Notícias do Mercado
-
22:57
United Kingdom CFTC GBP NC Net Positions: £15K vs £1.6K
-
22:56
European Monetary Union CFTC EUR NC Net Positions: €-11.3K vs €-12.1K
-
22:56
Australia CFTC AUD NC Net Positions rose from previous $-76.1K to $-75.2K
-
22:56
United States CFTC Oil NC Net Positions down to 423.7K from previous 429.6K
-
22:56
United States CFTC S&P 500 NC Net Positions: $96.5K vs $67.6K
-
22:56
Japan CFTC JPY NC Net Positions: ¥-107K vs previous ¥-102.7K
-
22:56
United States CFTC Gold NC Net Positions rose from previous $193.3K to $214.6K
-
22:39
AUD/USD clung to 0.7500 amid mixed-market sentiment ahead of the weekend
- AUD/USD fell on broad US dollar strength, as the greenback rose almost 1% in the US Dollar Index.
- European stock indices fell, while US equity indices rose, depicting a mixed-market sentiment, which benefited the US Dollar.
- US Core PCE rise overshadowed the Australian Retail Sales jump, weighed on the AUD/USD.
The Australian dollar slid for the first day of the week, down 0.37% as the New York session ends at 0.7516 at press time.
On Friday, the market sentiment was mixed as European equity indices fluctuated between winners and losers. Meanwhile, across the pond, US stock indices finished the day with gains between 0.19% and 0.46%.
Despite the risk-on market mood in the New York session, risk-sensitive currencies like the GBP, the NZD, and the AUD, were not able to extend their Thursday rally. Also, the US Dollar strengthened due to several factors like month-end flows, portfolio reshuffling, inflation concerns, and the upcoming Federal Reserve meeting, where market participants expect a bond taper announcement.
Worth noting that US T-bond yields were unchanged during the session, with the 10-year benchmark note ending the week-month at 1.561%.
Hence, AUD/USD sellers were benefited from the market sentiment and rising inflation figures in the US, which, despite remaining steady, spurred demand for the greenback as investors focus turns to the Federal Reserve.
US Core PCE rise overshadowed the Australian Retail Sales jump, weighed on the AUD/USD
On the macroeconomic docket, Australian retail sales bounced up sharply in September after plummeting in the previous three months, where lockdowns were to blame.
Across the pond, the Fed’s favorite gauge for inflation, the US Core PCE, rose by 3.6% for September on a yearly basis, which increased demand for the greenback, as market participants became aware that the Federal Reserve meeting was around the corner. Rising inflations increase the odds of hiking rates sooner than later.
-
22:00
Mexico Fiscal Balance, pesos declined to -99578.3B in September from previous -19.76B
-
21:36
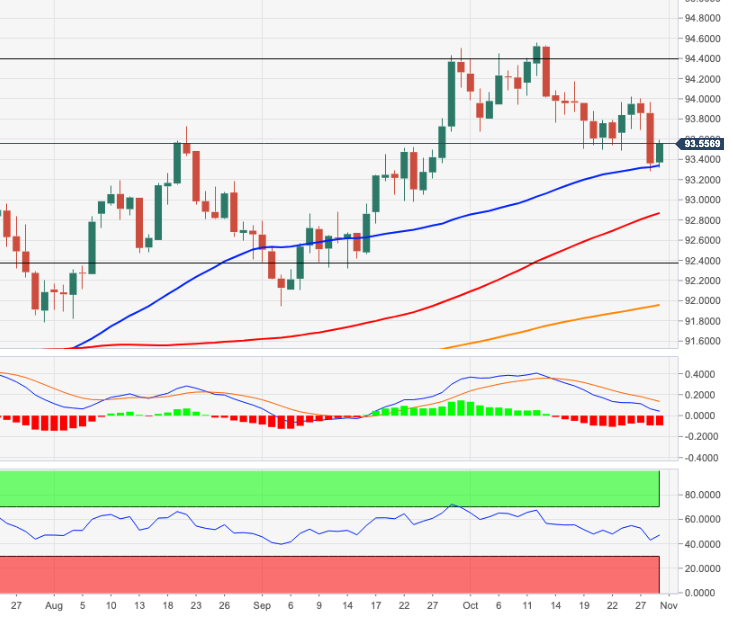
DXY Price Analysis: Strong support at 93.50 spurred US Dollar demand, finishing the week at 94.10
- The US Dollar Index rose almost 1% during the day, printing a fresh weekly high at 94.30.
- The greenback strengthened across the board amid falling US T-bond yields.
- DXY: A break above 94.17 opens the door for a renewed test of 2021 high at 94.56.
The US Dollar Index, which tracks the greenback’s performance against a basket of six peers, rallies 0.86% during the New York session, is at 94.10, short of the 94.30 fresh weekly high at the time of writing. In the meantime, US T-bond yields are falling, with the 10-year benchmark note down two basis points, sitting at 1.545%.
The market sentiment is mixed, depicted by European stock indices, splitting between gainers and losers. Across the pond, the story is positive for US equities. On Thursday’s late New York session, Us equity futures pointed lower, headed by the Nasdaq Composite and the S&P 500, which were falling sharply due to missed earnings by Apple and Amazon. But as of press time, the indices rise between 0.05% and 0.19%, ultimately boosting the greenback prospects
DXY Price Forecast: Technical outlook
Daily chart
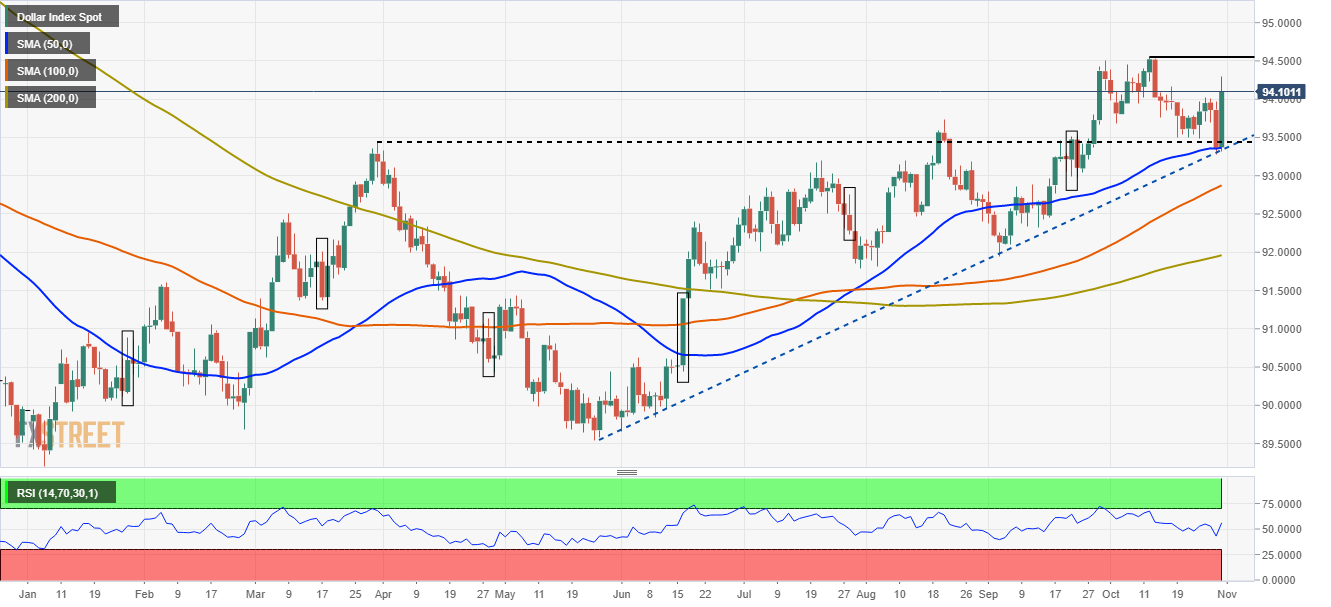
On Thursday, the index broke below the 93.50 substantial support area, unsuccessfully broken three times before. But on Wednesday, it finally yielded way for USD bears, printing a daily low at 93.27. At that level, the confluence of an upslope support trendline that travels from May 26 low towards the September 3 low and the 50-day moving average at 93.36 capped the downward move.
However, the story changed on Friday, as the index rose to print a fresh weekly high at 94.30, to settle at 94.10 finally. Friday’s price action printed a huge candlestick that completely covered Thursday’s one, forming a bullish engulfing candle with a solid upward conviction of USD bulls.
Furthermore, the daily moving averages (DMA’s) remain below the price, and a rising upslope trendline acted as solid support, adding two bullish signals to the US Dollar Index overall trend bias. The Relative Strength Index (RSI) at 56 is aiming higher, sums to the abovementioned, so the confluence of three bullish signals, confirm the bullish bias.
However, to resume the uptrend, USD bulls will need a daily close above the October 18 high at 94.17. In that outcome, the 2021 year high at 94.56 would be the only resistance level left before reaching fresh yearly highs.
On the flip side, failure at 94.17 might open the door for a newed re-test of the crucial 93.50 support area.
-
21:17
Colombia Interest rate registered at 2.5% above expectations (2.25%)
-
20:11
GBP/USD finds support at 1.3665 after plunging from 1.3800 area
- The pound finds buyers at 1.3665 after a 0.75% daily decline.
- The sterling suffers against a stronger USD.
- GBP/USD's reaction to the BoE is unpredictable – MUFG.
The British pound is attempting to find support at 1.3665 lows on Friday’s late US trading, after plummeting more than 0.7% on the day. End-of-month moves with November’s Federal Reserve meeting around the corner, have boosted the US dollar across the board.
The USD surges on expectations of a hawkish Fed statement
The GBP/USD has dropped sharply on Friday, weighed by broad-based US dollar strength in a combination of a moderate risk aversion, and higher expectations of a hawkish turn by the Federal Reserve next week.
US macroeconomic data might have encouraged investors to close US dollar shorts, especially after the Core Personal Consumption Expenditures, the Fed’s preferred inflation gauge, accelerated 3,6% year-on-year in September. These figures reaffirm the idea that the central bank will be forced to accelerate its monetary normalization plan, which has favored the US dollar.
Higher inflation expectations have also pushed the US Treasury bond yields higher, which has increased bullish traction on the USD.
All in all, the investors are bracing for an eventful next week, with the meetings of both, the Bank of England and the Federal Reserve scheduled. The Federal Reserve is expected to announce the end of its monetary stimulus, while, according to some market sources, the BoE might hike interest rates for the first time in three years in order to tackle inflation pressures.
GBP/USD’s reaction to BoE is unpredictable – MUFG
FX analysts at MUFG consider that the BoE could hike rates by 0.15% next week, although they warn about a negative GBP reaction: “Based on the recent FX response to central bank guidance we could well see GBP dismissing this guidance of slower tightening going forward. However, we would expect GBP to ultimately weaken on the back of a 15bp hike and guidance suggesting the need for less tightening than what is currently priced. That message may not be explicit but should be implied by the MPR forecasts.”
Technical levels to watch
-
19:48
Gold Price Forecast: XAU/USD slid below $1,800 on broad greenback strength, despite lower US yields
- XAU/USD plummeted almost $25.00 on steady US Core PCE reading, at 3.6%.
- A risk-off market mood boosted the US dollar, spurred by month-end flows and firm US T-bond yields.
- XAU/USD: A daily close below $1,780 could send gold tumbling towards $1,721.
Gold (XAU/USD) slides during the New York session, down almost 1%, trading at $1,782 at the time of writing. Earlier in the session, gold reached a fresh weekly low at $1,771 but bounced off the lows to stabilize at current levels.
Risk-off market sentiment spurred a flight towards safe-haven assets, but it failed to uplift the non-yielding metal. Concerns about high inflation, central bank tightening, and some CEOs from US companies complaining about supply shortages and high production costs dented the market mood.
The US Dollar Index reached a fresh weekly high at 94.30
That, in turn, boosted the greenback. The US Dollar Index is reversing Thursday losses, up 0.85%, at 94.14. During some time of the day, it reached a fresh weekly high around 94.30.
Contrarily, the US 10-year Treasury yield is firmly at 1.564%, unchanged throughout the day.
On the macroeconomic front, the US Core Personal Consumption Expenditure for September, the Federal Reserve favorite gauge for inflation, rose by 3.6%, a tad lower than the 3.7% foreseen by analysts.
Moreover, in October, the University of Michigan Consumer Sentiment weakened modestly and slid to 71.7 from 72.8 in September’s reading. Despite the fall, it was better than the 71.4 estimated by market participants.
The market’s reaction for the Core PCE, gold collapsed from $1,793 to $1,775 and gained traction towards the weekly low of $1,771, as the US Dollar Index continued its rally during the day.
XAU/USD Price Forecast: Technical outlook
Daily chart
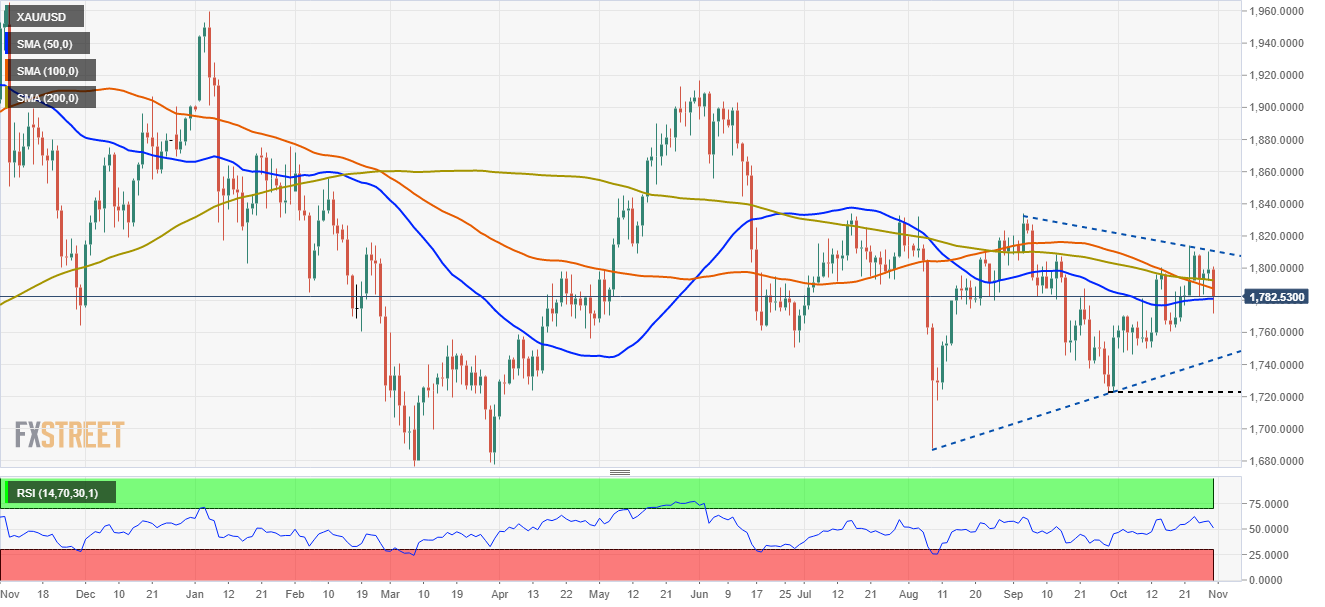
Gold (XAU/USD) daily chart depicts the yellow metal has been up-trending steadily, in ranges of $20.00 average. The 100 and the 200-day moving averages (DMA’s) are above the spot price. Meanwhile, gold is testing the 50-day moving average at $1,780, which, if broken to the downside, confirmed by a daily close underneath it, could propel USD bulls to open fresh bets, in the possibility of a trip towards the September 29 low at $1,721.
The Relative Strenght Index (RSI), a momentum indicator, is at 51, above the 50-midline, which could refrain XAU/USD sellers from opening new bets, unless it breaks below 50.
-
19:12
EUR/USD trying to bottom at 1.1535 after plunging from 1.1700 area
- The euro attempts to find support at 1.1535 after losing more than 1% on the day.
- The US dollar appreciates with the investors bracing for the Fed's meeting next week.
- Higher US bond yields and hawkish Fed expectations have crushed the euro.
The euro is attempting to hit a bottom at 1.1535 after plummeting more than 1% on the day. The pair has dropped like a stone on Friday, crushed by a combination of factors and a stronger US dollar.
The euro plummets with the US dollar firming up
The common currency has lost on Friday all the ground it gained on Wednesday and Thursday’s rally, weighed by the US dollar’s strength. End-of-the-month moves, as the market positions for the Federal Reserve’s monetary policy meeting next week and higher US Treasury bonds might have been the main reason for the sharp EUR/USD reversal.
The Bureau of Economic Analysis revealed today that US Core Personal Consumption Expenditures, the Fed’s favourite inflation gauge, accelerated 3,6% year-on-year in September. These figures come to reaffirm the theory that the US central bank will be forced to accelerate its monetary normalization plans, which, less than one week ahead of November’s meeting, has boosted demand for the USD,
Against this backdrop, US-T bond yields edged up again, with the 10-year note reaching levels near 1.6%, which has increased bullish pressure on the US dollar.
Technical levels to watch
-
18:46
United States Baker Hughes US Oil Rig Count increased to 444 from previous 443
-
18:36
USD/JPY extends past 114.00 buoyed by higher US yields
- The dollar bounces at 113.25 and reaches levels past 114.00.
- The greenback appreciates on higher inflation expectations.
- USD/JPY: expected to dive towards 112.00 in three months – Rabobank.
The dollar has regained bullish traction on Friday and is rallying nearly 0.5% so far today, erasing the previous two days’ losses. The USD/JPY is testing levels above 114.00 at the time of writing, after having bounced up from two-week lows at 113.25 on Thursday
Higher inflation expectations and stronger yields are buoying the USD
The greenback has been boosted by higher inflation expectations in the US, which have reinforced the idea that the Federal Reserve will be forced to accelerate its monetary policy normalization plan.
The US core personal consumption expenditures, the Fed’s preferred indicator for consumer inflation, has risen 3,6% year-on-year in September, which adds pressure on the bank to start increasing interest rates. As a consequence, US-T bond yields ticked up on the back of these figures, pushing the US dollar higher across the board.
Currency volatility surged in the second half of the week, after a very calm opening. Monetary policy decisions by the ECB, the BoC, and the BoJ plus the US GDP data have triggered significant fluctuations in FX markets. In that sense, the scenario can be fairly similar over the next week, with the investors awaiting decisions by the Federal Reserve, the Bank of England and the Reserve Bank of Australia.
USD/JPY: Forecast remains for a slide to 112.00 in three months – Rabobank
In spite of the current bullish reaction, FX Analysts at Rabobank remain dovish on the USD: “This may be a warning to the market that in view of the inflationary implications the BoJ is not entirely happy with the JPY’s position at the worst-performing G10 currency in the year to date. This signal may be sufficient to limit upside potential for USD/JPY near-term, particularly since the weakness of US Q3 GDP data has also undermined the greenback today. We retain a 3 month USD/JPY forecast of 112.”
Technical levels to watch
-
18:28
USD/CHF pares some weekly losses, hovers around 0.9150
- USD/CHF bounces off 0.9099 amid risk-off market sentiment.
- The US Dollar Index rises in the day, despite falling US T-bond yields.
- The USD/CHF 4-hour chart shows the pair is within a bullish flag, but a break below 0.9100 could invalidate the chart pattern.
The USD/CHF trims some weekly losses, advances sharply during the New York session, up 0.61%, trading at 0.9171 at the time of writing. Comments of some US CEOs about supply shortages, and higher costs amid companies missing earnings expectations, dampened the market sentiment. Additionally, inflationary pressures and central bank tightening monetary conditions kept investors at bay
Earlier in the day, the USD/CHF printed a weekly low of around 0.9099. But once American traders got to their desks, the pair jumped almost 70 pips, due in part to month-end flows and US dollar demand.
In the meantime, the US Dollar Index is rising almost 1%, sitting at 94.28 amid falling US T-bond yields. The US 10-year Treasury yield is flat, currently at 1.568%.
On the macroeconomic front, the US Personal Consumption expenditures, the Fed’s preferred inflation gauge, surged 3.6% year-on-year in September, a tad lower than expectations but in line with the August figure, signaling that inflation is stabilizing after a sudden jump to 6.1%.
USD/CHF Price Forecast: Technical outlook
4-hour chart
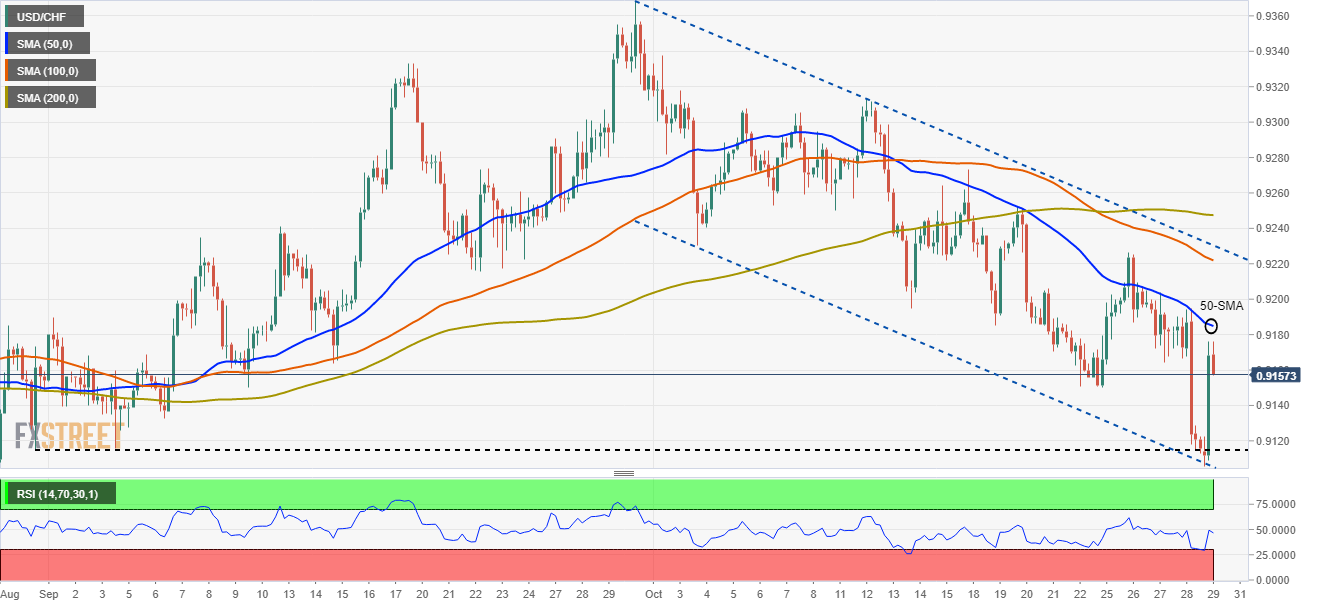
The USD/CHF pair is in a downtrend, shown by the simple moving averages (SMA’s) located above the spot price. Furthermore, a descending channel that seems to be a bullish flag capped the last downward move, bouncing off the bottom of the channel, towards the 50-simple moving average at 0.9181.
Nevertheless, the Relative Strength Index (RSI) at 48 is seesawing up and down, showing no clear confirmation of the actual trend.
If USD/CHF buyers fail to gain traction above 0.9200, investors could expect a renewed re-test of the daily lows around 0.9099.
-
18:04
EUR/USD: A more hawkish Fed and a overdone reaction to ECB – MUFG
Analysts at MUFG Bank are recommending a trade idea of shorting the EUR/USD pair with a target at 1.1300, an entry level of 1.1650 and a stop at 1.1850. They consider the EUR/USD could struggle to build on Thursday’s gains.
Key Quotes:
“The EUR bounced yesterday on a sense that ECB President Lagarde was less than enthusiastic in pushing back current market pricing for rate hikes next year. But senior central bankers rarely comment on specific market pricing and hence we did not view Lagarde as shifting the ECB stance in any way. We are in a market where investors are increasingly questioning the forward guidance of central banks – but we would argue that the ECB is on more credible ground than some of the other central banks and therefore a sustained divergence favouring a weaker EUR is likely to persist going forward.”
“The focus next week will shift of course to the FOMC and while we do not get any formal updated guidance on rates, we will get the QE tapering plan, the statement and the press conference and it is likely that Fed Chair will talk tougher on inflation given developments of late. We don’t expect any huge shift in tone or message but enough to prompt some reversal of the heavy USD selling in evidence in October.”
“Technically, EUR/USD is at an interesting point as well. The downtrend resistance on the daily intra-day chart from the highs in June and again in September comes in a little above the current spot rate (1.1706 today) and that could act to limit the upside over the short-term.”
-
17:58
GBP/JPY, rejected at 157.05, dives to levels sub-156.00
- The sterling retreats below 156.00 after failure at 157.05.
- Closing positions at the end of the month might have hit the pound.
- GBP/USD is testing support at 155.95 area.
The British pound has lost its bullish momentum after failing to confirm above 157.00 during Friday’s London trading, and the pair has posted a significant pullback during the US session, reaching day-lows right above 156.00.
The sterling gives away gains on end-of-month trading
The GBP/JPY is depreciating about 0.3% on the day, and on track to close the week practically flat, with the pair losing in less than two hours all the ground taken on Thursday and early Friday. In absence of relevant macroeconomic releases, closing positions at month-end might be one of the main reasons behind the sudden pound reversal.
Earlier this week, the sterling was buoyed by the dovish monetary statement by the Bank of Japan, which maintained its ultra-expansive policy and downgraded the country’s growth prospects for 2021.
On the other hand, the upbeat economic outlook forecasted by the UK finance minister Rishi Sunak at the Autumn Budget Report boosted hopes of a strong post-pandemic recovery in the UK and reinforced market expectations of a BoE rate hike in early 2022.
GBP/JPY is testing support at 155.95
On a broader view, the pair is hovering right above the bottom of the last weeks’ horizontal range, with immediate support at 155.95 (Oct. 22, 28 lows) ahead of 155.70 (Oct. 27 lows) If these levels are breached next potential target might be 154.80 (October 12 high).
On the upside, the pair should break above 157.10 where the October 28 high meets the 50-period SMA in the 4hr chart. Above here, the pair would regain bullish traction to extend towards 157.75 (Oct. 26 high) and then 158.20 (Oct. 20, 21 highs).
Technical levels to watch
-
17:56
BoE: Markets are overestimating the scale of future tightening – ING
Next Thursday, the Bank of England will have its monetary policy meeting. Analysts at ING expect a 15bp rate hike, following recent hawkish comments. They consider markets are overestimating the scale of future tightening, so they argue some modest pushback from policymakers in the form of lower medium-term inflation forecasts and a split rate hike vote, seems likely.
Key Quotes:
“Policymakers are likely to offer some modest pushback against the market's tightening expectations for 2022. That leads us neatly onto whether policymakers will attempt to lean more heavily against market pricing. We think they will, if only subtly.”
“For one thing, if the committee does indeed opt to increase rates on Thursday, then it's unlikely to be a unanimous decision. While a handful of committee members will likely take Governor Bailey’s lead and vote for a rise, we know at least one member is likely to dissent (Silvana Tenreyro). This should be a warning sign for markets: if the first – partial – rate rise can’t command a unanimous decision, then it’s harder to see a series of aggressive, future moves gaining similar levels of support.”
“When it comes to the forecasts, we may well see a downgrade to the inflation projections for two/three years' time. Don't forget that the Bank takes market interest rates and plugs them into its models. Back in August, a modest 40bp of tightening over its forecast horizon neatly kept inflation around 2% in the medium-term. All else equal, the much higher degree of tightening now priced into markets should result in that 2024 inflation forecast moving lower.
If that happens, then it would be an implicit sign that policymakers don’t see a need to act as aggressively as the markets.”“GBP has undoubtedly benefited from the dramatic re-pricing of the UK money market curve since early September. However, the BoE’s broad, trade-weighted measure of GBP is up only 1.1% over the same period, so it seems fair to describe GBP gains as ‘hard-won’.”
-
17:50
AUD/USD: Recent gains built on shaky foundations – MUFG
Market expectations for aggressive rate hikes next year from the Reserve Bank of Australia (RBA) are likely to be disappointed, according to analysts at MUFG Bank. They argue recent outsized gains of the Australian dollar are built on shaky foundations.
Key Quotes:
“At the same time the AUD has derived support from the aggressive repricing of RBA rate hike expectations.”
“Next week’s RBA policy meeting (Tues) will be closely watched to see if they make any policy adjustments and/or push back more strongly against early rate hike expectations. While we can anticipate the RBA bringing forward rate hike plans from the current guidance for no hikes before 2024, it is one hell of a long shot to expect the RBA to completely capitulate and start planning for hikes as soon as next year and joining the Norges Bank, RBNZ, BoE, BoC and Fed.”
“The RBA remains concerned that underlying inflation pressures have been uncomfortably low over the last six years averaging only around 1.6%Y/Y. Similar to the ECB, we do not expect the RBA to be in a rush to respond to the current period of higher inflation.”
“We doubt that recent AUD strength can be sustained beyond the near-term. Market expectations for RBA hikes next year will be disappointed while the Fed starts to raise rates, and the negative growth impact from real estate weakness in China will become bigger weight on the AUD going forward as well.”
-
17:46
BoC forecast of first rate hike pulled forward to April 2022 – NFB
Analysts at the National Bank of Canada, pulled forward the timing of the expected first rate hike from the Bank of Canada after the recent hawkish bias introduced by the central bank. They see some potential for a Fed rate hike by Q3 2022.
Key Quotes:
“In light of the Bank’s more hawkish tilt, we’ve pulled forward the expected timing of the first rate hike to April 2022. We could envision the Bank kick-starting a tightening cycle with back-to-back moves, as they’ve done in each of the past few cycles, settling into a quarter-move-per-quarter pattern in the second half of next year. The resulting year-end target rate of 1.25% implies four hikes next year, alongside prospective commencement of a gradual balance sheet run-off later in the year. The pace of tightening could moderate in 2023, with at least two hikes bringing overnight to the lower end of the BoC’s perceived neutral range (estimated at 1.75%-2.75%).”
“While the shifting BoC outlook has garnered plenty of airtime, attention will now rightly pivot to the Fed. A QE taper is set to commence in November. Given our long-standing and perhaps more pronounced inflation fears, alongside an ongoing evaporation of labour market slack, we see a compelling argument for hurrying the taper along. Prodded by an overheated economy, the Fed could take as little as six months to taper. A more condensed taper process would, in turn, set up an earlier lift off for the fed funds target. We now believe the Fed’s initial rate hike could come as early as 2022:Q3 (i.e., three months earlier than we had previously forecast).”
-
17:41
GBP/USD: Pound's response to BoE is unpredictable – MUFG
Analysts at MUFG Bank, point out that the Bank of England (BoE) is set to hike interest rates when it meets next week with clear rhetoric and pricing, pointing to action. They see an unpredictable response regarding the pound in the currency market.
Key Quotes:
“Following clear and explicit guidance from BoE Governor Bailey earlier this month we decided to move forward the timing of the first-rate hike by the BoE to next week – we maintain that view now and expect the MPC to vote in favour of a 15bps hike in Bank Rate taking it to 0.25%. It remains a close call with the strongest argument favouring a delay being to provide more time for assessing labour market conditions following the end of the Job Retention Scheme. But the possible confusion (market now expects a move) created by not hiking will likely sway a majority to act now.”
“We expect the BoE to remain on hold in December and hike by 25bps in February 2022.”
“Based on the recent FX response to central bank guidance we could well see GBP dismissing this guidance of slower tightening going forward. However, we would expect GBP to ultimately weaken on the back of a 15bp hike and guidance suggesting the need for less tightening than what is currently priced. That message may not be explicit but should be implied by the MPR forecasts.”
“The MPR should be the tool in which the BoE signals rate hikes are coming but not as much as priced which should ultimately weigh on GBP performance.”
-
17:33
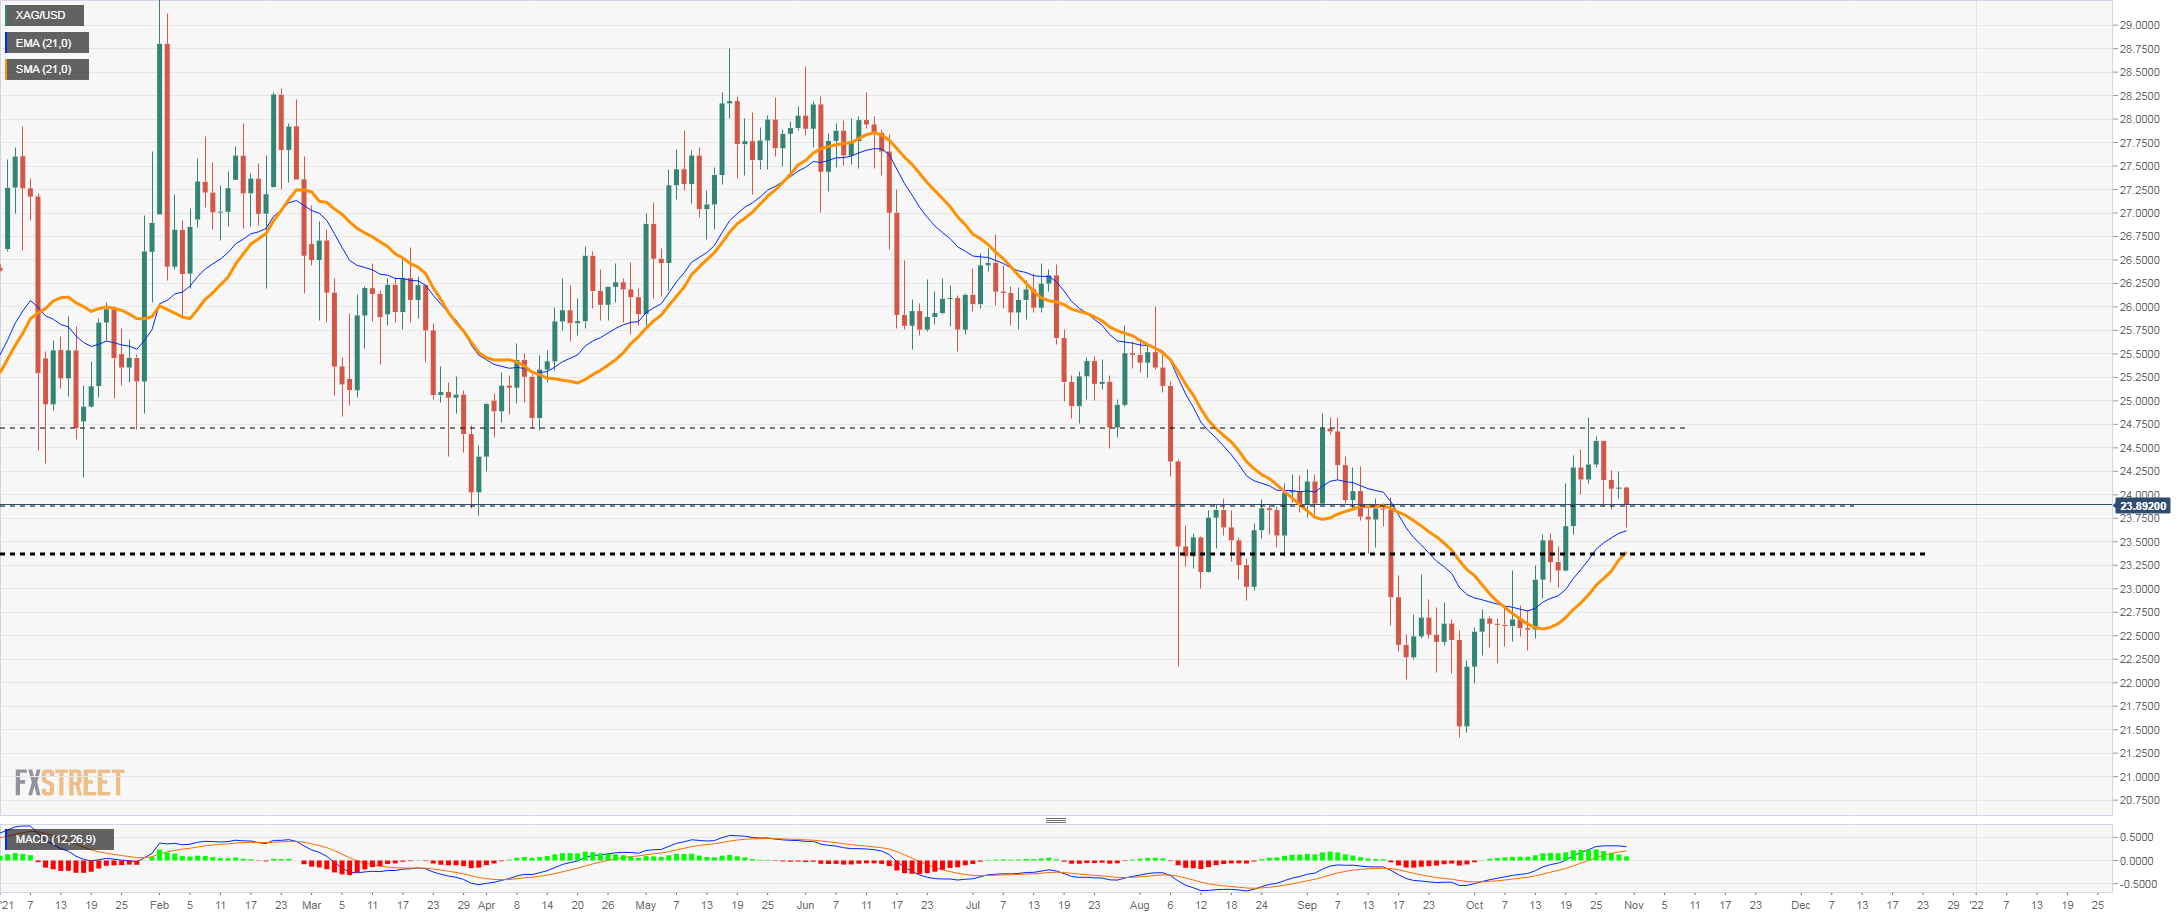
Silver Price Forecast: XAG/USD rebounds and trims losses, eyes 24.00
- Metals stabilized after sharp slide, DXY hits monthly highs above 94.00.
- The strong US dollar keeps metals under pressure ahead of next week’s FOMC meeting.
- XAG/USD falls for the fourth day, but moves off lows.
Silver and gold are falling sharply on Friday. A rally of the US dollar pushed XAG/USD to 23.68$, the lowest level in a week. During the last hours, silver recovered ground and rose to 23.90$ It is about to end the week lower, after finding resistance at the 20-week moving average around 24.40.
The DXY is up by 0.90% on Friday, trading at monthly highs at 94.20, boosted amid end-of-month flows and ahead of next week’s FOMC meeting. The Federal Reserve is expected to announce a tapering of its QE program. The latest round of economic data, including today’s Core CPE did not alter market expectations.
US stocks are modestly higher. Not even risk appetite is avoiding the rally of the greenback. For metals, a pullback in US yields favoured a consolidation.
The bias in the daily chart in XAG/USD still shows some bullish arguments, with price above key moving averages. The move off lows on Friday is another fact. Now silver needs initially to recover 24.25$ to gain momentum, and then break the key 24.75$ resistance to clear the way to more gains. A slide below 23.50$ on the contrary would increase the negative pressure.
Silver daily chart
-
17:24
USD/CAD advances firmly towards 1.2400 amid risk-off market sentiment
- USD/CAD briefly pierced 1.2400, reaching a daily high at 1.2408
- Concerns about inflation, central bank tightening, and US CEOs commenting on supply shortages and elevated prices dented market sentiment.
- US Core PCE remains steady at 3.6%, though lower than expected.
The USD/CAD climbs during the New York session, up 0.41%, trading at 1.2396 at the time of writing. Broad US dollar strength across the board keeps the Loonie under pressure. Also, weak Apple and Amazon Q3 corporate earnings and both companies CEO commenting about supply shortages and higher costs dented the market sentiment
Furthermore, concerns about inflation and central bank tightening conditions added to the abovementioned factors.
Earlier in the day, the Loonie appreciated against the greenback, maintaining the pair around 1.2329, near the lows of Thursday. However, month-end flows, and US Dollar demand, weakened the oil-linked Canadian dollar.
Also, crude oil prices, which boost or dents the CAD prospects, are falling, with the Western Texas Intermediate (WTI) down 0.23%, trading at $82.31 on Friday.
The US Dollar Index, which tracks the buck's performance against a basket of its peers, rallies almost 1%, sitting at 94.26, despite falling US bond yields, as the 10-year benchmark note drops one basis point, down to 1.566%, at press time.
US Core Personal Consumption Expenditure, Fed's favorite measure of inflation, steady at 3.6%
In the Canadian economic docket, Statistics of Canada released the Gross Domestic Product for August, which expanded by 0.4%, lower than the 0.7% estimated but better than July's -0.1% reading.
According to RBC Capital market in a note to clients, the disappointment of the GDP report should not derail the Bank of Canada hawkishness. Further noted, "The softer print on Q3 shouldn't derail the BoC's newfound hawkishness — the Bank's flexible treatment of the output gap still leaves April as the most likely point for lift-off. But nor do we want to give the impression that economic data is totally irrelevant here. If the economy fails to rebound in Q4 the Bank's shift in forward guidance may start to look ill-advised."
The Federal Reserve's favorite measure of inflation, the Core PCE for September, remained unchanged at 3.6% on a yearly basis, a tick lower than foreseen by economists and in line with the previous month. Moreover, in its final reading, the University of Michigan Consumer Sentiment Index drops to 71.7 in October, against 71.4 expected.
USD/CAD Price Forecast: Technical outlook
Daily chart
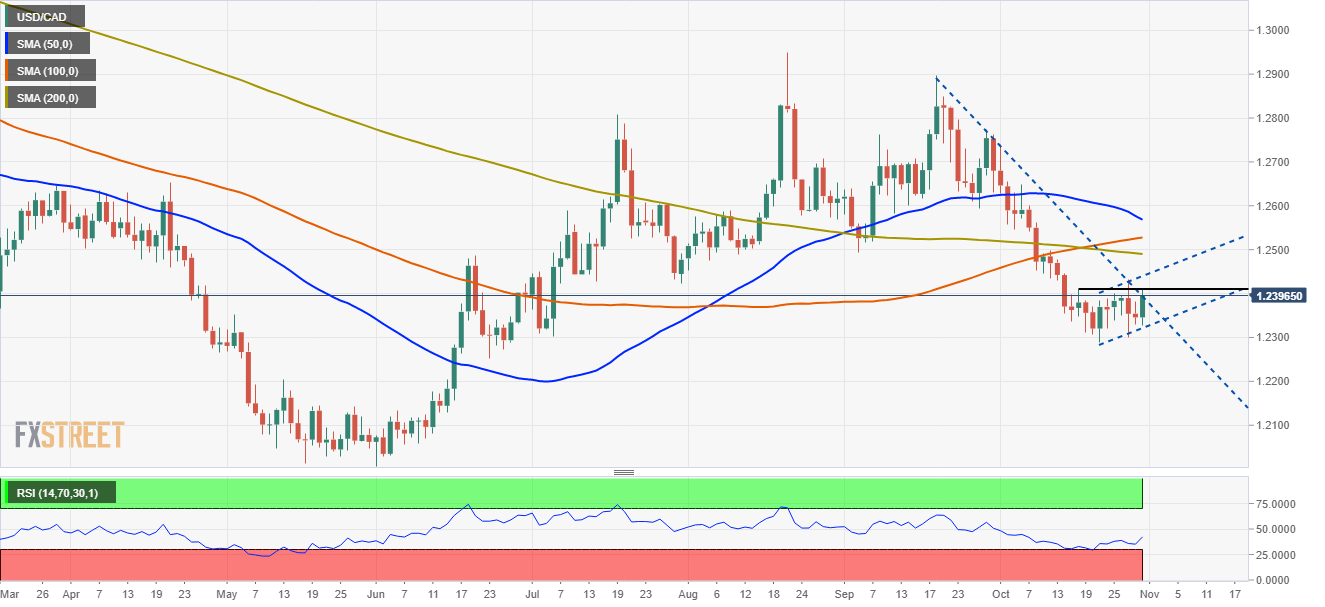
The USD/CAD pair is testing the top of a bearish flag, around 1.2400, which also confluences with a downslope trendline traveling from September 20 high towards September 29 high that the pair is testing at press time.
Nevertheless, to resume the downward trend, as confirmed by the daily moving averages (DMA's) above the spot price and the Relative Strength Index (RSI) at 41, it will need a daily close below the bottom of the bearish flag.
Therefore, due to US dollar strength at Friday's session, it seems the pair is under a mild correction before resuming the downward trend, as signaled by the moving averages and the RSI.
-
17:23
EUR/GBP dips further to hit fresh session lows below 0.8440
- Euro's reversal from 0.8475 extends to session lows below 0.8440.
- The pound remains stronger fuelled by BoE hike expectations.
- EUR/GBP: Biassed lower while below 0.8530 - Commerzbank.
The euro continues heading south against the British pound on Friday. The pair has depreciated about 0.4% so far today, reversing Thursday’s gains after its rejection from 0.8475, to reach session highs below 0.8440 and approaching
The pound remains firmer on BoE hike expectations
The sterling has regained the firm tone seen during the last weeks, buoyed by market expectations that the Bank of England might accelerate its monetary normalization plan to tackle inflation. This theory has been supported in the Autumn Budget Report when finance minister Rishi Sunak forecasted a strong post-pandemic recovery in the UK.
The European Central Bank, however, maintained its dovish stance in the face of the increasing inflationary pressures and pushed back any interest rate hike at least until late 2023, which has weighed on demand for the common currency.
ECB’s assumption that the currently high inflation levels will be temporary has been disputed by Eurozone CPI data earlier on Friday. Consumer inflation accelerated to a 4.1% year-on-year pace in September, more than twice the bank’s target for price stability, putting the ECB in an awkward situation. As a matter of fact, German 10-year Treasury yields rose by 8 basis points following the release of inflation figures, a signal that the market does not accept the bank’s dovish rhetoric.
EUR/GBP should break above 0.8530 to ease negative pressure – Commerzbank
Karen Jones, Team Head FICC Technical Analysis Research at Commerzbank sees the pair biased lower while below 0.8530: “We have initial resistance at 0.8500. Above here lies the 55-day ma at 0.8530 and will need to regain this in order to alleviate downside pressure and to challenge the 0.8659/73 highs since May (…) Below 0.8400 attention should revert to the 0.8239 2019 low and the 200-month ma lies at 0.8159.”
Technical levels to watch
-
17:08
Canada: GDP report shouldn't derail BoC’s hawkishness – RBC CM
Growth data from Canada was released on Friday. Industry-level GDP disappointed in August with the 0.4% print coming in well below the market consensus for 0.7%, explained analysts at RBC Capital Markets. They don’t expect the report to derail the Bank of Canada’s hawkishness.
Key Quotes:
“The economic recovery hit another snag in August with industry-level GDP rising by 0.4% m/m. In isolation, this would be considered a relatively robust print but markets had been expecting something considerably stronger (+0.7%), and flash estimates for September adding to the disappointment with Statistics Canada projecting a flat print.”
“With the flat flash estimate for September, Statistics Canada is projecting an unannualized gain of 0.5% for Q3 GDP (so call it roughly 2.0% annualized). We had been looking for Q3 growth in the mid-to-low 3s, while the BoC had forecast Q3 growth at 5.5% in its most recent MPR. Following today's report, we now look for 2021 GDP growth of about 4.7%, compared to the BoC's forecast of 5.1% growth.”
“The softer print on Q3 shouldn't derail the BoC's newfound hawkishness — the Bank's flexible treatment of the output gap still leaves April as the most likely point for lift-off. But nor do we want to give the impression that economic data is totally irrelevant here. If the economy fails to rebound in Q4 the Bank's shift in forward guidance may start to look ill-advised.”
-
17:01
Colombia National Jobless Rate declined to 12.1% in September from previous 12.3%
-
17:00
Russia Unemployment Rate down to 4.3% in September from previous 4.4%
-
16:45
AUD/USD retreats to 0.7500 area after failure at 0.7555
- The aussie retreats to 0.7500 after failure at 7545/50.
- The risk-sensitive AUD loses ground as market mood worsens.
- AUD/USD might extend losses if 0.7550 resistance caps.
The Australian dollar has been rejected again at the 0.7545/55 resistance area again, and the pair has given away Thursday’s gains, returning to the 0.7500 area. The aussie is heading lower on Friday, with the US dollar strengthening across the board.
The US dollar picks up as market sentiment sours
The AUD has been unable to maintain the bid tone shown during the previous four days and is pulling back against a firmer dollar. The USD is taking advantage of its safe-haven status amid a deteriorated market sentiment and firmer US Treasury yields.
Risk appetite was hammered on Thursday after the Commerce Department revealed that the US economy decelerated beyond expectations. These figures have curbed optimism about a strong post-pandemic recovery, which is taking a toll on equity markets and risk-sensitive currencies like the aussie.
On the macroeconomic calendar the US Personal Consumption expenditures, the Fed’s preferred inflation gauge surged 3.6% year-on-year in September, adding pressure to the central bank to accelerate its policy normalization plan. US T bond yields have ticked up on the back of these figures, thus increasing demand for the US dollar.
In Australia, retail sales bounced up strongly in September after having plunged over the previous three months as the easing COVID-19 restrictions have helped consumers to go to the shops.
AUD/USD: Headed lower if 0.7550 resistance caps – Citibank
The FX analysis team at Citibank, warns that failure to breach 0.7550 resistance could trigger a significant reversal: “The RBA decided not to defend its 3y yield target 0.1% which sent the April 2024 bond soaring. This has increased conviction that RBA may shift more hawkish in their forward guidance. However, as reflation bets move towards stagflation ones, the aussie struggles, particularly with the pullback in commodity prices that has kept it supported all month (…) Add to that the usual USD bid into month end, and risk/reward in AUD/USD appears more skewed to the downside, with 0.7550 providing firm resistance.”
Technical levels to watch
-
16:36
US: Overall consumer spending growth should remain solid – Wells Fargo
According to analysts at Wells Fargo, the 0.6% monthly pickup in personal spending is the latest sign that there is still some spring in the step of the US consumer heading into the final stretch of the year. They explained that the fact that last month's spending increase was revised higher by two-tenths of a percent actually makes today's report a slightly better than expected outcome.
Key Quotes:
“Despite a transition from transfer payments to wages that held back income growth in September, consumer spending still rose 0.6%, which was spot-on expectations. The fact that last month's spending increase was revised higher by two tenths of a percent actually makes today's report a slightly better than expected outcome.”
“Coming off of yesterday's GDP report, which showed only tepid consumer spending growth, the additional detail we get from today's personal income and spending report reveals that Q3 finished strong in August and September. As we describe in detail below, the long anticipated transition to services spending came at the cost of a sharp slowing in goods spending.”
“Looking ahead, we expect more payback may be in order for goods consumption, but with more and more services spending coming back online amid a decline in COVID cases, overall consumer spending growth should remain solid.”
-
16:25
GBP/USD plummets below 1.3700, on US dollar strength, ahead Fed and BoE week
- GBP/USD accumulates to its weekly losses, breaking below 1.3700.
- Due to month-end flows and the London fix, GBP/USD plummeted almost 80 pips in the last three hours.
- US Core PCE for September remains steady at 3.6%, as the Fed’s November meeting approaches.
The GBP/USD slides for the third time in the week, looking forward to ending the week in the red, down 0.67%, trading at 1.3696 during the New York session at the time of writing. Worse than expected, heavy-tech US Q3 corporate earnings on Thursday and concerns about inflation and tight monetary policy dampened market sentiment, weakening risk-sensitive currencies like the British pound.
In the last three hours, the GBP/USD pair has shed almost 80 pips, which also could lie on month-end flows, or profit-taking ahead of a critical Federal Reserve and Bank of England monetary policy week. Furthermore, US T-bond yields are flat at press time, with the 10-year benchmark note steady at 1.56%, while the US Dollar is reversing Thursday losses, as the US Dollar Index is rallying 0.62%, to sit at 93.93.
Meanwhile, scalations of the conflict between the UK and the Eurozone would open another chapter in their negotiations. The British PM Boris Johnson and France President Emmanuel Macron will meet this weekend after a conflict post-Brexit fishing rights. In the week, France seized a British boat, and London threatened to retaliate against French fishers.
Just breaking at press time, the European Commission has told member states that the role of the European Court of Justice in the North Ireland protocol is not up for discussion.
Fed’s favorite measure of inflation, the Core PCE unchanged at 3.6% versus August reading
On the macroeconomic front, the UK economic docket is absent.
Across the pond, the Federal Reserve’s favorite measure of inflation, the Core PCE for September, rose by 3.6% on a yearly basis, a tick lower of the estimations and in line with the previous month. Further, in its final reading, the University of Michigan Consumer Sentiment Index drops to 71.7 in October, against 71.4 expected.
That said, GBP/USD prepare for the next week, as the central banks of both countries will host their monetary policy meetings. Regarding the US, the Fed is expected to announce the QE reduction by $15 billion a week, to begin by mid-November. Concerning the UK, market participants expect a rate hike by the BoE.
GBP/USD Price Forecast: Technical outlook
Daily chart
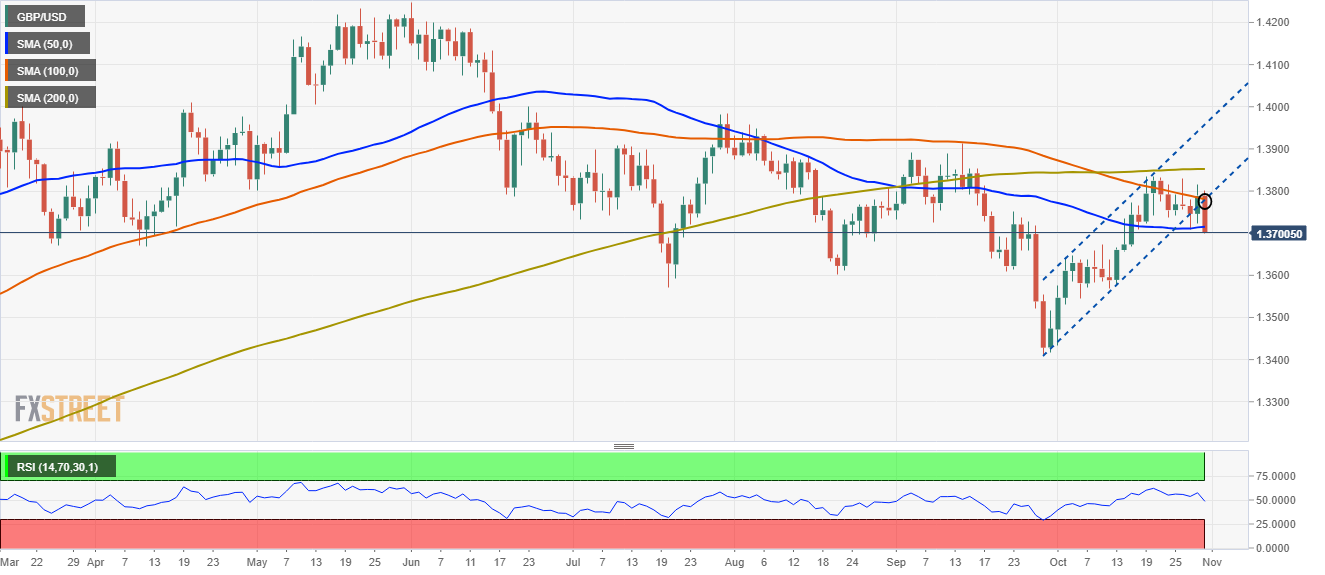
On Wednesday, the GBP/USD pair broke below a daily bearish flag, but on Thursday, trimmed some of its losses but failed to get back above the bottom of the channel. Wednesday’s momentum carried today, as the GBP/USD collapsed below the bottom trendline. It is also testing the 50-day moving average (DMA), which could spur additional losses for the British pound if it breaks it lower.
Further, the Relative Strength Index (RSI) is at 49, aiming lower, indicating the British pound is under strong selling pressure, favoring USD buyers.
-
16:05
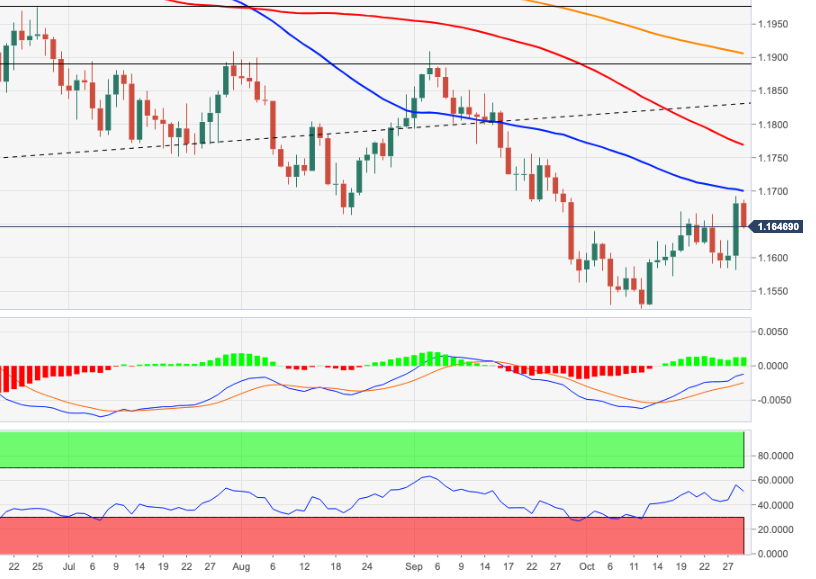
EUR/USD tumbles below 1.1600 to lowest in two weeks
- Euro under pressure around the London fix, drops across the board.
- US dollar strengthens even as US yields pull back.
- EUR/USD drops a hundred pips from weekly highs.
The EUR/USD pair is accelerating the decline on Friday amid a stronger US Dollar across the board. Around the last London fix of October, the pair dropped to 1.1563, reaching the lowest level in two weeks.
The pair remains near the lows, with a strong bearish tone. The euro is also falling versus the Swiss franc and the pound. EUR/CHF is having the worst day in months, trading under 1.0580, at the lowest since May 2020.
US yields look steady while US stocks are posting mixed results, not behind the rally of the greenback. End-of-month flow and some positioning ahead of next week’s FOMC meeting could be playing a key role. “With the Fed set to embark on taper and flexibility likely to be a key feature of policy going forward, risk/reward is shaping up more positively for the USD into and out of the Fed,” explained analysts at TD securities.
The reversal in EUR/USD pushed the price from the highest in four weeks to weekly lows. The euro is headed toward the lowest weekly close since May 2020. Currently stands at 1.1570, where the 200-week simple moving average stands.
Technical levels
-
15:10
US: UoM Consumer Sentiment Index edges lower to 71.7 (final) in October vs. 71.4 expected
- UoM Consumer Sentiment Index fell slightly in October.
- US Dollar Index continues to edge higher toward 94.00.
Consumer confidence in the US weakened modestly in October with the University of Michigan's Consumer Sentiment Index declining to 71.7 in October's final reading from 72.8 in September. This print came in slightly better than the flash estimate and the market expectation of 71.4.
Further details of the publication revealed that the Current Conditions Index edged lower to 77.7 from 80.1 and the Consumer Expectations Index fell to 67.9 from 68.1.
Commenting on the survey, "the positive impact of higher income expectations and the receding coronavirus has been offset by higher rates of inflation and falling confidence in government economic policies," Richard Curtin, Surveys of Consumers chief economist. "Consumers not only anticipated the highest year-ahead inflation rate since 2008 in the October survey, consumers also expressed greater uncertainty about the year-ahead inflation rate than anytime in nearly forty years."
Market reaction
The greenback continues to gather strength against its rivals after this report and the US Dollar Index was last seen rising 0.47% on the day at 93.80.
-
15:05
USD/ZAR to turn decisively bullish on a break above the 15.3950 August high – Credit Suisse
USD/ZAR is edging higher and economists at Credit Suisse expect the pair to challenge the 15.3950 August high. A break above here would signal a significant trend change to the upside.
USD/ZAR to tackle resistance starting at 15.3103 and stretching up to 15.3950
“USD/ZAR is pushing above its downtrend from August and we look for a break above the 15.2533 September high for a test of medium-term resistance, starting at 15.3103 and stretching up to the 15.3950 August high.”
“Above the 15.3950 level at any stage would establish a medium-term base to turn the core trend higher, with just initial resistance then seen at 15.6560/15.6645.”
-
15:01
United States Michigan Consumer Sentiment Index came in at 71.7, above expectations (71.4) in October
-
14:45
United States Chicago Purchasing Managers' Index registered at 68.4 above expectations (63.5) in October
-
14:41
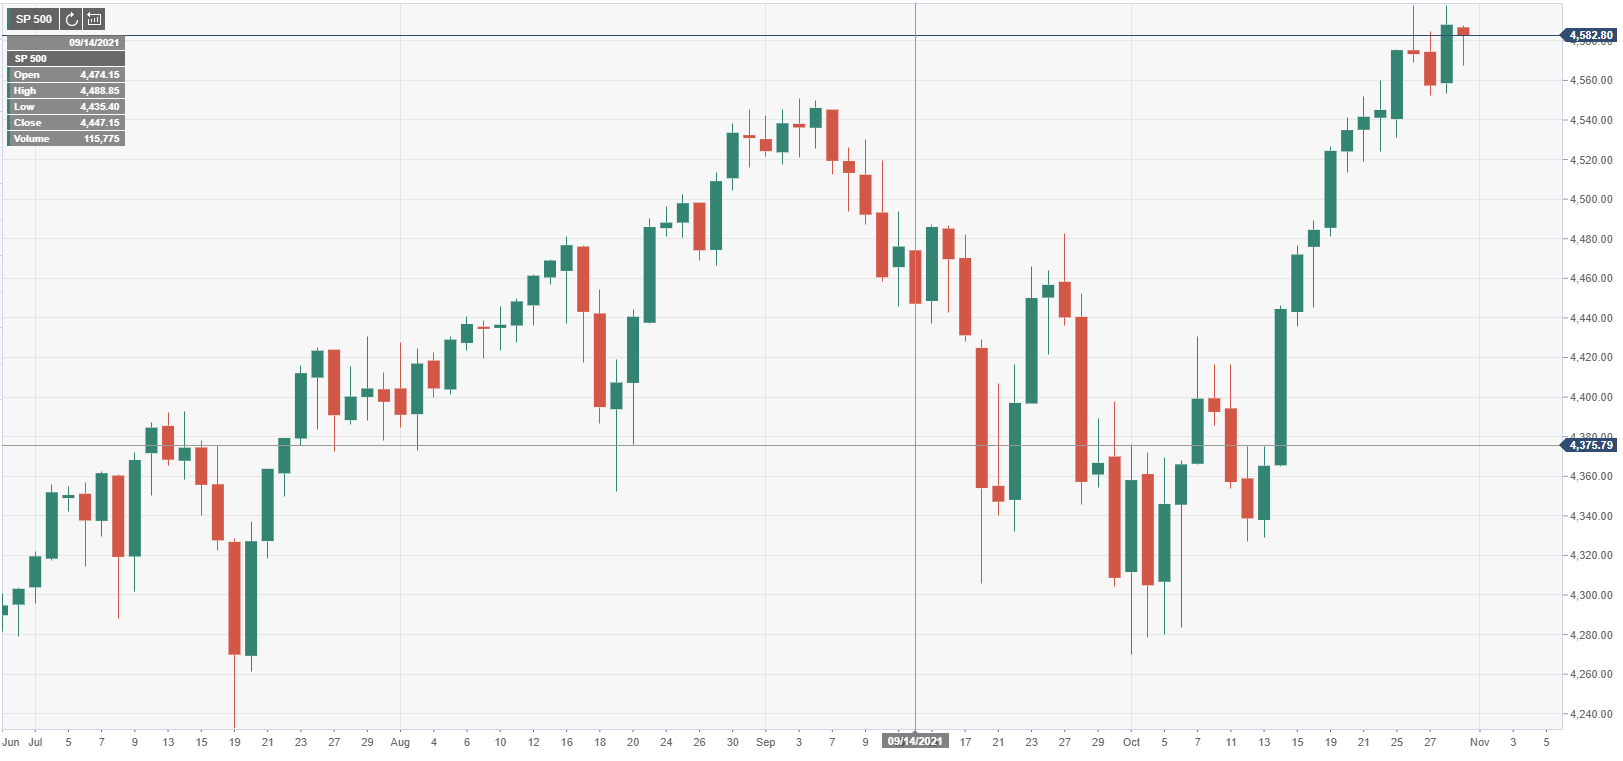
S&P 500 Index opens lower on October's last trading day
- Wall Street's main indexes trade mixed on Friday.
- Financial shares post modest gains on rising US Treasury bond yields.
- S&P 500 Consumer Discretionary Index is down more than 1%.
Major equity indexes started the last trading day of the month on a mixed note. As of writing, the S&P 500 Index was down 0.35% on the day at 4,580, the Dow Jones Industrial Average was rising 0.15% at 35,776 and the Nasdaq Composite was falling 0.55% at 15,360.
Among the 11 major S&P 500 sectors, the Consumer Discretionary Index is losing more than 1% as the biggest decliner after the opening bell. On the other hand, the Financials Index is trading in the positive territory supported by a more-than-1% increase seen in the benchmark 10-year US Treasury bond yield.
Earlier in the day, the data from the US showed that the Core Personal Consumption Expenditures (PCE) Price Index, the Fed's preferred gauge of inflation, stayed unchanged at 3.6% on a yearly basis in September.
S&P 500 chart (daily)
-
14:41
EUR/USD set to fall below the 1.16 level – Scotiabank
The EUR/USD pair has retraced part of yesterday’s post-ECB gains in broadly dollar-positive price action. Economists at Scotiabank expect the world’s most popular currency pair to tick down and slide below the 1.16 level.
Break above 1.17 is key to see further EUR gains
“We maintain a bearish view on the currency after yesterday’s ECB announcement. Lagarde did not push back on market rate hike expectations as the outlook on inflation remains highly uncertain – and a strong rebuke of market pricing could ‘backfire’.
“Month-end trading and short-covering likely also conspired to the spike in the EUR and we expect pressure for a firm drop under 1.16 to continue.”
“1.17 remains a key level to breach (50-day MA at 1.1699) against downtrend resistance from late-May/early-June (the level is also the 23.6% Fibo retracement of the May-Oct move). Beyond 1.17, 1.1750 stands as resistance while support is 1.1620 and the 1.1600 zone; 1.1572 follows.”
-
14:41
US Dollar Index pushes higher to the 93.80 zone, daily highs
- DXY regains further ground and retests the 93.75/80 band.
- US Core PCE came at 3.6% YoY in October, 0.2% MoM.
- Final October U-Mich Index comes next.
The US Dollar Index (DXY), which tracks the greenback vs. a basket of its main rival currencies, accelerates the daily recovery and flirts with the 100-hour SMA near 93.80 o Friday.
US Dollar Index up on higher yields, sticky inflation
The index extends the bounce off the 93.30 region and manages to advance to the 93.75/80 band at the end of the week on the back of rising US yields and persistent elevated US inflation.
In fact, yields in the front end and the belly of the curve extend the leg higher to the 0.55% region and the vicinity of 1.62%, respectively, while the long end clings to the positive ground around 1.98%.
The index gathered steam after US inflation figures tracked by the PCE rose 4.4% in a year to September, while the Core PCE rose 3.6% and matched the August’s reading. Additional data saw Personal Spending up 0.6% MoM inter-month and Personal Income contracting 1.0% from a month earlier.
US Dollar Index relevant levels
Now, the index is gaining 0.33% at 93.67 and a break above 94.02 (weekly high Oct.26) would open the door to 94.17 (weekly high Oct.18) and then 94.56 (2021 high Oct.12). On the flip side, the next down barrier emerges at 93.27 (monthly low October 28) followed by 92.98 (weekly low Sep.23) and finally 92.86 (100-day SMA).
-
14:40
Gold Price Forecast: XAU/USD dives to over one-week lows, below $1,780 level
- A strong pickup in the USD demand prompted aggressive selling around gold on Friday.
- The USD drew some support from elevated US bond yields and hawkish Fed expectations.
- A softer risk tone could lend some support to the safe-haven metal and limit further losses.
- Gold Price Forecast: XAU/USD to maintain range play around $1800 ahead US PCE inflation
Gold witnessed aggressive selling during the early North American session and dived to one-and-half-week lows, around the $1,776 region in the last hour. The US dollar was back in demand on the last trading day of the week and has now reversed a major part of the previous day's dismal US GDP-led slide to one-month lows. This, in turn, was seen as a key factor that weighed heavily on dollar-denominated commodities, including gold.
The USD held on to its strong intraday gains following the release of the softer than expected Core PCE Price Index. The Fed's preferred inflation gauge held steady near 30-year highs in September and came in at 3.6% YoY as against consensus estimates for a modest uptick to 3.7%. The data indicated that consumer cost pressures are getting entrenched and validated expectations the Fed would be forced to adopt a more aggressive policy response to contain stubbornly high inflation.
This, in turn, allowed the yield on the benchmark 10-year US government bond to hold steady above the 1.60% threshold, which further contributed to drive flows away from the non-yielding gold. Apart from this, the latest leg of a sudden fall over the past hour or so could further be attributed to some technical selling below 200-hour SMA. However, a softer risk tone – as depicted by a cautious mood around the equity markets – could extend some support to the safe-haven XAU/USD.
The continuous rise in inflationary pressures comes amid signs of a global economic slowdown and fueled worries about the risk of stagflation. This, in turn, tempered investors appetite for perceived riskier assets, which might hold bearish traders from placing aggressive bets around gold. Nevertheless, the precious metal remains on track to end the week as the focus now shifts to next week's FOMC meeting, where the US central bank is expected to begin tapering its bond purchases.
Technical outlook
From a technical perspective, repeated failures near the $1,810-12 resistance zone and the subsequent fall suggests that the recent positive move has run out of steam. Hence, some follow-through weakness towards testing the next relevant support, near the $1,762 region, remains a distinct possibility. The corrective pullback from multi-week tops could further get extended towards October monthly swing lows, around the $1,745 area.
On the flip side, any meaningful recovery now seems to confront stiff resistance near the $1,790-92 region (100/200-day SMAs confluence) and remain capped near the $1,800 mark. A sustained strength beyond could allow bulls to make a fresh attempt to clear the $1,810-12 barrier and push gold prices towards the $1,832-34 heavy supply zone.
Levels to watch
-
14:29
GBP/USD: Resistance from the 200-DMA at 1.3852 to cap with support seen at 1.3709/02 – Credit Suisse
GBP/USD has rallied strongly from price support at 1.3709. Nonetheless, economists at Credit Suisse expect the resistance from the 200-day moving average (DMA) at 1.3852 to cap the cable for another leg lower.
GBP/USD to see a top below the 200-DMA at 1.3852
“Despite the strength seen yesterday our bias remains to look for a fresh cap at the 200-DMA of 1.3830/55 and for the risk to turn back lower again.”
“Support moves to 1.3775 initially then 1.3755, with a break below 1.3709/02 now needed to mark a near-term top for a fall to 1.3674/67. Beneath this latter area remains needed to suggest we are seeing a more concerted move lower, with support seen next at 1.3575/69, then 1.3544 and eventually the 1.3411 low.”
“A close above 1.3855 would reassert a broader sideways range, with resistance then seen next starting at the 1.3914 September high and stretching up to the 61.8% retracement of the fall from June at 1.3929, with a fresh cap expected here.”
-
14:06
USD/CAD spikes to 1.2400 neighbourhood amid stronger USD/sliding oil prices
- A combination of factors assisted USD/CAD to gain some positive traction on Friday.
- A softer risk tone, elevated US bond yields revived demand for the safe-haven USD.
- Weaker Canadian GDP print, a fresh leg down in oil prices undermined the loonie.
- The markets had a rather muted reaction to the mixed US PCE Price Index data.
The USD/CAD pair shot to fresh daily tops during the early North American session, with bulls making a fresh attempt to conquer the 1.2400 round-figure mark.
A strong follow-through uptick in the US Treasury bond yields allowed the US dollar to stage a solid rebound from one-month lows touched in reaction to dismal US GDP print on Thursday. This, in turn, was seen as a key factor that assisted the USD/CAD pair to attract some buying on the last day of the week and rally nearly 70 pips from the daily swing lows, around the 1.2330-25 region.
The intraday positive move picked up pace in the last hour following the release of the Canadian monthly GDP report, which showed that the economy expanded by 0.4% in August. This marked a notable recovery from a modest decline recorded in August but was well short of market expectations for a 0.7% growth and turned out to be a key factor that weighed on the Canadian dollar.
From the US, the Fed's preferred inflation gauge – the Core PCE Price Index – held steady near 30-year highs in September and came in at 3.6% YoY, slightly below 3.7% anticipated. Additional details showed that Personal Income declined significantly, by 1.0% MoM, while Personal Spending rose +0.6% MoM. Nevertheless, the data indicated that consumer cost pressures are getting entrenched.
This, in turn, validated market expectations that the Fed would be forced to adopt a more aggressive policy response to contain stubbornly high inflation. This was evident from elevated US Treasury bond yields. In fact, the yield on the benchmark 10-year US government bond climbed back to 1.61%, which, along with a softer risk tone, continued benefitting the safe-haven greenback.
Apart from this, a fresh leg down in crude oil prices undermined the commodity-linked loonie, which was seen as another factor that provided a goodish lift to the USD/CAD pair. It will now be interesting to see if the pair is able to capitalize on the move and confirm a near-term bullish breakout through a downward sloping channel extending from September swing highs.
Technical levels to watch
-
14:04
EUR/USD drops further to new daily lows around 1.1620
- EUR/USD accelerates losses to the 1.1620 region.
- US Core PCE rose 3.6% YoY, headline PCE gained 4.4% YoY.
- US Consumer Sentiment comes next in the docket.
The selling pressure around the single currency now picks up extra pace and forces EUR/USD to recede to the 1.1620 zone, or new daily lows.
EUR/USD met resistance near 1.1690
EUR/USD sinks into the negative territory at the end of the week pari passu with the quick rebound in the greenback.
Indeed, the buck gathers extra steam and manages well to leave behind the recent area of multi-week lows around 93.30 (October 28) sustained by the profit taking sentiment in the risk complex and higher US yields.
In Germany, yields of the 10y benchmark Bund advanced to fresh multi-day highs around -0.08%.
In the docket, US inflation figures tracked by the headline PCE rose at an annualized 4.4% and 3.6% when it comes to the Core PCE (excluded food and energy costs). Further US data witnessed Personal Spending expanding 0.6% MoM in September and Personal Income contracting 1.0% inter-month. Later in the session, the final October Consumer Sentiment will close the weekly calendar.
EUR/USD levels to watch
So far, spot is losing 0.46% at 1.1623 and faces the next up barrier at 1.1692 (monthly high Oct.28) followed by 1.1698 (55-day SMA) and finally 1.1755 (weekly high Sep.22). On the other hand, a break below 1.1582 (weekly low Oct.28) would target 1.1571 (low Oct.18) en route to 1.1524 (2021 low Oct.12).
-
13:43
USD/JPY clings to gains post-US data, remains below 114.00 mark
- USD/JPY gained positive traction on Friday and snapped two days of the losing streak.
- A strong pickup in the US bond yields revived the USD demand and remained supportive.
- The US PCE Price Index did little to impress bulls or provide any impetus to the major.
The USD/JPY pair maintained its bid tone through the early North American session and was last seen hovering near daily tops, just below the 114.00 mark. The pair moved little following the release of the US PCE Price Index.
Following an early dip to the 113.40-35 region, the USD/JPY pair attracted some buying on the last day of the week and snapped two successive days of the losing streak. The move was sponsored by a strong follow-through uptick in the US Treasury bond yields, which assist the US dollar to rebound from one-month lows touched in reaction to dismal US GDP print on Thursday.
The USD stood tall and had a rather muted reaction to a slight disappointment from the US Core PCE Price Index, which held steady at a 3.6% YoY rate in September as against an uptick to 3.7% anticipated. Nevertheless, the data validated expectations for an early policy tightening by the Fed and allowed the yield on the benchmark 10-year US bond yield to hold steady above the 1.60% threshold. This, in turn, acted as a tailwind for the greenback and the USD/JPY pair.
Meanwhile, the Fed's inflation gauge indicated that consumer cost pressures are getting entrenched. This comes on the back of signs of an economic slowdown and further fueled concerns about the risk of stagflation, which might continue to weigh on investors' sentiment. This should keep a lid on any optimistic move in the markets and benefit the safe-haven Japanese yen, capping any meaningful upside for the USD/JPY pair, at least for the time being.
Hence, it will be prudent to wait for a strong follow-through buying beyond the 114.00 mark before confirming that the recent corrective pullback has run its course. This will set the stage for a move beyond multi-year tops, around the 114.70 region touched last week, and push the USD/JPY pair further towards reclaiming the key 115.00 psychological mark.
Technical levels to watch
-
13:38
Canada: Real GDP expands by 0.4% in August vs. 0.7% expected
- Canadian economy grew at a softer pace than expected in August.
- USD/CAD edges higher in the early American session.
Canada's Real Gross Domestic Product (GDP) expanded at a monthly rate of 0.4% in August, the data published by Statistics Canada showed on Friday. This reading came in weaker than the market expectation for a growth of 0.7%.
"Preliminary information indicates that real GDP was essentially unchanged in September," the publication further read. "This advance estimate points to an approximate 0.5% increase in real GDP in the third quarter of 2021."
Market reaction
The USD/CAD pair gained traction after this report and was last seen rising 0.15% on the day at 1.2360.
-
13:34
Brazil Nominal Budget Balance down to -42.018B in September from previous -29.739B
-
13:32
Brazil Primary Budget Surplus came in at 12.933B, above expectations (3B) in September
-
13:31
Breaking: US annual Core PCE inflation stays unchanged at 3.6% in September vs. 3.7% expected
Inflation in the US, as measured by the Personal Consumption Expenditures (PCE) Price Index, stayed unchanged at 0.3% on a monthly basis in September, the US Bureau of Economic Analysis reported on Friday. On a yearly basis, the PCE Price Index edged higher to 4.4% from 4.2% but came in lower than the market expectation of 4.7%.
More importantly, the Core PCE Price Index, the Fed's preferred gauge of inflation, remained steady at 3.6% on a yearly basis, compared to market expectation of 3.7%.
Market reaction
This report doesn't seem to be having a noticeable impact on the greenback's performance against its rivals. As of writing, the US Dollar Index was up 0.25% on the day at 93.58.
-
13:31
United States Personal Spending above expectations (0.5%) in September: Actual (0.6%)
-
13:31
United States Core Personal Consumption Expenditures - Price Index (MoM) meets forecasts (0.2%) in September
-
13:31
Canada Industrial Product Price (MoM) came in at 1%, above expectations (0.5%) in September
-
13:31
United States Personal Consumption Expenditures - Price Index (YoY) came in at 4.4% below forecasts (4.7%) in September
-
13:31
United States Core Personal Consumption Expenditures - Price Index (YoY) came in at 3.6% below forecasts (3.7%) in September
-
13:31
Canada Raw Material Price Index above expectations (0.1%) in September: Actual (2.5%)
-
13:31
Canada Gross Domestic Product (MoM) below forecasts (0.7%) in August: Actual (0.4%)
-
13:31
United States Personal Consumption Expenditures - Price Index (MoM) in line with expectations (0.3%) in September
-
13:30
United States Employment Cost Index came in at 1.3%, above forecasts (0.9%) in 3Q
-
13:30
United States Personal Income (MoM) came in at -1%, below expectations (-0.2%) in September
-
13:11
EUR/USD Price Analysis: A move to 1.1750 in the offing?
- EUR/USD partially fades Thursday’s sharp move to 1.1690.
- Further north comes the 1.1750 region, late September tops.
EUR/USD gives away part of the recent advance and returns to the negative ground near 1.1650.
In the meantime, if the upside impulse pushes the pair above the 1.1700 neighbourhood – where the monthly top, the 55-day SMA and the short-term resistance line all coincide – it could attempt to re-visit the late-September peaks in the mid-1.1700s in the not-so-distant future.
In the meantime, the near-term outlook for EUR/USD is seen on the negative side below the key 200-day SMA, today at 1.1904.
EUR/USD daily chart
-
13:04
India FX Reserves, USD down to $640.1B in October 23 from previous $641.01B
-
13:04
South Africa Trade Balance (in Rands): 22.24B (September) vs previous 42.4B
-
13:00
AUD/USD remains on the defensive below mid-0.7500s, awaits key US data
- AUD/USD was seen consolidating its recent gains to the highest level since early July.
- Rallying US bond yields, the cautious market mood underpinned the safe-haven USD.
- Hawkish RBA expectations helped limit the downside ahead of the US inflation data.
The AUD/USD pair extended its sideways consolidative price action and remained on the defensive, below mid-0.7500s through the mid-European session.
The pair struggled to capitalize on the previous day's positive move to the highest level since early July and edged lower on the last trading day of the week. Investors turned cautious amid growing concerns about the risk of stagflation following the release of the dismal US Q3 GDP print on Thursday. This was evident from a softer tone around the equity markets, which drove some haven flows towards the US dollar and acted as a headwind for the perceived riskier aussie.
The greenback drew additional support from a strong follow-through uptick in the US Treasury bond yields, bolstered by the prospects for an early policy tightening by the Fed. In fact, the markets now seem convinced that the Fed would be forced to adopt a more aggressive policy response to contain stubbornly high inflation. This, in turn, was seen as a key factor that pushed the yield on the benchmark 10-year US government bond back above the 1.60% threshold.
Hence, the market focus will remain on Friday's release of the Fed's preferred inflation gauge – the Core PCE Price Index. This will set the tone heading into next week's FOMC meeting and provide some meaningful impetus to the AUD/USD pair. In the meantime, speculations for an interest rate hike by the Reserve Bank of Australia (RBA) might continue to lend some support to the Australian dollar and help limit the downside for the major.
Technical levels to watch
-
13:00
India Infrastructure Output (YoY) below expectations (16.7%) in September: Actual (4.4%)
-
12:55
US Dollar Index Price Analysis: Further losses likely below 94.00
- DXY bounces off recent lows in the 93.30 region.
- While capped by 94.00 the index faces extra decline.
The index reverses the recent weakness and manages to regain the 93.60 zone on Friday.
If DXY cannot clear recent tops around 94.00 in the near term, it would likely expose a deeper pullback in the next sessions. That said, the immediate target now emerges at the monthly low at 92.32 (October 28)., which is also reinforced by the 55-day SMA.
Looking at the broader picture, the constructive stance on the index is seen unchanged above the 200-day SMA at 91.95.
DXY daily chart
-
12:29
ECB's Holzmann: Forward guidance requires credible inflation projections
European Central Bank (ECB) policymaker Robert Holzmann told Reuters on Friday that the ECB's forward guidance requires credible inflation projections for market participants.
"It is important to drive on sight in the course of next year, in particular given the high uncertainty about inflation developments in 2022 and beyond," he added.
Market reaction
These comments don't seem to be having a noticeable impact on the shared currency's performance against its major rivals. As of writing, the EUR/USD pair was down 0.22% on a daily basis at 1.1653.
-
12:25
When is US PCE Price Index and how could it affect EUR/USD?
US PCE Price Index Overview
Friday's US economic docket highlights the release of the September Personal Consumption Expenditure (PCE) Price Index, scheduled later during the early North American session at 12:30 GMT. The headline gauge is expected to ease from 0.4% to 0.3% during the reported month, while the yearly rate is seen rising to 4.7% from 4.3% in August. The core reading is forecast to rise 0.2% in September, down from 0.3% previous, and edge higher to 3.7% YoY from 3.6% in August.
According to Joseph Trevisani, Senior Analyst at FXStreet: “Inflationary pressures in the United States economy have not abated with the heat. Continuing supply-chain restrictions, labor shortages and commodity price increases are set to make the fall and winter as uncomfortable for consumers as the summer.”
How Could it Affect EUR/USD?
Against the backdrop of Thursday's dismal US GDP print, a stronger reading will further fuel worries about the risk of stagflation. This, however, will validate expectations for an early policy tightening by the Fed and result in higher US bond yields/a stronger US dollar. Conversely, a softer print is likely to be overshadowed by the prevalent cautious mood in the financial markets. This, in turn, should act as a tailwind for the safe-haven greenback, suggesting that the path of least resistance for the EUR/USD pair is to the downside.
Meanwhile, Eren Sengezer, Editor at FXStreet, offered a brief technical outlook for the major: “With Thursday's upsurge, EUR/USD broke above 1.1670 resistance but lost its momentum before reaching 1.1700. The Relative Strength Index (RSI) indicator on the four-hour chart is edging lower after reaching 70, suggesting that the pair is now making a technical correction.”
Eren also outlined important technical levels to trade the EUR/USD pair: “Currently, the pair is trying to flip 1.1670 into support and buyers could try to test 1.1700 as long as this level holds. Above 1.1700 (psychological level), the next resistance aligns at 1.1720 (Fibonacci 50% retracement of September downtrend) before 1.1770 (Fibonacci 61.8% retracement). On the downside, 1.1670 (Fibonacci 38.2% retracement, former resistance) is the first support ahead of 1.1635 (50-period SMA) 1.1600 (psychological level, 100-period SMA).”
Key Notes
• Personal Consumption Expenditure Price Index September Preview: Transitory inflation becomes permanent
• EUR/USD Forecast: Can euro crack 1.1700 ahead of the weekend?
• EUR/USD Price Analysis: 50-DMA, monthly trend line check heaviest daily jump since May
About the US PCE Price Index
The Personal Spending released by the Bureau of Economic Analysis, Department of Commerce is an indicator that measures the total expenditure by individuals. The level of spending can be used as an indicator of consumer optimism. It is also considered as a measure of economic growth: While the Personal spending stimulates inflationary pressures, it could lead to rise interest rates. A high reading is positive (or Bullish) for the USD.
-
12:23
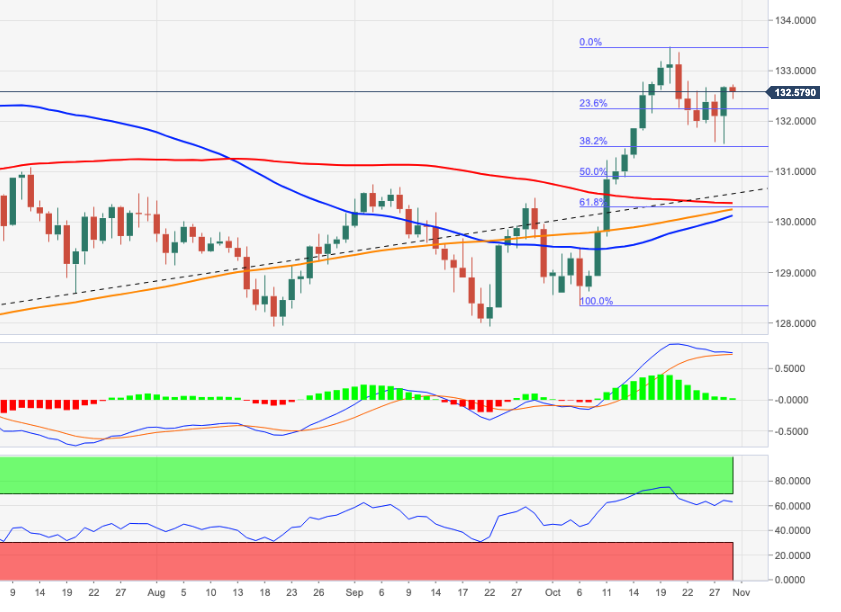
EUR/JPY Price Analysis: Extra gains seen retesting the mid-133.00s
- EUR/JPY meets resistance near 133.00 on Friday.
- Immediate hurdle comes at the monthly peaks near 133.50.
Sellers returned to the market and dragged EUR/JPY back to the negative territory on Friday.
The earlier spike met initial hurdle near 133.00 at the end of the week after rebounding from weekly lows in the mid-131.00s. The continuation of the recovery could extend further in the very near term and retest the October high near 133.50 (October 20). This is considered as the last defence for a probable move to the 2021 high past 134.00 the figure (June 1).
In the broader scenario, while above the 200-day SMA at 130.20, the outlook for the cross is expected to remain constructive.
EUR/JPY daily chart
-
12:01
India Federal Fiscal Deficit, INR: 5268.51B (September) vs 4680.09B
-
10:44
USD/CAD remains confined in a range around mid-1.2300s, US/Canadian data awaited
- USD/CAD extended its consolidative price action through the early European session.
- A combination of factors revived the USD demand and acted as a tailwind for the pair.
- A modest downtick in oil prices undermined the loonie and further extended support.
The USD/CAD pair quickly recovered around 20 pips from daily lows touched in the last hour and was last seen trading with modest intraday gains, around mid-1.2300s.
The pair continued with its struggle to gain any meaningful traction and continued with its two-way price move in a narrow trading band for the second successive day on Friday. A more hawkish Bank of Canada acted as a tailwind for the domestic currency and capped the upside for the USD/CAD pair. That said, a combination of factors extended some support to the major and helped limit losses, at least for the time being.
Crude oil prices failed to capitalize on the overnight goodish rebound from two-week lows, instead met with a fresh supply and undermined the commodity-linked loonie. The intraday downtick in the black gold followed reports that OPEC and its allies (OPEC+) cut 2022 oil demand growth outlook slightly to 5.7 million barrels per day. Apart from this, a solid US dollar rebound from one-month lows extended some support to the USD/CAD pair.
Worries about a faster-than-expected rise in inflation, along with signs of a global economic slowdown have raised fears about the risk of stagflation. The market concerns were further fueled by Thursday's dismal US GDP report, which showed that the growth in the world's largest economy decelerated sharply during the third quarter of 2021. This, in turn, weighed on investors' sentiment and revived demand for the safe-haven greenback.
The USD drew additional support from a strong follow-through rally in the US Treasury bond yields. In fact, the yield on the benchmark 10-year US government bond shot back above the 1.60% threshold amid expectations for an early policy tightening by the Fed. The markets have been pricing in the possibility of a potential interest rate hike in 2022 amid worries about a faster-than-expected rise in inflationary pressures.
Hence, the market focus will remain glued to the release of the US Core PCE Price Index, which will set the tone heading into next week's FOMC meeting. Friday's economic docket also features the release of monthly Canadian GDP print, which, along with oil price dynamics, should produce some trading opportunities around the USD/CAD pair.
Technical levels to watch
-
10:39
AUD/USD points to the downside as the 0.7550 mark caps – Citibank
AUD rates continue to be in focus after the Reserve Bank of Australia once again did not defend its yield target. Economists at Citibank expect the AUD/USD to turn back lower as the 0.7550 level proves to be a tough resistance.
Pullback in commodity prices dampens the AUD
“The RBA decided not to defend its 3y yield target 0.1% which sent the April 2024 bond soaring. This has increased conviction that RBA may shift more hawkish in their forward guidance. However, as reflation bets move towards stagflation ones, the aussie struggles, particularly with the pullback in commodity prices that has kept it supported all month.”
“Add to that the usual USD bid into month end, and risk/reward in AUD/USD appears more skewed to the downside, with 0.7550 providing firm resistance.”
-
10:21
EUR/GBP keeps the red post-Eurozone data, downside seems limited
- EUR/GBP edged lower on Friday and eroded a part of the overnight post-ECB gains.
- BoE rate hike expectations turned out to be a key factor that underpinned the GBP.
- Upbeat Eurozone GDP/hotter CPI extended support to the euro and limited losses.
The EUR/GBP cross remained depressed through the first half of the European session and was last seen hovering near daily lows, just above mid-0.8400s.
The cross struggled to capitalize on the previous day's post-ECB strong move up to two-week tops, instead met with some supply on the last trading day of the week. The British pound's relative outperformance comes amid firming market expectations for an imminent rate hike by the Bank of England at the upcoming meeting. The speculations were reinforced by the UK finance minister Rishi Sunak's upbeat economic assessment during the annual budget presentation on Wednesday.
On the other hand, the shared currency was pressured by dovish sounding remarks from ECB President Christine during the post-meeting press conference on Thursday. Lagarde acknowledged stronger-than-expected inflationary pressures but downplayed the need to hike interest rates. This, however, failed to convince investors that bets for an earlier policy tightening were misplaced amid the continuous rise in the Eurozone consumer prices for the fourth straight month in October.
According to the flash estimates released by Eurostat this Friday, the headline Eurozone CPI jumped to a 13-year high level of 4.1% for the current month. This marked a notable acceleration from 3.4% recorded in September and was also higher than the rise to 3.7% anticipated. Adding to this, the core reading exceeded the ECB's 2% target. This, along with a better-than-expected Eurozone GDP print for the third quarter, overshadowed a slight disappointment from German growth figures.
This, in turn, should act as a tailwind for the shared currency. Apart from this, Brexit jitters might hold the GBP bulls from placing aggressive bets and help limit any meaningful decline for the EUR/GBP cross. Investors remain worried about tensions between the UK and France over the post-Brexit fishing rights and a fresh row over the Northern Ireland protocol.
Even from a technical perspective, the overnight move beyond the top boundary of over one-week-old trading range suggests that the EUR/GBP cross might have bottomed out and favours bullish traders. Hence, any subsequent decline might still be seen as a buying opportunity and remain limited. Nevertheless, the stage seems set for a further near-term appreciating move, which should allow bulls to aim back to reclaim the key 0.8500 psychological mark.
Technical levels to watch
-
10:14
US Treasury Sec. Yellen: Inflationary pressures to normalize in second half of next year
In two different interviews with CNN and CNBC News on Friday, US Treasury Secretary Janet Yellen touched upon various topics, including rising inflation, supply chain crisis, economic recovery and the infrastructure spending bill.
Key quotes
Expect price increases to normalize in the second half of next year.
Hopeful and fully expects Congress to pass both infrastructure bill and larger spending bill.
We should focus on what is in the social and climate spending bill, not what fell out.
Spending bill includes very important investments to address the existential threat of climate change.
Spending in both measures is fully paid for and will occur gradually over almost a decade.
Still sees inflation as temporary, but doesn't mean a month or two.
Expect energy prices to begin to moderate in the months ahead.
Unemployment is expected to fall further in the months ahead.
Spending packages will lower some of the most important costs, which tends to push inflation down.
Global minimum tax agreement will not have any meaningful impact on direct investment around the globe.
Global tax agreement involves relatively modest increases in taxes, will create more certainty on tax rates.
Agreement will ensure that all countries can collect more from corporations, and they pay their fair share.
Supply chain bottlenecks are holding the US economy back, but GDP growth will pick up.
It will take a while to boost supply of semiconductors
expects semiconductor supply shortages to be addressed in medium term.
Some of fiscal stimulus will wear off, but households have amassed a lot of savings so consumer spending should remain 'quite healthy'.
Inflationary pressures are related to unique shock to economy.
Monthly inflation rates have come down from just 4-5 months ago and process is continuing.
-
US Dollar Index regains traction and tests the 93.40 region
-
-
10:03
Eurozone Preliminary CPI accelerates by 4.1% YoY in October, beats estimates
The annualized Eurozone Consumer Price Index (CPI) rose by 4.1% in October, beating expectations of 3.7% while sharply higher from the previous reading of 3.4%, the latest data published by Eurostat showed on Friday.
The core figures arrived at 2.1% YoY in October when compared to 1.9% expectations and 1.9% booked last.
Key details (via Eurostat)
“Looking at the main components of euro area inflation, energy is expected to have the highest annual rate in October (23.5%, compared with 17.6% in September), followed by services (2.1%, compared with 1.7% in September), non-energy industrial goods (2.0%, compared with 2.1% in September) and food, alcohol & tobacco (2.0%, stable compared with September).”
EUR/USD reaction
EUR/USD is virtually unchanged on rising Eurozone inflation. The spot is currently trading 0.23% lower on the day at 1.1652.
-
10:02
EUR/USD looks offered, turns negative near 1.1650
- EUR/USD now faces some downside pressure around 1.1660.
- German flash Q3 GDP came at 2.5% YoY and 1.8% QoQ.
- Flash EMU CPI is seen rising 4.1% YoY in October.
Following another test of recent tops around 1.1690, EUR/USD now comes under some downside pressure and revisits lows near 1.1650.
EUR/USD: Upside seems capped near 1.1700
EUR/USD gives away part of the recent strong advance and recedes after two consecutive daily pullbacks, always on the back of some profit taking mood and a decent recovery in the greenback at the end of the week.
The corrective downside in the pair comes amidst a recovery in yields of the US 10y reference note and its German counterpart to 1.61% and -0.10%, respectively.
The pair, in the meantime, seems to have already digested the ECB event on Thursday, where Chairwoman Lagarde failed to push back market bets for a lift-off next year on a more convincing fashion.
On the ECB front, the Survey of Professional Forecasters (SPF) now see inflation at 2.3% in 2021 (from 1.9%) and 1.9% in 2022 (from 1.5%). Regarding the GDP, the economy is expected to expand 5.1% this year and 4.5% during 2022, while the Unemployment Rate is seen lower across all the horizons.
In the domestic docket, advanced GDP figures showed the German economy is expected to have expanded 2.5% YoY and 1.8% QoQ during the July-September period. In the broader Euroland, flash inflation figures see the CPI at 4.1% YoY in October and the Core CPI at 2.1% YoY.
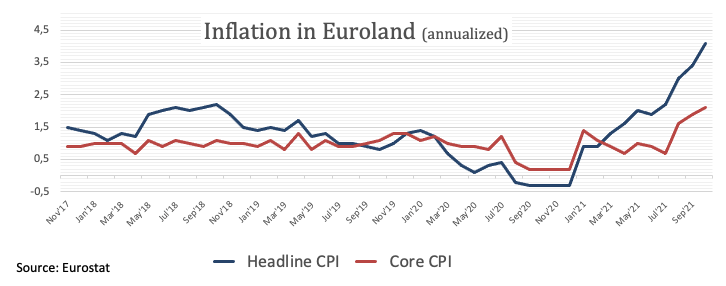
Across the pond, the PCE, Personal Income/Spending and the final October U-Mich print are all due later in the NA session.
What to look for around EUR
EUR/USD met initial hurdle in the boundaries of 1.1700 in the wake of the ECB meeting. While the improvement in the sentiment surrounding the risk complex lent extra wings to the par in past sessions, price action is expected to keep looking to dollar dynamics for the time being, where tapering chatter and a probable sooner-than-expected lift-off in rates remain well in well in centre stage. In the meantime, the idea that elevated inflation could last longer coupled with the loss of momentum in the economic recovery in the region, as per some weakness observed in key fundamentals, is seen pouring cold water over investors’ optimism as well as bullish attempts in the European currency.
Key events in the euro area this week: Advanced German Q3 GDP, flash EMU CPI (Friday).
Eminent issues on the back boiler: Asymmetric economic recovery post-pandemic in the region. Sustainability of the pick-up in inflation figures. Probable political effervescence around the EU Recovery Fund in light of the rising conflict between the EU, Poland and Hungary. ECB tapering speculations.
EUR/USD levels to watch
So far, spot is losing 0.21% at 1.1653 and faces the next up barrier at 1.1692 (monthly high Oct.28) followed by 1.1698 (55-day SMA) and finally 1.1755 (weekly high Sep.22). On the other hand, a break below 1.1582 (weekly low Oct.28) would target 1.1571 (low Oct.18) en route to 1.1524 (2021 low Oct.12).
-
10:01
Eurozone Preliminary GDP grows 2.2% QoQ in Q3 vs. 2.0% expected
The Eurozone economy grew 2.2% on quarter in the three months to September of 2021, beating 2.0% expected and 2.2% prior, the first estimate showed on Friday.
On an annualized basis, the bloc’s GDP rate expanded by 3.7% in Q3 vs. 14.3% booked in the second quarter of 2021 while beating 3.5% expectations.
FX implications
The euro ignores the upbeat Eurozone GDP report, as EUR/USD remains undermined by the US dollar’s resurgence across the board. The spot is last seen trading at 1.1652, down 0.22% so far.
About Eurozone Preliminary GDP
The Gross Domestic Product released by Eurostat is a measure of the total value of all goods and services produced by the Eurozone. The GDP is considered as a broad measure of the Eurozone's economic activity and health. Usually, a rising trend has a positive effect on the EUR, while a falling trend is seen as negative (or bearish).
-
10:01
Italy Consumer Price Index (EU Norm) (YoY) below forecasts (3.2%) in October: Actual (3.1%)
-
10:00
Italy Consumer Price Index (EU Norm) (MoM) in line with expectations (0.8%) in October
-
10:00
Italy Consumer Price Index (YoY) came in at 2.9%, above forecasts (2.6%) in October
-
10:00
Italy Consumer Price Index (MoM) above expectations (0.4%) in October: Actual (0.6%)
-
10:00
European Monetary Union Gross Domestic Product s.a. (QoQ) above expectations (2%) in 3Q: Actual (2.2%)
-
10:00
European Monetary Union Gross Domestic Product s.a. (YoY) came in at 3.7%, above forecasts (3.5%) in 3Q
-
10:00
European Monetary Union Consumer Price Index - Core (YoY) came in at 2.1%, above forecasts (1.9%) in October
-
10:00
European Monetary Union Consumer Price Index (YoY) came in at 4.1%, above forecasts (3.7%) in October
-
10:00
Greece Producer Price Index (YoY) up to 19.9% in September from previous 13.1%
-
10:00
Greece Retail Sales (YoY) declined to 6.6% in August from previous 11.6%
-
09:51
EUR/USD to challenge the 200-DMA at 1.1910 on a break above 1.1670/1.1700 – SocGen
EUR/USD returned over 1.1650 after President Lagarde said that the phase of higher inflation would last longer than previously thought. Economists at Société Générale expect the pair to extend its bounce on a break above 1.1670/1.1700.
Holding above 1.1570 is crucial for further up-move
“A break above multi-month channel at 1.1670/1.1700 will denote extension in rebound towards 200-DMA at 1.1910.”
“Defending 1.1570 is essential for further up-move.”
“Efforts to walk back market expectations of higher interest rates next year proved in vain. Lagarde explained that the outlook for inflation had not been met for a first-rate increase, implying that markets are ahead of themselves in pricing a 20bp rate increase in 2022.”
“The ECB estimates inflation will keep rising in the short term but there is every reason according to Lagarde to believe that price pressures will fade in 2022.”
-
09:42
Silver Price Analysis: Acceptance below $24.00 mark favours XAG/USD bears
- Silver edged lower on Friday and extended its recent pullback from monthly swing highs.
- Mixed oscillators on hourly/daily charts warrant caution for aggressive bearish traders.
Silver witnessed some selling on Friday and dropped to over one-week lows during the early part of the European session. The white metal now seems to have found acceptance below the $24.00 mark and was last seen trading with intraday losses or nearly 0.70%.
Given that the XAG/USD bulls have repeated failed near the 100-day SMA, the latest leg down might have shifted the bias in favour of bearish traders. The outlook is reinforced by the fact oscillators on hourly charts are holding deep in the negative territory.
That said, positive technical indicators on the daily chart suggest that any further decline could be seen as a buying opportunity near the $23.55 region. This, in turn, should help limit the downside for the XAG/USD near the $23.20-15 resistance breakpoint.
The mentioned region coincides with the 23.6% Fibonacci level of the $28.75-$21.42 downfall, which if broken will reaffirm the bearish bias. The XAG/USD might then turn vulnerable to break below the $23.00 mark and test the next relevant support near mid-$22.00s.
On the flip side, any meaningful positive move might continue to confront stiff resistance near 100-day SMA, around the $24.35 region, which now coincides with the 38.2% Fibo. level. A sustained move beyond will be seen as a fresh trigger for bullish traders.
The subsequent move up has the potential to push the XAG/USD back towards monthly swing highs, around the $24.80-85 region, en-route the key $25.00 psychological mark. The latter coincides with the 50% Fibonacci level of the $28.75-$21.42 downfall.
Some follow-through buying will set the stage for the recent appreciating move from the $21.45 region, or 14-month lows touched on September 30.
Silver daily chart
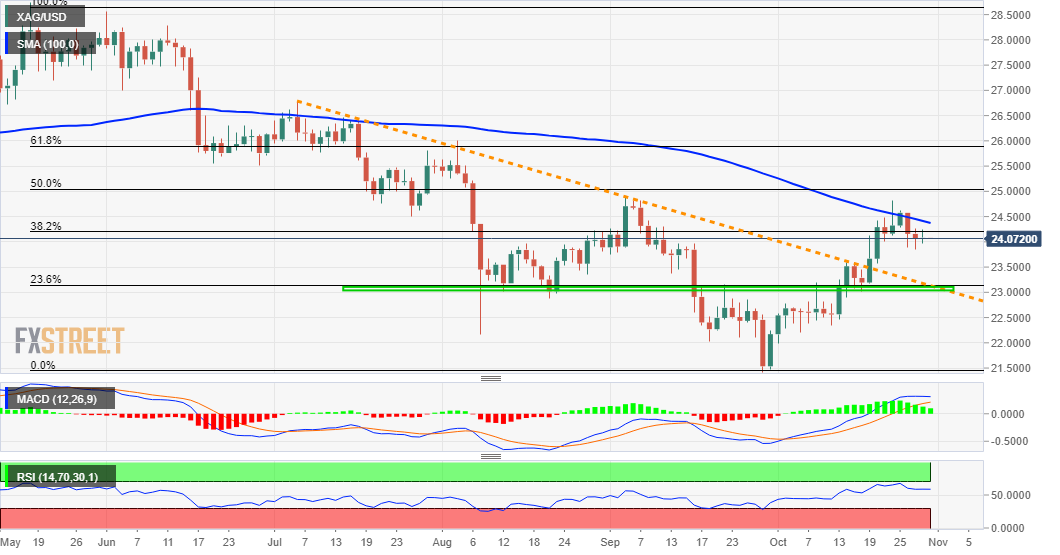
Technical levels to watch
-
09:38
OPEC+ cuts 2022 oil demand growth forecast slightly to 5.7M bpd – Reuters
The Joint Technical Committee (JTC) of OPEC and its allies (OPEC+) cut 2022 oil demand growth outlook slightly to 5.7 million barrels per day (bpd), Reuters reports, citing sources familiar with the matter.
The sources added that the committee left their 2021 oil demand growth forecast steady at 4.2 million bpd.
Market reaction
WTI is little affected by above the report, keeping its range just below $83 so far this Friday.
-
09:35
United Kingdom Mortgage Approvals above expectations (70.95K) in September: Actual (72.645K)
-
09:34
United Kingdom M4 Money Supply (YoY) remains at 7% in September
-
09:32
United Kingdom Consumer Credit below expectations (£0.45B) in September: Actual (£0.231B)
-
09:31
Portugal Gross Domestic Product (YoY) dipped from previous 15.5% to 4.2% in 3Q
-
09:31
Portugal Consumer Price Index (YoY) increased to 1.8% in October from previous 1.5%
-
09:31
United Kingdom Net Lending to Individuals (MoM): £9.8B (September) vs £5.6B
-
09:31
Portugal Consumer Price Index (MoM) declined to 0.5% in October from previous 0.9%
-
09:31
Portugal Gross Domestic Product (QoQ): 2.9% (3Q) vs previous 4.9%
-
09:30
United Kingdom M4 Money Supply (MoM) above forecasts (0.5%) in September: Actual (0.6%)
-
09:30
United Kingdom Consumer Credit registered at £0.2B, below expectations (£0.45B) in September
-
09:30
United Kingdom Consumer Credit came in at £0.231B, below expectations (£0.45B) in September
-
09:30
United Kingdom Mortgage Approvals above forecasts (70.95K) in September: Actual (72.6K)
-
09:30
United Kingdom Mortgage Approvals came in at 72.654K, above expectations (70.95K) in September
-
09:29
ECB’s Muller: PEPP can end next spring
The European Central Bank (ECB) Governing Council member Madis Muller is making some comments on the withdrawal of the central bank’s Pandemic Emergency Purchase Program (PEPP), nothing that the pandemic stimulus could end next spring.
more to come ...
-
09:26
ECB Bulletin: Eurozone companies brace for another year of supply snags
In its latest economic bulletin, the European Central Bank (ECB) said that most firms in the Eurozone will likely see another year of supply disruptions, as they prepare to pass the rising costs to clients.
Key takeaways
“30% of the companies also said they expected supply constraints and higher input costs to last for another year or longer, with a slightly lower percentage of respondents indicating they would continue for between six and 12 months.”
"Supply chain disruption was likely to persist for several months before gradually easing in the course of 2022, while more substantial capacity investments would take effect in 2023."
“Some two-thirds of respondents, particularly in the wholesale sector, expected to pass on "a lot" or some of their rising costs to their clients.”
"Most contacts anticipated higher wage increases in upcoming wage negotiations, broadly mirroring the recent pick-up in consumer prices.”
-
09:14
US Dollar Index regains traction and tests the 93.40 region
- DXY regains the smile following Thursday’s pullback.
- US yields extend the rebound from recent lows.
- Core PCE, Personal Income/Spending, U-Mich next on tap.
The greenback, in terms of the US Dollar Index (DXY), attempts a rebound to the 93.40 zone following the sharp selloff recorded on Thursday.
US Dollar Index looks to yields, data
The index partially leaves behind the recent weakness and manages to find some dip buyers after bottoming out near 93.30 on the previous session.
The so far tepid bounce in the dollar comes on the back of and equally mild recovery in yields in the US cash markets. Indeed, yields in the front end of the curve keep navigating the area above 0.50%, while the belly and the longer-dated end advance for the second session in a row to levels past 1.60% and above 2.0%, respectively.
Thursday’s intense pullback in DXY was accompanied by the extra improvement in the risk complex, particularly after the ECB did not sound as dovish as many were expecting.
In the US data space, the focus of attention will likely be on the inflation figures gauged by the PCE/Core PCE seconded by Personal Income/Spending and the final Consumer Sentiment for the current month.
What to look for around USD
The index manages to regain the smile and bounces off recent lows near 93.30. The price action in the buck continues to closely follow the performance of US yields, while the recent pick-up in the appetite for riskier assets put the dollar under extra pressure. In the meantime, supportive Fedspeak regarding the start of the tapering process as soon as in November or December (also bolstered by comments by Chief Powell) and the rising probability that high inflation could linger for longer somewhat limit intermittent bouts of weakness in the currency.
Key events in the US this week: PCE, Core PCE, Personal Income/Spending, Final Consumer Sentiment (Friday).
Eminent issues on the back boiler: Discussions around Biden’s multi-billion Build Back Better plan. US-China trade conflict under the Biden’s administration. Tapering speculation vs. economic recovery. Debt ceiling debate. Geopolitical risks stemming from Afghanistan.
US Dollar Index relevant levels
Now, the index is gaining 0.10% at 93.45 and a break above 94.02 (weekly high Oct.26) would open the door to 94.17 (weekly high Oct.18) and then 94.56 (2021 high Oct.12). On the flip side, the next down barrier emerges at 93.27 (monthly low October 28) followed by 92.98 (weekly low Sep.23) and finally 92.86 (100-day SMA).
-
09:13
ECB Survey: Eurozone inflation seen just below goal in 2022
The European Central Bank’s (ECB) Survey of Professional Forecasters released on Friday showed that the respondents predict higher in the coming years while expecting the inflation to come in just below the central bank’s 2% target in 2022.
Key findings
"Sees 2021 Eurozone inflation at 2.3% vs 1.9% seen three months ago."
"2022 inflation seen at 1.9% vs 1.5%, 2023 at 1.7% vs 1.5%."
"Longer-term or 2026 inflation seen at 1.9% vs 1.8%."
"Sees 2021 GDP growth at 5.1% vs 4.7% seen three months ago, 2022 seen at 4.5% vs 4.6%."
"Respondents attributed the upward revisions mainly to higher energy prices and the impact of supply chain tensions.”
"Although both these factors were also cited in the previous round, the recent developments were seen to have been more intense and were expected to be more persistent than previously anticipated."
-
09:07
Spain Current Account Balance fell from previous €2.49B to €0.98B in August
-
09:01
German Preliminary GDP expands 1.8% in Q3 vs. 2.2% expected, EUR/USD stays unfazed
- German GDP arrives at 1.8% QoQ in Q3 vs. 2.2% expected.
- Annualized German GDP stands at 2.5% in Q3 vs. 2.5% expected.
- EUR/USD unmoved on downbeat German Q3 growth numbers.
The German economy expanded 1.8% inter-quarter in the third quarter of 2021 when compared to the expectations of 2.2% and 1.6% booked in Q2, the preliminary report published by Destatis showed on Friday.
Meanwhile, the annualized GDP rate rose by 2.5% in Q3 against the previous reading of 9.4% and matched the market expectations of a 2.5% figure.
Separately, the Italian economy grew by 2.6% QoQ in Q3, surpassing estimates of 2% and 2.7% previous.
EUR/USD little changed on data
EUR/USD remains unperturbed by the downbeat German growth numbers, as the sentiment remains tepid, which keeps the US dollar’s safe-haven appeal underpinned.
The major was last seen trading at 1.1668, down 0.08% on the day.
About German Prelim GDP
The Gross Domestic Product released by the Statistisches Bundesamt Deutschland is a measure of the total value of all goods and services produced by Germany. The GDP is considered as a broad measure of German economic activity and health. A high reading or a better-than-expected number has a positive effect on the EUR, while a falling trend is seen as negative (or bearish).
-
09:01
Norway Registered Unemployment s.a down to 85.28K in October from previous 89.45K
-
09:01
Norway Registered Unemployment n.s.a came in at 2.2% below forecasts (2.3%) in October
-
09:00
Italy Gross Domestic Product (YoY) registered at 3.8% above expectations (3%) in 3Q
-
09:00
Italy Gross Domestic Product (QoQ) above forecasts (2%) in 3Q: Actual (2.6%)
-
09:00
Germany Gross Domestic Product (YoY) meets expectations (2.5%) in 3Q
-
09:00
USD/CHF drops to two-month lows, bears flirt with 0.9100 mark
- USD/CHF continued losing ground through the first half of the trading action on Friday.
- The cautious market mood benefitted the safe-haven CHF and exerted some pressure.
- An uptick in US bond yields revived the USD demand and helped limit the downside.
The USD/CHF pair dropped to two-month lows during the early European session, with bears now awaiting a sustained break below the 0.9100 round-figure mark.
The pair added to its weekly losses and remained depressed through the first half of the trading action on Friday amid a softer risk tone, which drove haven flows towards the Swiss franc. Fears about the risk of stagflation resurfaced after Thursday's dismal US GDP report, which showed that the growth in the world's largest economy decelerated sharply in the third quarter. This, in turn, weighed on investors sentiment and benefitted traditional safe-haven assets.
That said, a modest US dollar rebound from one-month lows touched on Thursday helped limit any deeper losses amid oversold RSI on hourly charts. The greenback drew some support from some follow-through uptick in the US Treasury bond yields, bolstered by expectations for an early policy tightening by the Fed. The markets have been pricing in the possibility of a potential interest rate hike in 2022 amid worries about a faster-than-expected rise in inflationary pressure.
Hence, the market focus will remain glued to Friday's release of the US Core PCE Price Index, due later during the early North American session. The data will set the tone heading into next week's FOMC meeting and provide some impetus to the USD/CHF pair. Apart from this, the US bond yields will influence the USD price dynamics, which along with the broader market risk sentiment should produce some short-term trading opportunities around the major.
Technical levels to watch
-
09:00
Germany Gross Domestic Product w.d.a (YoY) came in at 2.5%, above forecasts (2.4%) in 3Q
-
09:00
Germany Gross Domestic Product (QoQ) came in at 1.8% below forecasts (2.2%) in 3Q
-
08:53
AUD/USD to struggle to post further gains – MUFG
The Reserve Bank of Australia (RBA) did not attempt to stall the sell-off in April 2024 notes even as yields climbed to 0.81% against its target of 0.10% following the rise in core inflation to 2.1%. The aussie is marginally lower today despite this huge bond yield move. However, since the end of September, AUD/USD is 5% higher. But gains going forward will prove more of a struggle, in the opinion of economists at MUFG Bank.
RBA fails to maintain government bond target
“The RBA chose not to step into the market to take down the yield on the April 2024 government bond, which effectively is a signal of abandoning a key monetary policy commitment without any formal communication to the markets.”
“The failure to cap yields means all guidance is potentially up for change when the RBA meets next Tuesday. We believe the yield curve cap will be abandoned and consistent with that the RBA will also drop its view of inflation not reaching 2%-3% sustainably before 2024. That will essentially endorse the markets view of rate hikes sooner than what the RBA was implying.”
“But like elsewhere the rate curve in Australia has gone too far and hence the RBA next week is also likely to push back on the extent of monetary tightening priced. Around 90bps of tightening over the next 12 months is excessive but the markets may well ignore any attempted push-back for now.”
“Limited further commodity price gains given the moves we’ve already had plus China growth slowing will temper AUD gains from here.”
-
08:44
USD/COP to extend its rebound above the September high of 3860 – SocGen
USD/COP has defended the lower limit of a multi-month ascending channel near 3720/3700 which is also the 50% retracement from last December and the 200-day moving average. Economists at Société Générale expect the pair to see a larger bounce on a break above 3860.
Dip below 3720/00 to signal a deeper fall
“A rebound looks on the cards towards September high of 3860. If this is overcome, an extended up-move could take shape.”
“Only a break below 3720/3700 will denote possibility of a deeper down move.”
-
08:35
GBP/USD to enjoy a larger rebound on a break above 1.3910/30 – SocGen
GBP/USD stalls around 1.3800. Economists at Société Générale note that the cable needs to erode the 1.3910/30 resistance zone to extend its bounce.
Supports await at 1.3570 and 1.3410
“September high of 1.3910/1.3930 is an important hurdle that must be crossed for a larger bounce.”
“1.3570 and September low at 1.3410 are near-term supports.”
-
08:30
GBP/USD clings to modest gains, bulls await a move beyond 1.3800
- GBP/USD gained some positive traction on Friday, though lacked follow-through.
- BoE rate hike expectations underpinned the sterling and extended some support.
- A combination of factors helped revive the USD demand and capped the upside.
The GBP/USD pair traded with a mild positive bias through the early European session, with bulls awaiting a sustained move beyond the 1.3800 mark.
Following the previous day's failure ahead of the 1.3820-25 resistance zone, the GBP/USD pair regained traction on Friday and is now looking to build on this week's recovery from the 1.3700 neighbourhood. That said, a goodish pickup in the US dollar demand, bolstered by a combination of factors, acted as a headwind for the major.
As investors looked past Thursday's dismal US GDP print, the greenback drew some support from a strong follow-through uptick in the US Treasury bond yields and the cautious market mood. The yield on the benchmark 10-year US government bond shot back above the 1.60% mark amid prospects for an early policy tightening by the Fed.
The markets seem convinced that the Fed would be forced to adopt a more aggressive policy response to contain stubbornly high inflation. This, along with signs of a global economic slowdown, has been fueling worries about the risk of stagflation and weighed on investors' sentiment, lending some support to the safe-haven USD.
On the other hand, the British pound was undermined by Brexit jitters, though expectations for an imminent Bank of England rate hike move helped limit losses. In the latest Brexit-related developments, the UK Prime Minister said that conditions had been met to invoke Article 16 unless they see rapid progress on the Northern Ireland protocol.
This comes on the back of a row over the post-Brexit fishing rights between the UK and France, which could hold bullish traders from placing aggressive bets around the GBP/USD pair. Moreover, repeated pullbacks from the 1.3820-25 supply zone make it prudent to wait for a strong follow-through buying before positioning for any further gains.
Friday's key highlight will be the release of the US Core PCE Price Index, which will set the tone heading into next week's key central bank meetings – BoE and FOMC. Apart from this, the US bond yields and the broader market risk sentiment will influence the USD price dynamics and provide some impetus to the GBP/USD pair.
Technical levels to watch
-
08:08
EUR/GBP to alleviate downside pressure on a break above 0.8530 – Commerzbank
EUR/GBP’s new low has not been confirmed by the daily RSI. Karen Jones, Team Head FICC Technical Analysis Research at Commerzbank, expects the pair to see a correction higher with first resistance seen at 0.8500, then 0.8530.
EUR/GBP to target the 0.8239 2019 low below 0.8400
“EUR/GBP new lows have not been confirmed by the daily RSI, and we are correcting higher.”
“We have initial resistance at 0.8500. Above here lies the 55-day ma at 0.8530 and will need to regain this in order to alleviate downside pressure and to challenge the 0.8659/73 highs since May.”
“Below 0.8400 attention should revert to the 0.8239 2019 low and the 200-month ma lies at 0.8159.”
-
08:06
Austria Producer Price Index (MoM) climbed from previous 0.8% to 1.1% in September
-
08:06
Austria Producer Price Index (YoY) climbed from previous 9.5% to 10.5% in September
-
08:02
USD/CAD to drop considerably towards 1.18 by early 2023 – Wells Fargo
The Bank of Canada (BoC) monetary policy announcement was much more hawkish than expected. Economists at Wells Fargo expect an earlier lift-off for Bank of Canada rate hikes than previously and forecast the USD/CAD pair plummeting to 1.18 by early 2023.
Loonie to enjoy considerable gains over time
“The BoC ended its quantitative easing program with immediate effect, and also signaled that policy interest rates could start rising earlier than previously expected.”
“We now forecast an initial 25 bps rate increase in April 2022, followed by another 25 bps in July 2022 and again in October 2022.”
“Our forecast for monetary tightening is more gradual than what is currently priced in by market participants. Still, given the overall backdrop, including steady growth, a steady series of rate hikes, and elevated commodity prices, we remain comfortable with our forecast of moderate CAD appreciation over time.
“We forecast a USD/CAD at 1.1800 by early 2023.”
-
08:01
Spain Retail Sales (YoY) came in at -0.1%, above expectations (-1.3%) in September
-
08:00
Spain Gross Domestic Product - Estimated (YoY) below expectations (3.5%) in 3Q: Actual (2.7%)
-
08:00
Spain Gross Domestic Product - Estimated (QoQ) came in at 2% below forecasts (2.7%) in 3Q
-
08:00
Austria Gross Domestic Product (QoQ) above forecasts (2.5%) in 3Q: Actual (3.3%)
-
08:00
Hungary Gross Wages (YoY): 9.1% (August) vs 8.1%
-
08:00
Switzerland KOF Leading Indicator above expectations (108.2) in October: Actual (110.7)
-
07:59
French FinMin Le Maire: Economy has returned to pre-pandemic levels in October
French Finance Minister Bruno Le Maire told France Info Radio on Friday that the economy has returned to pre-pandemic levels in October.
Additional comments
“The third-quarter economic growth was an exceptional result.”
“French economy heading in the right direction.”
-
07:56
EUR/JPY set to surge higher towards the 137.51 2018 peak – Commerzbank
EUR/JPY has bounced off the 131.52 support and is set to head higher towards the 134.12 June peak. Above here, the pair will target the 137.51 mark, Karen Jones, Team Head FICC Technical Analysis Research at Commerzbank, reports.
EUR/JPY recovered off the Fibo support
“EUR/JPY has eased back to and bounced off the 38.2% retracement at 131.52. Attention is back on the 134.12 June peak.”
“Longer-term, a break above the June peak is favoured, and will introduce scope to 137.51.”
“Dips should find initial support 131.55/50 and then at 130.74/46, the September highs and should attempt to reassert its longer term bull trend ahead of here.”
“Below 130.46 lies 128.74, the 6th October low and the 127.94/50, August and September lows and the February 2019 high.”
-
07:55
FX option expiries for October 29 NY cut
FX option expiries for October 29 NY cut at 10:00 Eastern Time, via DTCC, can be found below.
- EUR/USD: EUR amounts
- 1.1510 485m
- 1.1590-95 1.3b
- 1.1650-55 1.2b
- 1.1700 549m
- USD/JPY: USD amounts
- 113.00 674m
- 113.90-114.00 1b
- 114.60 500m
- 114.75 565m
- 115.00 730m
- USD/CAD: USD amounts
- 1.2300 1.1b
- 1.2345 785m
- 1.2400 505m
- 1.2450 529m
- NZD/USD: NZD amounts
- 0.7210 706m
- EUR/GBP: EUR amounts
- 0.8500 445m
- 0.8550 302m
-
07:46
France Consumer Price Index (EU norm) (MoM) above forecasts (0.3%) in October: Actual (0.5%)
-
07:46
France Consumer Price Index (EU norm) (MoM) came in at 0.4%, above forecasts (0.3%) in October
-
07:45
France Consumer Price Index (EU norm) (YoY) came in at 3.2%, above forecasts (3.1%) in October
-
07:44
Gold Price Forecast: XAU/USD pivots around $1800, levels to watch – Confluence Detector
- Gold price cautious amid US yield curve flattening, month-end flows in play.
- Focus shifts to the US PCE inflation and FOMC decision fresh moves in gold.
- Gold price to maintain range play around $1800 ahead US PCE inflation.
With markets reassessing the Fed’s tightening expectations after the US Q3 GDP miss, gold price lacks impetus so far this Friday, pivoting around the $1800 level. The bond market rout extends, with the yield curve flattening in play, which helps put a floor under gold price. The bright metal now looks forward to the Fed’s preferred inflation gauge, the Core PCE index, for fresh trading impulse. Meanwhile, the month-end flows and pre-FOMC cautious trading could influence gold’s performance.
Gold Price: Key levels to watch
The Technical Confluences Detector shows that gold is trading listlessly below the powerful hurdle at $1802, where the previous high four-hour, Fibonacci 23.6% one-week and SMA5 four-hour converge.
Acceptance above the latter is critical to extending the previous gains towards the Fibonacci 23.6% one-day at $1804.
The next stop for gold bulls is envisioned at $1809, which is the confluence of the previous day’s high, pivot point one-day R1 and Bollinger Band one-day Upper.
The previous week’s high of $1814 will then grab the buyers’ attention.
Further up, the bulls will look to clear a bunch of resistance levels around $1820, which is the intersection of the pivot point one-day R2, pivot point one-month R1 and pivot point one-week R1.
Alternatively, the immediate decline could be capped at $1796, which is the meeting point of the previous low four-hour and SMA5 one-day.
The next significant support is seen at $1793, the convergence of the previous day’s low and SMA200 one-day.
Further south, the confluence of the Fibonacci 61.8% one-month and pivot point one-day S1 at $1791-$1790 will be the level to beat for gold bears.
Here is how it looks on the tool
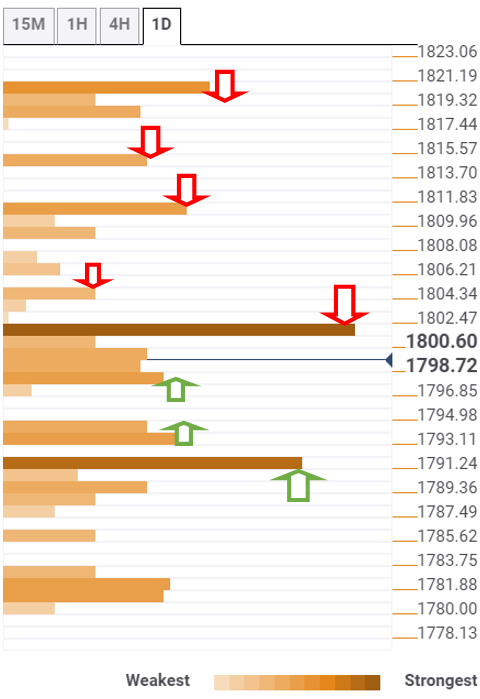
About Technical Confluences Detector
The TCD (Technical Confluences Detector) is a tool to locate and point out those price levels where there is a congestion of indicators, moving averages, Fibonacci levels, Pivot Points, etc. If you are a short-term trader, you will find entry points for counter-trend strategies and hunt a few points at a time. If you are a medium-to-long-term trader, this tool will allow you to know in advance the price levels where a medium-to-long-term trend may stop and rest, where to unwind positions, or where to increase your position size.
-
07:42
Forex Today: Dollar steadies, eyes on European data, US PCE inflation report
Here is what you need to know on Friday, October 29:
The dollar faced heavy selling pressure on Thursday after the US Bureau of Economic Analysis' first estimate showed that the US economy grew by only 2% in the third quarter. The shared currency outperformed its rivals as the European Central Bank adopted a cautious tone regarding inflation expectations. The greenback seems to have found its footing in the early European session as investors await GDP, inflation data for the euro area and German growth figures. Later in the day, the PCE inflation report and the UoM Consumer Sentiment Index will be featured in the US economic docket.
The US Dollar Index (DXY) fell more than 0.5% on Thursday as the disappointing GDP data caused investors to reassess the Federal Reserve's tapering timeline. Currently, the DXY is consolidating its losses around 93.50.
Personal Consumption Expenditure Price Index September Preview: Transitory inflation becomes permanent.
Wall Street: Major equity indexes in the US registered impressive gains on Thursday as investors remain hopeful for the Fed to continue to support the economy for longer than expected. US stocks futures are, however, losing between 0.3% and 0.9% early Friday, suggesting that there could be a deep correction ahead of the weekend.
Following a four-day slump, the benchmark 10-year US Treasury bond yield rose more than 2% on Thursday and continues to push higher on Friday, helping the dollar show some resilience against its rivals.
EUR/USD gained more than 70 pips on Thursday and reached its strongest level in a month at 1.1693. Although ECB President Christine Lagarde voiced her opposition to the market pricing of an ECB rate hike, she acknowledged that high inflation is likely to last longer than they initially anticipated. The shared currency could regather its strength in case Friday's data show that the economic activity in the euro area remains healthy in the third quarter. For now, the pair is moving sideways
GBP/USD stays below 1.3800 following Thursday's recovery. Renewed Brexit concerns could make it difficult for the British pound to attract investors. BBC reported late Thursday that France seized a British trawler and fined another one amid an ongoing spat regarding post-Brexit fishing rights.
USD/CAD failed to capitalize on the broad USD weakness as falling crude oil prices weighed on commodity-related loonie. August GDP data from Canada will be looked upon fresh impetus.
Once again, gold failed to clear $1,800 on Thursday capped by rising US T-bond yields. Last week, XAU/USD volatility increased into London fix and a similar action could be witnessed toward the end of the European session.Cryptocurrencies: Bitcoin managed to reclaim $60,000 on Thursday and looks to regather bullish momentum. Ethereum is treading water near record-highs and a break above $4,400 could trigger sharp fluctuations.
-
07:42
AUD/USD consolidates its recent gains to multi-month tops, just below mid-0.7500s
- AUD/USD lacked firm directional bias and seesawed between tepid gains/minor losses on Friday.
- The cautious market mood acted as a headwind for the perceived riskier aussie and capped gains.
- Rebounding US bond yields revived the USD demand and also held bulls from placing fresh bets.
The AUD/USD pair consolidated its recent gains to the highest level since early July and remained confined in a range through the first half of the trading action on Friday. The pair was last seen trading just below mid-0.7500s, nearly unchanged for the day.
Worries about a faster-than-expected rise in inflation, along with signs of a global economic slowdown have raised fears about the risk of stagflation. The market concerns were further fueled by Thursday's dismal US GDP report, which showed that the growth in the world's largest economy decelerated sharply during the third quarter of 2021. This, in turn, weighed on investors' sentiment and acted as a headwind for the perceived riskier aussie.
Meanwhile, the cautious market mood drove some haven flows towards the US dollar, which was further underpinned by a strong follow-through uptick in the US Treasury bond yields. This was seen as another factor that underpinned the greenback and collaborated to cap gains for the AUD/USD pair. In fact, the yield on the benchmark 10-year US government bond shot back above the 1.60% threshold during the Asian session on Thursday amid hawkish Fed expectations.
The markets seem convinced that the Fed would be forced to adopt a more aggressive policy response to contain stubbornly high inflation and have been pricing in the possibility of a rate hike in 2022. Hence, the focus will be on Friday's release of the US Core PCE Price Index, due later during the early North American session. The data will set the tone heading into next week's FOMC monetary policy meeting and provide a fresh impetus to the AUD/USD pair.
In the meantime, speculations for an interest rate hike by the Reserve Bank of Australia (RBA) might continue lending some support to the AUD/USD pair and help limit the downside. The market bets rose after Wednesday's RBA trimmed mean inflation for the third quarter indicated that consumer cost pressures are getting entrenched. This, in turn, warrants some caution for bearish traders and positioning for any meaningful corrective pullback.
Technical levels to watch
-
07:33
EUR/USD to climb towards 200-DMA at 1.1906 on a break above the 1.1706 downtrend – Commerzbank
EUR/USD is about to challenge its downtrend at 1.1706. Above here, the pair will target the 200-day moving average (DMA) at 1.1906, Karen Jones, Team Head FICC Technical Analysis Research at Commerzbank, reports.
Poised to challenge the four-month downtrend
“EUR/USD has shot higher and will shortly encounter the 55-DMA at 1.1700 and the 1.1706 four-month downtrend, which we suspect may hold for now.”
“A move above 1.1706 (resistance line) is needed to alleviate immediate downside pressure and would allow for a retest of the 1.1906 200-DMA.”
-
07:28
Natural Gas Futures: A deeper pullback is not favoured
According to flash data from CME Group, open interest in natural gas futures markets shrank for the third straight session on Thursday, this time by nearly 7K contracts. Volume followed suit and went down for the second consecutive session, now by more than 71.4K contracts.
Natural Gas: Prices could bounce back above $6.00
Thursday’s strong drop in prices of natural gas was against the backdrop of shrinking open interest and volume. That said, the likelihood of a sustainable decline from here appears not favoured, while a rebound to the area above the $6.00 mark per MMBtu stays in the pipeline in the very near term instead.
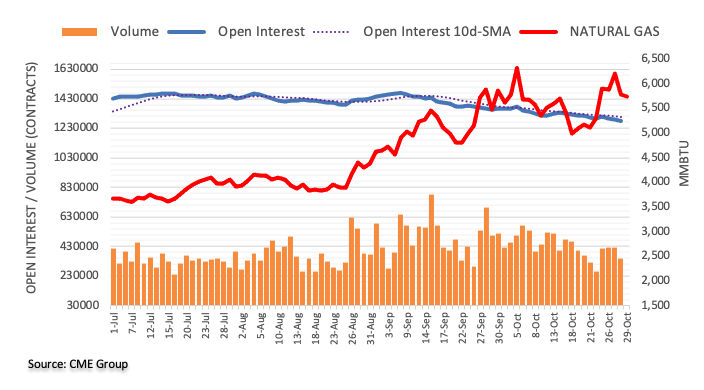
-
07:05
USD/JPY Price Analysis: 100-HMA, descending triangle keep buyers hopeful
- USD/JPY keeps rebound from 12-day low, picks up bids of late.
- Firmer RSI conditions, bullish chart pattern challenge seller’s entry.
- The 114.15 mark acts as a short-term key hurdle to the north.
USD/JPY pokes intraday high around 113.60 as European traders brush their screens for Friday’s tasks. The yen pair dropped to the lowest in two weeks the previous day before bouncing off 100-SMA.
The corrective pullback portrays a short-term descending triangle bullish chart pattern amid a firmer RSI line. However, the previous support line from September 22 becomes the key challenge for bull’s entry.
Hence, the USD/JPY pair’s upside break to the 114.00 threshold becomes imminent but the further upside will be challenged by the stated triangle’s upper line and the support-turned-resistance line around 114.15.
On the contrary, the 100-SMA level of 113.50 and the triangle’s support line near 113.20 questions the short-term declines of the pair.
Following that, the September-end top near 112.00 will gain the USD/JPY seller’s attention, a break of which will highlight the monthly low near 110.80.
USD/JPY: Four-hour chart
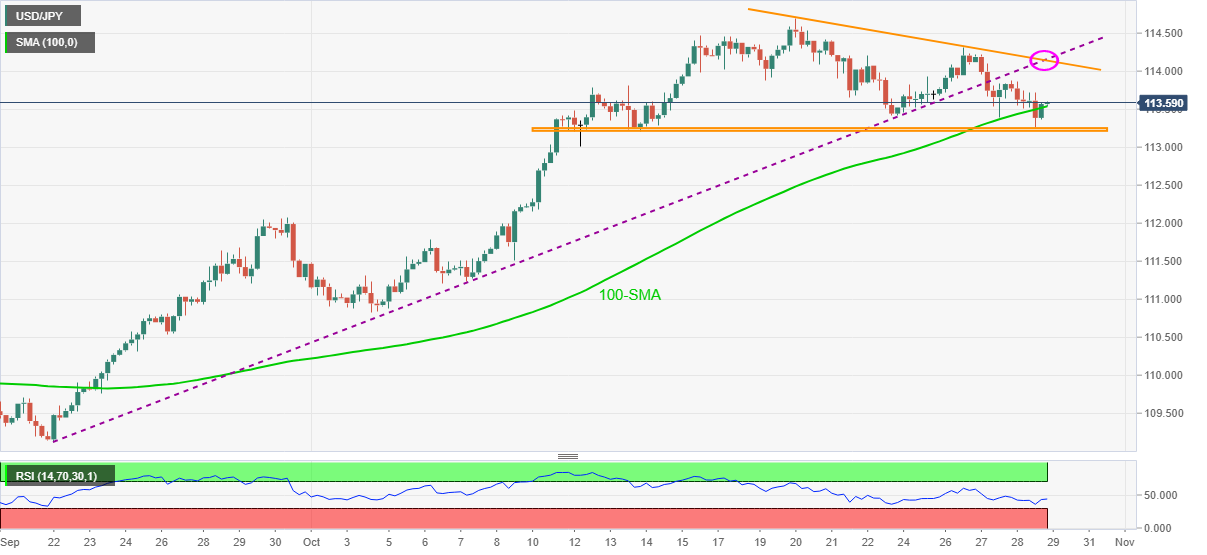
Trend: Further upside expected
-
07:04
Gold Price Forecast: XAU/USD to lurch higher a close above $1809
Gold price hit the highest levels so far this week at $1810 in early American trading after wavering around $1800 almost throughout the first half of Thursday. In the view of FXStreet’s Dhwani Mehta, XAU/USD is set to maintain range play around $1800 ahead of US PCE inflation.
Gold to waver within a pennant formation ahead of the key US data
“Gold is consolidating in a narrow range around $1800, contemplating the next move heading into the critical US PCE Price Index. The reading may not have much impact on gold unless there is a big deviation from the market consensus.”
“The yield curve flattening and the dollar dynamics will continue to influence gold, with investors awaiting the German and Eurozone GDP report for fresh trading impetus. The Eurozone inflation data will also be closely followed.”
“For a decisive break to the upside, XAU/USD needs a daily closing above the falling trendline resistance at $1809. If that happens, then a pennant breakout will get confirmed, opening doors towards the previous week’s high of $1814. The next relevant resistance is envisioned at the September month highs of $1834.”
“Strong support is seen at the 200-Daily Moving Average (DMA) at $1792, below which the $1788 will test the bullish commitments. A sustained move below the latter could validate a downside breakout from the pennant, with immediate cushion awaiting at the horizontal 50-DMA at $1781.”
See – Gold Price Forecast: Nascent XAU/USD bull to knock on the $1980 door – DBS Bank
-
07:04
EUR/GBP Price Analysis: Buyers face downside pressure near two-week old resistance around 0.8490
- EUR/GBP remains poised for weekly gains despite Friday’s weakness in the early European trading hours.
- The pair hovers in a short-term trading range of 0.8420 and 0.8480 since October 15.
- Momentum oscillator holds onto the oversold zone with bullish crossover.
EUR/GBP trades lower on Friday after posting strong gains in the US session. The pair opened higher but failed to sustain the momentum. At the time of writing, EUR/GBP is trading at 0.8466, down 0.06% for the day.
EUR/GBP daily chart
-637710840398980483.png)
On the daily chart, the EUR/GBP cross currency pair came under selling pressure after testing four-month high at 0.8658 on September 29, which intensified on October 14 after breaking the confluence of 100-day and 50-day Simple Moving Average’s (SMA) confluence.
If the price sustains the intraday high it could first face the upside target at October 15 high of 0.8486, followed by the psychological 0.8500 level.
Furthermore, the Moving Average Convergence Divergence (MACD) holds onto the oversold zone with a bullish crossover. Any uptick in the MACD could push the spot toward 0.8520 horizontal resistance zone.
Alternatively, on the reverse side of the trade, the downside target appears at the 0.8440 horizontal support zone and then the previous day’s low of 0.8422. A break of the 0.8400 level could open the gates for the February 2020 lows of 0.8282.
EUR/GBP additional levels
-
07:01
South Africa Private Sector Credit registered at 1.6%, below expectations (2.1%) in September
-
07:01
South Africa M3 Money Supply (YoY) above forecasts (3.9%) in September: Actual (4.01%)
-
07:00
Norway Credit Indicator remains unchanged at 5.3% in September
-
07:00
Denmark Unemployment Rate dipped from previous 3.1% to 2.9% in September
-
06:58
Crude Oil Futures: Extra gains likely
CME Group’s advanced prints for crude oil futures markets noted traders added around 11.7K contracts and reversed five consecutive daily drops on Thursday. Volume, instead, extended the downtrend and shrank by more than 8K contracts.
WTI appears supported above $80.00
Prices of the WTI dropped and rebounded from the vicinity of the $80.00 mark per barrel on Thursday, closing the session with decent gains. The move was in tandem with rising open interest, which is supportive of extra gains in the very near term. Against that, the next hurdle f note comes at the 2021 high past the $85.00 yardstick (October 25).
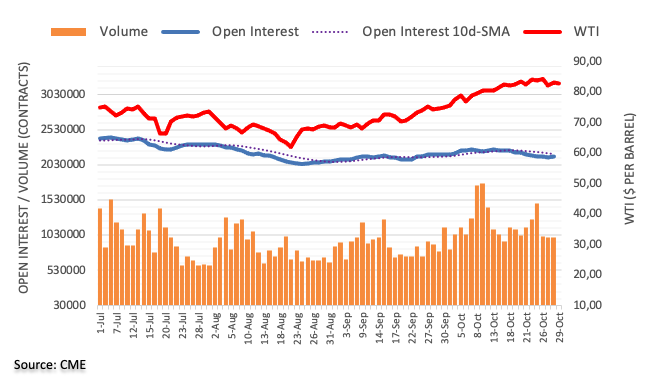
-
06:45
Gold Futures: Further consolidation on the cards
Open interest in gold futures markets reversed two daily builds and increased by around 7.8K contracts on Thursday considering preliminary readings from CME Group. In the same direction, volume rose by nearly 50K contracts and extended the choppy activity seen as of late.
Gold capped by the $1,800 area
Prices of the yellow metal surpassed the key $1,800 mark per ounce troy on Thursday just to retreat afterwards and closed once again below it. The move was amidst rising open interest and volume and could open the door to some weakness in the very near term. That said, gold is expected to remain with the current consolidative range for the time being.
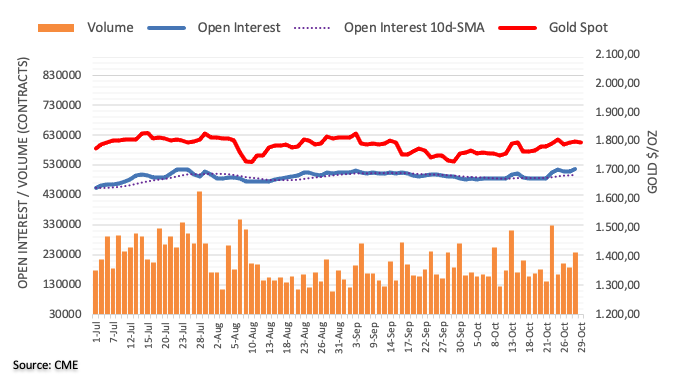
-
06:37
USD/CAD seesaws near 1.2350 despite heavy oil, US/Canada data in focus
- USD/CAD pauses two-day downtrend, retreats from intraday high of late.
- Risk-off mood help USD to consolidate recent losses, weigh on commodities.
- US Core PCE Inflation, Canada GDP will decorate calendar.
- Stimulus update, Fed tapering concerns are the key risk catalysts.
USD/CAD remains indecisive around 1.2350 amid the initial European session on Friday. In doing so, the Loonie pair sellers take a breather amid mixed clues concerning oil, the US and Canada.
Starting with the Canadian highlights, the Bank of Canada’s (BOC) end of bond issuance portrays optimism of the Canadian economy but the monthly GDP reading for August, expected +0.70% versus -0.10% prior, becomes necessary for the USD/CAD to please the bears.
On the same line, oil prices have been cheering hopes of economic recovery and supply outages before the US dollar rebound and the chatters surrounding tapering challenged the energy bulls.
Elsewhere, the absence of a deal on US President Joe Biden’s $1.75 trillion stimulus and mixed concerns over China’s Evergrande and real-estate market, not to forget fears of Fed tapering, weigh on the market sentiment and underpin the US dollar’s safe-haven demand. That said, the greenback gauge dropped the most in a week as US Q3 GDP and the European Central Bank (ECB) triggered risk-on mood.
Amid these plays, stock futures are down around 0.40% whereas the US 10-year Treasury yields gain four basis points (bps) to help the US Dollar Index (DXY) consolidate the recent losses.
Looking forward, the US Core Personal Consumption Expenditures (PCE) – Price Index for September, expected to ease to 0.2% from 0.3% prior, may help USD/CAD sellers should the Canadian GDP matches the upbeat forecast of +0.7% versus -0.10% MoM in August.
Technical analysis
USD/CAD prints a bearish flag on the four-hour chart, highlighting a downside break of 1.2300 as a trigger for further selling. However, MACD teases bulls and hence a corrective pullback towards 100-SMA level near 1.2410 can’t be ruled out before the next fall.
-
06:32
Asian Stock Market: Trades mixed on US-China row, central banks guidance
- Asian stocks remain poised to end the week on a flat path despite its higher US counterparts.
- Higher inflation, major central banks verdicts, lower economic growth keep traders' nerves in check.
- Recent US-China row over Taiwan bolsters tension in the region.
Asia-Pacific stocks are mixed on Friday diverging from the positive cues from Wall Street . Further, investors digested the policy updates from the Bank of Canada (BOC), Bank of Japan (BOJ), and the European Central Bank (Bank) policy announcements.
The sentiment was further dampened in the region after China accused the US over Taiwan military contracts by referring to it as interference in internal affairs.
MSCI’s broadest index of Asia-Pacific shares outside Japan edged down 0.3% and remained on track for a weekly loss of 1.3%.
The Shanghai Composite Index dropped 0.3%, following fear amid resurgence of coronavirus cases, ongoing property sector crisis, government intervention in the coal industry and rising tension with the US.
The Nikkei 225 index declined 0.7% after dismal data. The Japanese Industrial Production shranked at 5.4% in September, weaker than the 3.2% forecast .
The ASX 200 traded a tad lower below 7,400 mark despite a rebound in Retail Sales. The Retail Sales rose by 1.3% in September, from a 1.7 drop in the previous month.
Hong Kong’s Hang Seng Index declined 0.41% while South Korea’s Kospi fell 0.64%.
-
06:31
France Gross Domestic Product (QoQ) came in at 3%, above forecasts (2.1%) in 3Q
-
06:30
France Consumer Spending (MoM) came in at -0.2% below forecasts (0.2%) in September
-
06:09
Japan: Construction Orders, y/y, September 27.3%
-
06:04
NZD/USD Price Analysis: Prints cup-and-handle bullish formation around 0.7100
- NZD/USD grinds higher following the pullback from weekly top.
- Firmer RSI, sustained trading beyond 200-HMA favor bulls.
- May’s top lures buyers during further upside, weekly low adds to the downside filters.
NZD/USD consolidates the heaviest daily gain in a week around 0.7195, down 0.11% intraday as European traders brace for Friday’s bell.
The kiwi pair poked the monthly high before easing from 0.7218 the previous day. In doing so, the quote portrays a cup-and-handle bullish chart pattern on the hourly play.
The buyer’s optimism could also be witnessed through the pair’s successful trading above 200-HMA amid a firmer RSI line.
However, a clear break of 0.7210, followed by the clearance to 0.7220, becomes necessary for the confirmation of an upside targeting May’s peak of 0.7317.
Meanwhile, pullback moves remain less worrisome until staying beyond the 200-HMA level of 0.7165. Also acting as immediate support is the area comprising multiple levels marked since October 22, around 0.7130.
To sum up, NZD/USD upside momentum is gradually catching heat but needs a trigger for fire.
becomes necessary for the pair
NZD/USD: Hourly chart
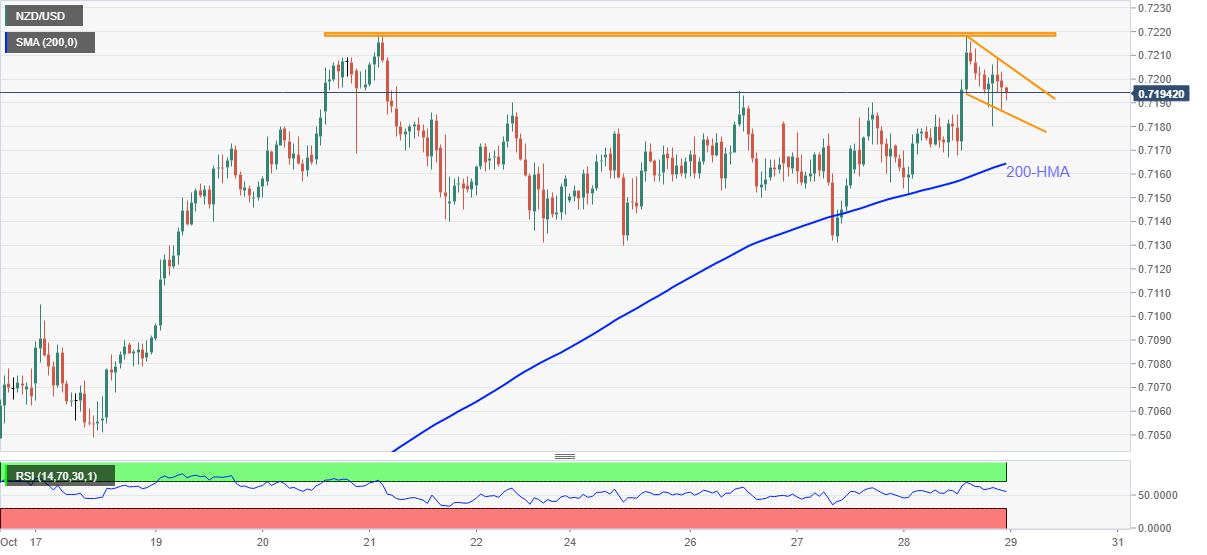
Trend: Further upside expected
-
06:03
Japan: Housing Starts, y/y, September 4.3% (forecast 7.5%)
-
06:02
Japan Annualized Housing Starts down to 0.845M in September from previous 0.855M
-
06:01
Japan Housing Starts (YoY) came in at 4.3% below forecasts (7.5%) in September
-
06:01
Japan Construction Orders (YoY) climbed from previous -2% to 27.3% in September
-
06:00
Japan: Consumer Confidence, October 39.2
-
05:41
USD/INR Price News: Indian rupee pokes weekly high below 75.00 on mixed concerns
- USD/INR braces for three-week fall, grinds lower of late.
- Shaktikanta Das get another term as RBI Governor, India’s covid-led fatalities jumped to three-month high.
- USD licks US GDP and ECB-led wounds around monthly low.
- US Core PCE Inflation, risk catalysts eyed for fresh impulse.
USD/INR bears take a breather following the heaviest daily fall in a week, seesaws around 74.80 heading into Friday’s European session. Even so, the Indian rupee (INR) pair remains on the way to print a three-week downtrend despite mixed news at home.
Among the positives is Shaktikanta Das’s re-appointment as the Governor of the Reserve Bank of India (RBI) for three years beyond December 10. “Das was previously the department of economic affairs secretary at the finance ministry and was appointed as the head of the central bank on Dec. 11, 2018, for three years,” said Reuters.
On the contrary, the highest covid-led death toll since late July, around 805, pours cold water on the face of the Indian government’s claims of success in jabbing.
Elsewhere, a delay in the US stimulus and mixed concerns over China’s Evergrande also weighed on the market sentiment and allowed the US Dollar Index (DXY) to consolidate recent losses. As per the latest update, US House Speaker Nancy Pelosi conveyed her optimism towards the passage of infrastructure and social spending, climate bills during the phone call to postpone the vote on the infrastructure bill. Further, Global rating giant S&P cites the risk of a default by the 33% of China’s property developers, including Evergrande. The news contrasts Evergrande’s second coupon payment, that too before time.
It should be noted that a softer-than-expected and previous readout of the US Q3 GDP joined the European Central Bank’s (ECB) failures to hide hawkish intentions to weigh on the greenback the previous day.
Against this backdrop, Asian stocks track US stock futures to the south and the US 10-year Treasury yields help the DXY to lick its wounds.
Moving on, the Core Personal Consumption Expenditures (PCE) – Price Index for September, likely to ease to 0.2% from 0.3% prior on the MoM basis will be the key to watch as it’s the Fed’s preferred inflation gauge. Hence, any softening of the data may add challenges for the greenback bulls.
Read: Personal Consumption Expenditure Price Index September Preview: Transitory inflation becomes permanent
Technical analysis
Given the first daily close below 20-DMA, around 75.00 by the press time, since mid-September, coupled with bearish MACD signals, USD/INR is likely declining towards October 21 swing low near 74.70. However, any further downside will be questioned by multiple tops marked in August around 74.50.
-
05:30
Netherlands, The Retail Sales (YoY): 4.7% (September) vs 1.9%
-
05:23
USD/TRY Price Analysis: Sellers remain active near 9.6000 resistance zone
- USD/TRY shrugs off the previous day’s gains on Friday in the early European session.
- The cross-currency pair remains pressured near 9.6000 for the past three-session.
- Receding momentum oscillator warns caution before placing aggressive bids.
USD/TRY edges lower on the last day of the trading week. The pair stayed in a very narrow trade band with no meaningful direction. At the time of writing, USD/TRY is trading at 9.5362, down 0.07% for the day.
USD/TRY daily chart
-637710780712470965.png)
On the chart, the USD/TRY cross-currency pair has been in the upside momentum since September 7. The pair traded in a close trade band of 9.4000 and 9.6000 since it peaked to an all time high on Monday at 9.8505.
If the price breaks below the intraday low it could again test the 9.4000 horizontal resistance level and then keep an eye on the October 21 low of 9.2098. Furthermore, The Moving Average Convergence Divergence (MACD) indicator holds onto the overbought zone with stretched buying conditions. Any downtick in the MACD could bring the 9.1000 horizontal support zone back into picture.
Alternatively, if the price reverses direction, it could first test the previous session’s high at 9.6317, followed by the 9.7000 horizontal resistance zone line. A daily close above the mentioned level would explore the possibility of 9.8505 (Monday high).
-
05:02
AUD/USD Price Analysis: Bears attack 0.7530 key support for re-entry
- AUD/USD grinds higher around three-month top, snaps four-day uptrend.
- Ascending trend line from late August challenge bears amid overbought RSI conditions.
- 200-DMA, weekly resistance line guards immediate upside.
AUD/USD bulls seem to have tired after a four-day uptrend to the fresh high since early July. That being said, the Aussie pair is down 0.15% intraday around 0.7535 ahead of Friday’s European session.
It’s worth noting that the overbought RSI conditions dragged the quote from the multi-day high but a two-month-old ascending support line challenges the sellers of late.
However, the stronger hurdle to the north, comprising weekly resistance line and 200-DMA, joins the RSI signals to hint at a pullback towards the 0.7500 threshold, on the break of the immediate 0.7530 trend line support.
During the quote’s weakness past 0.7500, the 10-DMA level near 0.7490 and September’s high near 0.7480 will question the AUD/USD weakness.
Meanwhile, an upside clearance of the 0.7560 resistance confluence isn’t a green pass to the strong rally as an ascending resistance line from late July, near 0.7575, becomes a tough nut to crack for the bulls.
To sum up, AUD/USD is likely to witness a pullback but the bullish trend isn’t expected to reverse.
AUD/USD: Daily chart
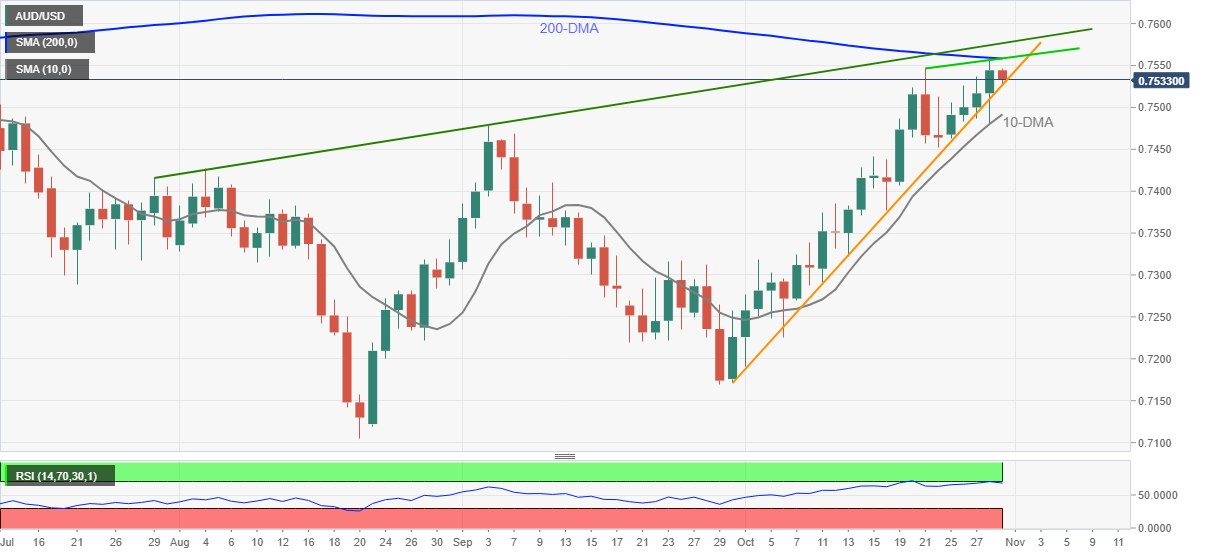
Trend: Pullback expected
-
04:39
EUR/USD clings to monthly top near 1.1700, Eurozone GDP, inflation eyed
- EUR/USD consolidates the biggest daily jump since May close to monthly top, sidelined of late.
- DXY licks US GDP, ECB-led wounds amid cautious sentiment.
- US Core PCE Inflation, risk catalysts are important too.
EUR/USD treads water around 1.1685, grinds higher heading into Friday’s European session.
The major currency pair cheered the US dollar slump to portray the biggest daily run-up in five months the previous day, also refreshing the monthly peak. However, the short-term key resistances line and 50-DMA challenged the quote’s further advances. The recent inactivity could also be linked to the sluggish markets.
Having witnessed both the key data/events of the week, namely US Q3 GDP and the European Central Bank (ECB) monetary policy, markets reconfirm the previous day’s risk-on mood. The skepticism joins the absence of a deal on US President Joe Biden’s $1.75 trillion stimulus package and cautious sentiment ahead of the top-tier data to weigh on the sentiment. Also challenging the risk appetite are mixed concerns over China’s Evergrande and real-estate market, not to forget fears of Fed tapering.
As per the latest update, US House Speaker Nancy Pelosi conveyed her optimism towards the passage of infrastructure and social spending, climate bills during the phone call to postpone the vote on the infrastructure bill. Further, Global rating giant S&P cites the risk of a default by the 33% of China’s property developers, including Evergrande. The news contrasts Evergrande’s second coupon payment, that too before time.
Additionally, inflation expectations in the US and Eurozone eased after refreshing multi-month high during the early week. However, the current levels are still challenging the respective central bank’s easy-money policies.
Hence, today’s preliminary Consumer Price Index (CPI) data for Eurozone, expected to rise from 3.4% prior to 3.7% for October, will be watched carefully for fresh impulse. Also important will be the initial Q3 GDP data for Germany and the Eurozone. While the bloc’s GDP growth is likely to slow to 2.0% versus 2.2% prior, Germany many keep the reflation fears on the table with 2.2% expected growth compared to 1.6% previous readouts. Should the scheduled economics arrive as stronger, the ECB’s efforts to play down inflation expectations will be rejected, which in turn could help the US dollar to consolidate recent losses.
However, it all depends upon how well the US dollar reacts to the Core Personal Consumption Expenditures (PCE) – Price Index for September, likely to ease to 0.2% from 0.3% prior on the MoM basis.
Read: Personal Consumption Expenditure Price Index September Preview: Transitory inflation becomes permanent
Technical analysis
Given the bullish MACD signals and the firmer RSI line, not overbought, the EUR/USD upside momentum is likely to prevail until staying beyond the previous high of the month near 1.1670. Though, a clear break of an upward sloping trend line from October 04 and the 50-DMA, respectively around 1.1690 and 1.1700, becomes necessary to rule out chances of a pullback.
-
04:13
GBP/USD remains depressed near 1.3800 ahead of US inflation
- GBP/USD trades cautiosly on Friday in the Asian trading hours.
- The US dollar falls below 93.50 following dismal US GDP figures.
- UK budget, Brexit, and hawkish BOE entertain the pound traders.
GBP/USD remains firm during the Asian session on the last trading day of the week. The pair managed to gather momentum, following the previous session. At the time of writing, GBP/USD is trading at 1.3800, up 0.01% for the day.
The sterling keeps its foot firmly against the majors amidst the broad-based USD selling. The greenback gauge dropped the most since October 13 the previous day after the US Q3 Gross Domestic Product (GDP) fell below the 2.7% forecast to 2.0%, much lower than the previous reading of 6.7%. Investors assessed the downbeat GDP data as a hint that could push the Fed to slow down on its monetary policy normalization hustle.
In addition to that, UK Chancellor Rishi Sunak’s multi-billion pound 2021 budget and the hawkish Bank of England (BOE) seem to support the move in the currency.
The Brexit-led pessimism, however, limits gains in sterling. As per the BBC, France has seized a British trawler and another has been fined amid an escalating row over post-Brexit fishing rights.
As for now, traders keep their focus on the BOE Consumer Credit, Mortgage Lending and US Personal Consumption Expenditures-Price Index to gauge market sentiment.GBP/USD technical levels
-
03:51
OPEC+ sees favorable shift in market ahead of November 4 meeting
“OPEC+ now sees some more room for its crude in the market,” Energy Intelligence reports, citing an initial draft of a report prepared ahead of the alliance's November 4 meeting.
At its last meeting, OPEC+ decided to maintain the planned 400K barrel per day (bpd) increase in oil output.
Meanwhile, it was reported earlier on that Algeria wants to stick to the 400K output bump, as the country’s Energy Minister said that OPEC+ output increase should not exceed 400K bpd in December.
Market reaction
In light of the OPEC+ oil out speculation, WTI is trading modestly flat around $82.80, consolidating the impressive recovery from two-week lows.
-
03:42
Japan’s Govt Official: October output may not expand as much as forecast amid chip shortage
A Japanese government official said on Friday, the October output may not expand as much as forecast, as worries over the chip and parts supply shortage remain.
These comments come after Japan's industrial output fell for the third straight month in September as the auto sector was hit by a persistent global supply shortage.
Factory production slumped 5.4% in the reported period from the previous month.
Market reaction
USD/JPY is keeping its recovery mode intact above 113.50 on these comments. The spot was last seen trading at 113.56, almost unchanged on the day.
-
03:10
RBA fails to defend the yield target once again
On Friday, the Reserve Bank of Australia (RBA) fails to defend the yield target for the second straight day, allowing the yields on the government’s April 2024 bond to advance as high as 0.76% vs. the central bank’s target of 0.1%.
The aussie central bank made no offer to buy the key April 2024 bond at the usual time for such operations, per Reuters.
With the RBA opting out defending the bond target fans speculation that policymakers are set to abandon the program, in the face of rising inflationary pressures.
This comes ahead of the central bank’s November monetary policy meeting due next Tuesday.
Market reaction
AUD/USD is benefiting from the RBA’s inaction in the bond markets, currently trading at 0.7541, almost unchanged on the day.
-
03:09
S&P 500 Futures drop as stimulus absence, anxiety over US inflation sour sentiment
- S&P 500 Futures fail to track Wall Street gains, US Treasury yields remain lacklustre.
- DXY consolidates the heaviest fall in 12 days amid a quiet session.
- Delay in Biden’s much-awaited aid package, wait for Fed’s preferred inflation gauge and mixed Evergrande news probe the bulls.
- US GDP, ECB favored market sentiment amid downbeat inflation expectations.
S&P 500 Futures consolidate weekly gains around record top, down 0.40% intraday near 4,570 during early Friday. The risk barometer portrays the cautious mood in the market following upbeat data backed by receding fears of the Fed tapering.
That being said, an absence of a deal on US President Joe Biden’s $1.75 trillion stimulus package weighs on the sentiment of late. As per the latest update, US House Speaker Nancy Pelosi conveyed her optimism towards the passage of infrastructure and social spending, climate bills during the phone call to postpone the vote on the infrastructure bill.
Elsewhere, Global rating giant S&P cites the risk of a default by the 33% of China’s property developers, including Evergrande. The news contrasts Evergrande’s second coupon payment, that too before time.
Against this backdrop, the US 10-year Treasury yields struggle for clear direction around 1.57% while the US Dollar Index (DXY) consolidates the heaviest fall in 12 days around 93.40 by the press time.
Previously, the softer prints of the US Q3 GDP, 2.0% versus 2.7% forecast and 6.7% prior, tamed the Fed tapering concerns and favored the risk-on mood. On the same line was the second daily fall in the US inflation expectations, as per the 10-year breakeven inflation rate per the St. Louis Federal Reserve (FRED) data.
Looking forward, investors will rethink the previous day’s moves amid a lack of major data/events and can consolidate the gains ahead of the US data. As per the market consensus, the Core Personal Consumption Expenditures (PCE) – Price Index for September is likely to ease to 0.2% from 0.3% prior on the MoM basis. This should ideally exert additional downside pressure on the reflation fears and challenge the tapering tantrums, helping the equities and commodities. However, the global central banks are less in the mood to accept that fact and hence the market fears may continue.
Read: Personal Consumption Expenditure Price Index September Preview: Transitory inflation becomes permanent
-
03:02
USD/INR Price Analysis: Daily flag losing bullish conviction
- USD/INR is under pressure as the Indian rupee finds strength on domestic basis.
- US dollar pressured as central banks start to align and leave US dollar out to hang.
The price of USD/INR is being capped by a dynamic trendline resistance and the price is starting to shift to the downside.
The following illustrates the bull's plight from a daily perspective and we zoom in on the 4-hour structure for a closer perspective.
USD/INR daily chart
-637710684010557586.png)
The price broke out of dynamic resistance but has so far failed to extend higher and is bounded by 4-hour resistance as follows:
USD/INR 4HR chart
-637710691793355736.png)
The price is accumulated at the trendline support as per the daily chart but it is tucked beneath the M-formation's neckline near 74.93. Only a break above there and a continuation to take out the 75.20s will leave the bulls in good stead for the upside continuation.
However, the US dollar is sticky as the euro advances following the central bank decision and concerns of inflation.
DXY daily chart
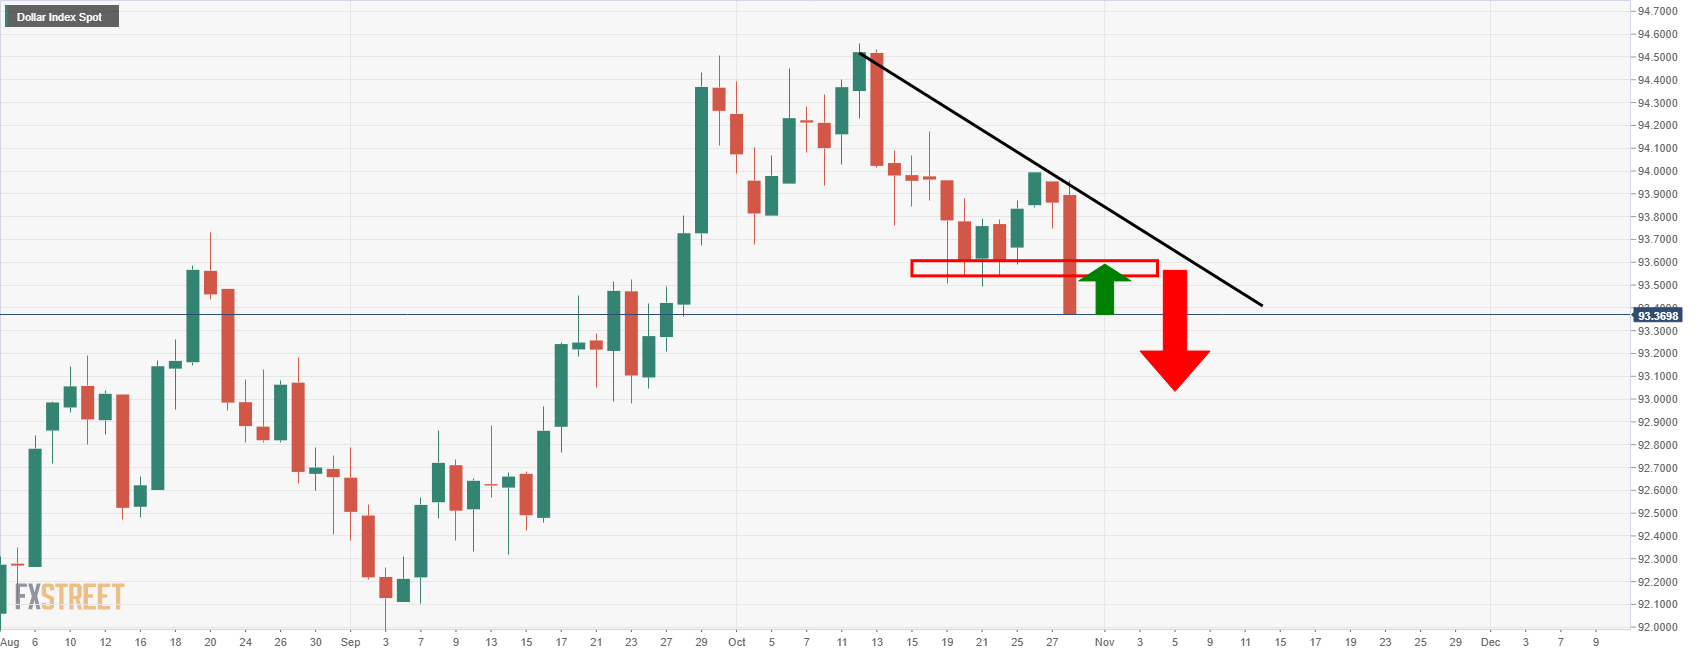
Additionally, the Indian rupee and bonds strengthened on Thursday as a drop in global crude oil prices provided a breather and helped calm investor worries over sustained imported inflationary pressures in the domestic economy.
-
02:43
Evergrande Update: 33% of China’s property developers face a real risk of default – S&P
Analysts at S&P Global Ratings warned in a research note on Friday, amidst the ongoing China Evergrande crisis, a third of the country’s property developers could face a “real” risk of default, with about US$84 billion in debt maturing by the end of next year, per South China Morning Post (SCMP).
Key takeaways
“More than half of its rated portfolio of Chinese property developers are “most at risk” under such a scenario as their bonds are rated as junk, from “B-” to “B+”, or two levels below investment grade.”
“The entities have also made heavy use of funding via joint ventures and trust loans, given they have been largely shut out of more conventional funding,”
“New regulations and weak sentiment are squeezing these capital channels.”
“The idea that entities may be abruptly deprived of such funding, threatening refinancing plans and potentially triggering defaults, is a large part of our scenario analysis.”
Meanwhile, it was reported earlier on that Evergrande, the world’s most indebted developer, made another debt payment of USD47.5 million ahead of a Friday deadline, averting default for the second time in two weeks.
Evergrande’s liquidity crunch amounts to more than $300 billion in liabilities, leaving investors on the edge.
Market reaction
Amid negative earnings from Wall Street giants, Amazon and Apple Inc, the S&P 500 futures are shedding 0.43% so far. The Asian stocks are also mostly lower after ECB’s disappointment and worse-than-expected US Q3 GDP data.
-
02:35
US Dollar Index Price Analysis: DXY bears need acceptance below 93.30
- DXY remains sidelined following the heaviest decline in two weeks.
- 50-DMA, five-month-old support line challenges further downside.
- Rebound will aim for 93.50 regain, short-term resistance line will be the key to watch afterward.
- 100-DMA acts as an additional downside filter below 92.30.
US Dollar Index (DXY) treads water around 93.35 during early Friday, having dropped the most in 12 days the previous day.
Although a clear break of 93.50 horizontal support, now resistance, keeps the DXY sellers hopeful amid bearish MACD signals, 50-DMA and an ascending trend line from late May question further declines.
Hence, the quote need not only break the 50-DMA support of 93.35 but also conquer the stated support line figure of 93.30 to extend the latest weakness.
Following that, the 93.00 threshold and the 100-DMA level near 92.85 will entertain the US Dollar Index bears.
Meanwhile, the corrective pullback may target the previous support around 93.50 but a descending trend line resistance from October 12, close to 93.90, will be a tough nut to crack for the DXY bulls.
In a case where the quote rises past 93.90, the 94.00 round figure will hold the gate for the further price rally targeting the monthly high near 94.55.
DXY: Daily chart
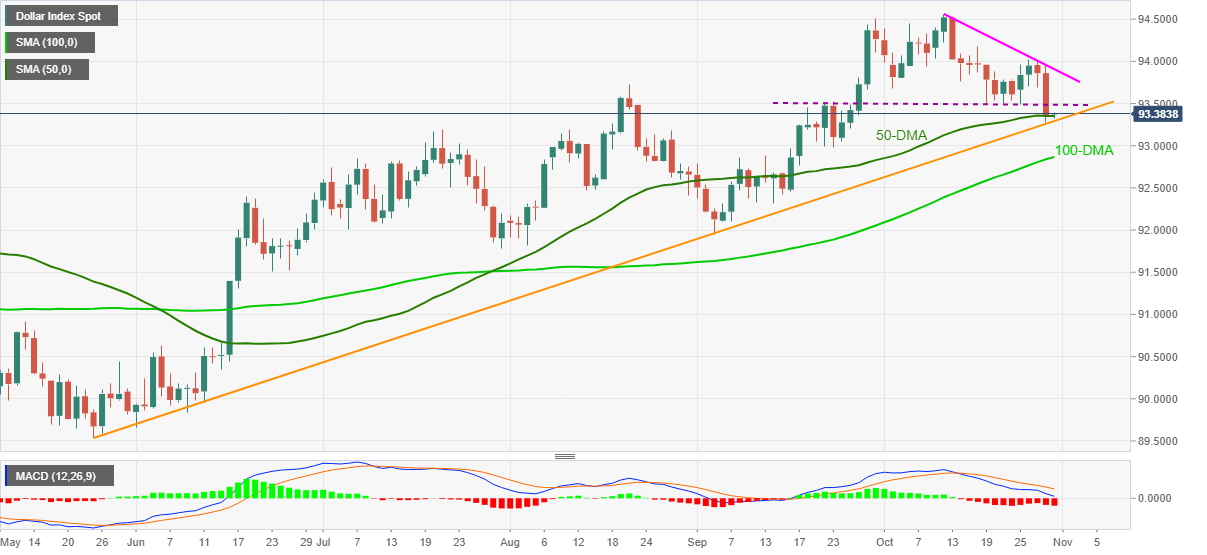
Trend: Further weakness expected
-
02:21
USD/CNY fix: 6.3907 vs. estimate of 6.388
In recent trade today, the People’s Bank of China (PBOC) set the yuan (CNY) at 6.3907 vs. estimate of 6.388.
About the fix
China maintains strict control of the yuan’s rate on the mainland.
The onshore yuan (CNY) differs from the offshore one (CNH) in trading restrictions, this last one is not as tightly controlled.
Each morning, the People’s Bank of China (PBOC) sets a so-called daily midpoint fix, based on the yuan’s previous day closing level and quotations taken from the inter-bank dealer.
-
02:14
Gold Price Forecast: XAU/USD bulls struggle around $1,800, US Core PCE Inflation eyed
- Gold remains sidelined after two-day uptrend amid quiet markets.
- Risk appetite worsens on US stimulus absence, consolidation following US GDP, ECB.
- DXY bears take a breather following the heaviest fall in a week.
- Gold Price Forecast: Poised to challenge October´s high at 1,813.80
Gold (XAU/USD) seeks fresh clues following two-day advances, seesaws around $1,800 during early Friday. Even so, the yellow metal remains on the way to print a three-week run-up by the press time.
Bulls refreshed weekly top the previous day following the US dollar’s slump on the downbeat US Q3 GDP figures and the European Central Bank’s (ECB) failed attempt to tame the Euro.
That said, the US Dollar Index (DXY) posted the heaviest fall in 12 days on Thursday after US Q3 GDP slipped below 2.7% forecast to 2.0%, much lower than 6.7% prior. The softer GDP growth pushes the Fed to slow down on its monetary policy normalization rush. It should be observed that the ECB’s hint to start tapering the monthly bond purchases and the PEPP (Pandemic Emergency Purchase Program) will end next March propelled the Euro and weighed down the USD. The regional central bank left monetary policy unchanged, as expected, with refinancing rate at 0.0% and deposit rates at -0.5%.
Although the greenback gauge remains lackluster by the press time and supports the gold buyers, sour sentiment challenges the commodity’s upside momentum. The same could take clues from an absence of a deal on US President Joe Biden’s $1.75 trillion stimulus package. Recently, US House Speaker Nancy Pelosi conveyed her optimism towards the passage of infrastructure and social spending, climate bills during the phone call to postpone the vote on the infrastructure bill.
To portray the mood, S&P 500 Futures print mild losses while the US 10-year Treasury yields struggle for clear direction around 1.568%.
Given the risk-off mood and an absence of US dollar selling, gold may remain pressured ahead of the key US inflation figures. That said, the Core Personal Consumption Expenditures (PCE) – Price Index for September is likely to ease to 0.2% from 0.3% prior on the MoM basis. The same should add to hopes of a bit slower dial-back of easy money by the Fed, which in turn may exert additional downside pressure on the USD on meeting the forecasts and help gold prices to retail the latest bullish impulse.
Read: Personal Consumption Expenditure Price Index September Preview: Transitory inflation becomes permanent
Technical analysis
Gold (XAU/USD) remains on the front foot inside a two-week-old rising wedge formation amid firmer RSI conditions, not overbought.
Although 50-SMA adds strength to the wedge’s support line around $1,788, gold buyers have repeatedly been rejected by 78.6% Fibonacci retracement (Fibo.) of September’s fall, near $1,810.
Even if the quote manages to cross the $1,810 hurdle, the upper line of the stated wedge close to $1,814 the previous month’s peak of $1,834 will be tough nuts to crack for the gold bulls.
On the contrary, a downside break of $1,788 support confluence will confirm the bearish chart pattern and could aim for September’s bottom of $1,721. During the fall, $1,770 and $1,745 may offer multiple supports to test the gold sellers.
Overall, gold remains in the upward trajectory but the bulls have a bumpy road ahead.
Gold: Four-hour chart
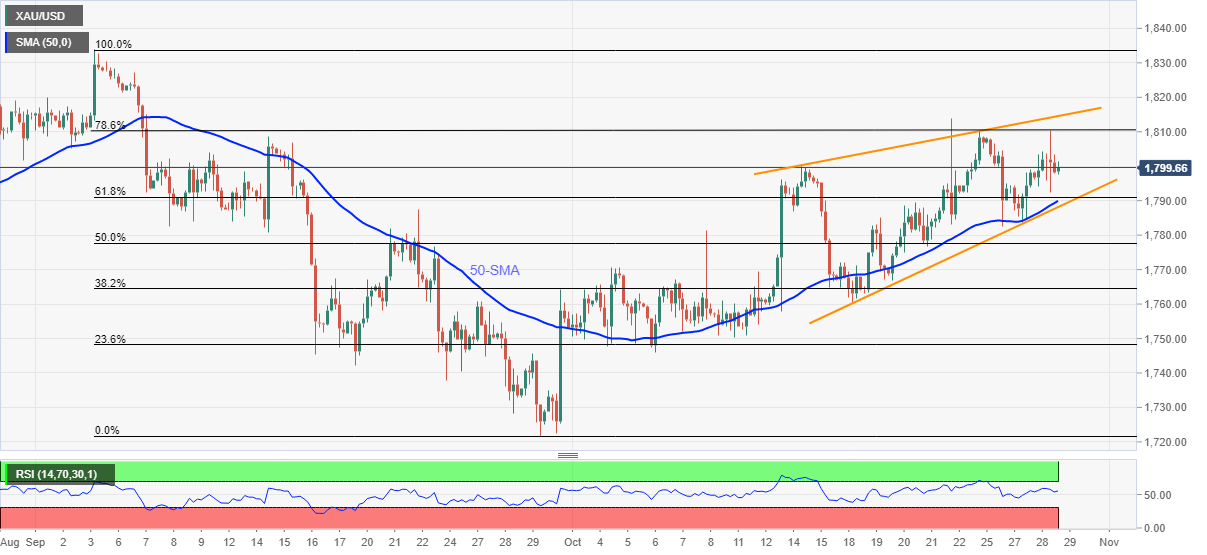
Trend: Further upside expected
-
01:59
AUD/NZD Price Analysis: Swings in between 21-day and 50-day SMA confluence
- AUD/NZD extends previous session’s declines on Friday.
- The cross-currency pair faces a resistance barrier near 1.0500.
- MACD holds above the midline with neutral stance
AUD/NZD edges lower on the last trading day of the week in the Asian trading session. The cross-currency pair stayed in a narrow trade band amid upbeat Australian Retail Sales data. At the time of writing, AUD/NZD is trading at 1.0472, down 0.04% for the day.
AUD/NZD daily chart
-637710657362709784.png)
On the daily chart, the AUD/NZD cross-currency pair has been under selling pressure after testing high at 1.0615 on October 12. The downside in the pair took a breather near the 50-day Simple Moving Average (SMA) at 1.0421. AUD/NZD spots a short term trading range of 1.0428 and 1.0490 around 21-day and 50-day SMAs confluence.
A successful daily close above the 21-day SMA at 1.0494 would mean the 1.0525 horizontal resistance level for the spot.
The Moving Average Convergence (MACD) trades above the midline. Any uptick in the MACD suggests the possibility of the 1.0575 horizontal resistance zone, followed by the high of October 13 at 1.0615.
.
Alternatively, if the price moves lower, it would first retest Wednesday’s low of 1.0445. Next, a daily close below the 50-day SMA could bring the 1.0400 horizontal support zone and one-month low of 1.0375 (September 28) back into picture.AUD/NZD additional levels
-
01:49
AUD/USD holds near 0.7530 support despite strong Australia Retail Sales
- AUD/USD stays on the back foot, consolidating weekly gains even after strong data release.
- Australia Retail Sales jumped 1.3% in September, PPI grew 1.1% in Q3.
- Sour sentiment exerts additional downside pressure, absence of US stimulus can be linked to the mood.
- US Core PCE Price Index data will be the key to watch for fresh impulse.
AUD/USD struggles to justify the strong Aussie Retail Sales, as well as mixed PPI data, taking rounds to 0.7530 support, down 0.15% intraday during early Friday. The reason could be the market’s risk-off mood and a lack of major data/events elsewhere.
Australia Retail Sales not only snapped a three-month downtrend but rose past +0.2% forecast to +1.3%, versus -1.7% prior, during September. Additionally, the Producer Price Index (PPI) data for the third quarter (Q3) also jumps above +0.3% market consensus and +0.7% prior readings to +1.1%. Further, the YoY figures rose to 2.9% versus 3.2% expected and 2.2% previous readouts.
Before the Aussie data releases, the downbeat mood in the market weighed on the AUD/USD prices due to its risk barometer status. The sour sentiment could take clues from an absence of a deal on US President Joe Biden’s $1.75 trillion stimulus package. Recently, US House Speaker Nancy Pelosi conveyed her optimism towards the passage of both infrastructure and social spending, climate bills during the phone call to postpone the vote on the infrastructure bill.
To portray the mood, S&P 500 Futures print mild losses while the US 10-year Treasury yields struggle for clear direction around 1.568%.
Given the lack of major data/events and sluggish sentiment ahead of the Federal Reserve’s (Fed) preferred inflation gauge, the AUD/USD prices may remain lackluster until getting any strong risk catalysts, which is less likely. Though, increased hopes of the RBA rate hike keep the pair buyers hopeful.
Read: RBA will wait until the Q2 2023 before raising interest rates – Reuters poll
Market forecasts suggest that the Core Personal Consumption Expenditures (PCE) – Price Index for September is likely to ease to 0.2% from 0.3% prior on the MoM basis. The same should add to hopes of a bit slower dial-back of easy money by the Fed, which in turn may extend the latest US dollar weakness and help AUD/USD bulls.
Read: Personal Consumption Expenditure Price Index September Preview: Transitory inflation becomes permanent
Technical analysis
AUD/USD bulls need to conquer the 200-DMA level surrounding 0.7560 to reject odds of dropping back below the monthly support line, around 0.7530 by the press time. That being said, bullish MACD and firmer RSI line, not overbought, favors the pair buyers.
-
01:45
Australia Producer Price Index (YoY) below expectations (3.2%) in 3Q: Actual (2.9%)
-
01:40
Australia: Retail Sales, M/M, September 1.3%
-
01:40
Australia: Private Sector Credit, y/y, September 5.3%
-
01:33
Australia Private Sector Credit (YoY) increased to 5.3% in September from previous 4.7%
-
01:33
Aussie Retail Sales shamsed estimates but AUD steady
AUSTRALIA SEPT RETAIL SALES +1.3 PCT M/M S/ADJ (REUTERS POLL +0.2 PCT).
More to come...
-
01:32
Australia Private Sector Credit (MoM) in line with forecasts (0.6%) in September
-
01:31
Australia Producer Price Index (YoY) below forecasts (3.2%) in 3Q: Actual (0.6%)
-
01:31
Australia: Private Sector Credit, m/m, September 0.6% (forecast 0.6%)
-
01:30
Australia Retail Sales s.a. (MoM) registered at 1.3% above expectations (0.2%) in September
-
01:30
Australia Producer Price Index (YoY) registered at 2.9%, below expectations (3.2%) in 3Q
-
01:30
Australia Producer Price Index (QoQ) came in at 1.1%, above expectations (0.3%) in 3Q
-
01:30
Australia: Producer price index, y/y, Quarter III 2.9%
-
01:30
Australia: Producer price index, q / q, Quarter III 1.1%
-
01:30
Schedule for today, Friday, October 29, 2021
Time Country Event Period Previous value Forecast 00:30 (GMT) Australia Producer price index, y/y Quarter III 2.2% 00:30 (GMT) Australia Private Sector Credit, m/m September 0.6% 0.6% 00:30 (GMT) Australia Producer price index, q / q Quarter III 0.7% 00:30 (GMT) Australia Private Sector Credit, y/y September 4.7% 00:30 (GMT) Australia Retail Sales, M/M September -1.7% 05:00 (GMT) Japan Housing Starts, y/y September 7.5% 7.5% 05:00 (GMT) Japan Construction Orders, y/y September -2.0% 05:00 (GMT) Japan Consumer Confidence October 37.8 05:30 (GMT) France Consumer spending September 1% 0.3% 05:30 (GMT) France GDP, q/q Quarter III 1.1% 2.1% 06:00 (GMT) United Kingdom Nationwide house price index, y/y October 10% 9.3% 06:00 (GMT) United Kingdom Nationwide house price index October 0.1% 0.4% 06:45 (GMT) France CPI, y/y October 2.2% 2.5% 06:45 (GMT) France CPI, m/m October -0.2% 0.3% 07:00 (GMT) Switzerland KOF Leading Indicator October 110.6 108.2 08:00 (GMT) Germany GDP (YoY) Quarter III 9.4% 2.5% 08:00 (GMT) Germany GDP (QoQ) Quarter III 1.6% 2.2% 08:30 (GMT) United Kingdom Net Lending to Individuals, bln September 5.6 08:30 (GMT) United Kingdom Consumer credit, mln September 0.4 0.45 08:30 (GMT) United Kingdom Mortgage Approvals September 74.5 70.95 09:00 (GMT) Eurozone Harmonized CPI October 0.5% 09:00 (GMT) Eurozone Harmonized CPI ex EFAT, Y/Y October 1.9% 1.9% 09:00 (GMT) Eurozone Harmonized CPI, Y/Y October 3.4% 3.7% 09:00 (GMT) Eurozone GDP (YoY) Quarter III 14.3% 3.5% 09:00 (GMT) Eurozone GDP (QoQ) Quarter III 2.2% 2% 09:30 (GMT) United Kingdom Net Lending to Individuals, bln September 5.6 09:30 (GMT) United Kingdom Consumer credit, mln September 0.4 09:30 (GMT) United Kingdom Mortgage Approvals September 74.5 12:30 (GMT) Canada Industrial Product Price Index, m/m September -0.3% 12:30 (GMT) Canada Industrial Product Price Index, y/y September 14.7% 12:30 (GMT) U.S. Personal spending September 0.8% 0.5% 12:30 (GMT) U.S. Employment Cost Index Quarter III 0.7% 0.9% 12:30 (GMT) Canada GDP (m/m) August -0.1% 0.7% 12:30 (GMT) U.S. PCE price index ex food, energy, m/m September 0.3% 0.2% 12:30 (GMT) U.S. PCE price index ex food, energy, Y/Y September 3.6% 3.7% 12:30 (GMT) U.S. Personal Income, m/m September 0.2% -0.2% 13:45 (GMT) U.S. Chicago Purchasing Managers' Index October 64.7 63.5 14:00 (GMT) U.S. Reuters/Michigan Consumer Sentiment Index October 72.8 71.4 17:00 (GMT) U.S. Baker Hughes Oil Rig Count October 443 -
01:21
AUD/JPY consolidates above 85.50 ahead of Aussie Retail Sales
- AUD/JPY surrenders early gains in the initial Asian trading hours.
- Australia Q3 PPI, Retail Sales, hawkish RBA governs aussie movement.
- The Japanese yen makes a recovery despite a dovish BOJ, mixed data.
AUD/JPY edges lower on Friday in the early Asian session. The pair continued to move in between 0.8550 and 0.8570 for the two sessions. As of writing, the AUD/JPY pair is trading at 85.55, down 0.11% for the day.
Investors remained concerned about the global growth prospects on dismal economic data amidst central banks verdicts. The Japanese yen managed to attract buying interest on its safe haven appeal despite Bank of Japan’s (BOJ) dovish tone. In addition to that, the comments from BOJ Governor Haruhiko Kuroda on the depreciation of the yen did not deter the gains in the currency.
The Unemployment Rate in Japan came at 2.8% in September, unchanged from the previous two months and in accordance with market consensus. The Industrial Production dropped 5.4% in September much below the market expectations of 3.2%.
It is worth noting that S&P 500 Futures are trading at 4,575.35, down 0.27% for the day.
The riskier asset hurted amid reduced risk appetite, which weighs on the prospects of the aussie. As per the latest Reuters poll, 21 out of 24 economists expected a rate hike to 0.25% in Q2 2023, earlier than the RBA’s 2024 expectations. This, in turn uplifts the sentiment around the Australian dollar.
As for now, traders are bracing up for the Australian Retail Sales data to take fresh trading impetus.
AUD/JPY additional levels
-
01:19
Time running out for solution in Brexit trade talks
The Independent has reported that the two sides remain far apart and time is running out to bridge the gap.The article explained that the ''UK and EU negotiators have met in Brussels over the past week to try and resolve major differences that have erupted over trade rules for Northern Ireland The talks move to London on Tuesday, and Britain says, substantial gaps on the fundamental issues remain.''
The article went on to say that ''the EU accuses Britain of trying to renegotiate a legally binding agreement that it signed less than a year ago; some officials say it shows the U.K. government can't be trusted.''
However, it was also explained that the bloc has, however, agreed to make changes to the deal, offering to reduce checks on food, plants and animals entering Northern Ireland by as much as 80% and to cut paperwork for transport companies in half.
Sterling investors will be pleased to know that Britain has welcomed those proposals, however, there remains the critical element left to be negotiated. The UK also is demanding that the EU's top court be stripped of its role resolving any disputes over the agreement and replaced with independent arbitration — an idea the bloc flatly rejects, as the article explained.
Trade war, a risk for GBP
The article reported that the ''chief negotiators Maros Sefcovic of the EU and David Frost for Britain are due to meet in London at the end of next week to assess the talks' progress. Britain on Saturday repeated a threat to trigger an emergency break clause that lets either side suspend the agreement in extreme circumstances if there is no breakthrough soon. That would bring legal action from the EU, and potentially economic sanctions that could spiral into a trade war.''
It has been regarded as more of a risk to the pound than the euro, although both sides stand to lose a great deal in such a scenario. ''Concerns about the UK’s growth outlook were highlighted last week by the IMF, which warned that the Covid crisis risks bringing more longer-lasting damage to the UK economy than any other country in the G7,'' analysts at Rabobank highlighted.
''Any such battle is likely to hurt the economy of the U.K. more than the much bigger EU,'' The Independent's article stated also.
''Irish Foreign Minister Simon Coveney also warned that talks couldn't go on forever, and urged Britain on Friday to respond to the EU's willingness to compromise.''
"I think the EU has shown a real appetite for compromise, and they have consciously avoided creating tension," he said. "I can't say the same in terms of the British government's approach."I don't think it will be the case forever, that the EU will be in compromise and solutions mode."
Market implications
While this is room to play out prior to traders reacting to sentiment, the markets are more aligned to what is happening between the central banks.
The Bank of England could proceed with an interest rate hike at the upcoming meetings or hold fire, given concerns around economic growth. However, the markets are pricing a chunky 34 cumulative bps in rate hikes rise from the BoE by year-end.
-
01:17
RBA will wait until the Q2 2023 before raising interest rates – Reuters poll
Economists in the October 25-28 Reuters poll predicted that the Reserve Bank of Australia (RBA) would raise its key interest rate to 0.25% in the second quarter (Q2) of 2023.
The poll also cited those respondents as, “who only a few weeks ago expected no increase across their forecast horizon.”
Key findings
Almost a fifth of economists surveyed have already brought forward their forecasts for a rate hike to the fourth quarter of next year.
The latest findings are an abrupt change from a poll conducted only a few weeks ago, when over half of economists predicted rates would stay on hold until at least 2024.
Indeed, 21 of 24 economists said the risk for the timing of the RBA's first move up was that it would come earlier than they expect, largely triggered by stronger wage growth and persistently high inflation.
However, not all economists were convinced the RBA would change its long-held view any time soon.
Wage growth must reach over 3% for the RBA to be convinced the rise in underlying inflation is lasting and interest rates can be raised.
With wages growing just 1.7% in the year to June, the forward guidance may remain centered on 2024, a few economists said.
Read: AUD/USD consolidates gains above 0.7500 ahead of Aussie Retail Sales
-
01:15
Currencies. Daily history for Thursday, October 28, 2021
Pare Closed Change, % AUDUSD 0.75413 0.33 EURJPY 132.642 0.47 EURUSD 1.16802 0.68 GBPJPY 156.614 0.16 GBPUSD 1.37917 0.39 NZDUSD 0.71977 0.45 USDCAD 1.23417 -0.14 USDCHF 0.91152 -0.54 USDJPY 113.549 -0.22 -
01:09
GBP/JPY Price Analysis: Picks up bids towards 157.00 inside bullish flag
- GBP/JPY extends recent gains to refresh intraday high.
- Firmer Momentum line favor upside moves, confirmation of bullish chart pattern becomes necessary.
- 50-SMA guards immediate upside ahead of flag’s resistance line.
- Sellers have a bumpy road until breaking 200-SMA.
GBP/JPY rises for the second consecutive day, refreshing intraday high to 156.76, up 0.12% on a day, during Friday’s Asian session.
In doing so, the quote takes the bids inside a bullish flag formation amid a firmer Momentum line.
Even so, the 50-SMA level surrounding the 157.00 threshold challenges the quote’s immediate upside ahead of the flag’s resistance line, close to 157.55 by the press time.
It’s worth noting that sustained trading beyond 157.55 will theoretically trigger the rally targeting May 2016 peak near 164.00. During the rise, the recent high near 158.20 and the 160.00 round figure may challenge GBP/JPY bulls.
On the contrary, 100-SMA restricts the quote’s immediate pullback moves, if any, around 155.70, a break of which will direct GBP/JPY prices towards testing the stated flag’s support line near 155.50.
In a case where the cross-currency pair drops below 155.50, the bullish chart pattern gets rejected, which in turn will drag the sellers towards October 12 low near 153.70. However, the 200-SMA level of 153.27 can question any further downside.
GBP/JPY: Four-hour chart
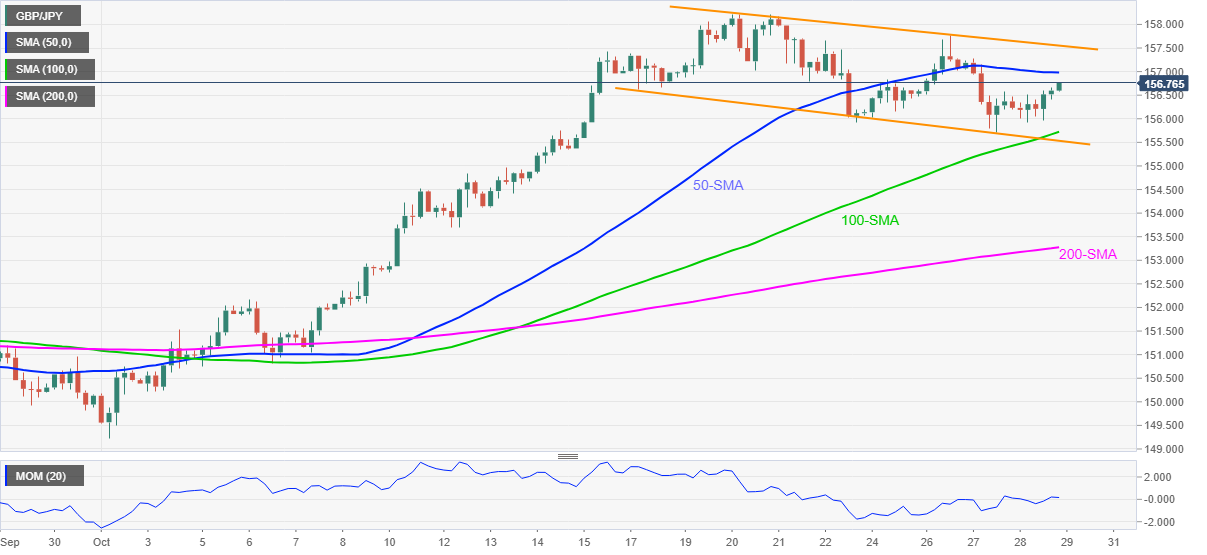
Trend: Further upside expected
-
00:54
Congress will soon pass both infrastructure and social spending, climate bills
US House Speaker Pelosi says that the House will postpone the vote on the infrastructure bill, adding, however, that most democratic members of the House who do not support a vote on infrastructure on Thursday have expressed support for the bill.
She explained that the White House says it is confident Congress will soon pass both infrastructure and social spending, climate bills.
She said:
As you know by now, the House will postpone the vote on the BIF. The good news is that most Members who were not prepared for a yes vote today have expressed their commitment to support the BIF. I thank the overwhelming number of House Dems who support both the BIF and the Build Back Better Act. It is both heartening and impressive to observe the strength of Members’ engagement in the discussion.
-
00:52
Japan: Industrial Production (YoY), September -2.3%
-
00:52
Japan Industrial Production (YoY) came in at -2.3% below forecasts (6.7%) in September
-