Notícias do Mercado
-
23:55
US President Biden signs $1.66 trillion FY 2023 government funding bill
Reuters came out with the news suggesting more US spending and additional help to Ukraine in the fiscal year (FY) 2023 during early Friday in Asia-Pacific, late Thursday in the West.
The news quotes the White House Statement as saying, “President Joe Biden on Thursday signed a $1.66 trillion bill funding the U.S. government for the fiscal year 2023.” Reuters also stated that the bill was passed by Congress in the last week and was recently signed by Biden while he is on vacation to the Caribbean island of St. Croix.
Key quotes
The legislation includes record military funding, emergency aid to Ukraine, more aid for students with disabilities, additional funding to protect workers' rights and more job-training resources, as well as more affordable housing for families, veterans and those fleeing domestic violence.
The 4,000-plus page bill passed the Senate on a bipartisan vote of 68-29, with the support of 18 of the 50 Senate Republicans. It passed the House of Representatives on a largely party-line vote of 225-201.
Market implications
The news fails to gain any major response and should favor the US Dollar, considering the higher spending and more geopolitical fears the bill is likely to produce.
Also read: US Dollar Index Price Analysis: DXY bears are well-set to revisit monthly low
-
23:48
US Dollar Index Price Analysis: DXY bears are well-set to revisit monthly low
- US Dollar Index pares the biggest daily loss in over a week.
- Clear downside break of a two-week-old ascending support, sustained trading below 200-HMA favor sellers.
- RSI conditions suggest limited downside, highlighting the monthly bottom as strong support.
- Multiple hurdles stand tall to challenge recovery moves.
US Dollar Index (DXY) picks up bids to pare the recent losses around 104.00 as traders prepare for the last daily show of 2022.
That said, the greenback’s gauge versus the six major currencies dropped the most in nearly 10 days the previous day after it broke a two-week-old ascending trend line.
However, the RSI (14) triggered the following corrective bounce which currently jostles with the support-turned-resistance line.
Even if the quote manages to cross the immediate hurdle surrounding 104.00, the 200-HMA resistance near 104.20 could probe the DXY bulls.
It should be observed that multiple levels around 104.60 and the 105.00 round figure might challenge the US Dollar Index upside before directing it to the monthly peak of 106.00.
Alternatively, pullback moves may aim for the latest trough surrounding 103.77 if the buyers fail to cross the previous support line.
Though, the RSI (14) may again play its role in activating the DXY rebound n case the quote fails to recover from 103.77 and poke the monthly low near 103.45.
If at all the US Dollar Index remains bearish past 103.45, the 103.00 round figure and early June’s high near 102.70 could gain the DXY seller’s attention.
US Dollar Index: Hourly chart
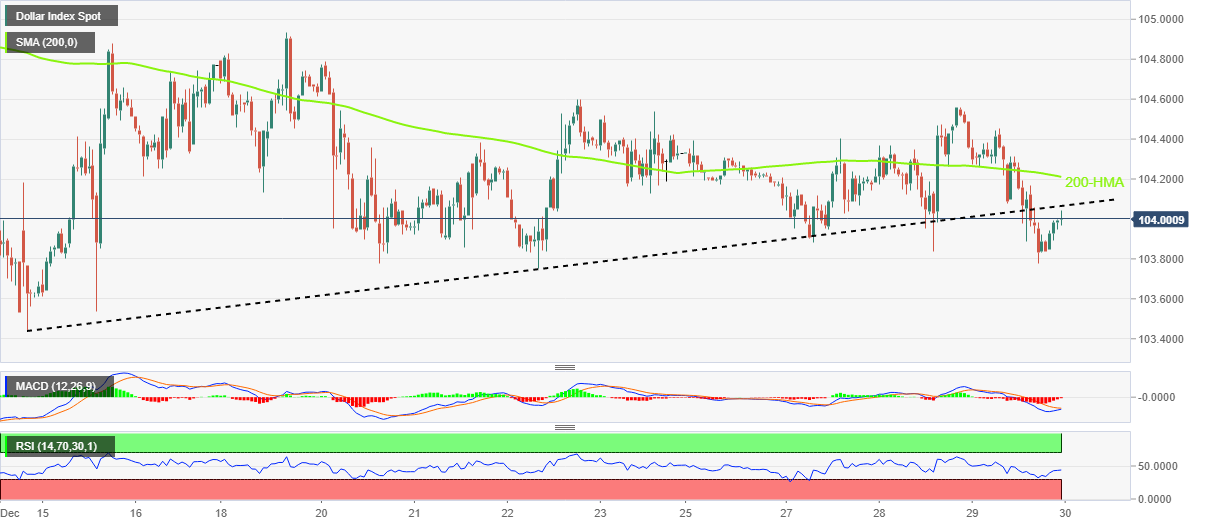
Trend: Limited downside expected
-
23:42
WTI extends recovery to near $79.00 despite an increment in US official oil stock data
- Oil price has scaled to near $79.00 as Goldman Sachs sees a potential recovery in China’s demand.
- An addition in oil inventory data against the consensus of a drawdown failed to impact the oil recovery.
- China’s Covid situation may find its peak sooner and will regain track of progress ahead.
West Texas Intermediate (WTI), futures on NYMEX, have extended its revival move above the crucial resistance of $78.50 in the early Tokyo session. The oil price sensed buying interest around $77.00 as supply worries due to a ban on oil sales from Russia to G7 countries and the European Union joined expectations of a recovery in demand projections in China due to reopening measures.
Oil supply is expected to remain a major concern as Russia is not intended to provide fossil fuels at reduced prices than prevailing in the market. No doubt, western countries are actively looking for alternatives to Russia to address their oil demand but their sheer dependence on Russian oil will keep them in short-term pain.
Meanwhile, the sheer pace of reopening measures in Beijing by the Chinese administration has created short-term havoc due to a solid spike in the number of infections, however, Covid-19 may find its peak and the economy will regain track of progress ahead.
A note from economists at Goldman Sachs dictated that "For oil prices, we remain constructive on oil prices in the near term given the potential for improving China demand, and lower supply growth from US shale due to discipline/tight service markets, and OPEC+ quota reduction,"
On Thursday, the oil price recovery after a temporary pain from an increment in oil inventories was reported by the United States Energy Information Administration (EIA) for the week ending December 23. The official US agency showed an addition in oil stockpiles by 0.718 million barrels while the street was expecting a drawdown of 1.52 million barrels.
-
23:30
USD/CHF seesaws around nine-month low as US Dollar bears pause amid sluggish markets
- USD/CHF refreshed multi-day low the previous day amid broad-based US Dollar declines.
- Firmer sentiment, downbeat Treasury bond yields weighed on the greenback.
- Swiss KOF Leading Indicator, US Michigan PMI eyed for fresh impulse.
USD/CHF licks its wounds near 0.9235 after declining to fresh lows since March. That said, the quote’s previous weakness could be linked to the US Dollar weakness, which in turn tracked downbeat US Treasury bond yields. However, the lack of major data/events and the year-end holiday mood seem to restrict the pair’s immediate moves.
On Thursday, US Dollar Index (DXY) refreshed its weekly low to near 103.78 while justifying the first negative daily closing of the US 10-year Treasury yields in the last five days. In doing so, the benchmark bond coupon reversed from a six-week high marked on Wednesday. The downbeat US bond yields also allowed the Wall Street benchmarks to remain positive and exert more downside pressure on the USD/CHF pair.
It’s worth noting that the mixed US data and concerns surrounding China, as well as Ukraine, seemed to have favored the Swiss Franc (CHF) pair’s latest weakness.
US Initial Jobless Claims rose 225K versus 216K prior for the week ended on December 24 while the Continuing Jobless Claims increased by 1.71M from 1.669M previous readout during the week ended on December 16. However, the 4-week moving average for the same dropped to 221K versus the revised down previous readings of 221.25K.
On the other hand, around seven major nations, including the US and the UK have recently announced Covid test requirements for Chinese travelers as the virus cases swirl in the dragon nation but Beijing reverses the “Zero-Covid” policy. Further, China’s Center for Disease Control and Prevention (CDC) top epidemiologist Wu Zunyou warned that Covid is seen spreading throughout the holiday season. Alternatively, Italy’s rejection of fears of any new Covid variant, after finding 50% of flight passengers being infected by the virus, seemed to have helped the markets in ignoring the fears of the virus. On the same line could be the headlines suggesting China’s discovery of a Covid antiviral pill and hopes of the CDC board to overcome the COVID-19 fears by citing the peak of virus spread in Beijing, Tianjin and Chengdu.
It should be observed that an absence of heavy losses to lives and infrastructures during Thursday’s heavy missile fire on Kyiv and Kharkiv by Moscow joined the global back-up to Ukraine in suggesting a sooner end to the thorny issue.
Moving on, a virtual meeting between China President Xi Jinping and Russian counterpart Vladimir Putin could entertain traders. Additionally, important will be the Swiss KOF Leading Indicator for December, expected 86.9 versus 89.5, as well as the US Chicago Purchasing Managers’ Index for the said month which is likely to improve to 41.2 from 37.2 prior.
Technical analysis
Although the USD/CHF bulls are far from the table unless crossing the 21-DMA hurdle surrounding 0.9320, March 2022 low near 0.9195 could restrict the short-term downside of the Swiss Franc (CHF) pair.
-
23:07
NZD/JPY Price Analysis: Downward pressured as a bearish harami emerged, at around 85.00
- The confluence of the 20 and 100-day EMAs, around 85.00, capped the NZD/JPY rally.
- A bearish harami candle chart pattern in the NZD/JPY daily chart could exacerbate a fall toward 82.50.
- NZD/JPY: To face solid support around the 200-day EMA, which, once it gives way, further downside is expected.
The NZD/JPY continued its downtrend after plummeting more than 300 pips following the Bank of Japan (BoJ) adjustment of its Yield Curve Control (YCC) on the 10-year JGB to 0.50%, which bolstered appetite for the Japanese Yen (JPY) to the detriment of most G8 currencies. At the time of writing, the NZD/JPY is trading at 84.34, slightly above the December 29 daily low of 84.20.
NZD/JPY Price Analysis: Technical outlook
After hitting a weekly high of 84.98, the NZD/JPY formed a bearish harami candle chart pattern, which usually has a downward bias. Nevertheless, it should be said that the 200-day Exponential Moving Average (EMA) lies close to current exchange rates and could be a difficult hurdle to surpass at 84.04, which, once cleared, will exert downward pressure on the NZD/JPY. Oscillators like the Relative Strength Index (RSI) and the Rate of Change (RoC) suggest sellers are in charge, though the RSI is almost flat, and the RoC continues to approach its neutral level.
If the NZD/JPY clears the 200-day EMA, that could open the door for further losses. Hence, the NZD/JPY first support would be the December 28 low of 83.66. Once cleared, the NZD/JPY might fall toward the 83.00 figure, closely followed by the December 23 daily low at 82.52.
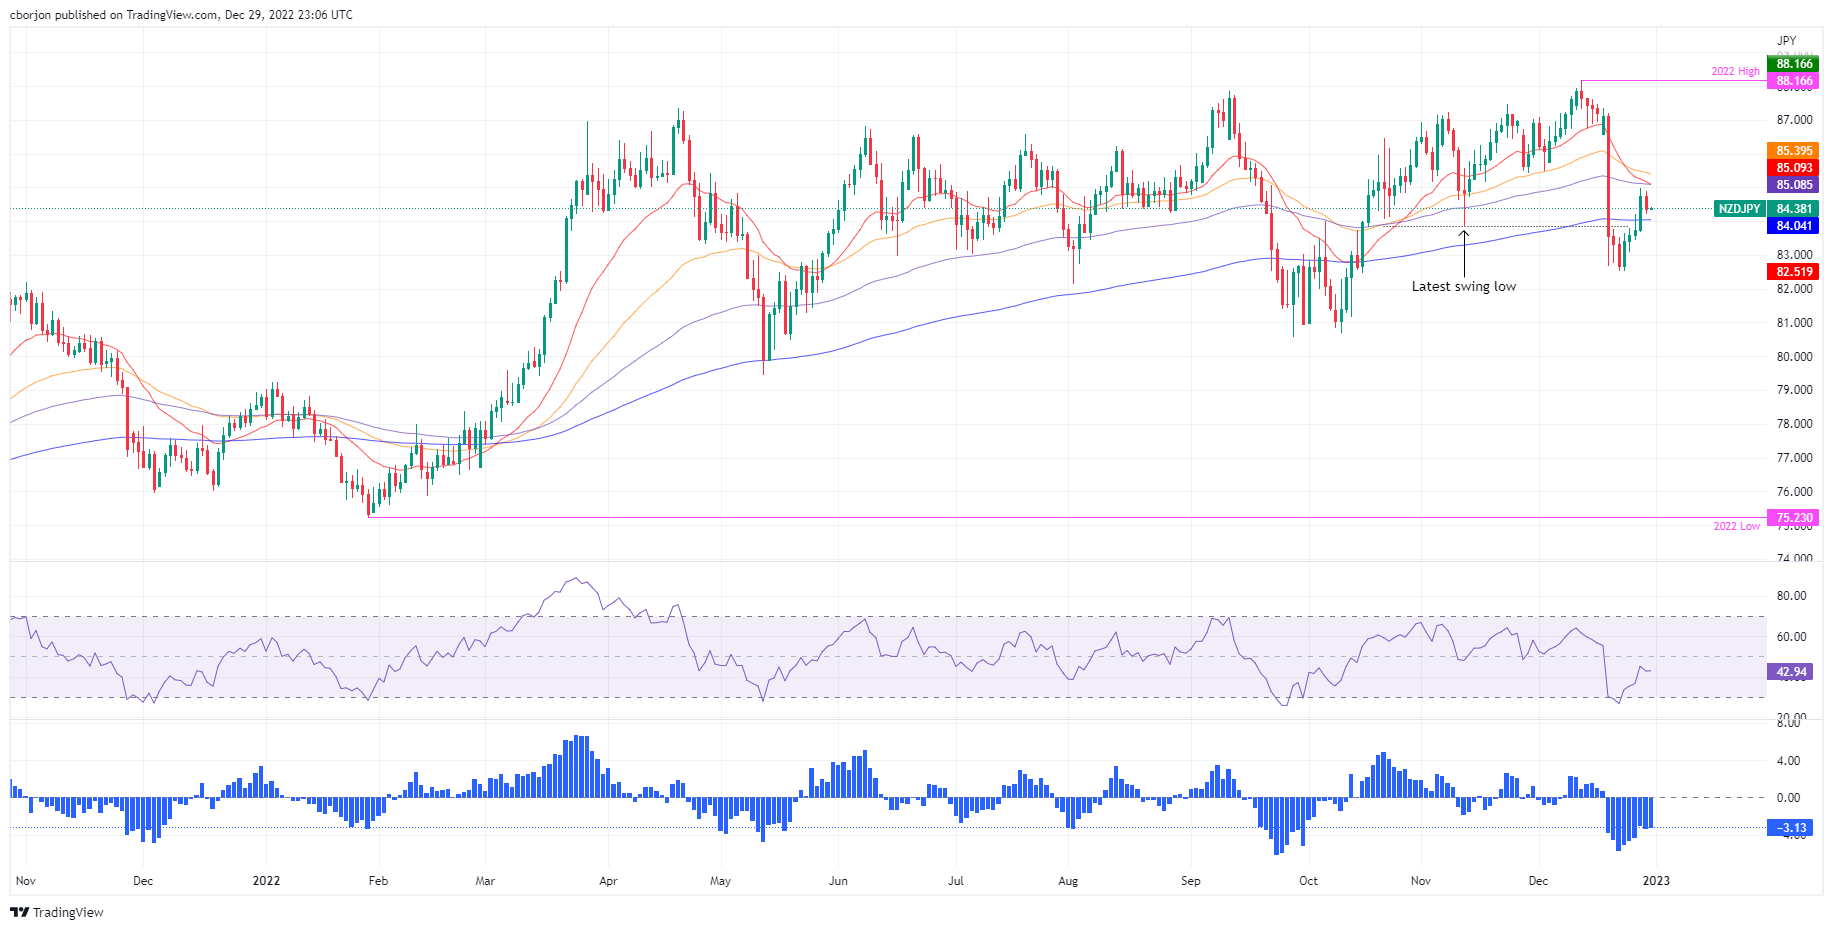
NZD/JPY Key Technical Levels
-
23:06
Silver Price Analysis: XAG/USD fades upside momentum below $24.00
- Silver price eases after positing the biggest daily gains in over a week.
- Impending bear cross on MACD, RSI retreat add strength to the fears of a pullback.
- 200-HMA, weekly support line to restrict short-term downside.
- Double tops around $24.30 appears the key hurdle towards the north.
Silver price (XAG/USD) slides to $23.90 as it consolidates the biggest daily jump in 10 days during early Friday.
The metal’s pullback takes clues from the looming bear cross on the MACD indicator, as well as the RSI (14) retreat.
As a result, the bullion sellers could well target the 200-HMA retest, around $23.70 by the press time.
However, an upward-sloping support line from December 22, close to $23.50 at the latest, will challenge the XAG/USD bears afterward.
It’s worth noting that the December 22 low near $23.40 is also an important support to watch for Silver traders as a break of which will confirm the “double top” bearish formation and theoretically suggest a slump towards $22.50.
Alternatively, a convergence of the previous support line from December 16 and the double tops appears the tough nut to crack for Silver buyers, around $24.30.
Should the silver buyers portray a successful run-up beyond the $24.30 hurdle, a gradual run-up toward April’s peak surrounding $26.22 can’t be ruled out. That said, the $25.00 and $26.00 round figure may act as intermediate halts during the anticipated run-up.
Silver price: Hourly chart
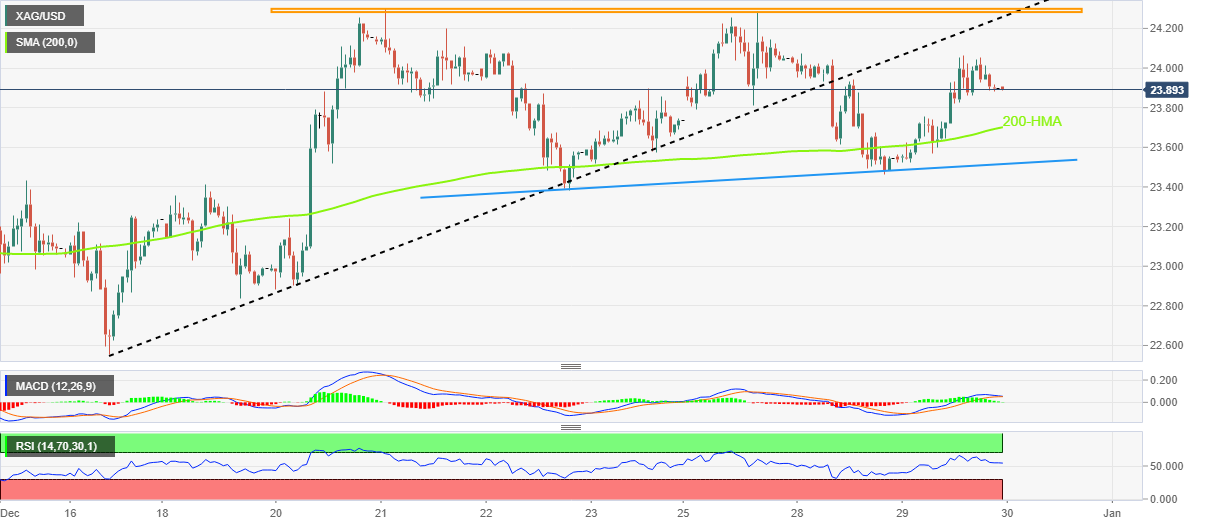
Trend: Pullback expected
-
23:02
USD/CAD Price Analysis: Shift of auction below 200-EMA signals more downside
- A recovery in the oil price and risk appetite theme have impacted the Lonnie asset.
- USD/CAD is auctioning below the 200-EMA which indicates weakness ahead.
- A slippage into the 20.00-40.00 range by the RSI (14) will trigger a bearish momentum.
The USD/CAD pair has turned sideways after a sheer drop from the round-level resistance of 1.3600. The Loonie asset is hovering around 1.3540 and is likely to remain highly volatile amid a recovery in the risk appetite theme and oil prices.
The US Dollar Index (DXY) witnessed a sell-off on Thursday after a rebound in the risk-perceived assets and an escalation in the number of weekly Initial Jobless Claims. Also, a recovery in oil price from $76.75 supported the Canadian Dollar.
On a two-hour scale, the Loonie asset has sensed selling pressure around 1.3600 after failing to regain auction above the upward-sloping trendline plotted from November 16 low at 1.3228. A sell-off in the United States Dollar has pushed the Lonnie asset below the 20-period Exponential Moving Average (EMA) at 1.3565. The major has also shifted its auction profile below the 200-EMA at 1.3579, which indicates that the long-term trend has turned bearish now.
Meanwhile, the Relative Strength Index (RSI) (14) is oscillating in a 40.00-60.00 range. A breakdown of the momentum oscillator inside the bearish range of 20.00-40.00, will trigger a downside momentum.
Going forward, a downside break below Tuesday’s low around 1.3484 will drag the asset toward November 22 high at 1.3444. A slippage below the latter will expose the major for more downside towards December 5 low at 1.3385.
Alternatively, a break above Wednesday’s high at 1.3612 will drive the Lonnie asset toward December 23 high around 1.3650 followed by the previous week's high around 1.3704.
USD/CAD two-hour chart
-638079517065099442.png)
-
23:01
South Korea Consumer Price Index Growth (MoM) registered at 0.2%, below expectations (0.5%) in December
-
23:00
South Korea Consumer Price Index Growth (YoY) registered at 5%, below expectations (5.1%) in December
-
22:47
EUR/USD grinds higher towards 1.0700 as US Dollar traces softer Treasury bond yields
- EUR/USD seesaws around two-week high after rising the most since mid-December.
- Market sentiment improves amid mixed concerns, weighing on the US Dollar.
- US Treasury bond yields benefits from mixed data, hopes of overcoming virus woes, geopolitical fears.
- No major data/events to test buyers but lack of market activity could probe further upside.
EUR/USD treads water around 1.0660, after refreshing a two-week high, as bulls await more clues to end the year 2022 on a positive note.
The major currency pair rose the most in nearly three weeks the previous day amid broad US Dollar weakness, mainly due to the softer US Treasury bond yields and cautious optimism in the markets.
The sentiment could be linked to the mixed data and easing fears surrounding Covid and the Russia-Ukraine tension, despite recent jitters.
That said, the US 10-year Treasury bond yields marked the first daily loss in five while reversing from the six-week high, down 1.75% to 3.82% by the end of the day. It’s worth noting that Wall Street benchmarks closed with an overall positive performance by rising more than 1.30% each.
Talking about the data, US Initial Jobless Claims rose 225K versus 216K prior for the week ended on December 24 while the Continuing Jobless Claims increased by 1.71M from 1.669M previous readout during the week ended on December 16. However, the 4-week moving average for the same dropped to 221K versus the revised down previous readings of 221.25K.
Around seven major nations have recently announced Covid test requirements for Chinese travelers as the virus cases swirl in the dragon nation but Beijing reverses the “Zero-Covid” policy. Further, China’s Center for Disease Control and Prevention (CDC) top epidemiologist Wu Zunyou warned that Covid is seen spreading throughout the holiday season.
However, Italy’s rejection of fears of any new Covid variant, after finding 50% of flight passengers being infected by the virus, seemed to have helped the markets in ignoring the fears of the virus. On the same line could be the headlines suggesting China’s discovery of a Covid antiviral pill and hopes of the CDC board to overcome the COVID-19 fears by citing the peak of virus spread in Beijing, Tianjin and Chengdu.
Elsewhere, Moscow unveiled heavy missile fire on Kyiv and Kharkiv but a lack of major victory and Ukraine’s global support, not to forget an absence of heavy losses to lives and infrastructures, seemed to have favored the risk appetite.
Looking forward, a virtual meeting between China President Xi Jinping and Russian counterpart Vladimir Putin could entertain traders while the US Chicago Purchasing Managers’ Index for December, expected 41.2 versus 37.2 prior, will decorate the calendar. Following that, Saturday’s official readings of China Manufacturing and Non-Manufacturing PMIs for the current month will be important to watch for clear directions.
Technical analysis
Although the 21-DMA support of 1.0590 restricts short-term EUR/USD downside, the pair’s advances remain elusive unless crossing the monthly high surrounding 1.0735.
-
22:32
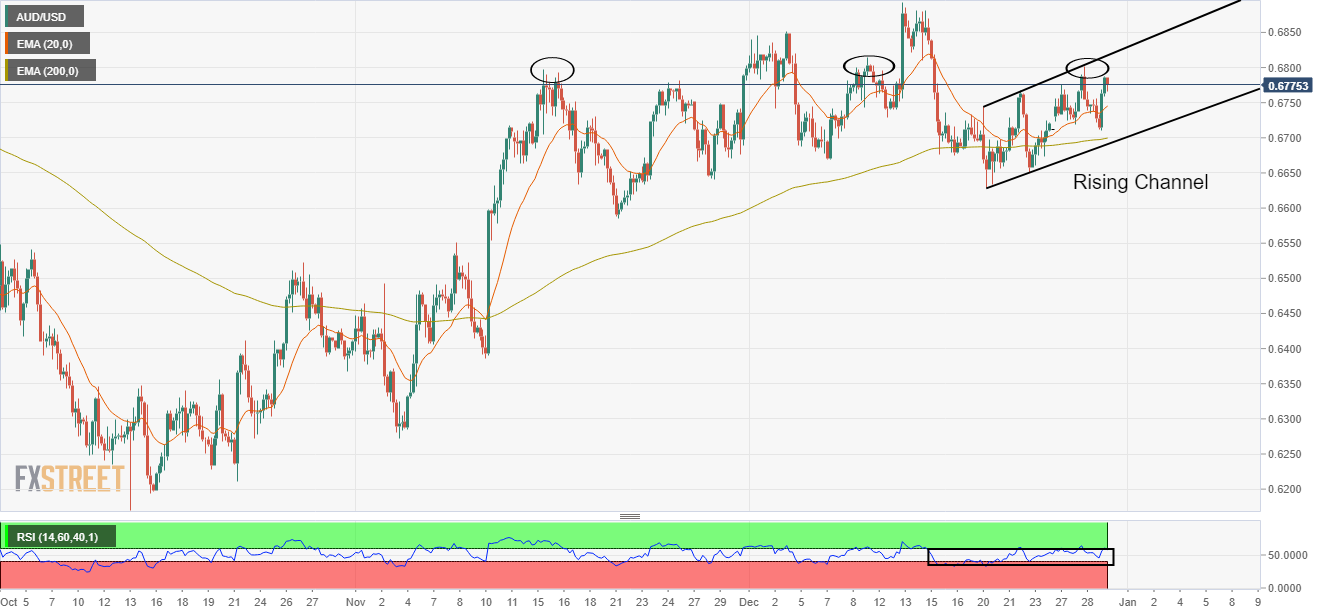
AUD/USD Price Analysis: 0.6800 remains critical for the Australian Dollar
- AUD/USD has sensed a minor correction after a perpendicular recovery from 0.6720.
- An improvement in investors’ risk appetite has underpinned the Australian Dollar.
- The Aussie asset needs to surpass 0.6800 for an upside move ahead.
The AUD/USD pair has sensed a minor correction in the early Tokyo session after a perpendicular recovery from 0.6720. The Aussie asset is likely to extend its recovery to near the round-level resistance of 0.6800 as the risk appetite of the market participants has improved dramatically.
A stellar recovery in the S&P500 on Thursday as investors rushed for dip buying after a two-day sell-off underpinned risk-off mood. The US Dollar Index (DXY) dropped to near the lower end of the weekly trading range around 103.60.
On a four-hour scale, the Aussie asset is auctioning in a Rising Channel chart pattern, which is highly neutral as it has formed after a sell-off move from December 13 high around 0.6900. The round-level resistance of 0.6800 has remained a critical barrier for the Australian Dollar for the past 15 trading sessions.
A recovery move in the Aussie asset has pushed it above the 20-period Exponential Moving Average (EMA) around 0.6747. Also, the 200-EMA at 0.6700 is still solid, which indicates that the long-term trend is still bullish.
The Relative Strength Index (RSI) (14) is struggling to shift into the bullish range of 60.00-80.00. An occurrence of the same will trigger bullish momentum.
For an upside move, the Australian Dollar needs to surpass Wednesday’s high around 0.6800, while will drive the Aussie asset towards December 13 high around 0.6880 followed by the psychological resistance at 0.7000.
On the contrary, a breakdown of December 27 low at 0.6719 will drag the major towards December 15 low around 0.6677. A slippage below the latter will expose the asset for more downside toward December 20 low at 0.6629.
AUD/USD four-hour chart
-
22:27
Gold Price Forecast: XAU/USD benefits from softer United States Treasury bond yields, Wall Street gains
- Gold price remains on course to second monthly gain amid market’s cautious optimism, pullback in United States Treasury bond yields.
- Mixed headlines China, softer US data weighed on US Dollar and allowed XAU/USD to remain firmer despite escalating Russia-Ukraine tussle.
- Gold traders remain little active amid year-end holiday mood, light calendar.
Gold price (XAU/USD) remains firmer around $1,815, even with less momentum strength, as traders brace for the final trading day of 2022 on early Friday.
The yellow metal cheered the latest pullback in the United States Treasury bond yields to post mild gains while paying little attention to the risk-negative headlines surrounding China’s Covid conditions and the geopolitical tension in Ukraine. The reason could be linked to Beijing’s reopening, softer US Dollar and upbeat performance of Wall Street.
Gold rises as United States Treasury bond yields ease
Given the negative correlation with the United States Treasury bond yields, Gold price benefited from a pullback in the key bond coupons from the multi-day high. That said, the US 10-year Treasury bond yields marked the first daily loss in five while reversing from the six-week high, down 1.75% to 3.82% by the end of the day. It’s worth noting that Wall Street benchmarks closed with overall positive performance by rising more than 1.30% each.
In doing so, the bond market cheered mixed US data and receding hopes of the global economic recession even as the fears of the COVID-19 and geopolitical tension between Ukraine and Russia continue.
US Initial Jobless Claims rose 225K versus 216K prior for the week ended on December 24 while the Continuing Jobless Claims increased by 1.71M from 1.669M previous readout during the week ended on December 16. However, the 4-week moving average for the same dropped to 221K versus the revised down previous readings of 221.25K.
It’s worth noting that earlier in the week San Francisco Fed came out with a research that ruled out recession for at least two quarters.
China Covid conditions flash mixed signals to markets but positive for Gold
Around seven major nations have recently announced Covid test requirements for Chinese travelers as the virus cases swirl in the dragon nation but Beijing reverses the “Zero-Covid” policy.
On Thursday, China’s Center for Disease Control and Prevention (CDC) top epidemiologist Wu Zunyou warned that Covid is seen spreading throughout the holiday season.
However, Italy’s rejection of fears of any new Covid variant, after finding 50% of flight passengers being infected from the virus, seemed to have helped the markets in ignoring the fears from the virus.
On the same line could be the headlines suggesting China’s discovery of a Covid antiviral pill and hopes of the CDC board to overcome the COVID-19 fears by citing peak of virus spread in Beijing, Tianjin and Chengdu.
Given China’s status as the key Gold user, the nation’s unlock and receding virus fears help the XAU/USD price.
Russia-Ukraine fears remain ineffective despite heavy explosions
Although Moscow unveiled heavy missile fires on Kyiv and Kharkiv, a virtual meeting between China President Xi Jinping and Russian counterpart Vladimir Putin keep traders hopeful of overcoming the geopolitical tussles.
No major catalysts to entertain Gold buyers
Given the light calendar and the year-end holiday season, the Gold traders are likely to keep favoring the upside momentum considering the latest market optimism. However, risk catalysts should be eyed for clear directions as China Covid woes join the Ukraine-Russia tension.
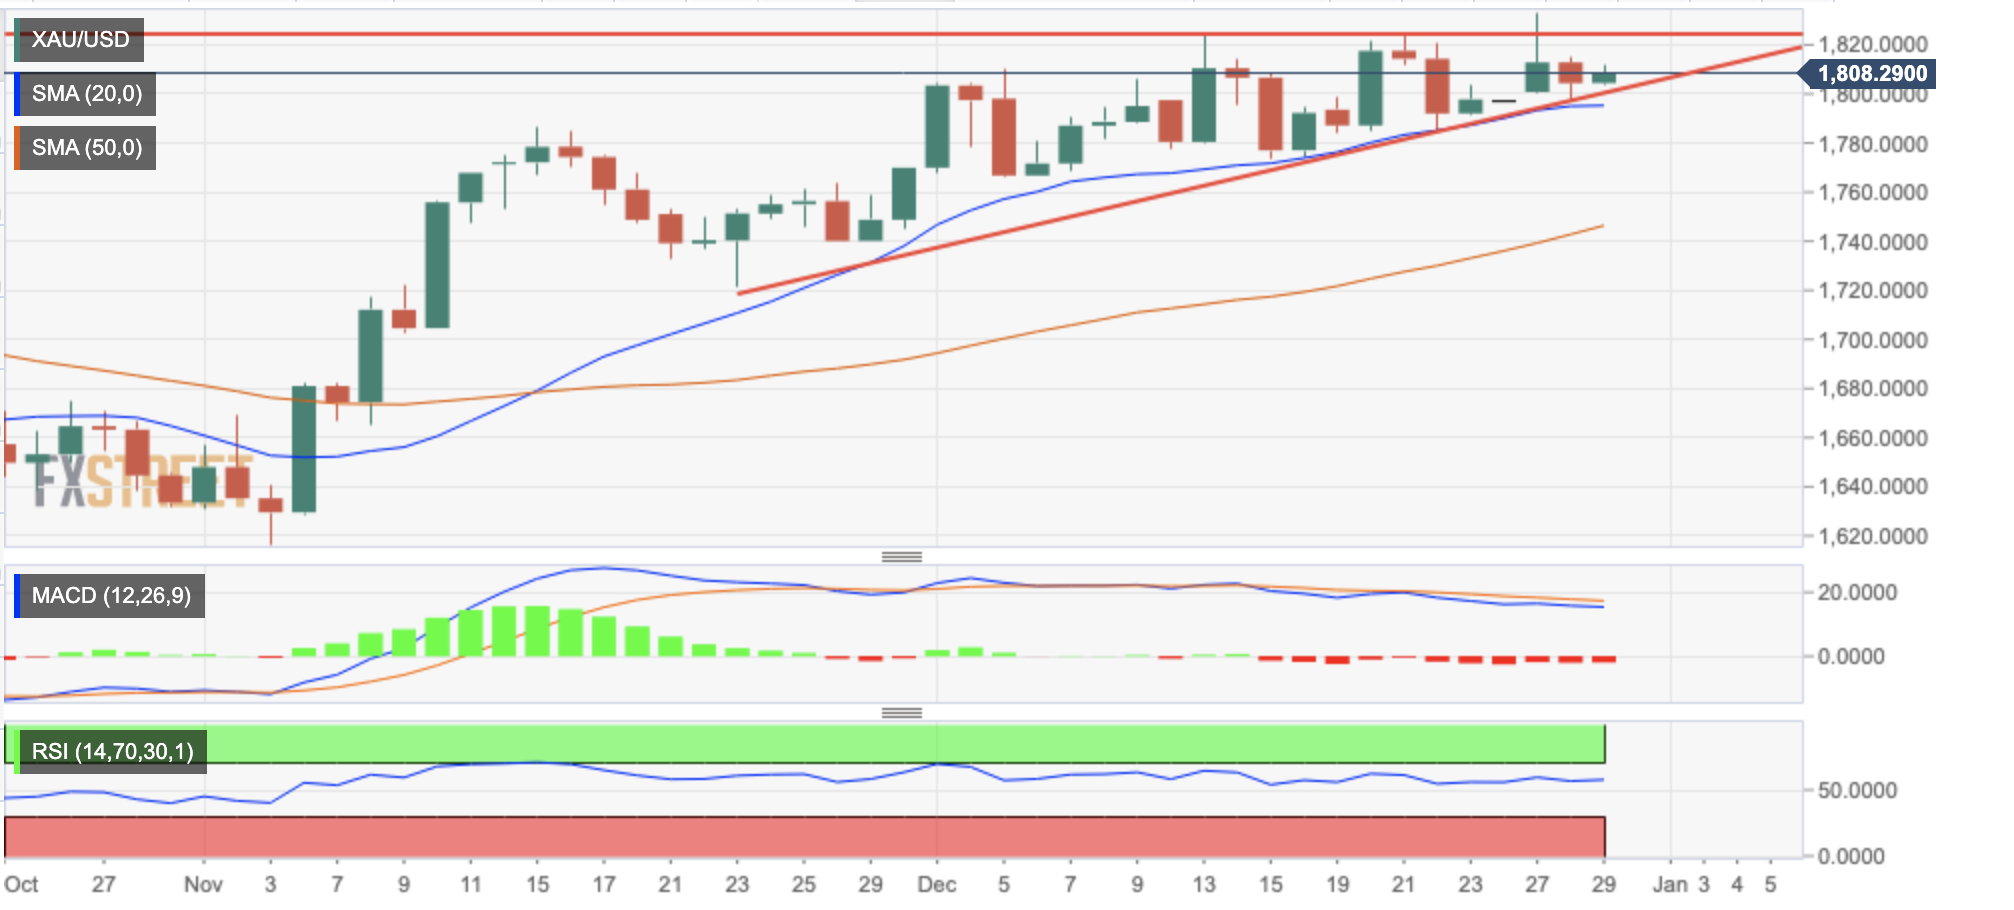
Gold price technical analysis
Despite being mostly inactive in December, Gold price defends its early November’s breakout of the 21-Daily Moving Average (DMA) while grinding higher.
The metal’s upside momentum, however, have recently lost momentum, as per the latest red signals from the Moving Average Convergence and Divergence (MACD) indicator. Even so, the firmer Relative Strength Index (RSI) line, placed at 14, favors the north-side grind.
As a result, the XAU/USD is likely to continue trading higher, even at a slower pace, unless breaking the 21-DMA support of $1,796.
Following that, November’s peak around $1,786 and the monthly bottom of $1,765 could act as the last defense of the Gold buyers before directing the precious metal towards the late November swing low near $1,721.
Alternatively, the recent swing high near $1,833 could act as the immediate hurdle for the Gold buyers to watch before targeting another battle with an upward-sloping resistance line from early October, close to $1,850 at the latest.
In a case where the XAU/USD remains firmer past $1,850, June’s peak surrounding $1,880 could act as an intermediate halt during the metal’s rush towards the $1,900 threshold.
Gold price: Daily chart
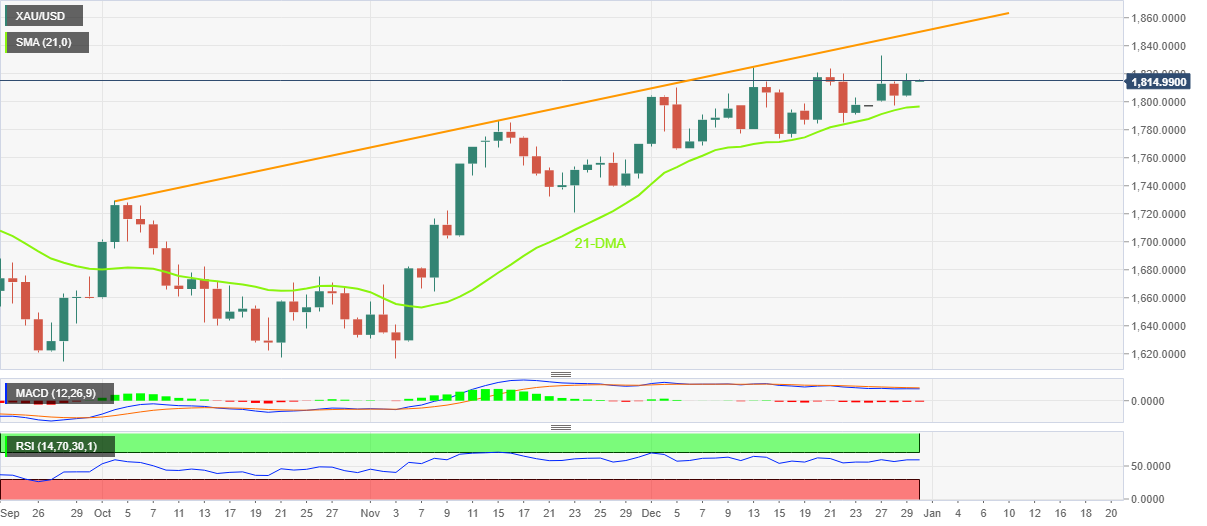
Trend: Further upside expected
-
22:25
USD/JPY Price Analysis: Bearish engulfing pattern spurred a fall below 133.00
- USD/JPY erased the last two days of gains due to the US Dollar weakness.
- USD/JPY Price Analysis: Bearish engulfing pattern spurred Thursday’s 140 pip fall.
The USD/JPY advancement was capped around the confluence of the 20 and 200-day Exponential Moving Averages (EMAs), forming a bearish engulfing candle pattern, opening the door for further losses. Therefore, the USD/JPY is trading at 132.90
USD/JPY Price Analysis: Technical outlook
After steadily advancing towards the weekly high of 134.50, the USD/JPY plunged beneath the 133.00 figure. Worse than estimated fundamental news caused US Dollar weakness. Therefore, the USD/JPY edged lower, confirmed by oscillators like the Relative Strength Index (RSI) and the Rate of Change (RoC), in bearish territory and aiming lower. Additionally, the confluence of the 20 and 200-day EMAs, exacerbated the major’s drop, as it prepared to fall towards the December low of 130.56.
Therefore, the USD/JPY first support would be the December 27 daily low of 132.63. A breach of the latter will expose the December 26 swing low of 132.30, ahead of the 132.00 mark. AS an alternate scenario, if the USD/JPY climbs above 135.00, the USD/JPY's next resistance would be 136.00, ahead of the December 20 daily high of 137.47.

USD/JPY Key Technical Levels
-
22:05
GBP/USD aims to recapture 1.2100 as US Dollar drops amid a recovery in risk-on mood
- GBP/USD is looking to reclaim the immediate resistance of 1.2100 amid a sheer drop in the US Dollar Index.
- A significant recovery in S&P500 has triggered hopes of a decent revival in investors’ risk appetite.
- Economists at TD Securities see that US inflation will remain well above 3% by the end of Q4 2023.
The GBP/USD pair has attempted a rebound and is likely to recapture the immediate resistance of 1.2100 in the early Asian session. The Cable has gained some traction as the US Dollar Index (DXY) has dropped near the lower portion of its weekly trading range around 103.60. The USD Index is oscillating in a range of 103.60-104.50 from the past week due to the absence of critical economic events for a decisive move amid a festive week.
A steep recovery in S&P500 after a two-day sell-off is portraying a decent recovery in the risk appetite theme. Investors jumped to load up beaten-down technology stocks. Meanwhile, the 10-year US Treasury yields witnessed a halt in its four-day winning streak and dropped to 3.82%, showing that volatility is cooling-off.
The US Dollar is not displaying a significant move this week due to a handful of economic events to bring an action in the FX action. On Thursday, the Greenback faced immense pressure after an acceleration in the number of Initial Jobless Claims for the week ending December 23. The Unemployment Claims jumped to 225K from the prior release of 216K. No doubt, the employment generation process has been slowed down led by higher interest rates by the Federal Reserve (Fed), which is resulting in more jobless claims from potential job seekers.
While the Fed is working hard to achieve price stability, economists at TD Securities are of the view that inflation in the United States will remain well above 3% by the end of Q4 2023. “We look for headline inflation to end the year at a robust 7.1% YoY pace in Q4, but to slow to 3.1% in Q4 2023. We also forecast Core CPI inflation to end the year at a still-high 6.0% but to decelerate to 3.3% in Q4 2023.”
On the United Kingdom front, the ending of the CY2023 at a higher inflation rate led by higher energy prices is going to keep the Bank of England (BOE) busy next year in handling the inflation mess. BOE Governor Andrew Bailey might bank upon further increments in the interest rates to trim inflationary pressures.
-
21:54
NZD/USD hits fresh weekly high around 0.6350s on soft US Dollar after US jobless claims
- NZD/USD bounced at the 20-day EMA and clung to gains at around 0.6350s.
- US Initial Jobless Claims rose more than estimates, flashing signs the labor market is easing.
- NZD/USD Price Analysis: Upward biased, but needs to clear 0.6360, to test 0.6400.
The New Zealand Dollar (NZD) clings to its gains on Thursday, bouncing off the 20-day Exponential Moving Average (EMA) as market sentiment improved due to a worse-than-expected US jobs report. Therefore, the US Dollar (USD) lost traction and weakened against most G10 currencies. At the time of writing, the NZD/USD is trading at 0.6350.
Wall Street finished the penultimate trading day of the year with gains between 1.05% and 2.59%. A light economic calendar left the NZD/USD pair adrift to US Dollar dynamics, which bolstered the New Zealand Dollar. The US Bureau of Labor Statistics (BLS) revealed the Initial Jobless Claims for the week ended on December 24 rose by 225K, in line with expectations, though 9K above the previous week’s record. Continuing claims jumped by 1.7 million in the week that ended on December 17, the highest since early February.
The NZD/USD reacted upwards amidst thin liquidity conditions as the year’s end approached.
Since authorities relaxed its zero-tolerance policy, the jump in Covid-19 cases in China is overwhelming its healthcare system. Also, Italy reported that half of the passengers on two flights from China were Covid-19 positive, spurring a chain reaction from Western countries, imposing tests on people traveling from China.
Elsewhere the US Dollar Index (DXY), a measure of the greenback’s value against a basket of peers, drops 0.49% and exchanges hands at 103.958, undermined by falling US bond yields. The 10-year benchmark note yields 3.826%, down six bps from its opening yield.
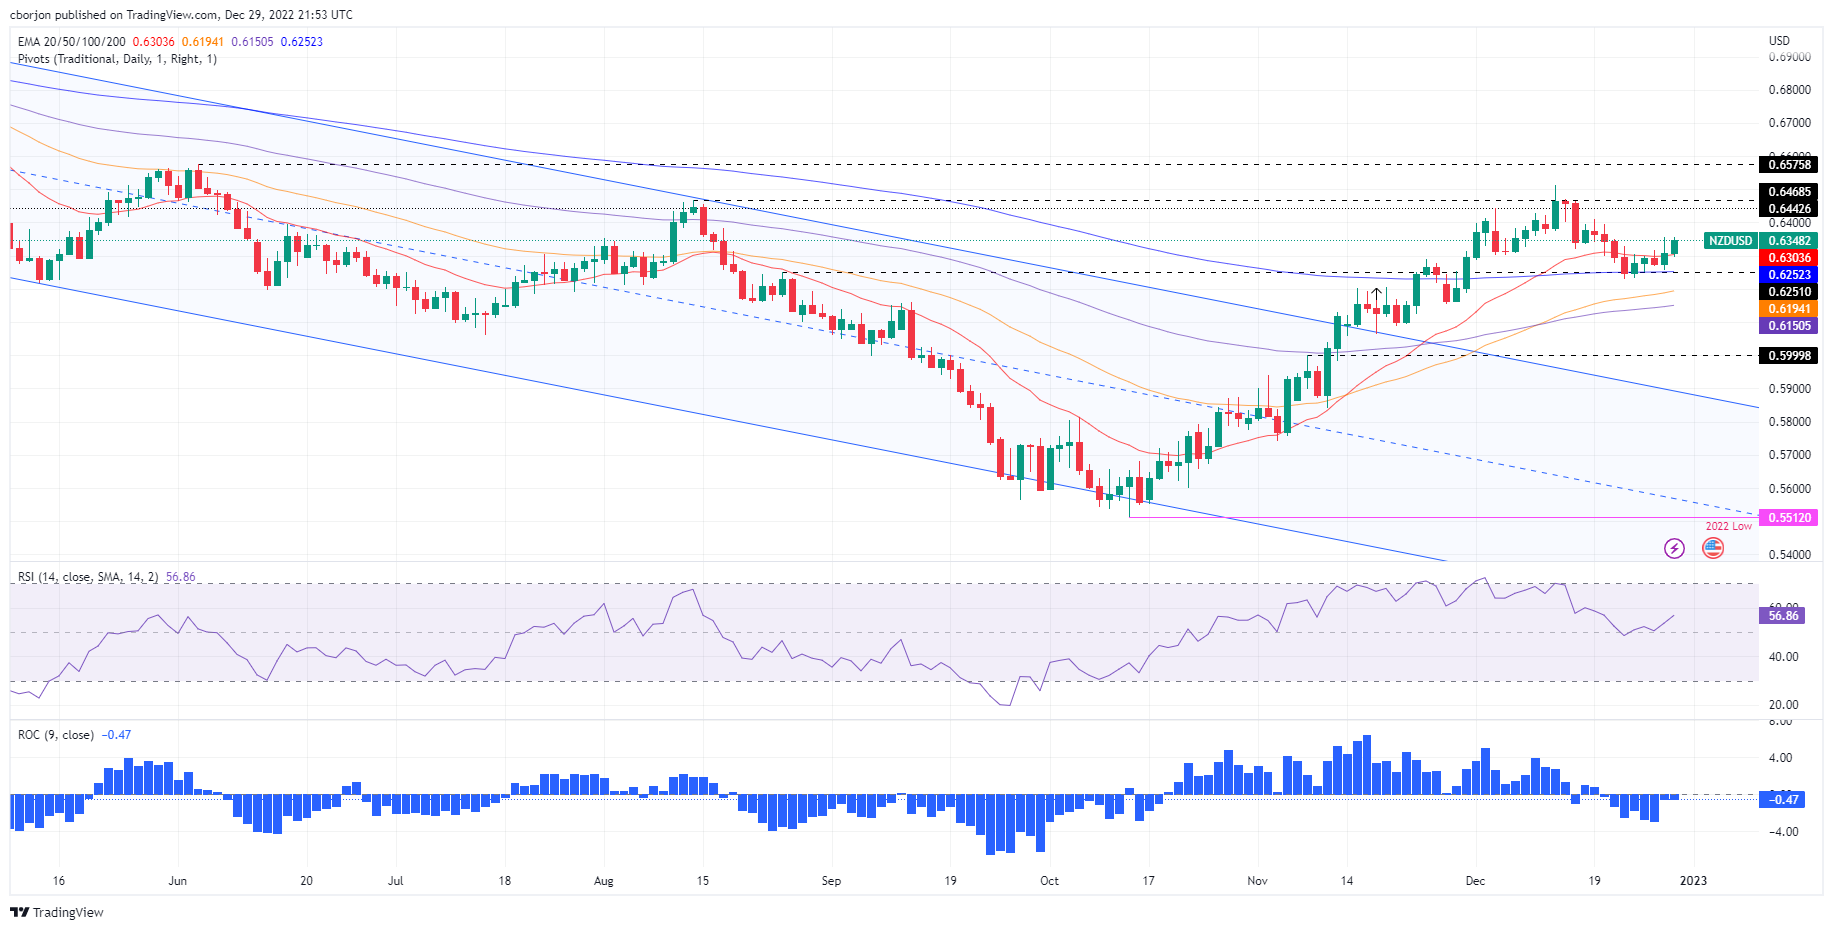
NZD/USD Price Analysis: Technical outlook
The daily chart shows the NZD/USD pair as upward biased, though struggling to crack the weekly high of 0.6355. Oscillators like the Relative Strength Index (RSI) and the Rate of Change (RoC) began to turn positive, suggesting buyers are moving in. However, if the NZD/USD is poised to fresh weekly highs, it will need to test the 0.6400 figure, followed by the December 13 daily high of 0.6513.
-
19:58
Forex Today: US Dollar gives up as Wall Street advances
What you need to take care of on Friday, December 30:
The US Dollar fell on Thursday, with the decline exacerbated by thin market conditions. Sentiment led the way throughout the day, with Chinese headlines triggering different market reactions. On Wednesday, financial markets were on alert after Italy reported that roughly 50% of the passengers of two flights arriving in Milan on Wednesday tested positive for COVID-19, and several western nations rushed to impose control on Chinese travelers, fearing the spread of a new strain. However, mid-European morning Italy reported they found no new covid variants in the aforementioned tests.
The mood improved ahead of the US opening, with Wall Street posting substantial gains. Nevertheless, growth and inflation concerns remain in the background. US Treasury yields were up at the shorter end of the curve, while the 10-year note yield shed 4 bps.
The EUR/USD pair peaked at 1.0689, holding on to gains ahead of the Asian opening. GBP/USD hovers around 1.2060, with Pound gains limited amid strikes going on in the United Kingdom. The 1,000 members of the Public and Commercial Services Union (PCS) are striking for four days until New Year’s Eve.
Commodity-linked currencies advanced vs their American rival. AUD/USD trades in teh 0.6780 price zone, while USD/CAD is down to 1.3540.
The Japanese yen appreciated amid the broad US Dollar weakness and news that the Bank of Japan conducted two unplanned bond purchase operations.
Spot gold edged marginally higher and finished the day at around %1,816 a troy ounce. Crude oil price weakened at the beginning of the day but trimmed most of its losses ahead of the close. WTI trades at around $78.30 a barrel
Like this article? Help us with some feedback by answering this survey:
Rate this content -
19:13
Gold Price Forecast: XAU/USD grinds higher toward $1815s on falling US yields, weaker USD
- Gold price holds to gains above $1,800 amidst thin liquidity conditions.
- The US labor market appears to ease as Initial Jobless Claims increase.
- Global central banks increased their holdings of Gold in Q3 by close to 400 metric tons.
- Gold Price Analysis: Hold above $1,800, eyeing June’s high of $1,879.45.
Gold Price advances after hitting a daily low of $1,803.30, gaining 0.83% during the North American session bolstered by falling US bond yields, which weakened the US Dollar (USD). Meanwhile, investors’ sentiment improved even though China relaxing Covid-19 policy keeps the health system pressured. At the time of writing, the XAU/USD is trading at $1,817.27, up by 0.74%.
Investors’ fears calmed following worse-than-expected US jobless claims data
Wall Street extends its gains on the penultimate trading day of the year. The US Department of Labor revealed Initial Jobless Claims for the week ended on December 24 jumped to 225K, in line with expectations, and 9K above the previous week’s record. Continuing claims rose to 1.7 million in the week that ended on December 17, the highest since early February.
Once the report hit newswires, Gold prices increased as investors’ fears for a tighter labor market eased. Additionally, US Treasury bond yields dropped, with the 10-year benchmark yield falling five bps, down to 3.830%. Consequently, the greenback weakened, as shown by the US Dollar Index (DXY), which tracks the US Dollar performance against a basket of peers, diving 0.54%, at 103.901.
According to the World Gold Council (WGC), global central banks bought Gold at the highest rate since 1967, likely led by Russia and China’s institutions. Central banks bought 399 metric tons of Gold in Q3, against 186 metric tons in Q1 and 88 metric tons in Q2.
The US economic docket will finish the year featuring the Chicago PMI on Friday. It will kick off the next year with a busy calendar, reporting S&P Global and ISM PMIs, labor market data, and the Balance of Trade.
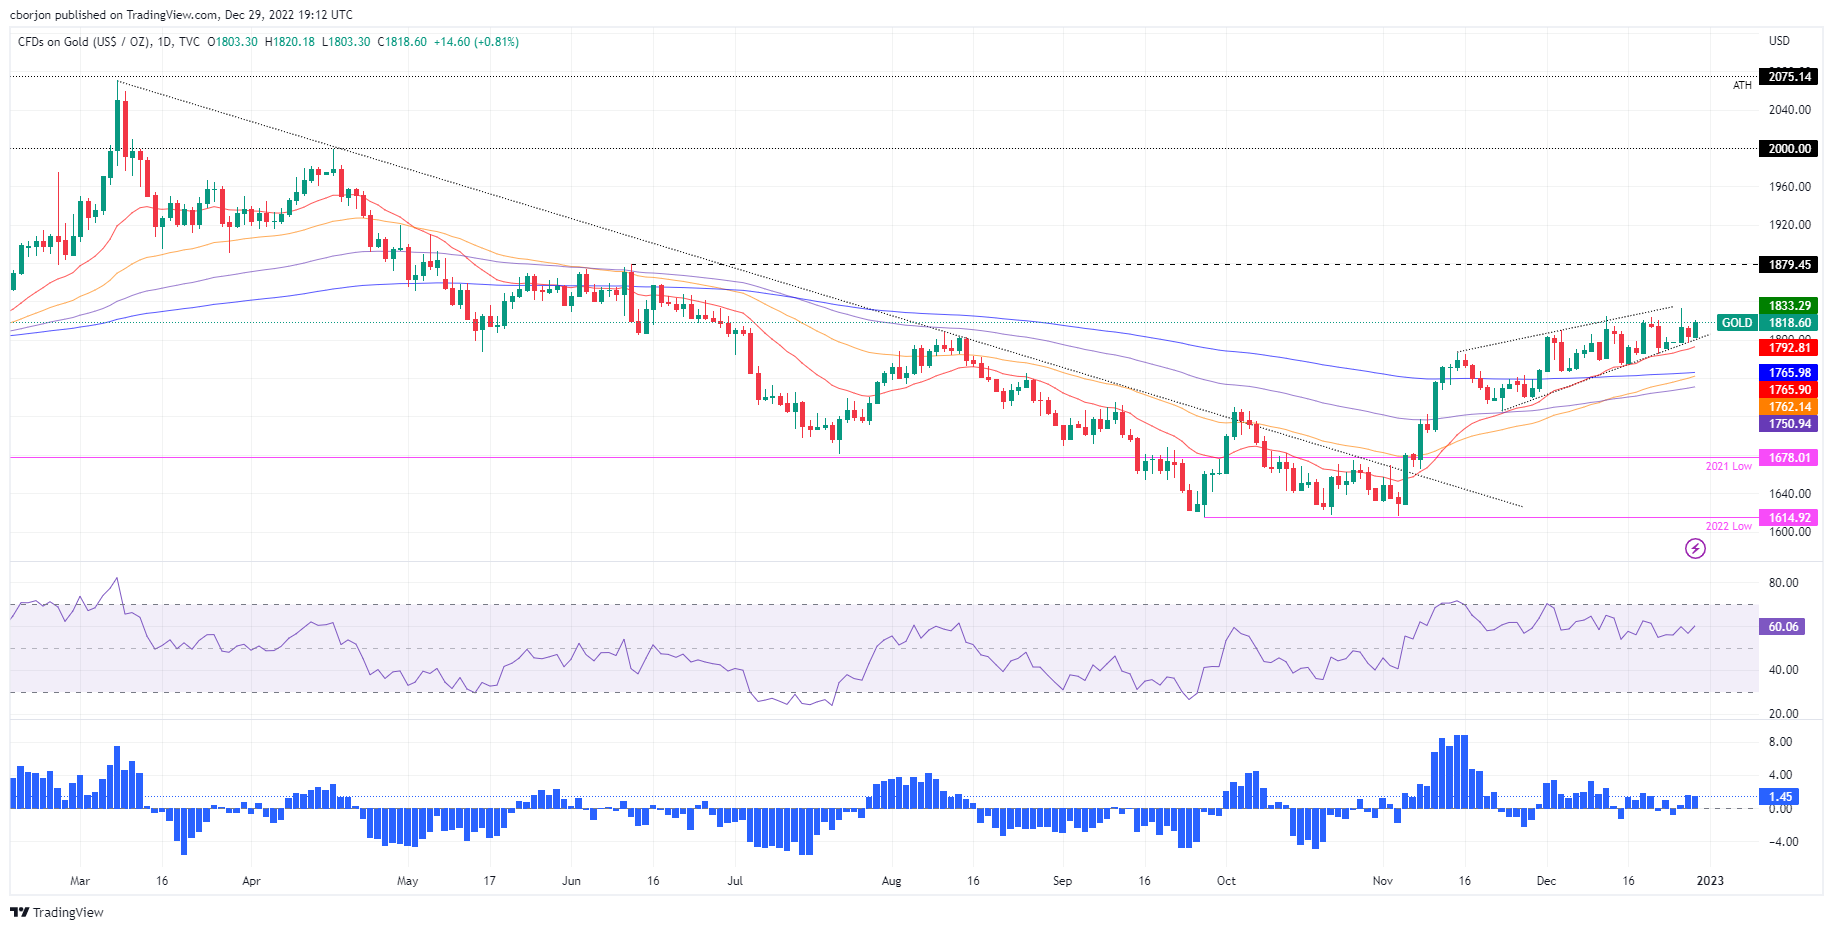
Gold Price Analysis: Technical outlook
From a daily chart perspective, the XAU/USD remains upward biased, though unable to crack December’s high of $1,833.29. Traders should be aware that the yellow metal prices have been tracking the 20-day Exponential Moving Average (EMA) since mid-November, and Gold is trading above its 200-day EMA. Therefore, further upside is expected.
That said, XAU/USD’s first resistance would be the MTD high of $1,833.29. A breach of the latter will expose June’s high of $1,879.45, followed by the $$1,900 mark. As an alternate scenario, the XAU/USD first support would be $1,800. Break below would expose the 20-day EMA at $1,792.78, followed by the 200-day EMA at $1,765.98.
-
18:11
United States 7-Year Note Auction rose from previous 3.89% to 3.921%
-
17:46
USD/CHF Price Analysis: Retests December lows around 0.9210s, as traders ignored a doji
- USD/CHF bypasses a doji and falls beneath the 0.9300 figure.
- The USD/CHF price action suggests the pair might form a triple bottom, but oscillators point downwards.
- A fall beneath 0.9200 could exacerbate a test of the 2022 lows.
The USD/CHF disregarded a doji formed on Wednesday and extended its losses below the 0.9300 figure, as the USD/CHF is about to finish the year almost unchanged. At the time of writing, the USD/CHF is trading at 0.9231, down by 0.58%.
USD/CHF Price Analysis: Technical outlook
The daily chart shows the USD/CHF hit a daily low of 0.9210 for the third time in December, though so far clung to the 0.9200 figure. However, the Relative Strength Index (RSI) and the Rate of Change (RoC) suggest that sellers gather momentum. So a fall beneath the 0.9200 figure could pave the way towards the 2022 yearly low of 0.9091.
Otherwise, the USD/CHF might be forming a triple bottom pattern, but firstly it would need to clear the 20-day Exponential Moving Average (EMA) at 0.9335 and December’s high of 0.9347 to confirm the chart pattern. Once achieved, the USD/CHF target would be the 50-day EMA at 0.9477, followed by 0.9500.
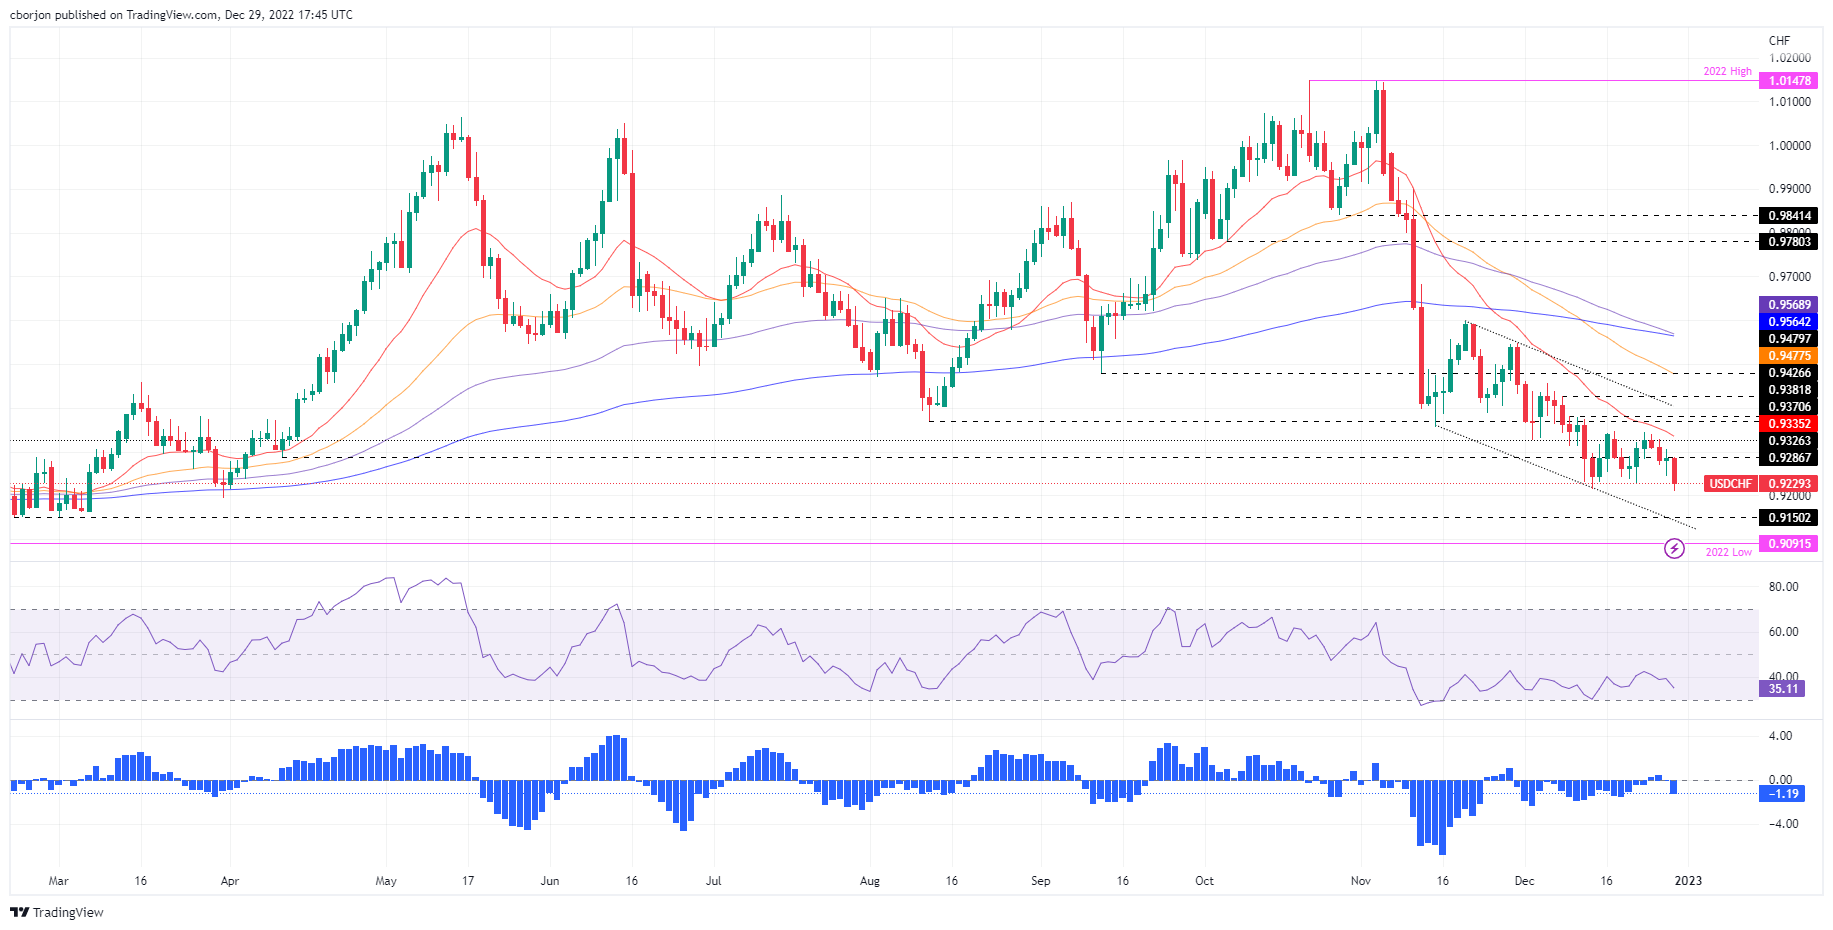
USD/CHF Key Technical Levels
-
16:47
EUR/USD climbs toward 1.0660s after US jobless claims increased
- The Euro remains above the 1.0600 figure, eyeing a year-end close above the figure.
- US Initial Jobless Claims exceeded the previous week’s reading, showing the labor market is easing.
- EUR/USD: Flat, but if it clears 1.0700, it could reach a new MTD high; otherwise, consolidation around 1.0600 is on the cards
The Euro (EUR) held to its gains vs. the American Dollar (USD) as sentiment improved ahead of the last trading day of 2022. Data from the United States (US) showed a slight jump in unemployment claims, boosting the EUR/USD, while China’s Covid-19 relaxing restrictions keep investors nervous. At the time of writing, the EUR/USD is trading at 1.0660.
An increase in US unemployment claims weighed on the US Dollar
US economic data revealed by the Department of Labor (DoL) featured Initial Jobless Claims for the week ended on December 24, which jumped to 225K, in line with expectations, and 9K above the previous week’s record. In the meantime, continuing claims rose to 1.7 million in the week that ended on December 17, the highest since early February.
Aside from this, since authorities relaxed its zero-tolerance policy, the jump in Covid-19 cases in China is overwhelming the country’s healthcare system. Also, flights from China that landed in Italy triggered a reaction from Western countries, with some reimposing tests for people flying from China.
Elsewhere, the Russian invasion of Ukraine escalated, with newswires reporting shelling in Kyiv and other cities.
In the meantime, the Eurozone economic docket featured Spain Retail Sales MoM, exceeding the previous month’s 0.4%, jumped 3.8%, while the EU’s M3 Money Supply for November dived to 4.8% YoY, vs. estimates of 5%.
The Eurozone economic calendar will feature Spain’s inflationary readings ahead of the week, while the US docket will release the Chicago PMI for December.
EUR/USD Price Analysis: Technical outlook
Choppy trading conditions in the EUR/USD continued, as usually happens, for the last ten days of the year. However, oscillators like the Relative Strength Index (RSI) suggest the shared currency could begin the year on a higher note while the Rate of Change (RoC) is flat. If the EUR/USD clears December’s 28 high of 1.0674, that could pave the way for a 1.0700 test. Once cleared, the next resistance would be the MTD high of 1.0736. As an alternate scenario, the EUR/SUD first support would be 1.0600, followed by last week’s low of 1.0573 and the 20-day Exponential Moving Average (EMA) at 1.0564.

-
16:32
United States 4-Week Bill Auction up to 3.83% from previous 3.61%
-
16:03
USD/JPY drops to fresh lows under 133.00 on the back of a weaker US Dollar
- Japanese Yen among top performers on Thursday despite higher equity prices.
- US Dollar turns negative as Wall Street soars.
- USD/JPY is ending a four-day positive streak with a 1% loss.
The USD/JPY broke below the 133.45/50 zone after the beginning of the American session and tumbled to 132.90, a two-day low. The pair remains under pressure, hovering around 133.00, down 1% so far for the day.
The decline took place amid a weaker US Dollar across the board hit by an improvement in risk sentiment. US bond yields remained steady. The Dow Jones was rising by more than 300 points while the Nasdaq was adding 2.45%.
US economic data showed Initial Jobless Claims rose to 225K during the week ended December 24, in line with expectations while Continuing Claims rose to 1.71 million, the highest level since February. The numbers did not have an impact. Price action remains subdue.
Short-term outlook
The USD/JPY is moving with a bearish bias in the very short-term. A recovery above the 133.45/50 level would alleviate the bearish pressure; while above 133.85 the bias should change to neutral/bullish.
The Momentum is about to cross 100 in four-hour charts and price is holding below key moving averages. A consolidation below 133.00 would keep the path clear to a slide to the next strong support located at 132.45/50 (weekly low).
Technical levels
-
16:00
United States EIA Crude Oil Stocks Change increased to 0.718M in December 23 from previous -5.894M
-
15:58
Gold Price Forecast: Backdrop for XAU/USD set to improve – Credit Suisse
The backdrop for cyclical commodities is likely to stay challenging and volatile. Nonetheless, strategists at Credit Suisse believe that Gold could enjoy gains later in 2023.
Gold upside optionality could be considered
“As we enter 2023, the backdrop might still be unfavorable for cyclical markets. However, central bank tightening efforts are likely to be advanced and peak hawkishness may be near, which would provide an improving backdrop for precious metals, especially Gold.”
“As central banks risk causing a deep growth slump, we see some upside risks to Gold as we progress in time. It may be premature to build outright exposure, but we see merit in looking for medium-term upside optionality.”
-
15:33
US: Inflation to still remain above the 3% level by Q4 2023 – TDS
Both Core CPI inflation and core PCE inflation will remain above target inflation levels by the end of 2023, in the opinion of economists at TD Securities.
Will inflation fizzle out?
“We continue to forecast inflation (as measured by the CPI) to still remain above the 3% level by Q4 2023 despite the expected cumulative aid from goods deflation and shelter disinflation. We continue to judge the move to below 3% to be the real challenge as the more persistent factors driving services inflation will become more evident.”
“We look for headline inflation to end the year at a robust 7.1% YoY pace in Q4, but to slow to 3.1% in Q4 2023. We also forecast Core CPI inflation to end the year at a still-high 6.0% but to decelerate to 3.3% in Q4 2023.”
“We also expect the spread between the CPI and PCE measures to shrink through the end of next year as the factors driving the wedge normalize. We project core PCE inflation at 3.0% YoY by end-2023.”
-
15:30
United States EIA Natural Gas Storage Change down to -213B in December 23 from previous -87B
-
15:29
GBP/USD hovers around 1.2030s on upbeat sentiment, soft US Dollar
- The British Pound clings to gains on optimistic sentiment and a weaker US Dollar.
- US Jobless Claims were aligned with estimates, showing the labor market remains tight.
- Traders expect a 25 bps rate hike by the Federal Reserve on February 2023.
- GBP/USD Price Analysis: Failure to crack 1.2100 will exacerbate a fall below 1.2000.
The Pound Sterling (GBP) remains sideways during the North American session after hitting a daily low of 1.2005 against the US Dollar (USD). Risk aversion spurred by factors linked to China’s learning to live with the coronavirus keeps investors uneasy. Meanwhile, the latest unemployment claims report shows the US labor market remains tight. At the time of writing, the GBP/USD is trading at 1.2033.
US Initial Jobless Claims failed to underpin the US Dollar
Wall Street is poised for a higher open, mimicking European stock indices. The US Bureau of Labor Statistics (BLS) revealed that Initial Jobless Claims for the week ended on December 24 rose by 225K, in line with expectations. The same report showed that continuing claims jumped to 1.7 million in the week that ended on December 17, the highest since early February.
Will the Federal Reserve hike 50 or 25 bps in February 2023?
Even though the US Federal Reserve (Fed) has lifted rates towards 4.50% during 2022 to tame inflation. The US Fed Chairman, Jerome Powell, and Co., have stressed that the labor market is tight and that the unemployment rate should be higher due to the imbalance between labor supply/demand. As the year’s end approached, the CME FedWatch Tool shows investors expect a 25 bps rate hike in the February 1 meeting, while Eurodollar futures show traders estimating a 50 bps lift.
Falling US bond yields lift the GBP/USD
Elsewhere, the GBP/USD is driven by the US Dollar dynamics due to the lack of UK economic data. The US Dollar Index (DXY), a gauge that tracks the US Dollar value against a basket of six currencies, tumbles 0.36%, down to 104.093, weighed by falling US Treasury yields. The US 10-year benchmark note rate drops three bps, yielding 3.856%.
What to watch
On Friday, the UK economic docket is empty, while the US calendar will feature the Chicago PMI for December, estimated at 40.
GBP/USD Price Analysis: Technical outlook
From a daily chart perspective, the GBP/USD upside was capped by the 200 and the 20-day Exponential Moving Average (EMA), each at 1.2111 and 1.2082. Oscillators like the Relative Strength Index (RSI) and the Rate of Change (RoC) suggest that sellers are beginning to gather momentum, even though the GBP/USD is edging up. That said, the GBP/USD first support would be the last week’s low of 1.1997. Break below will expose the 50-day EMA at 1.1936, followed by the 100-day EMA at 1.1884.

-
15:25
AUD/USD rises from three-day lows to 0.6765 as risk appetite improves
- Wall Street up sharply, Dow Jones gains more than 300 points.
- Improvement in risk sentiment boosts the Australian Dollar.
- AUD/USD moving without a clear direction, Aussie needs a confirmation above 0.6770.
The AUD/USD pair rebounded from levels near 0.6700 and printed a fresh daily low at 0.6764 during the American session amid a rally in equity prices in Wall Street.
The improvement in the demand for riskier assets in US markets weighed on the US Dollar that reversed its course, turning negative. The Dow Jones is up by 1.03% or 330 points while the Nasdaq climbs by more than 2%. US yields are moving without a clear direction, holding near recent highs. The US 10-year yield stands at 3.86% and the 2-year at 4.375.
US economic data released on Thursday showed Initial Jobless Claims rose to 225K during the week ended December 24, in line with expectation; Continuing Claims rose to 1.71 million, the highest level since February. On Friday, the Chicago PMI is due. In Australia will be a holiday.
The 0.6765/70 holds the upside
The AUD/USD is moving sideways. On the downside, the pair again found support above the 0.6700 area. A break lower could trigger an acceleration, targeting initially 0.6675.
If the Aussie manages to rise and hold firm above 0.6770 it would gain momentum, likely rising to test the weekly high area at 0.6800.
Technical levels
-
15:00
The main tailwind for USD is fading fast – HSBC
USD strength has been a very consistent story over the past two years. However, economists at HSBC note that the main tailwind for the Dollar is quickly falling away.
Upgrade of EUR and GBP to a neutral view
“USD benefited from the leadership of the Fed in setting the pace of monetary policy tightening and an attractive rate pickup compared to many other G10 currencies. But as we get closer to peak rate levels, we think those rate differentials are unlikely to widen further, and the gap may even narrow with some countries. As a result, the main tailwind for USD is fading fast.”
“USD will still get some support, however, from weakening global economic growth, relative economic resilience in the US and mixed-to-weak risk appetite.”
“We recently downgraded USD to neutral; upgraded EUR and GBP to a neutral view; and JPY and SGD to a bullish view.”
-
14:21
USD/CAD’s rebound from 1.3485 loses steam above 1.3600
- USD/CAD's recovery stalls below 1.3610.
- The Canadian dollar pares losses on the back of a mild rebound in oil prices.
- The lower US Treasury bonds are weighing on demand for the USD.
The US Dollar is treading water in the vicinity of 1.3600 on Thursday, following a solid recovery on Wednesday. The pair’s run-up from 1.3485 was capped at 1.3610 and has remained wavering on both sides of the 1.3600 level for most of the day.
The Canadian Dollar ticks up with oil prices trimming losses
The CAD is trimming losses, following its weakest daily performance in the last two weeks amid a moderate recovery in oil prices and the sluggish US Dollar’s performance in a choppy trading session.
Oil prices have appreciated about $1,5 during the European trading session, with the US benchmark West Texas Intermediate crude, picking up to $78.40 from session lows at $76.80, which might have offered some support to the commodity-linked CAD.
On the macroeconomic front, US initial Jobless Claims increased by 9.000 amounting to 225,000 in the week of December 24, with the 4-week moving average declining by 250 to 221,000 from the previous week, according to data released by the US Department of Labor.
These figures have failed to cheer a sluggish US Dollar, which has tracked the slight decline in US Treasury bond yields. The US Dollar Index has confirmed its decline below the 104.00 level, reaching fresh intra-day lows at 103.66 so far.
The yield of the benchmark US 10-year bond is trading at 3.867% at the moment of writing, 1.5 basis points lower on the day after having opened the session 2.4% down. Investor’s concerns about a potential recession in the first quarter of 2023 and a likely slowdown on the Fed’s tightening cycle are weighing on US Dollar demand
Furthermore, news reports about the soaring COVID-19 cases in China and the escalating tensions in Ukraine after Kremlin’s refusal to accept Zelenski’s peace deal proposal have crushed the optimism witnessed earlier this week after China scrapped its restrictions for inbound travelers.
Technical levels to watch
-
14:21
Gold Price Forecast: XAU/USD target range for 2023 set at $1,900 to $2,000 – Wells Fargo
While the commodity bull super-cycle has us positive on Commodities generally, strategists at Wells Fargo are neutral on the Precious Metals sector, which includes Gold.
Gold under pressure
“Gold has positives, but its negatives have been directing prices for some time now. The Dollar's 2022 ascent to a 20-year high was Gold's most potent negative, but the 2023 flattening and then reversal lower in the Dollar's value that we expect should relieve some pressure on Gold.”
“Other positives that may help in 2023 are a favorable supply/demand balance and oversold price conditions (cheap versus other commodities and negative investor sentiment).”
“Our 2023 target range of $1,900 to $2,000 reflects in-line commodity performance plus a bit extra, while Gold appears oversold. We caution investors, though, not to be too aggressive with Gold until it shows better price action.”
-
13:40
US: Weekly Initial Jobless Claims rise to 225K in week ending December 24
- Initial Jobless Claims in the US increased by 9,000 in the week ending December 24.
- US Dollar Index stays in negative territory near 104.00.
There were 225,000 initial jobless claims in the week ending December 24, the weekly data published by the US Department of Labor (DOL) showed on Thursday. This print followed the previous week's print of 216,000.
Further details of the publication revealed that the advance seasonally adjusted insured unemployment rate was 1.2% and the 4-week moving average was 221,000, a decrease of 250 from the previous week's revised average.
"The advance number for seasonally adjusted insured unemployment during the week ending December 17 was 1,710,000, an increase of 41,000 from the previous week's revised level," the DOL noted.
Market reaction
The US Dollar Index edged lower with the initial reaction and was last seen losing 0.38% on the day at 104.05.
-
13:30
United States Initial Jobless Claims climbed from previous 216K to 225K in December 23
-
13:30
United States Continuing Jobless Claims increased to 1.71M in December 16 from previous 1.672M
-
13:30
United States Initial Jobless Claims 4-week average fell from previous 221.75K to 221K in December 23
-
13:27
Gold Price Forecast: XAU/USD, in range above $1,800 amid a moderate risk aversion
- Gold is moving directionless above $1,800 as risk appetite faded.
- Concerns about China and the escalating tensions in Ukraine have dampened investors' optimism.
- XAU/USD remains trapped within an ascending triangle pattern.
Gold futures are moving without a clear direction on Thursday trapped within a $10 range above $1,800 in a choppy market session amid growing concerns about the Chinese economy and the rising tensions in Ukraine.
China and Ukraine have dampened risk appetite
The moderate optimism observed in the first half of the week, triggered by the Chinese authorities’ decision to lift the restrictions for inbound travelers faffed on Thursday as the recent reports about the sharp increase of infections have cast doubts about a quick recovery of China’s economy.
These reports have raised suspicions about the transparency of the Chinese Government and have prompted some countries, namely the US, Italy, and India to impose mandatory tests for Chinese travelers, a move that might be followed by other countries over the coming days.
Furthermore, Ukraine is reporting the heaviest artillery shelling in some of its main cities since the war started, leaving big parts of the population between energy, which is curbing risk appetite further.
XAU/USD remains moving within an ascending triangle pattern
From a technical point of view, the daily chart shows the pair trapped within ascending triangle pattern, limited by resistance area at $1,825, and trendline support from late-November lows, now around $1,800.
With the MACD indicator in negative territory, a confirmation below the $1,800 trendline would cancel the uptrend and might trigger a deeper retreat to $1765/75 December 6 and 15 lows and November 23 low at $1720.
On the contrary, a run-up above the $1825/35 resistance area would confirm the bullish pattern and set the pair aiming to June high at $1,880 before the $1,900 psychological level.
XAU/USD daily chart
Technical levels to watch
-
13:21
High inflation is expected to last beyond 2023 – Deutsche Bank
Inflation has become a dominant topic again. In the opinion of economists at Deutsche Bank, inflation will come down more slowly in the Eurozone than in the US.
Headline inflation seems to have already peaked in the US
“Inflation will still be well above the targets set by the central banks in Europe and the US in 2023.”
“While headline inflation seems to have already peaked in the US, it might not peak in Germany and the Eurozone until February or March 2023.”
“For 2023 as a whole, we expect inflation of 7.0% for Germany, 6.0% for the Eurozone and 4.1% for the US. High inflation is expected to last beyond 2023.”
“It is unlikely that inflation in the foreseeable future will return to the relatively low levels seen before the Covid pandemic.”
-
13:00
Chile Unemployment rate declined to 7.9% in November from previous 8%
-
13:00
Russia Central Bank Reserves $ remains unchanged at $581.7B
-
12:53
GBP/USD to see an average range of 1.23-1.28 until the longer term picture shows improvement – Citi
The British Pound has recovered somewhat from the intense selling that greeted former PM Liz Truss’s unfunded tax cut proposals in September 2022. In 2023, economists at Citi expect the GBP/USD pair to move within a 1.23-1.28 range.
Sterling vulnerable to further bouts of weakness against the USD
“For Sterling to make sustained gains the UK needs to present a sustainable long-term growth strategy. The outlook for 2023 is bleak, with recession likely, the developed world’s worst external deficit and trade with the EU hampered by Brexit.”
“The BoE has an equally difficult task of trying to lower a high inflation rate without deepening the UK recession and home price declines. Against this backdrop, we see Sterling vulnerable to further bouts of weakness against the USD.”
“We expect an average range of 1.23-1.28 until the longer term picture shows improvement.”
-
12:39
USD/JPY’, capped below 133.80/90 after its reversal from 134.50
- The Dollar remains steady above 133.40, with upside moves capped at 134.80/90.
- The Yen strengthens after the BoJ announces unscheduled bond purchase operations.
- USD/JPY: Breach of 130.40 support will trigger a deeper decline – SocGen.
The US Dollar’s mild rebound from intra-day lows at 133.50 is lacking follow-through right below the 133.80/90 resistance area, and the pair remains looking for direction within a 50-pip range, after retreating from the 134.50 area on Wednesday.
The BoJ announces more bond purchases
The Japanese currency appreciated about 0.6% during the Asian session, after the Bank of Japan announced two additional rounds of unscheduled bond purchase operations, responding to market speculation that points out to further relaxation of the bonds yield’s curve controls.
On the other end, the US Dollar is trading without a clear direction in a choppy post-Christmas market, with European stock markets picking up after a negative opening as concerns about China are dampening appetite for risk.
The exponential increase in COVID-19 infections has crushed investors’ enthusiasm about the end of the Zero-COVID policy and has dampened hopes of a quick economic recovery in China.
Recent reports revealing the high pressure that the new coronavirus wave is causing on the health system have moved some countries to impose restrictions on Chinese travelers. US Italy and India have already announced mandatory tests in arrivals from China and other countries are likely to follow suit.
On the macroeconomic front, with the Japanese calendar lacking relevant releases, in the US, the weekly jobless claims and oil stocks data could ofer a fresh boost to the US dollar crosses.
USD/JPY: Breach of 130.40 might trigger a further downtrend – SocGen
Currency analysts at Société Générale observe the pair biased lower and point out to 130.40 support: “The pair is now in the vicinity to August trough near 130.40. An initial bounce is not ruled out however 138 is likely to cap (…) Failure to defend 130.40 would mean a deeper downtrend. Next potential objectives could be at projections of 128 and 2015 levels of 125.85/124.00.”
Technical levels to watch
-
12:32
Brazil Nominal Budget Balance came in at -70.371B, below expectations (-52.794B) in October
-
12:32
Brazil Primary Budget Surplus came in at -20.089B, below expectations (13.765B) in October
-
12:19
Rapid equity market recovery unlikely with central banks’ new strategy – Natixis
Central banks’ strategy now seems to be to keep interest rates moderately high for a long time. How will equitty markets react to this interest rate scenario? In the view of analyst at Natixis, it is difficult to imagine a solid equity market recovery.
Central banks’ strategy is to keep interest rates moderately high
“Central banks’ new strategy is to raise interest rates moderately and keep them moderately high for a long time, as long as inflation does not return to the vicinity of the inflation target. Given the inertia of core inflation, we should actually expect a long period of moderately high interest rates.”
“During this period, the unemployment rate will rise until it exceeds the level of the structural unemployment rate. In this situation of rising unemployment and therefore persistently weak growth, it is difficult to imagine a marked recovery in share prices. The situation was different in the past as interest rates rose sharply (above the level of core inflation) and could therefore fall rapidly.”
-
11:43
GBP/USD extends its reversal to 1.2020 in a choppy market session
- The Pound U-turns at 1.2065 slides to. 1.2020 area.
- Concerns about China and Ukraine have soured investors' sentiment.
- The US dollar trims losses as US Treasuries bounce up.
Sterling’s reversal from the intra-day high of 1.2065 seen in the early European session has extended to the 1.2020 area in a choppy market session, with the European markets picking up, following a negative opening.
Concerns about China and Ukraine are weighing sentiment
Investors’ optimism about the end of the Zero-COVID policy in China faded on Thursday as reports about the exponential growth of infections and their strain on the country’s financial system are casting doubts on a fast recovery of the Chinese Economy.
Beyond that, the rising tensions in Ukraine where the Russian army is shelling heavily Kyiv and other cities after the Kremlin’s refusal to accept Zelenski’s peace plan is weighing risk appetite further, increasing negative pressure on the GBP.
Furthermore, the 0.5% interest rate hike approved by the Bank of England in December, following November’s 0.75% hike, has raised speculation of an easier monetary tightening in 2023 and a lower Bank Rate peak which is acting as a headwind for the Sterling.
On the other end, the US Dollar is trimming losses after a negative market opening. The US Dollar Index, which measures the value of the Greenback against the most traded currencies, has bounced up from levels right above 104.00, returning to 104.30 tracing the moderate recovery on US Treasury yields.
Technical levels to watch
-
11:40
USD/TRY to advance nicely toward 22 by end-2023 – SocGen
The Lira plummeted 28.8% this year versus the USD and 23.7% against the EUR, extending the downward trend of 2020. Economists at Société Générale expect the USD/TRY to reach 22 by the end of 2023.
Higher rates could dampen growth and pummel TRY
“The Lira still faces headwinds from deeply negative real rates, a wide current account deficit and geopolitical risk.”
“We expect the TRY to gradually weaken towards 19.00/USD by 1H23 and 22.00/USD by end-2023 as the current policy mix persists.”
“General and presidential elections in June/July 2023 could mark a turning point for the currency if a new government is elected and resets monetary policy.”
“Higher rates could dampen growth and weigh on the Lira.”
-
11:31
India Trade Deficit – RBI: -83.5B (3Q) vs previous -68.6B
-
11:02
EUR/USD remains rangebound, with upside attempts capped below 1.0660 area
- The Euro pulls back below 1.0640 after another rejection at the 1.0660 resistance area.
- Concerns about China and escalating tensions in Ukraine have dampened market optimism.
- EUR/USD seen at 1.0892/10944 in Q1, 2023 – Credit Suisse.
The Euro has turned lower during Thursday’s European trading session, unable to breach 1.0660/70 resistance in the fourth consecutive attempt this week. The pair remains trading within a 60-pip horizontal range on a thin post-Christmas market.
COVID-19 and Ukraine’s war dampen appetite for risk
Investors’ moderate appetite for risk seen in the first half of the week faded on Thursday, as reports from the surging coronavirus infections in China are casting doubts about the economic recovery of the Asian country.
The exponential increase in COVID-19 cases since the Chinese authorities relaxed its Zero-Covid policy is overwhelming the country’s healthcare system. This has raised suspicion about China’s transparency which has forced the US, Italy, and India, so far, to impose mandatory tests on arrivals from China.
Furthermore, tensions are escalating in Ukraine with news reporting heavy shelling in Kyiv and other cities after the Kremlin refused to accept Zelenski’s 10-point peace plan., which is putting additional negative pressure on the Euro.
On the economic calendar, in absence of key Eurozone data, the US US weekly jobless claims and crude oil stocks figures might offer a fresh impulse to Forex markets.
EUR/USD is aiming to 1.0892/1.0944 – Credit Suisse
From a technical point of view, analysts at Credit Suisse see the pair biased higher over the next months: “We expect further strength in Q1 2023, reinforced by the large top in front-end US/Europe interest rate differentials(…)We maintain our existing bullish call for 1.0892/1.0944 – the 50% retracement of the 2021/2022 fall and broken trend resistance from early 2017, with this then ideally capping to define the top of a broad range.”
Technical levels to watch
-
11:00
Brazil Inflation Index/IGP-M above expectations (-0.77%) in December: Actual (0.45%)
-
10:56
USD to lose altitude broadly as the end of Fed rate hikes come into view – BMO
After sprinting nearly 20% in the year to the end of September, the US Dollar then pulled back roughly 7% in the final quarter of 2022. Economists at the bank of Montreal expect the greenback to lose further ground in 2023
USD/CAD to see an average exchange rate of just under 1.33 in 2023
“We look for some further softening in the year ahead, as the Fed winds down what has been the most aggressive rate-hike campaign among major central banks. The Canadian Dollar is expected to modestly benefit from this move, albeit perhaps less than other major currencies, as the BoC is nearly done with its rate hikes.
“The Loonie will likely be a bit lower on average in 2023 than this year due to the big pullback late in 2022 (we expect an average exchange rate of just under $1.33 in the coming year).
“Stretch call: A soggy USD and a pick-up in China’s domestic economy help support commodity prices, even in the face of a North American recession, and the oil price average in 2023 (of about $90) is higher than current levels.”
-
10:27
USD/CHF resumes its downtrend and hits fresh week lows below 0.9245
- The dollar dives 0.5% on the day to test week lows at 0.9245.
- US Treasury bonds slide amid a negative market mood.
- Concerns about surging COVID-19 cases are casting doubts on China's economic recovery.
The Greenback’s reversal from Wednesday’s highs near 0.9300 is gaining traction on Thursday’s European trading with the pair testing fresh intra-week lows below 0.9245, following a mild recovery attempt, which was capped at 0.9285 earlier today.
From a wider perspective, the pair is resuming its downtrend from the 0.9340 resistance area tested at the start of the week, dangerously approaching a key support hurdle around 0.9210/20.
The Dollar retreats as US bond yields tick down
With the economic calendar lacking first-tier indicators, the moderate decline in US Bond yields, with the benchmark 10-year note ticking down 2.4 basis points to 3.862% amid a sourer market mood is weighing on US Dollar’s demand.
The surging COVID-19 infections in China since the Government relaxed its Zero-Covid policy are overwhelming the country’s healthcare system, crushing market hopes of a solid recovery in the world’s second major economy.
Against this backdrop, some countries have started imposing restrictions on inbound travelers from China. The US and Italy have established mandatory tests on arrivals from the Asian country and India has just announced a similar measure.
Furthermore, escalating tensions in Ukraine, with the Russian army shelling Kyiv and other cities following Putin’s refusal to accept Zelenski’s 10-point peace plan, has contributed to dampening market sentiment
On the economic calendar, the Swiss ZEW survey posted larger-than-expected improvement on Wednesday. Economic expectations improved to a -42.8 reading in December against market expectations of -50.5 and from the -57.5 seen in the previous month.
Today the US weekly jobless claims and crude oil stocks figures will be observed in an otherwise thin post-Christmas calendar.
Technical levels to watch
-
10:18
Equities seen higher by the end of next year – JP Morgan
In the view of economists at JP Morgan, stocks has pre-empted the macro troubles set to unfold in 2023 and look increasingly attractive.
The bull case for equities
“While we are not calling the bottom for equity markets, we do think that the risk vs. reward for equities in 2023 has improved, given the declines in 2022.”
“With quite a lot of bad news already factored in, we think that the potential for further downside is more limited than at the start of 2022.”
“Importantly, the probability that stocks will be higher by the end of next year has increased sufficiently to make it our base case.”
-
09:48
USD/ZAR to plummet toward 15.00 by end-2023 – SocGen
The Rand fell around 10% versus the US Dollar on a spot return basis this year. Looking ahead, economists at Société Générale expect the USD/ZAR pair to plunge to 15 by the end of 2023.
Rates are likely to stay at 8% until the end of 2023
“Despite the heightened political uncertainties, we remain positive on the ZAR. The re-opening of China and broader USD depreciation should deflate USD/ZAR in our view towards 15.00 by end-2023.”
“Headline inflation peaked five months ago but remains above the target range of 3-6%. We expect the central bank to slow the pace of tightening and deliver two more hikes of 50 bps in 1Q23 to 8%. Rates are likely to stay at this level until the end of 2023.”
“GDP growth may moderate from 1.9% this year to 1.2% in 2023.”
-
09:35
GBP/JPY Price Analysis: Pound, under pressure, testing support at 160.90
- The Pound dips 0.5% on the day after failing to confirm above 161.90 Fib. resistance.
- The pair has broken the near-term upward trendline and is now testing the 160.90 support area.
- Below 160.90, the next potential targets are 160.00 round revel and 158.55.
The Sterling is losing ground on Thursday, to put an end to a three-day recovery from the 158.90 area. The pair has lost nearly 0.5% on the day so far, retreating from Wednesday’s highs at 162.35 to test previous resistance turned support at 160.90.
The pair was unable to confirm the 38,2% Fibonacci Resistance level at 161.90 on Wednesday and has been gaining negative traction on Thursday, amid a sourer market sentiment.
Technical indicators are turning lower
On its reversal, the GBP has broken trendline support from last week's lows and is testing the mentioned 160.90 support area (December 21, 27 highs).
With the MACD in the four-hour chart on the verge of a bearish cross and RSI treading below the 50 level, a confirmation below 160.90 would strengthen bears and open the path toward the 160.00 round level on its way to a three-month low at 158.55.
On the contrary, a positive reaction should reach past the previous trendline support, now at 161.30, and the confluence of Fibonacci resistance and the 50-SMA at 161.80. This would ease negative pressure and set the pair’s focus on the December 28 peak, at 162.30.
GBP/JPY 4-hour chart
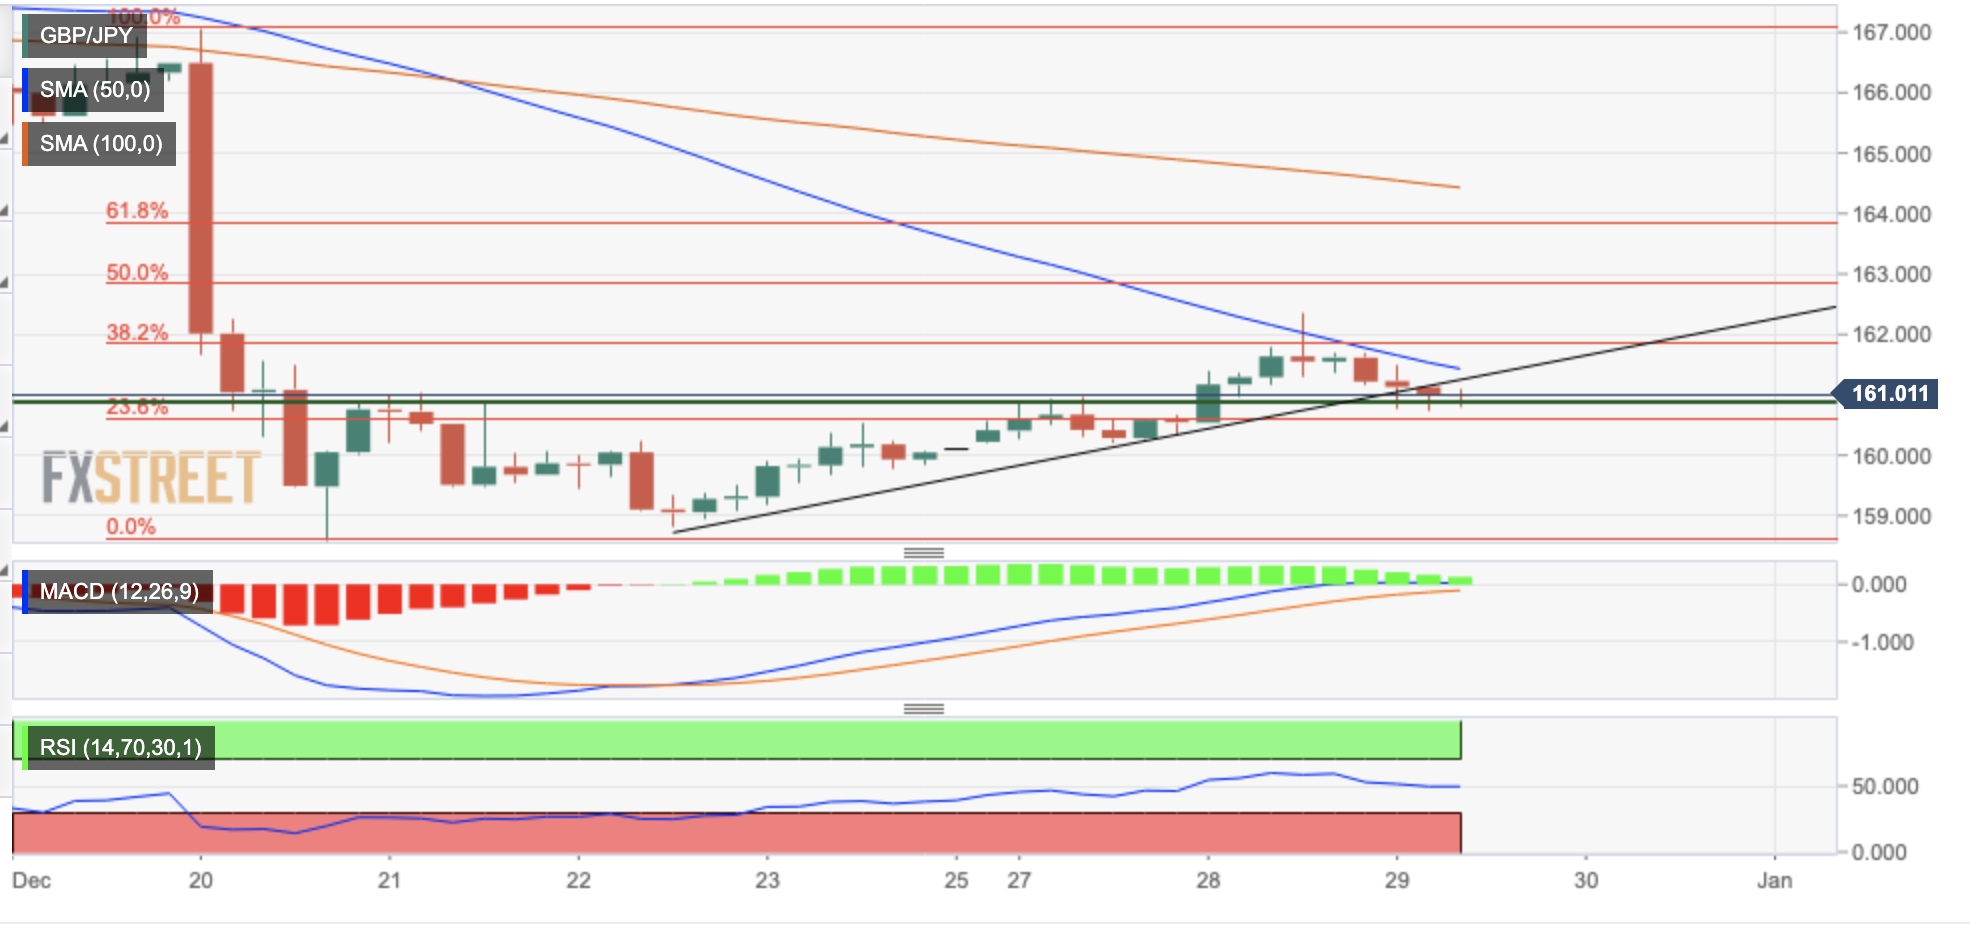
Technical levels to watch
-
09:34
China’s Health Official warns of Covid spreading throughout the holiday season
China’s Center for Disease Control and Prevention (CDC) top epidemiologist Wu Zunyou warned at a briefing on Thursday, Covid is seen spreading throughout the holiday season.
Additional quotes
“The Chinese provinces are in different stages of Covid outbreak.”
“Covid outbreaks have peaked in Beijing, Tianjin and Chengdu.”
“China is strengthening its Covid variant monitoring.”
Meanwhile, China's Senior health official Liang said that the country “will report to the World Health Organization (WHIO) if we find any new Covid variant.”
Market reaction
Despite a minor improvement in risk sentiment, the Chinese proxy, AUD/USD, remains pressured toward 0.6700. The pair is trading at 0.6722, down 0.18% on the day.
-
09:13
European Monetary Union M3 Money Supply (3m) fell from previous 5.8% to 5.4% in November
-
09:11
US Dollar to peak and then weaken in 2023 – Citi
Economists at Citi look for an end to the US Dollar’s mighty ascent.
CAD to strengthen once broader USD strength wanes
“We expect the US Dollar rally since 2021 to exhaust itself sometime in 2023 and then to reverse course. This is partly because the Fed is likely to stop raising interest rates more aggressively than other G10 central banks as economic growth slows.”
“Positioning for dollar strength has become a crowded trade as investors seek out “safe haven” assets amid uncertainty. The US has large trade and fiscal deficits that should prompt softening over time.”
“We expect the Canadian Dollar to strengthen once broader US Dollar strength wanes.”
-
09:01
BoJ: To supply two-year loans against pooled collateral on January 4
The Bank of Japan (BoJ )announced the conduct of funds-supplying operations against pooled collateral on Thursday.
The BoJ will supply about JPY1 trillion at a 0.0% interest rate in operations on January 4.
No further information is provided about the same.
Related reads
- USD/JPY bounces off intraday low amid BOJ’s action mode, softer yields despite Coronavirus, Ukraine fears
- BoJ conducted unplanned bond-buying twice on Thursday
-
09:00
European Monetary Union Private Loans (YoY) meets forecasts (4.1%) in November
-
09:00
European Monetary Union M3 Money Supply (YoY) came in at 4.8%, above forecasts (4.1%) in November
-
08:47
AUD/USD reversal from 0.6800 extends to 0.6720 as market sentiment sours
- Aussie's uptrend capped at 0.6800; the pair retreats to 0.6720.
- Market mood sours on concerns about COVID-19 infections in China.
- AUD/USD remains within recent ranges with the market focused on US data.
The Aussie is set to cap a four-day uptrend on Thursday, as the pair turned lower from one-week highs at 0.6800 and has extended losses to test week lows at 0.6720 in the early European session.
Concerns about COVID-19 in China dampen risk appetite
The sharp increase of coronavirus infections in China has curbed hopes about the economic recovery of the Asian dragon, crushing the moderate optimism observed in the first half of the week.
The major Asian markets have closed Thursday’s session in the red, and European indexes are following suit posting losses between 0.17% in Frankfort and a 0.62% decline in London.
COVID-19 cases have surged in China since the Government relaxed its Zero-Covid policy, and are overwhelming the country’s healthcare system in a wave that is threatening to extend from urban to rural areas as many citizens will travel to celebrate the lunar year. with their families.
In this context, many countries are considering introducing a covid test for travelers from China. The US has already announced the mandatory tests from January 5 and Italy is considering the same measure after half of the travelers arriving on a flight from China tested positive for Coronavirus at Milan’s Malpensa Airport on Wednesday.
The sentiment-linked Aussie has been hit by the souring mood and investors’ concerns about the consequences for China’s Economic growth. In a thinned post-Christmas market, however, the pair remains within recent ranges on Thursday with the focus on the US initial jobless claims and oil stocks figures, due later today.
Technical levels to watch
-
08:46
EUR/USD to extend its rally to 1.0892/1.0944 – Credit Suisse
EUR/USD hovers around mid-1.06s. Economists at Credit Suisse expect the pair to see further gains toward 1.0892/1.0944.
Further strength in Q1 2023
“We expect further strength in Q1 2023, reinforced by the large top in front-end US/Europe interest rate differentials.”
“We maintain our existing bullish call for 1.0892/1.0944 – the 50% retracement of the 2021/2022 fall and broken trend resistance from early 2017, with this then ideally capping to define the top of a broad range. Should strength directly extend though, we would see resistance next at 1.1185, potentially 1.1275.”
“Support to define the lower end of a potential range is seen at 1.0223/1.0198.”
-
08:42
China’s Finance Ministry: Will adjust trade tariffs on some goods from January 1
Citing the tariff commission of China's state council, the country’s Finance Ministry said in a statement on Thursday, China will adjust import and export tariffs on some goods from January 1.
Additional takeaways
“China has decided to further reduce the tariffs for most favoured nations on 62 types of information technology products from July 1 next year. That step will cut China's overall tariffs to 7.3% from 7.4%.”
“Will speed and promote development and expand domestic demand.”
“Export tariffs on aluminium and aluminium alloys are to be raised.”
“The current import tariff will stay on seven types of coal until March 31 next year.”
“Will meet shoppers' demands, import tariffs will be further lowered on coffee makers and juice extractors.”
Market reaction
AUD/USD is uninspired by the above headlines, weaker by 0.08% on the day at 0.6730, as of writing.
-
08:12
USD/CNY to gradually dip towards 6.80 by end-2023 – SocGen
The Chinese Yuan has come a long way, recovering to around 7.00/USD from the low of 7.32 in late October. Economists at Société Générale expect the USD/CNY to move slightly down toward 6.80 by the end of 2023.
CNY is likely to underperform other Asian currencies
“Our forecast is for the currency to gradually recover towards 6.80/USD by end-2023.”
“External demand for Chinese goods will likely stay weak and exports could be disrupted by the mounting toll following the easing of quarantine restrictions. This means the CNY is likely to underperform other Asian currencies like the KRW.”
“We expect the 10y Yield to rise towards 3.20% in 12 months as a result of heavy local government bond issuance, pressure on fiscal receipts and lower revenues from sizeable land sales.”
-
08:01
Spain Retail Sales (YoY) below forecasts (1.1%) in November: Actual (-0.6%)
-
07:58
USD/JPY bounces off intraday low amid BOJ’s action mode, softer yields despite Coronavirus, Ukraine fears
- USD/JPY picks up bids pares the first daily loss in six.
- US 10-year Treasury yields refresh intraday low, extend pullback from six-week high.
- China CDC official warns of more Covid spread, explosions heard in Kyiv, Kharkiv.
- BOJ undertook two back-to-back unplanned bond purchases in a single day.
USD/JPY consolidates the intraday losses around 133.85 during the early hours of the European session on Thursday.
In doing so, the Yen pair justifies the recent rebound in the US Dollar, mainly due to the risk-negative headlines surrounding China and Ukraine. However, downbeat US Treasury yields and the Bank of Japan’s (BOJ) active performance in the last few days seem to probe the buyers.
Earlier in the day, the Bank of Japan (BoJ) announced unplanned bond purchase operations twice in a single day.
That said, US Dollar Index (DXY) rises to 104.40 while reversing the early Asian session losses and printing the three-day winning streak despite softer US Treasury bond yields. The benchmark US 10-year Treasury yields refresh intraday low near 3.85%, down 3.0 basis points (bps), by the press time.
The US Dollar’s latest run-up could be linked to the comments from a top official from the Chinese Center for Disease Control and Prevention (CDC) as he warned of Covid spreading throughout the holiday season. The diplomat, however, also mentioned that the Coronavirus outbreaks have peaked in Beijing, Tianjin and Chengdu. Previously, around seven major nations have recently announced Covid test requirements for Chinese travelers as the virus cases swirl in the dragon nation but Beijing reverses the “Zero-Covid” policy.
Talking about geopolitics, Russia’s rejection of peace with Ukraine unless it accepts the treaty allowing additional territories, as well as an escalated war in the city of Kherson, weighs on the market sentiment. Recently, explosions were heard in Kyiv and Kharkiv after a Ukrainian diplomat warned of a missile launch.
Against this backdrop, S&P 500 Futures print mild gains but equities in Europe and London stay depressed by the press time.
Looking forward, risk aversion could renew USD/JPY buying but a jump in the US Initial Jobless Claims could weigh on the prices amid a likely sluggish session.
Technical analysis
A convergence of the 200-HMA and the support-turned-resistance line stretched from December 20, around 133.95, quickly followed by the 134.00 round figure, guards the USD/JPY pair’s immediate upside.
-
07:36
Gold Price Forecast: US Dollar rebound triggers XAU/USD pullback amid Covid, Ukraine woes
- Gold price grinds higher inside three-week-old bearish triangle.
- Pullback in US Treasury bond yields, mixed US data favor XAU/USD bulls.
- Chinese travellers to face multiple tests amid Covid spread, CDC Official sounds optimistic.
- Explosions were heard in Ukraine’s capital Kyiv, tensions escalate in Kherson.
Gold price (XAU/USD) takes a U-turn from the intraday high as traders in the west ascertain fears emanating from China’s Covid conditions and Ukraine during early Thursday. In doing so, the precious metal drops to $1,806 while consolidating the intraday gains.
That said, around seven major nations have recently announced Covid test requirements for Chinese travelers as the virus cases swirl in the dragon nation but Beijing reverses the “Zero-Covid” policy. It’s worth noting that a top official from the Chinese Center for Disease Control and Prevention (CDC) recently warned of Covid spreading throughout the holiday season. The diplomat, however, also mentioned that the Coronavirus outbreaks have peaked in Beijing, Tianjin and Chengdu.
Elsewhere, Russia’s rejection of peace with Ukraine unless it accepts the treaty allowing additional territories, as well as an escalated war in the city of Kherson, weighs on the market sentiment. Recently, explosions were heard in Kyiv and Kharkiv after a Ukrainian diplomat warned of a missile launch.
Even so, downbeat prints of the US 10-year Treasury yields, down 3.0 basis points (bps) to 3.85%, probes the US Dollar Index (DXY) bulls and puts a floor under the Gold price.
It’s worth mentioning that the options market appears optimistic over the yellow metal as the latest risk reversal (RR) for the XAU/USD, a difference between the calls and puts, appears positive to the prices. That said, the one-month RR eyes the biggest weekly print in four on a week-on-week basis while also reversing the previous monthly fall with +0.430 print at the latest.
Moving on, weekly prints of the US Initial Jobless Claims and Chicago PMI for December will be eyed for short-term directions but major attention will be given to the risk catalysts and the bond market moves during the year-end inaction.
Gold price technical analysis
A three-week-old ascending triangle restricts Gold price between $1,782 and $1,825. That said, the XAU/USD currently fades bounce off a fortnight-old upward-sloping support line inside the stated triangle, around $1,800 by the press time.
It’s worth noting that the bearish MACD signals and sluggish prints of the RSI (14) add strength to the downside bias. However, the 200-SMA level of $1,780 acts as an extra barrier for the Gold sellers before giving them control.
Alternatively, an upside clearance of $1,825 won’t hesitate to challenge June’s peak surrounding $1,880.
Gold price: Four-hour chart
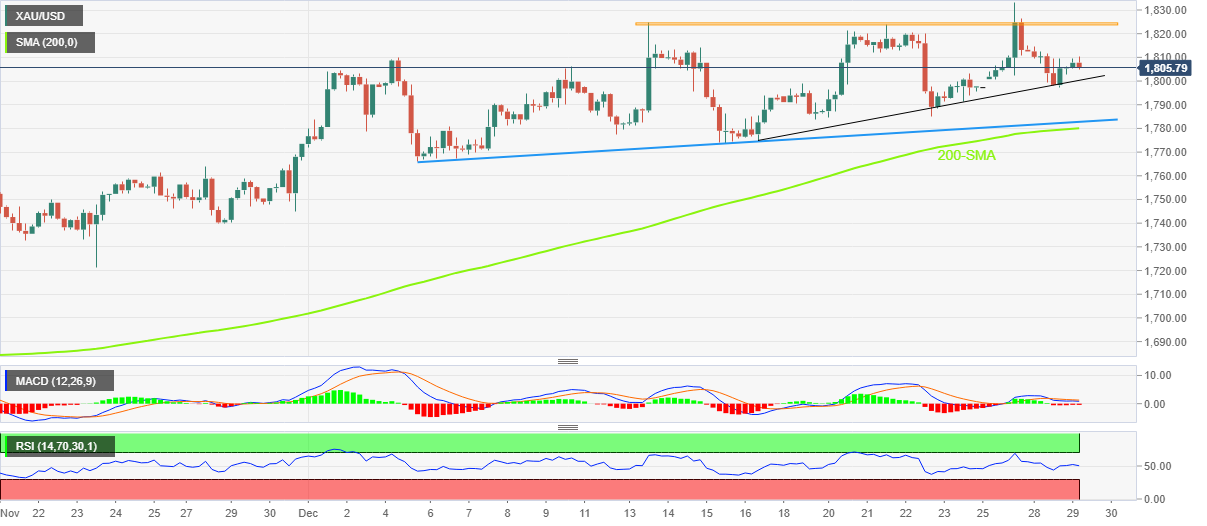
Trend: Pullback expected
-
07:34
Gold Price Forecast: XAU/USD could extend choppy trading within a triangle
Gold price is extending the previous rebound above the $1,800 mark. XAU/USD choppy trading is set to continue below $1,825 amid thin markets, FXStreet’s Dhwani Mehta reports.
Gold continues to wave within an ascending triangle formation
“Only a daily close above the horizontal trendline (triangle) resistance at $1,825 will confirm the ascending triangle breakout. The next upside target on buyers’ radars will be the multi-month high at $1,833. Further up, the psychological $1,850 level will come into the picture.”
“On the downside, Gold price could revisit Tuesday’s low at $1,800. The next critical support awaits at $1,795, which is the confluence of the rising trendline (triangle support line) and the bullish 21-Daily Moving Average (DMA). A downside break from the triangle could be seen on a daily closing below the latter, which could leave bulls in disarray.”
See – Gold Price Forecast: XAU/USD to enjoy further gains towards $1,876/96 and potentially beyond – Credit Suisse
-
07:33
Forex Today: US Dollar benefits from risk aversion
Here is what you need to know on Thursday, December 29:
The negative shift witnessed in risk mood helps the US Dollar holds its ground against its major rivals in the second half of the week. The US Dollar Index stays near 104.50 after having closed the previous two days in positive territory and US stock index futures trade mixed in the early European session on Thursday. Weekly Initial Jobless Claims and crude oil inventory data will be featured in the US economic docket. Market participants will keep a close eye on developments surrounding the Russia-Ukraine conflict and the coronavirus situation in China.
Late Wednesday, Wall Street's main indexes turned south and suffered heavy losses, providing a boost to the safe-haven US Dollar. While China continues to move closer to a full reopening, the rest of the world is looking to introduce new restrictions on travellers from China. Effective January 5, the US will require all travellers from China to provide a negative COVID test before entering the country. Similarly, Italy announced that they will commence testing on all arrivals from China after half of the passengers that arrived in Milan had reportedly had COVID. The UK is expected to assess the situation and decide whether non-stop inbound flights from China will be restricted.
Meanwhile, Kyiv's mayor Vitali Klitschko said on Thursday that there were explosions in the city. Additionally, Russian missile strikes have reportedly hit the eastern Ukrainian city of Kharkiv. Additionally, Russia's Foreign Minister Sergei Lavrov reiterated that they will not negotiate with Ukraine based on Ukrainian President Volodymyr Zelenskiy's 'peace formula.'
EUR/USD retreated toward 1.0600 and closed in negative territory on Wednesday. The pair stays relatively quiet slightly above that level early Thursday. M3 Money Supply and Private Loans data will be featured in the European economic docket.
GBP/USD registered modest losses for the second straight day on Wednesday but managed to hold above 1.2000. At the time of press, the pair was marginally higher on the day at around 1.2020.
After having closed the first three days of the week in positive territory, USD/JPY reversed its direction during the Asian trading hours on Thursday. Reuters reported earlier in the day that the Bank of Japan conducted an unplanned bond-buying for the second straight day. The pair was last seen losing 0.5% on the day at 133.80.
Following Tuesday's rally, Gold price stayed on the back foot amid risk aversion on Wednesday. Nevertheless, XAU/USD doesn't seem to be having a difficult time staying afloat above $1,800 early Thursday with the benchmark 10-year US Treasury bond yield losing nearly 1% at around 8.5%.
Bitcoin lost nearly 1% for the second straight day on Wednesday before going into a consolidation phase near $16,500 early Thursday. Ethereum fell nearly 2% and closed below $1,200 on Wednesday. ETH/USD was last seen trading modestly higher on the day at $1,190.
-
07:00
Turkey Economic Confidence Index climbed from previous 96.9 to 97.6 in December
-
07:00
FX option expiries for Dec 29 NY cut
FX option expiries for Dec 29 NY cut at 10:00 Eastern Time, via DTCC, can be found below.
- EUR/USD: EUR amounts
- 1.0615 426.8m
- GBP/USD: GBP amounts
- 1.1700 592.9m
- 1.2600 563.5m
- 1.1600 414.9m
- USD/JPY: USD amounts
- 135.00 732.7m
- 133.70 630.1m
- 120.00 520m
- AUD/USD: AUD amounts
- 0.6555 357.5m
- USD/CAD: USD amounts
- 1.3610 740m
- 1.3590 339.6m
- USD/CNY: USD amounts
- 6.9000 627m
-
06:55
GBP/USD pares intraday gains above 1.2000 as risk-aversion intensifies, Covid, Ukraine eyed
- GBP/USD takes offers to trim the first daily gain in three.
- Multiple nations, including Britain, announced fresh barriers for Chiense travellers amid Coronavirus woes.
- Geopolitical tensions in Kherson escalate, a blast heard in Kyiv.
- Pullback in US Treasury bond yields, mixed US data probe Cable bears.
GBP/USD slides to 1.2025 as it consolidates the intraday gains, the first in three days, during the early Thursday morning in London. The Cable pair’s latest weakness could be linked to the escalated fears surrounding COVID-19 and the Russia-Ukraine tussles. However, a retreat in the US Treasury yields put a floor under the prices.
The UK is among the major seven nations, including the US, South Korea, Japan, Taiwan, Italy and India, that recently announced Covid test requirements for Chinese travelers as the virus cases swirl in the dragon nation but Beijing reverses the “Zero-Covid” policy.
On the other hand, Russia’s rejection of peace with Ukraine unless it accepts the treaty allowing additional territories, as well as an escalated war in the city of Kherson, weighs on the market sentiment. Recently, explosions were heard in Kyiv after a Ukrainian diplomat warned of a missile launch.
It should be noted, however, that the mixed US data and absence of the hawkish Fed rhetoric seem to defend the GBP/USD buyers amid the year-end inaction. That said, US Pending Home Sales for November dropped to -37.8% YoY versus -36.7% expected and -37.0% previous readings while the Richmond Fed Manufacturing Index for December improved to 1.0 versus -4.0 anticipated and -9.0 prior.
Against this backdrop, the US 10-year Treasury yields dropped 2.6 basis points to 3.86% by the press time, after rising the most since October 19 the previous day. Furthermore, S&P 500 Futures remain indecisive as downbeat bond coupons put a floor under the stock futures even as Wall Street closed in the red.
Looking forward, a light calendar and the sour sentiment may recall the GBP/USD bears even as the likely increase in the US Initial Jobless Claims could weigh on the US Dollar.
Technical analysis
A five-week-old ascending trend line, around 1.2000 by the press time, restricts the short-term downside of the Cable pair. Even so, the GBP/USD bulls are likely to remain absent unless the quote prints a daily closing beyond the 200-DMA resistance, around 1.2050 at the latest.
-
06:30
EUR/USD Price Analysis: Bearish bias remains intact below 1.0650 hurdle
- EUR/USD pares the first daily gains in three during sluggish session.
- Clear downside break of weekly support line, sustained trading below 100-SMA favor sellers.
- Descending trend line from Tuesday adds to the upside filters.
- Weekly horizontal support restricts immediate downside amid steady RSI.
EUR/USD takes offers to consolidate the first daily gains in three around 1.0620 heading into Thursday’s European session. Even so, the major currency pair prints 0.13% intraday gains by the press time.
That said, the quote broke a one-week-old ascending trend line, as well as the 100-Simple Moving Average (SMA), the previous day and favored the bears.
The following corrective bounce off the late Friday’s trough, however, failed to cross the aforementioned hurdles and join the steady RSI (14) to keep sellers hopeful.
As a result, EUR/USD bears are likely to revisit the weekly horizontal support zone surrounding 1.0600, a break of which could quickly drag the quote towards the previous weekly low near 1.0575.
It’s worth noting that the pair’s weakness past 1.0575 will highlight the 1.0440 support level, as well as the monthly low of 1.0393 for the EUR/USD sellers.
On the contrary, the 100-SMA level of 1.0640 precedes the previous support line, around 1.0645 at the latest, to restrict the short-term EUR/USD upside.
Following that, a downward-sloping trend line from Tuesday, close to 1.0650 by the press time, will gain the market’s attention.
In a case where the EUR/USD bulls manage to cross the 1.0650 hurdle, which is less expected, the quote is likely to refresh the monthly high, currently around 1.0735.
EUR/USD: 30-minute chart
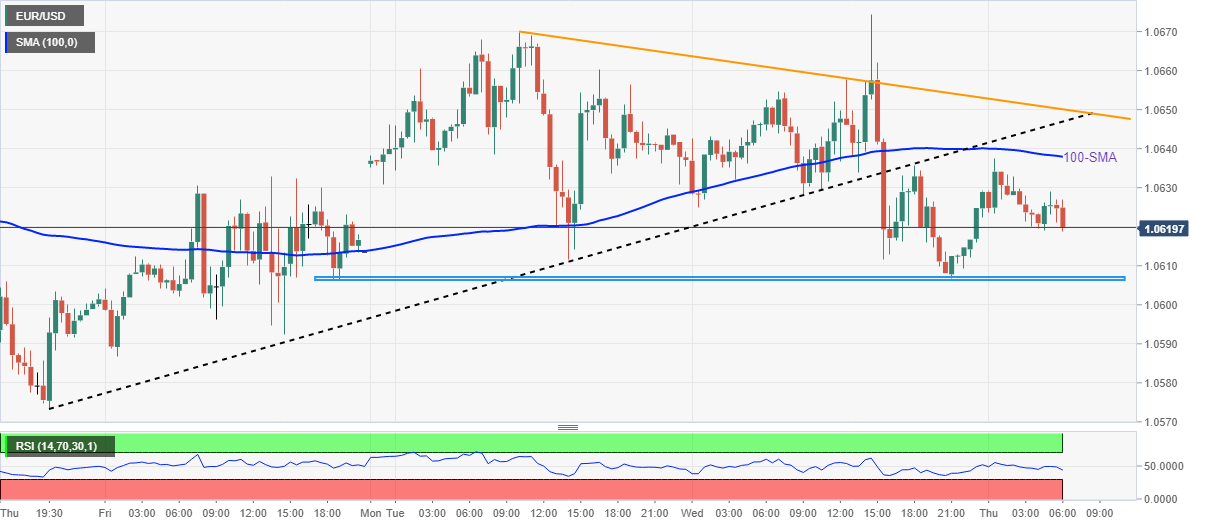
Trend: Further downside expected
-
06:21
EUR/CHF seen lower at 0.9200 by end-2023 – JP Morgan
Analysts at JP Morgan offer a negative outlook for EUR/CHF for the year 2023, with a target of 0.95 in Q1 2023 and 0.92 by the end of 2023.
Key quotes
“CHF's anti-cyclical properties and the SNB's bullish policy regime shift for the currency point to further downside for EUR/CHF into 2023.”
“The CHF remains one of the best proxies of global growth, serving as a reliable hedge against lingering downside risks to the cycle next year.”
“Real rate differentials and Switzerland's sustained current account surplus remain bullish CHF tailwinds, particularly vs. EUR.”
“Deleveraging flows should also be CHF-supportive.”
-
06:04
US Dollar Index fades upside momentum as yields retreat despite China Covid woes
- US Dollar Index snaps two-day uptrend, bounces off intraday low of late.
- US 10-year Treasury bond yields print the first intraday loss in five at 1.5-month high.
- Multiple nations announced requirement of COVID-19 tests for Chinese travelers.
- Mixed US data, lack of major catalysts triggered consolidation despite risk-off mood.
US Dollar Index (DXY) holds lower grounds despite bouncing off the intraday bottom early Thursday in Europe. In doing so, the greenback’s gauge versus the six major currencies prints the first daily loss in three around 104.32 by the press time.
DXY’s latest pullback could be linked to the market’s rush towards the Yen and Swiss Franc, as well as the Gold prices, amid sour sentiment and mostly downbeat US data. The same could be linked to the retreat in the US Treasury bond yields from a multi-day high.
That said, the benchmark US 10-year Treasury yields dropped 2.2 basis points to 3.86% by the press time, after rising the most since October 19 the previous day. With this, the key bond coupons retreat from the six-week high while snapping a four-day uptrend.
Talking about the key risk-negative headlines, fresh Covid-linked prerequisites for Chinese travelers, amid doubts over Beijing’s reporting of data and a jump in the virus numbers weigh on sentiment. On the same line could be Russia’s rejection of peace with Ukraine unless it accepts the treaty allowing additional territories, as well as an escalated war in the city of Kherson.
On Wednesday, US Pending Home Sales for November dropped to -37.8% YoY versus -36.7% expected and -37.0% previous readings while the Richmond Fed Manufacturing Index for December improved to 1.0 versus -4.0 anticipated and -9.0 prior.
Amid these plays, Wall Street closed in the red but S&P 500 Futures remain lackluster despite the downbeat performance of the Asia-Pacific shares.
Looking forward, weekly prints of the US Initial Jobless Claims and Chicago PMI for December will be eyed for short-term directions but major attention will be given to the risk catalysts and the bond market moves during the year-end inaction.
Technical analysis
US Dollar Index remains sidelined between the 21-DMA resistance and a two-week-old ascending support line, respectively near 104.60 and 104.00 by the press time.
-
06:04
WTI fails to surpass $79.00 amid uncertainty over China’s Covid situation
- Oil price has recovered to near $79.00 after a revival move amid China’s Covid-inspired uncertainty.
- The US Dollar Index slipped to near intraday low around 104.30 as investors turned anxious amid the festive mood.
- Investors are keeping an eye on the official United States oil inventory data for fresh cues.
- Oil price is at a make or a break around the upward-sloping trendline from $79.50.
West Texas Intermediate (WTI), futures on NYMEX, have reached to near $79.00 in the early European session after a firmer recovery. Earlier, the oil price witnessed a responsive buying action after a perpendicular drop to near $77.50. The oil price is highly expected to gain demand led by a sheer pace in reopening measures from the Chinese administration while the release of the official oil inventory data from the Energy Information Administration (EIA) could accelerate volatility in the black gold.
The US Dollar Index (DXY) has witnessed a steep fall after failing to surpass the crucial resistance of 104.39 as less trading activity in the global market due to the festive mood is creating ambiguity among the sentiment of the market participants. The USD Index has dropped to near its intraday low at 104.28 and is likely to dance to the tunes of macroeconomic events ahead.
Western nations announce strict measures for arrivals from China
In order to safeguard their respective economies from the Covid-19 pandemic, various nations have announced safety measures for individuals, which are arriving from China. According to CNN News, the United States will require all travelers from China to show a negative Covid test result before flying to the country, effective from January 5.
Meanwhile, Italy announced that it will commence testing all arrivals from China for Covid and urges European Union countries to follow suit, after the 50% positive test rate on China flights in Milan. Fresh concerns of the Covid situation in China are likely to keep the US Dollar Index in a positive trajectory.
The idea behind dismantling of the Covid related restrictions is to achieve the extent of economic activities recorded in the pre-pandemic period. No doubt, Covid restrictions by other nations may bring short-term pain in international trading but will be beneficial for the oil demand in the long run.
Russia bans oil supply to G7 and the European Union
After the announcement of a price cap of $60.00 per barrel on oil supply from Moscow, Russian President Vladimir Putin has announced a ban on oil supply to the G7 countries and the European Union. This has triggered the risk of lower supply against the quantity demanded, which could create a disequilibrium in the short run. Western countries announced a price cap on oil supply from Russia to restrict it from funding arms and ammunition for war against Ukraine. The ban on oil transactions will run from February 1 to July 1.
Investors await official oil stock data for further action
For further guidance, investors are awaiting the release of the oil inventory data for the week ending December 23 by the United States Energy Information Administration. On Wednesday, the American Petroleum Institute (API) reported a drawdown in the oil stockpiles straight for the second week. Oil inventory dropped by 1.3 million barrels last week. However, investors will keep an eye on official oil stock data for an informed decision. As per the projections, the oil stockpiles will drop by 1.52 million barrels.
WTI technical outlook
-638078904723456626.png)
Oil price is hovering around the upward-sloping trendline plotted from December 12 low around $79.50. The oil price is at a make or a break level, therefore investors should brace for a decisive move. The 20-and 50-period Exponential Moving Averages (EMAs) have delivered a bearish crossover at $79.36, which indicates a downside move ahead. However, the 200-period Exponential Moving Average (EMA) at $77.89 has not been surrendered yet.
Meanwhile, the Relative Strength Index (RSI) (14) is oscillating above 40.00 but a break inside the bearish range of 20.00-40.00 will trigger bearish momentum.
-
06:01
Russia S&P Global Manufacturing PMI fell from previous 53.2 to 53 in December
-
05:37
EUR/GBP walks on tight rope above 0.8800 as Covid woes join pullback in yields
- EUR/GBP struggles to extend pullback from 11-week high.
- US Treasury yields retreat from three-week top, EU bond coupons grind near 11-year high but Gilts stay depressed.
- Geopolitical fears from Russia join China Covid woes but lack of market participation, absence of major data bore momentum traders.
EUR/GBP remains sidelined around 0.8825, after reversing from a nearly two-month high the previous day, as traders seek more clues amid the market’s indecision headline into Thursday’s London open.
Even so, the cross-currency pair remains pressured as the geopolitical concerns surrounding Russia and fears of economic slowdown propel the Eurozone Treasury bond yields while the UK’s Gilts dropped to the lost levels for seven weeks.
Russia’s rejection of peace with Ukraine unless it accepts the treaty allowing additional territories joins an escalated war in the city of Kherson to weigh on the sentiment. On the same line could be the major nations’ notification to require the Covid tests for Chinese travelers amid doubts over Beijing’s reporting of data and a hidden jump in the virus numbers.
It’s worth noting, however, the comparatively stronger hawkish bias of the European Central Bank (ECB) policymakers versus the Bank of England (BOE) decision-makers challenge the EUR/GBP bears. Even so, the chatters surrounding the bloc’s recession seem to have gained more attention of late, which in turn should have recalled the bears the previous day.
Against this backdrop, the US 10-year Treasury yields dropped 2.8 basis points to 3.86% by the press time, after rising the most since October 19 the previous day. That said, the Eurozone 10-year Treasury bond yields rose to the highest levels since July 2011 before retreating to 2.51% while the UK’s 10-year Gilt coupons dropped for the third consecutive day to refresh multi-day low.
Looking forward, the EUR/GBP is likely to witness more inaction but the recent escalation in the Russia-Ukraine fight and the economic slowdown fears surrounding the bloc could weigh on the prices.
Technical analysis
Despite the failure to cross the 0.8855-65 resistance zone, comprising multiple levels marked since late September, EUR/GBP remains on the bear’s radar unless breaking the 200-DMA support, close to 0.8575 at the latest.
-
05:10
BoJ conducted unplanned bond-buying twice on Thursday
Reuters reported on Thursday that the Bank of Japan (BoJ) has announced an unplanned bond purchase operation for the second time in a day.
Earlier on, it was reported that the Japanese central bank will purchase emergency bonds.
The BoJ offered to buy unlimited amounts of two- and five-year notes at a fixed yield and also JPY 600 billion yen of one-to-10-year bonds on top of a daily offer to buy 10-year debt at 0.5%, Reuters noted.
Market reaction
USD/JPY remains little affected by the BoJ’s operations, shedding 0.60% on the day at 133.68. Risk-off flows dominate and boost the safe-haven demand for the Japanese Yen amid the end-of-the-year thin market conditions.
-
05:03
NZD/USD aims to recapture 0.6350 despite China’s Covid-inspired risk-off mood
- NZD/USD is aiming to reclaim the 0.6350 hurdle despite a solid risk-aversion theme.
- The New Zealand Dollar is holding its revival amid optimism about China’s reopening.
- Fed’s ultra-hawkish policy has resulted in a sheer decline in US Pending Home Sales data.
The NZD/USD pair has extended its recovery above 0.6320 in the Asian session. Earlier, the Kiwi asset picked up demand after dropping to near the round-level support at 0.6300. The major is expected to extend its recovery to near 0.6350 despite the risk-aversion theme in the global market.
The return on 10-year US Treasury bonds has trimmed to near 3.86% despite caution in the market led by a sheer spike in Covid-19 infections in China, however, the upside is still favored. Meanwhile, S&P500 futures are not getting decent traction from the market participants amid weak risk appetite. The US Dollar Index (DXY) is struggling to cross the critical resistance of 104.40. Ambiguity in performance from different asset classes is expected ahead as trading activity has dropped amid the festive mood.
The continuation of an ultra-hawkish monetary policy by the Federal Reserve (Fed) is significantly impacting the realty sector in the United States. On Wednesday, the National Association of Realtors published the Pending Home Sales, which declined by 4% on a monthly basis in November while the street was expecting an expansion of 0.6%. Higher interest rates by the Fed have forced households to drop the expression of buying a new home at the current juncture.
Although, risk-perceived assets are facing the heat of China’s reopening after strict Covid measures. The New Zealand Dollar is holding its revival move as ease in supply chain disruptions will increase the trading activity of New Zealand with China. It is worth noting that New Zealand is one of the leading trading partners of China.
-
05:02
USD/CAD Price Analysis: Reverse from 1.3615 resistance confluence
- USD/CAD renews intraday low while paring the biggest daily jump in a fortnight.
- Convergence of 100-SMA, previous support line from mid-November challenge upside moves.
- 200-SMA appears a tough nut to crack for the bears.
USD/CAD takes offers to refresh intraday low around 1.3580 as it pares the biggest daily gains in two weeks heading into Thursday’s European session.
In doing so, the Loonie pair extends the day-start pullback from the 1.3615 resistance confluence despite bullish MACD signals.
That said, the 200-Simple Moving Average (SMA) joins the support-turned-resistance line from November 15 to highlight the 1.3615 level as the key hurdle.
Given the quote’s recent pullback from the stated resistance, a pullback towards the mid-December swing low near 1.3520 can’t be ruled out. However, the 200-SMA level of 1.3507 and the 1.3500 round figure could challenge the USD/CAD bears afterward.
In a case where the Loonie pair drops below the 1.3500 round figure, the monthly low of 1.3385 will be in the spotlight.
Alternatively, recovery moves need to portray successful trading beyond the 1.3615 key resistance to convince the USD/CAD buyers.
Even so, a one-week-old descending trend line near 1.3655 could challenge the quote’s further upside before directing the bulls toward the monthly peak of 1.3705.
To sum up, the USD/CAD pair is likely to extend the latest weakness but the room towards the south appears limited.
USD/CAD: Four-hour chart
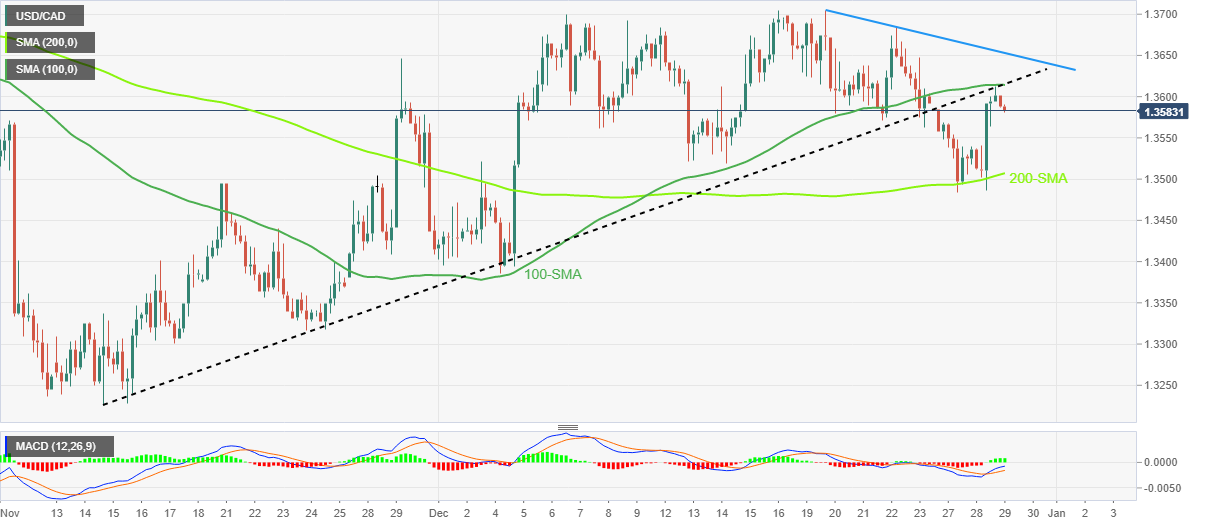
Trend: Limited downside expected
-
04:43
Asian Stock Market: China Covid concerns dent risk appetite, KOSPI leads bears
- Asia-Pacific equities print losses despite pullback in US Treasury bond yields.
- Doubts over China Covid numbers, medical facilities propel risk aversion.
- KOSPI drops the most even as South Korea promises policy support.
- BOJ’s unplanned bond operations and PBOC’s fund infusion fail to impress bulls.
Asian shares remain in the red even as the US Treasury bond yields retreat from the multi-day high during early Thursday. The reason could be linked to China-inflicted pessimism amid the year-end inaction.
While portraying the mood, the MSCI’s index of the Asia-Pacific shares outside Japan extends the previous day’s losses, down 0.95% intraday whereas Japan’s Nikkei 225 declines 1.20% on a day by the press time.
It’s worth noting that Japan conducted surprise bond buying for the second consecutive day to defend the yield curve and helped limit the recent losses of Nikkei 225.
That said, South Korea’s KOSPI prints the heaviest fall among its Asian peers, down nearly 2.0% at the latest, as Seoul promises policy support after witnessing downbeat November data that cloud the economic outlook. It should be observed that KOSPI is the weakest among the Asian equity indices when considering the year 2022 performance, down nearly 14% YoY as we write.
Multiple countries, including the US, the UK and Japan, announced requirements of Covid tests for Chinese travelers as doubts over Beijing’s reporting of data and a hidden jump in the virus numbers weigh on sentiment. On the same line could be Russia’s rejection of peace with Ukraine unless it accepts the treaty allowing additional territories, as well as an escalated war in the city of Kherson.
Amid these plays, the US 10-year Treasury yields drop 2.8 basis points to 3.858% by the press time, after rising the most since October 19 the previous day. Furthermore, S&P 500 Futures remain indecisive as downbeat bond coupons put a floor under the stock futures even as Wall Street closed in the red.
Elsewhere, the US Dollar Index (DXY) struggles to extend the two-day uptrend while the WTI crude oil price remains mildly offered during the third day of the south-run.
Looking forward, weekly prints of the US Initial Jobless Claims and Chicago PMI for December will be eyed for short-term directions.
Also read: Forex Today: Trading remains choppy ahead of year-end
-
04:25
Gold Price Forecast: XAU/USD struggles to kiss $1,810 as risk-off mood remains solid
- Gold price is struggling to surpass the crucial resistance of $1,810.00 amid a risk-off mood.
- Fresh stipulations of arrivals from China from various nations are expected to strengthen the US Dollar Index.
- A 40.00-60.00 range oscillation by the RSI (14) is hinting a consolidation ahead.
Gold price (XAU/USD) is facing barricades while attempting to surpass the immediate resistance of $1,810.00 in the Asian session. The precious metal is displaying an intraday inventory adjustment process, which is expected to display volatility expansion. The US Dollar Index (DXY) has displayed a recovery move after a steep correction to near 104.30.
It seems that fresh stipulations of arrivals from China from various nations, citing rising Covid-19 infections responsible for safety measures have improved the safe-haven’s appeal. The US Dollar Index has revived to near 104.40 and is expected to display more upside ahead. S&P500 futures are displaying a lackluster performance as trading activity is getting squeezed amid the festive season.
Meanwhile, 10-year US Treasury yields have corrected marginally to near 3.76% after a three-day rally. China’s Covid-inspired caution in the global markets has trimmed the demand for US government bonds. Going forward, investors will keep an eye on the release of the weekly Initial Jobless Claims data. For the past week, the United States economy reported an increment in fresh claims by 216K.
Gold technical analysis
On a two-hour scale, the Gold price is trading in a Rising Channel chart pattern that signals volatility contraction. The upper portion of the aforementioned chart pattern is placed from November 15 high at $1,786.55 while the lower portion is plotted from November 28 low at $1,739.82.
The precious metal has picked strength after dropping to near the 100-period Exponential Moving Average (EMA) at $1,802.20. Also, the 200-EMA at $1,793.35 is aiming higher, which indicates that the upside bias is still solid.
Meanwhile, the Relative Strength Index (RSI) (14) is oscillating in a 40.00-60.00 range, which signals that Gold price is awaiting a fresh trigger for a decisive move.
Gold two-hour chart
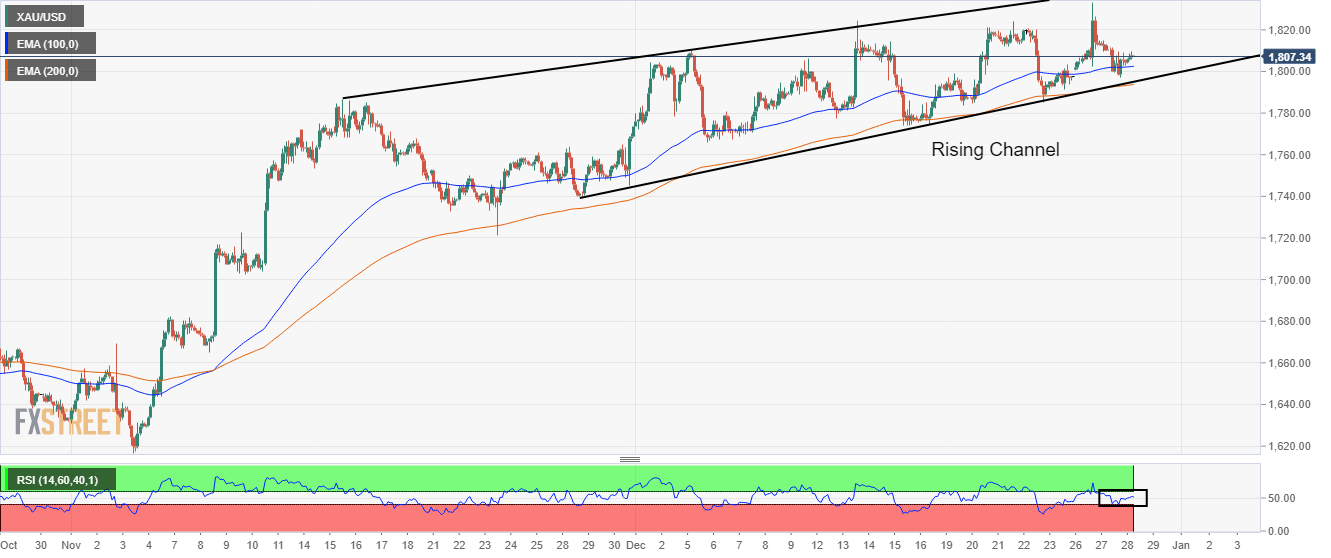
-
04:21
AUD/USD Price Analysis: Grinds near mid-0.6700s inside weekly bullish channel
- AUD/USD prints heaviest intraday gains since Friday despite recent inaction.
- Bullish chart formation, sustained trading beyond 0.6700 support confluence favor buyers.
- Multiple hurdles stand tall to test upside momentum.
AUD/USD reflects the market’s holiday mood as it treads water around 0.6750 despite posting the biggest daily gains in nearly a week during early Thursday.
In doing so, the Aussie pair seesaws inside a one-week-old ascending trend channel amid sluggish oscillators. Other than the channel formation and sluggish RSI, as well as MACD, the quote’s successful trading beyond the 0.6700 support confluence also keeps buyers hopeful.
However, 23.6% Fibonacci retracement level of the pair’s November 10 to December 13 upside, near 0.6775, guards the quote’s immediate upside.
Following that, the aforementioned channel’s upper line, around 0.6805 at the latest, could challenge the AUD/USD bulls.
In a case where the Aussie buyers cross the 0.6805 hurdle, multiple levels around 0.6820 and 0.6850 could probe the advances before highlighting the monthly peak of 0.6893 and the 0.6900 round figure.
On the flip side, pullback moves remain elusive unless the quote stays beyond the 0.6700 key support comprising the 200-Exponential Moving Average (EMA) and bottom line of the stated channel.
Should that happen, a quick fall to the monthly low marked in the last week around 0.6630 can’t be ruled out. Though, the 61.8% Fibonacci retracement level around 0.6580, also known as the “Golden Ratio”, appears a tough nut to crack for the AUD/USD bears.
AUD/USD: Four-hour chart
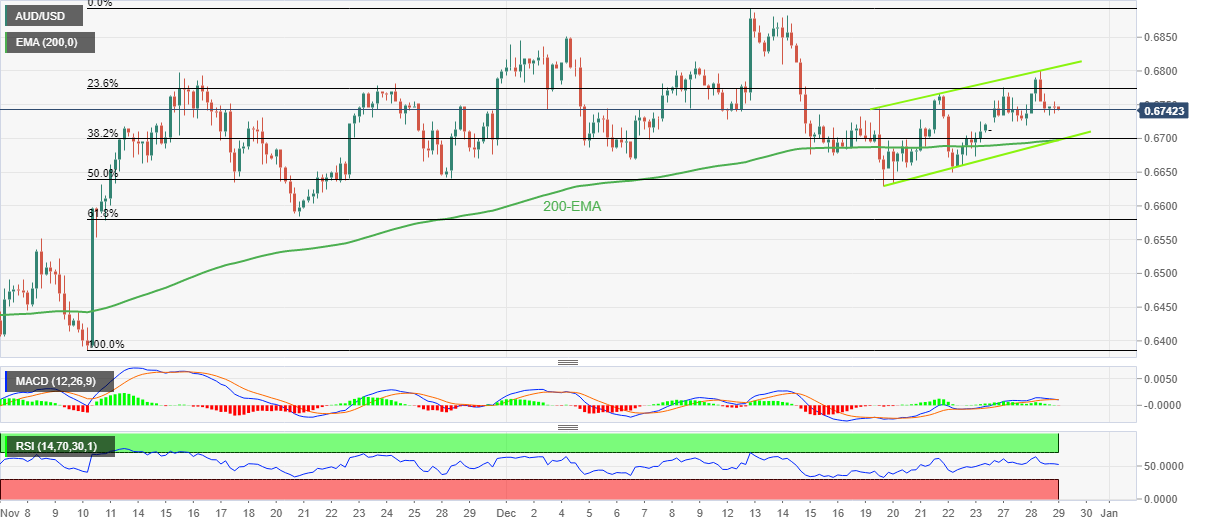
Trend: Bullish
-
03:59
USD/INR Price News: Indian Rupee drops below 83.00 amid mixed sentiment, US Dollar pullback
- USD/INR stays defensive amid sluggish markets, grinds lower of late.
- China Covid concerns weigh on risk profile in Asia but softer US Treasury yields probe Indian Rupee bears.
- India Trade Deficit for Q3, US Initial Jobless Claims eyed for fresh impulse.
USD/INR holds lower ground near 82.75 as bulls and bears jostle during Thursday’s Asian session.
The Indian Rupee (INR) pair welcomed bears the previous day but the broadly firmer US Dollar challenges the downside moves before the latest weakness, mainly due to the downbeat US Treasury yields. In doing so, the quote cheers softer Oil prices amid lackluster trading days through the end of 2022.
That said, the US 10-year Treasury yields drop 2.8 basis points to 3.858% by the press time, after rising the most since October 19 the previous day. The pullback in the benchmark US bond coupons from a three-week high also weighs on the US Dollar Index (DXY), down 0.15% intraday near 104.35 by the press time.
It’s worth noting, however, that the sour sentiment in the Asia-Pacific markets, mainly due to China-linked Covid woes, seems to challenge the USD/INR bears. On the contrary, WTI crude oil’s weakness allows the Indian Rupee (INR) to remain firmer, due to India’s reliance on energy imports.
Multiple countries, including India, announced requirements of Covid tests for Chinese travelers as doubts over Beijing’s reporting of data and a hidden jump in the virus numbers weigh on sentiment. On the same line could be Russia’s rejection of peace with Ukraine unless it accepts the treaty allowing additional territories, as well as an escalated war in the city of Kherson.
Against this backdrop, MSCI’s Index of Asia-Pacific outside Japan extend the previous day’s losses while India’s BSE Sensex drops half a percent at the latest.
Moving on, the India Trade Deficit for the third quarter (Q3) will precede Infrastructure Output for November to direct short-term USD/INR moves. On the other hand, weekly prints of the US Initial Jobless Claims and Chicago PMI for December will be eyed for short-term directions. Overall, the year-end inaction could allow the pair to consolidate the monthly gains.
Technical analysis
Although multiple failures to cross the 83.00 hurdle on a daily closing basis keep USD/INR bears hopeful, the 21-DMA support restricts the immediate downside of the pair to around 82.45.
-
03:48
EUR/USD drops to near 1.0620 as nations favor safety measures for arrivals from China
- EUR/USD is facing pressure as fresh Covid measures taken by various nations for arrivals from China trigger volatility.
- Absence of recovery signs from S&P500 futures after a two-day sell-off portraying risk-off mood.
- The United States will require all travelers from China to show a negative Covid report, effective from next week.
The EUR/USD pair has sensed heat after a rebound move to near 1.0637 in the Asian session. The major currency pair has dropped marginally around 1.0620 as the risk-off impulse has regained traction after various nations announced the requirement for negative Covid-19 test reports of arrivals from China. This is expected to escalate supply chain disruptions as China is a leading trading partner with various nations in the world.
The US Dollar Index has turned sideways in a range of 104.26-104.40 after a correction in the early trade from a four-day high around 104.56. Meanwhile, S&P500 futures have not displayed any recovery move after a two-day sell-off, portraying a risk-aversion theme underpinned by the market participants. The return on the 10-year US Treasury bonds is facing pressure and has dropped to near 3.86%.
The pace of reopening of the Chinese economy adopted by the respective administration has spiked the number of infections, which has dismantled the idea of easing supply chain disruptions. According to CNN News, the United States will require all travelers from China to show a negative Covid test result before flying to the country, effective from January 5.
Meanwhile, Italy announced that it will commence testing all arrivals from China for Covid and urges European Union countries to follow suit, after the 50% positive test rate on China flights in Milan. Fresh concerns about the Covid situation in China are likely to keep the US Dollar Index on a positive trajectory.
On the Eurozone front, the trading bloc is concluding the CY2022 on a high inflation note, which will keep the European Central Bank (ECB) policymakers busy in finding ways to tame the Consumer Price Index (CPI). This week, ECB Governing Council member, as well as Dutch Governor, Klaas Knot warned for more policy tightening in the five policy meetings between now and July 2023 to contain firmer inflation. He further added that ‘The risk of us doing too little is still the bigger risk’.
-
03:25
Japan’s MOF gives BoJ specific instructions for FX intervention – Goldman Sachs
Analysts at Goldman Sachs explain the process of how the forex market intervention is conducted by the Japanese authorities.
Key quotes
FX intervention is carried out under the authority of the Ministry of Finance (MOF).
The BoJ conducts FX interventions on behalf of and at the instruction of the MOF. The Foreign Exchange Fund Special Account (FEFSA), which falls under the jurisdiction of the MOF, is used for interventions. The MOF gives the BoJ specific instructions for FX intervention based on relevant market information provided by the BoJ.
Related reads
- USD/JPY Price Analysis: Bears smash weekly support line to aim for further downside below 134.00
- US Dollar Direction in 2023: Ranking of seven currencies and their drivers
-
03:15
GBP/USD Price Analysis: Ascending Triangle indicates consolidation ahead
- No revival in S&P500 futures is portraying a broader risk-off mood.
- Auctioning in a Descending Triangle chart pattern indicates volatility contraction.
- Cable is struggling to shift its auction profile above the 20-period EMA at around 1.2038.
The GBP/USD pair is struggling to extend its recovery above the immediate resistance of 1.2050 in the Tokyo session. The Cable attempted a rebound in Tokyo as the risk-off mood eased after investors started shrugging off uncertainty about a spike in Covid-19 cases in China.
Meanwhile, the US Dollar Index (DXY) is gauging a cushion after a correction from the four-day high at 104.56. S&P500 futures have failed to find a recovery, portraying a risk-aversion theme in the broader market. While the 10-year US Treasury yields have extended their losses below 3.86%.
Broadly, the Cable is trading in a Descending Triangle chart pattern, which indicates a volatility contraction on an hourly scale. The Pound Sterling witnessed demand after dropping to near the horizontal support of the aforementioned chart pattern placed from December 22 low at 1.1992. And, the downward-sloping trendline is plotted from December 19 high at 1.2242.
The Cable is struggling to shift its auction profile above the 20-period Exponential Moving Average (EMA) at around 1.2038.
Meanwhile, the Relative Strength Index (RSI) (14) is oscillating in a 40.00-60.00 range, which indicates that the Cable is awaiting a fresh trigger.
Should the Cable surpasses December 27 high at 1.2112 decisively, Pound Sterling bulls will drive the asset toward December 21 high at 1.2189 followed by December 19 high at 1.2242.
On the flip side, a decisive downside below December 22 low at 1.1992 will trigger a breakdown of the Descending Triangle and will drag the Cable toward November 29 low at 1.1940. A slippage below the latter will expose the Cable for more weakness toward November 30 low around 1.1900.
GBP/USD hourly chart

-
03:10
Yuan could rise to 6.6 against US Dollar in 2023 – China Press
Citing analysts, 21st Century Business Herald reported on Thursday, “the yuan is expected to rise by about 5% to reach about 6.6 against the US dollar next year as the Federal Reserve may end its rate hikes around mid-2023 as US inflation cools, and as China's GDP rebounds on reopening.”
Additional quotes
“It is possible the yuan may fluctuate around 7 in the first half of 2023 as US interest rates may still rise and support the US Dollar Index.”
“It is not recommended to bet on the one-way appreciation of yuan, as the currency may also be impacted by Sino-US relations, the global geopolitical situation and domestic real estate market.”
-
02:51
USD/CHF slides towards 0.9250 as US Dollar traces softer yields amid sluggish markets
- USD/CHF prints three-day losing streak, renews intraday low of late.
- Swiss ZEW Survey – Expectations improved in December to -42.8.
- Lack of market’s confidence in the US Dollar’s recovery favors bears amid mostly downbeat sentiment.
- Yields refreshed multi-day top on China, Russia concerns before easing amid a lackluster trading session.
USD/CHF takes offers to refresh intraday low around 0.9267 as it cheers the US Dollar pullback amid inactive markets during the holiday season. In doing so, the Swiss currency (CHF) pair fails to justify the previous day’s Doji candlestick amid firmer Swiss ZEW Survey numbers for December.
As per the latest Swiss ZEW Survey – Expectations, the sentiment gauge improved in December to -42.8 versus the -50.5 forecasts and -57.5 previous readings. On the other hand, US Pending Home Sales for November dropped to -37.8% YoY versus -36.7% expected and -37.0% prior while Richmond Fed Manufacturing Index for December improved to 1.0 versus -4.0 anticipated and -9.0 prior.
Also weighing on the quote could be the latest retreat in the US Treasury yields, which in turn weigh on the US Dollar. That said, the US 10-year Treasury yields drop 2.8 basis points to 3.858% by the press time, after rising the most since October 19 the previous day.
While the market’s consolidation and a lack of major data could be held responsible for the USD/CHF pair’s latest weakness, the Swiss Franc’s (CHF) safe-haven appeal and recently firmer data seem to favor the bears amid receding hawkish bias over the Fed.
That said, news from Reuters suggesting inconsistent virus details from Beijing and multiple economies announcing fresh testing requirements from China previously weighed on the market sentiment and propelled the US Treasury yields. “China reported three new COVID-related deaths for Tuesday, up from one for Monday - numbers that are inconsistent with what funeral parlors are reporting, as well as with the experience of much less populous countries after they re-opened,” reported Reuters.
Additionally challenging the risk takers is Russia’s rejection of peace with Ukraine unless it accepts the treaty allowing additional territories, as well as an escalated war in the city of Kherson.
Against this backdrop, stocks in the Asia-Pacific region trade mixed while the S&P 500 Futures print mild gains, despite the downbeat closing of the Wall Street benchmarks.
Moving on, the USD/CHF pair may witness the continuation of the latest moves amid a likely absence of major data/events. Even so, the US Initial Jobless Claims, Treasury yields and headlines surrounding Russia, as well as China, should be eyed for intraday directions.
Technical analysis
Wednesday’s Doji candlestick and a two-week-old ascending support line, close to 0.9235 by the press time, challenge USD/CHF bears. Recovery moves, however, remain elusive unless crossing the 21-DMA hurdle surrounding 0.9330.
-
02:27
USD/JPY Price Analysis: Bears smash weekly support line to aim for further downside below 134.00
- USD/JPY takes offers to refresh intraday low, snaps six-day uptrend.
- Failure to stay beyond 200-HMA joins RSI retreat to break the key support line from December 20.
- 100-HMA could probe the bears before directing them to the monthly low.
- Buyers need validation from the recent swing high surrounding 134.50 to retake control.
USD/JPY stands on the slippery ground near 133.65 as it renews its intraday low during the first negative daily performance in seven.
In doing so, the Yen pair breaks the seven-day-old ascending trend line to welcome the bears.
It should be noted that the multiple failures to stay beyond the 200-HMA join the RSI (14) pullback from the overbought territory to allow the USD/JPY pair to remain on the bear’s radar.
However, the 100-HMA support, around 133.00 by the press time, challenges the USD/JPY pair’s immediate downside, a break of which could quickly drag the quote towards the multi-month low marked earlier in December around 130.60-55.
In a case where the USD/JPY pair remains weak past 130.55, the August monthly low near 130.40 and the 130.00 round figure could probe the quote’s further downside.
Alternatively, a convergence of the 200-HMA and the support-turned-resistance line, around 133.95, quickly followed by the 134.00 round figure, guards the USD/JPY pair’s immediate upside.
Following that, the recent top surrounding 134.50 to act as the last defense of USD/JPY bears.
USD/JPY: Hourly chart
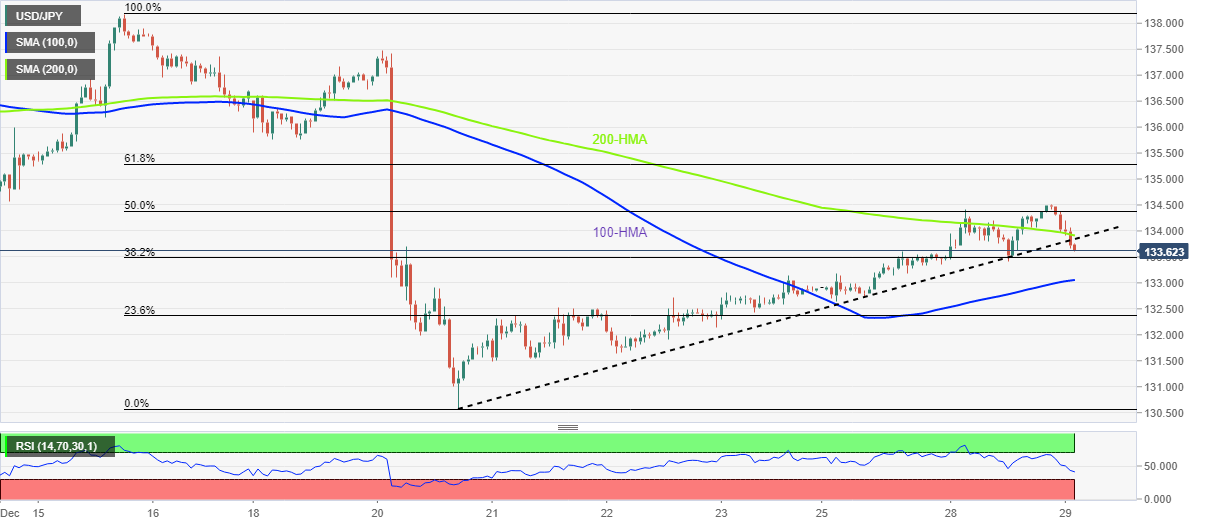
Trend: Further downside expected
-
02:18
Covid Update: US, UK, Italy and S. Korea announce restrictions on arrivals from China
As China re-opens its economy after three years of isolation notwithstanding the continued surged in COVID-19 cases, the rest of the world is bringing back restrictions on all arrivals from China.
According to CNN News, the US will require all travelers from China to show a negative Covid test result before flying to the country, effective from January 5.
Meanwhile, Italy announced that it will commence testing all arrivals from China for Covid and urges European Union countries to follow suit, after the 50% positive test rate on China flights in Milan.
The Chosun Ilbo, a South Korean daily, reported that Covid tests may be required for Chinese visitors to South Korea.
more to come ....
-
02:06
USD/CAD pares the biggest daily jump in two weeks near 1.3600 despite sluggish Oil price
- USD/CAD prints mild losses, holds lower ground near intraday bottom of late.
- WTI crude oil bears struggle for clear directions amid holiday mood, mixed sentiment.
- US Dollar traces a retreat in the US Treasury yields amid inactive markets.
USD/CAD remains depressed around the intraday low of 1.3588 amid the quiet markets during early Thursday.
In doing so, the Loonie pair consolidates the biggest daily gains in a fortnight as the US Treasury yields weigh on the US Dollar. That said, the softer prices of WTI crude oil, Canada’s key export item, join the market’s mixed mood to restrict the quote’s immediate downside.
USD/CAD jumped the most in two weeks the previous day as doubts over China’s Covid statistics and methods of unlock seem to have challenged the previous optimism.
News from Reuters suggesting inconsistent virus details from Beijing and multiple economies announcing fresh testing requirements from China previously weighed on the market sentiment and propelled the US Treasury yields. “China reported three new COVID-related deaths for Tuesday, up from one for Monday - numbers that are inconsistent with what funeral parlors are reporting, as well as with the experience of much less populous countries after they re-opened,” reported Reuters.
Recently the UK joined the line of the US South Korea, Japan, Taiwan, Italy and India to unveil fresh Covid test requirements for visitors from China.
On the other hand, Russia’s rejection of peace with Ukraine unless it accepts the treaty allowing additional territories to join Moscow weighs on the market sentiment and defends the USD/CAD bulls, despite the latest pullback.
Elsewhere, WTI crude oil prints 0.30% intraday losses around $78.50, falling for the third consecutive day, as demand fears due to China-linked headlines join Russia’s inability to highlight the supply crunch woes.
Amid these plays, the S&P 500 Futures seesaw around 3,810 whereas the US 10-year Treasury yield makes rounds to 3.87% after rising the most since October 19 the previous day.
Looking forward, risk catalysts will be more important for clear directions while US Initial Jobless Claims will decorate the economic calendar.
Technical analysis
USD/CAD takes a U-turn from the previous support line stretched from mid-November, around 1.3615 by the press time. However, the 50-DMA level of 1.3530 acts as the short-term key support.
-
01:37
Gold Price Forecast: XAU/USD remains sideways above $1,800 despite a rebound in risk-on profile
- Gold price is still sideways above $1,800.00 despite a gradual recovery in the risk-appetite theme.
- The US Dollar Index has dropped sharply below 104.30 after recording a fresh four-day high of 104.56.
- Federal Reserve’s higher interest rates have resulted in a decline in Pending Home Sales.
Gold price (XAU/USD) is displaying back-and-forth moves marginally above the psychological resistance of $1,800.00 in the Asian session. The precious metal is displaying a lackluster performance despite a correction in the US Dollar Index (DXY) in the early trade. The US Dollar Index has slipped firmly below 104.30 after recording a fresh four-day high of 104.56 on Wednesday.
Meanwhile, S&P500 futures are delivering hopes of revival after a two-day sell-off. Also, risk-perceived currencies are regaining traction as investors are shrugging-off uncertainty about a spike in Covid-19 cases in China. The 10-year US Treasury yields have trimmed to near 3.86%, following the footprints of the US Dollar Index.
Amidst the festive week, the economic calendar has nothing firm to offer, however, the release of the United States Pending Home Sales data on Wednesday has displayed the consequences of higher interest rates by the Federal Reserve (Fed). The economic data dropped by 4% to its lowest in 20 years on a monthly basis for November as transactions dropped after the Fed pushed the interest rate to 4.5%.
Gold technical analysis
Gold price is auctioning in a neutral channel on a two-hour scale that indicates a volatility contraction due to the absence of critical economic events. The precious metal has picked strength after dropping to near the 100-period Exponential Moving Average (EMA) at $1,802.20. Also, the 200-EMA at $1,793.35 is aiming higher, which indicates that the upside bias is still solid.
Meanwhile, the Relative Strength Index (RSI) (14) is oscillating in a 40.00-60.00 range, which signals that the Gold price is awaiting a fresh trigger for a decisive move.
Gold two-hour chart
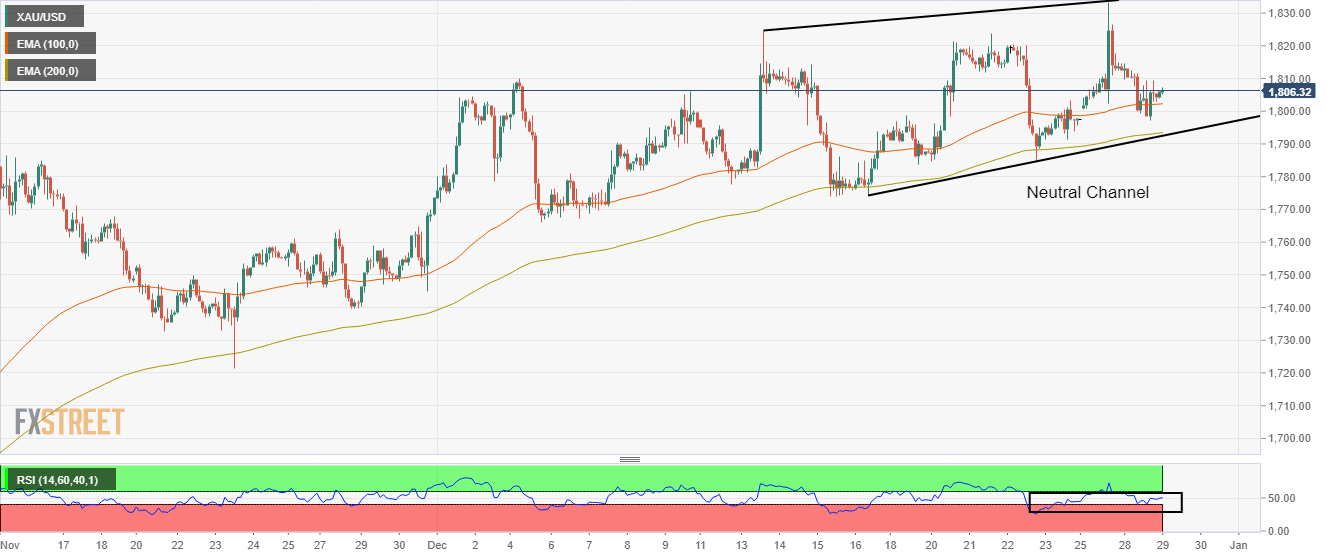
-
01:35
EUR/USD Price Analysis: Fades bounce off 10-day EMA below 1.0680 hurdle
- EUR/USD struggles near daily top, prints the biggest intraday gains in two weeks.
- Bearish MACD signals, nearly overbought RSI conditions challenge buyers.
- 12-day-old horizontal resistance probe immediate upside, ascending trend line from November 21 puts a floor under the price.
EUR/USD bulls step back as the quote reverses from the intraday high to 1.0630 during early Thursday. Even so, the major currency pair prints the biggest daily gains in two weeks by the press time, up 0.20% intraday at the latest.
It’s worth noting that the 10-day Exponential Moving Average (EMA) puts a floor under the EUR/USD prices to around 1.0610.
However, the bearish MACD signals and the nearly overbought conditions of the RSI (14) keep the pair sellers hopeful.
That said, the 1.0600 round figure and an upward-sloping support line from November 21, close to 1.0500 by the press time, challenge the EUR/USD declines past the 10-day EMA level surrounding 1.0610.
In a case where the EUR/USD remains bearish past 1.0500, the odds of witnessing a slump towards the late November swing low near 1.0290 can’t be ruled out.
On the flip side, a two-week-old horizontal resistance area surrounding 1.0675-80 restricts the short-term EUR/USD upside before directing the bulls toward the monthly peak of 1.0736. Should the quote remains firmer past 1.0736, May’s peak of 1.0786 will be in focus.
Overall, EUR/USD remains on the bear’s radar despite multiple bounces off the 10-day EMA.
EUR/USD: Daily chart
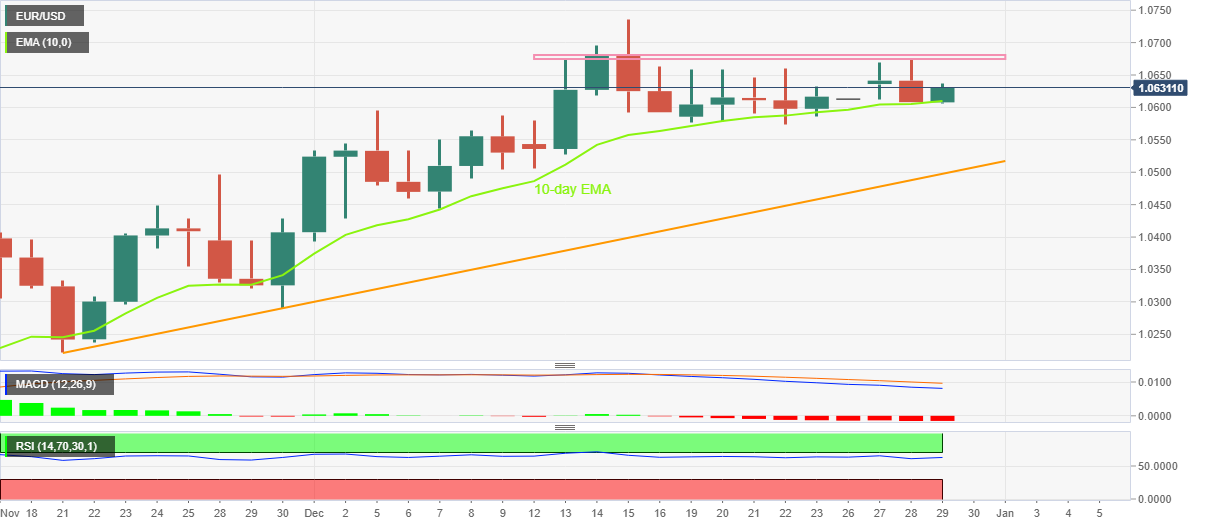
Trend: Pullback expected
-
01:16
PBOC sets USD/CNY reference rate at 6.9793 vs. 6.9681 previous
On Thursday, the People’s Bank of China (PBOC) set the USD/CNY central rate at 6.9793 versus Wednesday's fix of 6.9681 and market expectations of 6.9791. That said, the PBOC also announced a 5 billion Yuan of 3-month bill swap earlier in the day.
“With 4 billion Yuan worth of reverse repos maturing on Thursday, China central bank injects 201 billion Yuan on a net basis on the day,” mentioned Reuters.
It's worth noting that the USD/CNY closed near 6.9780 the previous day, marching towards 6.9800 by the press time.
About the fix
China maintains strict control of the yuan’s rate on the mainland.
The onshore yuan (CNY) differs from the offshore one (CNH) in trading restrictions, this last one is not as tightly controlled.
Each morning, the People’s Bank of China (PBOC) sets a so-called daily midpoint fix, based on the yuan’s previous day's closing level and quotations taken from the inter-bank dealer.
-
01:11
GBP/USD Price Analysis: Pound Sterling defends 1.2000 as risk-off mood eases
- An ease in the risk aversion theme has led to a rebound in the Cable.
- The Pound Sterling has recovered to near the 20-EMA around 1.2038.
- The formation of a Descending Triangle pattern indicates a consolidation broadly.
The GBP/USD pair is displaying a confident recovery after dropping to near 1.2005 in the early Asian session. The Cable has extended its rebound move to near 1.2034 but is expected to remain volatile as the overall sentiment is still risk-averse.
The US Dollar Index (DXY) has witnessed a correction to near 104.35 as the festive mood is keeping the asset inside the woods on a broader note. Also, the 10-year US Treasury yields have witnessed a gradual selling pressure to near 3.87%.
On an hourly scale, the Cable is auctioning in a Descending Triangle chart pattern, which indicates a volatility contraction. The Pound Sterling has sensed buying interest after dropping to near the horizontal support of the aforementioned chart pattern placed from December 22 low at 1.1992. While the downward-sloping trendline is plotted from December 19 high at 1.2242.
Cable has also challenged the 20-period Exponential Moving Average (EMA) at around 1.2038, which indicates that the short-term trend is turning bullish.
Meanwhile, the Relative Strength Index (RSI) (14) is oscillating in a 40.00-60.00 range, which indicates a consolidation head.
Should the Cable break above December 27 high at 1.2112, Pound Sterling bulls will drive the asset toward December 21 high at 1.2189 followed by December 19 high at 1.2242.
On the flip side, a decisive downside below December 22 low at 1.1992 will trigger a breakdown of the Descending Triangle and will drag the Cable toward November 29 low at 1.1940. A slippage below the latter will expose the Cable for more weakness toward November 30 low around 1.1900.
GBP/USD hourly chart

-
00:57
AUD/USD bulls take a breather around 0.6750 amid doubts on China Covid conditions
- AUD/USD struggles to defend recent gains, retreats from intraday high of late.
- Multiple countries announced special tests for visitors from China amid skepticism over COVID-19 conditions in Beijing.
- Yields portray recession woes, geopolitical headlines add strength to the market fears but holiday season restricts Aussie moves.
AUD/USD treads water around 0.6750 as it reassesses the optimism surrounding China’s unlock amid Thursday’s sluggish session. Also challenging the Aussie pair buyers during the second positive day are the fears emanating from Russia and upbeat US Treasury yields.
Although the dragon nation announced multiple measures to convince the markets of its ability to overcome the Covid-led economic woes, doubts over Beijing statistics and methods of unlock seem to have challenged the previous optimism. News from Reuters suggesting inconsistent virus details from Beijing and multiple economies announcing fresh testing requirements from China previously weighed on the market sentiment and propelled the US Treasury yields. “China reported three new COVID-related deaths for Tuesday, up from one for Monday - numbers that are inconsistent with what funeral parlors are reporting, as well as with the experience of much less populous countries after they re-opened,” reported Reuters.
That said, the US, South Korea, Japan, Taiwan, Italy and India all of them have recently announced fresh Covid test requirements for visitors from China. Even so, Australia kept the previous policies requiring no extra tests for Chinese travelers.
It should be noted that Russia’s rejection of peace with Ukraine unless it accepts the treaty allowing additional territories joining Moscow weigh on the market sentiment and the AUD/USD prices. On the same line could be the news suggesting Russian forces increased mortar and artillery attacks on the city of Kherson more than six weeks after it was retaken by Ukrainian troops, while also exerting pressure along frontlines in the east, per Reuters.
However, the year-end holiday mood and a light calendar restrict the AUD/USD pair’s immediate moves. While portraying the market conditions, the S&P 500 Futures seesaw around 3,810 whereas the US 10-year Treasury yield makes rounds to 3.87% after rising the most since October 19 the previous day.
To sum up, the AUD/USD strength appears doubtful amid multiple negatives to the sentiment and hence risk catalysts will be important to watch for fresh impulse. Additionally, US Initial Jobless Claims will decorate the economic calendar and should be eyed for extra directions.
Technical analysis
Multiple Doji candlesticks in the last few days suggest indecision of the AUD/USD traders. As a result, sustained trading beyond the 21-DMA hurdle surrounding 0.6740 becomes necessary for the bulls to keep the reins.
-
00:41
NZD/USD Price Analysis: Further upside remains elusive below 0.6365 support-turned-resistance
- NZD/USD struggles to defend two-day uptrend, seesaws around intraday high.
- Bearish MACD signals, sustained trading below 21-DMA keep sellers hopeful.
- One-month-old ascending trend line restricts immediate downside before the monthly low.
NZD/USD makes rounds to 0.6320 while printing mild gains for the second consecutive day during early Thursday.
In doing so, the Kiwi pair defends the previous weekly rebound from a one-month-old ascending support line, as well as portrays a struggle to cross the 21-DMA hurdle amid bearish MACD signals.
In addition to the 21-DMA level surrounding 0.6350, the previous support line stretched from October 13, now resistance around 0.6365, also challenges the NZD/USD buyers.
Even if the quote crosses the 0.6365 hurdle, the 0.6400 round figure and the monthly peak of 0.6514 could restrict the pair’s further upside. It should be noted that the NZD/USD pair’s successful trading beyond 0.6515 will need validation from June’s peak of 0.6575.
Hence, multiple hurdles stand ready to challenge the Kiwi pair’s latest recovery.
On the flip side, an upward-sloping support line from late November, close to 0.6250 by the press time, restricts the immediate downside of the NZD/USD price.
Following that, the bears may aim for the monthly lows and troughs marked during late November, respectively around 0.6230 and 0.6155.
It’s worth mentioning that the multiple lows marked during mid-November, around 0.6065-60 could challenge the NZD/USD bears past 0.6155, a break of which won’t hesitate to challenge the 0.6000 psychological magnet.
NZD/USD: Daily chart
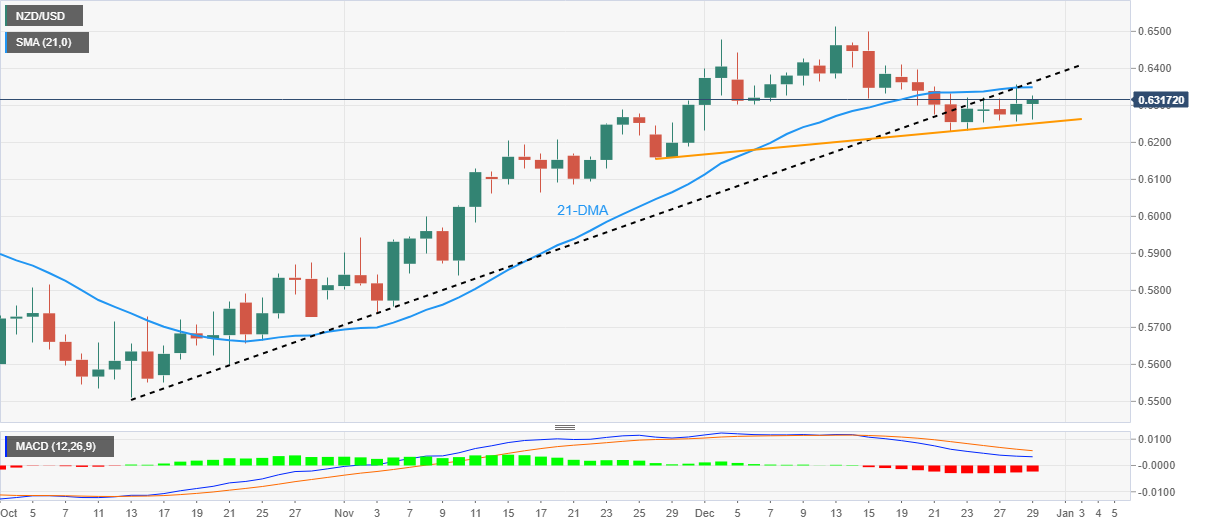
Trend: Limited upside expected
-
00:23
US Dollar Index displays a V-shape recovery to near 104.50 amid China’s Covid-inspired volatility
- The USD Index has witnessed traction amid a spike in Covid-19 cases in China.
- US Health Officials will impose mandatory COVID-19 tests on travelers from China.
- November’s Pending Home Sales showed the lowest reading in 20 years amid higher interest rates by the Fed.
The US Dollar Index (DXY) has sensed a mild selling pressure above 104.50 after a V-shape recovery move from the crucial support of 103.90. The USD Index witnessed a sheer responsive buying action after the spike in Covid-19 cases in China triggered a risk aversion theme in the global market. This led to a sheer fall in risk-sensitive assets like S&P500, which extended its downside journey with sheer momentum. While the return on 10-year US Treasury bonds climbed to 3.90%.
Risk-off triggers as China’s Covid cases spike
Chinese administration went to dismantle tight Covid-19 restrictions to reopen the economy to the fullest after levying curbs on the movement of men, materials, and machines for a longer period. The motive behind picking pace in the economy’s reopening was to ease supply chain disruptions to accelerate international trade. However, this resulted in a spike in Covid-19 infections and other countries returned to safety measures for travelers from China.
Health officials of the United States cited that the economy will impose mandatory COVID-19 tests on travelers from China, which has trimmed investors' risk appetite dramatically and has strengthened the US Dollar.
United States Pending Home Sales drop by 4%
The lack of economic data this week due to the festive mood has left a few triggers for the direction of the FX market. Therefore, investors are focusing on a handful of economic events. On Wednesday, the National Association of Realtors published the Pending Home Sales, which declined by 4% on a monthly basis in November while the street was expecting an expansion of 0.6%.
"Pending home sales in November 2022 recorded the second-lowest monthly reading in 20 years as interest rates by the Federal Reserve (Fed) have climbed to 4.5%, drastically cutting into the number of contract signings to buy a home," the National Association of Realtors said.
-
00:16
USD/JPY slides to 134.00 as US Treasury bond yields retreat
- USD/JPY takes offers to refresh intraday low, snaps one-week-old uptrend.
- US Treasury bond yields retreat from multi-day high as markets consolidate amid holiday mood.
- Fears emanating from China, Russia join BOJ’s defense of easy money policy to keep buyers hopeful.
USD/JPY reverses from the highest levels in over a week as bears cheer downbeat US Treasury yields on Thursday’s Tokyo open. In doing so, the Yen pair prints the first daily loss in seven days, refreshing its intraday low near 133.90 by the press time.
That said, the US Treasury retreat from the multi-day high as traders await more clues while consolidating the latest run-up amid sluggish markets and a light calendar. That said, US 10-year Treasury yields decline 1.3 basis points (bps) to 3.873% after rising to the highest levels since November 14 the previous day.
It should be noted that the benchmark US bond coupons marked the biggest daily jump since late October on Wednesday and allowed the US Dollar Index (DXY) to print the second daily gain, around 104.38 at the latest.
The previous run-up in the US Treasury yields could be linked to the market’s lack of confidence in China’s unlock, as well as the geopolitical woes surrounding Russia.
News from Reuters suggesting inconsistent virus details from Beijing and multiple economies announcing fresh testing requirements from China previously weighed on the market sentiment and propelled the US Treasury yields. “China reported three new COVID-related deaths for Tuesday, up from one for Monday - numbers that are inconsistent with what funeral parlors are reporting, as well as with the experience of much less populous countries after they re-opened,” reported Reuters. Further, the US, South Korea, Japan, Taiwan, Italy and India all of them have recently announced fresh Covid test requirements for visitors from China.
The latest updates from Ukrainian Military and Russian offices also portray the escalation of the geopolitical tension and propel the US Dollar’s haven demand. “Russian forces increased mortar and artillery attacks on the city of Kherson more than six weeks after it was retaken by Ukrainian troops, while also exerting pressure along frontlines in the east,” said the Ukrainian Military office per Reuters. In this regard, Russia previously stated that the only agreements that account for the four additional territories joining Russia are feasible.
Elsewhere, the Bank of Japan (BOJ) Summary of Opinions and the latest comments from BOJ Governor Haruhiko Kuroda defy hopes of the Japanese central bank’s hawkish moves and weigh on the JPY, which in turn propelled the USD/JPY prices previously.
Moving on, US Initial Jobless Claims will decorate the economic calendar but major attention should be given to the US bond market moves for fresh impulse.
Technical analysis
Despite the latest pullback, the USD/JPY pair remains firmer beyond a one-week-old ascending support line, close to 133.40, which in turn joins bullish MACD signals to favor buyers. However, a convergence of the 21-DMA and downward-sloping resistance line from late October, close to 135.10, appears a tough nut to crack for the bulls.
-
00:15
Currencies. Daily history for Wednesday, December 28, 2022
Pare Closed Change, % AUDUSD 0.67396 0.14 EURJPY 142.692 0.6 EURUSD 1.06127 -0.22 GBPJPY 161.591 0.8 GBPUSD 1.20188 0.04 NZDUSD 0.63103 0.58 USDCAD 1.36061 0.75 USDCHF 0.92892 0.21 USDJPY 134.459 0.81 -