Notícias do Mercado
-
23:54
USD/CHF Price Analysis: Fortnight-old resistance line, Doji prod bulls near 0.8950
- USD/CHF fades week-start recovery near short-term key resistance line, stays sidelined of late.
- Bearish candlestick formation, sluggish RSI also signal pullback moves.
- Convergence of 50-SMA, one-week-old ascending trend line restrict short-term downside.
- Bulls have a bumpy road to ride unless crossing 200-SMA.
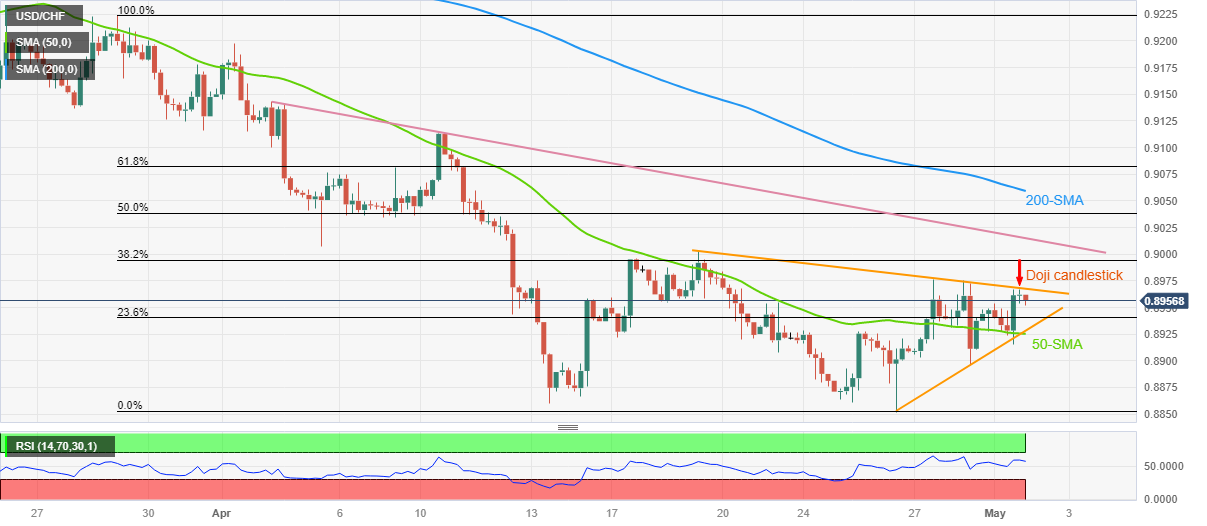
USD/CHF seesaws around 0.8950-60 following a failure to cross a two-week-old resistance line during early Tuesday. In doing so, the Swiss Franc (CHF) pair justifies the previous day’s Doji candlestick while positing mild losses near the stated price after an upward start to the week.
With this, the USD/CHF price is likely to decline towards the 0.8925-20 support confluence comprising the 50-SMA and a one-week-old ascending support line.
In a case where the USD/CHF bears keep the reins past 0.8920, the 0.8900 round figure and the previous monthly low, also the yearly low around 0.8850, will be in the spotlight.
It’s worth noting that the pair’s weakness past 0.8850 will make it vulnerable to dropping toward the year 2021 low of around 0.8755.
On the flip side, the aforementioned resistance line, near 0.8965 by the press time, precedes the late April swing high of around 0.8975 to restrict the immediate USD/CHF upside.
Following that, a one-month-old downward-sloping resistance line and the 200-SMA, respectively near 0.9015 and 0.9060, will be in the spotlight.
Overall, USD/CHF remains depressed but the bears are likely running out of steam, which in turn highlights the 0.8925-20 support confluence.
USD/CHF: Four-hour chart
Trend: Further downside expected
-
23:41
Gold Price Forecast: XAU/USD finds a cushion around $1,980, downside seems favored ahead of Fed policy
- Gold price is defending its downside around $1,980.00, downside bias is deepening ahead of Fed policy.
- US labor market conditions are expected to lose further as Morgan Stanley has announced 3K more job cuts.
- Gold price is consolidating in a Symmetrical Triangle in which volatility contracts ahead of a critical event.
Gold price (XAU/USD) is continuously defending downside around the crucial support of $1,980.00 for the past few weeks. The precious metal is prone to downside as the appeal for the US Dollar Index (DXY) is improving ahead of the interest rate decision by the Federal Reserve (Fed).
A consecutive 25 basis point (bp) interest rate hike is expected from Fed chair Jerome Powell to continue to weigh pressure on United States inflation. One more 25bp rate hike from the Fed is widely expected, however, the event that is infusing anxiety among the market participants is the interest rate guidance.
Considering recent events of declining growth rate as US Gross Domestic Product (GDP) slowed to 1.1% on a quarterly basis due to lower inventories, ISM Manufacturing PMI landed below 50.0 straight for the sixth month and a downward revision to Retail Sales indicate that the Fed would sound neutral on guidance.
Apart from that, US labor market conditions are expected to lose further as Morgan Stanley has announced a planned lay-off of 3K more jobs as deals have slumped as reported by Bloomberg.
Meanwhile, S&P500 settled Monday’s session with some losses as investors are turning cautious ahead of the interest rate policy by the Fed. The USD Index is gathering strength for breaking above the immediate resistance of 102.20.
Gold technical analysis
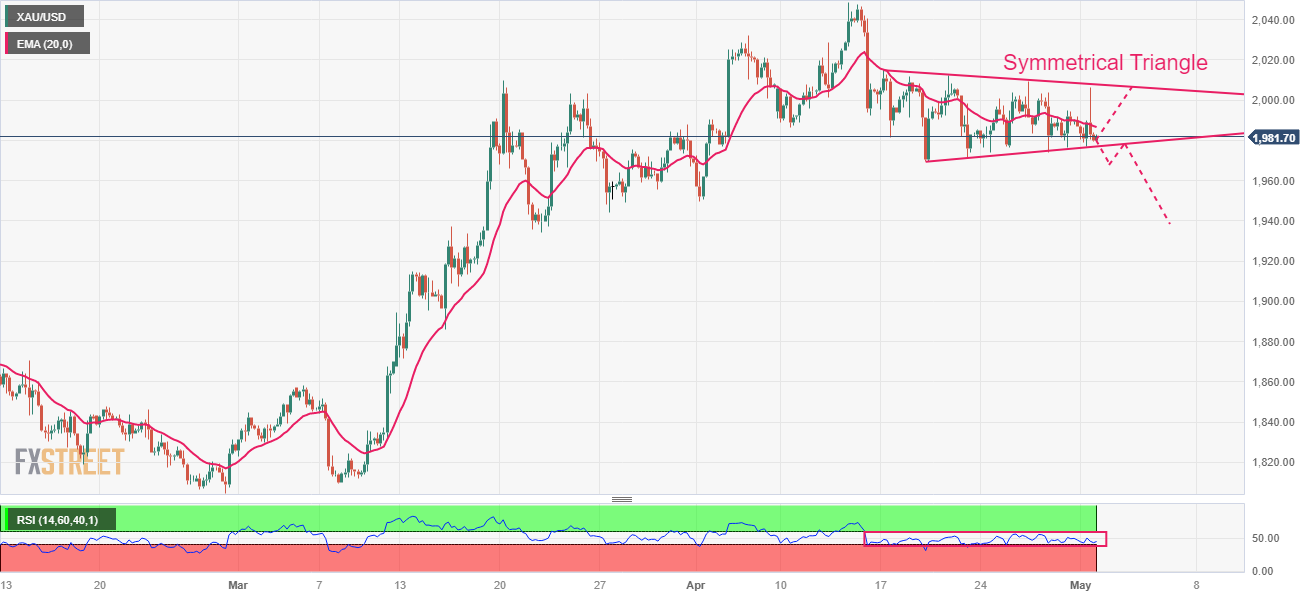
Gold price is consolidating in a Symmetrical Triangle chart pattern on a four-hour scale in which volatility contracts significantly ahead of a critical event. The upward-sloping trendline of the aforementioned pattern is plotted from April 19 low at $1,969.26 while the downward-sloping trendline is placed from April 17 high at $2,015.23.
The 20-period Exponential Moving Average (EMA) at $1,987.20 seems sticky to the Gold price, indicating a rangebound auction.
Also, the Relative Strength Index (RSI) (14) is hovering in the 40.00-60.00 range, which hints at a sheer consolidation.
Gold four-hour chart
-
23:23
US House Speaker McCarthy: The senate and the president need to get to work — and soon
US House of Representatives Speaker Kevin McCarthy crossed wires, via Reuters, early Tuesday as he said, “House republicans did their job and passed a responsible bill that raises the debt ceiling, avoids default, and tackles reckless spending.”
-
23:19
RBNZ: Not currently seeing widespread financial distress among households or businesses
“Not currently seeing widespread financial distress amongst households or businesses, which reflects the strength in the economy,” said the Reserve Bank of New Zealand (RBNZ) in its Financial Stability Report (FSR) released early Tuesday per Reuters.
Additional statements
More borrowers may fall behind on their payments this year, given the ongoing repricing of mortgages and weakening in the labor market.
Household balance sheets remain resilient in the aggregate, with most households with a mortgage still having substantial equity buffers.
Market implication
With these statements, New Zealand’s central bank repeated the previous day’s announcements and hence the RBNZ failed to impress NZD/USD traders, grinding lower around 0.6170 by the press time.
Also read: NZD/USD pressured in a firmer US Dollar environment
-
23:13
AUD/USD eases towards 0.6600 with eyes on RBA Interest Rate Decision
- AUD/USD fails to extend week-start gains, remains pressured of late.
- First Republic Bank linked improvement in market sentiment, mixed Aussie PMI allowed buyers to prepare for RBA.
- US Dollar remains firmer despite unimpressive data, cheers upbeat yields, immediate solution to banking fallout.
- RBA is expected to keep the benchmark rates unchanged, future guidance is the key.
AUD/USD remains pressured near 0.6630-25 during the early hours of Tuesday’s Asian session, after paring the daily gains amid late Monday. In doing so, the Aussie pair portrays the trader’s anxiety ahead of the Reserve Bank of Australia’s (RBA) monetary policy decision.
The Aussie pair began the week on a firmer footing despite mixed data at home and in China. However, hopes of overcoming immediate challenges to the market sentiment from the First Republic Bank (FRB), which was finally dealt with, helped the risk barometer pair to remain firmer.
On Sunday, China’s official NBS Manufacturing PMI disappointed markets with 49.2 figures for April, versus 51.4 market forecasts and 51.9 prior readings. It’s worth noting that the Non-Manufacturing PMI rose past 50.4 expected figures to 56.4 but remained below 58.4 reported in March. With the downbeat numbers from Australia’s biggest customer, as well as the banking fears, the AUD/USD pair remains pressured of late.
At home, Australia’s S&P Global Manufacturing PMI for April eased to 48.1 versus 48.0 prior while TD Securities Inflation eased to 0.2% on MoM for the said month from 0.3% but improved to 6.1% YoY from 5.7% previous.
Elsewhere, the US regulators seized assets of the FRB and sold them to the new buyer, namely JP Morgan. “JPMorgan will pay $10.6 billion to the U.S. Federal Deposit Insurance Corp (FDIC) as part of the deal to take control of most of the San Francisco-based bank's assets and get access to First Republic's coveted wealthy client base,” said Reuters.
On the other hand, US ISM Manufacturing PMI improved to 47.1 for April versus 46.3 prior and 46.6 market forecasts while the S&P Global Manufacturing PMI for the said month eased to 50.2 versus 50.4 first estimations.
It should be noted that Friday’s upbeat US inflation clues via Core PCE Price Index joined the solution on First Republic Bank to underpin the market’s optimism. The same helped the Wall Street and AUD/USD prices. Further, the US Treasury bond yields also began the key week on a positive footing and allowed the US Dollar to extend the previous gains.
Looking forward, all eyes are on the Reserve Bank of Australia’s (RBA) Interest Rate Decision even as the market players expect no change in the benchmark interest rate or other monetary policy measures. The reason could be linked to the doubts over the Aussie central bank’s interest rate peak, which some in the market expected around 3.65%, versus the 3.60% level at the latest. Hence, the rate guidance and economic forecasts will be crucial to watch for AUD/USD traders in today’s RBA announcements.
Also read: Reserve Bank of Australia Preview: No change, nothing new for the Aussie
Technical analysis
A three-week-old descending resistance line, around 0.6655 by the press time, joins bearish MACD signals to restrict short-term AUD/USD upside.
-
23:08
AUD/JPY Price Analysis: Faces resistance around 91.00, with downside risks lingering
- AUD/JPY rallies for three straight days, though tests solid resistance at around 91.00.
- Three daily closes above the 200-day EMA would cement the AUD/JPY uptrend.
- Downside risks remain if AUD/JPY drops below 91.00, which could exacerbate a fall toward 90.00.
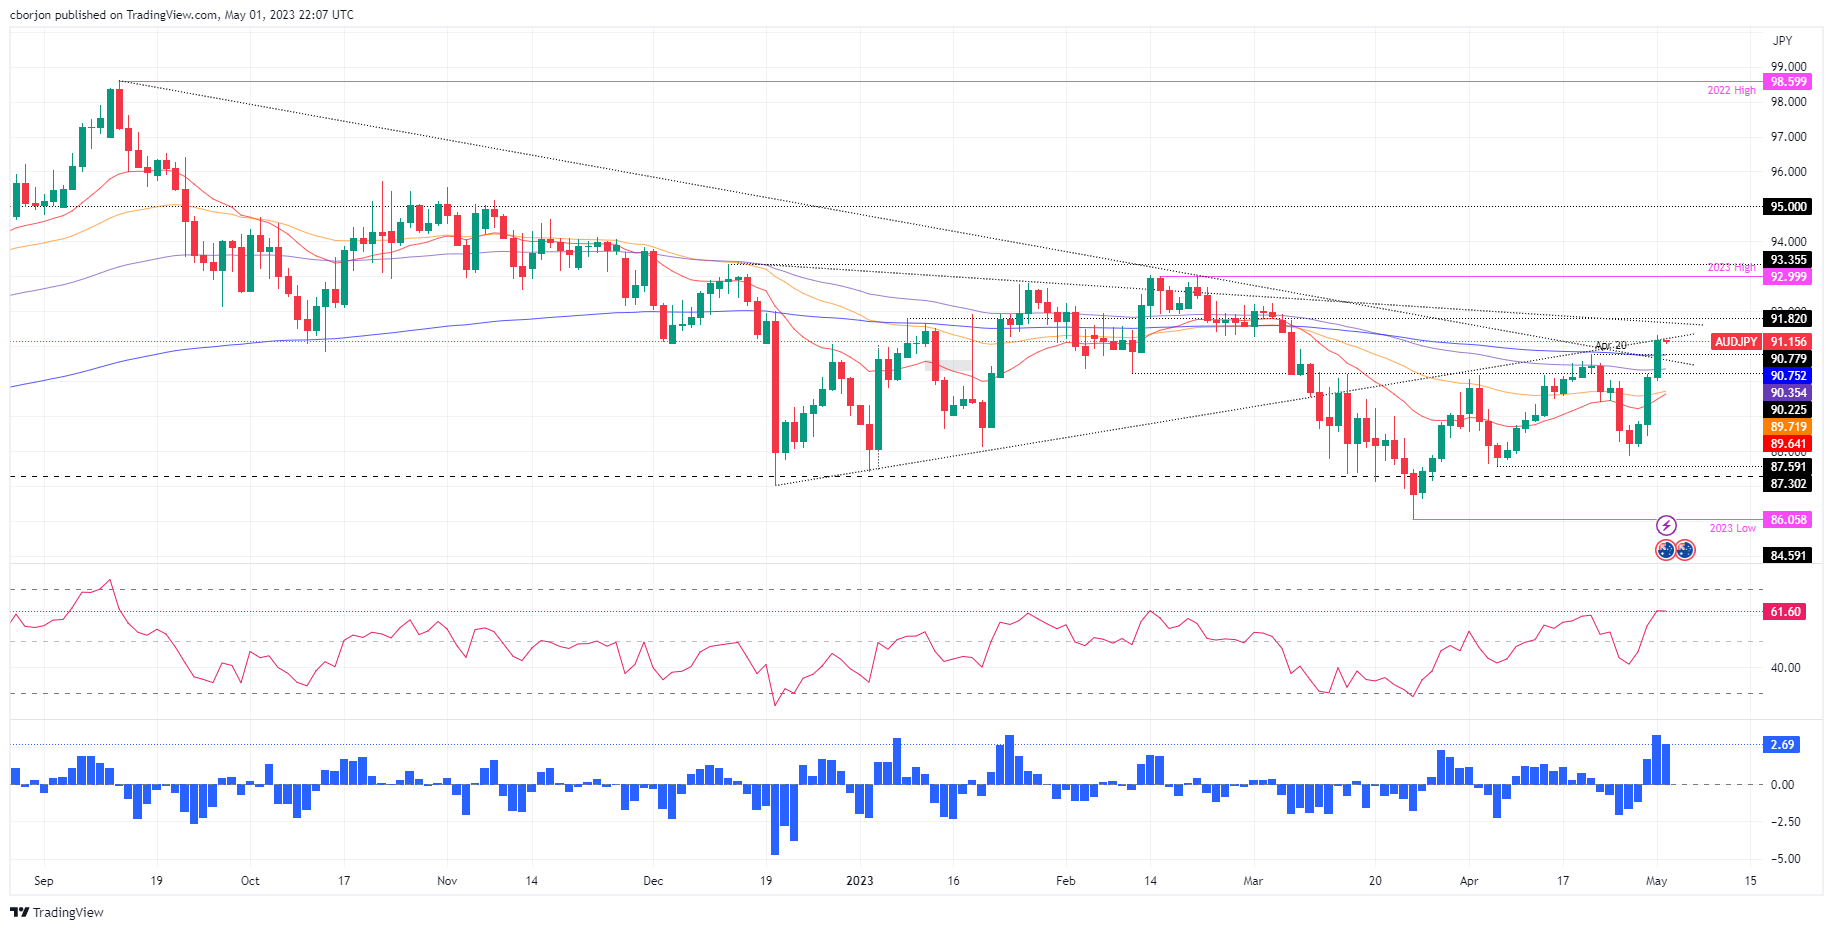
The AUD/JPY climbed above the 91.00 figure following the Bank of Japan’s (BoJ) decision last Friday to hold rates unchanged while maintaining its Yield Curve Control (YCC). Therefore, the AUD/JPY has gained since then 3.04%. As the Asian session begins, the AUD/JPY is trading at 91.14.
AUD/JPY Price Action
After clearing the latest cycle high achieved on April 20 at 90.78, the AUD/JPY extended its gains, breaking a downslope resistance trendline drawn from September 2022 highs of around 98.60. in addition, the 200-day Exponential Moving Average (EMA) at 90.75 was cleared, suggesting that the bearish bias is negated in the near term. To cement the bullish bias, the AUD/JPY must achieve three daily closes above the 200-day EMA. Once done, that could pave the way for further upside.
If AUD/JPY breaks above the January 9 daily high at 91.82, the 92.00 figure is up for grabs as buyers prepare to challenge the YTD high at 92.99.
However, if AUD/JPY tumbles below 91.00, a reversal toward the 200-day EMA at 90.75 is on the cards. If the May 1 low at 90.01 is compromised, a bearish engulfing candle pattern could form and, alongside the 200-day EMA, it could trigger a trend reversal that can challenge the YTD lows.
The next support would be the 50-day EMA at 89.71, immediately followed by the 20-day EMA at 89.64.
AUD/JPY Daily Chart
-
23:03
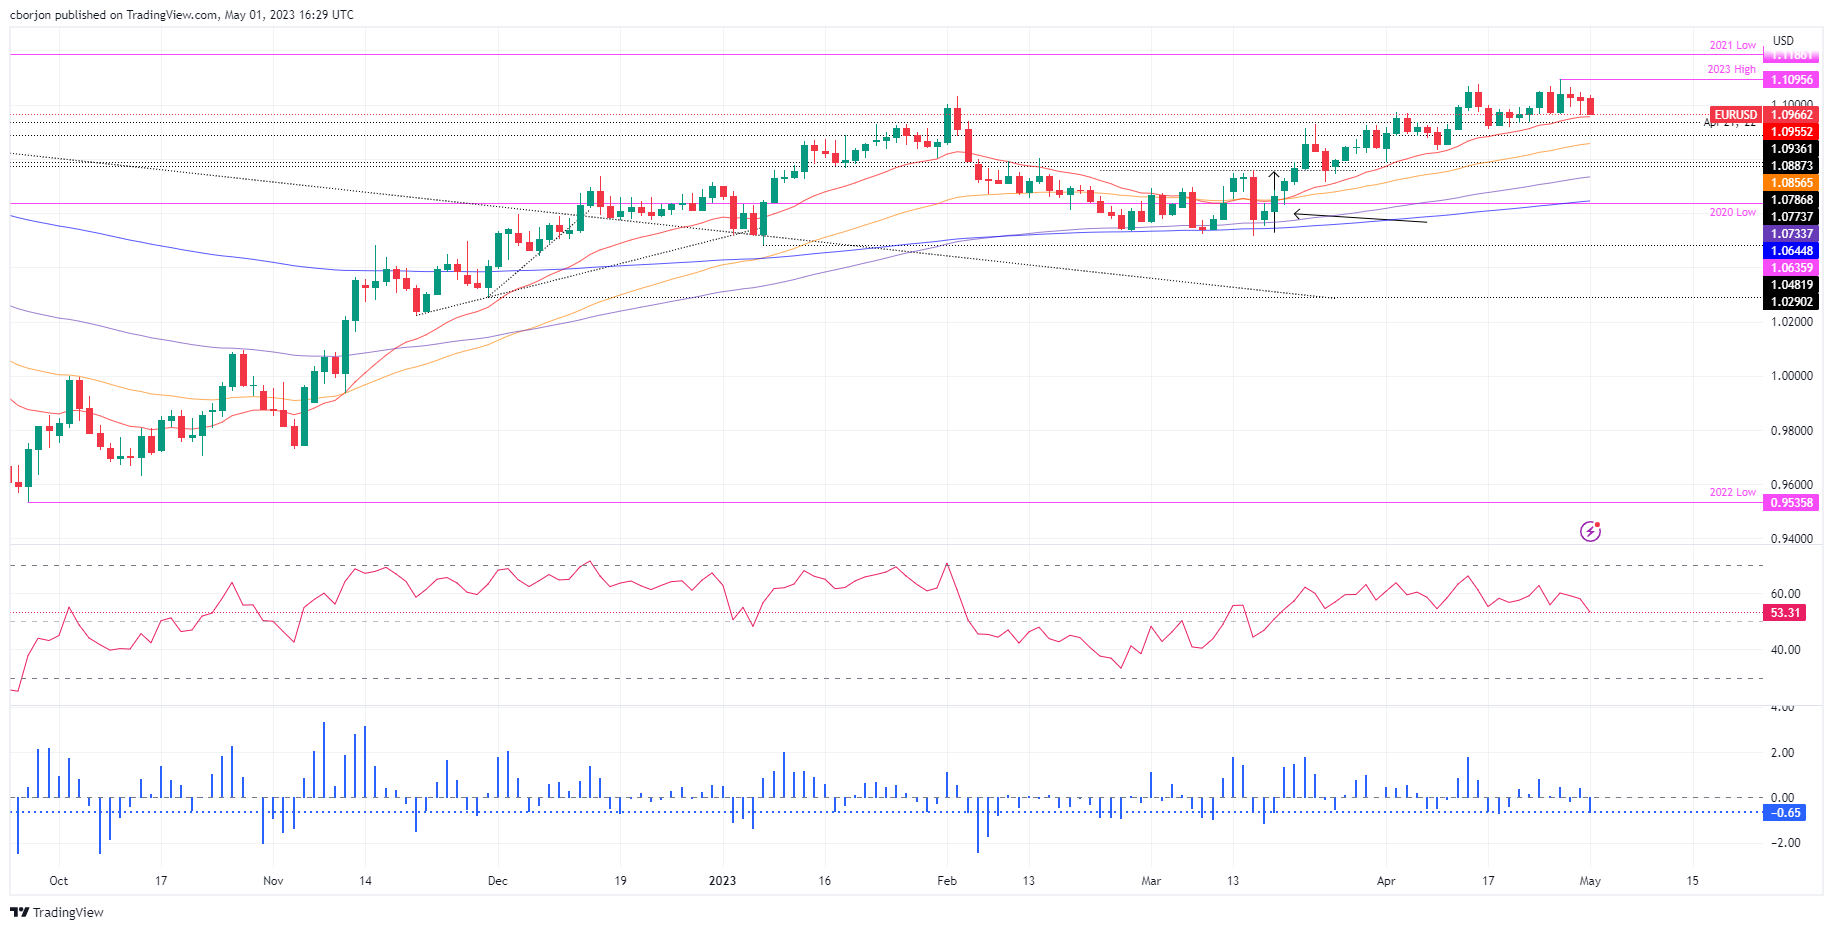
EUR/USD eyes more weakness below 1.0960 as focus shifts to Fed/ECB policy
- EUR/USD is expected to show further weakness if fails to keep the auction above 1.0960.
- S&P500 surrendered gains on settlement, portraying caution among market participants ahead of the Fed’s policy.
- US Manufacturing PMI continued to remain below the 50.0 threshold consecutively for the sixth time.
The EUR/USD pair is hovering near the eight-day-old support of 1.0960 in the early Asian session. The major currency pair is expected to display a sheer sell-off after breaking below the same. The downside bias for the shared currency pair looks solid as the US Dollar Index (DXY) is preparing for a fresh rally above 102.20 amid the monetary policy by the Federal Reserve (Fed), which will be announced on Wednesday.
S&P500 surrendered gains in the late New York session and ended Monday with some losses, portraying caution among market participants ahead of the Fed’s interest rate policy. Investors failed to capitalize on this despite easing United States banking jitters as JP Morgan buyout First Republic Bank from US regulators.
The USD Index has recaptured two-week-old resistance of 102.20 and is expected to remain in the driving seat as Fed policymakers are preparing for one more 25 basis points (bps) interest rate hike.
Meanwhile, the US ISM Manufacturing PMI (April) remained upbeat on Monday. The Manufacturing PMI continued to remain below the 50.0 threshold consecutively for the sixth month but rebounded from the annual lowest figure to 47.1. Also, New Orders Index improved to 45.7 from the consensus of 45.5.
On the Eurozone front, weak economic growth amid higher inflation is becoming a major problem for European Central Bank (ECB) policymakers. The shared continent has recorded a growth rate of 0.1% in the first quarter lower than the consensus of 0.2%.
This week, ECB President Christine Lagarde is set to raise interest rates further, however, uncertainty is building for the pace of rate hike to be opted by the central bank.
-
23:01
NZD/USD pressured in a firmer US Dollar environment
- NZD/USD bulls pressured back as US Dollar rises.
- US Dollar firms on JPMorgan Chase's takeover of First Republic Bank.
NZD/USD has been trading in a sideways fashion to start the week in choppy holiday conditions. The pair travelled between a low of 0.6161 and 0.6200.
The focus was on US and Chinese data and the calming of US regional bank jitters in the wake of the sale of First Republic Bank. JPMorgan Chase's takeover of First Republic Bank, ahead of Wednesday's policy decision by the US Federal Reserve. JPMorgan Chase has bought failed First Republic Bank's deposits and a "substantial amount of their assets and certain liabilities," JPMorgan Chase said in a press release Monday.
"Our government invited us and others to step up, and we did," JPMorgan Chase CEO Jamie Dimon said in a statement. "This acquisition modestly benefits our company overall, it is accretive to shareholders, it helps further advance our wealth strategy, and it is complementary to our existing franchise."
The US Dollar enjoyed the relief as well as ISM data surprised the upside and bond yields rose. Additionally, US construction spending increased more than expected in March. Weak economic data from China may have been a factor also with the manufacturing purchasing managers' index (PMI) declining to below contraction territory (50) with the data reading 49.2 from 51.9 in March for the world's second-biggest economy.
´´As we noted yesterday, this week is all about central banks globally and labour market data locally. And on that score, first cab off the rank is the RBA decision at 4.30pm NZT today,´´ analysts at ANZ Bank noted.
´´Almost nobody expects a hike, but many expect them in due course, and assuming we do see a pause, how the AUD (and by correlation, the NZD) react will depend on the RBA’s tone. NZ labour market data tomorrow may raise a few eyebrows for its strength, but it’s lagging data and FX markets may not give it the attention it deserves,´´ the analysts said.
Meanwhile, investors also await the Federal Reserve decision. ´´We expect a 25bp rate hike at next week's FOMC meeting and anticipate that post-meeting communication will: (i) emphasize that disinflation has been evolving slower than expected, leaving open the possibility of additional tightening, and (ii) acknowledge the more uncertain economic environment, especially with regard to credit conditions post SVB collapse,´´ analysts at TD Securities said.
-
22:21
EUR/JPY continues to rally on ECB and BoJ central bank divergence
- EUR/JPY extended its rally on central bank divergence between the ECB and the BoJ.
- BoJ’s decision to keep rates unchanged and maintain the YCC weighed on the JPY.
- Market participants estimate the ECB will raise rates by 25 or 50 bps.
The EUR/JPY remains rallying sharply to multi-year highs at 150.94, sponsored by central bank divergence, with the European Central Bank (ECB) expected to raise rates, while the Bank of Japan’s (BoJ) kept its policy unchanged. In addition, a risk-on impulse dented the appetite for safe-haven assets. At the time of writing, the EUR/JPY is trading at 150.93 after hitting a low of 150.02.
On Monday, a late risk-off impulse weighed on Wall Street as it registered minuscule losses. Last Friday, the BoJ’s decision to keep rates unchanged spurred a jump of more than 1.50%, or 240 pips, in the pair. However, the newest BoJ Governor, Kazuo Ueda, revealed that the central bank would conduct a review of its monetary policy.
Regarding its forward guidance, the BoJ removed to pledge to keep rates at “current or lower levels.” Uzeda’s added that if the central bank needs to shift policy, it will do it, regardless of finishing the review of the non-conventional use of monetary policy for 25 years.
On the ECB’s side, the ECB is expected to raise rates by 25 bps, though some ECB hawks are still pushing for a 50 bps increase. However, after Tuesday’s report of inflation in the EU, ECB policymakers would have a clearer view, alongside the release of S&P Global Manufacturing PMIs in the bloc.
TD Securities analysts estimate a 25 bps rate hike. They noted, “March lending data, and the ECB’s Q1 Bank Lending Survey, we expect the majority will opt for 25bps, with some clear hawkish dissents. Country-level inflation and growth data appear to have lessened the risk of a 50bps hike, but a material positive surprise in the BLS could still be enough to tip the decision. If the ECB hikes 25bps, the tone of the statement and press conference will likely be more important than the hike itself.”
EUR/JPY Technical Levels
-
22:17
WTI weighed by China woes and a firm US Dollar
- WTI is under pressure as US Dollar firms are on good news for the banking sector.
- China falls below contraction territory, weighing on oil.
West Texas Intermediate crude oil prices Monday lower and have traveled between a low of $74.58 and $76.65 so far.
The US Dollar index on Monday reached a to a 1-1/2 week high and has weighed on the price of commodities, including Oil while US data and Chinese data have been the focus to start the week. At the same time, the US Dollar has found a boost as investors digested news of JPMorgan Chase's takeover of First Republic Bank, ahead of Wednesday's policy decision by the US Federal Reserve.
JPMorgan Chase has bought failed First Republic Bank's deposits and a "substantial amount of their assets and certain liabilities," JPMorgan Chase said in a press release Monday.
"Our government invited us and others to step up, and we did," JPMorgan Chase CEO Jamie Dimon said in a statement. "This acquisition modestly benefits our company overall, it is accretive to shareholders, it helps further advance our wealth strategy, and it is complementary to our existing franchise."
In the Chinese economic news, the concerns have hit oil prices as China's April manufacturing and non-manufacturing activity slowed more than expected. The China Apr manufacturing PMI dropped -2.7 to a 4-month low of 49.2, weaker than expectations of 51.4. Also, the Apr non-manufacturing PMI fell -1.8 to 56.4, weaker than expectations of 57.0.
On the other side of the Pacific, the April ISM manufacturing index rose +0.8 to 46.1, stronger than expectations of 46.8. Also, Mar construction spending rose +0.3% MoM, stronger than expectations of +0.1% MoM and the largest increase in 4 months.
Specific to the industry, Reuters reported that last Wednesday's EIA report showed that (1) U.S. crude oil inventories as of April 21 were -0.5% below the seasonal 5-year average, (2) gasoline inventories were -7.2% below the seasonal 5-year average, and (3) distillate inventories were -12.4% below the 5-year seasonal average. U.S. crude oil production in the week ended April 21 fell -0.8% w/w to 12.2 million bpd, only 0.9 million bpd (-6.9%) below the Feb-2020 record-high of 13.1 million bpd.
Meanwhile, the Baker Hughes reported last Friday that active US oil rigs in the week ended April 28 were unchanged at 591 rigs, moderately below the 2-1/2 year high of 627 rigs posted on December 2. US active oil rigs have more than tripled from the 17-year low of 172 rigs seen in Aug 2020, signaling an increase in US crude oil production capacity.
Speculators have started to unwind their long exposure in WTI crude oil, while also adding short positions, analysts at TD Securities explained.
´´Despite the latest inventory statistics which continue to show robust product demand and dwindling inventories, crude markets were rocked by the reemergence of recessionary fears and bank liquidity concerns.´´
´´Prices have since collapsed, seeing the entirety of the OPEC+ driven rally reversed. But, as risk appetite stabilizes and fundamentals continue to look tighter in the second half of the year, CTAs could again turn buyers and offer support to crude oil markets in the coming weeks,´´ the analysts concluded.
-
20:53
Forex Today: US Dollar strengthens ahead of Fed
What you need to know on Tuesday, May 2:
Financial markets were quite volatile Monday, despite most major countries celebrating Labour Day, keeping local markets closed. The US Dollar edged higher against its rivals, initially extending Friday’s gains and later taking advantage of better-than-anticipated American data.
On Friday, month-end flows and position readjusting ahead of the multiple first-tier events this week pushed the Greenback higher. The rally continued at the beginning of the week but reverted during European hours, with thin volumes exacerbating the movements. It later resumed its advance following the release of US figures.
The United States (US) April ISM Manufacturing PMI improved more than anticipated, up to 47.1 from 46.3. Also, March Construction Spending rose by 0.3% MoM, better than the 0.1% decline expected by market players. Not so encouraging, the final estimate of the S&P Global Manufacturing PMI for the same month was downwardly revised from 50.4 to 50.2.
The US Dollar was also supported by rising US government bond yields. The 10-year Treasury note currently yields 360%, up 15 basis points (bps), while the 2-year note offers 4.13%, adding roughly 7 bps on Monday.
Meanwhile, central banks take center stage. The Bank of Japan (BoJ) announced its decision on Friday, and as widely anticipated, it left its interest rates unchanged in newly appointed Governor Kazuo Ueda’s first policy meeting. The central bank also kept the range for 10-year Japanese Government Bonds (JGB) unchanged at 50 basis points, around the 0% target.
The Reserve Bank of Australia (RBA) will be next, as it will announce its decision on Tuesday. The RBA is expected to pause rate hikes and maintain the cash rate at 3.50%. The United States (US) Federal Reserve (Fed) will be out on Wednesday, while the European Central Bank (ECB) will follow on Thursday.
Meanwhile, Wall Street advanced following news that JP Morgan bought most First Republic Bank assets, rescuing the troubled institution with blessings from the US regulator, the Federal Deposit Insurance Corporation (FDIC).
As for US data, the April ISM Manufacturing PMI improved more than anticipated, up to 47.1 from 46.3. Also, March Construction Spending rose by 0.3% MoM, better than the 0.1% decline expected by market players. Not so encouraging, the final estimate of the S&P Global Manufacturing PMI for the same month was downwardly revised from 50.4 to 50.2.
XAU/USD briefly traded above $2,000 but shed over $20 ahead of the close, opening the door for a bearish extension.
EUR/USD settled around 1.0960, maintaining the pressure at the lower end of its latest range and at risk of falling further. GBP/USD trades sub 1..2500, but the risk of another leg lower is limited.
The Japanese yen is the worst performer, as USD/JPY surged to the 137.50 region. Finally, commodity-linked currencies were the best performers against the US Dollar, finding support in the better tone of Wall Street.
Like this article? Help us with some feedback by answering this survey:
Rate this content -
20:52
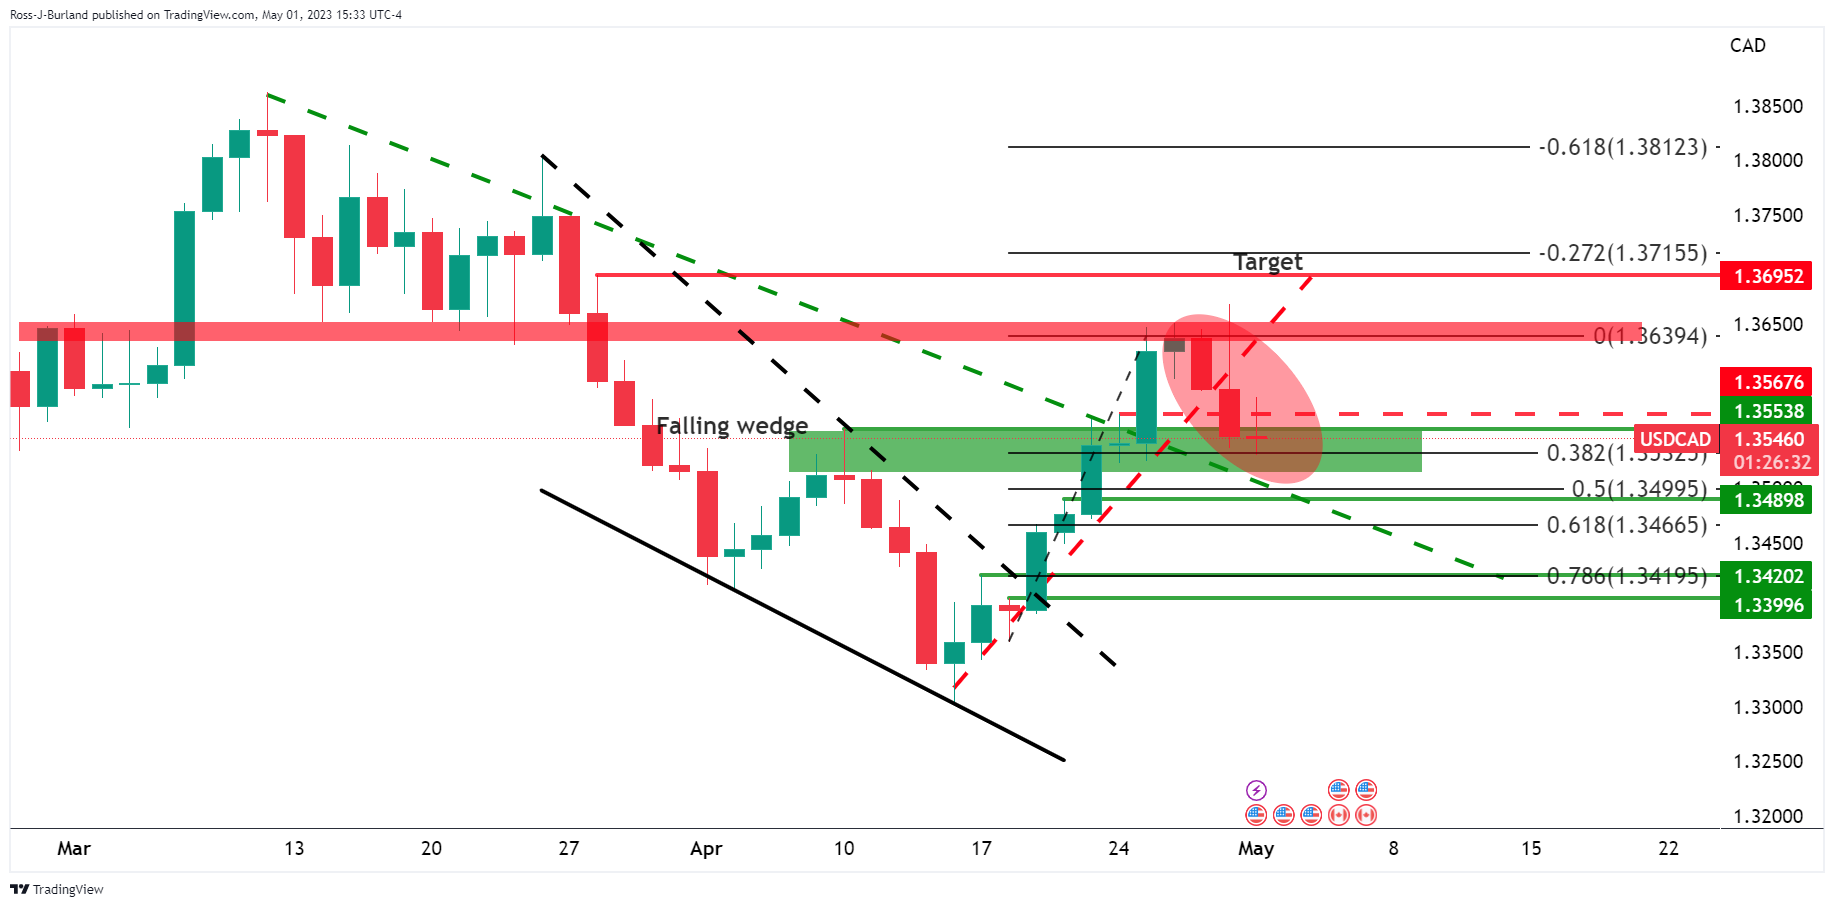
USD/CAD Price Analysis: Bulls are guarding critical support structures and eye 1.3700
- USD/CAD bulls could be on the verge of a rally through key 4-hour structure.
- Bulls eye a run to 1.3650 and then 1.3700.
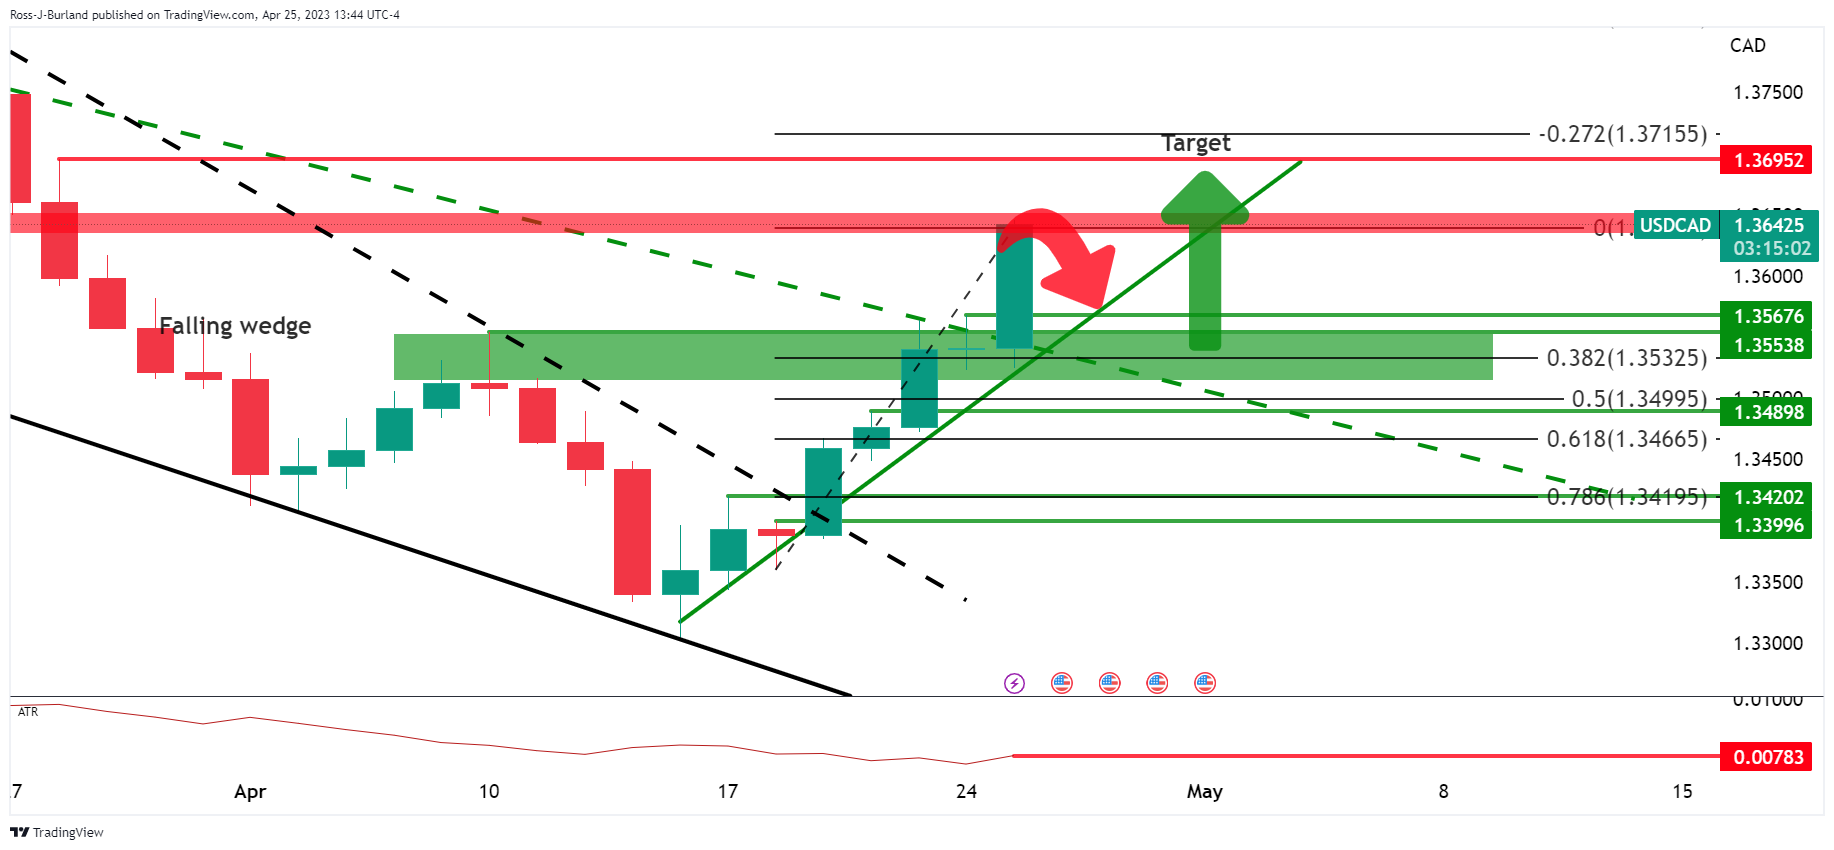
As per the prior USD/CAD analysis, USD/CAD bulls eye a run towards 1.3700 as risk sentiment sours, bulls remain in the picture for a run towards 1.3700 in the near term so long as the following conditions are met:
- The bulls need to stay committed to the counter-trendline support.
- Bulls need to guard 1.3500.
- Bulls need to get above 4-hour 1.3580 structure and then 1.3650-70.
USD/CAD prior analysis

USD/CAD had broken old trendline resistance and was expected to act as a counter-trendline for the bulls to lean against should there be a meanwhile and significant correction.
The trendline support was eyed ahead of 1.3570, 1.3550 and then the 38.2% Fibonacci at 1.3532 ahead of a 50% mean reversion near 1.3500:
USD/CAD live updates
The correction has played out.
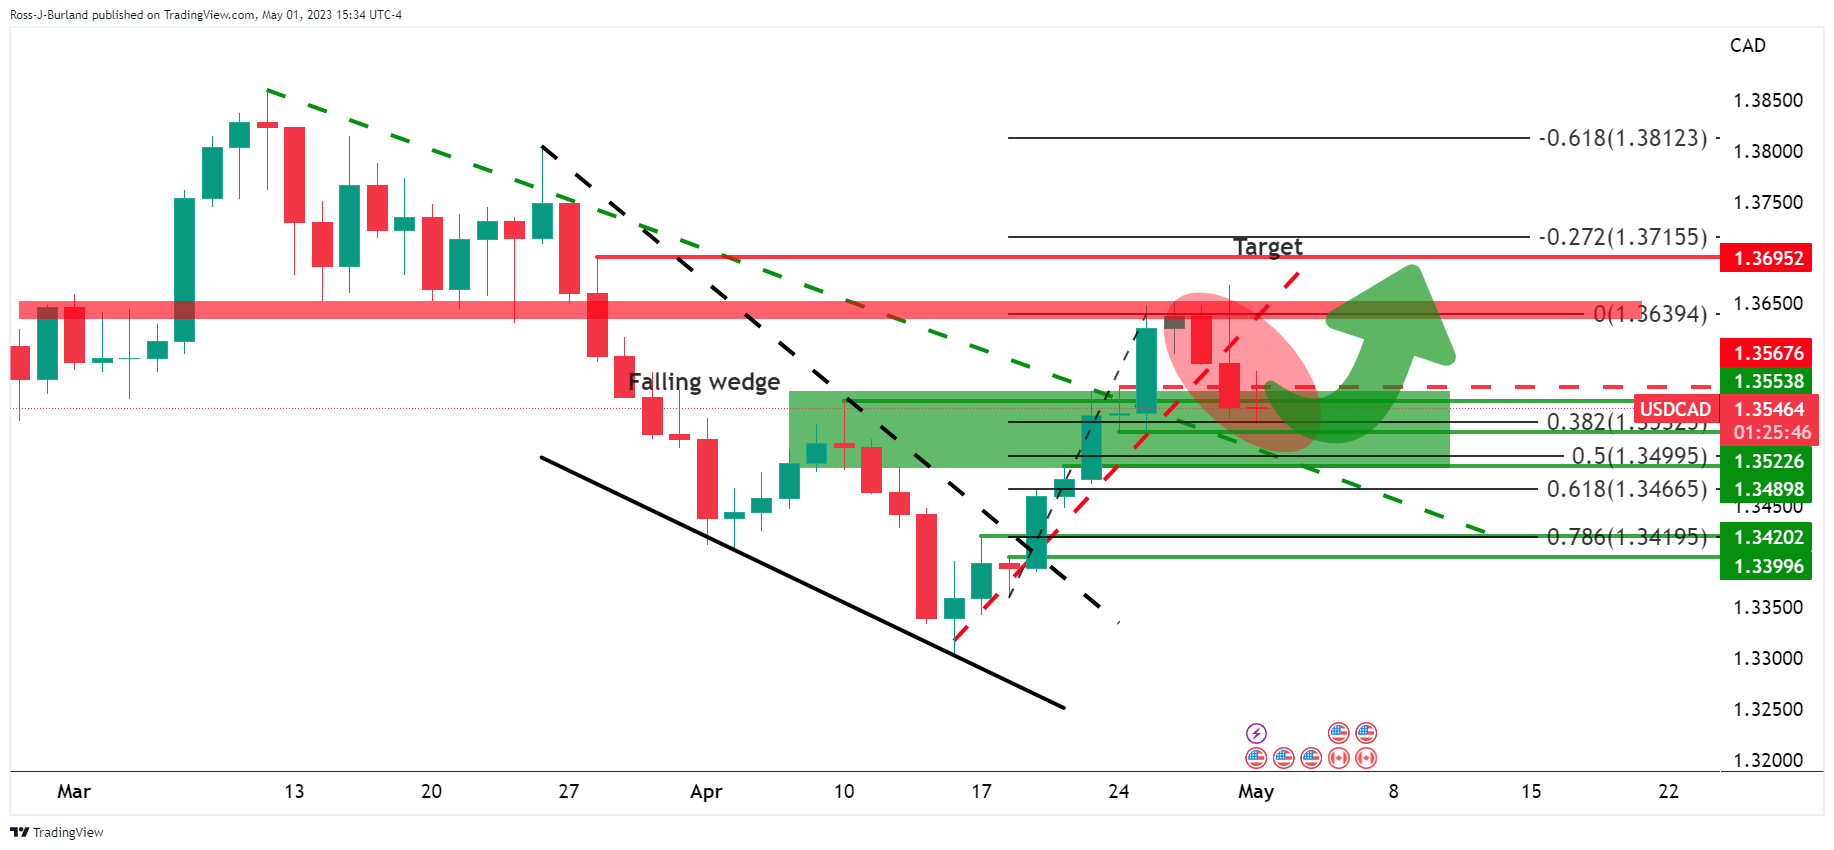
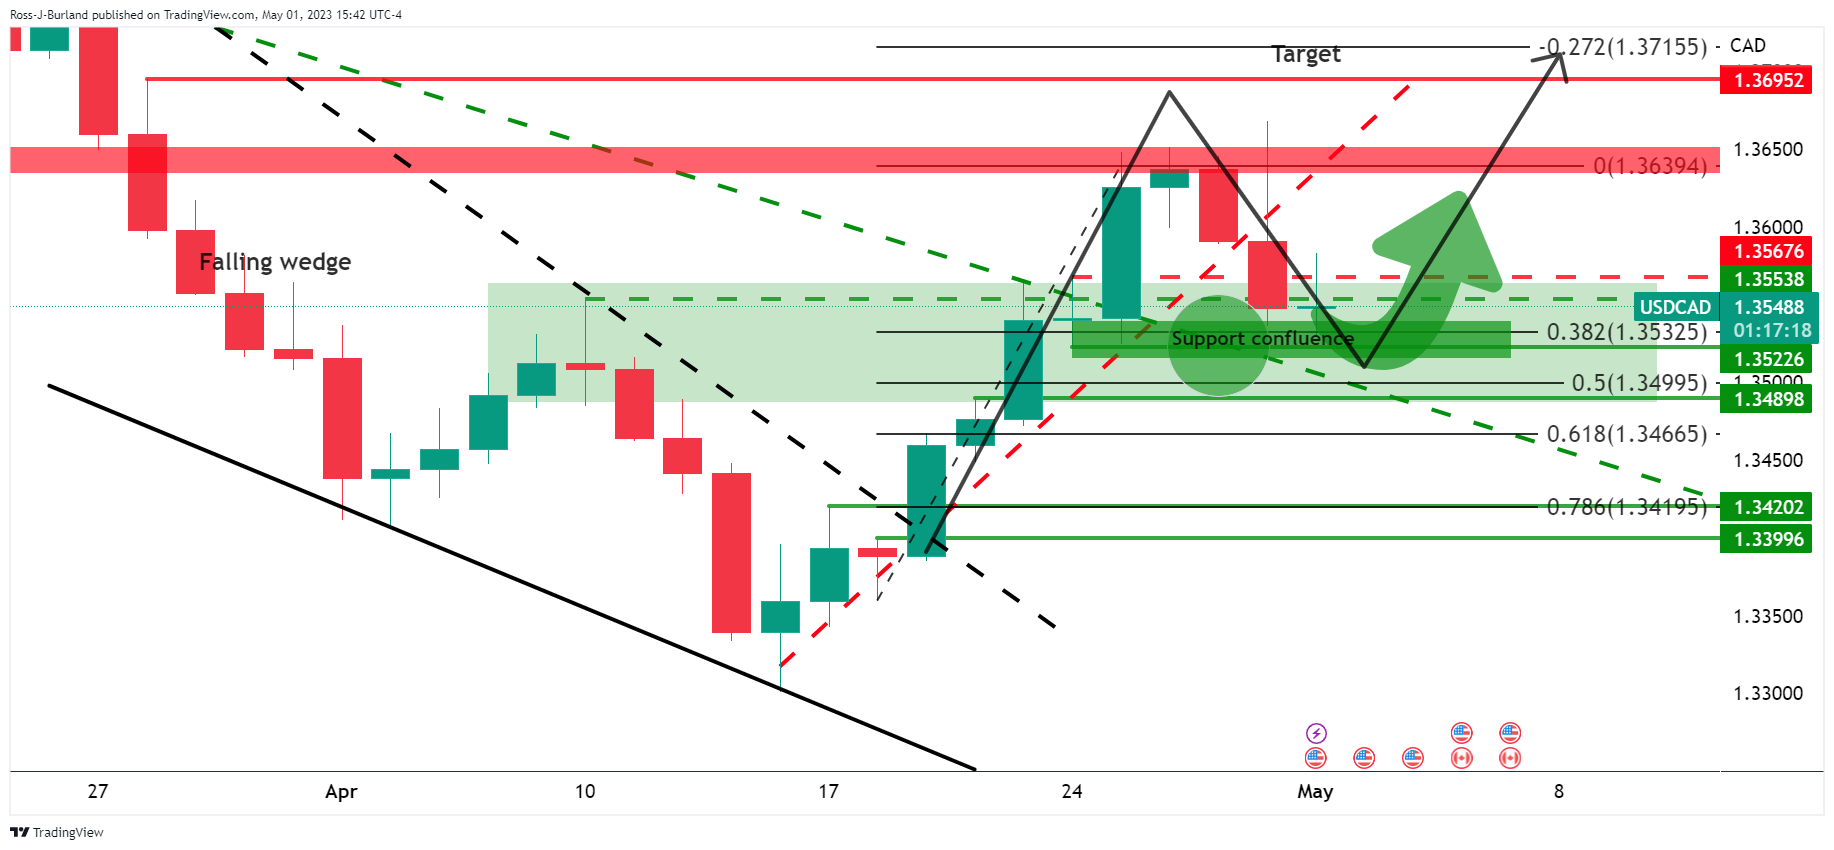
The bulls are starting to engage at the start of the week and the 1.3520s could be key in this regard where the counter trendlñinme support meets horizontal structures as illustrated above.
USD/CAD H4 chart
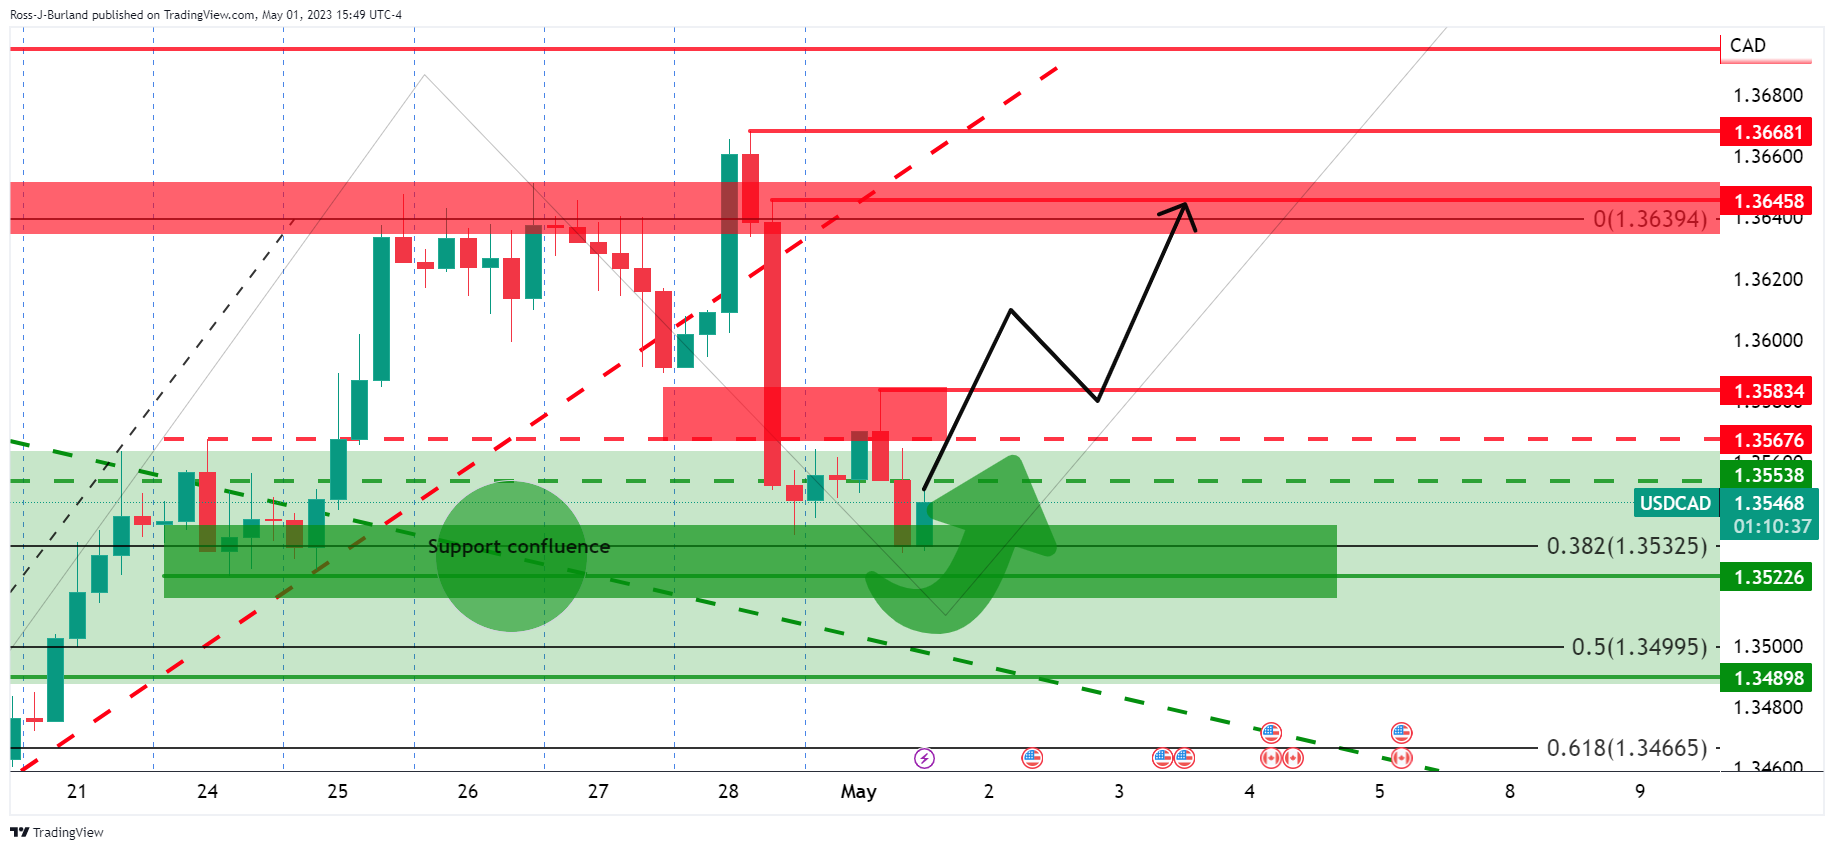
On the lower time frames, we can identify key levels as illustrated above. In this regard, the bulls really need to get above the 4-hour 1.3580 structure and then 1.3650-70.
-
19:52
AUD/USD remains resilient despite facing USD strength
- AUD/USD holds to its gains and remains above 0.6600 on overall risk sentiment.
- US manufacturing activity improved, though higher prices justify the need for further Fed tightening.
- Weaker than expected, China’s data capped the AUD/USD’s rally towards 0.6700.
The Australian Dollar (AUD) clings to some gains after hitting a daily high of 0.6668, though renewed US Dollar (USD) strength spurred a dip toward current exchange rates. That was sparked by the latest week’s inflation data, alongside an improvement in manufacturing activity. At the time of writing, the AUD/USD is trading at 0.6635.
AUD/USD oscillates around 0.6620s as traders brace for the Federal Reserve’s decision
Wall Street portrays an upbeat market sentiment after JP Morgan acquired the failed lender First Republic Bank. Market participants were bracing for another hike by the US Federal Reserve (Fed) and weighed on the AUD/USD’s pair.
A report by the Institute for Supply Management (ISM) revealed the Manufacturing PMI for April at 47.1, improving from March’s 46.3 but missed the chance to enter the expansionary territory. One of the subcomponents of the ISM’s poll, the Prices Index, surprisingly jumped to 53.2 from 49, indicating that inflation is picking up amongst US factories.
In the meantime, the US Dollar Index (DXY), a gauge for the buck’s value vs. a basket of six currencies, advances 0.43%, up at 102.112, a headwind for the AUD/USD pair. US Treasury bond yields climbed and underpinned the buck, as shown by the DXY
Aside from this, the Fed’s odds for a 25 bps rate hike stand at 88.9%, as shown by the CME Fed Watch Tool.
Aside from this, over the weekend, data from China increased concerns about its growth, with the National Bureau of Statistics (NBS) revealing that the Manufacturing PMI in April slowed down from 51.9 to 49.2. The Non- Manufacturing PMI rose to 56.4, down from 58.2 in March, while the composite Index stood at 54.4, from 57.
“A lack of market demand and the high-base effect from the quick manufacturing recovery in the first quarter” was among the factors that led to the contraction in April, said senior NBS statistician Zhao Qinghe.
Even though China’s outlook looks gloomy, the AUD/USD held to its earlier gains. Data from Australia witnessed the Judo Bank Manufacturing PMI rising to 48, below the prior’s month 49.1, while the TD-MI inflation gauge rose by 0.2%, below the latest month’s 0.3%.
In further data, Australia’s Labor government will reveal a vast improvement in the country’s budget bottom line next week, which has been helped by tax windfalls and job gains. Nevertheless, Treasurer Jim Chalmers has warned that fiscal challenges persist, and the government aims to be responsible with spending to avoid inflation, particularly since the Reserve Bank of Australia is aggressively lifting interest rates.
AUD/USD Technical Levels
-
19:44
Silver whipsawed as US Dollar firms
- Silver is choppy on Monday surrounding US data and the banking sector.
- US Dollar firms on JPMorgan Chase's takeover of First Republic Bank.
Silver is trading at $25.0445 at the time of writing and has traveled in a wide range of between $24.8845 and $25.9123 so far.
It has been a particularly choppy session for the white metal as traders digested news of JPMorgan Chase's takeover of First Republic Bank, ahead of Wednesday's policy decision by the US Federal Reserve.
JPMorgan Chase has bought failed First Republic Bank's deposits and a "substantial amount of their assets and certain liabilities," JPMorgan Chase said in a press release Monday.
"Our government invited us and others to step up, and we did," JPMorgan Chase CEO Jamie Dimon said in a statement. "This acquisition modestly benefits our company overall, it is accretive to shareholders, it helps further advance our wealth strategy, and it is complementary to our existing franchise."
Analysts at Brown Brothers Harriman said that ´´while the deal leads to even greater consolidation of the US banking sector, it was a necessary one in order to address this long-festering problem.´´
´´We are cautiously optimistic that this resolution finally ends the banking sector turmoil that began nearly two months ago,´´ the analysts said.
Meanwhile, the US Dollar is firmly higher as per the DXY index that measures the Greenback vs. a basket of currencies. DXY rallied from a low of 101.624 to a high of 102.189 so far. The boost came in line with Monday's good news for the banking sector as well as US data. US Manufacturing pulled off a three-year low in April as new orders improved slightly and employment rebounded.
Additionally, US construction spending increased more than expected in March. Weak economic data from China may have been a factor also with the manufacturing purchasing managers' index (PMI) declining to below contraction territory (50) with the data reading 49.2 from 51.9 in March for the world's second-biggest economy.
Meanwhile, this week is shaping up to be an eventful one in terms of economic data and earnings news while investors await the Federal Reserve decision. ´´We expect a 25bp rate hike at next week's FOMC meeting, and anticipate that post-meeting communication will: (i) emphasize that disinflation has been evolving slower than expected, leaving open the possibility of additional tightening, and (ii) acknowledge the more uncertain economic environment, especially with regard to credit conditions post SVB collapse,´´ analysts at TD Securities said.
-
18:56
GBP/USD Price Analysis: Bulls about to make another move? 1.2450 is key
- GBP/USD bulls are in the market while above key trendline support.
- Bears are taking on the micro trendline but 1.2450 is key.
GBP/USD bulls took over on Friday to print a fresh bull cycle high and although we have seen a slide from those highs, so long as the bulls commit to above 1.2450, the bias remains bullish.
The following is a top-down technical analysis that arrives at a bullish conclusion.
GBP/USD daily chart
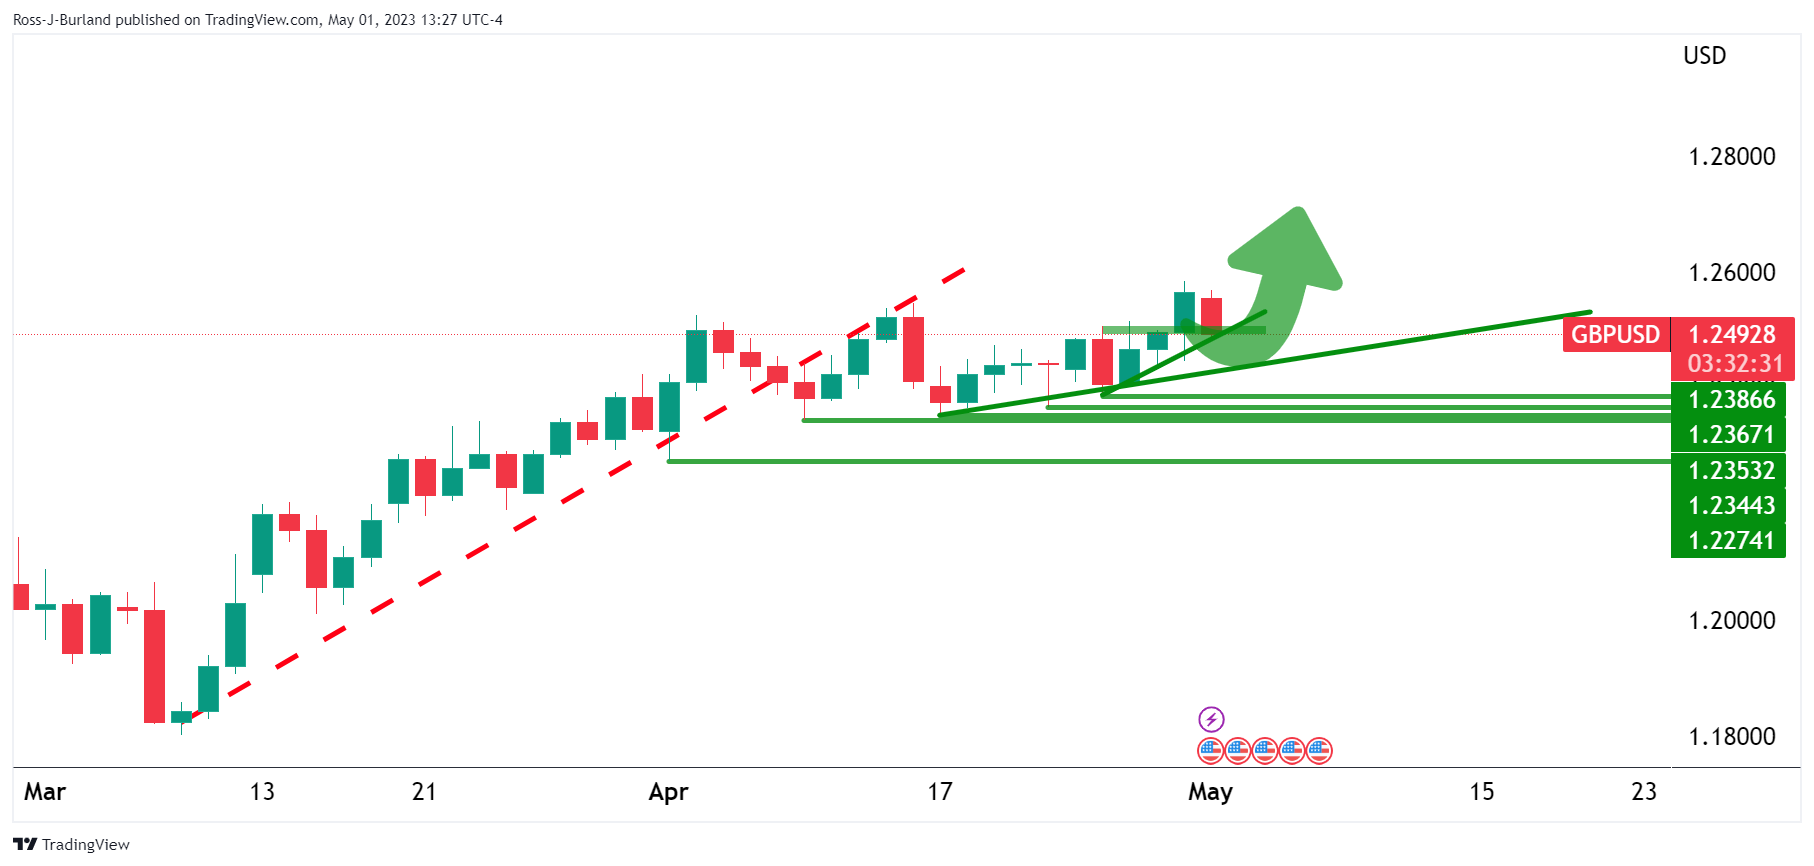
The failed right-hand shoulder of the head and shoulders pattern leaves the bias bullish considering the recent rally that took out the highs of the right-hand shoulder and the head:
GBP/USD H4 charts
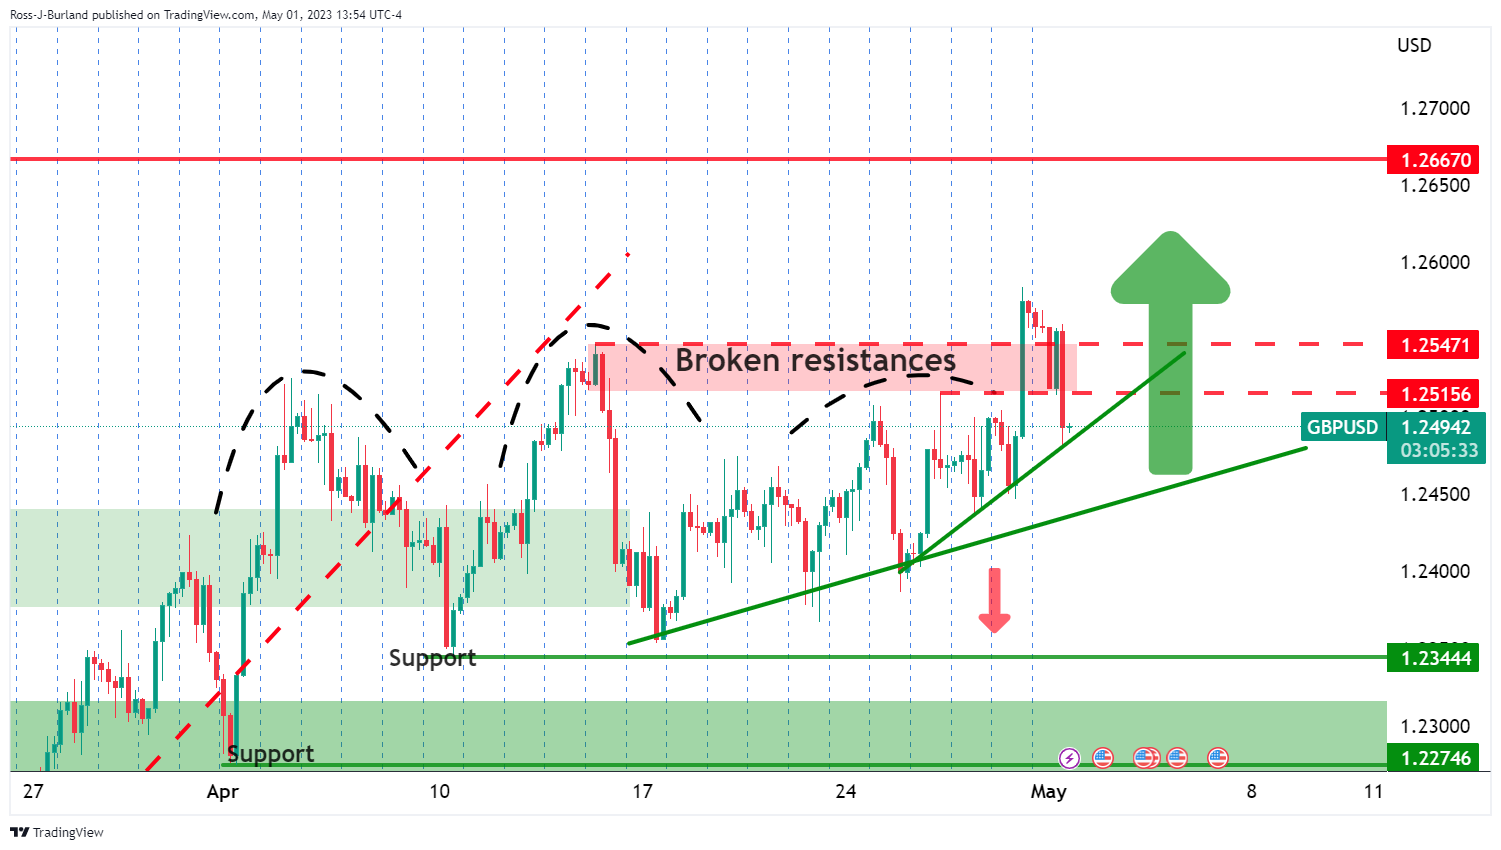
The trendline supports are key in this regard:
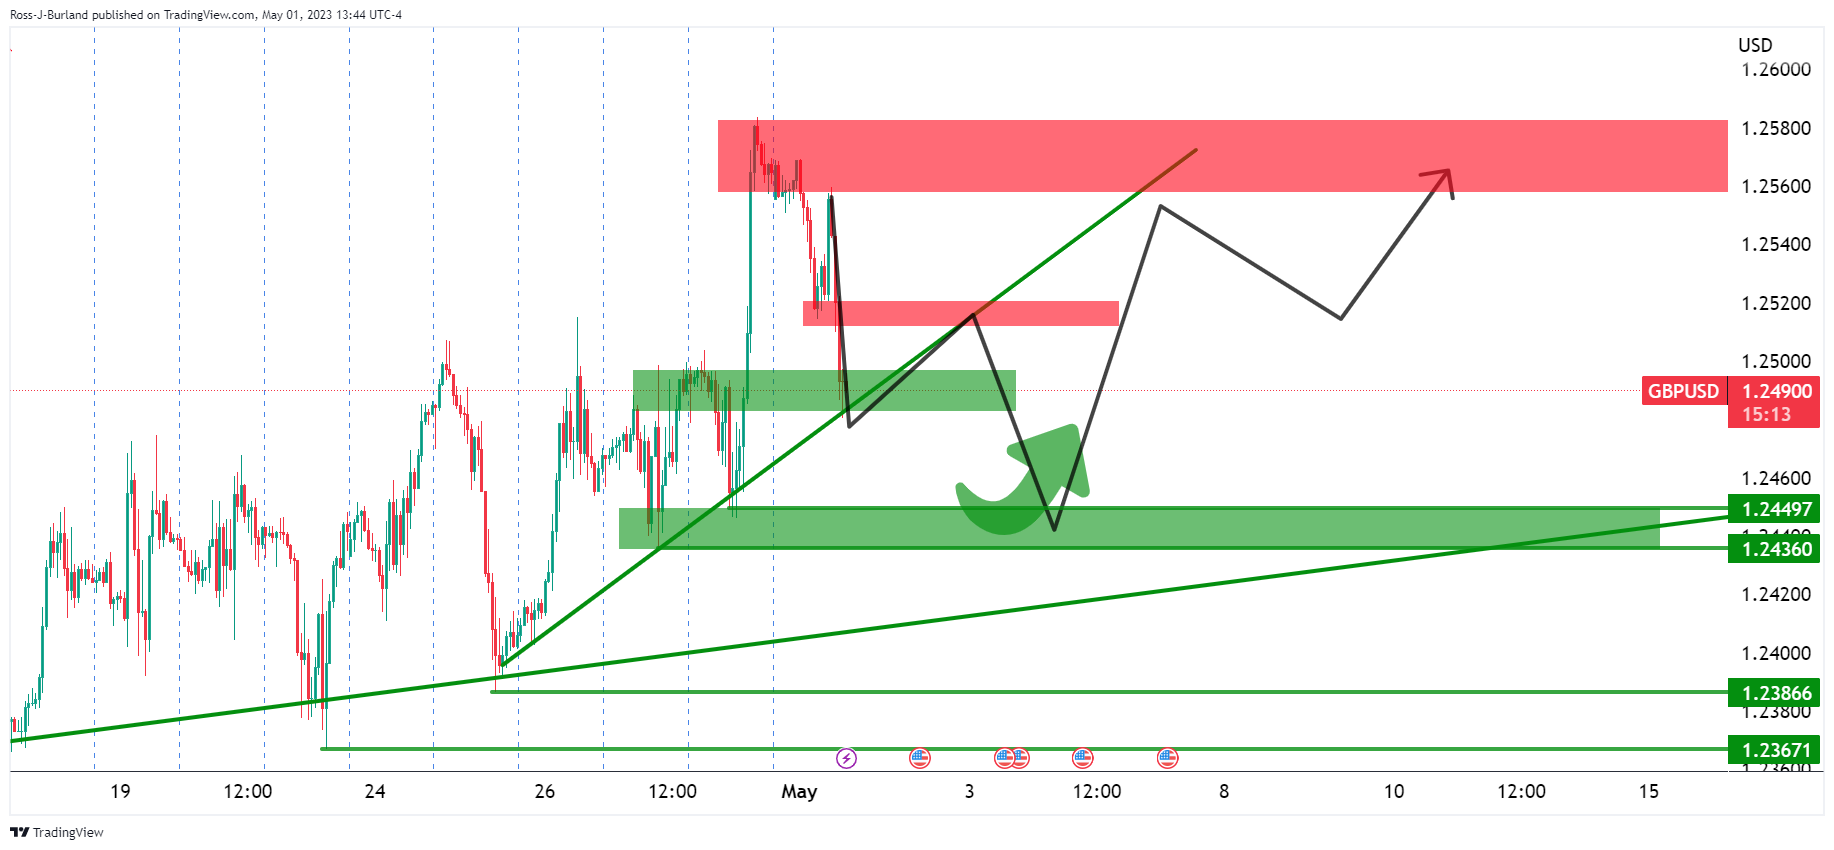
While the above is a theoretical schematic, it identifies the key areas of support and resistances in the 4-hour time frame. The micro trendline is under pressure but so long as the broader trendline remains intact, meeting 1.2450, or thereabouts, then it would be reasonable to expect the bulls to move in again.
-
18:37
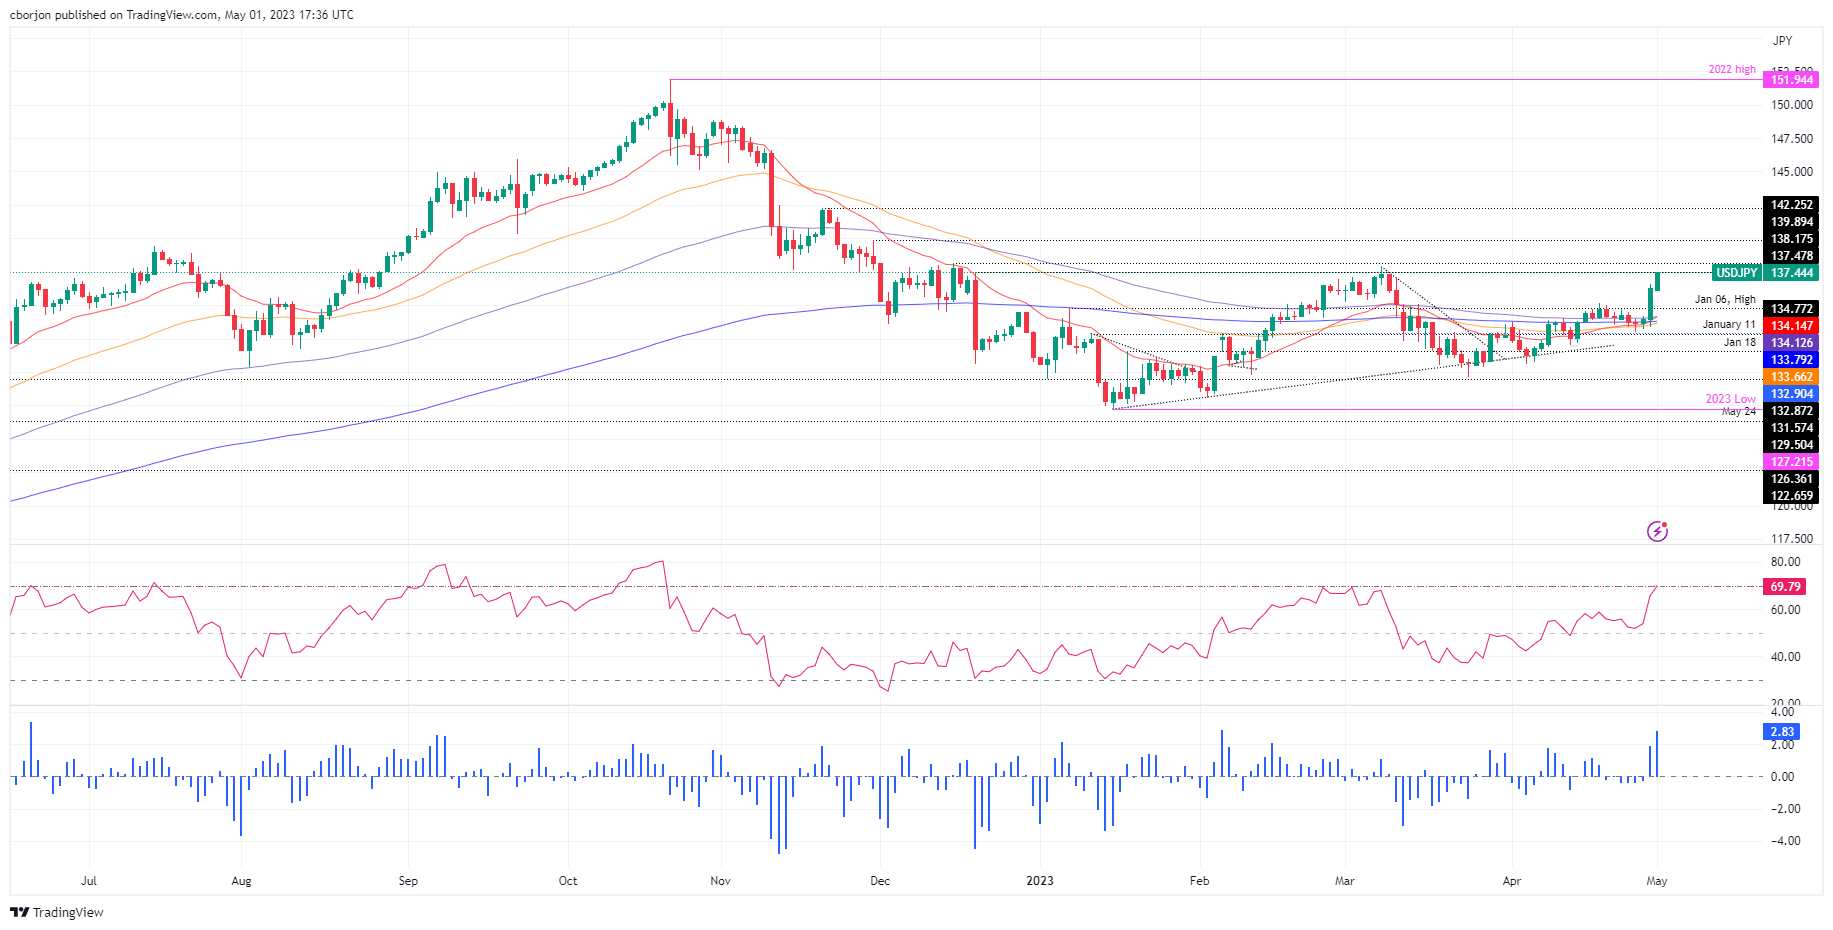
USD/JPY Price Analysis: Surges past 137.00, with buyers eyeing a new YTD high around 138.00
- USD/JPY continues to portray the Yen’s weakness, following the BoJ’s decision to keep its loose monetary policy.
- USD/JPY Price Analysis: The uptrend remains intact, above 137.00, with bulls eyeing 138.00.
The USD/JPY extends its gains in the New York session, rising above 137.00 on overall Japanese Yen (JPY) weakness after last week’s Bank of Japan’s (BoJ) decision to stick to its easy monetary policy. Therefore, the USD/JPY is trading at 137.42 after hitting a daily low of 136.11.
USD/JPY Price Action
From a daily chart perspective, the USD/JPY continues to trend up after last Friday’s price action witnessed more than 1.70% gains. As the pair edged higher, it broke several resistance levels, like the 20 and 100-day EMAs, each at 134.14 and 134.12, respectively. Additionally, the USD/JPY left behind the 200-day EMA at 133.79, cheered by buyers, who remain hopeful of lifting prices towards the last year’s high at 151.94.
If USD/JPY reclaims the November 30 cycle high at 138.17, that would expose the November 21 daily high at 142.25. A breach of the latter will expose the 145.00 figure.
Conversely, if USD/JPY drops below 137.00, it could pave the way for a downward correction. Once cleared, the USD/JPY following support would be the April 28 high at 136.56. Downside risks will emerge below the latter, and it might extend towards the April 19 swing high at 135.13, followed by the 20-day EMAat 134.14, closely followed by the 100-day EMA.
USD/JPY Daily Chart
-
17:42
US: Atlanta Fed GDPNow for Q2 rises to 1.8%
According to the Federal Reserve Bank of Atlanta's GDPNow model, the US economy is expected to grow at an annualized rate of 1.8% in the second quarter, up slightly from 1.7% on the April 28 estimate.
"After this morning’s construction spending release from the US Census Bureau and the Manufacturing ISM Report On Business from the Institute for Supply Management, the nowcast of second-quarter real gross private domestic investment growth increased from 0.3% to 1.0%," Atlanta Fed explained in its publication.
Market reaction
The US Dollar Index preserves its bullish momentum in the American session and was last seen rising 0.5% on the day at 102.15.
-
17:28
EUR/USD falls as ISM Manufacturing PMI improves, boosting USD on Fed tightening speculation
- EUR/USD dips as ISM Manufacturing PMI for April shows improvement but falls short of expansionary territory.
- IMF Chief Downplays de-dollarization concerns amid banking sector vulnerabilities.
- EU Inflation Figures and HCOB Manufacturing PMI to provide insight on the European Central Bank's chances for a 50 or 25 bps rate hike.
The EUR/USD dropped below 1.1000 after the ISM announced that manufacturing activity in April improved. However, it stood in contractionary territory, while a measure of inflation in the same data increased. Therefore, speculations for further tightening by the Federal Reserve (Fed) underpinned the US Dollar (USD). At the time of writing, the EUR/USD is trading at 1.0969 after hitting a high of 1.1035.
EUR/USD losses traction and creeps lower on US data
A risk-on impulse dominates the US equity markets, courtesy of JP Morgan's acquiring the troubled First Republic Bank. However, that's not happening in the FX space, as the EUR/USD fell after the ISM Manufacturing PMI for April improved to 47.1 from 46.3 in the prior's month. While there were improvements in the Orders and Production subcomponents, they fell short of reaching expansionary territory. The Prices Index increased by 4 points to 53.2, which led to speculation that the Federal Reserve might implement tighter monetary policies in the upcoming Wednesday.
Therefore, the EUR/USD retraced, past the daily pivot point and beneath the S1 daily pivot, at 1.0970. It should be said that the greenback underpinned by higher US T-bond yields, its printing losses of 0.46%, up at 102.149.
As of writing, comments from the IMF Managing Director Kristalina Georgieva on Monday said, "De-dollarization isn't on top of my worry list." She added, "There may be more vulnerabilities exposed in the banking sector," and warned that they would see quite a lot of regulatory and disclosure thinking in the wake of the banking crisis.
An absent Eurozone's (EU) economic docket kept EUR/USD traders leaning on the American Dollar (USD) dynamics and market sentiment. On Tuesday, the EU's agenda will feature inflation figures and the HCOB Manufacturing PMI in its final reading. The US economic calendar would feature the JOLTs Job Openings report and Factory Orders ahead of Wednesday's Federal Reserve monetary policy decision.
EUR/USD Technical Analysis
From a technical perspective, the EUR/USD is still upward biased but about to test the 20-day EMA at 1.0955. A fall below the latter will expose the 1.0900 figure, followed by the 50-day EMA at 1.0856. Conversely, if EUR/USD buyers reclaim 1.1000, further upside is warranted at around 1.1095.
-
16:53
IMF’s Georgieva: Don't see alternative to US Dollar any time soon
"De-dollarization isn't on top of my worry list," International Monetary Fund’s (IMF) Managing Director Kristalina Georgieva said on Monday and added that the doesn't see an alternative to the US Dollar any time soon.
"There may be more vulnerabilities exposed in the banking sector," Georgieva warned and further noted that they will see a quite a lot of regulatory and disclosure thinking in the wake of the banking crisis.
Market reaction
The US Dollar preserves its strength in the American session and the US Dollar Index was last seen rising 0.5% on a daily basis at 102.15.
-
16:11
Gold Price Forecast: XAU/USD dips below $2000 on improved ISM report, as high inflation looms
- Gold price dips below $2000, extending its fall beneath the 20-day EMA.
- The ISM showed that manufacturing activity in the US improved but flashed that prices jumped compared to last month’s data.
- XAU/USD Price Analysis: To continue to fall as the RSI indicator approaches the 50-midline.
Gold price slides below the $2000 barrier on a report by the Institute for Supply Management (ISM), showing that manufacturing activity is improving. However, a jump in the prices subcomponent justifies the need for higher rates in the United States (US). The XAU/USD is trading at $1982.70.
US ISM Manufacturing PMI improved but stayed at recessionary levels
Wall Street opened with gains after JP Morgan Chase, of the largest banks in the US, acquired the troubled First Republic Bank. That improved the market mood, though the ISM’s data triggered a leg down in XAU/USD’s price.
The ISM Manufacturing PMI for April remained in contractionary territory for the fifth month, after expanding for 30 consecutive months, at 47.1, higher than March’s 46.3. Delving into the data, the Orders and Production subcomponents improved but lacked the strength to enter the expansionary territory. The Prices Index jumped 4 points to 53.2, sparking speculations that the Federal Reserve (Fed) will tighten monetary conditions next Wednesday.
The XAU/USD reacted downwards, down 0.11% in the early New York session. US Treasury bond yields increased, with the 10-year benchmark note rate yielding 3.513%, gaining eight bps, a headwind for the yellow metal.
The US Dollar Index (DXY), which measures the performance of six currencies vs. the greenback, is climbing 0.33%, up at 102.009, courtesy of elevated US Treasury bond yields.
Despite the backdrop, the latest report for growth in the US), recessionary fears linger around the US economy. The Advanced Gross Domestic Product (GDP) for ¡2 2023 at 1.1% showed that the economy is slowing down. But the Core PCE, the Fed’s preferred gauge for inflation, stood at around 4.6% for the second straight month,
Therefore, the CME FedWatch Tool flashes an 88.9% chance the Fed will raise rates by 25 bps to 5.00% 5.25%. Notably, the swaps market shows a 40% chance for the first rate cut in November’s meeting.
Following today’s data, the US economic agenda will feature the JOLTs Job Openings report and Factory Orders on Tuesday. On Wednesday, the Federal Reserve monetary policy decision will be highlighted.
XAU/USD Technical Analysis
After hitting a daily high of $2005.99, the XAU/USD retreated sharply, exchanging hands below the 20-day Exponential Moving Average (EMA), which lies at $1988.60. Oscillators like the Relative Strength Index (RSI) indicators continued to show that sellers are gathering momentum, about to cross beneath the 50-midline. If that happens, XAU/USD could extend its losses toward the 50-day EMA at $1954.44, which, if cleared, the Gold price can extend its losses toward the 100-day EMA at $1906.42.
-
15:00
United States ISM Manufacturing Prices Paid above expectations (50.4) in April: Actual (53.2)
-
15:00
United States ISM Manufacturing PMI above forecasts (46.6) in April: Actual (47.1)
-
15:00
United States Construction Spending (MoM) above expectations (-0.1%) in March: Actual (0.3%)
-
15:00
United States ISM Manufacturing Employment Index registered at 50.2 above expectations (47.9) in April
-
15:00
United States ISM Manufacturing New Orders Index registered at 45.7 above expectations (45.5) in April
-
14:46
United States S&P Global Manufacturing PMI below expectations (50.4) in April: Actual (50.2)
-
14:45
GBP/USD bounces off daily low, holds steady around mid-1.2500s ahead of US ISM PMI
- GBP/USD reverses modest intraday losses amid the emergence of some USD selling.
- Rising US bond yields, looming recession risks underpin the USD and cap the upside.
- Traders now look to the US ISM PMI for some impetus ahead of the FOMC meeting.
The GBP/USD pair attracts some buying in the vicinity of the 1.2500 psychological mark on Monday and turns neutral during the early part of the North American session. The pair is currently placed around the 1.2550 region and remains well within the striking distance of its highest level since June 2022 touched on Friday.
The US Dollar (USD) surrenders a major part of its modest intraday gains amid the uncertainty over the Federal Reserve's (Fed) rate-hike path and turns out to be a key factor lending some support to the GBP/USD pair. In fact, the markets have fully priced in another 25 bps lift-off at the end of a two-day FOMC monetary policy meeting on Wednesday, which remains supportive of a modest uptick in the US Treasury bond yields and acts as a tailwind for the USD.
Investors, however, seem convinced that the US central bank will then hold rates steady for the rest of the year, which, in turn, holds back the USD bulls from placing aggressive bets. Apart from this, firming expectations that the Bank of England (BoE) will also hike interest rates by 25 bps in May assists the GBP/USD pair to attract some dip-buying at lower levels, though the upside seems limited ahead of the highly-anticipated FOMC meeting, starting on Tuesday.
Furthermore, looming recession risks might continue to benefit the Greenback's relative safe-haven status and contribute to capping gains for the GBP/USD pair, at least for the time being. From a technical perspective, Friday's sustained breakthrough and acceptance above the 1.2500 psychological mark, along with the emergence of some dip-buying on Monday, favours bulls and suggests that the path of least resistance for spot prices is to the upside.
Next on tap is the release of the US ISM Manufacturing PMI. This, along with the US bond yields and the broader risk sentiment, will drive the USD demand and provide some meaningful impetus to the GBP/USD pair. The immediate market reaction, however, is more likely to remain limited, warranting some caution before placing aggressive directional bets.
Technical levels to watch
-
14:36
Canada: S&P Global Manufacturing PMI improves to 50.2 in April vs. 50.5 expected
- S&P Global Manufacturing PMI for Canada recovered above 50 in April.
- USD/CAD stays in daily range at around 1.3550.
Business activity in the Canadian manufacturing sector expanded at a soft pace in April with S&P Global Manufacturing PMI improving to 50.2 from 48.6 in March. This reading came in below the market expectation of 50.5.
Commenting on the survey's findings, “although Canada’s manufacturing sector returned to growth in April, it did so only marginally with underlying data suggesting the recovery remained on shaky ground," noted Paul Smith, Economics Director at S&P Global Market Intelligence.
"Output and employment growth were sustained, but another drop in new orders is probably the most notable development," Smith added. "Clients are hesitant in their spending decisions, unsure of the direction of the economy at a time when prices remain high."
Market reaction
USD/CAD showed no immediate reaction to this report and was last seen trading modestly higher on the day at 1.3558.
-
14:31
Canada S&P Global Manufacturing PMI came in at 50.2, below expectations (50.5) in April
-
14:00
Chile Unemployment rate climbed from previous 8.4% to 8.8% in March
-
13:58
Gold Price Forecast: XAU/USD jumps back above $2,000 mark, upside seems limited
- Gold price reverses an intraday dip and climbs back above the $2,000 psychological mark.
- Looming recession fears weigh on investors’ sentiment and benefit the safe-haven metal.
- A modest US Dollar strength might cap gains ahead of this week’s central bank event risks.
Gold price attracts some dip-buying near the $1,977 region on Monday and climbs to a fresh daily high heading into the North American session. The XAU/USD is currently placed just above the $2,000 psychological mark, though remains confined in a familiar trading range held over the past two weeks or so.
Looming recession fears benefit Gold price
The weaker Chinese manufacturing data released on Sunday adds to market worries about economic headwinds stemming from rising borrowing costs and turns out to be a key factor acting as a tailwind for the safe-haven Gold price. In fact, the official Chinese Manufacturing Purchasing Managers' Index (PMI) declined to 49.2 in April from 51.9 previous. This comes on the back of the Advance Gross domestic product (GDP) report released from the United States (US) last week, which showed that the world's largest economy slowed more than expected in the first quarter. Furthermore, factory activity in Japan - the world's third-biggest economy - contracted for the sixth straight month in April and fueled recession fears. This, in turn, weighs on investors' sentiment and drives some haven flows towards the XAU/USD.
Modest US Dollar strength caps gains for Gold price
Apart from this, speculations that the Federal Reserve (Fed) will hold rates steady for the rest of the year beyond May further seem to lend support to the non-yielding Gold price. The markets, however, have fully priced in another 25 basis points (bps) lift-off at this week's Federal Open Market Committee (FOMC) policy meeting, starting on Tuesday. The expectations remain supportive of a modest uptick in the US Treasury bond yields and assist the US Dollar (USD) to gain some positive traction for the third successive day. Adding to this, expectations that the European Central Bank (ECB) could surprise with an outsized 50 bps lift-off on Thursday might hold back traders from placing aggressive bets around the XAU/USD and further contribute to keeping a lid on any meaningful upside, at least for the time being.
The aforementioned fundamental backdrop makes it prudent to wait for strong follow-through buying before positioning for any further appreciating move ahead of the key central bank event risks. The focus will then shift to the release of the closely-watched US monthly employment details on Friday. The popularly known Nonfarm Payrolls (NFP) report will play a key role in influencing the near-term USD price dynamics and determine the next leg of a directional move for the US Dollar-denominated Gold price. In the meantime, traders on Monday will take cues from the release of the US ISM Manufacturing PMI print for April to grab short-term opportunities around the XAU/USD.
Gold price technical outlook
From a technical perspective, any subsequent move-up is likely to confront some resistance near the $2,010-$2,012 supply zone, which if cleared decisively will negate any near-term negative bias and prompt some technical buying. The Gold price might then climb to the $2,039-$2,040 region before aiming to challenge the YTD peak, around the $2,048-$2,049 region touched on April 13.
On the flip side, the $1,975-$1,970 zone might continue to protect the immediate downside. A convincing break below the said support will mark a bearish breakdown through a short-term trading range and make the Gold price vulnerable to decline further. The XAU/USD might then accelerate the downfall towards the $1,948 resistance breakpoint, now turned support, en route to the 50-day Simple Moving Average (SMA), currently around the $1,937-$14,936 area.
Key levels to watch
-
12:04
US Dollar firm as First Republic gets closure – BBH
"We finally have some closure on First Republic; the deal clears the deck for global monetary tightening to continue unabated," not analysts at BBH.
Recent data have been dollar-supportive
"The dollar is firm as First Republic gets closure. DXY is trading higher for the third straight day just below 102 as the deal should help dial down banking sector risk in the U.S. With most of Europe on holiday, the euro is trading lower near $1.10 and sterling is trading lower near $1.2520. USD/JPY is trading at the highest since March 10 and is testing the 200-day moving average near 137. It should eventually break above and near 137 and test the March 8 high near 138."
"Recent data have been dollar-supportive but until rate cuts this year are finally priced out, the dollar is likely to remain vulnerable. Perhaps the First Republic deal and a hawkish Fed this week will open up the next stage higher for the greenback."
"After marathon talks, regulators seized the troubled bank and will sell the bulk of the assets to JPMorgan Chase. JPMorgan will assume all of First Republic’s $92 bln in deposits as well as most of its assets, including nearly $175 bln in loans and $30 bln in securities. In order to help facilitate the deal, the FDIC will share losses on Frist Republic’s loans and estimated it would see a $13 bln hit from the deal. While the deal leads to even greater consolidation of the U.S. banking sector, it was a necessary one in order to address this long-festering problem. We are cautiously optimistic that this resolution finally ends the banking sector turmoil that began nearly two months ago."
-
12:00
USD/JPY stalls intraday positive move near 200 DMA, still well bid above mid-136.00s
- USD/JPY climbs to its highest level since March 10, albeit struggles to break through the 200 DMA.
- The BoJ’s dovish outlook weighs heavily on the JPY and acts as a tailwind amid a modest USD strength.
- Investors now look to the US ISM Manufacturing PMI for some impetus ahead of the FOMC meeting.
The USD/JPY pair builds on Friday's blowout rally and gains strong follow-through traction on the first day of a new week. The momentum lifts spot prices to the highest level since March 10, though pauses near a technically significant 200-day Simple Moving Average (SMA) resistance just ahead of the 137.00 mark. The pair, however, maintains its bid tone through the first half of the European session and is currently placed just above mid-136.00s, still up around 0.25% for the day.
The Japanese Yen (JPY) continues to be weighed down by the Bank of Japan's (BoJ) dovish outlook, which, along with a modest US Dollar (USD) strength, acts as a tailwind for the USD/JPY pair. It is worth recalling that the Japanese central bank on Friday left its ultra-loose monetary policy settings unchanged and also made no tweaks to its yield curve control (YCC) by a unanimous vote. Adding to this, the new BoJ Governor Kazuo Ueda said that the risk from tightening too hastily is larger than monetary policy falling behind the curve and added that it will be appropriate to continue monetary easing to achieve the 2% inflation target.
Apart from this, data released earlier this Monday showed that factory activity in Japan - the world's third-biggest economy - contracted for the sixth straight month in April, which, in turn, exerts additional downward pressure on the JPY. The USD, on the other hand, edges higher for the third successive day amid the prospects of the Federal Reserve (Fed) raising interest rates by another 25 basis points (bps) at the end of a two-day meeting on Wednesday. The markets, however, seem convinced that the US central bank will then hold rates steady for the rest of the year. This holds back the USD bulls from placing aggressive bets and caps the pair.
Furthermore, worries about economic headwinds stemming from rising borrowing costs could lend some support to the safe-haven JPY and contribute to keeping a lid on the USD/JPY pair, at least for the time being. In fact, the Advance USD GDP report released last week showed that growth in the world's largest economy slowed more than expected in the first quarter. Moreover, the official Chinese Manufacturing PMI declined to 49.2 in April from 51.9 in March and further fueled recession fears. Market participants now look forward to the release of the US ISM Manufacturing PMI, due later during the early North American session.
Apart from this, the broader market risk sentiment might further contribute to producing short-term opportunities around the USD/JPY pair. The focus, meanwhile, will remain glued to the outcome of the FOMC meeting on Wednesday and the closely-watched US monthly employment details, popularly known as the NFP report on Friday. This will play a key role in influencing the near-term USD price dynamics and help determine the next leg of a directional move for the major.
Technical levels to watch
-
11:22
USD/CAD clings to gains near 1.3575 area amid sliding Oil prices, modest USD strength
- USD/CAD regains positive traction on Monday and draws support from a combination of factors.
- Sliding Crude Oil prices undermines the Loonie and acts as a tailwind amid a modest USD strength.
- Traders now look to the US ISM Manufacturing PMI for some impetus ahead of the FOMC meeting.
The USD/CAD pair attracts some buyers near the 100-day Simple Moving Average (SMA) on Monday and stalls Friday's sharp retracement slide from the 1.3665-1.3670 region, or one-month high. The pair maintains its bid tone around the 1.3570-1.3575 area through the first half of the European session and for now, seems to have snapped a two-day losing streak.
Crude Oil prices struggle to capitalize on Friday's goodish rebound from a one-month low and come under renewed selling pressure amid worries that rising borrowing costs could slow economic growth, which, in turn, will hit fuel demand. Apart from this, weaker Chinese manufacturing data aggravates the bearish pressure surrounding the black liquid. This, in turn, is seen undermining the commodity-linked Loonie and acting as a tailwind for the USD/CAD pair. Apart from this, a modest US Dollar (USD) strength further contributes to the bid tone surrounding the major.
The prospects for further interest rate hikes by the Federal Reserve (Fed), along with looming recession risks, push the USD higher for the third successive day on Monday. In fact, the markets have fully priced in another 25 bps lift-off at the end of the highly-anticipated two-day FOMC policy meeting on Wednesday. Furthermore, growing market concerns about economic headwinds stemming from rising borrowing costs benefit the Greenback's relative safe-haven status and provide an additional lift to the USD/CAD pair ahead of the key central bank event risk.
In the meantime, traders on Monday will take cues from the release of the US ISM Manufacturing PMI, due later during the early North American session. Apart from this, the broader risk sentiment will drive the USD demand and provide some impetus to the USD/CAD pair. This, along with Oil price dynamics, should further contribute to producing short-term trading opportunities around the major.
Technical levels to watch
-
11:21
Inflation will be important in determining size of ECB hike – TDS
Analysts at TD Securities see the European Central Bank (ECB) raising its policy rate by 25 basis points (bps) at this week's meeting but note that they can't rule out a bigger hike.
We wouldn't completely rule out a 50bps hike
"Easing financial system stress, persistent high inflation, strong wage growth, and avoidance of a winter recession are enough for the ECB to comfortably hike rates by 25bps in May and re-introduce guidance that more tightening is to come. We wouldn't completely rule out a 50bps hike should data ahead of the decision surprise significantly but that would come without guidance."
"The Bank Lending Survey (BLS) and inflation data will be important inputs in determining the size of rate hike at the May ECB meeting. We expect the BLS to show some easing in lending conditions, in part due to the improved economic outlook since Q4. Moreover, a decline in core and a steady headline rate (TDS: 6.9%, mkt: 7.0%) should skew risks further away from a 50bps hike."
-
11:15
ECB is not in position to pause tightening cycle – ANZ
Analysts ANZ think that the European Central Bank (ECB) is not in a position to pause its tightening cycle.
We forecast a 25bp rate rise this week
"The ECB is not yet able to contemplate pausing its tightening cycle. We forecast a 25bp rate rise this week as the ECB balances the lagged effects of previous rate hikes, recent banking turmoil and further tightening."
"Prior to the meeting, however, the updated ECB bank lending survey, M3 data, unemployment and preliminary April HICP data will be published. The ECB will factor this information into deciding the magnitude of its rate rise."
"Clearly, if core inflation is still ratcheting higher in annual terms and both bank lending conditions and credit are holding up well, the ECB could opt for a 50bp rise. Hawks have said that a 50bp rise is on the table."
"The question for the ECB is how persistent inflation will be and if second round effects are emerging. We expect future rate rises to be determined meeting by meeting and see a risk that tightening could extend into Q3."
-
11:11
Fed to emphasize disinflation has been evolving slower than expected – TDS
Previewing this week's key events and data releases from the United States (US), analysts at TD Securities noted that they expect the US central bank to raise the policy rate by 25 basis points (bps).
US payrolls likely slowed for a third consecutive month
"We anticipate that post-meeting communication will: (i) emphasize that disinflation has been evolving slower than expected, leaving open the possibility of additional tightening, and (ii) acknowledge the more uncertain economic environment, especially with regard to credit conditions post SVB collapse."
"US payrolls likely slowed for a third consecutive month to a still firm pace in April, though the slowest since 2020. We also look for the UE rate to rise to 3.6%, and wage growth to print 0.3% m/m."
"Surveys already released point to a small rebound for both the ISM manufacturing and services indexes in April following their twin declines in March to 46.3 and 51.2, respectively. We look for the ISM manufacturing index to advance modestly to a less dire level at 47.5. The services index likely rose as well but to 52.2, indicating a modest improvement in the pace of expansion for the sector."
-
11:05
US: Downward revision to retail sales responsible for GDP miss – ABN Amro
Commenting on the US growth data, "GDP growth slowed to 1.1% q/q annualised, according to the advance estimate, which was well below our and consensus forecasts for a 2% expansion, and down from 2.6% growth in Q4," said Bill Diviney, Senior Economist at ABN Amro.
Consumption still grew very strongly in the first quarter
While the main drag came from a drop in inventories (which subtracted a whopping 2.7pp from growth), a large downward revision to retail sales also meant consumption was not as strong as expected. Indeed, the Atlanta Fed’s GDP Now tracker had already suggested a big miss the day prior to the release of the GDP report, due to the revision to retail sales. Despite that downward revision, consumption still grew very strongly in the first quarter, by 3.7% annualised, with a 16.9% surge in durable goods consumption responsible for the strength (services consumption growth was much more moderate at 2.3%).
The exceptional strength in goods consumption has been a surprise in the first quarter, given that for much of last year goods consumption had been on a cooling trend. Still, looking at more recent high frequency data does suggest goods consumption has since resumed its cooling trend, with for instance Redbook weekly department store sales slowing sharply of late. At the same time, there has been a tendency for repeated downward revisions to consumption data in the post-pandemic period, likely reflecting difficulty in measuring price effects in the current high inflation environment. As such, it would not be a surprise if the Q1 strength in consumption is further revised away in future GDP estimates.
-
10:31
NZD/USD flat-lines below 0.6200 mark, modest USD strength caps the upside
- NZD/USD lacks any firm intraday direction on Monday and oscillates in a narrow band.
- A combination of factors pushes the USD higher and acts as a headwind for the major.
- Traders look to the US ISM PMI for some impetus ahead of the FOMC on Wednesday.
The NZD/USD pair struggles to capitalize on its modest uptick and seesaws between tepid gains/minor losses through the first half of trading on Monday. The pair is currently placed around the 0.6175 region, nearly unchanged for the day and just below a one-and-half-week high touched during the Asian session.
The prospects for further interest rate hikes by the Federal Reserve (Fed), along with looming recession risks, help the US Dollar (USD) to gain traction for the third successive day and turn out to be a key factor capping gains for the NZD/USD pair. In fact, the markets have fully priced in another 25 bps lift-off at the end of the highly-anticipated two-day FOMC policy meeting on Wednesday. Furthermore, weaker Chinese manufacturing data released on Sunday weigh on investors' sentiment and benefits the safe-haven Greenback.
In fact, the official Chinese Manufacturing Purchasing Managers' Index (PMI), released on Sunday, declined to 49.2 in April from 51.9 in March. The data comes on the back of the Advance US GDP report last week, which showed that growth in the world's largest economy decelerated at a faster-than-expected pace during the first quarter, and adds to worries about economic headwinds stemming from rising borrowing costs. This, in turn, drives some haven flows towards the buck and contributes to keeping a lid on the NZD/USD pair.
The markets, meanwhile, seem convinced that the US central bank will hold rates steady for the rest of the year beyond May, which is holding back the USD bulls from placing aggressive bets and lending some support to the NZD/USD pair. Traders also prefer to wait on the sidelines ahead of the key central bank event risk. In the meantime, Monday's release of the US ISM Manufacturing PMI, along with the broader risk sentiment, might influence the USD price dynamics and produce short-term trading opportunities around the major.
Technical levels to watch
-
09:42
GBP/USD drops to fresh daily low amid stronger USD, holds above 1.2500 mark
- GBP/USD retreats from a multi-month high touched on Friday amid a modest USD strength.
- The fundamental backdrop warrants some caution before positioning for any further losses.
- Investors now look to the US ISM PMI for some impetus ahead of the FOMC on Wednesday.
The GBP/USD pair comes under some selling pressure on the first day of a new week and erodes a part of Friday's strong gains to the 1.2580-1.2585 region, or its highest level since June 2022. Spot prices extend the steady intraday descent through the early part of the European session and drop to a fresh daily low, around the 1.2520 area in the last hour.
A combination of supporting factors assists the US Dollar (USD) to gain positive traction for the third successive day, which, in turn, is seen dragging the GBP/USD pair lower. The prospects of the Federal Reserve (Fed) raising interest rates by another 25 basis points (bps) at the end of a two-day meeting on Wednesday, along with looming recession risks, continue to act as a tailwind for the safe-haven Greenback.
China's official Manufacturing PMI declined to 49.2 in April from 51.9 in March. This comes on the back of the Advance US GDP report released last week, which showed that growth in the world's largest economy decelerated more than expected during the first quarter. This, in turn, adds to worries about economic headwinds stemming from rising borrowing costs and drives some haven flows towards the buck.
The markets, however, seem convinced that the US central bank will then hold rates steady for the rest of the year beyond May, which might hold back the USD bulls from placing aggressive bets. Apart from this, rising bets for a 25 bps lift-off by the Bank of England (BoE) might further contribute towards limiting the downside for the GBP/USD pair, warranting some caution before positioning for any further downfall.
Traders might also prefer to wait on the sidelines amid relatively thin trading volumes on the back of a holiday in Europe and ahead of the highly-anticipated two-day FOMC policy meeting, starting on Tuesday. The Fed is scheduled to announce its decision on Wednesday, which will play a key role in influencing the USD price dynamics and help determine the near-term trajectory for the GBP/USD pair.
In the meantime, traders on Monday will take cues from the release of the US ISM Manufacturing PMI, due later during the early North American session. Apart from this, the broader risk sentiment will drive demand for the safe-haven buck and contribute to producing short-term opportunities around the GBP/USD pair.
Technical levels to watch
-
08:54
AUD/USD steady climbs closer to mid-0.6600s, upside potential seems limited
- AUD/USD kicks off the new week on a positive note and climbs to a four-day high.
- A combination of factors could cap any further gains and warrants caution for bulls.
- Traders now look to the US ISM Manufacturing PMI ahead of the RBA on Tuesday.
The AUD/USD pair attracts some buyers on the first day of a new week and builds on Friday's bounce from the 0.6575-0.6570 area, or its lowest level since March 10. Spot prices build on the steady intraday ascent through the early North American session and climb to a four-day high, closer to mid-0.6600s in the last hour.
Traders opt to lighten their bets ahead of this week's key central bank event risks, which, in turn, is seen as a key factor pushing the AUD/USD pair amid relatively thin liquidity conditions on the back of a holiday in Europe. The Reserve Bank of Australia (RBA) is scheduled to announce its monetary policy decision on Tuesday. This will be followed by the outcome of the highly-anticipated two-day FOMC meeting on Wednesday.
The upside for the AUD/USD pair, however, seems limited amid a modest US Dollar (USD) strength, bolstered by the prospects for another 25 bps lift-off by the Federal Reserve (Fed). Apart from this, looming recession fears drive some haven flow towards the Greenback and act as a headwind for the risk-sensitive Aussie. Furthermore, weaker Chinese manufacturing data released on Sunday might contribute to capping the AUD/USD pair.
In fact, the official Chinese Manufacturing Purchasing Managers' Index (PMI), released on Sunday, declined to 49.2 in April from 51.9 in March. The data comes amid worries about economic headwinds stemming from rising borrowing costs and tempers investors' appetite for riskier assets, which is evident from the cautious mood around the equity markets. This warrants some caution before placing bullish bets around the AUD/USD pair.
Market participants now look to the release of the US ISM Manufacturing PMI, due later during the early North American session. This, along with the broader risk sentiment, should influence the USD price dynamics and contribute to producing short-term trading opportunities around the AUD/USD pair.
Technical levels to watch
-
08:22
Forex Today: US Dollar extends recovery to start action-packed week
Here is what you need to know on Monday, May 1:
Financial markets stay relatively quiet to start the new week after month-end flows ramped up volatility ahead of the weekend. Nevertheless, the US Dollar manages to stay resilient against its rivals early Monday with the US Dollar Index extending its recovery toward 102.00. The trading is action is likely to remain subdued during the first half of the day due to Labor Day holiday. In the American session, the ISM Manufacturing PMI survey for April will be watched closely by investors.
US ISM Manufacturing PMI April Preview: Gloom persists despite expanding US economy.
On Friday, the data from the US showed that the Core Personal Consumption Expenditures (PCE) Price Index, the Fed's preferred gauge of inflation, edged lower to 4.6% on a yearly basis in March from 4.7% in April. Moreover, the US Bureau of Labor Statistics reported that the Employment Cost Index, compensation costs for civilian workers, increased by 1.2% in the first quarter, compared to 1% increase recorded in the previous quarter.
Over the weekend, roughly a dozen banks, including PNC Financial Services Group, JPMorgan Chase & Co and Citizens Financial Group Inc, have reportedly submitted bids for first Republic Bank as US regulators are trying to finalize the sale. US stock index futures trade modestly higher on the day following this development and the benchmark 10-year US Treasury bond yield stays below 3.5% despite having retraced a small portion of Friday's decline.
EUR/USD stays under modest bearish pressure and trades near 1.1000 in the European morning on Monday.
GBP/USD reached its highest level since June 2022 at 1.2585 on Friday but struggled to preserve its bullish momentum at the beginning of the week. The pair was last seen trading in negative territory below 1.2550.
Following Friday's impressive rally that was fueled by the Bank of Japan's dovish language, USD/JPY continues to push higher early Monday and was last seen trading at its highest level since early March at 136.80.
AUD/USD has gained traction and advanced toward 0.6650 early Monday. In the Asian trading hours on Tuesday, the Reserve Bank of Australia will announce its policy decision.
Reserve Bank of Australia Preview: No change, nothing new for the Aussie.
Gold price came under renewed selling pressure on Monday and declined to $1,980 area, pressured by recovering US T-bond yields.
Following a quiet weekend, Bitcoin turned south early Monday and was last seen losing more than 2% on the day at around $28,650. After having failed to reclaim $1,900, Ethereum lost its traction and lost more than 1% on Sunday. ETH/USD continues to edge lower toward $1,800 on Monday.
-
08:07
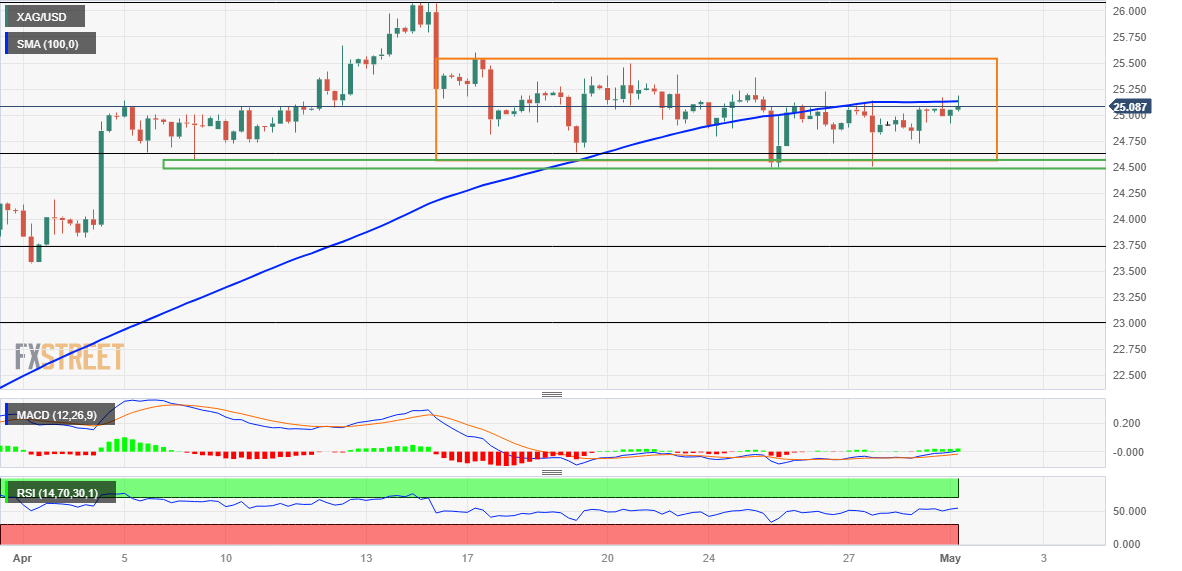
Silver Price Analysis: XAG/USD struggles to break through 100-period SMA on H4
- Silver struggles to gain any meaningful traction and oscillates in a narrow band on Monday.
- The technical setup favours bullish traders and supports prospects for some intraday gains.
- A convincing break below the 23.6% Fibo. is needed to negate the near-term positive bias.
Silver reverses an intraday dip to sub-$25.00 levels and touches a three-day daily high during the early European session on Monday, though lacks follow-through. The white metal has been struggling to make it through the 100-period Simple Moving Average (SMA), warranting some caution for bullish traders and before positioning for an extension of the recent bounce from the $24.50-$24.40 horizontal support.
Looking at the broader picture, the XAG/USD is holding comfortably above the 23.6% Fibonacci retracement level of the March-April rally. Moreover, technical indicators on the daily chart maintain their bullish bias and have been gaining positive traction on hourly charts. This, in turn, supports prospects for some intraday appreciating move back towards the $25.50 supply zone. Some follow-through buying will negate any negative bias and pave the way for additional gains.
The XAG/USD might then make a fresh attempt to conquer the $26.00 round-figure mark and retest a one-year high touched on April 14. The positive momentum could get extended further towards the next relevant hurdle near the $26.25-$26.30 region en route to the 2022 swing high, just ahead of the $27.00 round-figure mark.
On the flip side, the $24.50-$24.40 region might continue to act as immediate strong support, which if broken decisively might prompt some technical selling. The subsequent downfall has the potential to drag the XAG/USD below the $24.00 mark, towards testing the 38.2% Fibo. level, around the $23.70 area. The corrective decline could get extended further towards the $23.35-$23.30 horizontal support before the metal drops to the $23.00 confluence, comprising the 50% Fibo. level and the 50-day SMA.
Silver 4-hour chart
Key levels to watch
-
08:00
US ISM Manufacturing PMI April Preview: Gloom persists despite expanding US economy
- The ISM Manufacturing PMI is set to rise to 47.0 from 46.9, New Orders seen higher at 45.5.
- The ISM Prices Paid Index is seen expanding to 50.4 from 49.2 in the previous month.
- Purchasing Managers’ Index will be released by the ISM at 14:00 GMT.
The main Manufacturing Purchasing Managers’ Index (PMI) in the United States will be released by the Institute of Supply Management (ISM) in its Report on Business, where the latest manufacturing business survey result is displayed, at 14:00 GMT this Monday.
What to expect from the ISM manufacturing PMI report?
The most important manufacturing PMI in the United States is expected to have risen slightly to 47.0 in April from the 46.3 figure booked in March.
Among the sub-components of the report, the focus will be on Prices Paid as it reflects business sentiment around future inflation. The Manufacturing Prices Paid sub-index is likely to return to expansion, with a 50.4 expected for April. In March, the gauge stood at 49.2.
The ISM Manufacturing Employment Index is also seen a tad higher at 47.9 in the fourth month of the year while the New Orders Index for April is foreseen at 45.5 vs. March’s 44.3.
In March, the ISM survey showed that all subcomponents of its manufacturing PMI were below the 50 threshold for the first time in 14 years. The headline index tumbled to its lowest level in three years, as new orders plunged. The US Federal Reserve’s (Fed) relentless tightening to fight inflation raised borrowing costs and cooled demand for goods.
The data will provide a fresh update on the health of the US manufacturing sector amid tighter financial conditions and growing recession risks, especially after Thursday’s US Gross Domestic Product (GDP) data for Q1.
Apart from the US economic data, investors will track the broader market sentiment in the lead-up to Wednesday’s Federal Reserve policy announcements.
Analysts at TD Securities offer a brief preview of the key macro data and explain:
“Surveys already released point to a small rebound for both the ISM manufacturing and services indexes in April following their twin declines in March to 46.3 and 51.2, respectively. We look for the ISM Manufacturing index to advance modestly to a less dire level at 47.5. The services index likely rose as well but to 52.2, indicating a modest improvement in the pace of expansion for the sector."
When will the ISM manufacturing Purchasing Managers’ Index report be released and how could it affect EUR/USD?
The ISM Manufacturing PMI report is scheduled for release at 14:00 GMT, on May 1. Ahead of the key release, the US Dollar staged a decent comeback from two-week lows, fuelling a corrective downside in the EUR/USD pair toward 1.1000. The main currency pair hit a new 13-month high at 1.1096 last Wednesday.
A stronger headline print will bolster bets for a 25 basis points (bps) Fed rate hike move in early May. This, in turn, should fuel a fresh leg higher in the US Treasury bond yields, aiding the recovery of the US Dollar.
Last week, even though the headline US Q1 GDP number missed estimates of 2.0% QoQ by a wide margin at 1.1%, resilient personal consumption, inventories accumulation and a higher inflation component grabbed investors’ attention and ramped up odds of a quarter percentage point Fed rate hike next week to 86%. At the start of the week, the probability of a 25 bps Fed May rate hike stood at around 75%.
However, a softer report could act as a headwind to the ongoing recovery momentum in the US Dollar. The US Dollar decline could follow, driving the EUR/USD pair back toward the yearly top.
Traders will also pay close attention to the ISM survey's forward-looking New Orders sub-index, the Prices Paid component and the measure of factory employment for fresh implications on the Fed’s interest rates outlook. Markets could resort to repositioning ahead of the all-important Federal Reserve interest rates decision, which could affect the pair’s reaction to the ISM survey.
Eren Sengezer, Editor at FXStreet, offers a brief technical overview of the EUR/USD and writes: “Despite the pullback seen in the second half of the previous week, EUR/USD manages to hold above the 20-day Simple Moving Average, currently located at 1.0970. Meanwhile, the Relative Strength Index (RSI) indicator on the daily chart stays slightly above 50, reflecting the lack of bearish pressure for the time being”
"If buyers fail to defend 1.0970, additional losses toward 1.0900 (psychological level) and 1.0800 (50-day SMA) could be witnessed," Eren adds further. "In case the pair stabilizes above 1.1000 and continue to use this level as support, it could face interim resistance at 1.1050 (static level) before targeting fresh multi-month highs at 1.1100."
ISM manufacturing PMI related content
- EUR/USD faces major breakout resistance at 1.1075.
- Gold Price Forecast: XAU/USD remains confined in a familiar range ahead of key event/data risks.
- USD/JPY Outlook: Move beyond 200-day SMA will set the stage for additional near-term gains.
About the US ISM manufacturing PMI
The Institute for Supply Management (ISM) Manufacturing Index shows business conditions in the US manufacturing sector. It is a significant indicator of the overall economic condition in the US. A result above 50 is seen as positive (or bullish) for the USD, whereas a result below 50 is seen as negative (or bearish).
-
07:59
USD/JPY extends BoJ-inspired rally to refresh seven-week top near 137.00 despite sluggish yields
- USD/JPY stretches the BoJ-led rise despite holidays in major markets, sluggish yields.
- Downbeat JGBs, firmer US Dollar and First Republic bank woes also propel the Yen pair prices.
- Nikkie closed at the highest levels in nine months as easy money policy talks join mixed Japan data.
- US ISM Manufacturing PMI can entertain intraday traders, Fed, US NFP will be the key for clear directions.
USD/JPY bulls are in the driver’s seat even as holidays in multiple markets challenge the momentum during early Monday. That said, the Yen pair prods the 137.00 round figure while refreshing the highest levels since early March by the press time.
While checking the Yen pair’s latest up-moves, the biggest in 2023, a divergence between the monetary policy outlook of the Federal Reserve (Fed) and the Bank of Japan (BoJ) could be considered the key catalyst. Following that, downbeat Japanese Government Bond (JGB) yields and the US Dollar’s broad run-up also gain the attention of the USD/JPY pair watchers.
Furthermore, cautious optimism in the market, amid hopes that the US Federal Deposit Insurance Corporation (FDIC) will be able to defend the First Republic Bank also propel the Yen pair.
It’s worth noting that final readings of Japan’s Jibun Bank Manufacturing PMI for April confirmed the initial 49.5 figures, showing a contraction in activities, while the Japanese Consumer Confidence Index for the said month improved to 35.4 from 33.9 prior and 32.4 market forecasts.
On the other hand, the recently upbeat prints of the US Core PCE Price Index and early signals of the US inflation have propelled the hawkish Fed bets and underpinned the US Dollar’s rebound. That said, the US Dollar Index (DXY) renews its intraday high near 101.85 during a three-day uptrend by the press time.
Against this backdrop, market sentiment remains cautiously optimistic as the Fed’s 0.25% rate hike is already given and the First Republic bank-led wounds are likely to be overcome soon. Adding to the slightly positive mood, as well as the USD/JPY upside, could be the absence of traders from Europe, the UK, China and India, which in turn eases the recession talks and allow markets to consolidate previous pessimism.
Above all, the BoJ’s inaction on Friday and the newly appointed Governor Kazuo Ueda’s defense of the easy-money policy by saying, that it is “appropriate to continue monetary easing to achieve 2% inflation target in tandem with wage growth,” keeps USD/JPY buyers hopeful. That said, the BoJ dropped its forward guidance for interest rates and launched a review of its policies that will take more than a year, which in turn might have also fuelled the USD/JPY prices of late.
Moving on, a light calendar on Monday and holidays in multiple markets, together with a technical breakout, may allow the USD/JPY bulls to keep the reins with eyes on the US ISM Manufacturing PMI for April for intraday directions.
Technical analysis
Considering the overbought RSI, the 200-DMA near 137.00, quickly followed by the 137.90-138.20 resistance zone comprising multiple levels marked since early December 2022, to challenge the USD/JPY buyers.
-
07:31
Australia RBA Commodity Index SDR (YoY) above forecasts (-20.7%) in April: Actual (-19.2%)
-
07:19
Gold Price Forecast: XAU/USD grinds lower past $1,990 hurdle, focus on Fed, US NFP – Confluence Detector
- Gold price remains depressed after slipping beneath short-term key support confluence.
- Sour sentiment, firmer US Dollar weigh on XAU/USD price ahead of Fed, US NFP.
- Off in Europe, UK and China restrict market moves as crucial week begins.
Gold Price (XAU/USD) holds lower grounds within a short-term trading range past $2,000 as holidays in multiple markets restrict the bullion’s moves as the key week begins. Even so, the US Dollar’s recent run-up, backed by upbeat US inflation clues, weighs on the Gold price. On the same line, the First Republic bank woes, hawkish Fed bets and downbeat China PMIs for April also exert downside pressure on the Gold price amid a sluggish start to the crucial week comprising multiple central bank monetary policy meetings and the US jobs report for April.
It’s worth mentioning, however, that the US Treasury bond yields remain lackluster and the Wall Street also witnessed an upbeat week in the last, which in turn keeps the Gold buyers hopeful as crucial data/events loom.
Also read: Gold Price Forecast: XAU/USD remains confined in a familiar range ahead of key event/data risks
Gold Price: Key levels to watch
As per our Technical Confluence indicator, the Gold price remains depressed below the $1,990 resistance confluence, previous support, amid Monday’s inactive markets. That said, the stated level comprises Fibonacci 61.8% on one-week and one-month, as well as Fibonacci 38.2% on one-day.
In addition to the $1,990 hurdle, the 5-DMA and Fibonacci 23.6% on one-day, near $1,993, also restrict short-term XAU/USD upside.
Even if the Gold price crosses the $1,993 hurdle, a joint of the previous daily high and Fibonacci 38.2% on one-week, close to the $1,998 mark, will precede the $2,000 psychological magnet to challenge the XAU/USD buyers.
Meanwhile, the metal’s road towards the south appears smoother with minor supports near $1,980 comprising Pivot Point one-day S1.
Following that, the $1,970 support level comprising the lower Bollinger band on one-day and Pivot Point one-day S2 can act as the last defense of the Gold buyers.
Here is how it looks on the tool
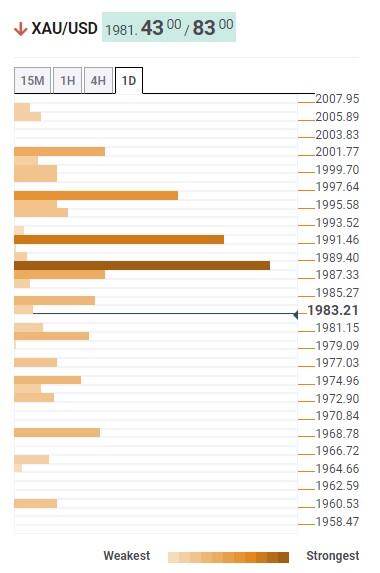
About Technical Confluences Detector
The TCD (Technical Confluences Detector) is a tool to locate and point out those price levels where there is a congestion of indicators, moving averages, Fibonacci levels, Pivot Points, etc. If you are a short-term trader, you will find entry points for counter-trend strategies and hunt a few points at a time. If you are a medium-to-long-term trader, this tool will allow you to know in advance the price levels where a medium-to-long-term trend may stop and rest, where to unwind positions, or where to increase your position size.
-
07:11
EUR/USD gauges cushion around 1.1000 as investors anticipate bumper rate hike from ECB
- EUR/USD has sensed a decline in the selling interest after correcting to near 1.1000.
- The USD Index is failing to attract more bids amid expectations of neutral interest rate guidance from the Fed.
- German inflation decelerated in April but is insufficient to stop the ECB from hiking interest rates.
The EUR/USD pair has found an intermediate cushion after a steep correction to near the psychological support of 1.1000. The major currency pair is defending its downside as investors as the US Dollar Index (DXY) is facing barricades in extending its recovery significantly above 101.80.
The US Dollar Index (DXY) is failing to attract more bids as investors are divided due to expectations of neutral interest rate guidance from the Federal Reserve (Fed). A consecutive 25 basis point (bp) interest rate hike from the Fed cannot be ruled out, however, further roadmap seems less bumpy amid easing United States inflationary pressures.
Meanwhile, S&P500 futures have added more gains in early London, portraying further improvement in the risk appetite. The 10-year US Treasury yields seem sideways above 3.45%.
Investors should brace a volatile action from the USD Index amid the release of the US ISM Manufacturing PMI (April) data. As per the consensus, the economic data is seen higher at 46.6 from the former release of 46.3. A figure below 50.0 is considered a contraction in manufacturing activities and consistency with consensus will make it the sixth consecutive contracting month.
Apart from that, New Orders data indicates forward demand is seen expanding to 45.5 vs. the prior release of 44.3.
On the Eurozone front, preliminary Gross Domestic Product (GDP) expanded by 0.1% in the first quarter while the street was anticipating an expansion of 0.2%. The shared continent has managed to doge contraction anyhow but the risk of recession has cemented. Annual GDP expanded by 1.3% lower than the estimates of 1.4% and the former release of 1.8%.
German inflation decelerated in April but is insufficient to stop the European Central Bank (ECB) from hiking interest rates further. ECB President Christine Lagarde is expected to continue announcing mega rate hikes to arrest sticky inflation.
-
06:52
USD/CAD Price Analysis: Key EMA confluence prods Loonie pair sellers near 1.3530
- USD/CAD struggles to defend corrective bounce from one-week low.
- U-turn from seven-week-old descending resistance line, downside break of fortnight-old previous support favor sellers.
- 100-EMA, 200-EMA together challenge Loonie pair bears amid steady RSI.
USD/CAD buyers struggle to keep the first daily gains in three as the quote retreats to 1.3550 heading into Monday’s European session. In doing so, the Loonie pair fades bounce off the convergence of the 100-bar and 200-bar Exponential Moving Averages (EMAs).
Given the quote’s clear pullback from a downward-sloping resistance line from early March, as well as a downside break of the previous support line stretched from April 14, the USD/CAD sellers remain hopeful. Adding strength to the downside bias are the bearish MACD signals.
However, the aforementioned key EMA confluence surrounding 1.3530 joins the downbeat RSI (14) to challenge the Loonie pair’s further declines.
In a case where the USD/CAD bears keep the reins past 1.3530, the 1.3500 round figure may act as an intermediate halt before directing the quote towards the early April swing low surrounding 1.3400. Following that, the previous monthly low of around 1.3300 will be in the spotlight.
Meanwhile, USD/CAD recovery needs validation from a two-week-long support-turned-resistance, around 1.3630 by the press time.
Even so, a convergence of the downward-sloping resistance line from early March and the 61.8% Fibonacci retracement level of March-April downside, near 1.3655, will be important to challenge the Loonie pair buyers.
Should the USD/CAD bulls manage to keep the reins past 1.3655, the odds of witnessing a gradual rally towards the late March swing high of 1.3804 and then to the yearly high marked in March surrounding 1.3860 can’t be ruled out.
USD/CAD: Four-hour chart
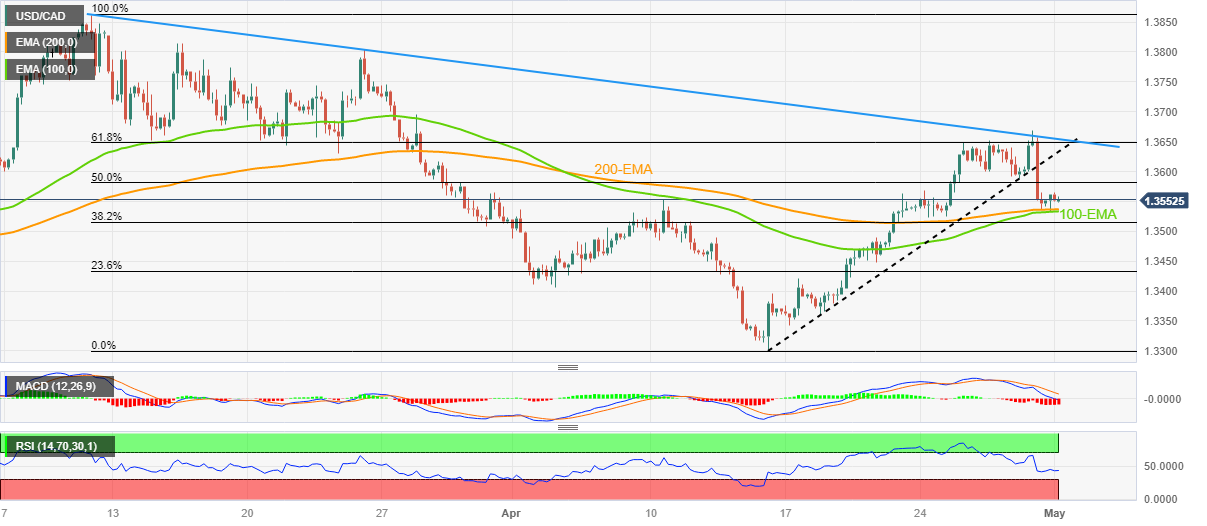
Trend: Limited downside expected
-
06:38
GBP/USD Price Analysis: Testing breakout of a rising channel pattern below 1.2550
- GBP/USD is showing signs of exhaustion in the upside momentum after failing to extend the upside above 1.2583.
- The risk profile is favoring risk-sensitive assets amid solid quarterly performance from US tech-savvy stocks.
- GBP/USD has delivered a breakout of the Rising Channel chart pattern and is testing it with a minor correction to near 1.2546.
The GBP/USD pair is showing signs of exhaustion in the upside momentum after failing to extend the upside above 1.2583. The Cable has turned sideways around 1.2560 as investors are preparing for monetary policy by the Federal Reserve (Fed), which is scheduled for Wednesday.
The risk profile is favoring risk-sensitive assets as S&P500 futures are having minimal gains after a bullish Friday. Investors were gung-ho for United States equities after a solid quarterly performance from tech-savvy stocks.
The US Dollar Index (DXY) is eyeing a further stretch in recovery above 101.80 as the Fed is expected to raise interest rates further to tame sticky core inflation. US Consumer spending is resilient amid higher outlays for services.
GBP/USD has delivered a breakout of the Rising Channel chart pattern on a two-hour scale. An upside break of the Rising Channel chart pattern indicates sheer strength in the Pound Sterling. The immediate support is plotted from April 14 high at 1.2546.
Advancing 20-period Exponential Moving Average (EMA) at 1.2530 indicates more upside ahead.
Also, the Relative Strength Index (RSI) (14) has shifted into the bullish range of 60.00-80.00, hinting that the upside momentum is active for now.
A successful test of breakout near April 14 high at 1.2546 will drive the asset towards a fresh 10-month high at 1.2597, which is 08 June 2022 high. A breach of the latter will expose the asset to May 27 high at 1.2667.
On the flip side, a slippage below April 10 low at 1.2345 will expose the asset to March 30 low at 1.2294 followed by March 27 low at 1.2219.
GBP/USD two-hour chart
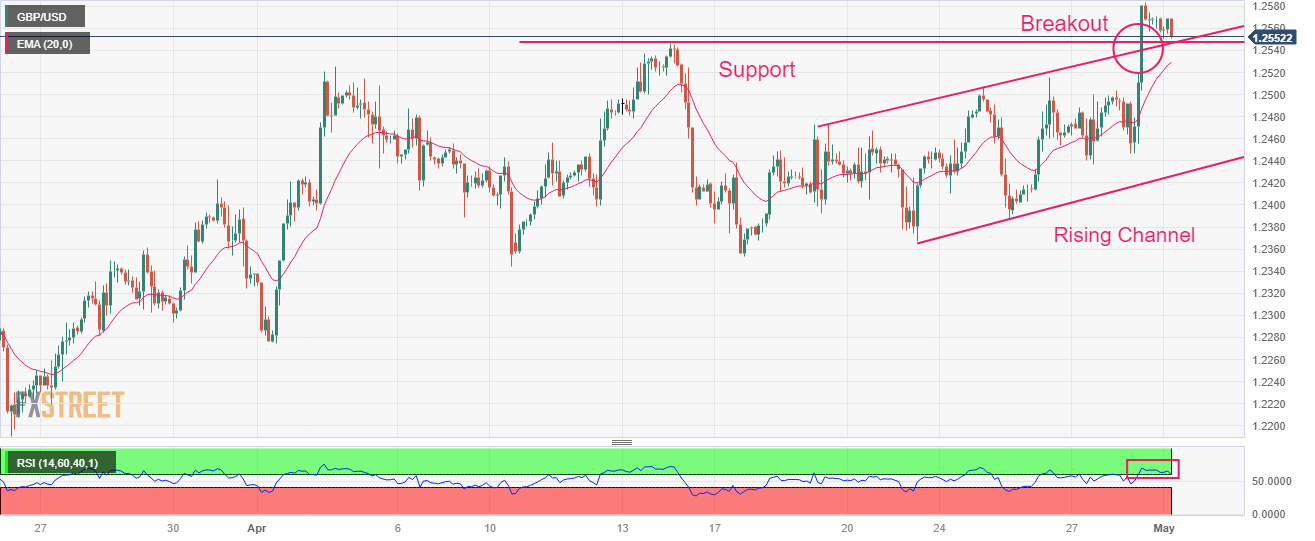
-
06:26
NZD/USD bulls prod 0.6200 as RBNZ defends hawks, UK-New Zealand trade deal looms
- NZD/USD grinds near intraday high during three-day uptrend.
- RBNZ rules out challenges to NZ banks from higher rates, NZ PM will meet British counterpart for FTA deal.
- Hawkish Fed bets, First Republic bank induced challenges to risk prod Kiwi pair buyers.
- New Zealand jobs report, US NFP appear the key data to watch for clear direction.
NZD/USD clings to mild gains around 0.6180 as the Kiwi pair buyers cheer upbeat catalysts at home while struggling with the US Dollar strength during early Monday.
The Kiwi pair’s latest gains could be linked to the Reserve Bank of New Zealand’s (RBNZ) latest commentary to defend the rate hikes. Also positive for the NZD/USD bulls are the hopes of a Free Trade Agreement (FTA) between New Zealand (NZ) and the UK as NZ PM Chris Hipkins recently announced he will meet his UK counterpart Rishi Sunak at 10 Downing Street this week to advance the two countries’ FTA.
The policymaker also said, “It’s estimated the FTA will see New Zealand goods exports to the UK increase by over 50 percent, boost New Zealand’s annual GDP by up to $1 billion and save approximately $37 million per year on tariff elimination from day one.”
On the other hand, the RBNZ released an excerpt of its May 2023 Financial Stability Report amid the ongoing banking fears due to the First Republic Bank’s latest fallout. The updates mentioned that banks in the country have relatively little risk from surging interest rates as they are required to hold sufficient capital to cover potential losses.
It’s worth noting, however, that the recently upbeat prints of the US Core PCE Price Index and early signals of the US inflation have propelled the hawkish Fed bets and underpinned the US Dollar’s rebound. That said, the US Dollar Index (DXY) renews its intraday high near 101.80 during a three-day uptrend as market players cheer on recently firmer US data while also rushing toward the greenback on fears emanating from the First Republic Bank.
Amid these plays, S&P 500 Futures remain directionless while the US Treasury bond yields pare the previous day’s heavy losses amid holidays in multiple markets including China, the UK, India and Europe.
Looking forward, intraday NZD/USD buyers may keep the reins ahead of the US ISM Manufacturing PMI for April. However, Wednesday’s NZ jobs report, US Federal Open Market Committee (FOMC) and Friday’s US Nonfarm Payrolls (NFP) will be crucial to watch for clear directions.
Technical analysis
A daily closing beyond the 200-DMA and a downward-sloping resistance line from early April, now immediate support near 0.6160-55, keeps NZD/USD buyers hopeful.
-
06:04
AUD/USD aims to surpass 0.6640 ahead of Fed/RBA policy, US ISM PMI in focus
- AUD/USD is eyeing a break above 0.6640 as USD Index is struggling to extend recovery.
- Market sentiment is upbeat amid an attempt of rescuing First Republic Bank by private lenders has eased US banking jitters.
- The RBA is expected to continue a pause on interest rate hikes as Australian inflation is consistently cooling.
The AUD/USD pair is looking to surpass the crucial resistance of 0.6640 in the Asian session. The Aussie asset has stretched its rally as the US Dollar Index (DXY) is struggling in extending its recovery above 101.80. The Australian Dollar will be required immense strength for conquering the 0.6640 amid anxiety ahead of the monetary policy by the Federal Reserve (Fed).
S&P500 futures are having some gains in the Asian session after a bullish Friday, portraying positive market sentiment. An attempt of rescuing First Republic Bank by private lenders has eased US banking jitters. JP Morgan and PNC are submitting a final bid for First Republic Bank in Federal Deposit Insurance Corporation (FDIC) auction.
The US Dollar Index (DXY) is facing barricades in extending its rally above 101.80 as investors are divided over further movement. One more interest rate hike of 25 basis points (bps) from the Fed is widely expected as the United States' core inflationary pressures are critically persistent. However, investors will keenly focus on guidance on interest rates.
But before that, US ISM Manufacturing PMI will keep USD Index in action. Investors are anticipating mild gains in PMI figures to 46.6 vs. the prior release of 46.3. New Orders Index data that indicates forward demand is expected to jump to 45.5 from the former release of 44.3.
On the Australian Dollar front, Tuesday’s interest rate decision by the Reserve Bank of Australia (RBA) will be in focus. Considering the fact that Australian inflation is declining consistently for the past three months and RBA policymakers are anticipating a slowdown in the economy ahead, a continuation of the pause is widely expected.
-
06:00
Japan Consumer Confidence Index above forecasts (32.4) in April: Actual (35.4)
-
05:51
USD/INR Price Analysis: Indian Rupee sellers jostle with immediate resistance line near 81.80
- USD/INR buyers prod eight-day-old descending resistance line while defending Friday’s corrective bounce.
- Gradually improving RSI conditions back late rebound but key SMAs challenge Indian Rupee sellers.
- Two-month-old support area appears a tough nut to crack for USD/INR bears.
USD/INR snaps three-day downtrend during a holiday-driven illiquid trading session on early Monday. In doing so, the Indian Rupee (INR) pair jostles with a one-week-old downward-sloping trend line resistance following a sustained bounce off a seven-week-old horizontal support zone.
Given the sluggish MACD signals and a gradually improving RSI (14) line, the USD/INR price is likely to mark another attempt in crossing the aforementioned trend line resistance, around 81.80 by the press time.
However, the 100-SMA and the 200-SMA, respectively near 81.95 and 82.10, could challenge the USD/INR bulls afterward.
Even so, a five-week-old falling resistance line, near 82.40 by the press time, could challenge the Indian Rupee sellers before giving them control.
Meanwhile, USD/INR pullback may find multiple supports near 81.65, a break of which will highlight a seven-week-old horizontal support zone near 81.50 for the pair sellers to watch.
In a case where the Indian Rupee buyers dominate past 81.50, the odds of witnessing the pair’s slump towards the 81.00 round figure and then to the Year-To-Date (YTD) low surrounding 80.90 can’t be ruled out.
Overall, USD/INR consolidates recent losses amid holidays in India.
USD/INR: Four-hour chart
-01052023-638185134795205811.png)
Trend: Limited upside expected
-
05:16
USD/CHF corrects to near 0.8940 as USD Index struggles to extend recovery, Fed policy eyed
- USD/CHF has slipped marginally to near 0.8940, however, the upside seems favored ahead of Fed policy.
- Persistent US core inflation supports the continuation of the policy-tightening spell by the Fed.
- US labor market conditions are still tight as firms are offering higher wages for recruiting fresh talent.
The USD/CHF pair has corrected gradually after failing to sustain above the immediate resistance of 0.8950 in the Tokyo session. The Swiss franc asset is expected to resume its upside journey as the appeal for the US Dollar Index (DXY) is improving ahead of the release of the Federal Reserve’s (Fed) monetary policy.
S&P500 futures are adding more gains in Asia after recovering losses, portraying a risk appetite theme in which declines are heavily bought by market participants. A recovery in the USD index is also supporting US Treasury yields. The return on 10-year US Treasury bonds has rebounded above 3.45%.
The USD Index is struggling in extending its recovery above 101.80, however, the upside seems favored as the pre-Fed anxiety is expected to kick in. One more interest rate hike announcement from Fed chair Jerome Powell is in the pipeline as US consumer spending is resilient and Employment Cost Index is not showing stagnation.
Friday’s core Personal Consumption Expenditure (PCE) Price Index showed that the pace in consumer spending for goods and services excluding oil and food remained steady at 0.3%. The headline price index is consistently declining due to lower oil prices, however, the core inflation seems extremely persistent, which supports the continuation of the policy-tightening spell by the Fed.
Apart from that, US Labor Cost Index (Q1) climbed to 1.2% from the consensus of 1.1%. It indicates that labor market conditions are still tight as firms are offering higher wages for recruiting fresh talent.
On the Swiss Franc front, weak Real Retail Sales data has trimmed fears of inflation in the Swiss economy. On Friday, the economic data contracted sharply by 1.9% while the street was anticipating an expansion by 1.7% on an annual basis. This would be a relief for the Swiss National Bank (SNB), which is struggling to tame stubborn inflation.
Investors should be aware that the Swiss economy will remain closed on Monday on account of Labor Day.
-
05:15
Natural Gas Price Analysis: XNG/USD retreats towards $2.34-35 support confluence
- Natural Gas Price takes offers to refresh intraday low, reverses from six-week high.
- Failure to cross one-month-old descending resistance line favor pullback moves.
- 100-SMA, 200-SMA and three-week-long rising support line together prods XNG/USD bears.
Natural Gas (XNG/USD) price prints the first daily loss in three as bears prod $2.42 level during early Monday morning in Europe.
In doing so, the energy instrument extends the week-start pullback from a downward-sloping resistance line from early March.
Given the sluggish MACD signals, the XNG/USD’s latest retreat is likely to extend towards short-term key support of around $2.35-34 comprising the 100-bar SMA, 200-bar SMA and a three-week-old ascending trend line.
In a case where the Natural Gas price drops below $2.34, the odds of witnessing a slump towards the Year-To-Date (YTD) low marked in April around $2.11 can’t be ruled out. However, the $2.00 appears a tough nut to crack for the XNG/USD bears and can prod the quote’s further downside.
Alternatively, an upside clearance of the aforementioned resistance line, close to $2.48 at the latest, can convince the Natural Gas buyers to aim for the latest swing high surrounding $2.58.
Following that, the 50% and 61.8% Fibonacci retracement levels of the XNG/USD downturn from early March to mid-April, near $2.60 and $2.71 respectively, can challenge the Natural Gas buyers before the March 08 swing high of $2.78 and the $3.00 gain the market’s attention.
To sum up, the Natural Gas price remains on the bear’s radar but the road towards the south appears long and bumpy.
Natural Gas Price: Four-hour chart

Trend: Limited downside expected
-
04:46
Gold Price Forecast: XAU/USD sees downside below $1,970 as USD Index rebounds and US banking woes ease
- Gold price is expected to display sheer weakness below $1,970.00 amid a recovery in the USD Index.
- Easing US banking jitters has trimmed the appeal for the Gold price as a safe-haven.
- The USD Index will remain in action amid the release of the US ISM Manufacturing PMI data.
Gold price (XAU/USD) is declining towards its crucial support of $1,970.00 in the Asian session. A solid recovery in the US Dollar Index (DXY) amid upbeat expectations that the Federal Reserve (Fed) will raise interest rates one more time by 25 basis points (bps) on Wednesday is impacting the Gold price. The precious metal might show a significant fall after a confident break below $1,970.00 as it has been acting as a major support from the past week.
S&P500 futures have recovered their entire losses generated in early Asia and has shifted into positive territory, portraying an upbeat market mood. Also, the demand for US government bonds looks solid. The 10-year US Treasury yields have dropped to near 3.43%.
The USD Index is expected to show a power-pack action on Monday amid the release of the United States ISM Manufacturing PMI (April) data. As per the consensus, the economic data is seen higher at 46.6 from the former release of 46.3. A figure below 50.0 is considered a contraction in manufacturing activities and consistency with consensus will make it the sixth consecutive contracting month.
The headlines that JP Morgan and PNC are submitting final bids for First Republic Bank in Federal Deposit Insurance Corporation (FDIC) auction has eased United States banking jitters, which has trimmed appeal for the Gold price.
Apart from that, New Orders data that indicates forward demand is seen expanding to 45.5 vs. the prior release of 44.3.
Meanwhile, consumer spending in the United States economy seems resilient despite higher interest rates from the Fed. A surprise jump in Employment Cost Index (Q1) to 1.2% indicates that labor market conditions are upbeat and the Fed has no other option than to continue paddling interest rates.
Gold technical analysis
Gold price is consolidating in a narrow range of $1,971-2,021 from the past week as investors are awaiting the monetary policy by the Fed for a decisive move. Upward-sloping trendline March 22 low at $1,934.34 is acting as a cushion for the Gold bulls.
The 20-period Exponential Moving Average (EMA) at $1,990.28 is showing stickiness to the Gold price, indicating a lackluster performance.
Meanwhile, the Relative Strength Index (RSI) (14) is on the verge of slipping into the bearish range of 20.00-40.00, which will activate the bearish momentum.
Gold two-hour chart
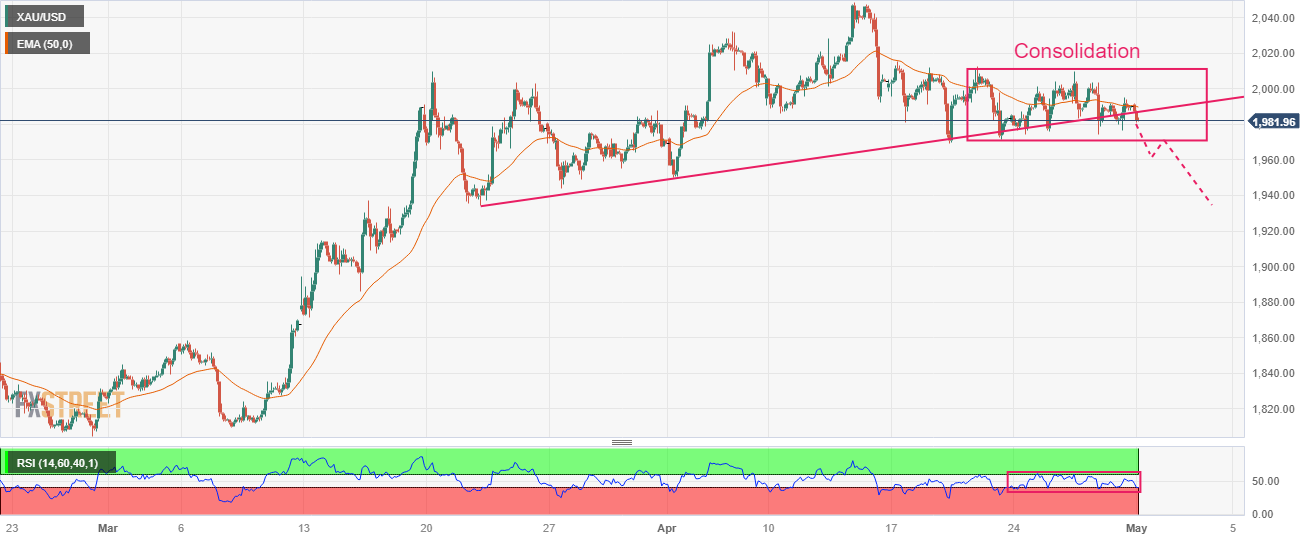
-
04:13
USD/JPY Price Analysis: Overbought RSI, 200-DMA prod BoJ-led rise at two-month high
- USD/JPY takes the bids to refresh multi-day high, cheers upside break of a descending trend line from November.
- Yen pair buyers may struggle as 200-DMA, five-month-old horizontal resistance zone join overbought RSI (14).
- Bullish MACD signals, previous resistance line challenge USD/JPY sellers.
USD/JPY buyers prod the 200-DMA hurdle as they push the limits of a two-month high near 137.00 during early Monday. In doing so, the Yen pair rises for the third consecutive day while cheering the previous day’s upside break of a downward-sloping resistance line from the last November, now the immediate support, as well as the bullish MACD signals.
However, the 200-DMA level surrounding the 137.00 round figure joins the overbought RSI (14) line to challenge the USD/JPY bulls of late.
Even if the Yen pair manages to overcome the 137.00 hurdle, a horizontal region comprising multiple levels marked since early December 2022, between 137.90 and 138.20, will be crucial for the pair buyers to watch.
Should the quote manages to remain firmer past 138.20, the odds of witnessing the USD/JPY rally targeting a 61.8% Fibonacci retracement level of the October 2022 to January 2023 downturn, near 142.55, will be in the spotlight.
Alternatively, USD/JPY pullback remains elusive unless the quote stays beyond the resistance-turned-support line, around 135.85 by the press time.
Even if the Yen pair drops below 135.85, the mid-April swing high around 135.15 and the five-week-old ascending support line near 133.70 could challenge the USD/JPY bears.
Overall, USD/JPY is likely to remain firmer but the quote’s additional rise depends upon a 138.20 breakout.
USD/JPY: Daily chart

Trend: Pullback expected
-
03:46
S&P500 Futures, yields remain pressured as traders await First Republic updates
- Market sentiment remains fragile the key week comprising multiple top-tier data/events begins with holidays at many bourses.
- S&P 500 Futures grind near two-week high after Wall Street’s upbeat close, mildly offered of late.
- US Treasury bond yields stay depressed as hawkish Fed bets join recession woes.
- Results for FDIC-organized First Republic bids eyed ahead of ECB, Fed and US NFP.
Financial markets portray a cautious mood while waiting for the key First Republic bidding results early Monday. Adding strength to the sour sentiment could be the fears emanating from recent hawkish Fed bets and fears of recession. However, holidays in China, the UK and Europe prod the traders and limit the moves as the key week comprising multiple central bank meetings and the US employment report begins.
While portraying the mood, the S&P 500 Futures snap a two-day uptrend near 4,185, making rounds to the highest levels in a fortnight, whereas the US 10-year and two-year Treasury bond yields seesaw around 3.45% and 4.05% after falling notably the previous day.
A slew of top-tier US banks, including JP Morgan, participated in the bidding for the Federal Deposit Insurance Corporation (FDIC) induced resolution for the First Republic Bank. The early updates suggested the results will be out before Monday morning in Asia but the traders are still waiting for a short-term solution to the problem at hand.
On the other hand, the CME Group FedWatch Tool suggests higher odds of the Fed’s 0.25% rate hike in May and June, as well as a reduction in the market’s bets on the September rate cut from the US central bank. The reason for the latest swing in the hawkish Fed concerns could be linked to the recently firmer US data suggesting an increase in the US inflation pressure. On Friday, the Fed’s preferred inflation gauge, namely the Core Personal Consumption Expenditure (PCE) Price Index, for March matched 0.3% market forecasts and prior to MoM but rose to 4.6% from 4.5% expected on YoY, with an upwardly revised previous reading of 4.7%. On the same line, the US Employment Cost Index also increased by 1.2% in Q1 2023, versus the 1% increase marked previously.
Elsewhere, the latest easing in the US, Germany and Eurozone Gross Domestic Product (GDP) for the first quarter (Q1) of 2023 renew recession fears and prod the market players.
Alternatively, upbeat Q1 earnings from the tech-giants like Alphabet and Meta keep equity buyers hopeful even as fears of Apple’s disappointment prod the S&P 500 Futures of late.
Moving on, holidays in the UK, Eurozone and China may restrict Monday’s market moves but the First Bank announcement and the US ISM Manufacturing PMI may entertain momentum traders. However, major attention will be given to Wednesday’s US Federal Open Market Committee (FOMC) and Friday’s US Nonfarm Payrolls (NFP) for clear directions.
Also read: Nikkei average rallies to highest since August 2022
-
03:30
Commodities. Daily history for Friday, April 28, 2023
Raw materials Closed Change, % Silver 25.046 0.57 Gold 1989.6 0.1 Palladium 1498.19 0.49 -
03:26
EUR/USD Price Analysis: Bears eye 1.0960 as US Dollar cheers pre Fed, ECB anxiety
- EUR/USD takes offers to refresh intraday low, prints three-day losing streak.
- Euro bears attack three-week-old ascending support line, 200-EMA.
- Impending bear cross on MACD, failure to keep bounce off one-week-old horizontal support favor sellers.
- Wait for First Republic bidding results to join hawkish Fed bets to weigh on EUR/USD ahead of key monetary policy meetings.
EUR/USD renews intraday low as bears attack the 1.1000 round figures early Monday amid broad US Dollar strength, as well as sluggish markets due to holidays at many bourses.
Also read: EUR/USD drops towards 1.1000 as ECB hawks retreat, First Bank roils the mood, US NFP, Fed eyed
In doing so, the Euro pair drops for the third consecutive day as it breaks the 200-bar Exponential Moving Average (EMA) and an ascending trend line from April 10.
Given the Euro pair’s failure to defend the previous week’s bounce off short-term horizontal support, coupled with the recently impending bearish signals from the MACD indicator, the EUR/USD sellers are likely to keep the reins.
That said, the major currency pair presently drops towards a horizontal support zone comprising multiple levels marked since April 25, near 1.0960.
However, a two-week-long ascending trend line near 1.0945 could challenge the EUR/USD bears afterward.
On the contrary, EUR/USD recovery may aim for the 1.1050 round figures before directing the pair buyers towards a 12-day-long horizontal resistance area surrounding 1.1065-70.
Following that, the recently marked multi-month high of 1.1095 can prod the Euro pair buyers before directing them to the March 2022 peak close to 1.1185.
EUR/USD: Hourly chart
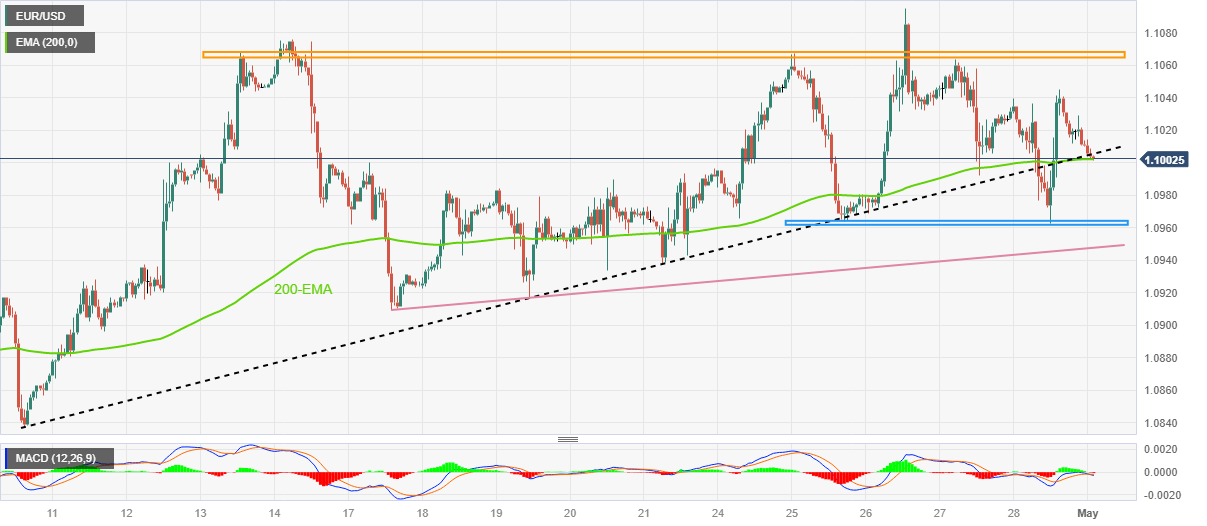
Trend: Further downside expected
-
03:03
AUD/USD Price Analysis: Bears eye a break of 0.6607
- 0.6620 was the structure that gave way to 0.6574 recent lows.
- 0.6650 is key resistance and the focus will be on a break of 0.6607.
AUD/USD has popped higher in the opening session to a high of 0.6623 but the daily technical outlook is bearish while on the back side of the broader and micro trendlines as follows:
AUD/USD daily chart
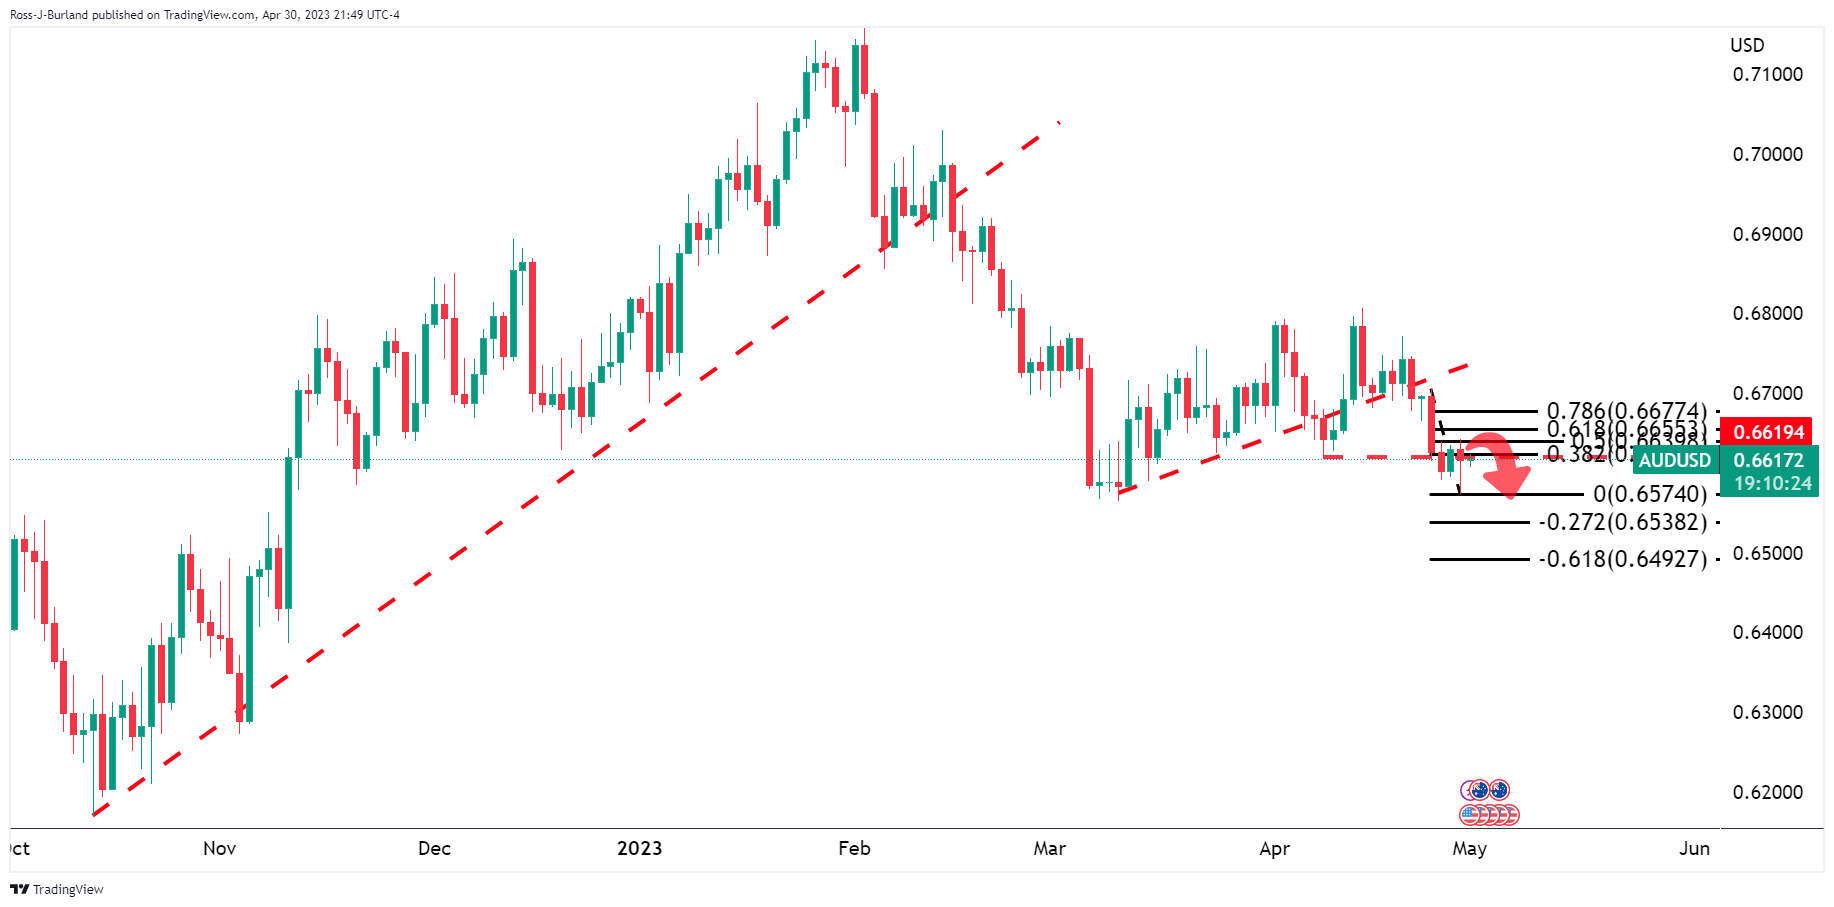
The price is in a broken-down market and besides the meanwhile correction, the 0.6550s are eyed.
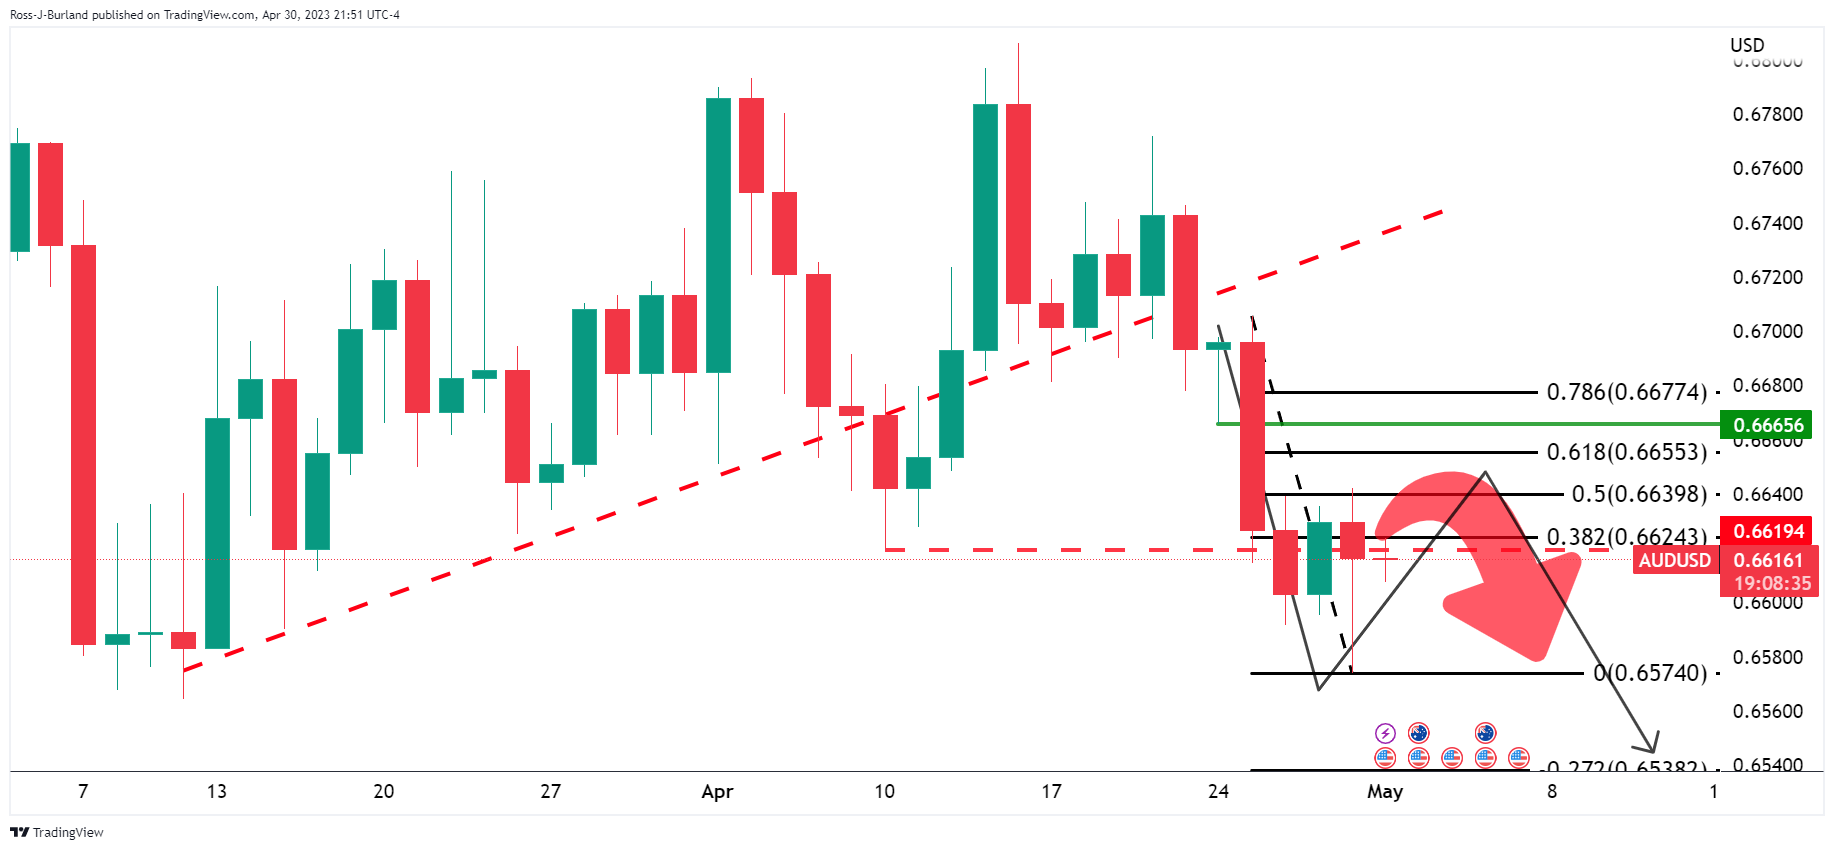
0.6620 was the structure that gave way to 0.6574 recent lows. If the price struggles to get above 0.6650, then the focus will be on a break of 0.6607 to give way to the downside.
-
02:54
USD/CAD recovery fades near 1.3550 despite softer Oil price, First Republic, US/Canada data eyed
- USD/CAD eases from intraday high as market players seek more clues to extend week-start moves.
- Cautious mood ahead of First Republic announcements, US/Canada jobs report prod buyers.
- Oil price ease amid broad US Dollar gains, recession woes.
- Fed’s 0.25% rate hike is given but clues for future moves will be the key for near-term Loonie moves.
USD/CAD seesaws around 1.3550-60 during the first positive day in three early Monday. In doing so, the Loonie pair cheers recent weakness in WTI crude oil price amid the US Dollar’s strength due to the risk-off mood. However, cautious mood ahead of the key US and Canadian statistics prod the Loonie pair buyers.
WTI crude oil snaps two-day uptrend as sellers approach the $76.00, fading the last week’s bounce off April’s low. In doing so, the black gold bears the burden of the US Dollar’s broad run-up amid sour sentiment and recently hawkish Fed bets.
That said, the US Dollar Index (DXY) renews intraday high near 101.80 during three-day uptrend as market players cheer recently firmer US data while also rushing towards the greenback on fears emanating from the First Republic Bank.
During the weekend, the Federal Deposit Insurance Corporation (FDIC) called in bids for the troubled US bank in which multiple top-tier private organizations, including JP Morgan, took part. The results are up for release and can give only knee-jerk optimism as an immediate defense of the bank by a private player isn’t a solution to the broad banking problems.
Talking about the US data, first readings of the US Gross Domestic Product (GDP) for the first quarter (Q1) of 2023, also known as Advance readings, marked mixed outcomes. That said, the headline US GDP Annualized eased to 1.1% from 2.0% expected and 2.6% prior but the GDP Price Index inched higher to 4.0% on an annualized basis from 3.9% prior and 3.8% market consensus. Further, the Fed’s preferred inflation gauge, namely the Core Personal Consumption Expenditure (PCE) Price Index, for March matched 0.3% market forecasts and prior to MoM but rose to 4.6% from 4.5% expected on YoY, with an upwardly revised previous reading of 4.7%. On the same line, the US Employment Cost Index also increased by 1.2% in Q1 2023, versus the 1% increase marked previously.
On the other hand, dovish bias surrounding the Bank of Canada (BoC) and an absence of major Canadian data in the last week allowed the USD/CAD buyers to keep the reins.
Against this backdrop, the CME Group FedWatch Tool suggests higher odds of the Fed’s 0.25% rate hike in May and June, as well as a reduction in the market’s bets on the September rate cut from the US central bank. With this, S&P 500 Futures print mild losses even as Wall Street closed positive and the yields eased.
Looking forward, Canada S&P Global Manufacturing PMI and US ISM Manufacturing PMI for April may entertain intraday traders of the USD/CAD pair, together with the First Republic Bank news. However, major attention will be given to Wednesday’s Federal Reserve (Fed) monetary policy meeting and Friday’s employment data from the US and Canada for clear directions.
Technical analysis
USD/CAD pair’s latest rebound could be linked to its inability to break the 100-DMA support of around 1.3525. However, the Loonie pair buyers need validation from the 50-DMA hurdle surrounding 1.3590 to retake control.
-
02:53
GBP/USD eyes 1.2600 despite consistent US consumer spending support Fed rate hike
- GBP/USD is looking to capture 1.2600 despite an extended recovery in the US Dollar Index.
- Resilience in US consumer spending for core goods and services supports more rate hikes from the Fed.
- UK’s inflationary pressures are showing no signs of deceleration amid a labor shortage and consistently elevating food prices.
The GBP/USD pair is aiming to claim the round-level resistance of 1.2600 in the Asian session. The Cable has corrected marginally after failing to sustain above 1.2580. However, the scale of correction in the Cable is critically low in comparison with the recovery in the US Dollar Index (DXY), which indicates that Pound Sterling is holding some strength.
S&P500 futures have trimmed losses generated in early Asia as investors are focusing again on solid quarterly results reported by United States tech-savvy companies. A recovery in the risk appetite of the market participants is expected to improve the appeal for risk-perceived assets.
The USD Index is facing barricades in extending its recovery above 101.80. The greenback index slipped sharply on Friday despite a consistent increase in consumer spending. March’s core Personal Consumption Expenditure (PCE) Price Index landed at 0.3%, consistent with consensus and the former release. Resilience in spending outlays for core goods and services indicates that inflation would remain persistent and the Federal Reserve (Fed) is needed to stay affirmed on its path of policy-tightening.
On Monday, US ISM Manufacturing PMI data will be in focus. Investors are anticipating mild gains in PMI figures to 46.6 vs. the prior release of 46.3. New Orders Index data that indicates forward demand is expected to jump to 45.5 from the former release of 44.3.
On the Pound Sterling front, the street is anticipating that the Bank of England (BoE) will keep its policy-tightening spell continuing to arrest United Kingdom’s double-digit inflation figure. UK’s inflationary pressures are extremely stubborn and showing no signs of deceleration amid a labor shortage and consistently elevating food prices.
-
02:29
WTI Price Analysis: Oil sellers need validation from 200-SMA level of $75.85
- WTI crude oil snaps two-day winning streak, holds lower ground near intraday bottom.
- Fortnight-old descending resistance line, 50-SMA restrict immediate upside.
- 200-SMA, 50% Fibonacci retracement limit nearby downside as bears take a breather.
WTI crude oil retreats to $76.00 as it fades the previous day’s corrective bounce off 50% Fibonacci retracement of the March-April uptrend amid early Monday. In doing so, the black gold retreats from a two-week-old falling trend line and the 50-SMA. Adding strength to the downside bias is the steady RSI (14) line.
However, the 200-SMA level of around $75.85 and bullish MACD signals challenge the energy benchmark buyers.
That said, the quote’s weakness past $75.85 needs validation from the 50% Fibonacci retracement level of around $73.85 and the late March swing low of around $72.70 to convince the Oil bears.
Following that, the WTI crude oil price can approach the 61.8% Fibonacci retracement level, also known as the golden Fibonacci ratio, to act as the last defense for the Oil buyers.
On the flip side, the aforementioned immediate descending resistance line and the 50-SMA, respectively near $76.80 and $77.10, can challenge short-term Oil buyers.
Even so, multiple levels near $79.50, the $80.00 round figure and $81.60 can prod the WTI bulls before directing them to the latest multi-day peak of $83.40, marked in April.
To sum up, WTI crude oil price is likely to remain on the bull’s radar unless staying below $72.70.
WTI crude oil: Four-hour chart
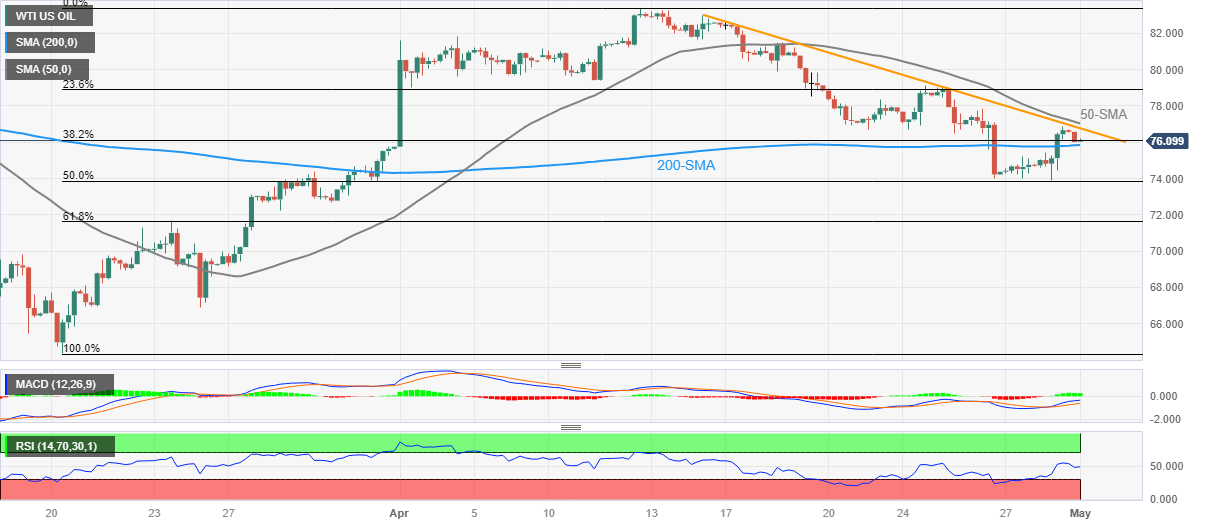
Trend: Limited downside expected
-
02:23
GBP/JPY Price Analysis: Sets to test six-month high above 172.00 amid ultra-easy BoJ policy
- GBP/JPY is aiming to capture a six-month high of 172.17 amid BoJ’s ultra-dovish policy.
- BoJ Ueda supported the continuation of ultra-dovish monetary policy to keep inflationary pressures steadily above 2%.
- A demand zone is placed in a range of 165.42-167.95 which will provide a cushion to the Pound Sterling.
The GBP/JPY pair is approaching the six-month high of 172.17 after an upside break of the consolidation formed around 171.00 in the Asian session. The Japanese Yen has been heavily impacted as the new Bank of Japan (BoJ) Governor Kazuo Ueda supported the continuation of ultra-dovish monetary policy to keep inflationary pressures steadily above 2%.
The BoJ announced no change in the Yield Curve Control (YCC) unanimously confirming that consideration of an exit from the ultra-loose policy is not in the picture.
On the pound Sterling front, the focus is on the interest rate decision by the Bank of England (BoE), which will be announced next week.
GBP/JPY is aiming to capture the six-month resistance of 172.17 horizontally plotted from 31 October 2022 high. A demand zone is placed in a range of 165.42-167.95 which will provide a cushion to the Pound Sterling.
Upward-sloping 10-and 20-period Exponential Moving Averages (EMAs) at 168.27 and 166.87 respectively, add to the upside filters.
Adding to that, the Relative Strength Index (RSI) (14) is oscillating in the bullish range of 60.00-80.00, indicating that the bullish momentum is already active.
For further upside, a confident break above a six-month high of 172.17 will drive the cross toward a fresh seven-year high of around 172.50 followed by 08 January 2016 high at 173.38.
On the flip side, a breakdown below April 25 low at 165.42 will drag the pair toward March 01 high at 164.40 and March 07 high at 163.86.
GBP/JPY daily chart
-638185009300497456.png)
-
02:06
EUR/JPY advances to fresh high since September 2008 as BoJ concerns drown Yen, focus on ECB
- EUR/JPY takes the bids to refresh multi-day top amid broad-based Yen selling.
- BoJ held monetary policy intact, new Governor Ueda defends currency methods of taming inflation.
- Comparatively more hawkish ECB bias, despite recently softer EU data, also propels cross-currency pair prices.
- Downbeat Japan Jibun Bank Manufacturing PMI adds strength to run-up despite First Republic Bank inflicted woes.
EUR/JPY bulls cheer the broad-based JPY weakness to refresh highest levels in more than 15 years to 150.60 during early Monday. In doing so, the cross-currency pair also ignore the latest retreat in the European Central Bank's (ECB) hawkish bias ahead of the bloc’s central bank’s monetary policy meeting, mainly due to the downbeat data.
Hopes of continued easing on the part of the Bank of Japan (BoJ) join downbeat US Treasury bond yields and the US government’s efforts to tame the banking crisis to favor the EUR/JPY pair’s latest run-up.
After witnessing an exodus of withdrawal and a slump in the First Republic's share price, the Federal Deposit Insurance Corporation (FDIC) called in bids for the troubled US bank in which multiple top-tier private organizations, including JP Morgan, took part. The results are up for release and can give only knee-jerk optimism as an immediate defense of the bank by a private player isn’t a solution to the broad banking problems. On the contrary, the same raises fears of such actions for the larger public banks in the future and hence can keep the risk-off mood intact.
On Friday, BoJ held the current monetary policy unchanged, as expected, while the newly appointed Governor Kazuo Ueda said that it is “appropriate to continue monetary easing to achieve 2% inflation target in tandem with wage growth.” That said, the BoJ dropped its forward guidance for interest rates and launched a review of its policies that will take more than a year.
On the other hand, ECB hawks retreat amid downbeat EU and German statistics released in the last week. On Friday, preliminary readings of Germany’s inflation for April, as per the Harmonized Index of Consumer Prices (HICP) index, eased to 7.6% YoY versus 7.8% expected and prior. Further, the nation’s inflation per the Consumer Price Index (CPI) also softened to 7.2% YoY compared to 7.3% market consensus and 7.4% previous readings.
Further, the first readings of the Eurozone Gross Domestic Product (GDP) for the first quarter (Q1) of 2023 came in mixed for QoQ and YoY. That said, the Eurozone Q1 GDP improved to 0.1% QoQ from 0.0% prior, versus 0.2% expected, whereas the yearly growth eased to 1.3% from 1.4% market forecasts and 1.8% prior. On the same line, Germany’s Q1 GDP improved on a quarterly basis, to 0.0% from -0.4% prior and 0.2% analysts’ estimations, whereas the yearly figures dropped to -0.1% from 0.9% previous readings and 0.3% market forecasts.
Moving on, EUR/JPY pair traders should keep their eyes on the risk catalysts and the BoJ headlines amid holidays in Europe. However, Thursday’s ECB monetary policy meeting will be crucial to watch as hawks step back and weigh on the odds of the 0.50% rate hike, with most market players expecting 0.25% rate increase.
Technical analysis
Unless dropping back below the October 2022 high of 148.40, the EUR/JPY pair appears well-set to challenge the September 2008 peak of near 156.85.
-
02:04
Nikkei average rallies to highest since August 2022
- Japan's Nikkei average rallied 0.90% in the open.
- US stocks moved up on Friday and the Bank of Japan kept to its easing policy.
Japan's benchmark Nikkei average opened up 0.90% and scored a high of 2,9143.89 on Monday, while the broader Topix gained 0.63% at 2,070.37.
The move follows US stocks gaining on Friday and after the Bank of Japan kept to its easing policy which sent the Yen lower to a 7-week low against the US Dollar. The Dow Jones Industrial Average rose 272 points, or 0.8%, to 34,098.16, the S&P 500 gained 34.13 points, or 0.83%, to 4,169.48 and the Nasdaq Composite added 84.35 points, or 0.69%, to 12,226.58.
The BoJ kept monetary policy unchanged and said it would “patiently” continue with monetary easing. Also, Governor Kazuo Ueda said the Japanese economy faces a bigger risk from premature tightening than from a delay. The members voted 9-0 to maintain its policy balance rate at 0.1% and keep its 10-year JGB yield target at about 0%. The BoJ also cut its 2023 Japan Gross Domestic Product estimate to 1.4% from a previous estimate of 1.7% and raised its 2023 core Consumer Price Index estimate to 1.8% from 1.6%. Meanwhile, instead of tweaking forward guidance, BoJ removed it entirely and this puts the focus on data. BoJ also decided to embark on a broad perspective review of policy for a relatively long 1 to 1.5 years, reviewing policies used over the longer term.
-
02:03
Australia TD Securities Inflation (YoY): 6.1% (April) vs 5.7%
-
02:03
Australia TD Securities Inflation (MoM) fell from previous 0.3% to 0.2% in April
-
01:51
Silver Price Analysis: XAG/USD extends pullback from 100-SMA below $25.00
- Silver price takes offers to refresh intraday low, snaps two-day winning streak.
- Steady RSI, U-turn from the key SMA favor XAG/USD sellers in approaching immediate support line.
- One-month-old horizontal support, 200-SMA can challenge Silver bears.
Silver price (XAG/USD) drops to $24.95, printing the first intraday loss, so far, in three during early Monday. In doing so, the bright metal extends late Friday’s U-turn from the 100-bar Simple Moving Average (SMA).
Given the steady RSI (14) line also favoring the XAG/USD’s latest weakness, the metal price can witness further downside towards an upward-sloping support line from the last Thursday, close to $24.85 by the press time.
Should the Silver price breaks the immediate support, a horizontal area comprising multiple lows marked since early April, near $24.55-50, will precede the 200-SMA level of near $24.10 to challenge the XAG/USD bears.
In a case where the bullion price remains weak past $24.10, the $24.00 round figure may act as the last defense of the buyers.
Meanwhile, the 100-SMA level of around $25.15 guards the short-term Silver price recovery.
Following that, a fortnight-old descending resistance line near $25.25 will be important to watch as a clear upside break of the same can open the doors for the metal’s rally towards the latest multi-month high, marked in April around $26.10.
Overall, Silver price is likely to witness further declines but the room towards the south appears limited.
Silver price: Four-hour chart
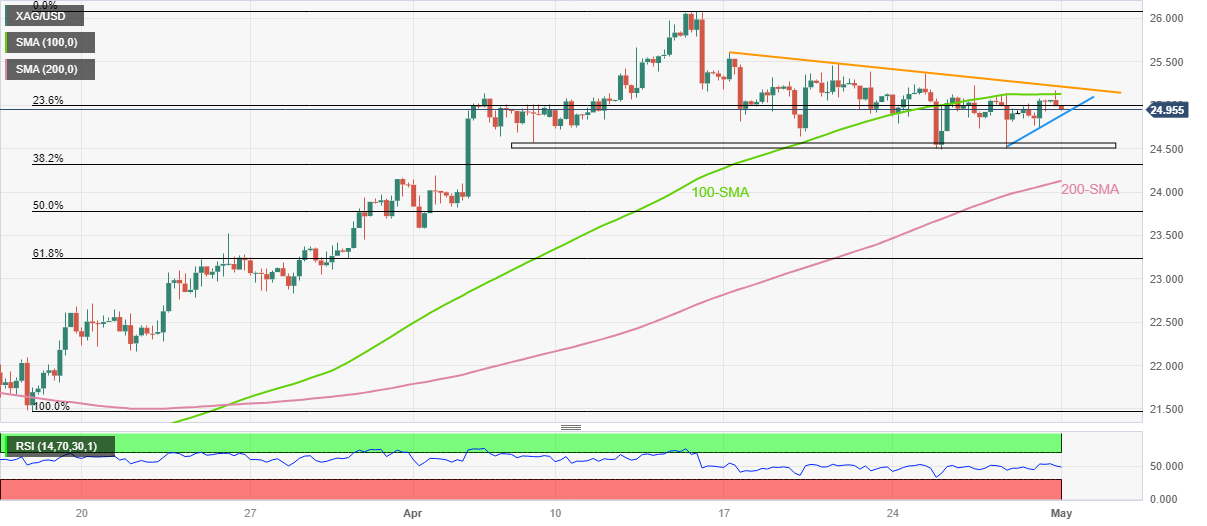
Trend: Limited downside expected
-
01:38
AUD/JPY jumps to 90.50 inspired by BoJ’s dovish stance, RBA policy eyed
- AUD/JPY has scaled to 90.50 amid weakness in the Japanese Yen as BoJ has favored a continuation of easy monetary policy.
- BoJ Ueda decided to stay with an ultra-loose policy as the impact of higher import prices has already been discounted.
- The RBA is expected to continue a pause on interest rates as Australian inflation is declining consistently.
The AUD/JPY pair has shifted sustainably above the critical resistance of 90.00 in the Asian session. The cross is continuously moving higher for the past two trading session. The risk barometer has been fueled by the maintenance of the ultra-dovish policy stance by the Bank of Japan (BoJ).
A continuation of the expansionary monetary policy by the BoJ to keep inflation sustainably above 2% impacted heavily on the Japanese Yen. New BoJ Governor Kazuo Ueda decided to stay with ultra-loose policy considering the fact that the impact of higher import prices has already been discounted in the domestic economy more than expected. Domestic demand is struggling to show a recovery despite enormous efforts of accelerating wages by the central bank and the administration.
Also, the BoJ unanimously voted in favor of keeping the band of Japanese Government Bonds (JGBs) steady. This indicated that the central bank has no intention of exiting from the ultra-dovish policy for now.
On the Australian Dollar front, investors are keenly awaiting the interest rate decision by the Reserve Bank of Australia (RBA). Considering the fact that Australian inflation is declining consistently for the past three months and RBA policymakers are anticipating a slowdown in the economy ahead, a continuation of the pause is widely expected.
China’s PMI released by the National Bureau of Statistics (NBS) has not impacted the Australian Dollar heavily. China’s Manufacturing PMI (April) dropped to 49.2 from the consensus of 51.4 amid persistent pessimism in producers and a weak real estate market. The Services PMI surprisingly jumped to 56.4 from the estimates of 50.4.
It is worth noting that Australia is the leading trading partner of China and a decline in Chinese economic activities usually impacts the Australian Dollar.
-
01:33
Breaking: USD/JPY rallies sharply to fresh highs, eyes on 137.00
- USD/JPY rallies to fresh highs in the Tokyo opening hour.
- Bulls eye 137.00 with the eyes on the US yields.
There was a positive tone to markets on Friday The S&P 500 was up 0.8% and the Nikkei has rallied in the open and USD/JPY has followed suit, rising 0.34% so far to fresh highs for April of 136.77.
The Bank of Japan kept its easing policy on Friday and the Yen has weakened to a 7-week low against the US Dollar as the BoJ decision re-ignites emphasis on US Treasuries and the Federal Reserve.
The BoJ kept monetary policy unchanged and said it would “patiently” continue with monetary easing. The members voted 9-0 to maintain its policy balance rate at 0.1% and keep its 10-year JGB yield target at about 0%. At the same time, the BoJ cut its 2023 Japan Gross Domestic Product estimate to 1.4% from a previous estimate of 1.7% and raised its 2023 core Consumer Price Index estimate to 1.8% from 1.6%. Meanwhile, the BoJ scrapped its forward guidance on interest rates and said it would patiently continue with monetary easing. Also, Governor Kazuo Ueda said the Japanese economy faces a bigger risk from premature tightening than from a delay.
´´While giving BoJ more flexibility, we continue to think that a move in YCC is not that far off. A June move is probably too early now, but a shift later in H2 2023 still looks likely,´´ analysts at TD Securities explained.
´´While the 1-1.5y time frame for the BoJ review is much longer than expected, it is not clear that this will be overwhelmingly bearish for the yen.´´
´´USD/JPY extended its upward momentum into Ueda's press conference, but we would expect strategic interest to fade into 137 (~200dma).´´
´´This market is asymmetric with a preference to hold on to a receiver bias in the US. We have also seen tests into 3.60% in US10s as a solid point to fade. It's not obvious that the BOJ will remain idle for 1-1.5 years on YCC. But the Fed is very likely going to be cutting then,´´ the analysts added.
In data, meanwhile, Japan's March Industrial Production fell -0.7% YoY, a smaller decline than expectations of -1.2% YoY. Retail Sales climbed +0.6% MoM, stronger than expectations of +0.3%. Japan Tokyo Apr CPI ex-fresh food and energy rose +3.8% YoY, stronger than expectations of +3.5% YoY and the biggest increase in 41 years.
USD/JPY technical analysis
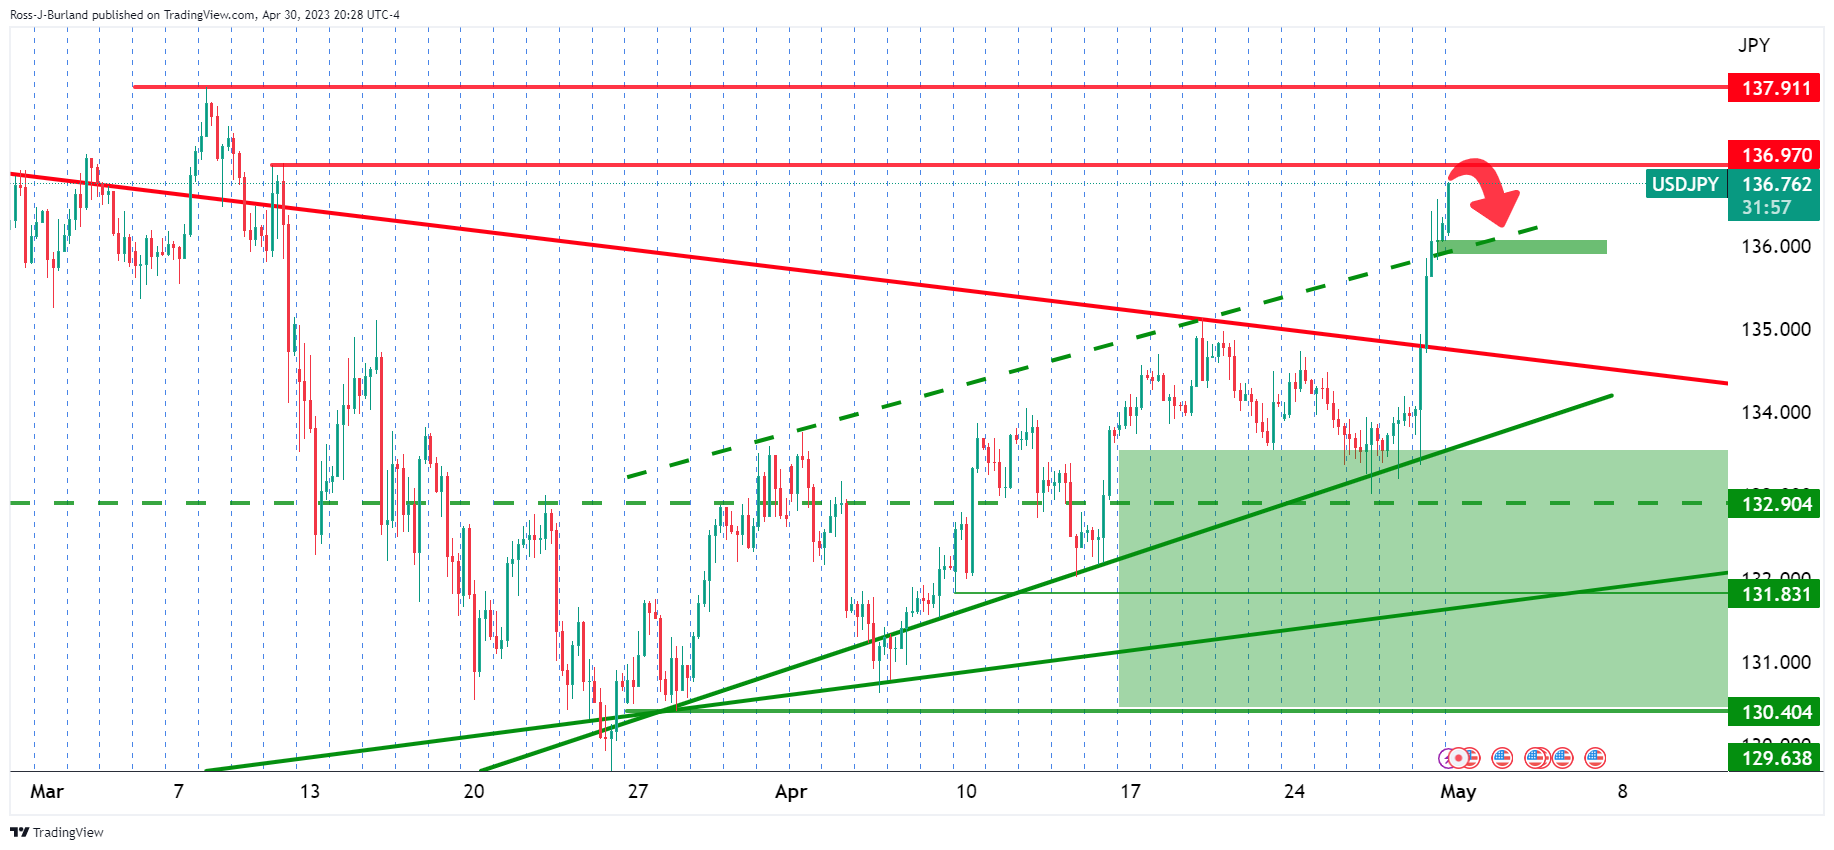
USD/JPY is making fresh highs with 137.00 in focus.
-
01:31
Japan Jibun Bank Manufacturing PMI meets forecasts (49.5) in April
-
01:30
Stocks. Daily history for Friday, April 28, 2023
Index Change, points Closed Change, % NIKKEI 225 398.76 28856.44 1.4 Hang Seng 54.29 19894.57 0.27 KOSPI 5.72 2501.53 0.23 ASX 200 16.5 7309.2 0.23 FTSE 100 39 7870.6 0.5 DAX 121.93 15922.38 0.77 CAC 40 7.66 7491.5 0.1 Dow Jones 272 34098.16 0.8 S&P 500 34.13 4169.48 0.83 NASDAQ Composite 84.34 12226.58 0.69 -
01:27
Gold Price Forecast: XAU/USD bears approach $1,980 support on First Republic woes, Fed, US NFP eyed
- Gold price stays inside two-week-old trading range despite posting firmer weekly close.
- United States statistics renew hawkish Federal Reserve bias and prod XAU/USD bulls.
- Fears surrounding First Republic Bank, recession talks exert downside pressure on the Gold price.
- No surprises from Fed, downbeat US Nonfarm Payrolls may bolster XAU/USD upside.
Gold price (XAU/USD) drops towards a short-term key support confluence as sour sentiment underpins the US Dollar demand and weighs on the metal prices during the early trading hours of the key week. That said, the XAU/USD renews its intraday low near $1,986 as it bears the burden of the market’s fears emanating from First Republic Bank amid hawkish hopes from the Federal Reserve, especially after the recently firmer United States inflation clues.
Gold price declines on First Republic Bank inflicted fears
Gold price fails to extend the previous weekly gains as traders brace for the top-tier data/events amid holidays in China and Europe. Even so, anxiety surrounding the troubled US bank, namely the First Republic, exerts downside pressure on the XAU/USD.
After witnessing an exodus of withdrawal and a slump in the First Republic's share price, the Federal Deposit Insurance Corporation (FDIC) calls in bids for the troubled US bank in which multiple top-tier private organizations, including JP Morgan, took part. The results are up for release and can give only knee-jerk optimism as an immediate defense of the bank by a private player isn’t a solution to the broad banking problems. On the contrary, the same raises fears of such actions for the larger public banks in the future and hence can keep the risk-off mood intact.
United States inflation clues propel hawkish Federal Reserve bets, weigh on XAU/USD
Apart from the market’s fears emanating from the First Republic, hawkish Federal Reserve (Fed) concerns also weigh on the Gold price. That said, the CME Group FedWatch Tool suggests higher odds of the Fed’s 0.25% rate hike in May and June, as well as a reduction in the market’s bets on the September rate cut from the US central bank.
While tracing the latest shift in the market bets on the Fed, the United States statistics surrounding inflation gain major attention. In the last week, initial estimations of the US Gross Domestic Product (GDP) for the first quarter (Q1) of 2023, also known as Advance readings, marked mixed outcomes. That said, the headline US GDP Annualized eased to 1.1% from 2.0% expected and 2.6% prior but the GDP Price Index inched higher to 4.0% on an annualized basis from 3.9% prior and 3.8% market consensus. Further, the Fed’s preferred inflation gauge, namely the Core Personal Consumption Expenditure (PCE) Price Index, for March matched 0.3% market forecasts and prior to MoM but rose to 4.6% from 4.5% expected on YoY, with an upwardly revised previous reading of 4.7%. On the same line, the US Employment Cost Index also increased by 1.2% in Q1 2023, versus the 1% increase marked previously.
Downbeat China PMIs also please Gold sellers
Considering China’s position as one of the world’s biggest Gold consumers, the latest disappointment from the Dragon Nation’s official Purchasing Managers Indexes (PMIs) for April exert downside pressure on the XAU/USD. During the weekend, China’s official NBS Manufacturing PMI disappointed markets with 49.2 figures for April, versus 51.4 market forecasts and 51.9 prior readings. It’s worth noting that the Non-Manufacturing PMI rose past 50.4 expected figures to 56.4 but remained below 58.4 reported in March.
A busy week ahead for XAU/USD traders, Fed, NFP in focus
Although markets in China, Europe and the UK are off on Monday, a slew of central bank announcements and top-tier data from the United States, Eurozone, Australia and New Zealand are likely to offer a busy week ahead to the Gold traders. Among them, Wednesday’s Fed meeting, Thursday’s ECB monetary policy announcements and Friday’s US jobs report for April will be crucial to watch for the Gold price predictions. Should the Fed hawks keep the reins and the US economics are firmer as well, the Gold price may witness the much-awaited pullback.
Gold price technical analysis
Gold price seesaws within a nearly $30.00 trading range as it consolidates the early March to the mid-April run-up.
That said, a six-week-old ascending trend line joins the 200-bar Simple Moving Average (SMA) to put a short-term floor under the XAU/USD price near $1,980.
On the contrary, a fortnight-old downward-sloping resistance line, close to $2,007 at the latest, guards immediate recovery of the Gold price.
It’s worth noting, however, that the sluggish signals from the Moving Average Convergence and Divergence (MACD) indicator and a steady Relative Strength Index (RSI) line, placed at 14, suggest a continuation of the metal’s sideways move.
Meanwhile, multiple upside hurdles near $2,010 and $2,030 can test the XAU/USD bulls past $2,007 before directing them to the recent peak of near $2,050.
Alternatively, a downside break of $1,980 needs validation from the late March swing low around $1,935 before welcoming the Gold bears.
Gold price: Four-hour chart

Trend: Further grinding expected
-
01:15
Currencies. Daily history for Friday, April 28, 2023
Pare Closed Change, % AUDUSD 0.66149 -0.19 EURJPY 150.046 1.64 EURUSD 1.10166 -0.09 GBPJPY 171.118 2.34 GBPUSD 1.25678 0.59 NZDUSD 0.61822 0.59 USDCAD 1.35434 -0.37 USDCHF 0.89461 0.05 USDJPY 136.278 1.74 -
01:04
USD/CHF Price Analysis: Recovery firmly to 0.8950 as Fed policy comes into picture
- USD/CHF has extended its recovery being supported by the US Dollar ahead of Fed policy.
- Swiss’s annual Real Retail Sales contracted sharply by 1.9% while the street was anticipating an expansion by 1.7%.
- USD/CHF is preparing for a bullish reversal as it is gathering strength after breaking the declining trendline plotted at 0.9439.
The USD/CHF pair is eyeing a recovery extension above the immediate resistance of 0.8946 in the early Tokyo session. The Swiss franc asset recovered swiftly from the round-level support of 0.8900 as investors are running for the US Dollar Index (DXY) as a safe-haven ahead of the interest rate decision by the Federal Reserve (Fed).
S&P500 futures are showing some losses in early Asia as investors are getting anxious ahead of United States ISM Manufacturing PMI (April) and Fed’s monetary policy, portraying a caution in an overall risk appetite theme. The US Dollar Index (DXY) is approaching the critical resistance of 101.80 amid an improvement in its safe-haven appeal.
The Swiss franc remained in action on Friday after the release of Real Retail Sales (March) data. Annual Real Retail Sales contracted sharply by 1.9% while the street was anticipating an expansion by 1.7%. This would be a relief for the Swiss National Bank (SNB), which is struggling to tame stubborn inflation.
Investors should be aware that the Swiss economy will remain closed on Monday on account of Labor Day.
USD/CHF is preparing for a bullish reversal as it is gathering strength after breaking the downward-sloping trendline plotted around March 08 high at 0.9439 on a two-hour scale. The Swiss Franc asset is confidently shifting above 20-period Exponential Moving Average (EMA) at 0.8936, indicating a bullish shift in the short-term trend.
The major has shown a recovery after forming a Triple Bottom chart pattern which indicates that the downside bias is over as the entire selling has dried.
The Relative Strength Index (RSI) (14) has shifted into the 40.00-60.00 range. A move into the bullish range of 60.00-80.00 will strengthen the US Dollar bulls further.
Should the asset decisively breaks above the psychological resistance at 0.9000, US Dollar bulls will drive the asset towards April 07 low and high at 0.9034 and 0.9082 respectively.
Alternatively, a downside move below April 17 low at 0.8922 will drag the asset toward April 13 low at 0.8860. A slippage below the latter will expose the asset to the round-level support at 0.8800.
USD/CHF two-hour chart
-638184961887995436.png)
-
01:04
South Korea Trade Balance came in at $2.62B, above expectations ($-2.89B) in April
-
00:51
EUR/USD drops towards 1.1000 as ECB hawks retreat, First Bank roils the mood, US NFP, Fed eyed
- EUR/USD pares recent gains at 13-month high, remains pressured during three-day downtrend.
- Downbeat EU data contrasts with firmer inflation signals from US to prod Euro pair buyers.
- ECB and Fed are both likely to announce 0.25% rate hike this week but signals for future moves are the key.
- US ISM PMIs, NFP and First Republic headlines are extra catalysts to watch for clear directions.
EUR/USD remains depressed for the third consecutive day while staying around the highest levels since April 2022, mildly offered near 1.1010 during Monday’s Asian session. In doing so, the Euro pair bears the burden of the recently easing hawkish bets on the European Central Bank (ECB), as well as the strong inflation signals from the US. Also challenging the pair buyers at the multi-month high are the economic slowdown fears and the First Republic woes.
The Federal Deposit Insurance Corporation (FDIC) calls in bids for the troubled US bank after an exodus of withdrawals caused First Republic share price to tank. That said, multiple top-tier private organizations, including JP Morgan, bid for the bank’s takeover. The results are up for release and can give only knee-jerk optimism as an immediate defense of the bank by a private player isn’t a solution to the broad banking problems. On the contrary, the same raises fears of such actions for the larger public banks in the future and hence can keep the risk-off mood intact.
Elsewhere, ECB hawks retreat amid downbeat EU and German statistics released in the last week. On Friday, preliminary readings of Germany’s inflation for April, as per the Harmonized Index of Consumer Prices (HICP) index, eased to 7.6% YoY versus 7.8% expected and prior. Further, the nation’s inflation per the Consumer Price Index (CPI) also softened to 7.2% YoY compared to 7.3% maroet consensus and 7.4% previous readings. Further, the first readings of the Eurozone Gross Domestic Product (GDP) for the first quarter (Q1) of 2023 came in mixed for QoQ and YoY. That said, the Eurozone Q1 GDP improved to 0.1% QoQ from 0.0% prior, versus 0.2% expected, whereas the yearly growth eased to 1.3% from 1.4% market forecasts and 1.8% prior. On the same line, Germany’s Q1 GDP improved on quarterly basis, to 0.0% from -0.4% prior and 0.2% analysts’ estimations, wheras the yearly figures dropped to -0.1% from 0.9% previous readings and 0.3% market forecasts.
Alternatively, initial estimations of the US Gross Domestic Product (GDP) for the first quarter (Q1) of 2023, also known as Advance readings, marked mixed outcomes. That said, the headline US GDP Annualized eased to 1.1% from 2.0% expected and 2.6% prior but the GDP Price Index inched higher to 4.0% on an annualized basis from 3.9% prior and 3.8% market consensus. Further, the Fed’s preferred inflation gauge, namely the Core Personal Consumption Expenditure (PCE) Price Index, for March matched 0.3% market forecasts and prior to MoM but rose to 4.6% from 4.5% expected on YoY, with an upwardly revised previous reading of 4.7%. On the same line, the US Employment Cost Index also increased by 1.2% in Q1 2023, versus the 1% increase marked previously.
Amid these plays, the CME Group FedWatch Tool suggests higher odds of the Fed’s 0.25% rate hike in May and June, as well as a reduction in the market’s bets on the September rate cut from the US central bank. With this, S&P 500 Futures print mild losses even as Wall Street closed positive and the yields eased.
Moving on, holidays in multiple European markets on Monday may restrict EUR/USD moves even as the US ISM Manufacturing PMI is up for the release. However, major attention will be given to Wednesday’s Fed meeting, Thursday’s ECB monetary policy announcements and Friday’s US jobs report for April. Overall, bulls appear running out of steam but bears have a tough task retaking control.
Technical analysis
The overbought RSI (14) line joins the EUR/USD pair’s repeated failure to provide a daily closing beyond 1.1050 to lure the sellers. However, an upward-sloping trend line from early April, close to 1.0980, holds the gate for sellers.
-
00:46
RBNZ: New Zealand banks have relatively little interest rate risk
Interest rate risk management in the New Zealand banking system, a statement from the Reserve Bank of New Zealand said.
´´The recent collapse of silicon valley bank highlights the importance of managing interest rate risk effectively, especially in a rising interest rate environment.´´
´´This risk is caused by fluctuations in the value of banks’ assets and liabilities as interest rates change. If not managed well, changing interest rates can adversely affect banks’ capital and liquidity positions.´´
NZD/USD update
The NZD/USD has been offered in Asia and is moving into Friday´s rally. At the time of writing, NZD/USD is trading at 0.6170.
-
00:18
NZD/USD faces tough hurdles above 0.6180 ahead of US ISM PMI and Fed policy
- NZD/USD has slipped after failing to sustain above 0.6180 as the USD Index has shown recovery.
- Mild losses in the S&P500 futures could be short-lived as JP Morgan and PNC are submitting a final bid for First Republic Bank.
- Consistent US consumer spending and a jump in the labor cost index have advocated for further rate hikes from the Fed.
The NZD/USD pair has failed to sustain above the crucial resistance of 0.6180 in the early Asian session. The Kiwi asset has sensed selling interest as investors are getting anxious ahead of the mega event of the Federal Reserve’s (Fed) interest rate policy.
S&P500 futures are facing nominal losses in early Asia as pre-Fed policy anxiety has kicked in. However, the 500-US stocks basket was heavily bought on Friday, indicating a caution amid a cheerful market mood. Mild losses in the S&P500 futures could be short-lived as JP Morgan and PNC are submitting final bid for First Republic Bank in Federal Deposit Insurance Corporation (FDIC) auction, which might infuse some confidence in investors as it would ease United States banking jitters.
The US Dollar Index (DXY) has extended its recovery above 101.70 as a consecutive 25 basis point (bp) interest rate hike announcement from Fed chair Jerome Powell is highly likely. Consistent consumer spending and a jump in labor cost index data released on Friday have advocated for further interest rate hikes from the Fed.
The US core Personal Consumption Expenditure (PCE) Price Index remained steady in March at 0.3% as expected by the market participants. The Employment Cost Index (Q1) rose to 1.2% from the consensus and the prior release of 1.1%.
On Monday, US ISM Manufacturing PMI (April) will be keenly watched. Investors are anticipating mild gains in PMI figures to 46.6 vs. the prior release of 46.3. New Orders Index data that indicates forward demand is expected to jump to 45.5 from the former release of 44.3.
On the New Zealand dollar front, investors will keenly await the release of NZ employment (Q1) data. Employment Change is expected to remain steady at 0.2%. While the Unemployment Rate is seen rising to 3.5% from the former release of 3.4%. The quarterly Employment Cost Index is seen unchanged at 1.1%. Fewer job additions and higher jobless rates would allow the Reserve Bank of New Zealand (RBNZ) to consider a pause in the policy-tightening process.
-
00:15
US Dollar Index: DXY marches towards 102.00 as First Republic woes join hawkish Fed bets
- US Dollar Index picks up bids to reverse late Friday’s pullback from one-week high.
- FDIC calls bids for First Republic Bank after heavy withdrawals propelled banking fears.
- Early signals for US inflation came in firmer and favored Fed hawks even as US GDP eased.
- Fed is expected to announce 0.25% rate hike but signals for future moves are the key, US NFP eyed too.
US Dollar Index (DXY) justifies its safe-haven status, also backed by the hawkish Fed bets, as it renews the intraday high to around 101.70 during the early hours of Monday. In doing so, the greenback’s gauge versus the six major currencies benefit from the market’s fears surrounding the First Republic bank, as well as the recently upbeat US data, ahead of this week’s Fed meeting and the US Nonfarm Payrolls (NFP) releases.
A large exodus in the First Republic bank’s deposit caused the share prices to plunge heavily in the last week and pushed the Federal Deposit Insurance Corporation (FDIC) finally took a tough decision to call in bids for the troubled bank. This attracted multiple top-tier private organizations, including JP Morgan, to bid for the bank’s takeover. The results are up for release and can give only knee-jerk optimism as an immediate defense of the bank by a private player isn’t a solution to the broad banking problems. On the contrary, the same raises fears of such actions for the larger public banks in the future and hence can keep the risk-off mood intact.
On the other hand, the first readings of the US Gross Domestic Product (GDP) for the first quarter (Q1) of 2023, also known as Advance readings, marked mixed outcomes. That said, the headline US GDP Annualized eased to 1.1% from 2.0% expected and 2.6% prior but the GDP Price Index inched higher to 4.0% on an annualized basis from 3.9% prior and 3.8% market consensus. Further, the Fed’s preferred inflation gauge, namely the Core Personal Consumption Expenditure (PCE) Price Index, for March matched 0.3% market forecasts and prior to MoM but rose to 4.6% from 4.5% expected on YoY, with an upwardly revised previous reading of 4.7%. On the same line, the US Employment Cost Index also increased by 1.2% in Q1 2023, versus the 1% increase marked previously.
With this, the CME Group FedWatch Tool suggests higher odds of the Fed’s 0.25% rate hike in May and June, as well as a reduction in the market’s bets on the September rate cut from the US central bank.
Against this backdrop, S&P 500 Futures print mild losses even as Wall Street closed positive and the yields eased.
Moving on, US ISM Manufacturing PMI for April may entertain intraday traders of the DXY but major attention will be given to the headlines surrounding the First Republic Bank and the Fed. It’s worth noting that the US jobs report for April is also on the calendar and can entertain the US Dollar Index traders. Above all, the greenback is well set for consolidating the losses made in March and April.
Technical analysis
A clear upside break of one-month-old descending resistance line, around 101.70 by the press time, becomes necessary for the US Dollar Index (DXY) to convince buyers.
-
00:00
Australia S&P Global Manufacturing PMI fell from previous 48.1 to 48 in April
-