Notícias do Mercado
-
23:59
AUD/USD stays bearish near 0.6600 amid China, First Republic inflicted fears ahead of RBA, Fed
- AUD/USD fades bounce off seven-week low amid sour sentiment, anxiety before key data/events.
- US FDIC calls for bids to turn First Republic bank, China PMIs disappoint.
- Recent data suggests divergence between the RBA and the Fed monetary policy.
- US NFP, second-tier Aussie data and risk catalysts are also important to entertain Aussie pair traders.
AUD/USD justifies its risk barometer status as the pair sellers attack the 0.6600 round figure, fading the late Friday’s corrective bounce after refreshing the seven-week low, during early Monday in Asia. In doing so, the Aussie pair bears the burden of the risks emanating from downbeat China activity data for April and the auction of another US bank, namely the First Republic Bank. Also exerting downside pressure on the Aussie pair is the cautious mood ahead of this week’s monetary policy meeting of the Reserve Bank of Australia (RBA) and the US Federal Reserve (Fed).
Having witnessed a slump in the First Republic shares and fleeing deposits from the US bank, the Federal Deposit Insurance Corporation (FDIC) finally took a tough decision to call in bids for the troubled bank. The same attracted multiple top-tier private organizations, including JP Morgan, to bid for the bank’s takeover. The results are up for release and can give only a kneejerk optimism as an immediate defense of the bank by a private player isn’t a solution to the broad banking problems. On the contrary, the same raises fears of such actions for the larger public banks in the future.
During the weekend, China’s official NBS Manufacturing PMI disappointed with 49.2 figures for April, versus 51.4 market forecasts and 51.9 prior readings. It’s worth noting that the Non-Manufacturing PMI rose past 50.4 expected figures to 56.4 but remained below 58.4 reported in March. With the downbeat numbers from Australia’s biggest customer, as well as the banking fears, the AUD/USD pair remains pressured of late.
In the last week, headline inflation numbers from Australia have disappointed the Aussie pair buyers, on both the monthly and the quarterly format. The same joins the RBA’s latest pause in the rate hike trajectory to raise the odds of witnessing one more status quote decision by the Australian central bank.
On the other hand, the first readings of the US Gross Domestic Product (GDP) for the first quarter (Q1) of 2023, also known as Advance readings, marked mixed outcomes. That said, the headline US GDP Annualized eased to 1.1% from 2.0% expected and 2.6% prior but the GDP Price Index inched higher to 4.0% on an annualized basis from 3.9% prior and 3.8% market consensus. Further, the Fed’s preferred inflation gauge, namely the Core Personal Consumption Expenditure (PCE) Price Index, for March matched 0.3% market forecasts and prior to MoM but rose to 4.6% from 4.5% expected on YoY, with an upwardly revised previous reading of 4.7%. On the same line, the US Employment Cost Index also increased by 1.2% in Q1 2023, versus the 1% increase marked previously.
Amid these plays, S&P 500 Futures print mild losses even as Wall Street closed positive and the yields eased.
Moving on, AUD/USD pair may remain pressured amid the market’s cautious mood ahead of the top-tier data/events, as well as due to the sour sentiment. However, major attention will be given to the RBA and Fed moves as a monetary policy divergence appears to brew.
Technical analysis
Unless rising back beyond the previous support line stretched from early March, close to 0.6665 by the press time, the AUD/USD pair is well-set to refresh the yearly high of around 0.6565.
-
23:47
USD/CAD Price Analysis: Finds an intermediate cushion below 1.3550, US/Canada PMI in focus
- USD/CAD has found short-term support below 1.3550 after a vertical sell-off.
- A power-pack action is anticipated amid the release of US/Canada Manufacturing PMI figures.
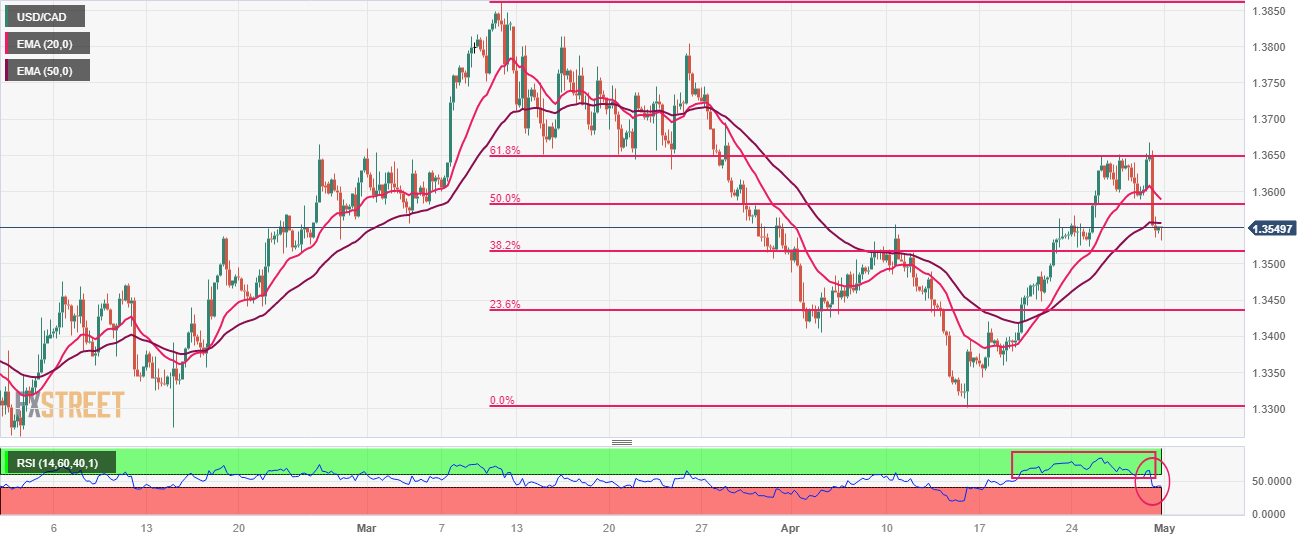
- USD/CAD has slipped significantly after facing immense selling pressure from 61.8% Fibo retracement.
The USD/CAD pair has gauged an intermediate cushion below 1.3550 after a vertical sell-off from the weekly high of 1.3668. The Loonie asset is building a base ahead of the Manufacturing PMI data from Canada and the United States ahead.
S&P500 settled Friday’s session on a bullish note as consistent consumer spending and upbeat quarterly figures from technology stocks infused confidence in investors. Investors could show some traits of pre-Federal Reserve (Fed) policy anxiety ahead.
The US Dollar Index (DXY) has rebounded after dropping to near 101.50 and is looking to extend its recovery above 101.70 as the Fed is expected to raise interest rates one more time by 25 basis points (bps).
USD/CAD has slipped significantly after facing immense selling pressure from 61.8% Fibonacci retracement (placed from March 10 high at 1.3862 to April 14 low at 1.3301) at 1.3650 on a four-hour scale. It seems that the strength in the selling pressure was extremely high as it dragged the Loonie asset sharply below the 20-and 50-period Exponential Moving Averages (EMAs) at 1.3590 and 1.3566 respectively.
Meanwhile, the Relative Strength Index (RSI) (14) has shifted into the 40.00-60.00 range from the bullish range of 60.00-80.00. The RSI (14) is struggling to maintain the 40.00 support as a break below the same will strengthen the Canadian Dollar.
Going forward, a decisive break below the intraday low at 1.3533 will expose the asset to psychological support at 1.3500 followed by a 23.6% Fibo retracement at 1.3438.
On the flip side, a recovery move above the 61.8% Fibo retracement at 1.3650 will trigger a reversal and will drive the major toward the round-level resistance at 1.3700. A break above the same will expose the asset to March 22 high at 1.3745.
USD/CAD four-hour chart
-
23:41
RBNZ: New Zealand banks at little risk from interest rate rises
“Banks in the country have relatively little risk from surging interest rates as they are required to hold sufficient capital to cover potential losses,” said Reserve Bank of New Zealand (RBNZ) early Monday per Reuters.
The RBNZ released excerpt of its May 2023 Financial Stability Report amid the ongoing banking fears due to the First Republic bank’s latest fallout.
Also read: Sources: PNC, JPM putting in final bids for First Republic in FDIC auction
Additional statements
Banks in New Zealand ‘manage this risk by matching the repricing profile of their assets and liabilities, and by using financial products to hedge any differences.’
They are also required to hold sufficient capital to cover potential losses arising from any remaining interest rate risk, which incentivises banks to carefully manage the risk.
NZD/USD grinds
With the RBNZ’s assurance, the NZD/USD battles with the market’s risk-off mood, as well as downbeat China data, while making rounds to 0.6170-80 and prints mild gains by the pres time.
-
23:23
Sources: PNC, JPM putting in final bids for First Republic in FDIC auction
Reuters quotes anonymous sources familiar with the matter while saying, “PNC Financial Services Group and JPMorgan Chase & Co were among banks set to submit final bids for First Republic Bank by midday Sunday in an auction being run by US regulators.”
“Citizens Financial Group Inc was another bidder in the final phase of the process, according to one of the sources familiar with the matter,” adds Reuters.
Three sources familiar with the matter said that the Federal Deposit Insurance Corporation (FDIC) is expected to announce a deal on Sunday night before Asian markets open, with the regulator likely to say at the same time that it had seized the lender.
Additional details
A deal for First Republic would come less than two months after Silicon Valley Bank and Signature Bank failed amid a deposit flight from U.S. lenders, forcing the Federal Reserve to step in with emergency measures to stabilize markets.
While markets have since calmed, a deal for the First Republic would be closely watched for the amount of support the government needs to provide.
In trying to find a buyer before closing the bank, the FDIC is turning to some of the largest U.S. lenders. Large banks had been encouraged to bid for FRC's assets, one of the sources said.
A source familiar with the situation told Reuters on Friday that the FDIC decided the lender's position had deteriorated and there was no more time to pursue a rescue through the private sector.
By Friday, First Republic's market value had hit a low of $557 million, down from its peak of $40 billion in November 2021.
-
23:14
Gold Price Forecast: XAU/USD struggles to find direction as focus shifts to Fed policy
- Gold price is inside the woods as investors are awaiting the Fed policy announcement for further guidance.
- The USD Index slipped firmly from 102.17 despite the upbeat Employment Cost Index and consistency in consumer spending.
- Lengthy consolidation in the Gold price would be followed by wider ticks and heavy volume after an explosion
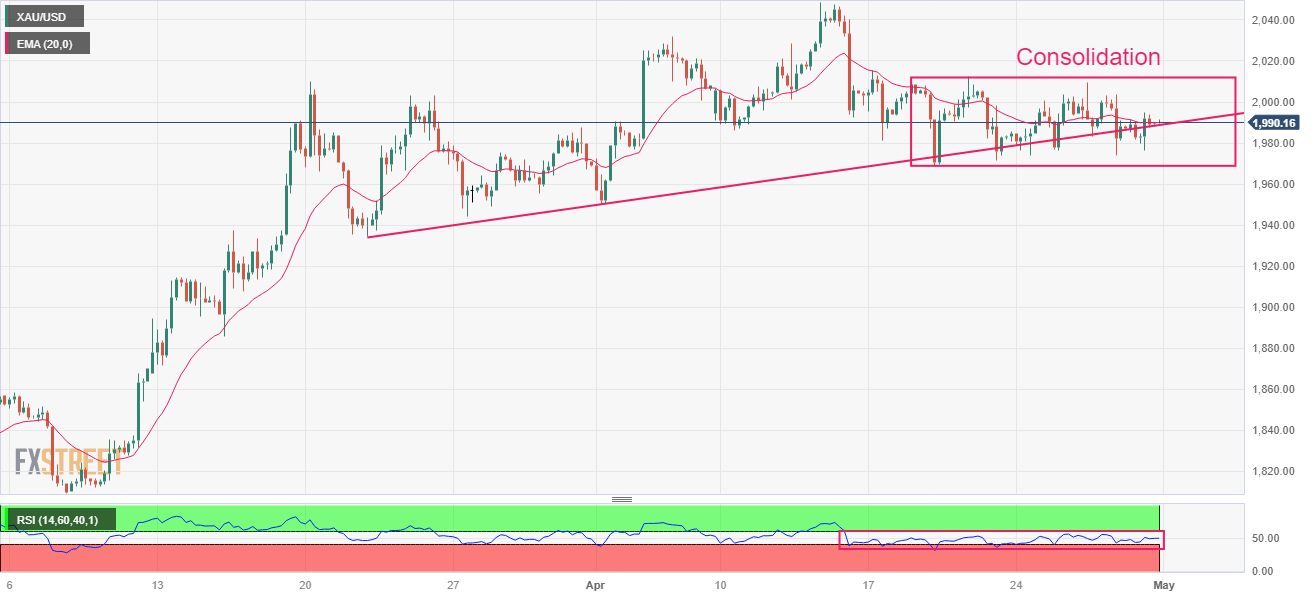
Gold price (XAU/USD) is hovering around $1,990.00 in the early Asian session. The precious metal is struggling to find any direction as investors are awaiting the announcement of the interest rate decision by the Federal Reserve (Fed). The yellow metal is bounded in a range of $1,970-2,010 from the past week as investors are anxious about knowing the importance of May’s monetary policy meeting.
S&P500 settled last week with 1% gains despite a sell-off in the initial days. After digesting renewed fears of United States banking woes investors shifted their focus on upbeat quarterly earnings from technology stocks. Also, Friday’s bullish closing portrays an upbeat market mood.
The US Dollar Index (DXY) slipped firmly from the weekly high of 102.17 on Friday despite an upbeat Employment Cost Index and consistency in consumer spending. The Labor Cost Index (Q1) jumped to 1.2% from the consensus and the former release of 1.1%. A higher labor cost index indicates that firms still offer higher wages to attract talent due to labor shortage.
Meanwhile, the monthly core Personal Consumption Expenditure (PCE) Price Index remained consistent with estimates and former acceleration at 0.3%. The preferred tool of the Fed to judge the overall context of inflationary pressures in the US economy landed at 4.6% higher than expectations of 4.5% but lower than the former release of 4.7% on an annual basis, indicating stubbornness in core inflation.
Gold technical analysis
Gold price is inside the woods from the past week in a range of $1,969-2,014 on a four-hour scale. Lengthy consolidation indicates a sheer volatility contraction, which is expected to be followed by wider ticks and heavy volume after an explosion.
Advancing trendline from March 22 low at $1,934.34 is acting as a cushion for the Gold bulls.
The 20-period Exponential Moving Average (EMA) at $1,990.15 is continuously hovering around the Gold price, hinting at a sideways performance.
Also, the Relative Strength Index (RSI) (14) is oscillating in the 40.00-60.00 range, indicating an absence of a critical trigger.
Gold four-hour chart
-
23:12
GBP/USD bulls attack 11-month top below 1.2600 with eyes on Fed, US NFP
- GBP/USD seesaws at multi-month high after two-week uptrend.
- Upbeat US data underpinned hawkish Fed bets and US Dollar.
- Brexit positive news, hawkish hopes from BoE favor and technical technical breakout help Cable pair buyers.
- Fed monetary policy meeting, US jobs report for April will be crucial to watch for fresh impulse.
GBP/USD grinds near the highest levels since June 2022, after rising in the last two consecutive weeks, as traders kick-start the key week comprising multiple central bank meetings including from the Federal Reserve and the US jobs report. That said, the Cable pair makes rounds to 1.2570 while defending the previous day’s run-up near the multi-day high during early Monday in Asia.
Hopes of getting another positive from the Brexit front, this time in the form of easy travel to and from Europe during the holiday season, initially underpinned the GBP/USD pair’s run-up in the last week. The reason could be linked to UK Prime Minister Rishi Sunak’s push for the rules that can help cheer the vacation after the much-awaited Brexit deal is sealed.
Further, upbeat inflation clues from private surveys and hopes of higher Bank of England (BoE) rates, as well as an absence of the banking crisis in the UK, are also likely to have favored the GBP/USD buyers. On Friday, a jump in the UK business confidence, per the Lloyds Bank survey for March also seemed to have propelled the quote. As per the latest poll, the British Business Sentiment rallied to an 11-month high of 33.0% in March versus 32.0% prior. Additionally, the survey also showed a seven-month high in wage growth, which in turn can push the BoE
On the other hand, looming fears of the US debt ceiling expiration, banking fears emanating from the First Republic Bank and recession woes challenged the US Dollar bulls even if the greenback managed to post a weekly gain backed by upbeat US data and hawkish Fed bets.
In the last week, the first readings of the US Gross Domestic Product (GDP) for the first quarter (Q1) of 2023, also known as Advance readings, marked mixed outcomes. That said, the headline US GDP Annualized eased to 1.1% from 2.0% expected and 2.6% prior but the GDP Price Index inched higher to 4.0% on an annualized basis from 3.9% prior and 3.8% market consensus. Further, the Fed’s preferred inflation gauge, namely the Core Personal Consumption Expenditure (PCE) Price Index, for March matched 0.3% market forecasts and prior to MoM but rose to 4.6% from 4.5% expected on YoY, with an upwardly revised previous reading of 4.7%. On the same line, the US Employment Cost Index also increased by 1.2% in Q1 2023, versus the 1% increase marked previously.
Against this backdrop, Wall Street managed to close on the positive side amid strong equity earnings while yields dropped and the US Dollar Index (DXY) closed the week with mild gains.
Moving on, a slew of top-tier US data and events are on the calendar that can fuel market volatility. However, holidays at a few markets on Monday and a lack of major data in the UK may allow the GBP/USD to take a breather.
Also read: GBP/USD Weekly Forecast: Pound Sterling bulls regain control ahead of next week's key events
Should the Fed matches market forecasts of a 0.25% rate hike and provide signals for policy pivot, and/or the US jobs report disappoints, the GBP/USD pair may have a long way to go towards the north.
Technical analysis
A clear upside break of an upward-sloping resistance line from late April, now immediate support near 1.2555, enables the GBP/USD buyers to aim for May 2022 peak surrounding 1.2665.
-
22:52
EUR/USD Price analysis: Bulls eye an upside continuation towards 1.1070
- EUR/USD is holding up at a 38.2% Fibonacci retracement level
- Bulls could be in play for the opening sessions.
A subsequent upside continuation is a bias for the open.
As per the prior analysis, EUR/USD Price Analysis: Bears are moving in and eye a run on length, EUR/USD ran into the 1.0960s and support structure as the following will illustrate.
EUR/USD H4 charts
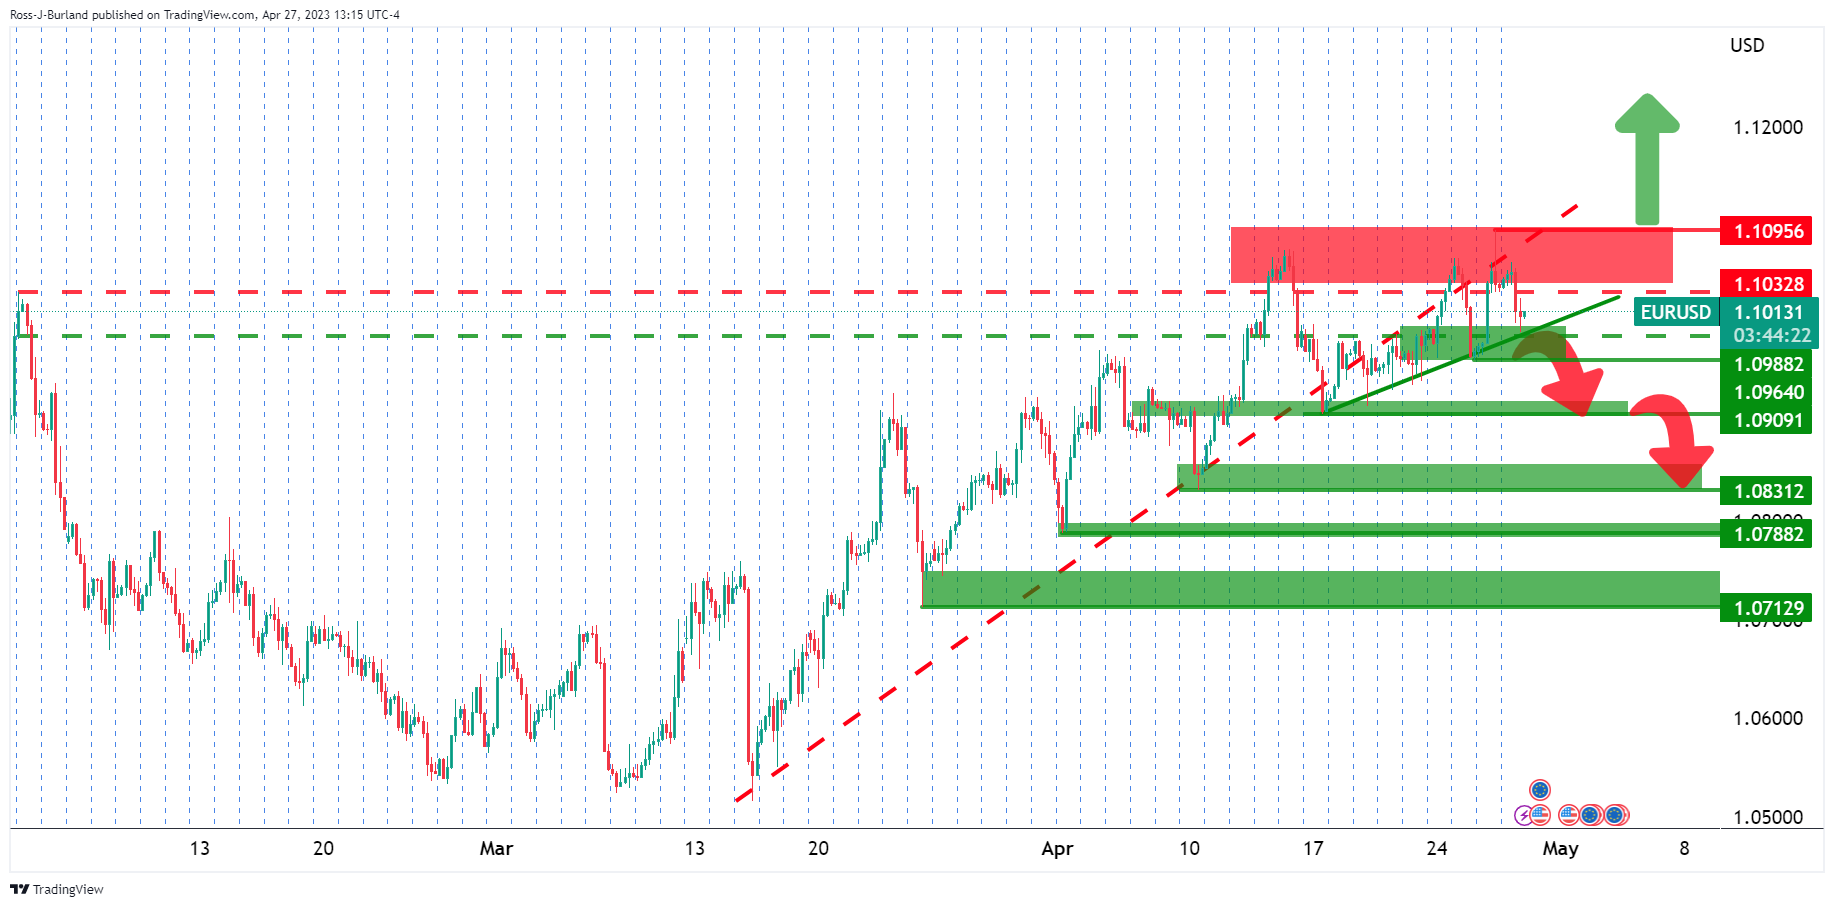
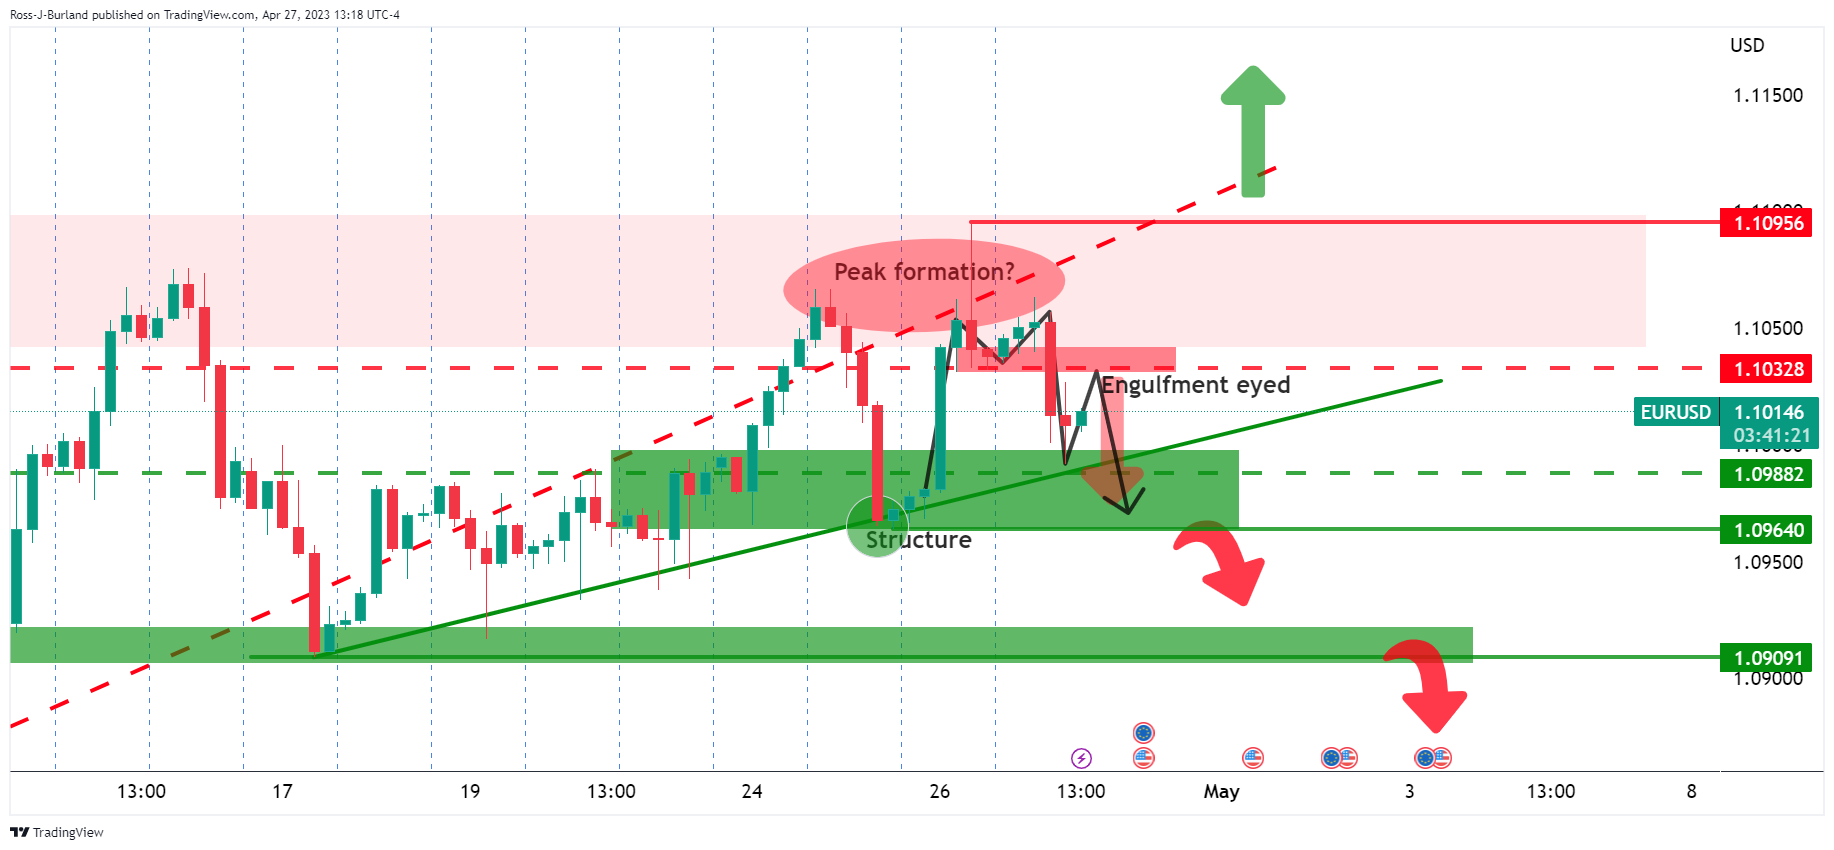
Zooming into the 4-hour charts, we had the M-formation with a test of the neckline resistance near the 1.1030s eyed before a strong test of the trendline support. An engulfment was eyed.
EUR/USD H1 chart
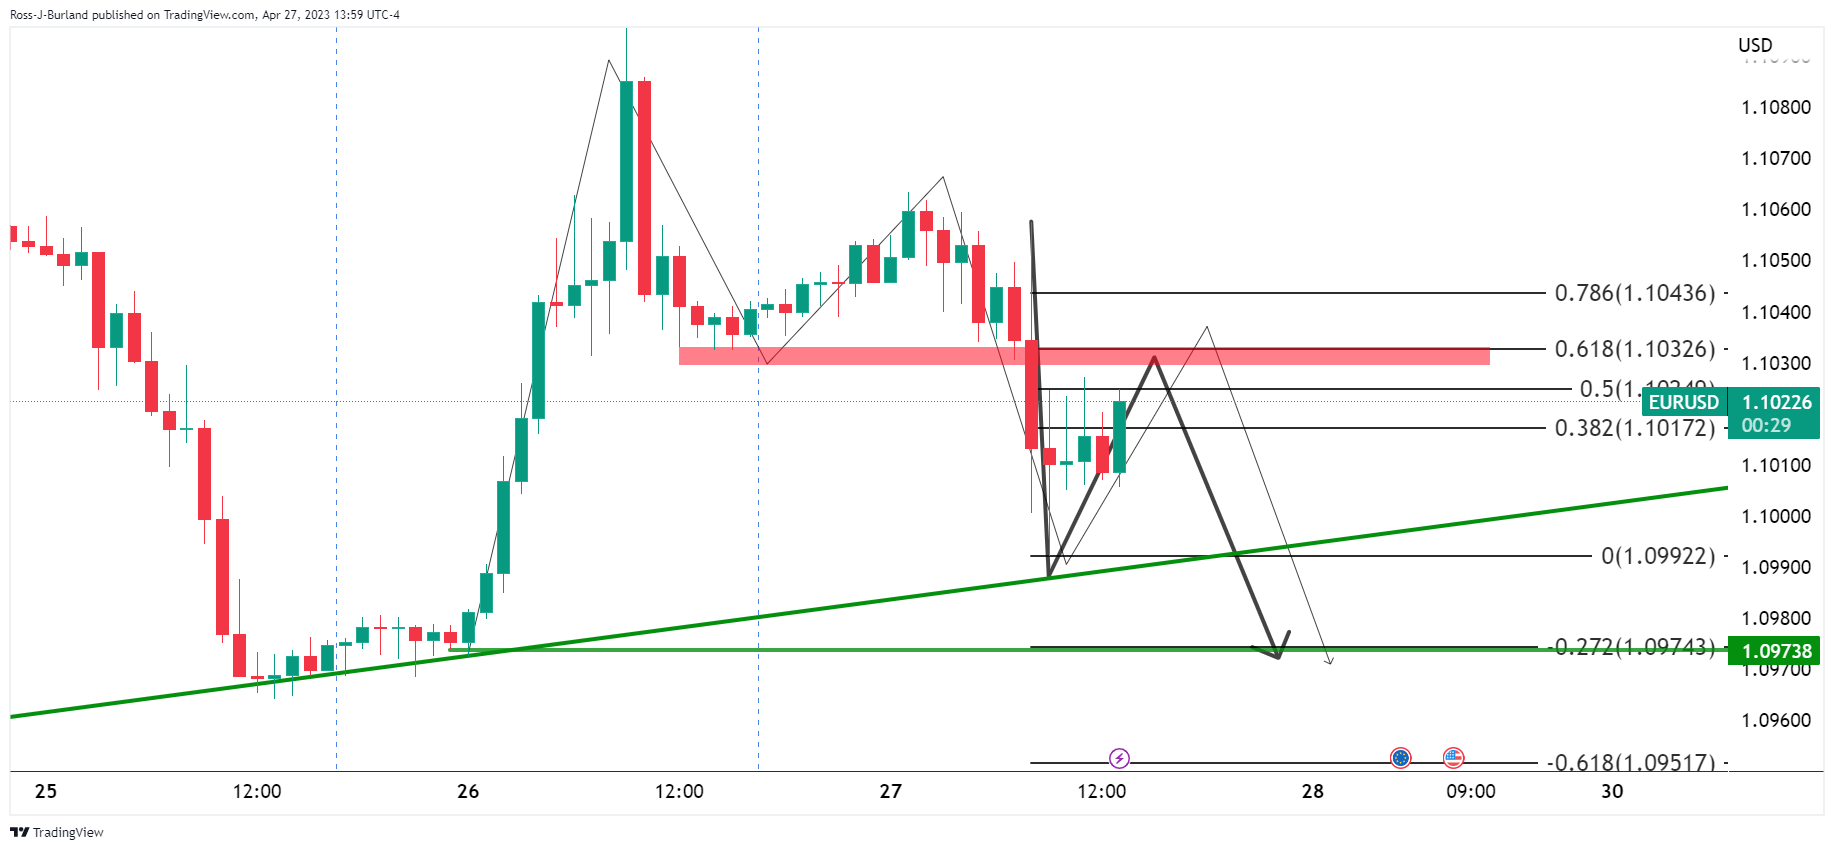
On the hourly chart, the thesis was playing out. A 61.8% Fibonacci retracement met the neckline resistance. Everything above was trapped volume, so the long squeeze thesis was a reasonable one into 1.0950s stops and the week´s lows.
EUR/USD week template, M15 chart
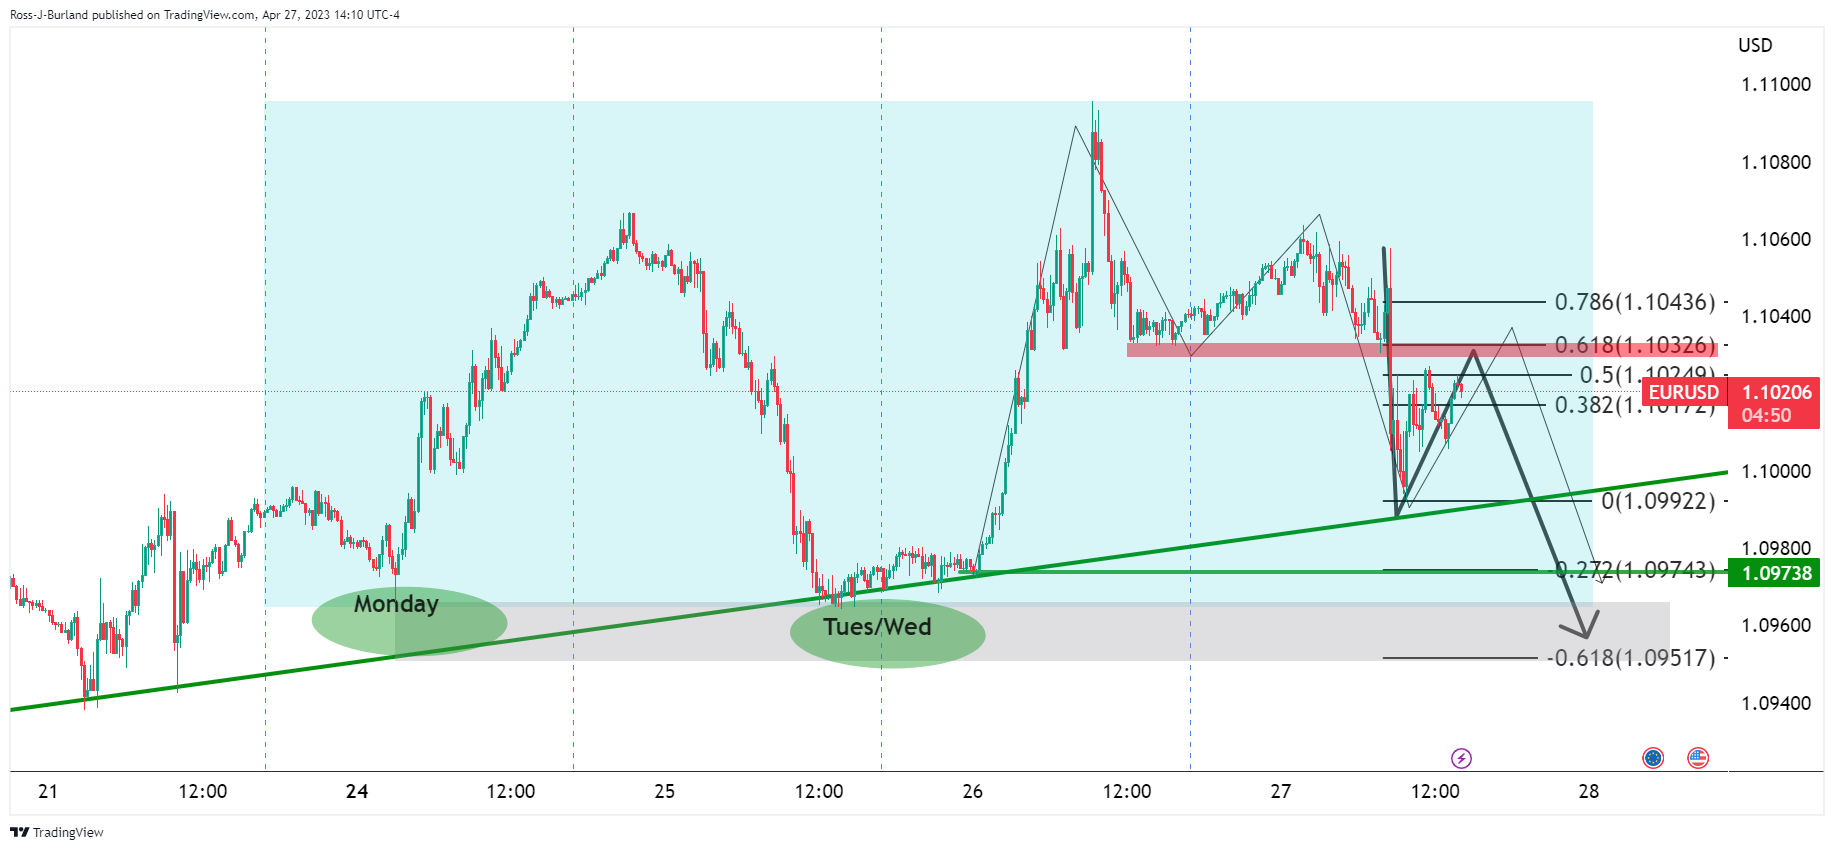
Monday and mid-week longs were still in the money with stop losses below eyed.
EUR/USD update
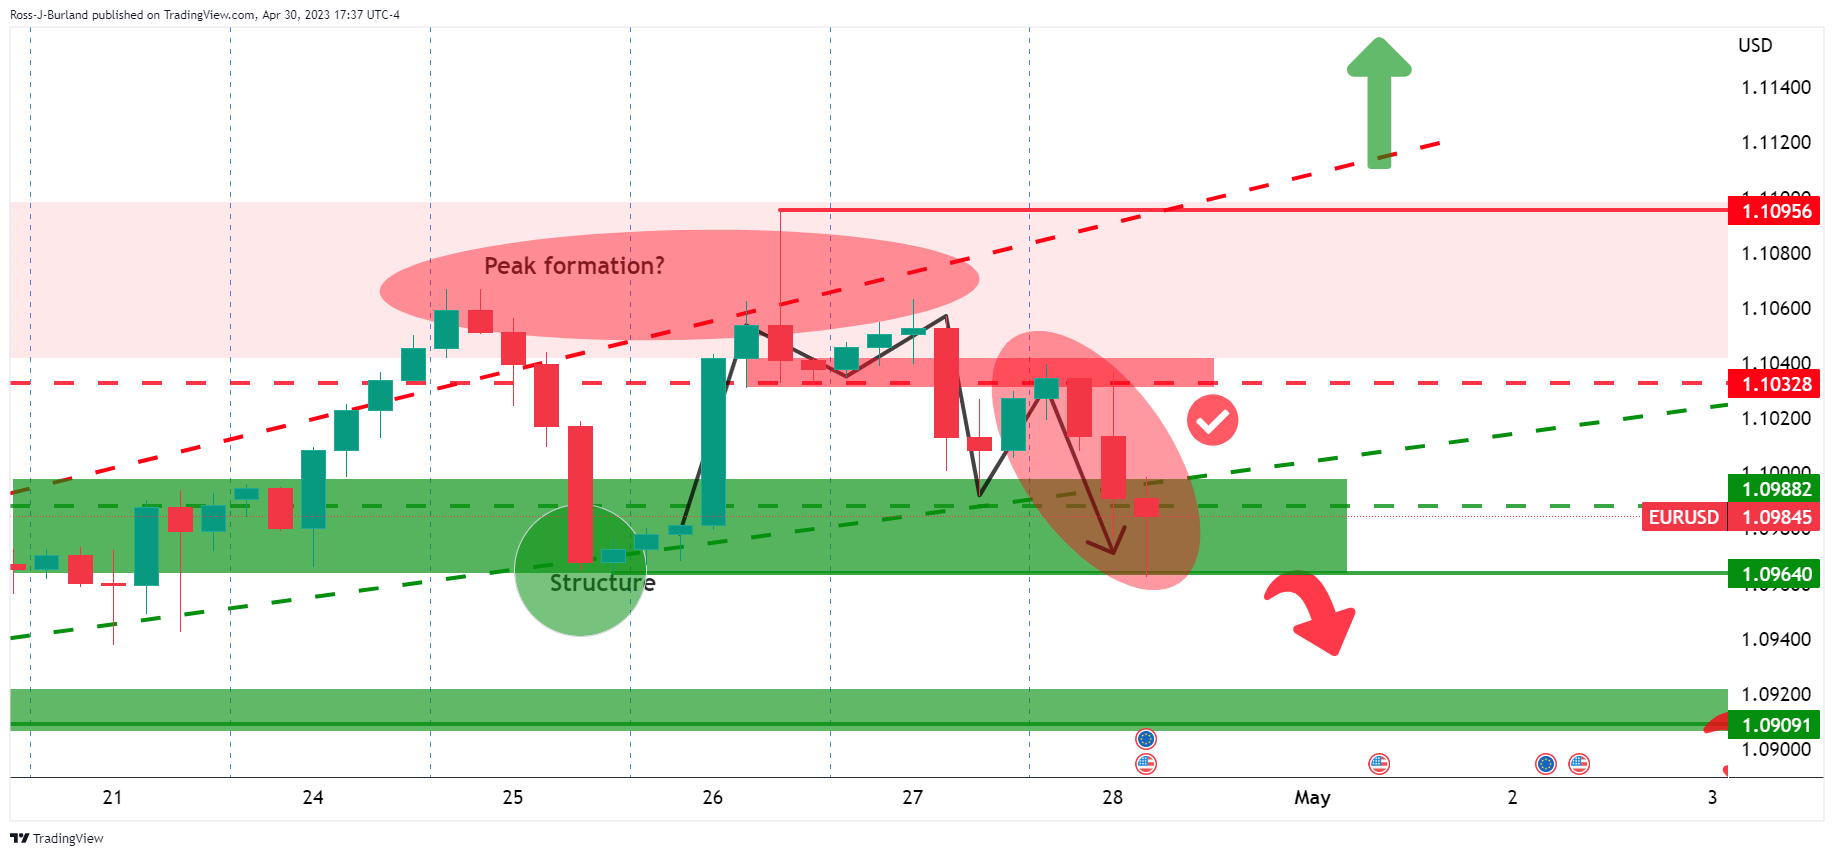
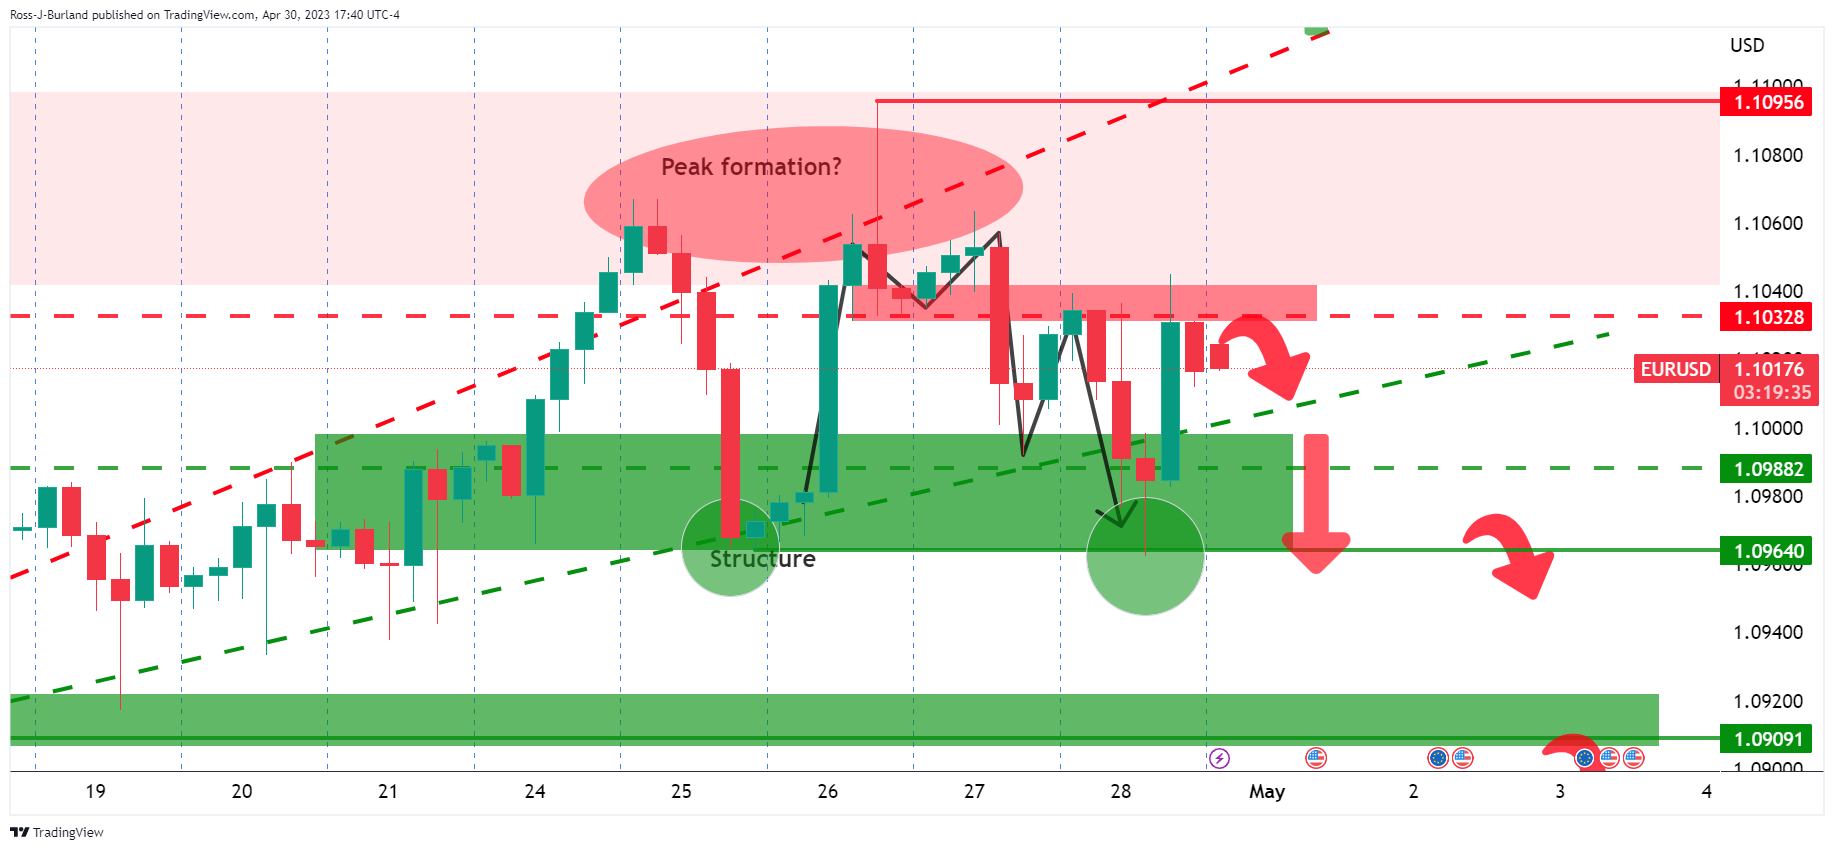
The price has moved back into the peak formation following the move to test the structure. This leaves the outlook neutral for the days ahead while the price is trapped between horizontal resistance and support. However ...
EUR/USD H1 chart
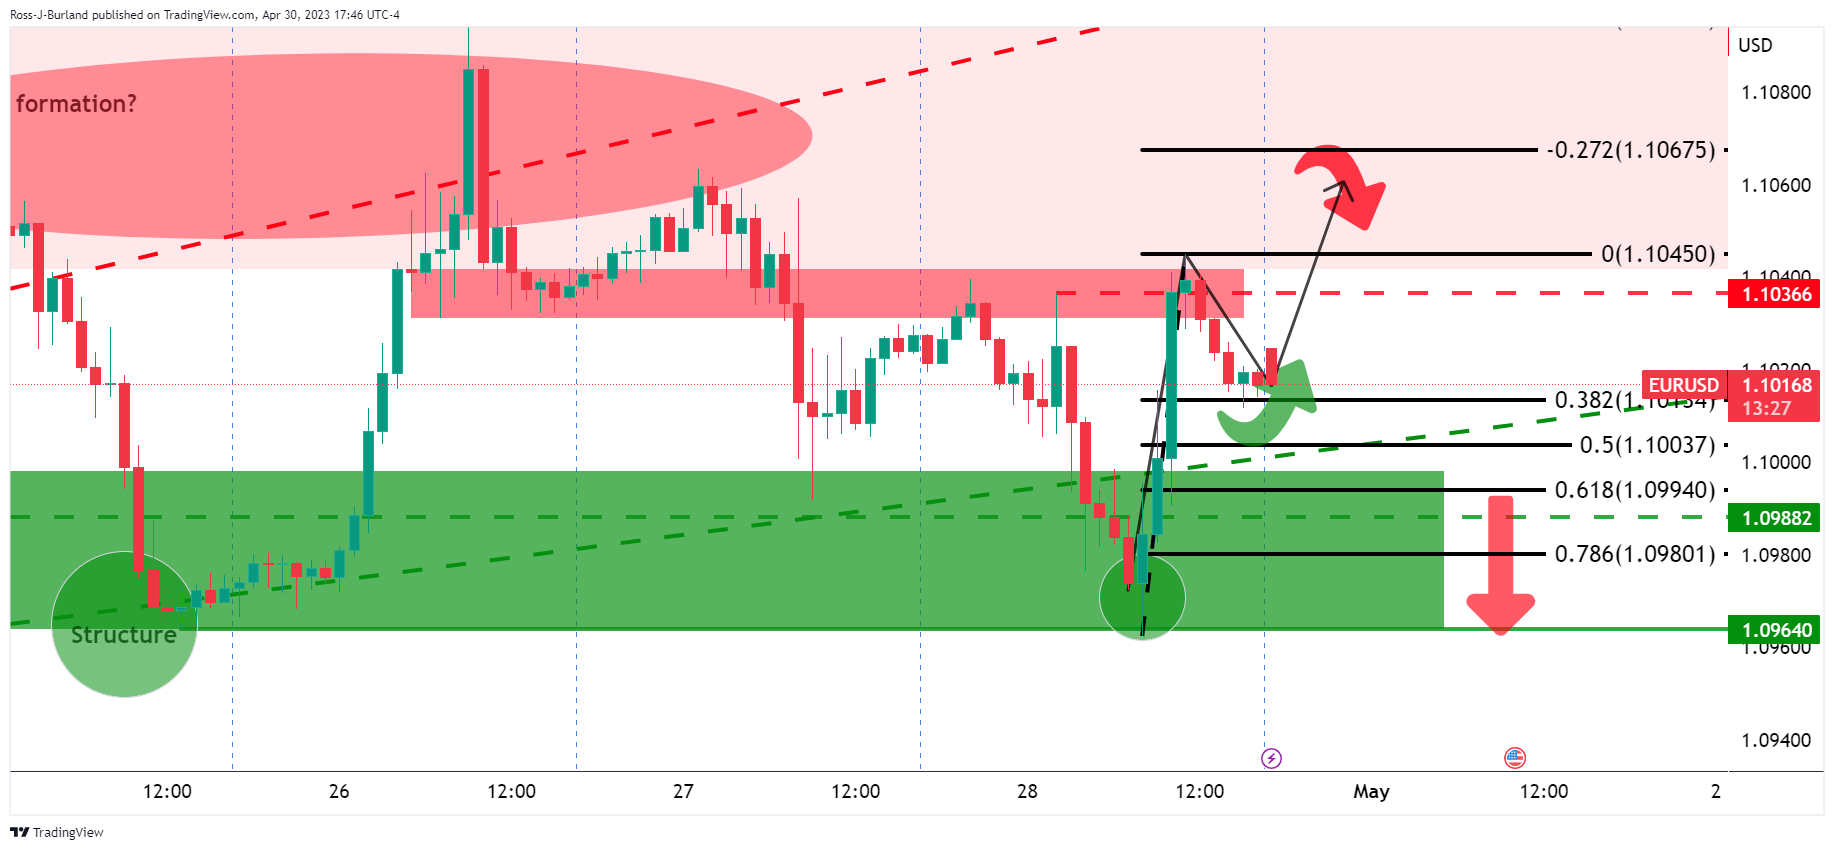
On the hourly chart, we have seen a break of the prior highs and the 38.2% Fibonacci retracement level is acting as support. A subsequent upside continuation is a bias for the open.
-
21:18
AUD/USD Price Analysis: Bears lurking in resistance, eyes on 0.6550s
- AUD/USD bears seeking a move to snap 0.6600.
- 0.6550s are vulnerable on a downside extension.
As per the prior analysis, AUD/USD Price Analysis: Bulls could be lurking at the fresh cycle lows but continuation not off the table, the bulls have indeed started to correct from the fresh lows, but still, the bearish bias persists as the following will illustrate.
AUD/USD prior analysis
The M-formation on the daily chart was expected to act as the peak formation in a correction and lead to a move lower to break the structure on the downside.
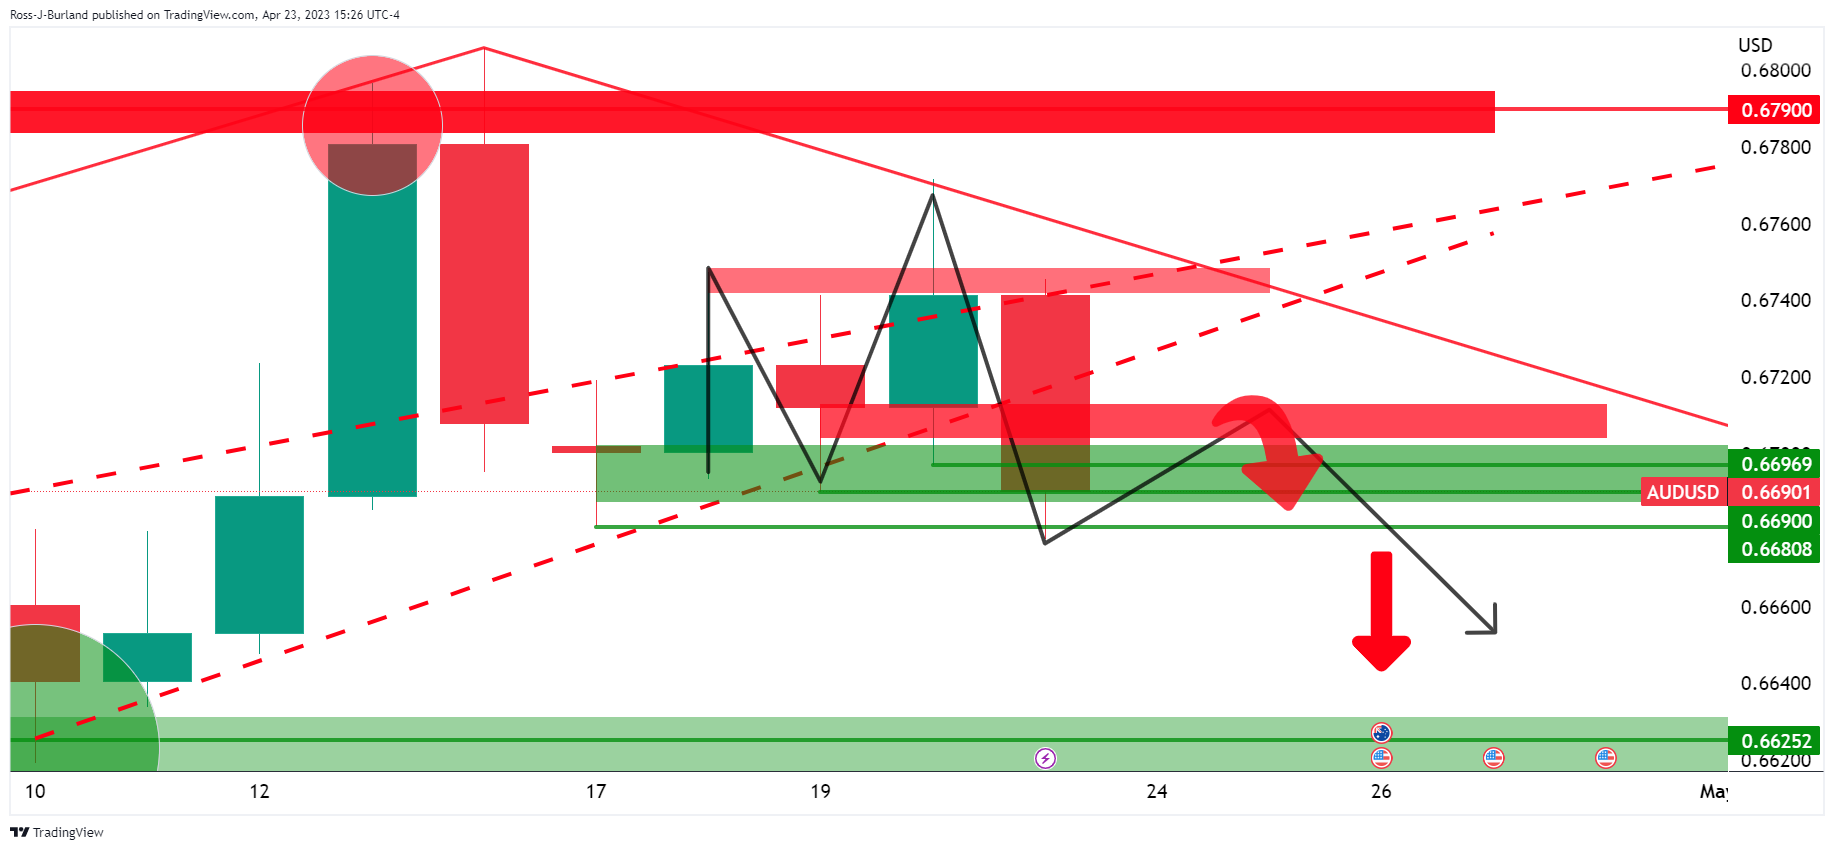
AUD/USD H4 chart
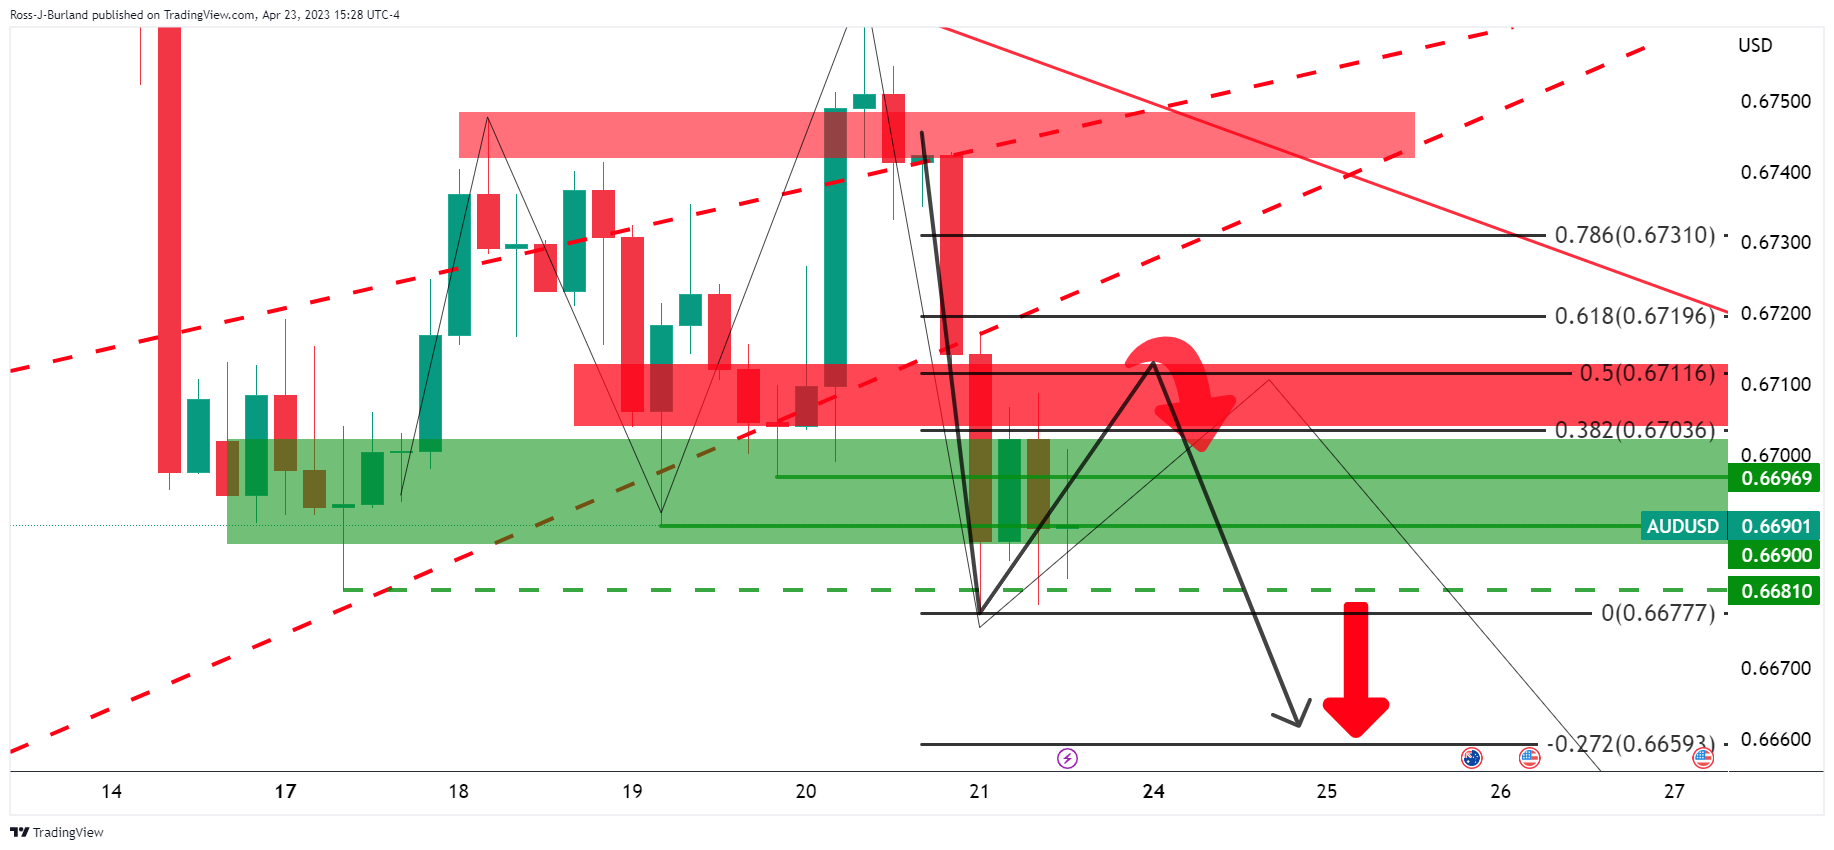
The four-hour chart´s 50% mean reversion level near 0.6710 aligned with the neckline of the pattern that could continue to act as resistance.
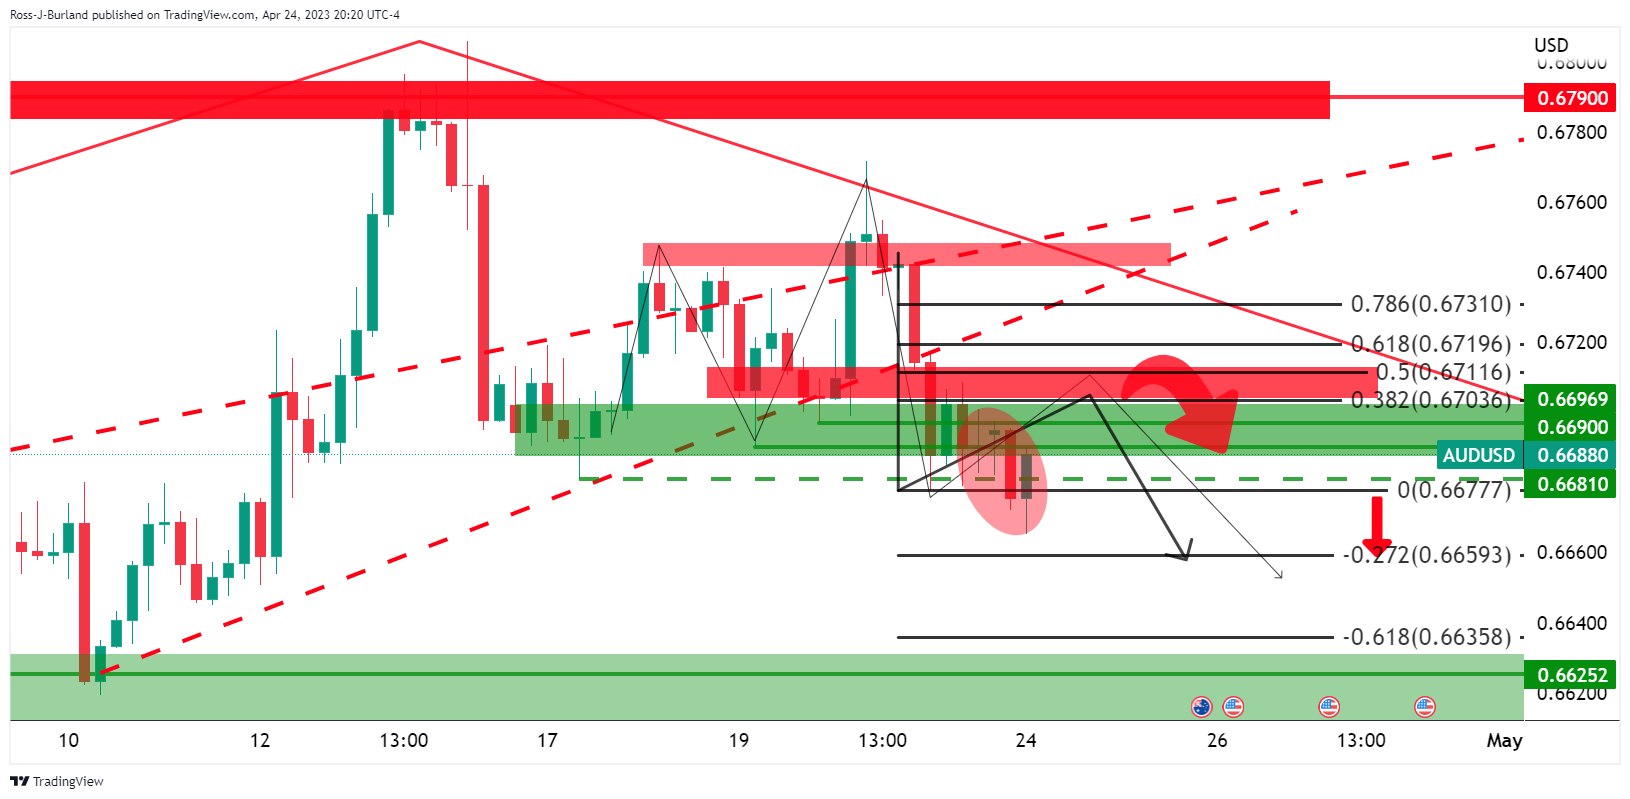
The price deteriorated but there had been a lack of momentum in the US Dollar and AUD/USD climbed back into the barroom brawl as follows:
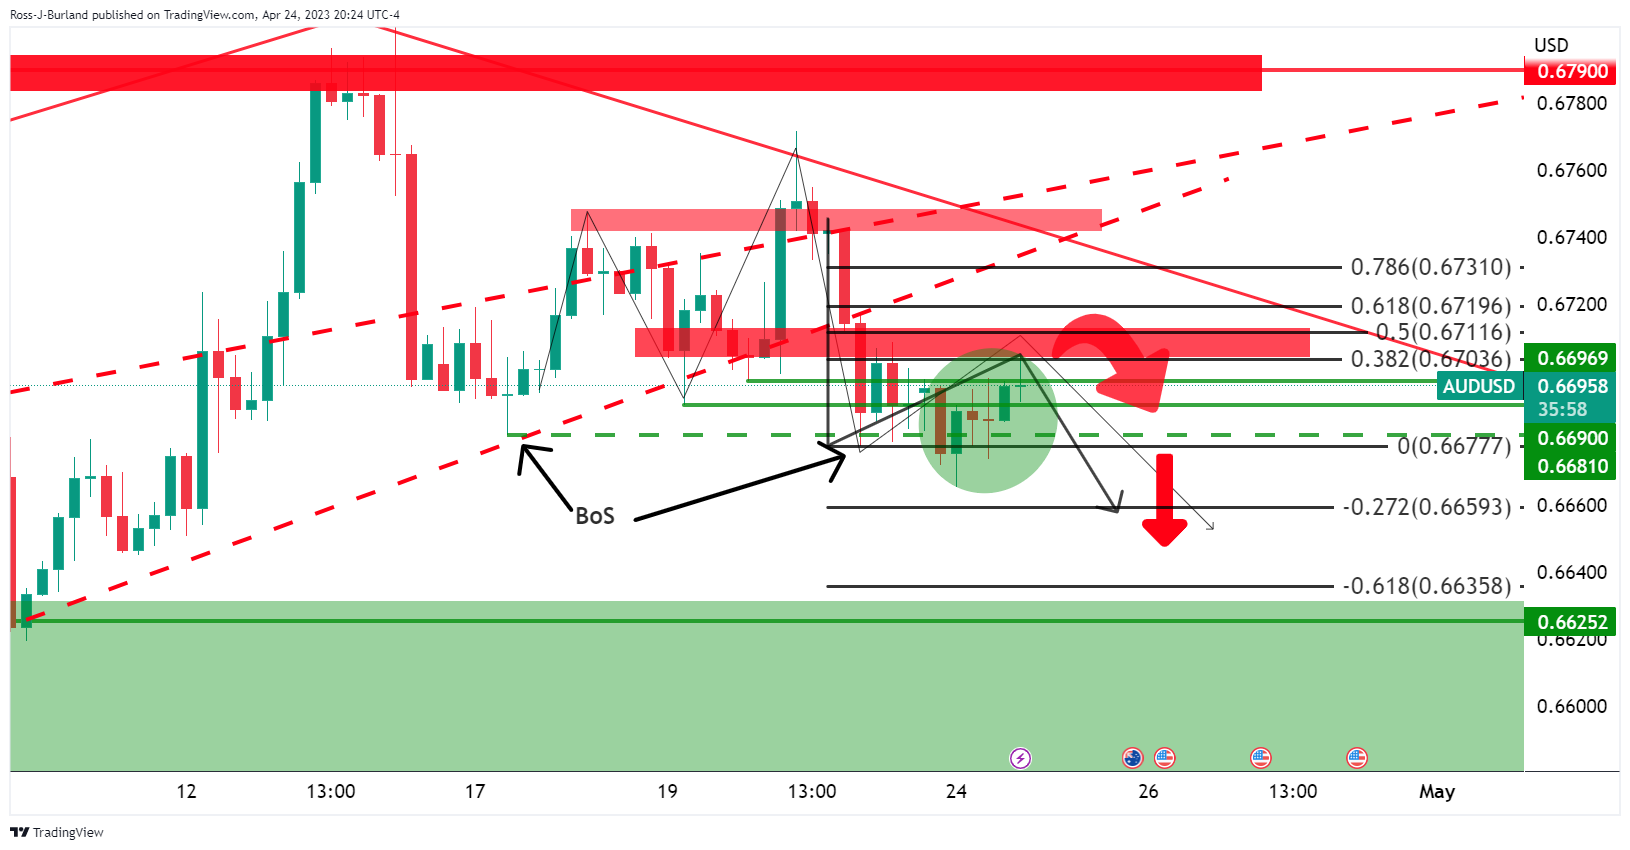
In the bearish thrust, there was a break in structure which left the bias to the downside so long as the bears showed up and guarded the 0.67s.
However, there was an adjustment to the daily chart´s Fibonaccis as follows:
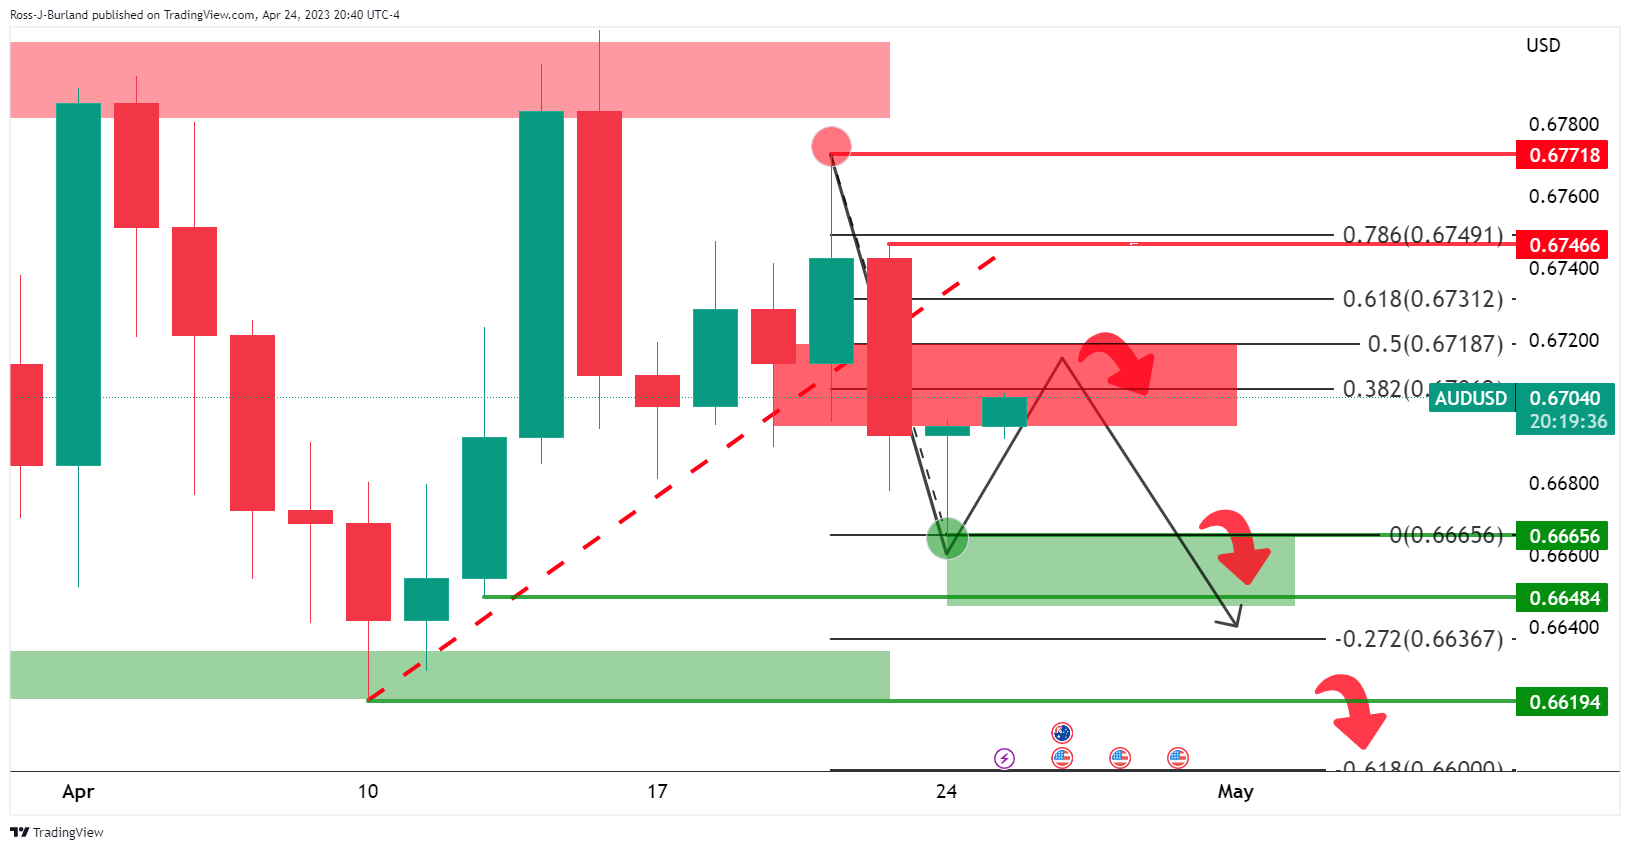
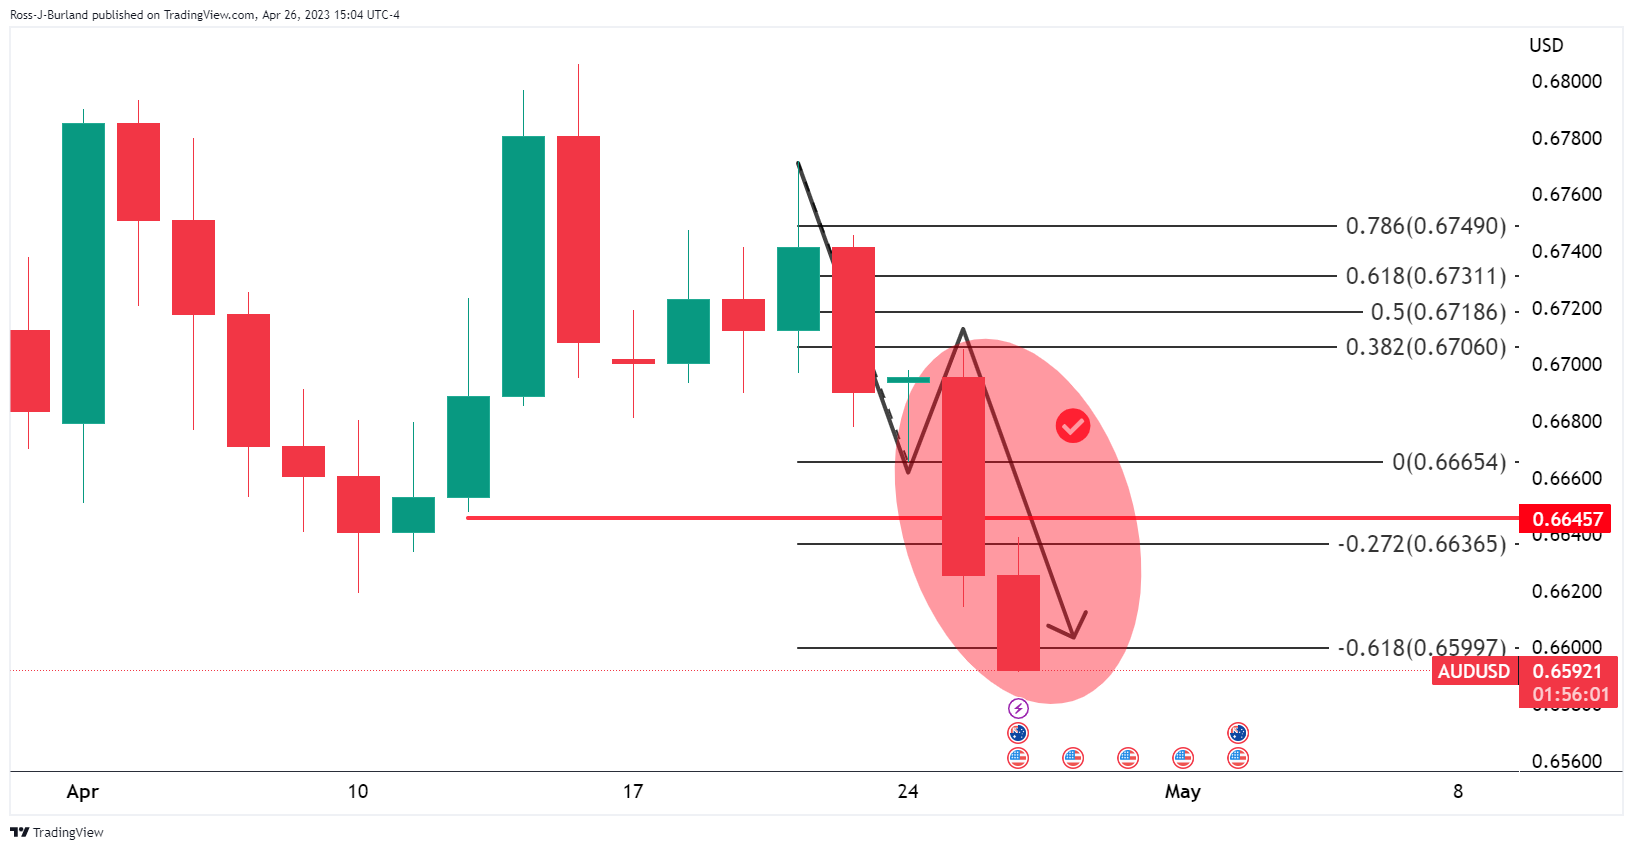
The 38.2% Fibonacci acted as resistance and we got a strong bearish impulse from there to test 0.6600 and the -61.8% Fibo.
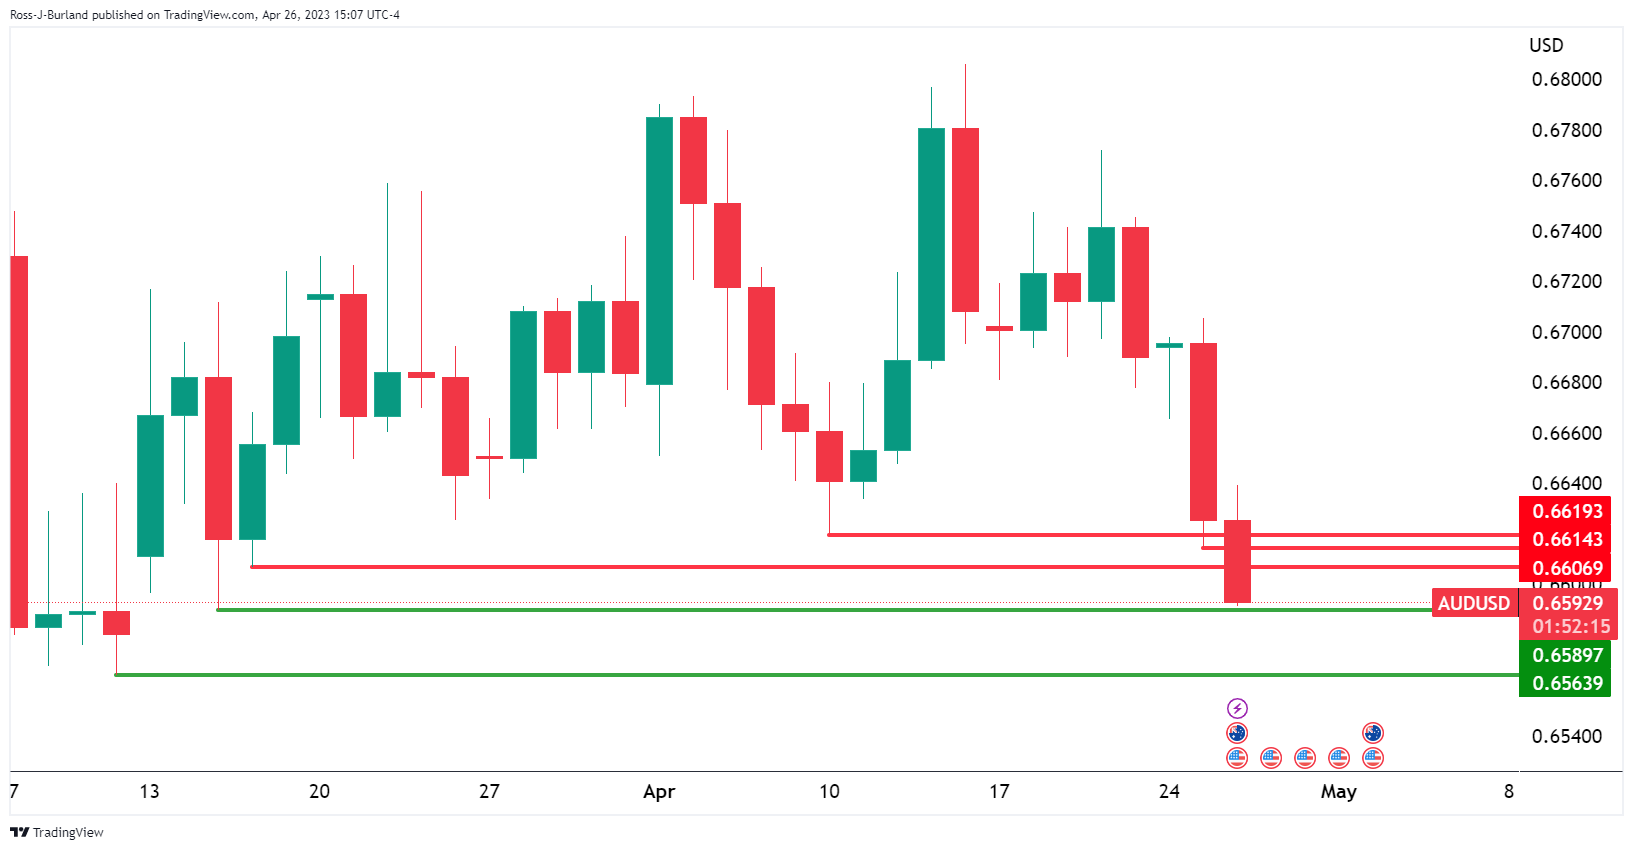
There were long positions from below 0.6590 and 0.6560 that were expected to see the market move into and further out:
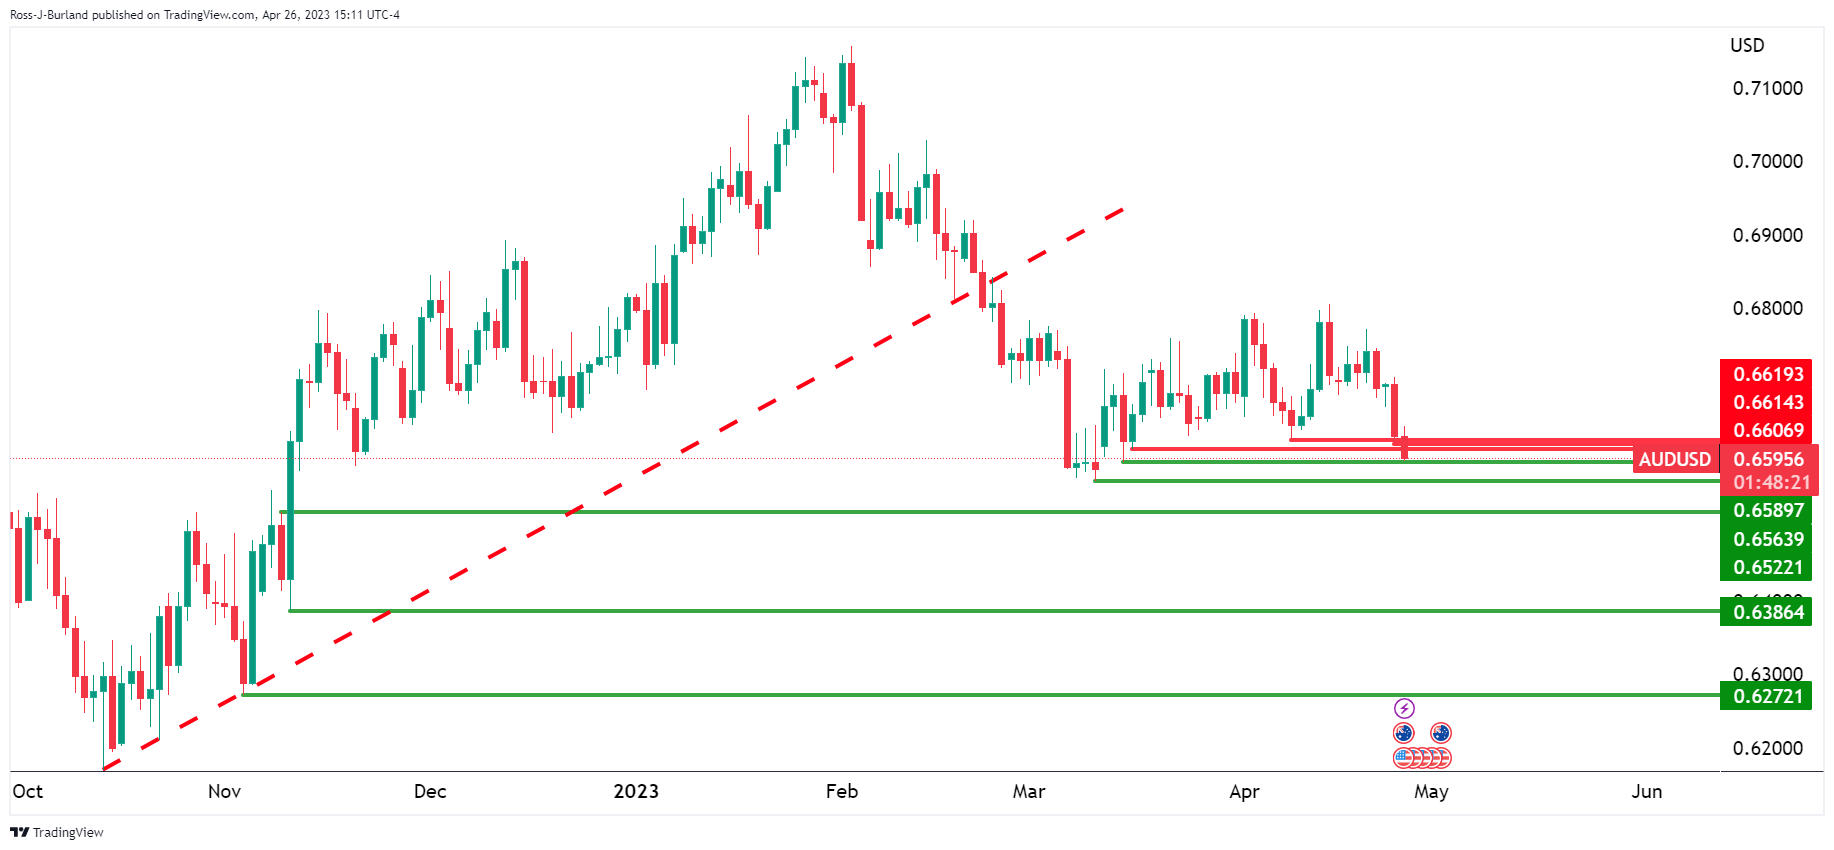
... there was a lot of downside potential below. However...
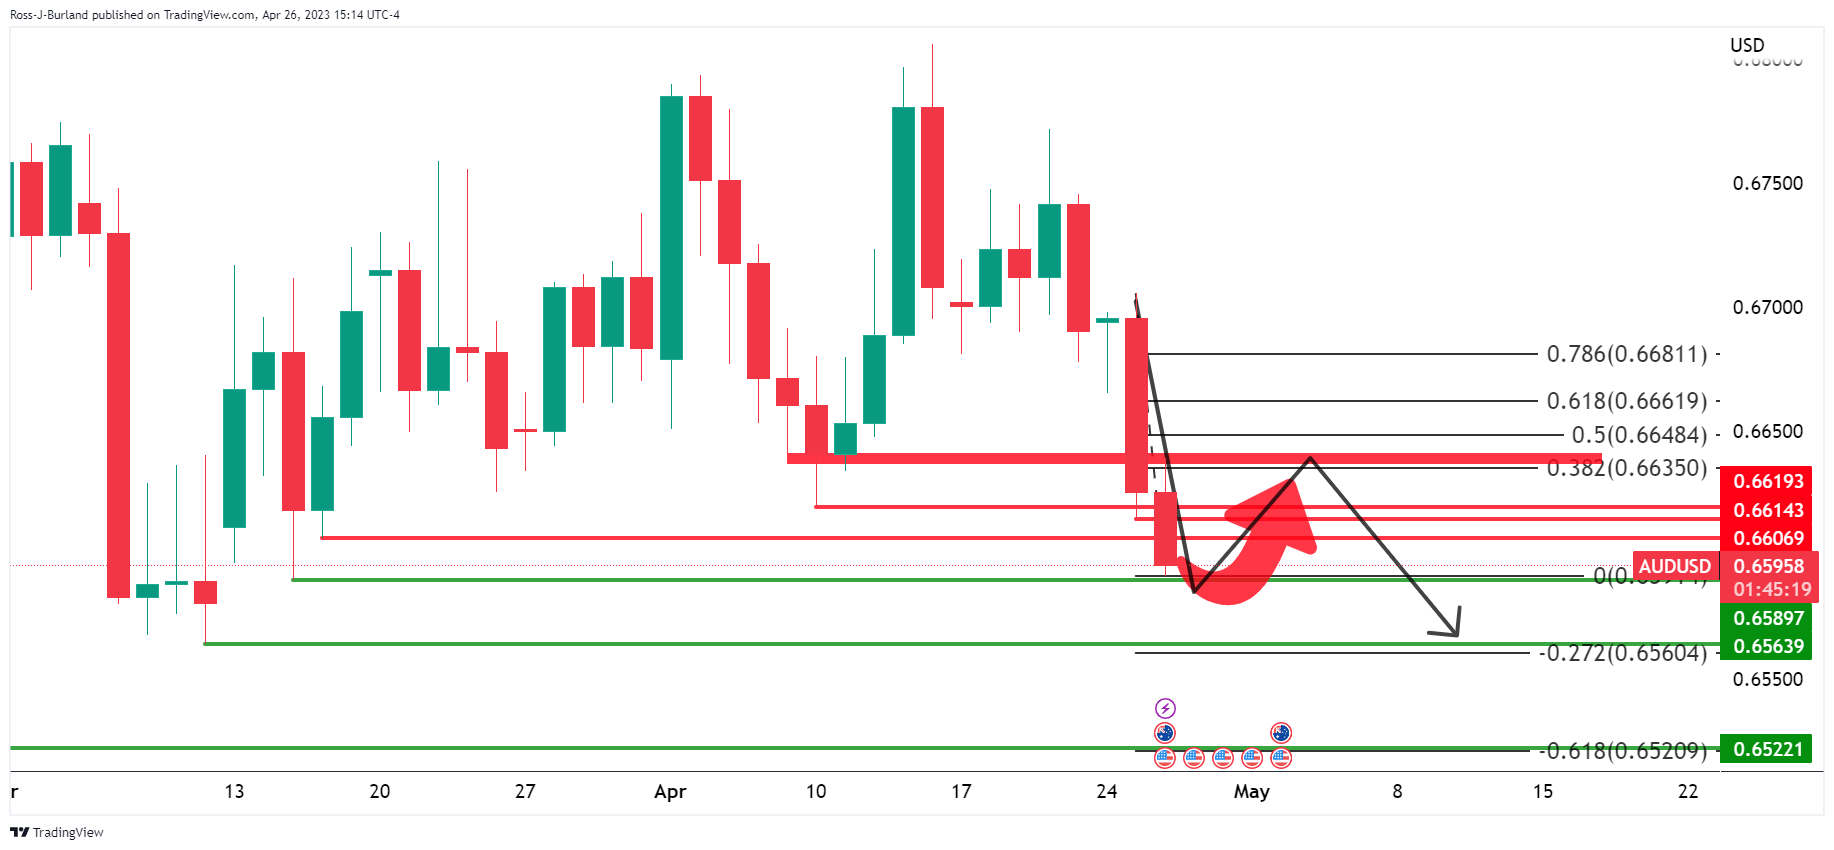
If the bulls stepped in, then there were prospects of a correction into prior support near the 38.2% Fibonacci. The 50% mean reversion aligned with the round 0.6650 number also.
AUD/USD update
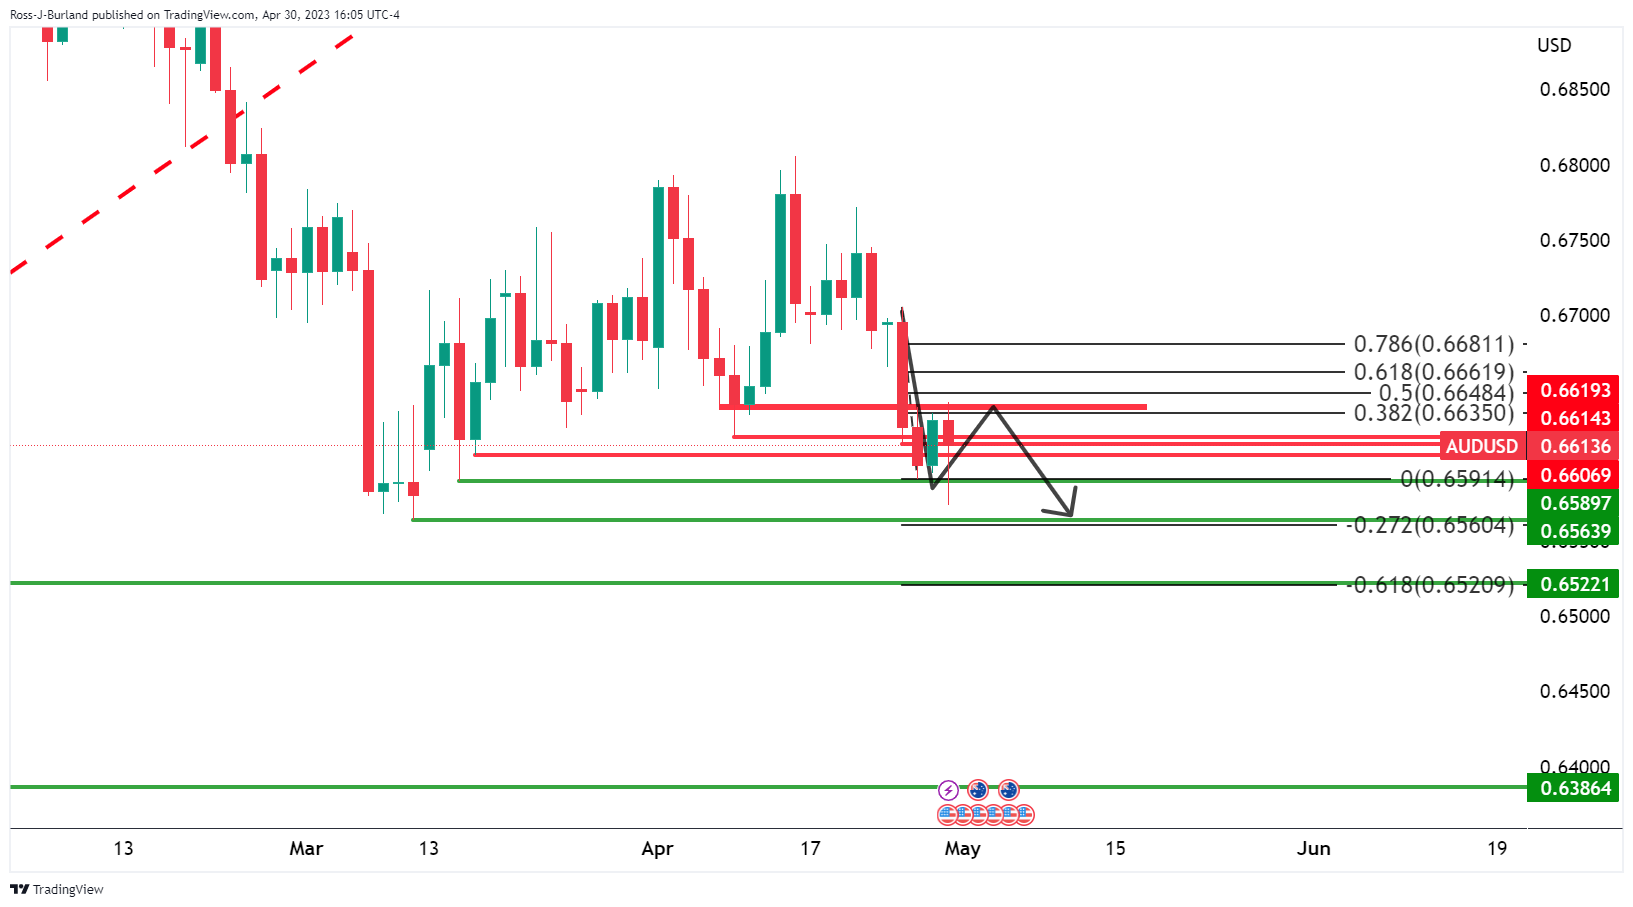
The price has run into the 38.2% Fibonacci so bears can be monitoring for bearish structure to lean against for the a position that will ride the possible downside extension for the days ahead.
AUD/USD H1 charts
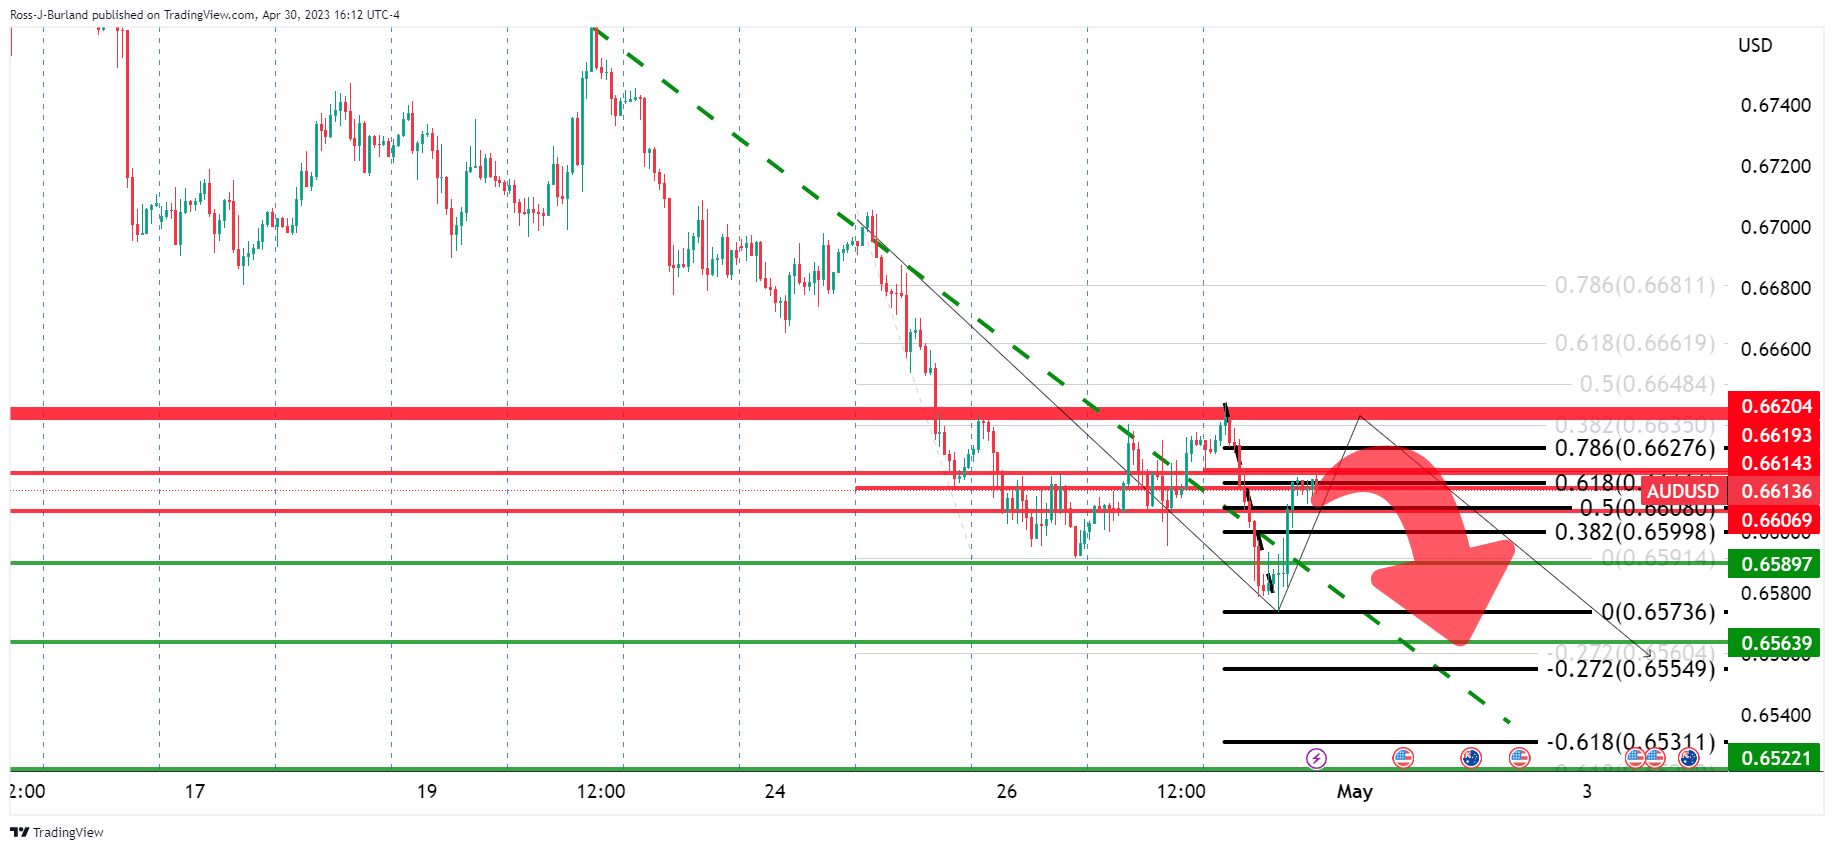
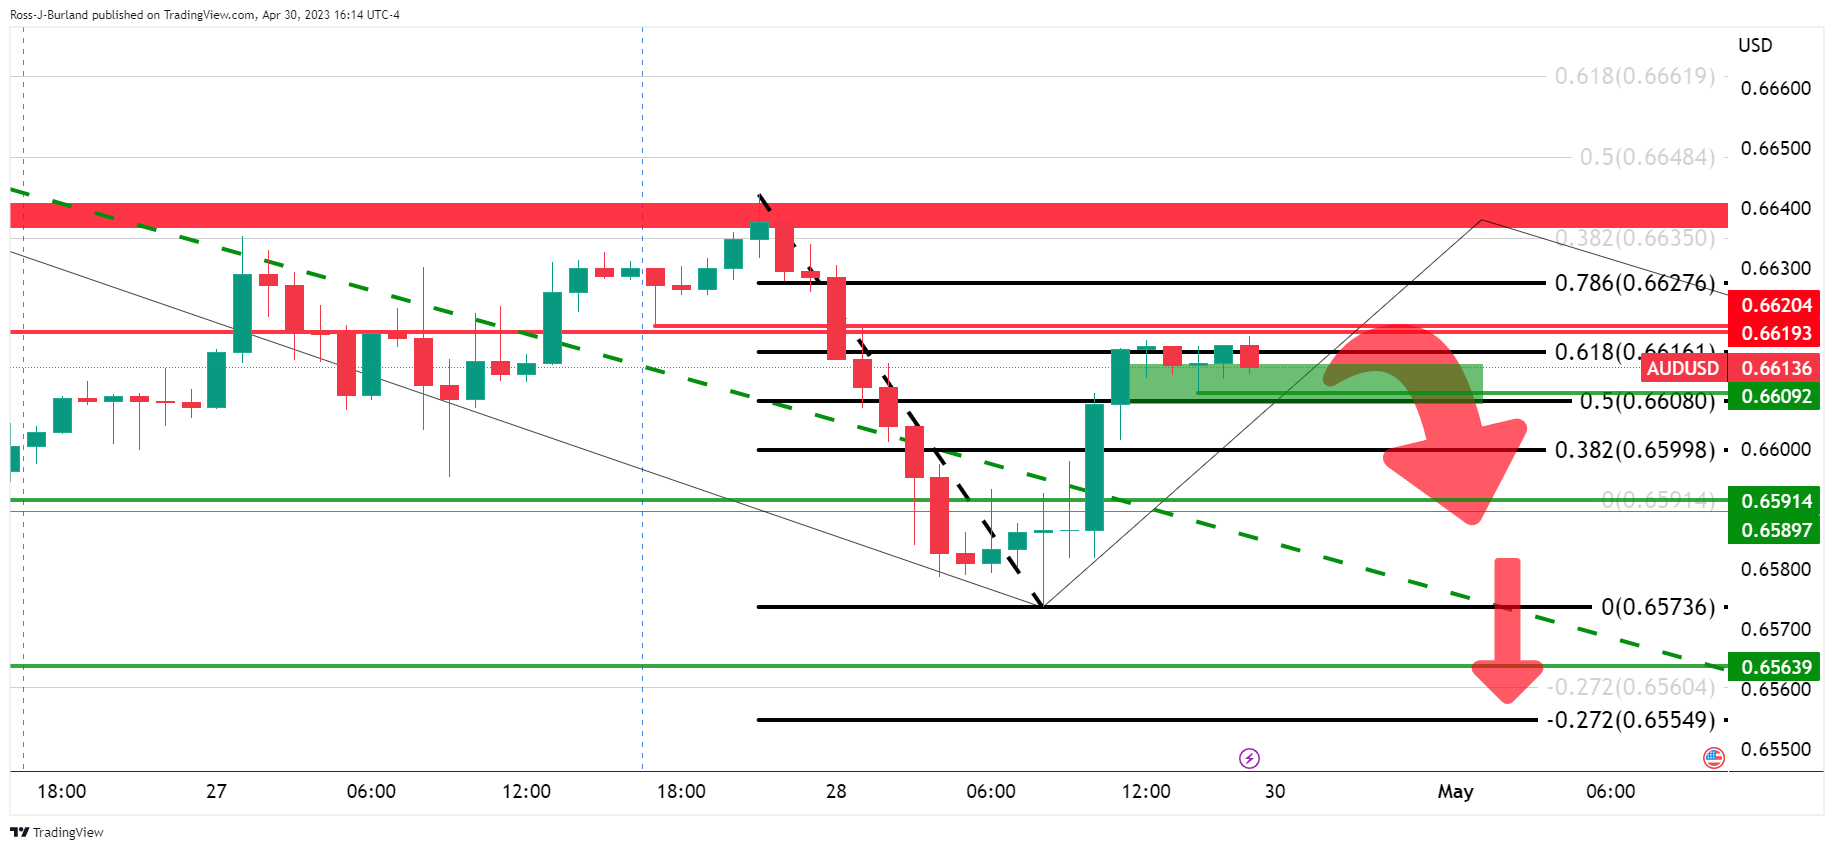
Zooming in on the hourly chart, presuming that the correction has run its course, a break of the 0.6609 structure opens risk to the 0.6550s for the day ahead.
-
02:31
China NBS Manufacturing PMI came in at 49.2 below forecasts (51.4) in April
-
02:30
China Non-Manufacturing PMI came in at 56.4, above forecasts (50.4) in April
-