Notícias do Mercado
-
23:28
WTI climbs sharply more than 2% as demand for oil increases
- WTI is set to post back-to-back weekly losses, despite gaining more than 2% on Friday.
- US crude oil output shortages were outweighed by gasoline demand; therefore, WTI rose.
Western Texas Intermediate (WTI), the US crude oil benchmark, posted gains of more than 2% after US companies related to the energy sector exceeded earnings estimates. Furthermore, a government report flashed increased demand for fuel while crude oil output decelerated. At the time of writing, WTI is trading at $76.61.
Even though WTI is registering daily gains, it would finish the week with losses of 1.67%, extending its fall to two straight weeks concerning an impending slowdown in the United States (US).
The latest news reported by Reuters said that the US Federal Deposit Insurance Corp (FDIC), the US Secretary of Treasure, and the Federal Reserve held meetings with First Republic Bank, which is failing to reach a deal, to improve its financial position.
US crude output fell in February, as reported by the US Energy Information Administration (EIA) report, with production decelerating to 12.5 million barrels per day (bpd), the lowest level since December. Nonetheless, demand for fuel jumped to nearly 20 million bpd, its highest since November.
Meanwhile, the Baker Hughes report for April 28 reported that rigs drilling for oil in the US remained unchanged at 591, on a day that US companies reported earnings.
WTI Technical Levels
-
22:58
USD/JPY Price Analysis: Trades nearby six-week highs, above 136.20s
- USD/JPY skyrocketed after BoJ’s dovish decision and high US core PCE data.
- USD/JPY Price Analysis: Rallied more than 200 pips, set for a pullback, before challenging YTD high,
The USD/JPY rose sharply after the first monetary policy decision by the Bank of Japan (BoJ) new Governor Kazuo Ueda struck a dovish tone, a greenlight for US Dollar (USD) buyers, against the Japanese Yen. (JPY). Therefore, the USD/JPY extended its gains of more than 1.73%, trading at 136.27.
USD/JPY Price Action
After the US inflation data release, the USD/JPY skyrocketed, past the last week’s high of 135.13, and extended its gains toward the 136.56 area, a six-week high at 136.56.
The USD/JPY resumed its uptrend after the release of inflation data in the US. On its way north, the price jumped more than 200 pips in the day, and it had opened the door to test the YTD high at 137.91. Nevertheless, buyers must reclaim some resistance levels before challenging the YTD high.
The first resistance would be the March 10 high at 136.99, which, once cleared, the USD/JPY will continue towards the March 9 high at 137.35. Up next would be the YTD high before testing 138.00.
On the other hand, the aggressive rally lifted the Relative Strength Index (RSI) indicator shy of reaching the overbought level; while the Rate of Change (RoC) hit levels last seen on February 15. Given the backdrop, the USD/JPY might be headed for a pullback after Friday’s rally.
The USD/JPY first support would be 136.00, followed by the 135.50 area. A breach of the latter, the USD/JPY could dip toward April 19 daily high, turned support at 135.13, ahead of challenging the 135.00 figure.
USD/JPY Daily Chart

-
22:00
Mexico Fiscal Balance, pesos increased to 6.99B in March from previous -74.37B
-
21:52
USD/MXN tumbles below 18.0000 amid solid US earnings and higher inflation concerns
- USD/MXN to finish the week almost flat, with gains of 0.70%.
- Data from the United States justified a 25 bps hike by the Fed at the May meeting, though it did not boost the US Dollar.
- USD/MXN Price Analysis: Downward pressured below 18.00; otherwise, expect a rally to the 20-DMA at 18.10000.
The Mexican Peso (MXN) appreciates during the last trading day of the week, as shown by the USD/MXN tumbling 0.25%, amidst a risk-on impulse due to US stocks posting solid earnings. US data flashed signs that inflation is too high, a green light for another rate increase by the Federal Reserve (Fed). At the time of writing, the USD/MXN is trading at 17.9830 after hitting a high of 18.1089.
USD/MXN holds steady weekly gains of 0.70%, despite lackluster response to US data
Wall Street finished the last trading day of April with solid gains, propelled by earnings from Exxon and Intel. A report by the US Commerce Department showed that inflation in March, as measured by the Fed’s preferred gauge for inflation, the core Personal Consumption Expenditure (PCE), rose by 0.3% MoM in line with estimates. On an annual basis, figures rose by 4.6%, above forecasts of 4.5%, increasing the chances for another quarter of percent rate hike by the US central bank.
Given the backdrop, the swaps market continued to price in a 25 bps hike for the May meeting though investors remain reluctant to believe the Fed’s rhetoric of going higher for longer. The CME FEdWatch Tool odds for a 25 bps lift stood at 84%, but the first rate cut is expected by September.
In the meantime, the US Dollar Index (DXY), which tracks the value of six currencies against the greenback, advances 0.20% to 101.681 but fails to impress USD/MXN buyers as the pair extended its losses past the 18.0000 figure.
In other data, Consumer Sentiment in the US stood at 63.5, an improvement over the latest reading of 62.0, as revealed by the University of Michigan (UoM) poll. Inflation expectations for a one-year horizon rose to 4.6% from 3.6%, and expectations for a 5-year uptick to 3% from 2.9%.
On the Mexican front, the economy expanded by 1.1% QoQ, above the previous 0.5% growth in Q4, 2022, as reported by INEGI. On an annual basis, the Gross Domestic Product (GDP) grew by 3.9%, exceeding the forecasts of 3.3%.
Aside from this, USD/MXN traders would look for clues to next week’s Federal Reserve Open Market Committee (FOMC) decision on Wednesday afternoon, and the US Nonfarm Payrolls report on Friday
USD/MXN Technical Analysis
The downtrend in the USD/MXN pair stays intact after testing the 20-day EMA earlier in the day. However, USD/MXN sellers must drag the exchange rate below the April 25 low of 17.9505 if they want to re-test the YTD low at 17.8968. Conversely, the USD/MXN buyers must crack 18.0000 and the 20-day EMA at around 18.1000 if they want to challenge the 50-day EMA At 18.2910.
-
21:32
Australia CFTC AUD NC Net Positions rose from previous $-42.4K to $-39.5K
-
21:32
Japan CFTC JPY NC Net Positions declined to ¥-68.7K from previous ¥-56.9K
-
21:32
United States CFTC Gold NC Net Positions dipped from previous $189.9K to $185.3K
-
21:32
United States CFTC Oil NC Net Positions dipped from previous 244.6K to 236.4K
-
21:32
European Monetary Union CFTC EUR NC Net Positions rose from previous €164.4K to €169.4K
-
21:31
United Kingdom CFTC GBP NC Net Positions: £5.8K vs £1.3K
-
21:31
United States CFTC S&P 500 NC Net Positions dipped from previous $-344.3K to $-363.3K
-
21:00
Colombia Interest rate above expectations (13%): Actual (13.25%)
-
20:37
Colombia: Central bank has now additional reasons to be cautious in coming months – TDS
The Central Bank of Colombia (BanRep) raised its key interest rate by 25bps to 13.25%. Analysts at TD Securities think this was the last hike in the cycle and they warn that after the recent Cabinet reshuffle form the President, the central bank has now additional reasons to be cautious in coming months.
Key quotes:
“We think BanRep has hit terminal rate at 13.25%. As we expected, the central bank deployed another 25bp rate hike in a decision by majority. The wording of the forward guidance did not provide a hint on the central bank hitting terminal after today's meeting. Once more, it was stated that future decisions will depend on incoming data. However, based on our prospects for inflation, inflation expectations and economic activity in the run up to the next monetary policy decision (June 30), we think this was the last hike in the cycle.”
“BanRep has now additional reasons to be cautious in coming months. Up to April 25, we thought a data-dependent approach in the aftermath of April's monetary policy decision will focus on incoming inflation data, expectation surveys, and activity figures in the interim before the start of a cutting cycle. However, after the Cabinet reshuffle that took place on April 26, certain idiosyncratic factors have returned to the spotlight in the form of renewed fiscal and policy uncertainty.”
-
20:02
EUR/USD: Room for rebound to extend – MUFG
Analysts at MUFG Bank continue to see the EUR/USD pair moving to the upside over the next few days. They expect the pair to break out to the upside and move back closer to pre-Ukraine conflict levels from early last year.
Key quotes:
“The pair has been attempting to break above the top of this year’s trading range between 1.0500 and 1.1000 over the past week, and has spent the most time trading above the 1.1000-level this month since March of last year. We expect the pair to break to out to the upside and move back closer to pre-Ukraine conflict levels from early last year. The fundamental drivers that have helped lift EUR/USD at the start of this year remain in place and have been reinforced recently.”
“The EUR is continuing to benefit from the easing of downside risks to growth in the euro-zone.”
“Renewed concerns over the health of First Republic Bank over the past week ahead of next week’s FOMC meeting makes us more confident that the Fed will deliver a more cautious policy update. We expect one final 25bps hike from the Fed next week and a signal that they are more seriously considering pausing their hiking cycle. The narrowing policy divergence between the ECB and Fed should help to keep lifting EUR/USD to fresh year to date highs.”
-
20:01
NFP: Payroll growth to slow to 195K in April – Wells Fargo
Next week it is not only about central banks, the US official employment report is due on Friday. Analysts at Wells Fargo, see payroll rising by 195K, slightly above the consensus of 181K.
Key quotes:
“Slowly bending, not breaking, has so far been the story of the labor market this year. That is unlikely to change with April's employment report. In March, nonfarm payrolls rose by 236K, the weakest print since December 2020. Signs were more encouraging in the separate household survey, where employment rose by 577K, causing the unemployment rate to tick back down to 3.5%. The labor force participation rate also rose for a fourth straight month.”
“Falling hiring plans and job openings point to demand for workers continuing to trend lower. With some hiring pulled forward by the unusually warm weather to start the year, we look for payroll growth to slow to 195K in April and for the unemployment rate to edge back up to 3.6%. Another 0.3% increase in average hourly earnings would keep the year-over-year rate at 4.2%.”
-
19:55
Canada: A slowing economy should keep the BoC on hold – CIBC
Data released on Friday showed monthly GDP in Canada rose by 0.1% in February, below market consensus. Analysts at CIBC point out that a slowing economy should keep the Bank of Canada (BoC) on hold for the remainder of 2023, rather than pulling the trigger on another rate hike, before cuts arrive early next year.
Key quotes:
“After sprinting out of the gate to start 2023, the Canadian economy had already hit a wall by March. Monthly GDP rose by 0.1% in February, which was a tick below the consensus forecast and a noticeable deceleration from an upwardly revised 0.6% gain in January. Moreover, the March advance estimate suggests that GDP fell slightly to end the quarter, implying little momentum heading into the second quarter.”
“The weak end to the first quarter, combined with the negative but temporary impact of the public sector strike on Q2 GDP, increases the risk of a contraction in economic activity during the second quarter. However, the Bank of Canada will look through that volatility, and focus instead on trying to get and keep inflation and inflation expectations under control. While a weakening economy should prevent policymakers pulling the trigger on another interest rate hike, we don’t see cuts forthcoming until early next year.”
-
19:46
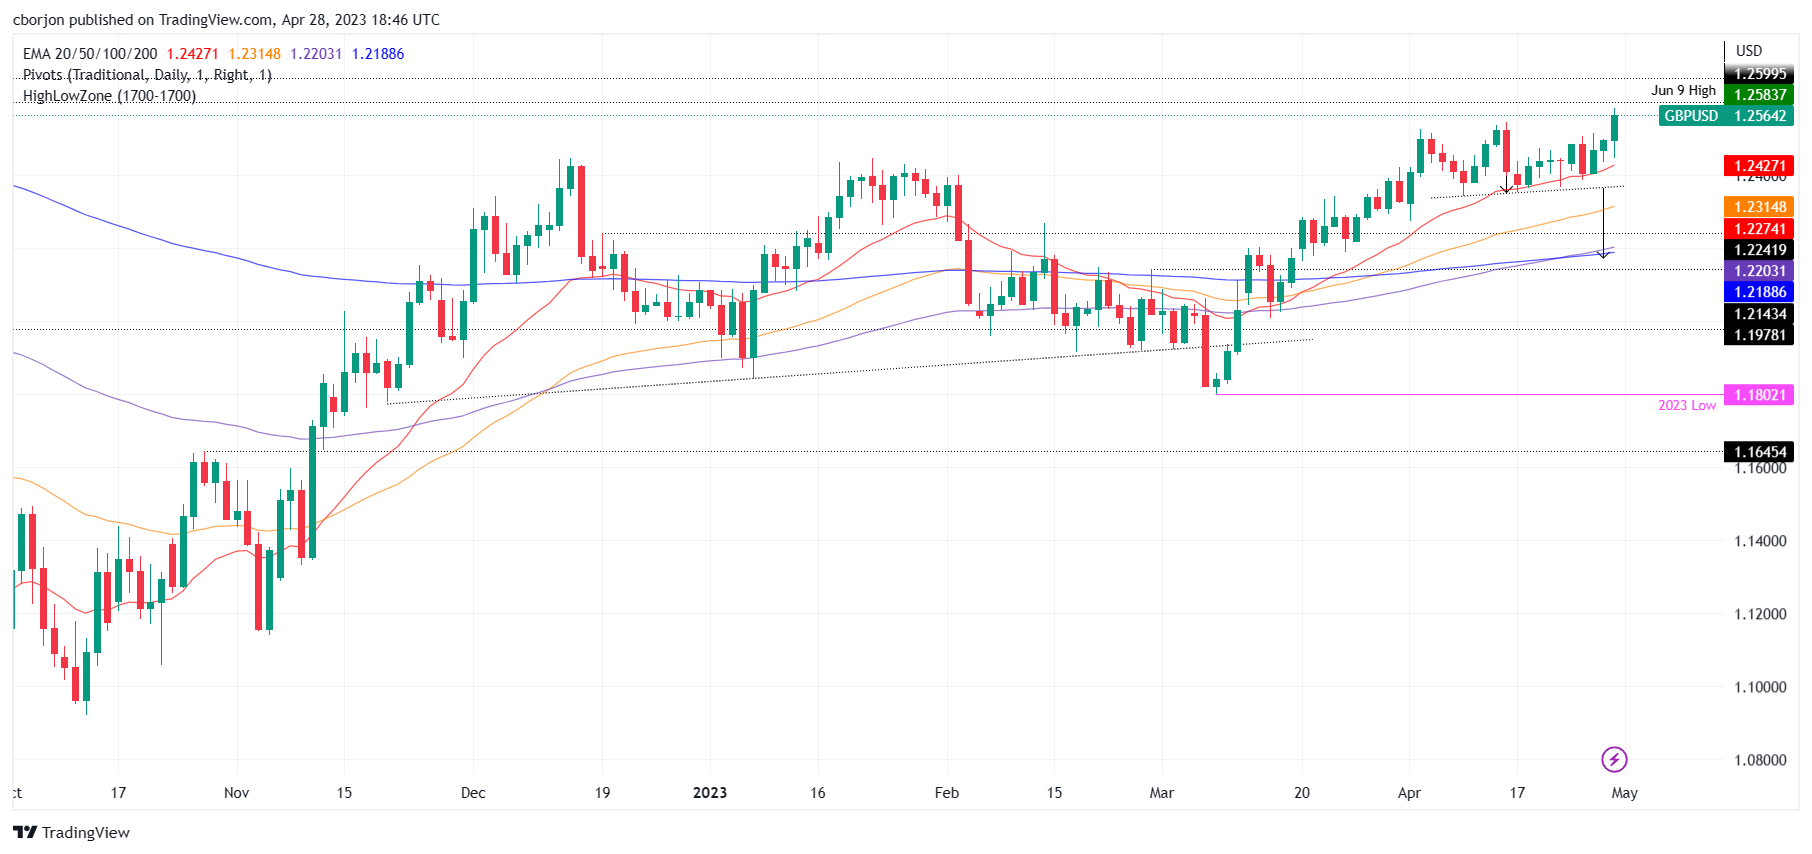
GBP/USD Price Analysis: Climbs to 11-month highs, as buyers eye 1.2600
- The GBP/USD bounced off daily lows at 1.2446 and reclaimed 1.2500.
- GBP/USD Price Analysis: Bullish above 1.2500, with buyers eyeing the 200-week EMA above 1.2800.
The GBP/USD soared to fresh YTD highs at 1.2583 despite fundamental news from the United States (US) increasing the likelihood of a Federal Reserve 25 bps rate hike. Therefore, the GBP/USD is trading at 1.2571, above its opening price by 0.61%.
GBP/USD Price Action
The GBP/USD daily chart remains upward-biased from a technical perspective. After dipping to the 20-day EMA at 1.2477, the GBP/USD surged past the 1.2500 mark, despite the US Dollar (USD) strengthening after high inflation data.
The Relative Strength Index (RSI) indicator is still in bullish territory and aims higher, justifying higher GBP/USD prices. If GBP/USD cracks the 1.2600 figure, it would be cheered by buyers, which will set their eyes on the 200-week EMA at 1.2817.
Conversely, if the GBP/USD tumbles below 1.2500, that will expose the 20-day EMA at 1.2427, followed by 1.2400. A breach of the latter will expose the 50-day EMA at 1.2315, followed by the 1.2300 figure ahead of the confluence of the 200/100-day EMAs, each at 1.2188/1.2203, respectively.
GBP/USD Daily Chart
-
19:32
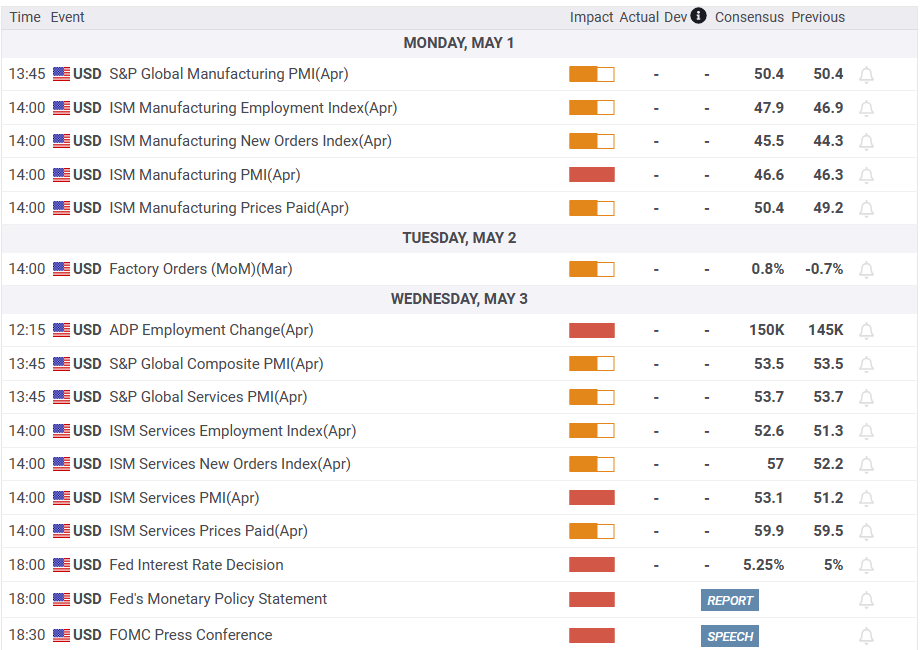
Forex Today: Busy week ahead with Fed, ECB, RBA, ISM, NFP, and more
Here is what you need to know for next week:
On Friday, Wall Street enjoyed a two-day rally thanks to better-than-expected earnings from big tech companies. However, the positive sentiment may be short-lived given the gloomy global growth outlook and renewed concerns surrounding First Republic Bank. Incoming economic data will be closely watched, although it could potentially be offset by central bank decisions.
It will be a busy week for the US Dollar, as the economic data set to be released includes the ISM PMIs, the ADP Private Employment, and the official employment report. The Federal Reserve will announce its decision on Wednesday, with market participants expecting a final 25 basis points rate hike. The US Dollar Index finished the week little changed around 101.50. The DXY continues to hover around recent lows, holding above but with gains limited. The economic calendar for next week warrants volatility and may challenge the ongoing consolidation pace.
EUR/USD saw a modest rise during the week, continuing to trade near one-year highs but struggling to consolidate above 1.1050. The Eurozone's Q1 GDP narrowly avoided a recession with a 0.1% expansion. The European Central Bank is expected to raise interest rates by 25 basis points next week, as inflation remains elevated.
The Japanese Yen tumbled on Friday following the Bank of Japan's monetary policy meeting. The central bank dropped its forward guidance for interest rates and launched a review of its policies that will take more than a year. "We're not starting the review with the aim of normalizing," said Uedo at his first post-meeting press conference. USD/JPY soared on Friday from 134.00 to 136.55.
The Pound was the best performer among G10 currencies. GBP/USD broke above 1.2550 and climbed to 1.2583, reaching the highest level since June 2022. On the other hand, EUR/GBP suffered on Friday, recording the biggest daily loss in weeks, falling towards 0.8750.
USD/CAD ended the week with little change after a considerable pullback on Friday, signaling a potential reversal that could continue. The pair reached its peak at 1.3667, the highest level in four weeks, before dropping back below 1.3550, despite weaker-than-expected Canadian GDP data. Next Friday, Canada will release its employment report.New Zealand will release its employment report next week. NZD/USD ended a three-week negative streak after a considerable rally on Friday, with the Kiwi outperforming. The pair rose from 0.6120 to 0.6190.
The Reserve Bank of Australia will make its interest rate decision next week; no change is expected. The key will likely be in the monetary policy statement on Friday. AUD/USD fell during the week but managed to recover 0.6600. The bias is to the downside, but losses seem limited while above 0.6560.
The Colombian Peso is expected to face continued pressure, having been the worst performing currency of the week due to increasing political risk in Colombia. This was triggered by President Petro's decision to remove a moderate finance minister and replace him with a key leftist ally. As a result, USD/COP surged to 4,714 on Friday, experiencing a gain of over 4% for the week.
Commodity prices had a tough week, with corn sliding more than 10%, coffee falling 4%, and soybeans dropping 4%. Crude oil prices dropped 1.5% after trimming losses on Friday. Gold and silver finished the week flat near $1,990 and $25.00, respectively, as they remained mostly sideways. Bitcoin, on the other hand, jumped 7%.
Like this article? Help us with some feedback by answering this survey:
Rate this content -
19:09
EUR/USD rebounds, Fed considers tightening as US inflation sticks
- EUR/USD bounces back from the daily low and reclaims 1.1000 after US data.
- US inflation on the rise: core PCE at 4.6% in March, unchanged from February.
- EUR/USD Price Analysis: Likely to test 1.1100 above 1.1000; otherwise, it could test the 20-day EMA in the near term.
The EUR/USD recovered from earlier losses that dragged the pair towards its daily low of 1.0962 and is trading at around the 1.1020s area after inflation in the United States (US) proved to be stickier than expected, warranting further tightening by the Federal Reserve (Fed).
EUR/USD climbed despite high inflation in the US, warrants higher rates
Wall Street prints solid gains in the mid-day of the New York session. The US Department of Commerce revealed that the Fed’s preferred gauge for inflation, the core Personal Consumption Expenditure (PCE) in March, rose by 4.6%, unchanged from February’s data. Therefore, further tightening is expected by the Federal Reserve, even though the headline figure slowed to 0.1% MoM less than the prior’s month 0.3%, and the annual figures slowed from 5.1% to 4.2%.
In the initial reaction, the EUR/USD dipped to its daily low, but since then, the shared currency posted an 80-pip gain before stabilizing at current exchange rates.
Other data reported from the University of Michigan (UoM), Consumer Sentiment, remained unchanged at 63.5, while Inflation expectations for 1-year stood at 4.6%, and for a 5-year horizon at 3%.
Regarding the following week’s Federal Reserve’s monetary policy meeting, traders appeared convinced that the US central bank will increase rates by 25 bps, as shown by the CME FedWatch Tool odds of 88%. However, they remained skeptical about the Fed’s rhetoric of going higher for longer, as the swaps market estimates 50 bps rate cuts for the year’s second half.
Therefore, the US Dollar seesawed between gains and losses, as shown by the US Dollar Index, oscillating around 101.500s, registering minuscule gains of 0.10%. BBH analysts say, “Recent data have been dollar-supportive, but until rate cuts this year are finally priced out, the dollar is likely to remain vulnerable.”
Across the pond, Germany’s GDP for Q4 improved to 0%, from Q3’s -0.4% contraction, but missed estimates of 0.2%. In the meantime, the Eurozone (EU) reported GDP at 0.1% for Q4 and also missed the 0.2% projected by the consensus.
EUR/USD Technical Analysis
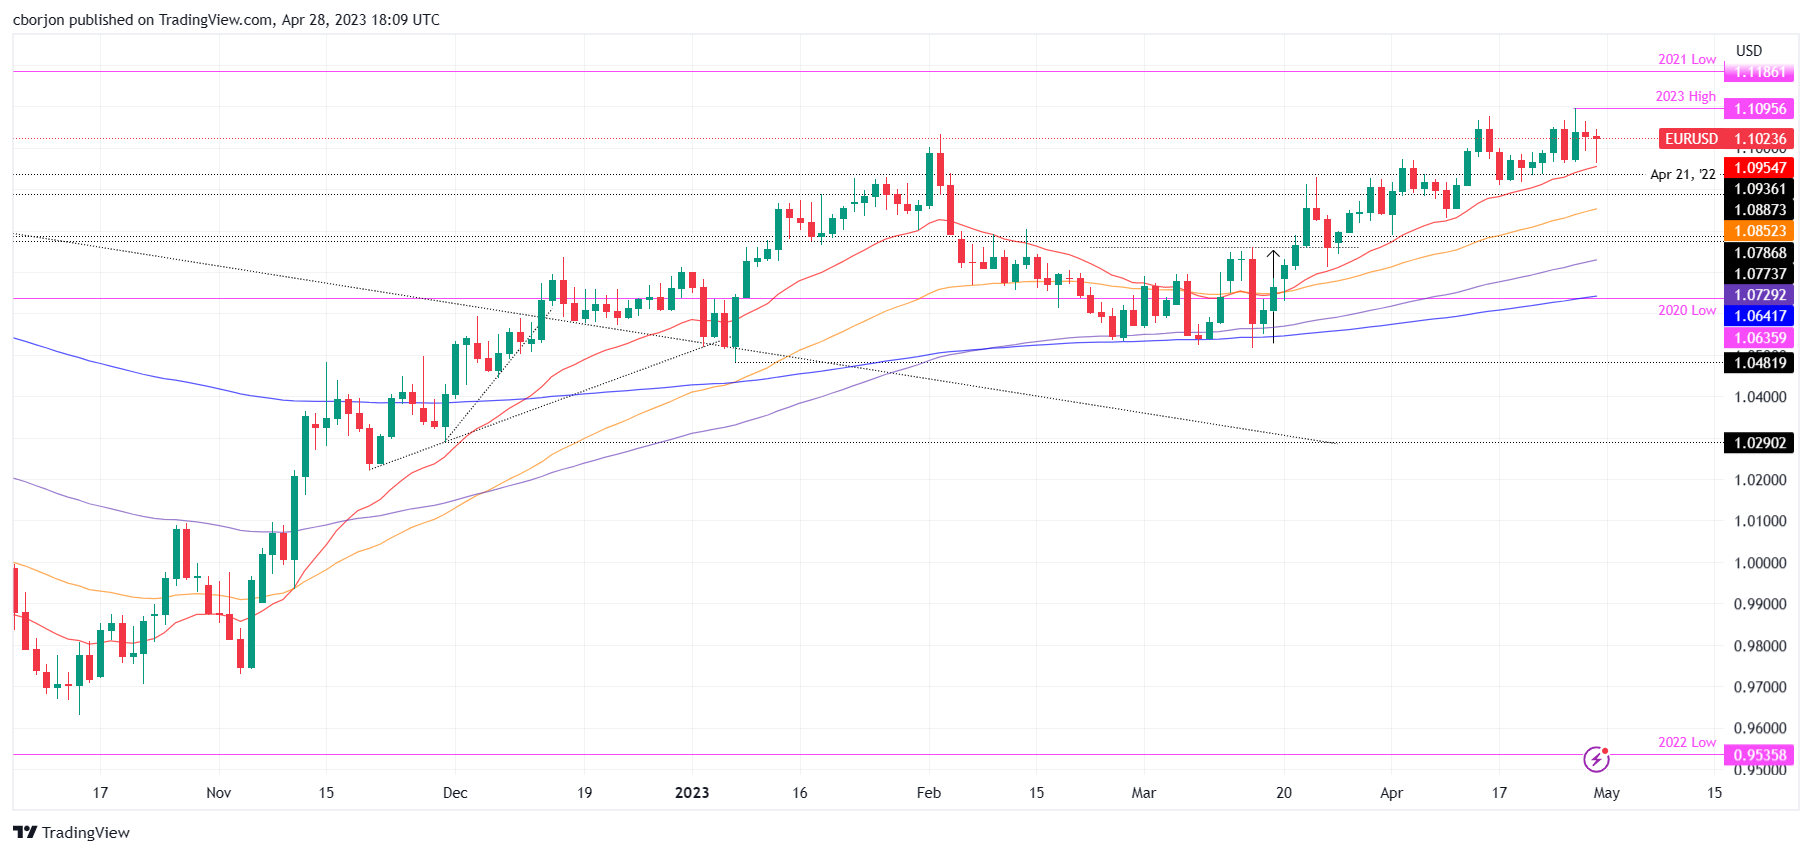
The EUR/USD remained supported by the 20-day EMA, which, acting as dynamic support, remains sought by buyers, as the pair has bounced from that area since mid-March. Additionally, the Relative STrengh Index (RSI) indicator continued to be in bullish territory, though its slope turned flat, as buyers took a respite after a failing attempt to 1.1100. If EUR/USD breaks the YTD high at 1.1095, 1.1100 would be up for grabs. Once conquered, buyers would look to challenge the 2021 cycle low turned resistance at 1.1186, ahead of 1.1200. On the flip side, the EUR/USD could remain sideways and test the 20-day EMA at 1.0955
-
18:42
EUR/USD: Keeping a buy on dip mentality – TDS
Next week, the European Central Bank will have its monetary policy meeting. Analysts at TD Securities see a 25 basis points rate hike but do not rule out a 50 bps. Regarding EUR/USD, they see it breaking above 1.10 in the months ahead.
Key quotes:
“Easing financial system stress, persistent high inflation, strong wage growth, and avoidance of a winter recession are enough for the ECB to comfortably hike rates by 25bps in May with guidance that more tightening is to come. We wouldn't completely rule out a 50bps hike should Tuesday's data surprise significantly.”
“We maintain a buy on dip mentality for EURUSD, expecting a sustained break of 1.10 in the months ahead. The ECB risks skew towards the hawkish end, while other factors in our MRSI overlay framework, like equities, terms of trade, momentum, and inflation remain supportive of EUR outperformance. We continue to see EUR outperforming European peers like NOK, SEK, CHF, and GBP and like scaling back into EURGBP longs towards 0.88.”
-
18:13
United States Baker Hughes US Oil Rig Count remains at 591
-
17:54
Gold Price Forecast: XAU/USD holds steady around $1990s after data shows persistent inflation
- Gold price makes minor gains as stickier inflation prompts the Federal Reserve to tighten.
- CME FedWatch Tool indicates the odds of a Fed rate hike at 83.1%.
- XAU/USD Price Analysis: To test the YTD high above $2009.75; otherwise, it could challenge the 50-day EMA.
Gold price registers minimal gains, as traders brace for the weekend, gains 0.16%% after data from the United States (US) showed that inflation remains at high levels, justifying the need for further tightening by the US Federal Reserve. After hitting a daily low of 1976.31, the XAU/USD is trading at $1992.93, up 0.28%.
Gold price edged high but was capped within the weekly trading range
US equities continued to climb. A report by the US Department of Commerce showed inflation in the United States had decelerated, with the Personal Consumption Expenditure (PCE) rate slowing from 5.1% to 4.2% in YoY readings. The monthly growth rate increased to 0.1%, below the prior month’s 0.3%. Despite this deceleration, the Fed’s preferred gauge for inflation, the core PCE, remained unchanged at 4.6% YoY, suggesting that inflationary pressures remain stickier than estimates. As a result, investors continued to believe that the Fed would raise rates.
That’s shown by the CME FedWatch Tool, with odds for a 25 bps increase at 83.1, lower than the previous day’s 83.9% chances.
Gold prices remained supported by falling US Treasury bond yields. As of writing, the 2-year Treasury bond yield drops 3.5 bps and yields 4.039%, while the 10-year benchmark note rate sits at 3.443% and collapses 8 bps.
In other data, the University of Michigan (UoM) Consumer Sentiment remained unchanged at 63.5, with inflation expectations for 1-year standing at 4.6% and a 5-year horizon at 3%.
XAU/USD Technical Analysis
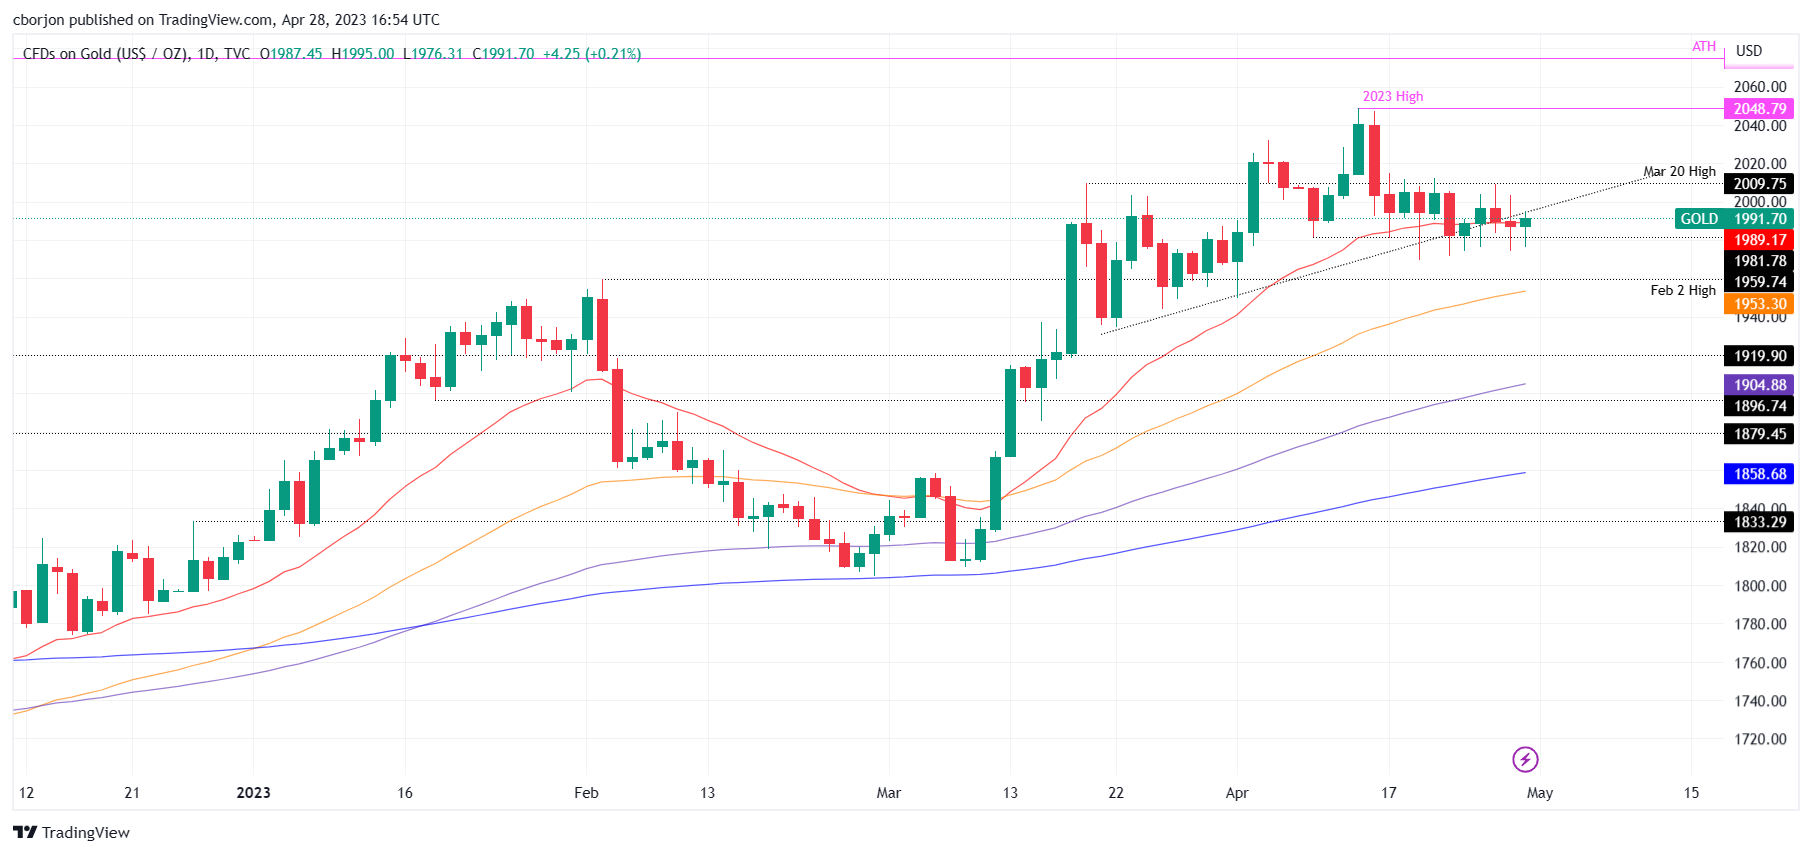
During the week, XAU/USD faltered to break below/above the $1970-$2010 range, hovering on each side of the 20-day Exponential Moving Average (EMA) at $1989.35. Although the latter was broken four times weekly, the EMA turned flat, suggesting that sideways trading will continue in the XAU/USD.
If XAU/USD reclaims $2000, further upside is expected, and a challenge to March’s 20 high at $2009.75 in on the cards. A breach of it will expose the YTD high at $2048.79. Conversely, the XAU/USD first support would be $1970. A decisive break will expose the 50-day EMA at $1953.34.
What to watch?
-
16:33
NZD/USD hits three-day high despite US data and Fed hike expectations
- NZD/USD breaks prior's day high and eyes a test of the 20-day EMA at 0.6188.
- The core PCE, the Fed's preferred gauge for inflation, remains stickier, warranting a Fed hike at the May meeting.
- NZD/USD Price Analysis: Downtrend risks negation as NZD/USD eyes 0.6200 with 200-day EMA hovering near 0.6220s.
The NZD/USD extends its uptrend, hitting a three-day high at around 0.6172, as buyers see a break above technical resistance at the 20-day EMA. Although data from the United States (US) further cemented the case for a Federal Reserve (Fed) hike, the New Zealand Dollar (NZD) advances steadily. At the time of writing, the NZD/USD is trading at 0.6182.
NZD/USD breaks prior's day high and targets 0.6188, while Fed's core PCE supports May rate hike
The US Department of Commerce (DoC) revealed that inflation in the United States decelerated, with the Personal Consumption Expenditure (PCE) slowing from 5.1% to 4.2% in YoY readings, while for a monthly basis, edged to 0.1%, below the prior's month 0.3%. Meanwhile, the Fed's preferred gauge for inflation, the core PCE, stood at 4.6% YoY, unchanged compared to the last month's data.
Given the backdrop, investors stood convinced that the Fed would raise rates, as shown by the CME FedWatch Tool. Odds for a 25 bps increase lie at 88.3%, above yesterday's 83.9% chances. Nevertheless, US T-bond yields edged lower, with 2s down 3.5 bps at 4.039%, while 10s dropped 7.5 bps at 3.448%.
Another piece of the puzzle that added to inflationary pressures standing still is the Employment Cost Index (ECI) revealed by the US Department of Labor. The ECI rose from 1.1% in the previous quarter to 1.2% in Q1, 2023.
In other data, the University of Michigan (UoM) Consumer Sentiment remained unchanged at 63.5. Inflation expectations for 1-year stood at 4.6%, and for a 5-year horizon at 3%.
In the meantime, the US Dollar Index (DXY), which measures the performance of six currencies against the American Dollar (USD), has erased some of its earlier gains and remains above its opening price by 0.10%< at 101.583.
On the New Zealand front, the ANZ Roy Morgan Consumer Confidence Index improved to 79.3 in April from 77.7 in March of 2023, though it remained at low levels as people remained concerned about elevated prices
NZD/USD Technical Analysis
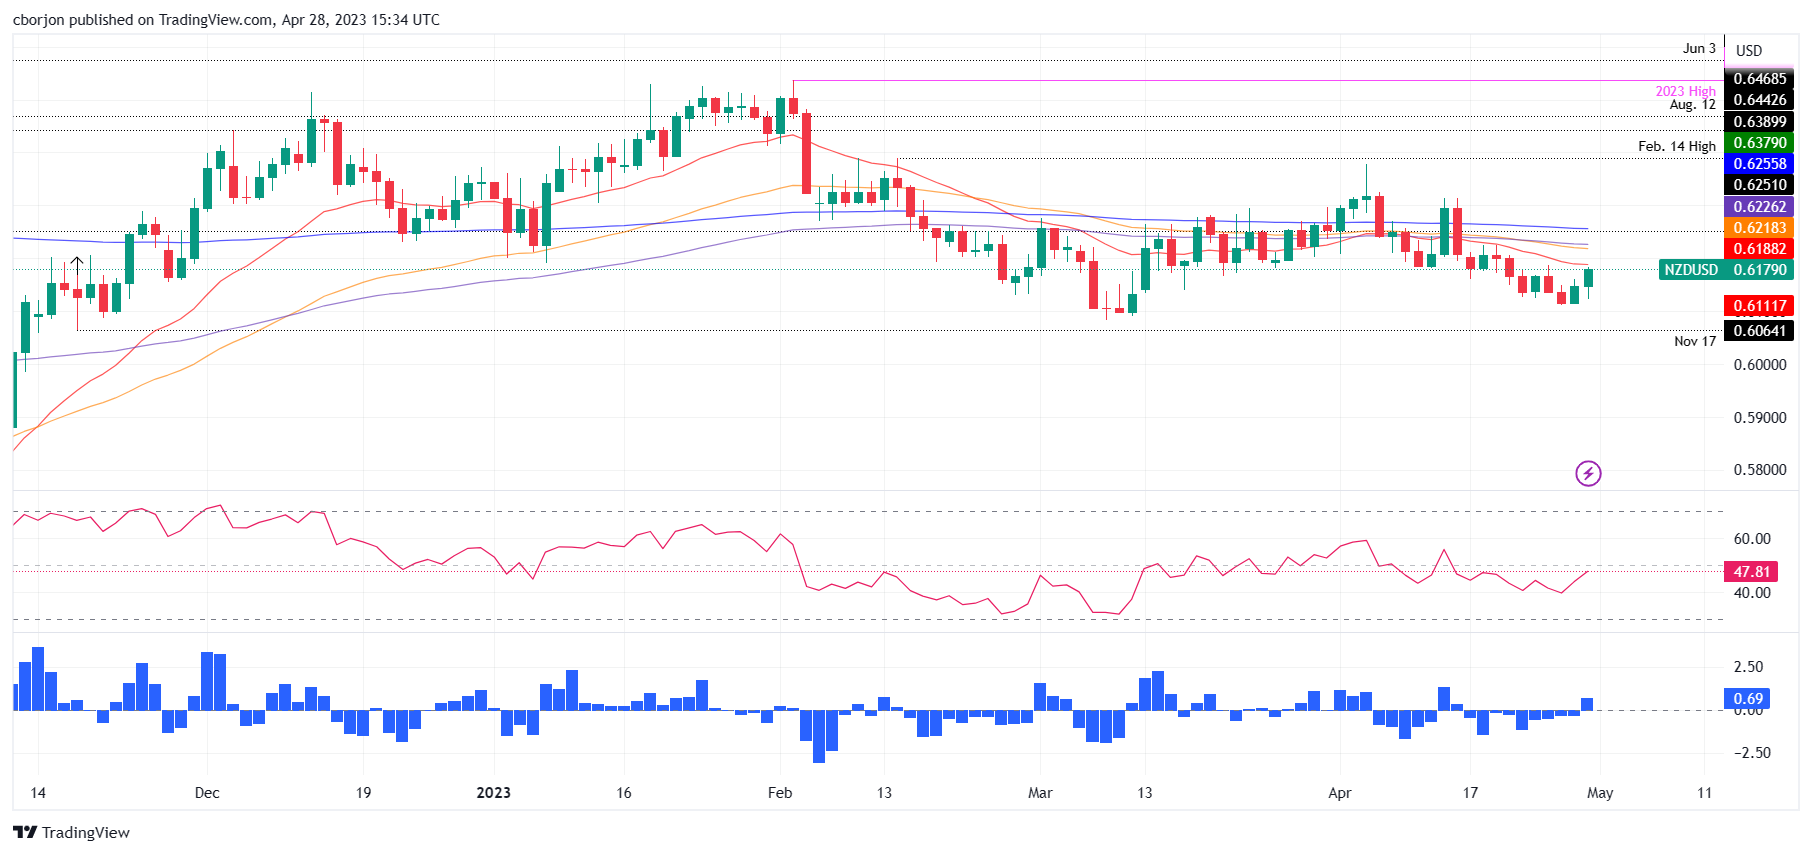
From a technical perspective, the NZD/USD is still in a downtrend though it has recovered some ground. The 20-day Exponential Moving Average (EMA) at 0.6187 would be the first resistance that buyers will test as they aim toward 0.6200. Once broke, the latter will be challenged, as the 100-day EMA at 0.6218 would appear in front of the bulls. The downtrend would be at risk at the 200-day EMA at 0.6226. On the flip side, if NZD/USD drops below the April 27 high of 0.6161, further downside is expected.
-
15:00
United States UoM 5-year Consumer Inflation Expectation rose from previous 2.9% to 3% in April
-
15:00
United States Michigan Consumer Sentiment Index in line with expectations (63.5) in April
-
14:53
GBP/USD hits two-week high, looks to build on momentum beyond 1.2500 mark
- GBP/USD turns positive for the third straight day and climbs to a two-week high on Friday.
- The USD trims a part of its intraday gains and turns out to be a key factor lending support.
- Bets for a 25 Fed rate hike in May, the risk-off impulse underpins the buck and cap gains.
The GBP/USD pair attracts fresh buying following an intraday dip to the 1.2445 region and build on its steady intraday ascent through the early North American session. The uptick, marking the third successive day of a positive move, pushes spot prices to a two-week high, around the 1.2515-1.2520 region in the last hour, though lacks bullish conviction.
The US Dollar (USD) retreats from a two-and-half-week-high touched this Friday in reaction to the softer US macro data, which, in turn, is seen lending some support to the GBP/USD pair. In fact, the US Bureau of Economic Analysis reported that the US Personal Consumption Expenditures (PCE) Price Index declined more-than-expected, to 4.2% on a yearly basis in March from 5.1% previous. The Core PCE Price Index (the Fed's preferred inflation gauge), meanwhile, edged lower to 4.6% from 4.7%.
Apart from this, a steep intraday decline in the US Treasury bond yields contributes to keeping a lid on the USD and acts as a tailwind for the GBP/USD pair amid rising bets for another 25 bps rate hike by the Bank of England (BoE) in May. The markets, however, still seem convinced that the Federal Reserve (Fed) will go ahead with a 25 bps lift-off next week. This, along with the prevalent cautious market mood, continues to underpin the safe-haven buck and might cap the upside for the major.
The aforementioned mixed fundamental backdrop makes it prudent to wait for strong follow-through buying before placing fresh bullish bets around the GBP/USD pair and positioning for any further near-term appreciating move. Nevertheless, spot prices remain on track to register gains for the second successive week as the market focus now shifts to the key central bank event risk - the highly-anticipated FOMC policy meeting starting next Tuesday.
Technical levels to watch
-
14:47
United States Chicago Purchasing Managers' Index came in at 48.6, above expectations (43.5) in April
-
14:44
EUR/USD bounces off lows and retakes 1.1000
- EUR/USD meets support near 1.0960 on Friday.
- Disappointing EMU, GDP results weigh on the single currency.
- US headline PCE eased more than expected in April.
After bottoming out in the proximity of 1.0960, EUR/USD manages to regain some composure and now looks to regain the key 1.1000 barrier and beyond at the end of the week.
EUR/USD offered on poor euro docket
A fresh bout of oxygen seems to lift EUR/USD back to the 1.1000 neighbourhood, as the Greenback gives aways some gains and investors continue to digest disappointing results from the EMU and German docket on Friday.
The US dollar, in the meantime, recedes from earlier tops in response to another sign of further disinflation in the US economy following the publication of PCE prints for the month of March.
In the meantime, yields on both sides of the Atlantic fade Thursday’s rebound and refocus on the downside amidst an incipient recovery in the risk complex.
Later in the session, the final prints from the Michigan Consumer Sentiment will close the weekly calendar.
What to look for around EUR
EUR/USD’s upside momentum loses traction on the back of disheartening prints from the euro calendar on Friday.
Meanwhile, price action around the single currency should continue to closely follow dollar dynamics, as well as the incipient Fed-ECB divergence when it comes to the banks’ intentions regarding the potential next moves in interest rates.
Moving forward, hawkish ECB-speak continue to favour further rate hikes, although this view appears in contrast to some loss of momentum in economic fundamentals in the region.
Key events in the euro area this week: Euro group Meeting, Germany labour market report/ Advanced Inflation Rate/Flash Q1 GDP Growth Rate, EMU Flash Q1 GDP Growth Rate (Friday).
Eminent issues on the back boiler: Continuation (or not) of the ECB hiking cycle. Impact of the Russia-Ukraine war on the growth prospects and inflation outlook in the region. Risks of inflation becoming entrenched.
EUR/USD levels to watch
So far, the pair is losing 0.28% at 1.0997 and faces the next support at 1.0909 (weekly low April 17) seconded by 1.0831 (monthly low April 10) and finally 1.0788 (monthly low April 3). On the flip side, the surpass of 1.1075 (2023 high April 14) would target 1.1100 (round level) en route to 1.1184 (weekly high March 21 2022).
-
14:28
USD/CAD eases from one-month high, still well bid around 1.3640 area amid stronger USD
- USD/CAD catches fresh bids and climbs to a one-month high amid broad-based USD strength.
- The softer US PCE Price Index fails to impress the USD bulls or provide any meaningful impetus.
- An intraday bounce in Oil prices underpins the Loonie and contributes to cap gains for the pair.
The USD/CAD pair regains positive traction following the previous day's downfall and climbs to a fresh one-month top, around the 1.3665-1.3670 area during the early North American session on Friday. Spot prices, however, trim a part of the intraday gains and retreat below mid-1.3600s in reaction to the mixed US macro data.
In fact, the US Bureau of Economic Analysis reported that the Personal Consumption Expenditures (PCE) Price Index declined more-than-expected, to the 4.2% YoY rate in March from 5.1% previous. The Core PCE Price Index (the Fed's preferred inflation gauge), meanwhile, edged lower to 4.6% from 4.7% as compared to consensus estimates for a fall to 4.5%. In the absence of any big surprises, the US Dollar (USD) fades an intraday bullish spike to a two-and-half-week high amid a steep decline in the US Treasury bond yields and turns out to be a key factor acting as a headwind for the USD/CAD pair.
Apart from this, a modest intraday rebound in Crude Oil prices underpins the commodity-linked Loonie and further contributes to capping gains for the USD/CAD pair, at least for the time being. The Canadian Dollar (CAD), however, struggles to gain any meaningful traction in the wake of the softer domestic GDP report, which showed that the economy grew by 0.1% in February as compared to the 0.6% increase reported in the previous month. This, in turn, suggests that the path of least resistance for spot prices is to the upside and any corrective pullback is more likely to get bought into.
Technical levels to watch
-
14:06
Chile Industrial Production (YoY) declined to -5.9% in March from previous -1.1%
-
13:59
Canada: Real GDP expands by 0.1% in February vs. 0.2% expected
- Canadian economy grew at a softer pace than expected in February.
- USD/CAD clings to daily gains near 1.3650 after the data.
The real Gross Domestic Product (GDP) of Canada grew by 0.1% on a monthly basis in February, Statistics Canada reported on Friday. This reading followed January's expansion of 0.6%and came in weaker than the market expectation for a growth of 0.2%.
"Advance information indicates that real GDP edged down 0.1% in March," Statistics Canada further noted in its press relese. "Decreases in retail and wholesale trade sectors, as well as in the mining and quarrying (except oil and gas) subsector were partially offset by increases in the public sector, in professional, scientific and technical services, and in administrative and support, waste management and remediation services."
Market reaction
USD/CAD showed no immediate reaction to this data and was last seen rising 0.35% on the dayat 1.3640.
-
13:50
US: Employment Cost Index rises by 1.2% in Q1 vs. 1.1% expected
- US Employment Cost Index rose more than expected in Q1.
- US Dollar Index clings to strong daily gains above 102.00.
The data published by the US Bureau of Labor Statistics revealed on Friday that the Employment Cost Index, compensation costs for civilian workers, increased by 1.2% in the first quarter.
This reading followed the 1% growth recorded in the previous quarter and came higher than the market expectation of 1%.
Market reaction
The US Dollar Index, which tracks the US Dollar's performance against a basket of six major currencies, preserves its bullish momentum after this data and was last seen rising 0.6% on the day at 102.10.
-
13:49
USD/JPY sticks to BoJ-inspired strong gains, trades above 136.00 post-US PCE Price Index
- USD/JPY rallies over 300 pips intraday and spikes to its highest level since March 10.
- The BoJ’s dovish stance weighs heavily on the JPY and prompts aggressive buying.
- Bets for another 25 bps lift-off in May underpin the USD and contribute to the rise.
- The US Core PCE Price Index fails to provide any meaningful impetus to the major.
The USD/JPY pair builds on its strong intraday rally and climbs to its highest level since March 10, around the 136.40 region during the early North American session. Spot prices, however, retreat a few pips following the release of the US macro data and trade around the 136.00 mark, still up over 1.5% for the day.
The Japanese Yen (JPY) turns out to be the worst-performing G10 currency on Friday in reaction to the Bank of Japan's (BoJ) decision to leave its ultra-loose monetary policy settings unchanged. The Japanese central bank also made no tweaks to its yield curve control (YCC) by a unanimous vote, while the BoJ Governor sounded dovish during the post-meeting press conference. This, along with resurgent US Dollar (USD) demand, provides a goodish lift to the USD/JPY pair and further contributes to the intraday rally of over 300 pips.
In fact, the USD Index (DXY), which tracks the Greenback against a basket of currencies, touches a two-and-half-week high amid firming expectations for another 25 bps lift-off at the next FOMC meeting in May. The USD, however, eases a bit after the US Bureau of Economic Analysis reported that the US Personal Consumption Expenditures (PCE) Price Index declined more than expected, to 4.2% on a yearly basis in March from 5.1% previously. The Core PCE Price Index (the Fed's preferred inflation gauge), meanwhile, edged lower to 4.6% from 4.7%.
This, along with a sharp intraday declining in the US Treasury bond yields, keeps a lid on any further gains for the Greenback. Apart from this, the risk-off impulse - as depicted by a generally weaker tone around the equity markets - lends some support to the safe-haven JPY and acts as a headwind for the USD/JPY pair amid slightly overbought oscillators on hourly charts. Nevertheless, spot prices remain on track to register strong gains for the third successive week, also marking the fifth week of a positive move in the previous six.
Technical levels to watch
-
13:42
Germany: Annual HICP inflation declines to 7.6% in April vs. 7.8% expected
- Inflation in Germany came in lower than expected in April.
- EUR/USD stays under bearish pressure below 1.1000 on Friday.
Inflation in Germany, as measured by the Consumer Price Index (CPI), declined to 7.2% on a yearly basis in April from 7.4% in March. This reading came in below the market expectation of 7.3%. On a monthly basis, the CPI was up 0.4%, down from +0.8 in March.
The annual Harmonised Index of Consumer Prices (HICP), the European Central Bank's (ECB) preferred gauge of inflation, fell to 7.6% from 7.8% in the same period, compared to analysts' estimate of 7.8%.
Market reaction
EUR/USD continues to trade in negative territory below 1.1000 after German inflation data.
-
13:33
Breaking: US annual Core PCE inflation declines to 4.6% in March vs. 4.5% expected
Inflation in the US, as measured by the Personal Consumption Expenditures (PCE) Price Index, declined to 4.2% on a yearly basis in March from 5.1% in February, the US Bureau of Economic Analysis reported on Friday. This reading came in lower than the market expectation of 4.6%.
The annual Core PCE Price Index, the Federal Reserve's preferred gauge of inflation, edged lower to 4.6% from 4.7% in the same period, compared to analysts' forecast of 4.5%. On a monthly basis, Core PCE inflation and PCE inflation rose 0.3% and 0.1%, respectively.
Further details of the report showed that Personal Spending remained unchanged in March while Personal Income increased by 0.3%.
Market reaction
The US Dollar continues to outperform its rivals after this data and the US Dollar Index was last seen rising 0.55% on the day at 102.05.
-
13:32
United States Personal Spending came in at 0%, above expectations (-0.1%) in March
-
13:32
United States Personal Income (MoM) came in at 0.3%, above forecasts (0.2%) in March
-
13:32
United States Personal Consumption Expenditures - Price Index (YoY) below forecasts (4.6%) in March: Actual (4.2%)
-
13:32
United States Personal Consumption Expenditures - Price Index (MoM) came in at 0.1% below forecasts (0.3%) in March
-
13:31
United States Core Personal Consumption Expenditures - Price Index (YoY) above expectations (4.5%) in March: Actual (4.6%)
-
13:31
United States Core Personal Consumption Expenditures - Price Index (MoM) meets forecasts (0.3%) in March
-
13:31
Canada Gross Domestic Product (MoM) came in at 0.1% below forecasts (0.2%) in February
-
13:30
United States Employment Cost Index above forecasts (1.1%) in 1Q: Actual (1.2%)
-
13:00
Germany Harmonized Index of Consumer Prices (YoY) came in at 7.6%, below expectations (7.8%) in April
-
13:00
Brazil Unemployment Rate came in at 8.8% below forecasts (9%) in March
-
13:00
Germany Consumer Price Index (YoY) registered at 7.2%, below expectations (7.3%) in April
-
13:00
Germany Harmonized Index of Consumer Prices (MoM) came in at 0.6%, below expectations (0.8%) in April
-
13:00
Germany Consumer Price Index (MoM) came in at 0.4%, below expectations (0.6%) in April
-
13:00
India Infrastructure Output (YoY) below expectations (4.6%) in March: Actual (3.6%)
-
12:33
India FX Reserves, USD declined to $584.25B in April 21 from previous $586.41B
-
12:33
Brazil Nominal Budget Balance came in at -79.499B, below expectations (-37.164B) in March
-
12:33
Brazil Primary Budget Surplus came in at -14.182B, below expectations (-9.028B) in March
-
12:30
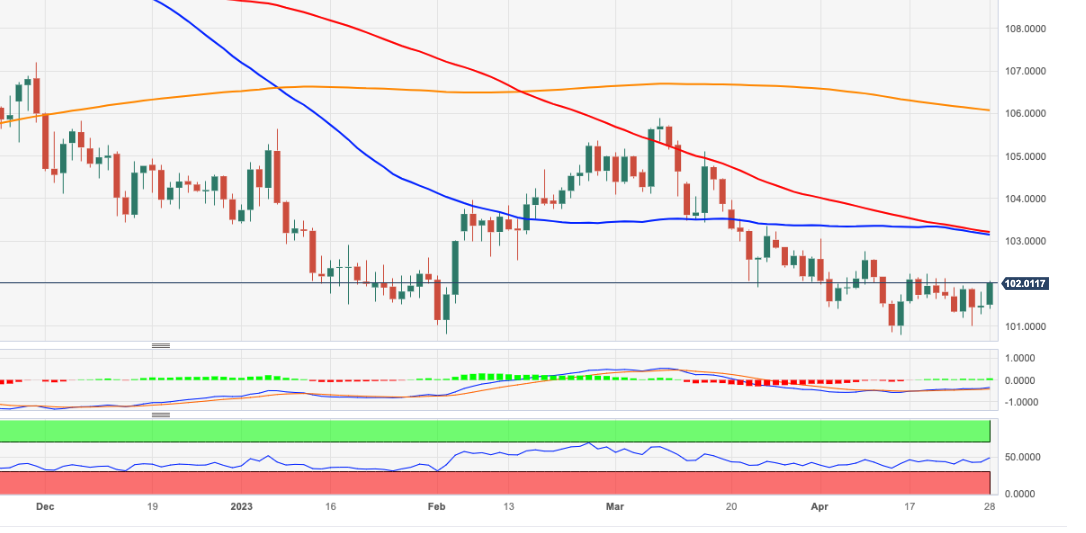
USD Index Price Analysis: Downside alleviated above 103.15/20
- DXY extends the bounce and reclaims the 102.00 mark and above.
- Next on the upside appears the 103.15/20 band.
DXY adds to Thursday’s gains and surpasses the key barrier at 102.00 the figure at the end of the week.
In the meantime, the index remains broadly side-lined and with a downwards bias. That said, further upside should clear the 103.15/20 band, where the interim 55- and 100-day SMAs coincide to see the bearish perspective somewhat mitigated.
Looking at the broader picture, while below the 200-day SMA, today at 106.07, the outlook for the index is expected to remain negative.
DXY daily chart
-
12:18
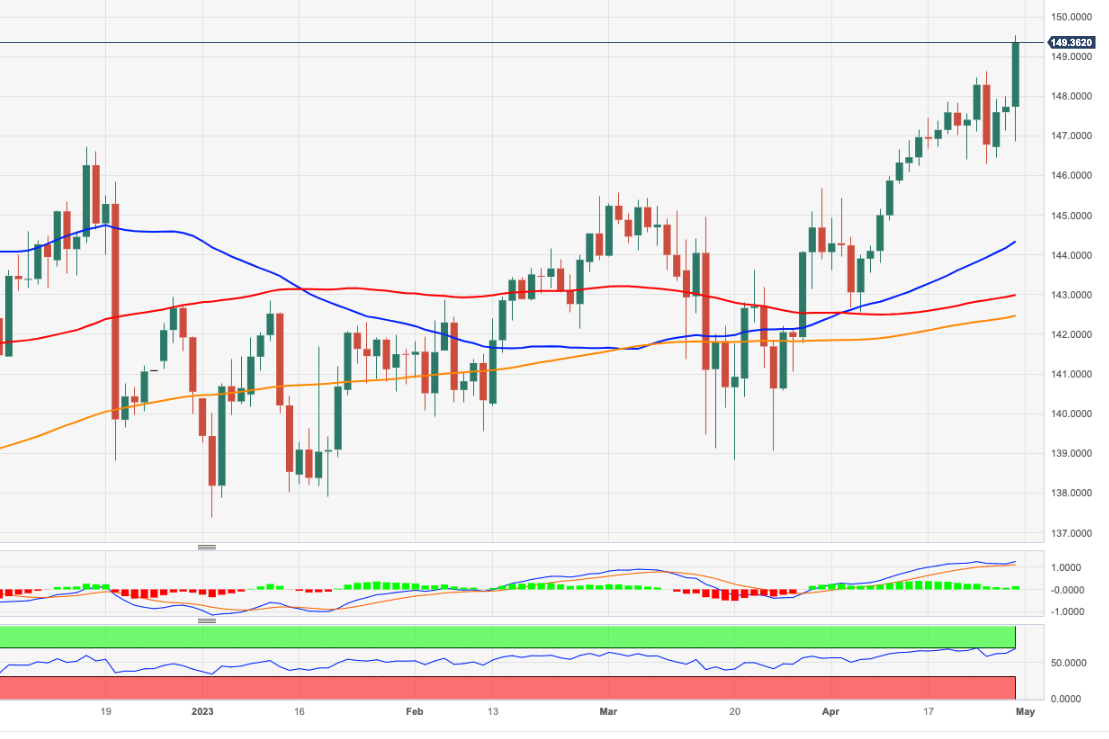
EUR/JPY Price Analysis: I can see 150.00 just there
- EUR/JPY climbs sharply to 2023 past 149.00.
- Further upside could visit the 150.00 region in the near term.
EUR/JPY rallies north of the 149.00 hurdle for the first time since early December 2014.
The underlying strong upside momentum in the cross appears unchallenged for the time being. Against that, the continuation of the upward bias should challenge the key 150.00 barrier in the relatively short term.
So far, further upside looks favoured while the cross trades above the 200-day SMA, today at 142.43.
EUR/JPY daily chart
-
12:12
When is the US March PCE Price Index and how could it affect EUR/USD?
US PCE Price Index Overview
Friday's US economic docket highlights the release of the Personal Consumption Expenditure (PCE) Price Index, scheduled later during the early North American session at 12:30 GMT. The gauge is anticipated to have risen by 0.3% in March, matching the previous month's reading. The yearly rate, meanwhile, is expected to have eased to 4.6% from 5% in February. Moreover, the Core PCE Price Index - the Fed's preferred inflation measure - likely edged lower to a 4.6% YoY rate and rose 0.3% in March.
Analysts at TD Securities (TDS) offer a brief preview of the report and write: “We expect core PCE inflation to have risen at a still firm 0.3% m/m pace in March (in line with consensus and also matching Feb's advance). While below the core CPI's 0.4% m/m gain, the increase will keep the 3m AR pace high at around 4.7%. The y/y rate likely remained unchanged at 4.6%, suggesting the path to normalization in price gains will probably take longer than expected. Conversely, personal spending is expected to be muted (TD: 0.0% m/m, consensus: -0.1%), which would confirm the loss of momentum from consumer outlays toward the end of the quarter. The details of the spending part of the report will be very important, particularly the breakdown between goods and services.”
How Could It Affect EUR/USD?
Ahead of the key macro data, the US Dollar (USD) climbs to a fresh weekly high and drags the EUR/USD pair further below the 1.1000 psychological mark. A surprisingly stronger report will further point to persistent inflationary pressure and reaffirm market bets for another 25 bps lift-off at the next FOMC policy meeting in May. This, in turn, should provide a goodish boost to the Greenback and set the stage for an extension of the pair's retracement slide from a 13-month high touched earlier this week.
Conversely, weaker PCE data will fuel fresh speculations that the US central bank will pause the rate-hiking cycle after May. This might prompt aggressive USD selling and allow the EUR/USD pair to resume its recent well-established uptrend witnessed since mid-March. Nevertheless, the data should infuse volatility in the markets and allow traders to grab short-term opportunities on the last day of the week.
Eren Sengezer, Editor at FXStreet, offers a brief technical outlook and outlines important technical levels to trade the EUR/USD pair: “The 100-period Simple Moving Average and the Fibonacci 23.6% retracement of the latest uptrend form strong support area at 1.0950/1.0970. In case the pair falls below that area and starts using it as resistance, it could extend its downward correction toward 1.0900/1.0880 (psychological level, 200-period SMA).”
“On the upside, sellers could turn hesitant if EUR/USD reclaims 1.1000 (psychological level, static level, 50-period SMA) and stabilizes there. In that case, 1.1050 (static level) and 1.1070 (end-point of the latest uptrend) could be seen as next resistance levels,” Eren adds further.
Key Notes
• US Core PCE Preview: Why this is a lose-lose situation for the US Dollar
• EUR/USD Forecast: Euro trades dangerously close to key support area
• EUR/USD breaks below 1.1000 to print 2-day lows, focus remains on key data
About the US PCE Price Index
The Personal Spending released by the Bureau of Economic Analysis, Department of Commerce is an indicator that measures the total expenditure by individuals. The level of spending can be used as an indicator of consumer optimism. It is also considered as a measure of economic growth: While Personal spending stimulates inflationary pressures, it could lead to raise interest rates. A high reading is positive (or Bullish) for the USD.
-
12:07
USD/CNH: There is a major hurdle at 6.9650 – UOB
Extra gains in USD/CNH should meet a tough barrier at 6.9650 in the short-term horizon, argue Economist Lee Sue Ann and Markets Strategist Quek Ser Leang at UOB Group.
Key Quotes
24-hour view: “Our expectations for USD to rise above 6.9510 did not materialize as it traded sideways in a range of 6.9216/6.9469. The price actions are likely part of a consolidation and today, we expect USD to trade between 6.9150 and 6.9450.”
Next 1-3 weeks: “Our latest narrative from two days ago (26 Apr, spot at 6.9370) still stands. As highlighted, upward momentum in USD has improved further but the major resistance at 6.9650 might not come into view soon. Overall, USD is expected to stay underpinned in the coming days as long as it stays above 6.8950 (no change in ‘strong support’ level).”
-
11:39
Gold Price Forecast: XAU/USD trades with modest losses ahead of US PCE Price Index
- Gold price remains on the defensive for the third straight day amid a stronger US Dollar.
- Reviving safe-haven demand lends some support to the XAU/USD and helps limit losses.
- Traders also seem reluctant and move to the sidelines ahead of the US PCE Price Index.
Gold price edges lower for the third successive day on Friday, albeit lacks follow-through selling and remains confined in a familiar trading range held over the past two weeks or so. The XAU/USD is currently placed just above the $1,980 level and is influenced by a combination of diverging forces.
Resurgent US Dollar demand weighs on Gold price
The US Dollar (USD) regains strong positive traction and touches a fresh weekly high amid firming expectations for another 25 basis points (bps) lift-off at the next Federal Open Market Committee (FOMC) policy meeting in May. In fact, the USD Index, which tracks the Greenback against a basket of currencies, touches a fresh weekly high and exerts some downward pressure on the US Dollar-denominated Gold price. The prospects for further policy tightening by the Federal Reserve (Fed) were reaffirmed by the latest macro data released on Thursday from the United States (US), which indicated persistent price pressures and that the labor market remains healthy.
The US Bureau of Economic Analysis reported that growth in the world's largest economy slowed from 2.6% annualized pace to 1.1% during the first quarter of 2023, missing estimates for a reading of 2.0%. The disappointment, however, was offset by the GDP Price Index, which edged higher to 4% from 3.9%. Moreover, the Personal Consumption Expenditures (PCE) Prices rose from 3.7% to 4.2% during the January-March period, while the Core PCE climbed 4.9%, higher than the 4.7% estimated. Adding to this, data published by the US Department of Labor (DOL) showed that Initial Jobless claims fell to 230K in the week ended April 22 - the lowest in three weeks.
Softer risk tone and sliding US bond yields limit losses for Gold price
That said, a combination of factors lends some support to the Gold price and helps limit the downside, at least for the time being. Worries about economic headwinds stemming from rising borrowing costs temper investors' appetite for riskier assets, which is evident from a generally softer tone around the equity markets. The anti-risk flow triggers a sharp decline in the US Treasury bond yields and turns out to be a key factor acting as a tailwind for the safe-haven Gold price. Traders also seem reluctant to place aggressive directional bets and wait on the sidelines ahead of Friday's release of the US Core PCE Price Index - the Fed's preferred inflation gauge.
Traders keenly await the release of the US Core PCE Price Index
Given that the markets have been pricing in an imminent pause in the Fed's rate-hiking cycle after May, a stronger PCE Price Index report might prompt aggressive short-covering around the USD. Gold price, however, could benefit from its status as a hedge against rising inflation. Conversely, any disappointment will be enough to weigh heavily on the buck and provide a fresh boost to the XAU/USD. This, in turn, suggests that the path of least resistance for the commodity is to the downside and any subsequent slide could get bought into.
Gold price technical outlook
From a technical perspective, any subsequent slide is likely to find some support near last week's swing low, just below the $1,970 level. Some follow-through selling will be seen as a fresh trigger for bearish traders and make the Gold price vulnerable to test the next relevant support near the $1,956-$1,955 area. The XAU/USD could eventually drop to the monthly low around the $1,950 region.
On the flip side, the intraday positive move now seems to confront some resistance near the $2,000 psychological mark ahead of the $2,010 supply zone and the $2,020 horizontal barrier. A sustained strength beyond the latter will be seen as a fresh trigger for bulls and lift the Gold price move towards the $2,040 area. Bulls might eventually aim to challenge the YTD peak, around the $2,047-$2,049 region touched earlier this month.
Key levels to watch
-
11:31
Russia Interest rate decision meets forecasts (7.5%)
-
11:02
Ireland Retail Sales (YoY) increased to 8.6% in March from previous 3.6%
-
11:02
Ireland Retail Sales (MoM): 2% (March) vs 0.7%
-
11:01
Italy Industrial Sales n.s.a. (YoY) below expectations (14.3%) in February: Actual (7.2%)
-
11:01
US Dollar rallies, Argentina to pay for Chinese imports in Yuan
- US Dollar gathers bullish momentum on Friday as markets assess the latest US data.
- USD is up more than 1% against the Japanese Yen following the Bank of Japan’s policy meeting.
- PCE inflation and Employment Cost Index data from United States could drive USD valuation ahead of the weekend.
The US Dollar (USD) has gathered strength in the second half of the week and the US Dollar Index climbed above 102.00 for the first time in a week on Friday. The risk-averse market atmosphere helps the USD find demand as a safe haven while hawkish Federal Reserve (Fed) bets provide an additional boost to the currency.
Ahead of the weekend, the US Bureau of Economic Analysis (BEA) will release the Personal Consumption Expenditures (PCE) Price Index, the Fed’s preferred gauge of inflation, for March. Employment Cost Index data for the first quarter will also be watched closely by market participants.
Daily digest market movers: US Dollar rallies despite disappointing Q1 GDP reading
- The BEA reported on Thursday that the real Gross Domestic Product (GDP) expanded at an annual rate of 1.1% in the first quarter, compared to the market expectation for a 2% growth.
- Despite the weak GDP print, the stronger-than-expected increase in the inflation component of the GDP, which could allow the Fed to delay a policy pivot, helped the USD outperform its rivals.
- Moreover, the 2.26 percentage point negative contribution of the change in private inventories to the GDP seems to be making the growth reading look worse than it actually is, since inventories tend to fluctuate.
- Commenting on the GDP report, "the US economy grew 1.1% in the first quarter of 2023, slower than in the previous quarter (2.6%). However, the main drag came from significantly lower inventory accumulation, while private consumption remained strong. We still expect the economy to contract slightly in the second half of the year due to the Fed's hefty rate hikes," Commerzbank analysts said.
- According to the CME Group FedWatch Tool, the probability of the Fed cutting its policy rate by 25 basis points in September currently holds at around 40%, down from 60% last week.
- Argentina announced that they will start paying for Chinese imports in Yuan rather than USD in an attempt to limit the USD outflows. Argentina will reportedly pay $1 billion of Chinese imports in Yuan in April and will be paying around $790 million worth of imports in Yuan monthly thereafter.
- The Bank of Japan (BoJ) left its policy settings unchanged following the April policy meeting. The BoJ left the 10-year Japanese Government Bond (JGB) yield target unchanged at about 0% while maintaining the policy balance rate at -0.1% without altering YCC band.
- In an unexpected move, the BoJ removed its forward guidance, suggesting that it will be more data-dependent moving forward. In turn, USD/JPY gathered bullish momentum and climbed to its highest level in seven weeks near 136.00.
- Previewing the upcoming PCE inflation report, “the ‘tortoise’ of inflation reports tends to provide little surprises, but it still moves markets, even if it is not the ‘hare.’ There are good reasons to expect the US Dollar to fall and equities to rise in response to the data,” said FXStreet Analyst Yohay Elam.
Technical analysis: US Dollar Index techs point to a bullish tilt
The US Dollar Index (DXY) climbed above the 20-day Simple Moving Average (SMA), which is currently located near 101.80, for the first time in 10 days on Friday. Additionally, the Relative Strength Index (RSI) indicator on the daily chart rose to 50, reflecting the lack of seller interest.
In case the DXY manages to end the week above 101.80, it could stage an extended recovery toward 102.60 (static level) and 103.00 (50-day SMA, 100-day SMA).
If sellers defend 101.80 and don’t allow the index to hold above that level, additional losses toward 101.00/100.80 (psychological level, static level, multi-month low set on April 14) and 100.00 (psychological level) could be witnessed.
How does Fed’s policy impact US Dollar?
The US Federal Reserve (Fed) has two mandates: maximum employment and price stability. The Fed uses interest rates as the primary tool to reach its goals but has to find the right balance. If the Fed is concerned about inflation, it tightens its policy by raising the interest rate to increase the cost of borrowing and encourage saving. In that scenario, the US Dollar (USD) is likely to gain value due to decreasing money supply. On the other hand, the Fed could decide to loosen its policy via rate cuts if it’s concerned about a rising unemployment rate due to a slowdown in economic activity. Lower interest rates are likely to lead to a growth in investment and allow companies to hire more people. In that case, the USD is expected to lose value.
The Fed also uses quantitative tightening (QT) or quantitative easing (QE) to adjust the size of its balance sheet and steer the economy in the desired direction. QE refers to the Fed buying assets, such as government bonds, in the open market to spur growth and QT is exactly the opposite. QE is widely seen as a USD-negative central bank policy action and vice versa.
-
11:01
Portugal Consumer Price Index (MoM) declined to 0.6% in April from previous 1.7%
-
11:01
Italy Industrial Sales s.a. (MoM) came in at 1.3%, above forecasts (0%) in February
-
11:01
Portugal Consumer Price Index (YoY) fell from previous 7.4% to 5.7% in April
-
10:40
AUD/USD drops to its lowest level since March 10, further below 0.6600 ahead of US PCE
- AUD/USD comes under heavy selling pressure on Friday and drops back closer to the YTD low.
- A combination of factors lifts the USD to a fresh weekly high and exerts pressure on the major.
- Investors now look forward to the US Core PCE Price Index for some meaningful opportunities.
The AUD/USD pair attracts fresh selling near the 0.6640-0.6645 area on Friday and extends its intraday descent through the first half of the European session. The downward trajectory drags spot prices to the 0.6580-0.6575 region, or the lowest level since March 10, and is sponsored by resurgent US Dollar (USD) demand.
In fact, the USD Index (DXY), which tracks the Greenback against a basket of currencies, climbs to a fresh weekly top and draws support from firming expectations for another 25 bps lift-off at the next FOMC meeting in May. The bets for additional rate hikes by the US central bank were reaffirmed by the US macro data released on Thursday, which indicated persistent inflationary pressures and that the US job market remains healthy despite an economic slowdown.
Moreover, the Bank of Japan (BoJ)-inspired sell-off in the Japanese Yen (JPY), along with a generally weaker tone surrounding the equity markets, further benefit the safe-haven buck and drive flows away from the risk-sensitive Aussie. Apart from this,
technical selling below the 0.6600 round-figure mark aggravates the bearish pressure and contributes to the AUD/USD pair's steep intraday decline. Spot prices now move back closer to the YTD low touched in March.Investors now look forward to the release of the US Core PCE Price Index - the Fed's preferred inflation gauge - due later during the early North American session. Given that the markets have been pricing in a pause in the Fed's rate-hiking cycle after May, a stronger reading might prompt aggressive short-covering around the USD and pave the way for a further depreciating move for the AUD/USD pair. Nevertheless, spot prices remain on track to register heavy weekly losses.
Technical levels to watch
-
10:08
ECB Preview: The art of compromise – Danske
Analysts at Danske Bank provide a sneak peek at what to expect from next Thursday’s European Central Bank (ECB) monetary policy announcements.
Key quotes
“Next week, the ECB will meet to deliver another rate hike in its hiking cycle that started in July last year.”
“This time, the question is whether it will slow the hiking pace to 25bp or continue to hike once more by 50bp.”
“We believe it will be a 50bp compromise deal with no specific forward guidance (nor guidance on balance sheet normalization in H2 yet), but repeating a data-dependent approach to future policy decisions.”
“Economic developments since the ECB meeting, coinciding with the banking turmoil, have shown resilient economic activity and another record-high core inflation print.”
“Headline inflation has declined on the back of base effects, but the stickiness of core inflation and wages should pave the way for another 50bp rate hike, in our view.”
-
10:01
Eurozone Preliminary GDP expands by 0.1% QoQ in Q1 vs. 0.2% expected
The preliminary release published by Eurostat revealed on Friday that the Eurozone economy expanded by 0.1% on a quarterly basis in the three months to March of 2023, missing the 0.2% expected and against the no growth seen in the previous quarter.
The bloc’s annual GDP rate grew by 1.3% in the first quarter (Q1) vs. a 1.8% print registered in the final quarter of 2022 while falling short of the 1.4% expectations.
Market reaction
EUR/USD was last seen trading at 1.0985, down 0.37% on the day. The Euro is consolidating the decline, triggered by the downbeat German GDP data and broad-based US Dollar rebound.
About Eurozone Preliminary GDP
The Gross Domestic Product released by Eurostat is a measure of the total value of all goods and services produced by the Eurozone. The GDP is considered as a broad measure of the Eurozone's economic activity and health. Usually, a rising trend has a positive effect on the EUR, while a falling trend is seen as negative (or bearish).
-
10:00
European Monetary Union Gross Domestic Product s.a. (QoQ) registered at 0.1%, below expectations (0.2%) in 1Q
-
10:00
European Monetary Union Gross Domestic Product s.a. (YoY) below expectations (1.4%) in 1Q: Actual (1.3%)
-
10:00
Greece Producer Price Index (YoY) down to -10.9% in March from previous 4.7%
-
10:00
Greece Retail Sales (YoY) rose from previous 1.4% to 2.4% in February
-
09:55
EUR/GBP flirts with 100-day SMA, just above 0.8800 mark ahead of German CPI
- EUR/GBP drifts lower for the second successive day, though lacks follow-through selling.
- The softer German GDP report weighs on the Euro and exerts some pressure on the cross.
- Investors now look to the German consumer inflation figures for some meaningful impetus.
The EUR/GBP cross attracts some sellers following an early uptick to the 0.8835-0.8840 region on Friday and turns lower for the second successive day. Spot prices drop to a fresh weekly low during the early part of the European session, with bears flirting with the 100-day Simple Moving Average (SMA) support around the 0.8800 mark.
The shared currency's relative underperformance could be attributed to the disappointing release of the preliminary German GDP report, which turns out to be a key factor weighing on the EUR/GBP cross. In fact, Germany's Destatis reported this Friday that growth in the Eurozone's largest economy stagnated during the first three months of 2023. Moreover, the annualized GDP showed an unexpected contraction of 0.1%, down sharply from the 0.9% rise recorded in the final quarter of 2022. This, along with a goodish pickup in the US Dollar (USD) demand, exerts additional downward pressure on the Euro.
The British Pound, on the other hand, draws support from growing acceptance that the Bank of England (BoE) will hike interest rates by 25 bps in May. This further contributes to the offered tone surrounding the EUR/GBP cross, though the prospects for more rate hikes by the European Central Bank (ECB) should help limit further losses, at least for the time being. It is worth recalling that the ECB chief economist Philip Lane said on Tuesday that the central bank will need to raise interest rates again in May and leaving interest rates at current levels will be inappropriate despite falling inflation.
This, in turn, makes it prudent to wait for some follow-through selling and sustained weakness below the 100-day SMA before positioning for any further depreciating move. Traders might also prefer to move to the sidelines and wait for the release of the flash German consumer inflation figures. Nevertheless, the EUR/GBP cross remains on track to register modest losses for the second successive week as market participants start repositioning for the highly-anticipated ECB monetary policy meeting next Thursday.
Technical levels to watch
-
09:51
USD/JPY faces extra range bound near term – UOB
USD/JPY is still seen trading within the 132.85-134.70 range in the short-term horizon, comment Economist Lee Sue Ann and Markets Strategist Quek Ser Leang at UOB Group.
Key Quotes
24-hour view: “We expected USD to consolidate in a range of 133.00/134.00 yesterday. However, USD dropped briefly to 133.20, rebounded to 134.19 before closing at 133.94. The price actions still appear to be consolidative and today, we expect USD to trade in a range of 133.30//134.30.”
Next 1-3 weeks: “There is not much to add to our update from Wednesday (26 Apr, spot at 133.60). As highlighted, USD appeared to have entered a consolidation phase and for the time being, it is likely to trade in a range of 132.85/134.70.”
-
09:44
US GDP growth slowed in Q1 but details stronger – RBC
Analysts at RBC Economics offer their afterthoughts on the preliminary estimate of the US Gross Domestic Product (GDP) data released for the first quarter on Thursday.
Key quotes
“US GDP growth slowed to 1.1% (annualized) in Q1 2023, following a larger 2.6% increase in Q4 2022. Details reflected strong consumer fundamentals, with offset from weaker inventory investment.
“Consumer spending rose 3.7% in Q1 supported by a surge in vehicle sales (+45.3%). Service spending also maintained momentum, rising by 2.3%.”
“Business fixed investment ticked slightly higher in Q1 (+0.7%), and solid domestic demand led to stronger imports though exports also rose.”
“The strong fundamentals in Q1 GDP should cement a 25 bp hike from the Federal Reserve next week. However, there are signs that growth momentum began to taper off later in Q1.”
“Higher rates should continue to slow household demand for goods and services in the quarters ahead, moderating growth in prices along the way.“
-
09:39
RBA preview: An extended pause – TDS
In the view of analysts at TD Securities (TDS), the Reserve Bank of Australia (RBA) is likely to bring a halt to its tightening cycle when it meets to decide on its monetary policy next Tuesday.
Key quotes
“The RBA hit the pause button last month, and we expect it to leave the cash rate target unchanged again as the Bank would prefer more time to assess the effects of the rapid rate hikes to date.“
“The continued moderation in monthly CPI prints and lower Q1 trimmed mean (RBA's core inflation measure) give room for the Bank to head for an extended pause.”
“Curve has repriced the RBA and dragged the AUD along with it. But, risks around equity sentiment and US-centric events leave AUD vulnerable still, particularly against crosses where monetary policy is still at play (like EURAUD and AUDNZD).”
“RBA OIS strip points to another on-hold decision, with only 2bps priced for the May meeting. Upside risks to inflation may pressure the Bank to hike in the months ahead, and we like Aus bond flatteners vs US steepeners.”
-
09:33
EUR/USD breaks below 1.1000 to print 2-day lows, focus remains on key data
- EUR/USD loses the grip and breaches the key 1.1000 mark.
- Germany GDP figures surprised to the downside in Q1.
- Germany flash CPI, US PCE next of note in the calendar.
Sellers remain in control of the sentiment surrounding the European currency and drag EUR/USD back below the 1.1000 mark at the end of the week.
EUR/USD loses momentum on weak German GDP
EUR/USD accelerates losses and breaks below the psychological 1.1000 support on Friday in response to discouraging figures from the advanced GDP Growth Rate in Germany during the January-March period.
On the latter, the German economy is expected to contract 0.1% YoY in Q1 and remain flat vs. the previous quarter. Adding to these poor results, the jobs report did not help either after the Unemployment Change rose more than estimated by 24K people amidst a steady jobless rate at 5.6%.
Later in the session, advanced inflation figures in Germany and the preliminary GDP Growth Rate in the broader Euroland will also take centre stage.
In the US, inflation figures measured by the PCE will be in the centre of the debate along with Personal Income, Personal Spending, Employment Cost and the final reading of April’s Michigan Consumer Sentiment.
What to look for around EUR
EUR/USD’s upside momentum loses further traction on the back of disheartening prints from the German calendar on Friday.
Meanwhile, price action around the single currency should continue to closely follow dollar dynamics, as well as the incipient Fed-ECB divergence when it comes to the banks’ intentions regarding the potential next moves in interest rates.
Moving forward, hawkish ECB-speak continue to favour further rate hikes, although this view appears in contrast to some loss of momentum in economic fundamentals in the region.
Key events in the euro area this week: Euro group Meeting, Germany labour market report/ Advanced Inflation Rate/Flash Q1 GDP Growth Rate, EMU Flash Q1 GDP Growth Rate (Friday).
Eminent issues on the back boiler: Continuation (or not) of the ECB hiking cycle. Impact of the Russia-Ukraine war on the growth prospects and inflation outlook in the region. Risks of inflation becoming entrenched.
EUR/USD levels to watch
So far, the pair is losing 0.41% at 1.0981 and faces the next support at 1.0909 (weekly low April 17) seconded by 1.0831 (monthly low April 10) and finally 1.0788 (monthly low April 3). On the flip side, the surpass of 1.1075 (2023 high April 14) would target 1.1100 (round level) en route to 1.1184 (weekly high March 21 2022).
-
09:31
Portugal Gross Domestic Product (QoQ) rose from previous 0.3% to 1.6% in 1Q
-
09:31
Portugal Gross Domestic Product (YoY) dipped from previous 3.2% to 2.5% in 1Q
-
09:16
NZD/USD remains depressed below mid-0.6100s amid stronger USD, ahead of US PCE Price Index
- NZD/USD edges lower on Friday and remains well within the striking distance of the monthly low.
- A combination of factors lifts the USD to a fresh weekly high and exerts some pressure on the pair.
- The downside remains cushioned as traders move to the sidelines ahead of the US PCE Price Index.
The NZD/USD pair attracts some intraday sellers near the 0.6160 area on Friday and remains on the defensive through the early part of the European session. The pair remains well within the striking distance of its lowest level since March 10 touched earlier this week and is pressured by resurgent US Dollar (USD) demand.
In fact, the USD Index, which tracks the Greenback against a basket of currencies, touches a fresh weekly high and continues to draw support from firming expectations for another 25 bps lift-off at the next FOMC meeting in May. The bets for additional rate hikes by the US central bank were reaffirmed by the US macro data released on Thursday, which indicated persistent inflationary pressures and that the US job market remains healthy despite an economic slowdown.
The Greenback gets an additional boost from the Bank of Japan (BoJ)-inspired sell-off in the Japanese Yen (JPY). Apart from this, a softer risk tone further benefits the safe-haven buck and acts as a headwind for the risk-sensitive Kiwi. The markets, however, have been pricing in a pause in the Fed's rate-hiking cycle after May. This, in turn, is holding back the USD bulls from placing aggressive bets and lending some support to the NZD/USD pair, at least for the time being.
Traders also seem reluctant and remain on the sidelines ahead of Friday's release of the US Core PCE Price Index - the Fed's preferred inflation gauge. The crucial US macro data will play a key role in influencing the near-term USD price dynamics and provide some meaningful impetus to the NZD/USD on the last day of the week. Apart from this, traders will further take cues from the broader risk sentiment to grab short-term opportunities heading into the weekend.
Technical levels to watch
-
09:15
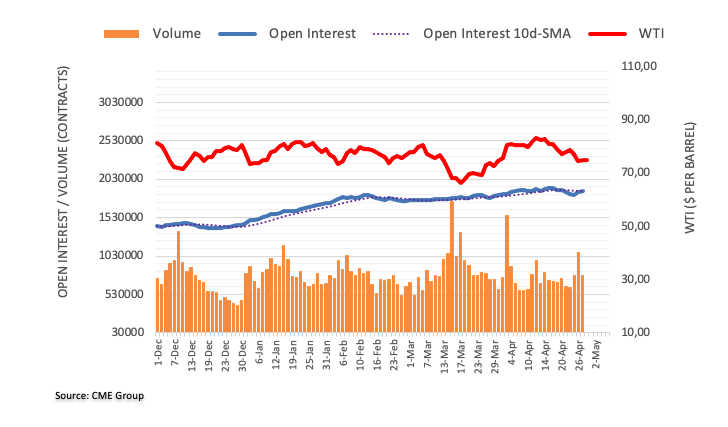
Crude Oil Futures: Room for further upside near term
CME Group’s flash data for crude oil futures markets note traders added nearly 20K contracts to their open interest positions on Thursday, adding to the previous daily build. On the other hand, volume reversed two daily builds in a row and shrank by almost 300K contracts.
WTI: Interim hurdle comes at the 55-day SMA
Thursday’s uptick in prices of the WTI came on the back of increasing open interest, which leaves the door open to extra gains in the very near term. That said, there is a provisional hurdle at the 55-day SMA just above the $76.00 mark per barrel so far.
-
09:10
Turkey Foreign Arrivals fell from previous 21.35% to 12.32% in March
-
09:06
Euro coils in a triangle in the 1.10s ahead of Eurozone GDP data, policy decisions
- Euro vs US Dollar traces out a triangle in the 1.10s amidst uncertainty as to the outlook for interest rates.
- Eurozone GDP and German HICP data could provide an early indication of what the ECB will do at next week’s meeting.
- The trend remains bullish with the 200-day SMA at circa 1.1190 as the next target.
The Euro (EUR) continues trading in the mid 1.10s against the US Dollar (USD) during the early European session, on Friday. The pair coils in a triangle as traders wait for important meetings held by the US Federal Reserve (Fed) and the European Central Bank (ECB) next week, at which rate-setters will decide the future path of interest rates. Given higher interest rates increase demand for currencies, the rate differential between the US and Eurozone is a key determinant of the exchange rate.
Other key factors influencing markets are lingering banking crisis fears and impending data out of the Eurozone, including GDP and HICP inflation for Germany. From a technical standpoint, the overall trend is up and the probabilities favor long holders.
EUR/USD market movers
- The US Dollar benefits from support after the release of US macroeconomic data on Thursday that saw sticky inflation despite a slowdown in growth.
- Fed Funds Futures – a market-based gauge of future interest rates – increased the chances of the Fed hiking its base rate by 0.25% at the May 4 meeting from around 70% to 80%. It also raised the chances of a June hike to above 25%.
- Uncertainty remains as to whether the ECB will hike rates by 0.25% or 0.50% at its May 4 meeting. If the latter, the Euro will probably surge.
- ECB’s chief economist Philip Lane has said the size of the hike will depend on both the state of Eurozone banks, as assessed by the ECB’s Bank Lending Survey out on May 2, as well as April flash HICP inflation data released on the same day. (German HICP is out early on Friday)
- The revelation that troubled US regional lender, First Republic Bank – which benefited from a $30B handout from sector peers during the March crisis – is once again in trouble seems to have set off alarm bells that the bank could fail. US government officials from the FDIC, Treasury and Fed are in talks with industry leaders in an attempt to put together another rescue plan.
- US recession fears won’t go away and may be deep rooted, as reflected by comments from JP Morgan’s CIO, Bob Michele, who sees deposit flight in the US as more systematically linked to lower-income earners burning through savings to meet the rising cost of living, according to an interview with Bloomberg News.
- A key data release for the Euro on Friday is Eurozone first quarter GDP at 9:00 GMT, which is expected to show a 0.2% rise QoQ and 1.4% rise YoY.
- German Harmonized Index of Consumer Prices (HICP) for April out at 12:00 GMT could also be key as it will provide a glimpse of inflation in April for the whole region, released on May 2.
- A meeting of the Eurogroup of Eurozone finance ministers currently underway may also provide commentary that impacts markets.
- The main releases for the US Dollar are University of Michigan (UoM) Consumer Confidence for April, out at 14:00 GMT, also including UoM 5-year Inflation Expectations, and, US Personal Consumption Expenditure Price Index for March at 12:30 GMT, the Federal Reserve’s preferred gauge of inflation.
- Personal Spending and Personal Income for March are both also out at 12:30 GMT.
EUR/USD technical analysis: Triangle almost complete
EUR/USD continues trading sideways in the mid 1.10s as a probable triangle pattern unfolds. Panning out and the broader medium-term uptrend remains intact – and will continue to – as long as the 1.0830 lows hold. Overall the odds favor a continuation of the dominant Euro bullish trend.
-638182655722260147.png)
EUR/USD: 4-hour ChartOn the 4-hour chart, EUR/USD looks like it is near to completing a triangle pattern. Since triangles are usually composed of five waves it is probably almost finished, with the final wave E currently unfolding lower.
Triangles can breakout in either direction but, given the dominant trend is bullish, the odds partially favor an upside breakout. As such, a decisive break above the 1.1095 year-to-date highs would confirm such a bullish breakout, and a continuation of the Euro’s uptrend to the next key resistance level at around 1.1190, where the 200-week Simple Moving Average (SMA) is located. If the triangle fulfills its full price potential (based the height of the triangle at its widest point extrapolated higher) the Euro-US Dollar could even reach 1.1229.
For the sake of clarity, a ‘decisive break’ could be defined as either a ‘breakout candle’ – a long green bullish daily candle that extends above the 1.1075 highs and closes near its high – or three smaller green bullish candles in a row that break above the highs.
Alternatively, a break and daily close below the key 1.0909 lows would signify a bearish breakout from the triangle, with a target at 1.0805, which in itself could suggest a possible reversal of the dominant trend.
Finally, the Relative Strength Indicator (RSI) in the lower pane, is a mirror image of price, tracing out a little triangle of its own, and so giving no clues as to the underlying strength of the market or in which direction the eventual break will be.
Euro FAQs
What is the Euro?
The Euro is the currency for the 20 European Union countries that belong to the Eurozone. It is the second most heavily traded currency in the world behind the US Dollar. In 2022, it accounted for 31% of all foreign exchange transactions, with an average daily turnover of over $2.2 trillion a day.
EUR/USD is the most heavily traded currency pair in the world, accounting for an estimated 30% off all transactions, followed by EUR/JPY (4%), EUR/GBP (3%) and EUR/AUD (2%).What is the ECB and how does it impact the Euro?
The European Central Bank (ECB) in Frankfurt, Germany, is the reserve bank for the Eurozone. The ECB sets interest rates and manages monetary policy.
The ECB’s primary mandate is to maintain price stability, which means either controlling inflation or stimulating growth. Its primary tool is the raising or lowering of interest rates. Relatively high interest rates – or the expectation of higher rates – will usually benefit the Euro and vice versa.
The ECB Governing Council makes monetary policy decisions at meetings held eight times a year. Decisions are made by heads of the Eurozone national banks and six permanent members, including the President of the ECB, Christine Lagarde.How does inflation data impact the value of the Euro?
Eurozone inflation data, measured by the Harmonized Index of Consumer Prices (HICP), is an important econometric for the Euro. If inflation rises more than expected, especially if above the ECB’s 2% target, it obliges the ECB to raise interest rates to bring it back under control.
Relatively high interest rates compared to its counterparts will usually benefit the Euro, as it makes the region more attractive as a place for global investors to park their money.How does economic data influence the value of the Euro?
Data releases gauge the health of the economy and can impact on the Euro. Indicators such as GDP, Manufacturing and Services PMIs, employment, and consumer sentiment surveys can all influence the direction of the single currency.
A strong economy is good for the Euro. Not only does it attract more foreign investment but it may encourage the ECB to put up interest rates, which will directly strengthen the Euro. Otherwise, if economic data is weak, the Euro is likely to fall.
Economic data for the four largest economies in the euro area (Germany, France, Italy and Spain) are especially significant, as they account for 75% of the Eurozone’s economy.How does the Trade Balance impact the Euro?
Another significant data release for the Euro is the Trade Balance. This indicator measures the difference between what a country earns from its exports and what it spends on imports over a given period.
If a country produces highly sought after exports then its currency will gain in value purely from the extra demand created from foreign buyers seeking to purchase these goods. Therefore, a positive net Trade Balance strengthens a currency and vice versa for a negative balance. -
09:02
German Gross Domestic Product arrives at 0% QoQ in Q1 vs. 0.2% expected
- German economy skirted a technical recession in the first quarter of 2023.
- EUR/USD keeps losses near 1.1000 on the downbeat German GDP data.
The German economy showed no growth on a quarterly basis in the first quarter of 2023, according to the preliminary data published by Germany's Destatis on Friday. The market consensus was for a 0.2% clip. The euro area’s economic powerhouse contracted by 0.4% in the fourth quarter of last year.
Germany’s annualized Gross Domestic Product shrank 0.1%, down sharply from 0.9% recorded in the final quarter of 2022, and missed the market expectation of 0.3%.
Meanwhile, German unemployment rose more than expected by 24,000 in April. The seasonally adjusted Unemployment Rate remained stable at 5.6%.
Market reaction
The Euro is under renewed selling on the downbeat German data, with EUR/USD losing 0.34% on the day to test daily lows near 1.0985, at the time of writing.
-
09:01
Norway Registered Unemployment n.s.a unchanged at 1.8% in April
-
09:01
Norway Registered Unemployment s.a rose from previous 59.82K to 61.64K in April
-
09:01
Spain Current Account Balance came in at €2.29B, above forecasts (€0.183B) in February
-
09:00
Italy Gross Domestic Product (QoQ) above forecasts (0.2%) in 1Q: Actual (0.5%)
-
09:00
Italy Gross Domestic Product (YoY) came in at 1.8%, above expectations (1.4%) in 1Q
-
09:00
Germany Gross Domestic Product (YoY) registered at -0.1%, below expectations (0.3%) in 1Q
-
09:00
Germany Gross Domestic Product w.d.a (YoY) below forecasts (0.8%) in 1Q: Actual (0.2%)
-
09:00
Germany Gross Domestic Product (QoQ) below expectations (0.2%) in 1Q: Actual (0%)
-
08:55
Germany Unemployment Change registered at 24K above expectations (10K) in March
-
08:55
Germany Unemployment Rate s.a. meets expectations (5.6%) in March
-
08:47
AUD/USD: Downward momentum picks up pace – UOB
AUD/USD risks further weakness in the near term and faces strong support at 0.6565, suggest Economist Lee Sue Ann and Markets Strategist Quek Ser Leang at UOB Group,
Key Quotes
24-hour view: “Yesterday, we held the view that AUD ‘could weaken further but it is unlikely to challenge the major support at 0.6565’. Our expectations did not materialize as it traded sideways between 0.6596 and 0.6635. Momentum indicators are flattish and further sideways trading appears likely. Expected range for today, 0.6605/0.6650.”
Next 1-3 weeks: “Our narrative from two days ago (26 Apr, spot at 0.6635) is still valid. As highlighted, downward momentum is beginning to build and AUD is likely to edge lower in the coming days. However, any decline is likely to face solid support at the year-to-date low near 0.6565. All in all, AUD is likely to stay under pressure as long as 0.6670 (no change in ‘strong resistance’ from yesterday) is not breached. Looking ahead, if AUD breaks clearly below 0.6565, the focus will shift to the round-number support level of 0.6500.”
-
08:41
USD/JPY builds on BoJ-inspired rally, jumps to its highest level since March 10
- USD/JPY catches aggressive bids after the BoJ left its monetary policy settings unchanged.
- BoJ Governor Ueda’s dovish remarks aggravate the bearish pressure surrounding the JPY.
- Bets for another 25 bps Fed lift-off in May boost the USD and also contribute to the rally.
The USD/JPY pair rallies over 250 pips from the daily low and jumps to its highest level since March 10, around the 135.85 area during the early part of the European session on Friday.
The Japanese Yen (JPY) slumps across the board after the Bank of Japan (BoJ) announced its policy decision, which, along with resurgent US Dollar (USD) demand, prompts aggressive short-covering around the USD/JPY pair. As was widely expected, the Japanese central bank left its ultra-loose policy settings unchanged and also made no tweaks to its yield curve control (YCC) by a unanimous vote.
The JPY selling picks up pace in reaction to the BoJ Governor Kazuo Ueda's dovish remarks, noting that it will be appropriate to continue monetary easing to achieve the 2% inflation target. Speaking at the post-meeting press conference, Udea added that the risk from tightening too hastily is larger than monetary policy falling behind the curve and that Japan's inflation is likely to slow below 2% in the latter half of the year.
The USD, on the other hand, climbs to a fresh weekly high and continues to draw support from firming expectations for a 25 bps lift-off at the next FOMC policy meeting in May. The bets were reaffirmed by Thursday's US macroeconomic releases, which indicated persistent price pressures and that the US job market remains healthy despite an economic slowdown. This is seen as another factor pushing the USD/JPY pair.
Apart from this, the strong intraday rally could further be attributed to some technical buying above the 135.00 psychological mark, which coincided with the 61.8% Fibonacci retracement level of the March downfall. This might have already set the stage for a further appreciating move, though bulls might wait for the release of the US Core PCE Price Index - the Fed's preferred inflation gauge - later this Friday.
Technical levels to watch
-
08:09
Silver Price Analysis: XAG/USD oscillates in a range below 100-hour SMA, $25.00 mark
- Silver struggles to capitalize on the overnight goodish rebound from the $24.50 support zone.
- The technical setup seems tilted in favour of bulls and supports prospects for additional gains.
- A convincing break below the $24.40-30 resistance-turned-support will negate the positive bias.
Silver edges higher on Friday, albeit struggles to capitalize on the move beyond 100-hour Simple Moving Average (SMA) and remains capped near the $25.00 psychological mark through the early European session.
From a technical perspective, the XAG/USD has been showing some resilience below the 23.6% Fibonacci retracement level of the March-April rally and finding support ahead of the $24.40-$24.30 strong horizontal resistance breakpoint. The subsequent bounce, along with positive oscillators on the daily chart, favour bullish traders and support prospects for additional gains. That said, it will still be prudent to wait for some follow-through buying beyond the $25.00 mark before placing fresh bullish bets.
The XAG/USD might then accelerate the momentum towards the $25.50-$25.60 supply zone. A sustained strength beyond will negate any near-term negative bias and allow the white metal to make a fresh attempt to conquer the $26.00 round-figure mark and retest a one-year high touched earlier this month. Some follow-through buying should pave the way for an extension of the positive momentum towards the next relevant hurdle near the $26.25-$26.30 region en route to the $27.00 round-figure mark.
On the flip side, the $24.50-$24.40 region might continue to act as immediate strong support, which if broken decisively might prompt some technical selling. The XAG/USD might then weaken further below the $24.00 mark and test the 38.2% Fibo. level, around the $23.70 area. The corrective decline could get extended further towards the $23.35-$23.30 horizontal support before the metal eventually drops to the $23.00 round-figure mark, representing the 50% Fibo. level.
Silver 1-hour chart
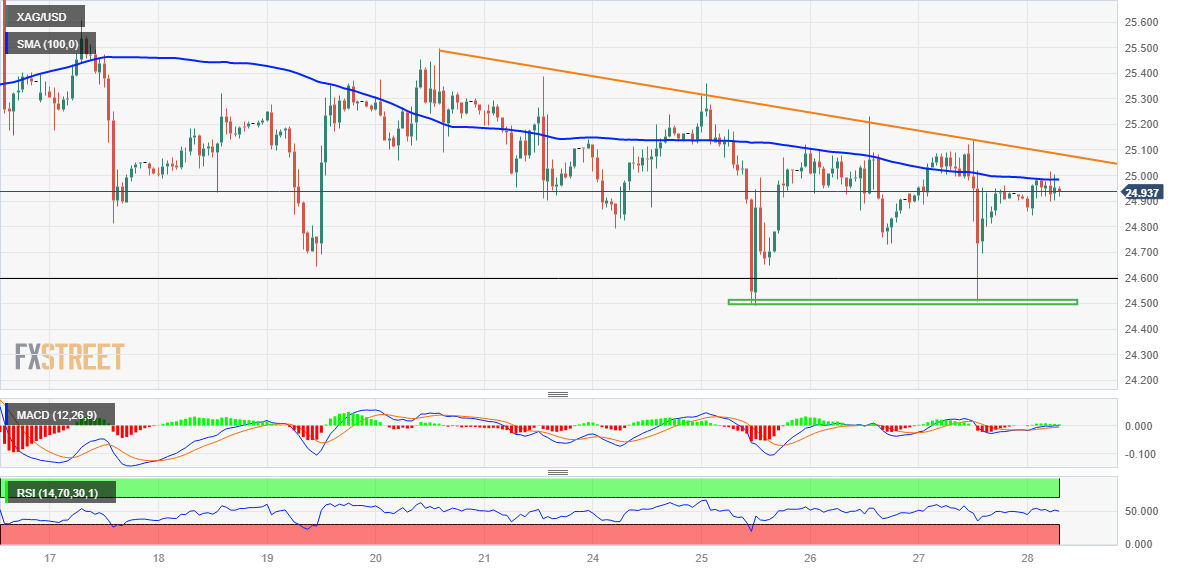
Key levels to watch
-
08:03
Turkey Trade Balance increased to -8.34B in March from previous -12.08B
-
08:02
Austria Producer Price Index (YoY) dipped from previous 11.8% to 7.7% in March
-
08:02
Austria Producer Price Index (MoM): -0.9% (March)
-
08:01
Spain Consumer Price Index (MoM) came in at 0.6%, below expectations (0.9%) in April
-
08:01
Spain Harmonized Index of Consumer Prices (MoM) below expectations (0.6%) in April: Actual (0.5%)
-
08:00
Austria Gross Domestic Product (QoQ) declined to -0.3% in 1Q from previous 0%
-
08:00
BoJ’s Ueda: Today's policy decision took into account financial turmoil since March
More comments are flowing in from new Bank of Japan Governor Kazuo Ueda on Friday, as he addresses his first press conference that follows the monetary policy meeting.
Key quotes
Our conducting a review does not signify stance that monetary easing in past was ineffective.
It would take more time for trend inflation to heighten further.
Will be careful not to misread balance between effects and side-effects of monetary policy.
Today's policy decision took into account financial turmoil since March.
Market conditions are stabilising now.
Concern lingers over mid-sized financial institutions.
Next year's labour talks will be very important factor for inflation.
But doesn't mean we need to wait for wage talk results to make any decision.
Monetary easing in past 25 years were effective to some extent, but not successful enough in terms of achieving 2% inflation target.
Must acknowledge side-effects of current monetary policy are present in some areas.
YCC is a policy that prompts effects and side-effects when infaltion expectations are rising, as seen since last year.
Market reaction
The rally in the USD/JPY pair remains relentless on Ueda’s remarks. The pair is adding 1.30% on the day at 135.72, as of writing.
-
08:00
Switzerland KOF Leading Indicator below expectations (98.1) in April: Actual (96.4)
-
08:00
Spain Harmonized Index of Consumer Prices (YoY) registered at 3.8%, below expectations (4.1%) in April
-
08:00
Spain Consumer Price Index (YoY) came in at 4.1% below forecasts (4.4%) in April
-
08:00
Spain Gross Domestic Product - Estimated (YoY) registered at 3.8% above expectations (3%) in 1Q
-
08:00
Spain Gross Domestic Product - Estimated (QoQ) above expectations (0.3%) in 1Q: Actual (0.5%)
-
07:58
USD/CAD run-up crosses 1.3600 as Oil trims recent gains, Canada GDP, Fed’s preferred inflation eyed
- USD/CAD reverses the previous day’s losses, the first in seven, ahead of the key data releases.
- Oil prices retreat from intraday high amid firmer US Dollar, recession woes.
- First Republic Bank, China news recently weigh on sentiment, upbeat US data propel hawkish Fed bets.
- US Core PCE Price Index, Canada’s Monthly GDP eyed for clear directions.
USD/CAD grinds near intraday high after pausing a six-day winning streak the previous day, mildly bid near 1.3620 amid early Friday morning in Europe. In doing so, the Loonie pair takes clues from the broad US Dollar strength ahead of the key data from Canada and the US.
Also likely to favor the Loonie pair buyers is the recent retreat in the WTI crude oil prices, Canada’s main export item. That said, the WTI eases from an intraday high of $75.43 to $75.05 by the press time, mildly bid for the second consecutive day after refreshing the monthly low on Wednesday.
That said, the US Dollar Index (DXY) extends the previous day’s recovery moves while refreshing intraday tops near 101.80, up 0.30% on a day at the latest, as sour sentiment joins hawkish Fed bets.
Among the latest challenges to sentiment are the headlines surrounding the First Republic Bank (FRB) and China. Reuters relies on anonymous sources to convey that officials from the Federal Deposit Insurance Corporation (FDIC), the Treasury Department and the Federal Reserve (Fed) are coordinating urgent talks to rescue First Republic Bank.
On the other hand, China’s Envoy to Japan said, “The issue surrounding Taiwan is a red line that should not be crossed.”
It should be observed that the Bank of Japan’s (BoJ) sustained support to the ultra-easy monetary policy, despite the change of Governor, weighed on the yields and allowed the US Dollar to remain firmer. Additionally, upbeat prints of the Gross Domestic Product (GDP) Price Index and Personal Consumption Expenditure (PCE) Prices for the first quarter (Q1) renewed calls for a delay in the Fed’s policy pivot the previous day.
Moving forward, USD/CAD traders are likely to cheer the latest run-up in the prices backed by a risk-off mood and broad US Dollar strength ahead of the key data. That said, the monthly Canada GDP for February, expected to ease to 0.2% from 0.5%, may add strength to the Loonie pair’s upside momentum. However, any negative surprise from the US Core PCE Price Index for March, expected to ease to 4.5% YoY versus 4.6% prior, won’t hesitate to recall the sellers.
Also read: US Core PCE Preview: Why this is a lose-lose situation for the US Dollar
Technical analysis
A clear rebound from the 50-DMA support, around 1.3585 by the press time, joins bullish MACD signals to keep USD/CAD buyers hopeful. However, the monthly high of near 1.3650, followed by a downward-sloping resistance line from early March, near 1.3660 at the latest, can prod the Loonie pair bulls afterward.
-
07:56
Forex Today: US Dollar extends rebound ahead of PCE inflation data
Here is what you need to know on Friday, April 28:
The US Dollar (USD) continues to gather strength on the last trading day of April after having managed to record small gains against its major rivals on Thursday. First quarter Gross Domestic Product (GDP) data from the Eurozone and Germany will be watched closely by market participants ahead of April inflation figures from Germany. Later in the session, the Personal Consumption Expenditures (PCE) Price Index, the Fed's preferred gauge of inflation, will be featured in the US economic docket alongside the Employment Cost Index for the first quarter.
US Core PCE Preview: Why this is a lose-lose situation for the US Dollar.
The US Bureau of Economic Analysis (BEA) reported on Thursday that the US economy expanded at an annualized rate of 1.1% in the first quarter of 2023. This reading followed the 2.6% growth recorded in the last quarter of 2022 and came in worse than the market expectation for an expansion of 2%. Nevertheless, the USD held resilient against its rivals as the underlying details of the report showed healthy consumer activity and strong inflation components. With Wall Street's main indexes rallying after the opening bell, however, the US Dollar Index (DXY) erased a portion of its gains. Early Friday, the DXY has regained its traction and started to push higher toward 102.00.
During the Asian trading hours, the data from Japan showed that the Unemployment Rate climbed to 2.8% in March from 2.6% in February, compared to the market expectation of 2.5%. Additionally, Tokyo Consumer Price Index rose to 3.5% in April from 3.3%, surpassing analysts' estimate of 2.6% by a wide margin. Finally, the Bank of Japan (BoJ) announced that it left its policy settings unchanged as widely anticipated. The BoJ maintained the band around its 10-year JGB yield target at up and down 0.5% each while reiterating that it will take additional easing steps without hesitation as needed while striving for market stability. The BoJ's dovish tone provided a boost to USD/JPY and the pair was last seen rising more than 1% on the day near 135.50.
After having declined slightly below 1.1000 in the early American session on Thursday, EUR/USD staged a rebound and closed the day virtually unchanged. The pair continues to trade in a tight range below 1.1050 early Friday.
GBP/USD registered small gains on Thursday and continued to push higher toward 1.2500 in the Asian session before losing its traction. The pair was last seen trading flat on the day at around 1.2480.
For the third straight trading day on Thursday, Gold failed to reclaim $2,000. With the benchmark 10-year US Treasury bond yield stabilizing above 3.5% following the two-day rebound, XAU/USD stays on the back foot and trades below $1,990 early Friday.
Bitcoin benefited from the risk-positive atmosphere on Thursday and gained nearly 3%. BTC/USD trades in a tight range near $29,500 in the European morning. Ethereum rose 2% on Thursday and climbed above $1,900 before going into a consolidation phase slightly above that level early Friday.
-
07:49
France Producer Prices (MoM) above forecasts (1.2%) in March: Actual (2%)
-
07:45
France Consumer Price Index (EU norm) (MoM) above forecasts (0.4%) in April: Actual (0.7%)
-
07:45
France Producer Prices (MoM) came in at 0.2%, below expectations (1.2%) in March
-
07:45
France Consumer Price Index (EU norm) (YoY) came in at 6.9%, above expectations (6.6%) in April
-
07:43
BoJ’s Ueda: Appropriate to continue monetary easing to achieve 2% inflation target with wage growth
Bank of Japan (BOJ) Governor Kazuo Ueda is speaking at his first post-policy meeting conference on Friday, noting that it is “appropriate to continue monetary easing to achieve 2% inflation target in tandem with wage growth.”
Additional quotes
Won't hesitate to ease monetary policy further if necessary,
Reorganized forward guidance given changes in govt's COVID-19 classification, lower the risk of pandemic's impact on economy, markets,
Decided to conduct a broad-perspective review of monetary policy to deepen understanding of past policy conducts, gain informative insights for future policy.
'Review' is not aimed at conducting specific policy measures or changes in future.
We can hope for stable, sustainable inflation to take hold.
No idea what kind of policy our review will lead to.
Review of monetary policy will also include input from external members.
Policy review period of 1 to 1-1/2 years does not mean there will be no policy change during that time.
Will make changes to monetary policy as needed during the review period.
May announce results of policy review in the interim if needed.
Does not warrant no policy change during 1 to 1.5-year 'review' as policy shifts should be carried out if necessary.
A policy shift could happen in next 1.5 years since chance of underlying inflation rate reaching 2% is 'not zero'.
Monetary easing in past 25 years were effective to some extent, but not successful enough in terms of achieving 2% inflation target.
Market reaction
In reaction to the above comments, USD/JPY is extending the rally toward 136.00, currently trading 1.18% higher on the day at 135.50.
-
07:40
FX option expiries for Apr 28 NY cut
FX option expiries for Apr 28 NY cut at 10:00 Eastern Time, via DTCC, can be found below.
- EUR/USD: EUR amounts
- 1.1000 3.1b
- 1.1025-30 594m
- 1.1040-50 1.3b
- GBP/USD: GBP amounts
- 1.2400 407m
- USD/JPY: USD amounts
- 134.00 536m
- 135.00 422m
- USD/CHF: USD amounts
- 0.8820 400m
- AUD/USD: AUD amounts
- 0.6550 924m
- 0.6600 1.2b
- 0.6630-35 677m
- 0.6650 405m
- USD/CAD: USD amounts
- 1.3600 809m
- 1.3625 387m
-
07:30
Switzerland Real Retail Sales (YoY) came in at -1.9%, below expectations (1.7%) in March
-
07:27
USD/MXN Price Analysis: Mexican Peso grinds near 18.00 within symmetrical triangle
- USD/MXN picks up bids to refresh intraday high, consolidates the biggest daily loss in a month.
- Bearish MACD signals challenge Mexican Peso sellers, 200-EMA acts as additional upside hurdle for the pair.
- Multiple levels towards the south challenge USD/MXN bears inside three-week-old triangle.
USD/MXN renews its intraday high near 18.09 as it pares the biggest daily loss in one month during early Friday. In doing so, the Mexican Peso (MXN) pair remains inside a three-week-old symmetrical triangle, reversing the pullback from the top of late.
It’s worth noting that the pair’s repeated failures to cross the 200-bar Exponential Moving Average (EMA) join bearish MACD signals to keep the USD/MXN bears hopeful despite the pair’s latest rebound.
That said, the 38.2% and 50% Fibonacci retracement levels of the USD/MXN’s April 05-16 fall, respectively near 18.11 and 18.16, act as nearby resistance for the buyers to watch before challenging the stated triangle’s top line, close to 18.18.
Following that, the 200-EMA level of 18.20 can act as the last defense of the bears before signaling a run-up toward the monthly high of near 18.40.
Alternatively, a 23.6% Fibonacci retracement puts the short-term price limit under the pair near 18.04, a break of which will highlight the aforementioned triangle’s lower line, currently around the 18.00 round figure.
In a case where the USD/MXN bears keep the reins, the monthly low near 17.93 and the previous monthly bottom surrounding 17.89 can prod the downside moves before signaling a fall towards the year 2017 trough of around 17.44.
USD/MXN: Four-hour chart
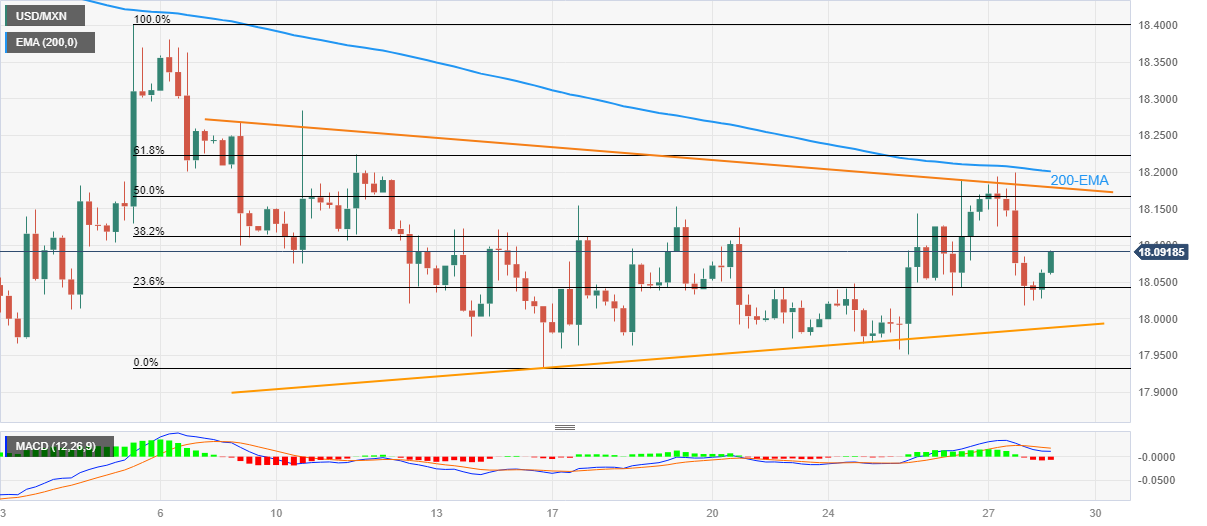
Trend: Limited recovery expected
-
07:18
Gold Futures: No changes to the range bound stance
Open interest in gold futures markets kept the choppiness well in place and shrank by nearly 4K contracts on Thursday according to preliminary readings from CME Group. Volume followed suit and dropped by around 18.3K contracts after two consecutive daily builds.
Gold faces further consolidation near term
Prices of the ounce troy of gold retreated marginally amidst a broader inconclusive session on Thursday. The price action was amidst shrinking open interest and volume and keeps pointing to the continuation of the side-lined trade for the time being.
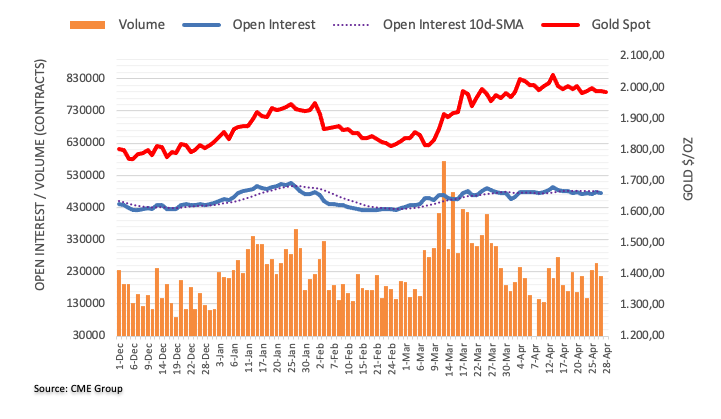
-
07:14
USD/JPY Price Analysis: Rally inspired by continuation of BoJ’s ultra-dovish policy approaches 135.00
- USD/JPY has jumped swiftly to near 135.00 as BoJ has announced a continuation of ultra-dovish monetary policy.
- The USD Index has jumped above 101.76 amid a delay in US debt-ceiling proposal and pre-Fed policy anxiety.
- USD/JPY is on the verge of delivering a breakout of the Ascending Triangle pattern.
The USD/JPY pair has scaled quickly to near the crucial resistance of 135.00 after the Bank of Japan (BoJ) announced a continuation of ultra-loose monetary policy and stability in Japanese Government Bonds’ (JGBs) yields band to maintain an expansionary policy stance. BoJ Governor Kazuo Ueda has confirmed that the central bank will take additional easing steps without hesitation as needed while striving for market stability.
S&P500 futures have recovered the majority of losses generated in the Asian session, portraying a recovery in appeal for US equities as investors are cheerful from solid quarterly performances by technology companies.
The US Dollar Index (DXY) has refreshed its day high at 101.76 amid a delay in US debt-ceiling proposal and pre-Federal Reserve (Fed) policy anxiety among the market participants.
On a four-hour scale, USD/JPY is near the edge of the horizontal resistance of the Ascending Triangle chart pattern plotted from March 15 high at 135.12. The upward-sloping trendline of the aforementioned chart pattern is placed from March 24 low at 129.64.
The 20-period Exponential Moving Average (EMA) below 134.00 has got highly diverged from the major, indicating solid strength in the upside bias.
Meanwhile, the Relative Strength Index (RSI) (14) has climbed above 60.00, which signals that the bullish momentum has been triggered.
Going forward, a decisive break above March 06 low at 135.37 will drive the major toward March 10 high at 137.00 followed by the ultimate resistance plotted from March 08 high at 137.91.
On the contrary, a break below April 05 low at 130.63 would drag the asset toward the round-level support of 130.00. A break below the 130.00 support would expose the asset to March 24 low at 129.64.
USD/JPY four-hour chart
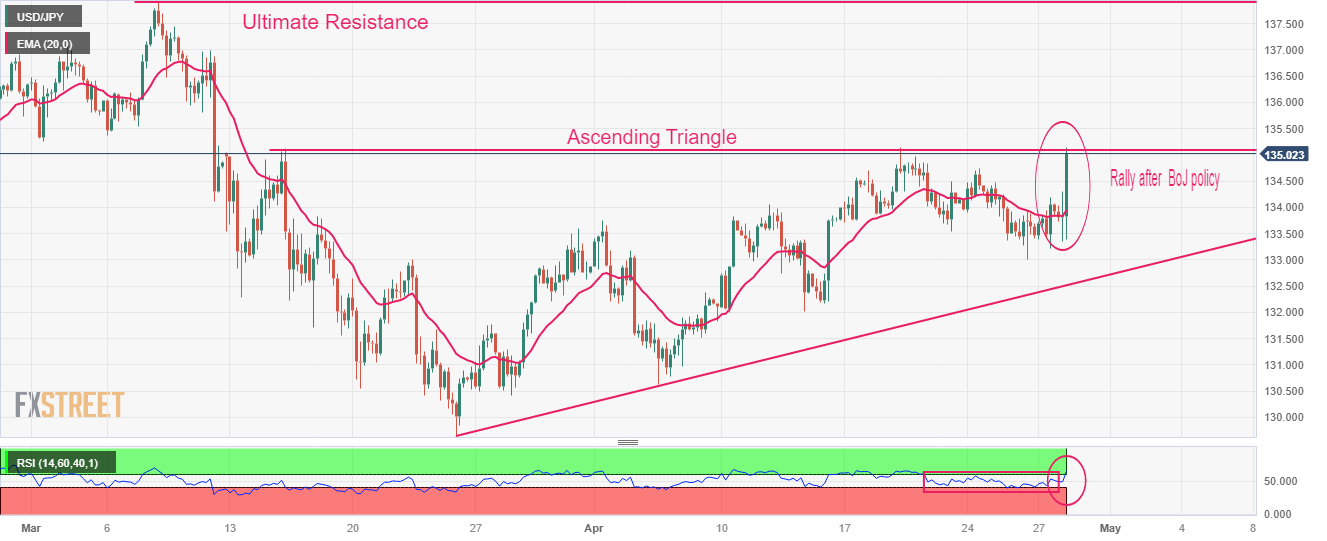
-
07:12
GBP/USD: Extra advance appears on the cards above 1.2550 – UOB
In the opinion of Economist Lee Sue Ann and Markets Strategist Quek Ser Leang at UOB Group, the upside momentum in GBP/USD is expected to accelerate once 1.2550 is cleared.
Key Quotes
24-hour view: “We highlighted yesterday that despite the advance in GBP to 1.2516, there was no significant increase in momentum. We added, ‘instead of strengthening further, GBP is more likely to trade sideways in 1.2420/1.2520 range’. Our view was not wrong even though GBP traded in a narrower range than expected (1.2437/1.2500). The underlying tone has firmed somewhat, and today there is room for GBP to edge above 1.2520. However, a clear break of the major resistance at 1.2550 is unlikely. Support is at 1.2470, followed by 1.2435.”
Next 1-3 weeks: “We highlighted yesterday (27 Apr, spot at 1.2470) that in order for GBP to advance in a sustained manner, it has to break and stay above 1.2550. We continue to hold the same view. The likelihood of GBP breaking clearly above 1.2550 will remain intact as long as it does move below 1.2390 (‘strong support’ level was at 1.2370 yesterday). Looking ahead, the next resistance level above 1.2550 is at 1.2665.”
-
07:01
South Africa M3 Money Supply (YoY) below forecasts (9.9%) in March: Actual (8.9%)
-
07:01
South Africa Private Sector Credit registered at 7.19%, below expectations (7.75%) in March
-
07:01
Sweden Retail Sales (MoM) came in at -1.6% below forecasts (0.5%) in March
-
07:01
Sweden Retail Sales (YoY) came in at -11.6% below forecasts (-7%) in March
-
07:01
Germany Import Price Index (MoM) below forecasts (-0.9%) in March: Actual (-1.1%)
-
07:01
Denmark Retail Sales (YoY) down to -4.6% in March from previous -4.3%
-
07:00
Denmark Unemployment Rate remains unchanged at 2.3% in March
-
07:00
Germany Import Price Index (YoY) came in at -3.8%, below expectations (-3.6%) in March
-
06:59
Gold Price Forecast: XAU/USD downside hinges on $1960 break and Fed – Confluence Detector
- Gold appears well-set for weekly gains on plotting double bottom, despite recent weakness.
- US data propels hawkish Fed bets and US Dollar despite US default woes.
- Geopolitical fears, First Republic Bank-inflicted pessimism underpin XAU/USD demand.
- After impressive US GDP details, Fed’s preferred inflation gauge eyes for Gold price directions ahead of next weeks’ FOMC.
Gold price (XAU/USD) remains pressured below $2,000, printing a three-day downtrend, even as the yellow metal buyers brace for the weekly gains due to its traditional safe-haven status. In doing so, the XAU/USD ignores the recent recovery of the US Dollar, backed by upbeat inflation signals from the US economic calendar, amid fears of US debt ceiling expiration due to the policymakers’ inability to agree on measures ahead of the likely due date in June. Additionally, allowing the Gold price to remain firmer is the upbeat performance of equities due to technology companies’ results.
It’s worth noting that the fears emanating from the First Republic Bank (FRB) seem to also underpin the Gold price rebound amid the US Dollar’s lackluster moves ahead of the Fed’s preferred inflation gauge, namely the US Core PCE Price Index for March, expected to ease to 4.5% YoY versus 4.6% prior. On the same line are the US-China tension and the latest harsh comments from Chinese diplomat to Japan, about Taiwan's status.
Moving on, Gold traders will seek to soften inflation pressure in the US ahead of the next week’s Federal Open Market Committee (FOMC) monetary policy meeting.
Also read: Gold Price Forecast: XAU/USD bull-bear tug-of-extends around $2,000, eyes on US Core PCE Price Index
Gold Price: Key levels to watch
As per our Technical Confluence indicator, Gold price remains firmer past $1,964 support confluence comprising Fibonacci 23.6% on one-month and Pivot Point one-week S1.
That said, the XAU/USD’s sustained trading above the $1,980 support level including Fibonacci 23.6% in one week and one-day also keeps the buyers hopeful.
However, a slew of upside hurdles near $1,990 and $1,993, encompassing 5-DMA and Fibonacci 61.8% on one-day, restricts the short-term upside of the Gold price.
Following that, the $2,000 psychological magnet, also including the Fibonacci 61.8% on one-week, could check the Gold buyers before directing them to the monthly high of around $2,010, which also comprises the Pivot Point one week R1.
It’s worth observing that the previous daily high of around $2,005 and the previous weekly low near $1,970 are some extra filters to watch for the Gold traders.
Here is how it looks on the tool
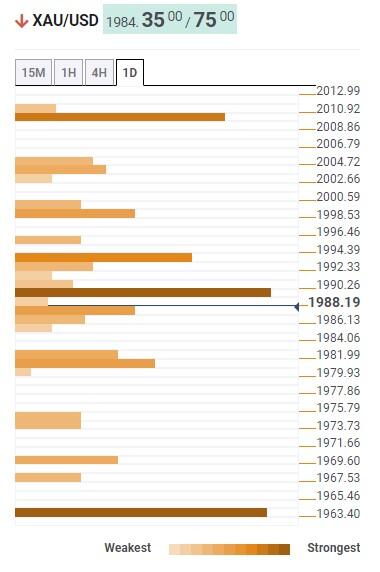
About Technical Confluences Detector
The TCD (Technical Confluences Detector) is a tool to locate and point out those price levels where there is a congestion of indicators, moving averages, Fibonacci levels, Pivot Points, etc. If you are a short-term trader, you will find entry points for counter-trend strategies and hunt a few points at a time. If you are a medium-to-long-term trader, this tool will allow you to know in advance the price levels where a medium-to-long-term trend may stop and rest, where to unwind positions, or where to increase your position size.
-
06:57
USD Index adds to recent gains near 101.80 ahead of PCE
- The index extends the uptrend to the 101.80 region.
- US yields gives away some gains across the curve.
- Inflation tracked by the PCE, Consumer Sentiment next on tap.
The Greenback, in terms of the USD Index (DXY), extends the optimism to the 101.80 zone at the end of the week.
USD Index now looks at key data
The index adds to Thursday’s advance and keeps the optimism well in place in the second half of the week so far.
The selling bias in the risk complex underpins the recent recovery in the dollar, while the unchanged stance from the BoJ at its meeting earlier in the Asian session – and the subsequent bout of weakness in the Japanese yen - also collaborates with the upside bias in the Buck.
Busy day in the US docket, where the salient event will be the release of inflation figures gauged by the PCE along with Personal Income, Personal Spending, Employment Cost and the final print of the Michigan Consumer Sentiment for the month of April.
What to look for around USD
The dollar keeps the bullish performance and looks to revisit the key hurdle at 102.00 against the backdrop of a mild knee-jerk in the risk-associated universe.
Looking at the broader picture, the index continues to navigate in a consolidative phase against steady expectations of another rate increase in May by the Fed.
In favour of a pivot in the Fed’s hiking cycle following the May event appears the persevering disinflation and nascent weakness in some key fundamentals.
Key events in the US this week: PCE/Core PCE, Employment Cost, Personal Income, Personal Spending, Final Michigan Consumer Sentiment (Friday).
Eminent issues on the back boiler: Persistent debate over a soft/hard landing of the US economy. Terminal Interest rate near the peak vs. speculation of rate cuts in 2024. Fed’s pivot. Geopolitical effervescence vs. Russia and China. US-China trade conflict.
USD Index relevant levels
Now, the index is up 0.27% at 101.75 and faces the next resistance level at 102.80 (weekly high April 10) followed by 103.05 (monthly high April 3) and then 103.14 (55-day SMA). On the flip side, the breach of 100.78 (2023 low April 14) would open the door to 100.00 (psychological level) and finally 99.81 (weekly low April 21 2022).
-
06:36
AUD/USD drops sharply towards 0.6600 as USD Index regains strength, RBA-Fed policy in focus
- AUD/USD has slipped sharply to near 0.6610 amid a sustained jump in the USD Index ahead of Fed policy.
- Pre-Fed policy anxiety is impacting the risk appetite of the market participants.
- Decelerates Australian PPI has strengthened the case of an unchanged interest rate policy.
The AUD/USD pair has displayed a steep fall after failing to extend recovery above 0.6640 in the Asian session. The Aussie asset has sensed selling pressure as investors have sifted funds into the US Dollar Index (DXY) amid anxiety ahead of the monetary policy decision by the Federal Reserve (Fed).
Correction in the S&P500 futures in the Asian session has extended as pre-Fed policy anxiety is impacting the risk appetite of the market participants. The USD Index has stretched its rebound move above the immediate resistance of 101.70. The demand for US government bonds has dropped sharply as one more interest rate hike from the Fed is widely anticipated. The 10-year US Treasury yields have jumped sharply to near 3.53%.
On Thursday, the USD Index defended its downside despite a sheer contraction in quarterly Gross Domestic Product (GDP) numbers. GDP (Q1) showed a decline to 1.1% vs. the former expansion of 2.6%. Businesses winded up inventories to offset consumer spending amid dismal economic outlook. However, it will provide firms an opportunity to start afresh with minimal inventory for the second quarter.
Meanwhile, the Australian Dollar is facing immense pressure as the Reserve Bank of Australia is expected to continue its neutral stance on interest rates. RBA Governor Philip Lowe kept its Official Cash Rate (OCR) unchanged at 3.60% considering the current scale of interest rate as restrictive enough to tame stubborn inflation.
Australia’s Producer Price Index (PPI) (Q1) has also decelerated heavily, strengthening the case for an unchanged interest rate policy. Quarterly PPI has accelerated by 1.0% at a slower pace than the forecast of 1.5% and the former release of 1.7%. Annual PPI has been trimmed to 5.2% from the estimates and the prior release of 5.8%.
-
06:30
France Gross Domestic Product (QoQ) meets forecasts (0.2%) in 1Q
-
06:30
France Consumer Spending (MoM) came in at -1.3% below forecasts (0.3%) in March
-
06:26
EUR/USD: A move above 1.1120 appears not favoured – UOB
According to Economist Lee Sue Ann and Markets Strategist Quek Ser Leang at UOB Group, a sustained advance past 1.1120 in EUR/USD seems unlikely for the time being.
Key Quotes
24-hour view: “After EUR soared to a high of 1.1095 and then pulled back on Wednesday, we highlighted yesterday that ‘the rapid rise appears to be overdone’ and we were of the view that EUR ‘is unlikely to advance much further’. We expected EUR to trade in a range between 1.1000 and 1.1100. EUR traded in a narrower range than expected (1.0991/1.1063) before closing slightly lower at 1.1027 (-0.12%). We continue to expect EUR to range trade but the slightly soft underlying tone suggests a lower range of 1.0980/1.1060.”
Next 1-3 weeks: “Our update from yesterday (27 Apr, spot at 1.1045) is still valid. As highlighted, despite the relatively strong advance to 1.1095 on Wednesday, upward momentum has not improved much. While EUR could ratchet higher towards 1.1120, the odds for a sustained rise above this major resistance level are not high for now. In order to keep the momentum going, EUR should not break below 1.0950 (no change ‘strong support’ level).”
-
06:26
US officials lead urgent rescue talks for First Republic Bank – Reuters
Citing three sources familiar with the situation, officials from the Federal Deposit Insurance Corporation (FDIC), the Treasury Department and the Federal Reserve (Fed) are coordinating urgent talks to rescue First Republic Bank, as private-sector efforts led by the bank's advisers have yet to reach a deal.
Additional takeaways
“The government bodies have in recent days started to orchestrate meetings with financial companies about putting together a lifeline for the troubled lender.”
“The government's involvement is helping bring more parties, including banks and private equity firms, to the negotiating table.”
“It is unclear whether the US government is considering participating in a private-sector rescue of First Republic.”
Market reaction
The US Dollar Index is holding the renewed upside at around 101.70 on the above headlines, adding 0.16% on the day.
-
06:19
Japan Annualized Housing Starts climbed from previous 0.859M to 0.877M in March
-
06:18
Japan Housing Starts (YoY) registered at -3.2% above expectations (-4.3%) in March
-
06:18
Japan Construction Orders (YoY) registered at -4.1%, below expectations (11.1%) in March
-
05:58
GBP/USD Price Analysis: Gathers strength for a sustainable move above 1.2500
- GBP/USD is hovering near 1.2500, gathering strength for a decisive breakout.
- The USD Index has regained strength as investors are shifting their focus toward the Fed policy.
- GBP/USD is consolidating in a range of 1.2436-1.2500 amid the absence of a critical trigger.
The GBP/USD pair is consolidating near the psychological resistance of 1.2500 in the Asian session. The Cable is gathering strength for a sustained breakout above 1.2500 after a few failed attempts. Rising expectations of more interest rate hikes from the Bank of England (BoE) to arrest double-digit stubborn inflation are fueling fresh blood into the Pound Sterling.
The US Dollar Index (DXY) has regained strength and has jumped above 101.70 as investors are shifting their focus toward the monetary policy decision by the Federal Reserve (Fed), which will be announced next week.
GBP/USD is consolidating in a range of 1.2436-1.2500 on an hourly scale. The 20-period Exponential Moving Average (EMA) at 1.2483 is still providing support to Pound Sterling, indicating that the upside bias has not faded yet. A potential resistance is placed from April 14 high at 1.2545 while the downside is being cushioned near support plotted from April 10 low at 1.2344.
Meanwhile, the Relative Strength Index (RSI) (14) has slipped back into the 40.00-60.00 range, signaling a lack of momentum.
A decisive move above April 13 high at 1.2537 will drive the asset towards to a fresh 10-month high at 1.2597, which is 08 June 2022 high. A breach of the latter will expose the asset to May 27 high at 1.2667.
On the flip side, a slippage below April 10 low at 1.2345 will expose the asset to March 30 low at 1.2294 followed by March 27 low at 1.2219.
GBP/USD hourly chart
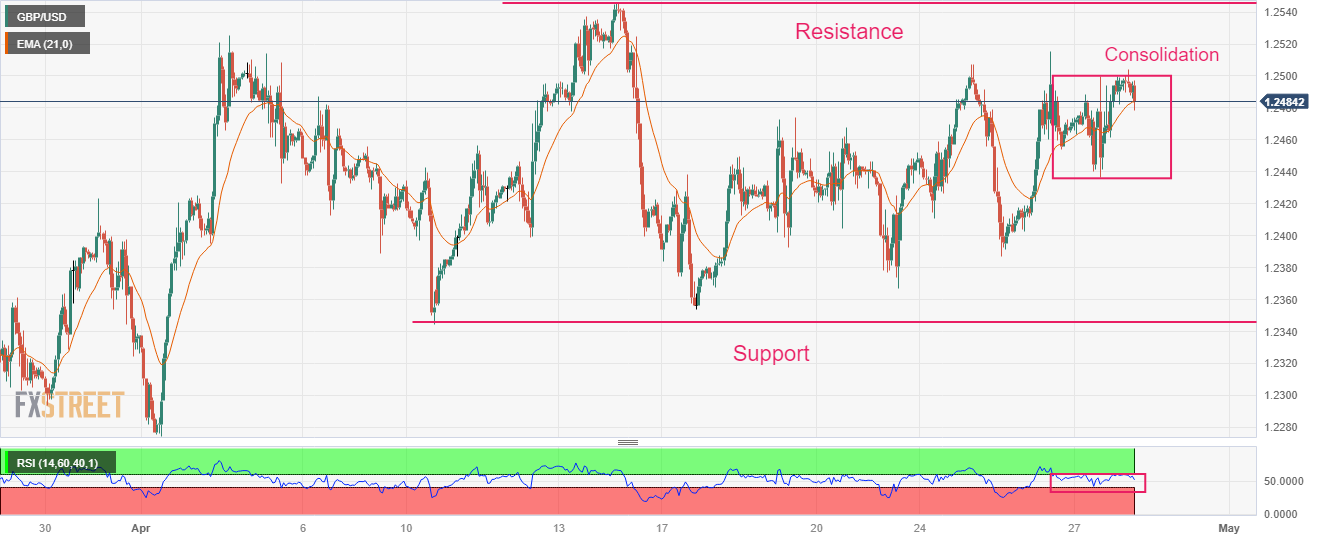
-
05:33
AUD/JPY soars above 89.20 as BoJ keeps policy expansionary and YCC band stable
- AUD/JPY has galloped sharply above 89.20 as BoJ continues its ultra-loose monetary policy as expected.
- The BoJ is ready to take additional easing steps without hesitation as needed while striving for market stability.
- A neutral interest rate stance is expected from the RBA amid declining Australian inflation.
The AUD/JPY pair has run swiftly above 89.20 in the Asian session after the Bank of Japan (BoJ) decided to continue its ultra-loose monetary policy. BoJ Governor Kazuo Ueda in his first monetary policy meeting has announced the maintenance of expansionary monetary policy and has kept the band of Japanese Government Bonds (JGBs) band unchanged.
The decision of keeping rates in negative territory was highly expected as the central bank is struggling to keep inflation steadily above 2%. As the impact of higher import prices has concluded, inflationary pressures in Japan are failing to firm their feet.
Earlier, Nikkei reported that in the review, the BOJ will seek to clarify the effectiveness and side effects of its monetary easing steps and make use of the findings in future policy conduct. Therefore, more action is still expected from the BoJ ahead. It seems that the odds of an exit from the ultra-loose monetary policy have receded as BoJ Ueda has stated “Will take additional easing steps without hesitation as needed while striving for market stability.”
On the Australian Dollar front, investors are shifting their focus toward the interest rate policy from the Reserve Bank of Australia (RBA). Consistently declining Australian inflation is expected to provide room for RBA Governor Philip Lowe for keeping interest rates steady consecutively.
Economists at UOB cited, “Following inflation figures, the RBA is likely to remain on the sidelines at the upcoming monetary policy meeting on 2 May. As such, we continue to see the current 3.60% cash rate as the likely peak. Focus will nonetheless continue to be on incoming economic data, including 1Q23 wage price index (17 May), followed by Apr employment (18 May).”
-
05:30
RBA to hold cash rate at 3.60% in May, but may need to raise again – Reuters poll
Reserve Bank of Australia (RBA) will keep its interest rate unchanged at 3.6% on Tuesday for a second consecutive meeting to assess the impact of past hikes on inflation, per the latest survey of 34 economics.
Earlier in the day, Westpac also trimmed its Australia peak rate forecasts from 3.85% to 3.60%.
Key findings
Over 75% of economists, or 26 of 34 polled in an April 26-28 Reuters survey said the RBA would hold its official cash rate at 3.6% at its meeting on May 2.
The remaining eight respondents expected a 25 basis point hike to 3.85%, a level not seen since April 2012. But interest rate futures are pricing in no further hikes from the current rate.
Among major local banks, ANZ, NAB, and Westpac expect a pause on Tuesday while CBA predicted a 25 basis point hike.
A strong majority, 30 of 34, expected no move in June either, while four expected a 25 basis point hike.
Several economists have instead pushed forward rate expectations to the third quarter, with 13 of 34 expecting a 3.85% peak then. Four saw the peak at 4.1%, and one said 4.35%. The remaining 16 expected rates to remain at 3.6%.
While there was no majority view, the median forecast showed the cash rate reaching a peak of 3.85% in Q3.
Also read: AUD/USD Price Analysis: Marches towards previous support near 0.6650
-
05:27
GBP/JPY renews YTD top past 168.00 as BoJ defend easy-money policy, focus on Ueda
- GBP/JPY jumps nearly 150 pips on BoJ inaction, pierces the key technical hurdle.
- BoJ matches market forecasts with no change to monetary policy, YCC measures.
- UK Business Sentiment hits 11 months high and favors cross-currency pair buyers.
- Newly appointed Governor Ueda’s speech will be the key for immediate directions.
GBP/JPY takes the bids to refresh the yearly high around 168.15 as bulls cheer the Bank of Japan’s (BoJ) status quo during early Friday. Also underpinning the cross-currency pair’s run-up could be the technical breakout and upbeat UK sentiment data.
BoJ held benchmark interest rates unchanged at -0.10% while also defending the latest 0.50% band of the Yield Curve Control (YCC) policy, as expected. However, the BoJ also said that they will take additional easing steps without hesitation as needed while striving for market stability. With this, the market took a sigh of relief that no change is likely under the new governorship.
Also read: BOJ Quarterly Outlook Report: Uncertainty over Japan's economy extremely high
Apart from the BoJ action, a jump in the UK business confidence, per the Lloyds Bank survey for March also seemed to have propelled the GBP/JPY price. As per the latest poll, the British Business Sentiment rallied to an 11-month high of 33.0% in March versus 32.0% prior. Additionally, the survey also showed a seven-month high in wage growth, which in turn can push the Bank of England (BoE) towards being more hawkish.
As a result, the divergence between the BoJ and BoE monetary policies offers an extra boost to the GBP/JPY prices.
Furthermore, cautious optimism in the market and upbeat Treasury bond yields allow the GBP/JPY pair buyers to keep the reins as well.
To sum up, the GBP/JPY pair buyers are properly set in the driver’s seat. However, BoJ Governor Kazuo Ueda’s press conference, scheduled at 06:30 AM GMT, will be crucial to watch for clear directions.
Technical analysis
A clear upside break of the 168.00 double-top hurdle keeps GBP/JPY buyers hopeful of posting further upside towards the late 2022 peak near 169.30.
-
05:08
EUR/JPY roars abive 148.00 as BoJ keeps interest rate policy expansionary as expected
- EUR/JPY has jumped above 148.00 as BoJ has maintained the status quo.
- A continuation of ultra-dovish policy was widely anticipated to keep inflation confidently above 2%.
- Investors are keenly awaiting the release of preliminary Eurozone GDP and German HICP data for further guidance.
The EUR/JPY pair has climbed above the critical resistance of 148.00 as the Bank of Japan (BoJ) has kept its interest rate policy unchanged. Maintenance of an expansionary monetary policy was already anticipated by the market participants as the BoJ is dedicated to keeping inflation sustainably above 2%.
BoJ Governor Kazuo Ueda has already announced that the impact of higher import prices has already passed into the economy higher than expected. Domestic demand is struggling to firm its feet despite enormous efforts of accelerating wages. Therefore an expansionary monetary policy was highly required to maintain fuel in inflationary pressures.
On the Eurozone front, investors are keenly awaiting the release of preliminary Eurozone Gross Domestic Product (GDP) and German Harmonized Index of Consumer Prices (HICP) data. European Central Bank (ECB) policymakers are confident about economic recovery as headline inflation is quickly softening due to declining energy prices and a shortage of labor due to upbeat demand.
Reuters reported that according to a Gfk Survey German consumer sentiment is set to pick up in May as moderating energy prices and expected wage increases help to dissipate households' initial fears about a loss in purchasing power.
Considering the consensus, preliminary monthly German inflation is seen accelerated by 0.8% vs. the 1.1% pace recorded in the prior month. While Eurozone GDP (Q1) is expected to an expansion by 0.2% against a stagnant performance displayed in the last quarter.
Eurozone’s economic data holds significant importance it will be considered by ECB President Christine Lagarde for the monetary policy decision scheduled for next week.
-
05:07
BoJ Quarterly Outlook Report: Uncertainty over Japan's economy extremely high
Following are the key highlights from the Bank of Japan’s (BoJ) quarterly outlook report, reported by Reuters.
Key takeaways
Board's real GDP fiscal 2025 median forecast at +1.0%.
Board's real GDP fiscal 2024 median forecast at +1.2% vs +1.1% in January.
Board's real GDP fiscal 2023 median forecast at +1.4% vs +1.7% in January.
Uncertainty over Japan's economy extremely high.
Need to closely watch financial, currency market moves and their impact on Japan's economy and prices.
Risks to economic outlook broadly balanced.
Risks to price outlook skewed to upside in fiscal year 2023 but skewed to downside in fiscal year 2025.
Uncertainty is high for China's economy.
Japan's economy likely to recover moderately.
Japan's economy picking up albeit being affected by past rises in raw material prices.
Inflation expectations are moving sideways after having heightened.
Japan's economy likely to recover moderately after coming under pressure from past rises in raw material costs, overseas slowdown.
Japan's core consumer inflation slowing pace of increase.
Japan's output gap likely to turn positive around middle of current fiscal year.
Japan likely to see sustainable price rises accompanied by wage increases toward latter half of three-year forecast period for this quarterly report.
Japan's consumer inflation likely to slow below 2% toward the middle of current fiscal year.
Related reads
- USD/JPY jumps 100 pips to mid-134.00s on BoJ status quo, Governor Ueda eyed
- EUR/JPY roars abive 148.00 as BoJ keeps interest rate policy expansionary as expected
-
05:06
USD/JPY jumps 100 pips to mid-134.00s on BoJ status quo, Governor Ueda eyed
- USD/JPY as BoJ matches market forecasts of keeping monetary policy, rates unchanged.
- BoJ keeps YCC band unchanged but tweaks forward guidance.
- Yen traders keenly await Governor Ueda’s first press conference, economic outlook amid hawkish bias.
- US Core PCE Price Index also appears important ahead of next week’s FOMC.
USD/JPY rallies 100 pips to 134.45 on the Bank of Japan’s (BoJ) inaction during early Friday. Although the Japanese central bank matches most market expectations by keeping the monetary policy unchanged, an edit in the forward guidance seemed to have fuelled the Yen pair.
That said, the BoJ held benchmark interest rates unchanged at -0.10% while also defending the latest 0.50% band of the Yield Curve Control (YCC), as expected. However, the BoJ also said that they will take additional easing steps without hesitation as needed while striving for market stability, which in turn propels the USD/JPY prices of late.
Also read: Breaking: BoJ steers policy on a steady course, USD/JPY jumps
Given the central bank officials’ latest defense of easy money policy matching the monetary policy inaction, the USD/JPY prices rise after the announcement.
However, challenges to sentiment emanating from the First Republic Bank (FRB), US debt ceiling expiration woes and hawkish Fed bets led by recently upbeat US inflation signals seem to prod the USD/JPY pair buyers.
It’s worth mentioning that the recent escalation in the geopolitical fears surrounding China also weighs on the sentiment and the USD/JPY prices. Earlier in the day, China’s Envoy to Japan said, “The issue surrounding Taiwan is a red line that should not be crossed.”
While portraying the mood, the S&P500 Futures remain directionless around mid-4,100s after rising the most in 1.5 months the previous day whereas the US Treasury bond yields remain lackluster following a notable recovery in the 10-year and two-year bond coupons in the last two days.
Having witnessed the initial reaction to the Bank of Japan’s (BoJ) monetary policy announcements, the USD/JPY pair traders will pay attention to newly appointed Governor Kazuo Ueda’s press conference, scheduled at 06:30 AM GMT. Should the policymaker walks in the footprints of previous Governor Haruhiko Kuroda, the Yen pair may please buyers.
Apart from the BoJ-linked catalysts, the market’s fears of banking fallouts and US default highlight the First Republic Bank (FRB) updates and discussion on debt ceiling expansion as important factors to watch. Additionally, the Fed’s preferred inflation gauge, namely the US Core PCE Price Index for March, expected to ease to 4.5% YoY versus 4.6% prior, could offer more details to aptly predict the USD/JPY pair’s moves ahead of the next week’s Federal Open Market Committee (FOMC) monetary policy meeting.
Also read: US Core PCE Preview: Why this is a lose-lose situation for the US Dollar
Technical analysis
A daily closing beyond the downward-sloping resistance line from early March, around 134.50 by the press time, becomes necessary for the Yen pair buyers to retake control. That said, sellers may tighten control on witnessing sustained trading below a one-month-old support line, close to 133.85 at the latest.
-
05:02
Breaking: BoJ steers policy on a steady course, USD/JPY jumps
At Bank of Japan (BoJ) Governor Kazuo Ueda’s first monetary policy meeting, the central bank’s board members decided to make no changes to their current monetary policy settings, maintaining rates and 10yr JGB yield target at -10bps and 0.00% respectively.
Summary of the statement
No change to yield band.
BoJ maintains band around its 10-year JGB yield target at up and down 0.5% each.
BoJ made decision on YCC by unanimous vote.
To conduct examination of monetary policy.
BoJ tweaks forward guidance.
BoJ removes forward guidance that pledged to keep interest rate at current or lower levels.
Will continue expanding monetary base until year-on-year rate of increase in CPI exceeds 2% and stays above the target in stable manner.
Will take additional easing steps without hesitation as needed while striving for market stability.
BoJ removes reference to COVID-19 pandemic from its forward guidance.
Will spend 1 to 1-1/2 years to conduct review on monetary policy guidance.
Japan's economy fell into deflation in late 1990s, achieving price stability has been a challenge for long period of 25 years.
During this period, BoJ has implemented various monetary easing steps.
Market reaction
USD/JPY storms through the 134.50 level on BoJ’s policy announcements. The pair is currently trading at 134.54, up 0.48% on the day.
-
05:01
Japan BoJ Interest Rate Decision in line with expectations (-0.1%)
-
04:58
EUR/USD prints pre-data anxiety near 1.1030 as Eurozone GDP, US inflation clues loom
- EUR/USD remains defensive during two-day losing streak, sidelined of late.
- Hawkish ECB bias, mixed US data allow Euro bulls to remain hopeful.
- Challenges to sentiment, unimpressive EU statistics keep traders on the dicey floor.
- Q1 GDP for Eurozone and Germany can entertain traders ahead of Fed’s favorite inflation gauge, namely Core PCE Price Index.
EUR/USD clings to mild losses near 1.1020 during early Friday in Europe as it tries to keep bears on the table after welcoming them the previous day. With this, the Euro pair aptly portrays the market’s anxiety ahead of the top-tier growth numbers from the bloc, as well as the Federal Reserve’s (Fed) preferred inflation gauge.
EUR/USD eased from the 13-month high on Thursday even after softer US Gross Domestic Product (GDP) for the first quarter (Q1), not to forget mixed Eurozone sentiment numbers. The reason could be linked to the absence of commentary from the European Central Bank (ECB) and the Fed officials ahead of next week’s monetary policy meetings by these central banks. Also likely to have called the Euro sellers are the upbeat inflation signals from the GDP and the Personal Consumption Expenditure (PCE) Prices for Q1.
Further, US banking fallout fears regain momentum amid reports that the First Republic Bank (FRB) plans to sell half its loan book to fill a $100B deposit flight gap, which in turn should have teased the EUR/USD sellers even if the tech giants kept the market optimistic.
Elsewhere, the likely deadlock over the US debt ceiling talks, as most policymakers have contrasting views, also prods the optimists during the pre-data anxiety and restricts EUR/USD moves. Recently, House Speak Kevin McCarthy said, “I won't pass a clean debt-limit increase.”
On the same line is the escalation in the geopolitical fears surrounding China. Earlier in the day, China’s Envoy to Japan said, “The issue surrounding Taiwan is a red line that should not be crossed.”
Amid these plays, the S&P500 Futures remain directionless around mid-4,100s after rising the most in 1.5 months the previous day whereas the US Treasury bond yields grind higher and put a floor under the US Dollar Index (DXY).
Looking ahead, a likely improvement in the German and Eurozone GDP figures can challenge the EUR/USD sellers. However, the pair traders should wait for the US Core PCE Price Index for March, expected to ease to 4.5% YoY versus 4.6% prior, for clear directions. In a case where the Fed’s preferred inflation gauge print higher numbers, the major currency pair may decline heavily.
Technical analysis
EUR/USD pair’s retreat from an upward-sloping resistance line from early February, close to 1.1075 by the press time, keeps sellers hopeful amid sluggish oscillators. The pullback moves, however, remain elusive unless providing a daily close below a two-month-old ascending support line, near 1.0990 at the latest.
-
04:44
Gold Price Forecast: XAU/USD extends recovery above $1,990 as Fed to sound neutral on interest rate guidance
- Gold price has managed to surpass $1,990.00 after a recovery move as investors anticipate neutral guidance from Fed.
- Market mood is upbeat as investors digested fears of recession and shifted focus to outperformance from US tech stocks.
- Gold price is inside the woods for the past week in a range of $1,974.08-2,014.22, indicating a volatility contraction.
Gold price (XAU/USD) has climbed above $1,990.00 after rebounding from $1,976.00 in the Asian session. The precious metal witnessed a steep fall on Thursday after House Speaker McCarthy said the debt limit can't pass without dealing with the budget, as reported by Bloomberg.
Investors were expecting that increase in the US debt ceiling could impact the long-term rating of the United States economy, which would impact the US Dollar but will improve the appeal of the Gold price as a safe-haven. A delay in US debt-ceiling talks weighed heavily on the Gold price.
S&P500 futures are showing nominal losses in the Asian session. The 500-US stocks basket was heavily bought on Thursday as investors digested fears of recession due to higher interest rates from the Federal Reserve (Fed) and shifted focus to outperformance quarterly performance from US tech-savvy stocks. The risk profile is mildly cautious amid an overall cheerful mood.
The US Dollar Index (DXY) has rebounded after defending the critical support of 101.00 despite higher chances that one more rate hike from the Federal Reserve (Fed) could be the last nail in the coffin. A consecutive 25 basis point (bp) interest rate hike from the Fed would push rates above 5%. Apart from that, neutral interest rate guidance is expected from Fed chair Jerome Powell as firms are losing confidence due to higher borrowing costs and inflation is softening consistently.
Gold technical analysis
Gold price is inside the woods from the past week in a range of $1,974.08-2,014.22 on a two-hour scale. Lengthy consolidation indicates a sheer volatility contraction, which is expected to be followed by wider ticks and heavy volume after an explosion.
Advancing trendline from March 22 low at $1,934.34 is acting as a cushion for the Gold bulls.
The 20-period Exponential Moving Average (EMA) at $1,988.82 is continuously hovering around the Gold price, hinting at a sideways performance.
Also, the Relative Strength Index (RSI) (14) is oscillating in the 40.00-60.00 range, indicating an absence of a critical trigger.
Gold two-hour chart
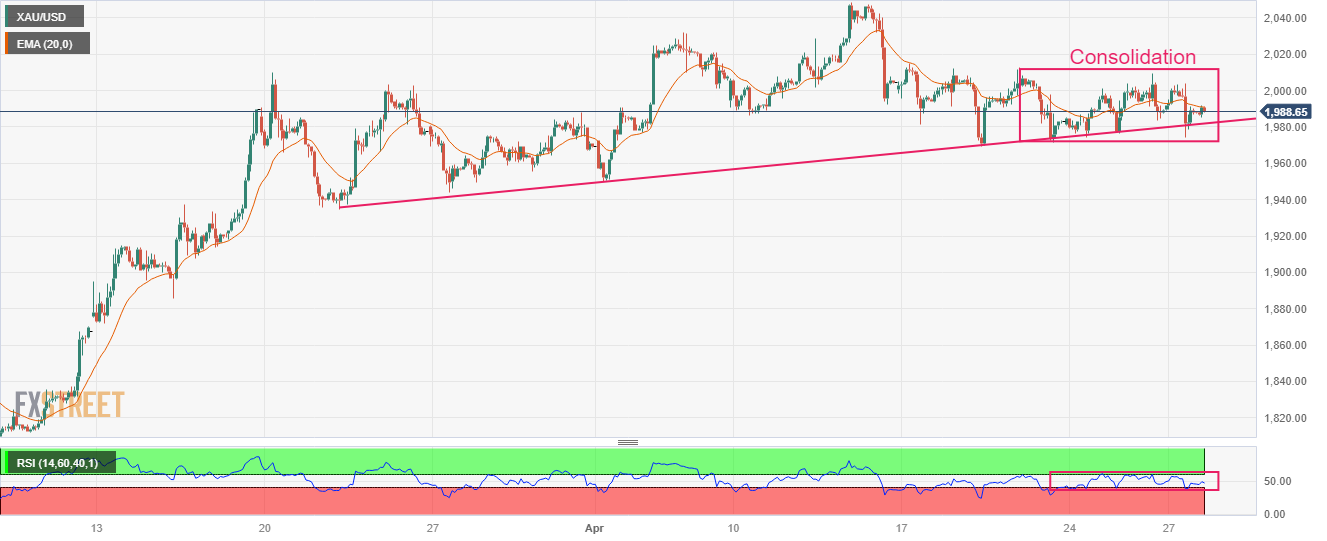
-
04:31
USD/INR Price News: Rupee stays depressed ahead of India Fiscal Deficit, US Core PCE Inflation
- USD/INR grinds higher after bouncing off two-week low the previous day.
- Cautious mood ahead of the key data keeps Indian Rupee directionless.
- US statistics defend Fed hawks ahead of the key inflation clues and FOMC.
- Fresh tensions surrounding China, First Republican Bank prod USD/INR sellers above 200-DMA.
USD/INR picks up bids to defend the previous day’s rebound from a fortnight low with mild gains around 81.90 during early Friday.
That said, the US Dollar rebound seems to have triggered the USD/INR pair buyer’s optimism. However, the cautious mood ahead of India’s Federal Fiscal Deficit for March and the US Core Personal Consumption Expenditure (PCE) Price Index for the said month restrict the pair’s immediate moves.
The USD/INR pair bounced off the lowest levels in two weeks the previous day after the US Dollar managed to cheer mostly upbeat inflation signals in the headline growth numbers. On Thursday, the first readings of the US Gross Domestic Product (GDP) for the first quarter (Q1) of 2023, also known as Advance readings, marked mixed outcomes. That said, the headline US GDP Annualized eased to 1.1% from 2.0% expected and 2.6% prior but the GDP Price Index inched higher to 4.0% on an annualized basis from 3.9% prior and 3.8% market consensus.
Further, the Personal Consumption Expenditure (PCE) Prices for Q1 rallied to 4.2% from 3.7% in previous readouts whereas the Core PCE figures also crossed 4.8% market forecasts and 4.4% prior with 4.9% mark for the said period. It should be noted that a slump in the weekly Initial Jobless Claims also allowed the US Dollar to remain firmer.
It’s worth mentioning that the upbeat earnings from Meta Platforms jostle with Amazon’s recession warning and welcome results to entertain equity bulls on Wall Street the previous day. The same seemed to have joined downbeat US GDP figures to prod the USD/INR pair buyers.
Alternatively, US banking fallout fears weighed on the sentiment amid reports that the First Republic Bank (FRB) plans to sell half its loan book to fill a $100B deposit flight gap.
On the same line is the likely deadlock over the US debt ceiling talks, as most policymakers have contrasting views, also prods the optimists during the pre-data anxiety. Recently, House Speak Kevin McCarthy said, “I won't pass a clean debt-limit increase.”
Furthermore, the recent escalation in the geopolitical fears surrounding China also weighs on the sentiment and the Indian Rupee. Earlier in the day, China’s Envoy to Japan said, “The issue surrounding Taiwan is a red line that should not be crossed.”
It should be observed that the mildly bid prices of WTI crude oil, around $74.85 by the press time, allow USD/INR to remain firmer due to New Delhi’s reliance on energy imports and record deficit.
Against this backdrop, the S&P500 Futures remain directionless around mid-4,100s after rising the most in 1.5 months the previous day whereas the US Treasury bond yields remain lackluster following a notable recovery in the 10-year and two-year bond coupons in the last two days.
Moving on, India’s Federal Fiscal Deficit for March, prior 14,538.62B, will precede the US Core PCE Price Index for March, expected to ease to 4.5% YoY versus 4.6% prior, to entertain USD/INR pair traders. However, major attention will be given to the risk catalysts as the recent worsening of the sentiment in India prods the INR bulls.
Technical analysis
Although a two-week-old descending resistance line challenges USD/INR bulls around the 82.00 round figure, the pair’s downside remains limited unless the quote provides a daily closing beneath the 200-DMA support of 81.65.
-
03:53
USD/CNH Price Analysis: Extends pullback from 6.9540-50 resistance confluence
- USD/CNH remains pressured for third consecutive day despite bouncing off intraday low at the latest.
- RSI retreat backs offshore Chinese Yuan pair’s U-turn from 200-DMA, 38.2% Fibonacci retracement.
- Five-week-old horizontal support restricts immediate downside ahead of the key support line stretched from early February.
USD/CNH bears keep the reins for the third consecutive day on early Friday, down 0.10% intraday near 6.9250 by the press time. In doing so, the offshore Chinese Yuan (CNH) pair ignores the latest rebound from the intraday low while keeping the early-week U-turn from the key upside hurdle.
Not only the failure to cross the 200-DMA and 38.2% Fibonacci retracement level of the USD/CNH pair’s fall from October 2022 to January 2023 but the RSI (14) retreat from overbought territory also suggests a further decline of the quote.
However, a horizontal area comprising multiple levels marked since March 20, between 6.9070 and 6.9130, restricts the immediate downside of the USD/CNH pair.
Following that, an upward-sloping support line from February 02, close to 6.8850, will be in the spotlight. In a case where the USD/CNH price stays weaker past 6.8850, the 100-DMA level of 6.8760 can act as the last defense of the buyers.
Alternatively, recovery moves need to cross the aforementioned 6.9540-50 resistance confluence to convince USD/CNH bulls.
Even so, the four-month-old descending resistance line near 6.9800 can prod the pair buyers before suggesting a clear bullish trend.
USD/CNH: Daily chart

Trend: Limited downside expected
-
03:38
Singapore Unemployment rate below expectations (2%) in 1Q: Actual (1.8%)
-
03:30
Commodities. Daily history for Thursday, April 27, 2023
Raw materials Closed Change, % Silver 24.917 0.09 Gold 1987.7 -0.1 Palladium 1487.72 -0.67 -
03:15
S&P500 Futures ignore Wall Street’s gains, yields dribble ahead of Fed’s favorite inflation
- Market sentiment remains sluggish after an upbeat day as traders await the key US data.
- S&P500 Futures lack clear directions after rising the most in six weeks the previous day.
- US Treasury bond yields grind higher as US GDP growth eased, price details improved.
- Fears emanating from First Republic Bank jostle with technology company-led optimism.
Risk profile remains blurry during early Friday as market players eye the Federal Reserve’s preferred inflation gauge after witnessing mixed clues the previous day. Adding strength to the inaction are the contrasting plays of the First Republic Bank-induced fears and optimism spread via upbeat earnings from the global technology giants.
While portraying the mood, the S&P500 Futures remain directionless around mid-4,100s after rising the most in 1.5 months the previous day, as well as snapping a two-day downtrend. It’s worth noting that the US Treasury bond yields remain lackluster following a notable recovery in the 10-year and two-year bond coupons in the last two days.
Upbeat earnings from Meta Platforms jostle with Amazon’s recession warning and upbeat results to entertain equity bulls on Wall Street the previous day. Alternatively, US banking fallout fears weighed on the sentiment amid reports that the First Republic Bank (FRB) plans to sell half its loan book to fill a $100B deposit flight gap.
Elsewhere, upbeat inflation signals from the United States data ahead of the next week’s Federal Open Market Committee (FOMC) monetary policy meeting initially allowed the US Dollar and yields to remain firmer before the greenback’s retreat.
That said, the first readings of the US Gross Domestic Product (GDP) for the first quarter (Q1) of 2023, also known as Advance readings, marked mixed outcomes. That said, the headline US GDP Annualized eased to 1.1% from 2.0% expected and 2.6% prior but the GDP Price Index inched higher to 4.0% on an annualized basis from 3.9% prior and 3.8% market consensus. Further, the Personal Consumption Expenditure (PCE) Prices for Q1 rallied to 4.2% from 3.7% in previous readouts whereas the Core PCE figures also crossed 4.8% market forecasts and 4.4% prior with 4.9% mark for the said period. It should be noted that a slump in the weekly Initial Jobless Claims also allowed the US Dollar to remain firmer.
It should be observed that the likely deadlock over the US debt ceiling talks, as most policymakers have contrasting views, also prods the optimists during the pre-data anxiety. Recently, House Speak Kevin McCarthy said, “I won't pass a clean debt-limit increase.”
Amid these plays, prices of the Gold and WTI crude oil struggle for clear directions and tease the bears whereas the major currency pairs, ex USD/JPY, remain sluggish while waiting for the key data.
With this, the Fed’s preferred inflation data, namely the US Core Personal Consumption Expenditure (PCE) Price Index for March, expected to ease to 4.5% YoY versus 4.6% prior, becomes crucial for market players to watch. Also important are the first readings of the Eurozone and German Q1 GDP.
Also read: Forex Today: Market sentiment improves; Ueda's first BOJ meeting
-
03:04
When is the BoJ and how might it affect USD/JPY?
The Bank of Japan is scheduled to deliver the outcome of its meeting today with the governor Kazuo Ueda to hold a news conference at 0630 GMT after the policy meeting. There is no firm time for the announcement of the decision but last time it was at 0230 GMT.
Markets aren’t expecting any changes at this meeting, but the fact that Japan is now recording the highest inflation since 1981 suggests that pressure for a change in policy is on the up. Leading up to the meeting, Tokyo CPI inflation numbers released showed a YoY price growth of 3.5% in April. ´´That’s two ticks higher than expected, and the core readings look even stronger,´´ analysts at Rabobank said. ´´
Meanwhile,´´ they said, ´´the Japanese jobless rate rose to 2.8% when it was expected to fall one tick to 2.5%. That all looks stagflationary too, but new BOJ Governor Ueda has said that the economy is past the peak for cost-push inflation.´´
In the media today, the Nikkei reported that the BoJ will forego revising YCC and will discuss a revision of forward guidance.
´´We think it is highly likely that a formal policy review is announced. That should put the next YCC shift as early as June. Generally, we think assuming a YCC change sooner rather than later is a prudent strategy,´´ analysts at TD Securities said.
´´Lifting the yield cap to 1% as its next move has a lot of appeal,´´ they analysts said.
´´The BOJ will not provide advance warning to a YCC change and will instead prefer to do it when it is least expected. As such, one cannot fully rule out a change at any meeting. We also think they would prefer to make a shift when the Fed has neared or completed its tightening cycle as there is less natural upward pressure to push global yields higher.´´
How will USD/JPY react?
The analysts at TD Securities argue that there could be some yen upside through the meeting via a 1m 132/129 USD/JPY put-spread. ´´The yen should trade with an asymmetric bias.´´

such a view plays into the W-formation and bear pennant on the weekly chart.

The daily chart has already seen the price break structure which leaves the bias bearish while below 134.48-73 /135.14 peak formation highs. A break of 133.01 will be a significant bearish development if that occurs in the coming sessions.
About the BoJ
BoJ Interest Rate Decision is announced by the Bank of Japan. Generally, if the BoJ is hawkish about the inflationary outlook of the economy and rises the interest rates it is positive, or bullish, for the JPY. Likewise, if the BoJ has a dovish view on the Japanese economy and keeps the ongoing interest rate, or cuts the interest rate it is negative, or bearish.
-
02:52
USD/CAD Price Analysis: 50-DMA prods Loonie bears around 1.3600
- USD/CAD remains pressured after reversing from one-month high.
- Bullish MACD signals, 50-DMA challenge Loonie pair’s further downside.
- Convergence of early April top, two-week-old ascending trend line adds to the downside filters.
- Buyers need validation from seven-week-long resistance line, 61.8% Fibonacci retracement.
USD/CAD holds lower grounds near 1.3600 as the 50-DMA challenges the Loonies pair’s U-turn from a one-month high during early Friday. In doing so, the quote also traces the bullish MACD signals while preparing for the consecutive second weekly gain.
That said, the Loonie pair’s latest rebound may aim for a monthly high of near 1.3650. However, a downward-sloping resistance line from early March, near 1.3660 at the latest, can prod the USD/CAD bulls afterward.
Following that, the 61.8% Fibonacci retracement of USD/CAD downside during October-November 2022, around 1.3690, will precede the tops marked during late 2022 near the 1.3700 round figures to restrict the pair’s further upside.
It’s worth noting, however, that the Loonie pair’s successful run-up beyond 1.3700 enables it to challenge the key horizontal resistance area established since October 2022, near 1.3850-60.
On the flip side, a daily closing below the 50-DMA support of around 1.3585 isn’t a clear signal for the USD/CAD pair’s further downside as the early month high and a fortnight-old ascending trend line together highlight 1.3555 as the short-term key support.
In a case where the Loonie pair breaks the 1.3555 support confluence, the odds of witnessing a slump toward the monthly low of 1.3300 can’t be ruled out.
Overall, USD/CAD is likely to remain firmer but the upside room appears limited.
USD/CAD: Daily chart

Trend: Limited downside expected
-
02:34
Australia Private Sector Credit (YoY) dipped from previous 7.6% to 6.8% in March
-
02:31
Natural Gas Price News: XNG/USD retreats to $2.40 on higher EIA inventory build, mixed sentiment
- Natural Gas Price fades the previous day’s bounce off one-week low, eases of late.
- Weekly prints of EIA Natural Gas Storage Change came in firmer.
- Expectations of downbeat Russia Gas exports, higher US consumption keep XNG/USD bulls hopeful.
Natural Gas Price (XNG/USD) grinds lower at $2.40 while struggling to extend the previous day’s corrective bounce off the lowest levels since April 17. In doing so, the energy instrument justifies price-negative weekly inventory details despite bullish supply-demand signals.
On Thursday, the US Energy Information Administration (EIA) Natural Gas Storage Change grew to 79B for the week ended on April 21, versus expectations of staying unchanged at 75B.
Also challenging the XNG/USD price could be the recently cautious mood in the market ahead of the US Fed’s preferred inflation data, namely the US Core Personal Consumption Expenditure (PCE) Price Index for March, expected to ease to 4.5% YoY versus 4.6% prior.
It’s worth noting that the mixed US data joined chatters of a slide in Russia’s Natural Gas exports in 2023 underpinned the XNG/USD rebound the previous day. On the same line is the gradual easing of restrictions on Natural Gas usage in the US.
On a different page, recently downbeat sentiment in the market, as per the mildly offered S&P 500 Futures, join the banking fears and hopes of higher rates at the major central banks to weigh on the Natural Gas price.
Looking ahead, Natural Gas traders should pay attention to market dynamics and US data amid a lack of major energy updates.
Technical analysis
Although the 21-DMA puts a floor under the Natural Gas price near $2.32, the XNG/USD upside remains elusive unless providing a daily close beyond a six-week-old descending resistance line, close to $2.48 by the press time.
-
02:30
Australia Producer Price Index (YoY) below forecasts (5.8%) in 1Q: Actual (5.2%)
-
02:30
Australia Private Sector Credit (MoM) meets forecasts (0.3%) in March
-
02:30
Australia Producer Price Index (QoQ) registered at 1%, below expectations (1.5%) in 1Q
-
02:27
AUD/JPY aims 89.00 as BoJ to continue ultra-dovish interest rate policy
- AUD/JPY is aiming to reclaim 89.00 as a continuation of expansionary monetary policy by the BoJ is widely anticipated.
- The requirement of keeping Japan’s inflation rate steadily above 2% an ultra-dovish policy is highly required.
- Consistently declining Australian inflation will allow the RBA to keep interest rates steady.
The AUD/JPY pair is approaching the 89.00 hurdle on expectations that the Bank of Japan (BoJ) will continue its ultra-dovish policy stance on interest rates. The cross has climbed above 88.85 after a breakout of a base formation in an 87.87-88.75 range for the past two trading sessions.
Considering the fact that the Japanese economy has already passed on the impact of higher import prices and domestic demand is vulnerable, BoJ Governor Kazuo Ueda has no other option than to keep interest rates unchanged. The Japanese economy has yet not reached its pre-pandemic levels. The administration is making enormous efforts to propel wages to accelerate households’ spending. However, a failure in doing so is going to force the BoJ to continue an expansionary monetary policy.
On Yield Curve Control (YCC) band, analysts at TD Securities expect, “While we think Ueda's next move will be a further adjustment of the yield curve target band, he appears in no rush to make such an adjustment, saying it's appropriate to maintain YCC "for now"
On the Australian Dollar front, investors are awaiting the interest rate decision by the Reserve Bank of Australia (RBA), which will be announced on Tuesday. An unchanged monetary policy is widely anticipated from RBA Governor Philip Lowe as Australian inflation is consistently declining for the past three months. RBA would prefer some time to observe the influence of current monetary policy but will keep doors open for further rate hikes if inflation continues to remain persistent.
-
02:23
GBP/USD bulls reaching for a close above 1.2500
- GBP/USD bulls reaching into resistance near 1.2500 but remain in control.
- It has been a jittery week and the US Dollar has been pulled and pushed ahead of the Fed.
GBP/USD is flat in Tokyo following an impressive rally on Thursday in a continuation of the short squeeze. The bulls reached the prior resistance around 1.2500 and sit there currently waiting for a fresh impetus sat not far off a 10-month peak.
financial market jitters have caused volatility this week as investors vacillated over whether U.S. banking issues and a standoff over the debt ceiling were overall supportive of the US Dollar. On Thursday, investors moved away from the Greenback ahead of the release of the first estimate of Q1 Gross Domestic Product and weekly initial jobless claims.
The data showed that while the US economy is forecast to have risen by 2% in Q1 after a 2.6% gain in the previous quarter, with personal consumption spending up 4.2% after a 1% gain to offset softer readings for other components, inflation remains sticky. The GDP Price Index for the US increased at an annualized rate of 4.0% in Q1, indicating inflation is stronger than initially expected. The core inflation measure lifted 4.9%.
Eyes on Fed May meeting
Meanwhile, ahead of next week's much anticipated Federal Open Market Committee meeting, Morgan Stanley (MS) published their views on what to expect.
MS said they expect the Fed to deliver a 25 basis points (bps) hike and communicate a conditional pause. The research also states that their rates strategists see scope for markets to extract a dovish message from the Fed at the upcoming FOMC meeting. That said, the MS highlights news about recent banking system stress as a challenge for the US central bank hawks. Still, the reports show that the investment bank believes a robust job market and high inflation support the May hike thesis. MS believes the May meeting "is likely to represent a turning point in the monetary policy tightening cycle."
-
02:22
USD/CNY fix: 6.9240 vs. the prior close of 6.9203
In recent trade today, the People’s Bank of China (PBOC) set the yuan at 6.9240 vs. the prior close of 6.9203 and an estimate of 6.9249.
About the fix
China maintains strict control of the yuan’s rate on the mainland.
The onshore yuan (CNY) differs from the offshore one (CNH) in trading restrictions, this last one is not as tightly controlled.
Each morning, the People’s Bank of China (PBOC) sets a so-called daily midpoint fix, based on the yuan’s previous day's closing level and quotations taken from the inter-bank dealer.
-
02:08
AUD/USD Price Analysis: Marches towards previous support near 0.6650
- AUD/USD picks up bids to refresh intraday high, extends the previous day’s rebound.
- Downbeat oscillators fail to back Thursday’s U-turn from 38.2% Fibonacci retracement.
- Bottom line of bullish channel prods Aussie pair’s immediate upside.
AUD/USD stays on the front foot around 0.6640 as it defends the previous day’s gains after bouncing off a six-week low. In doing so, the Aussie pair approaches the support-turned-resistance line stretched from early March, forming part of the previous bullish channel.
It’s worth noting, however, that the bearish MACD signals and sluggish RSI (14), can challenge the AUD/USD bulls around the 0.6655 previous support.
In a case where the Aussie buyers manage to cross the 0.6655 hurdle, its run-up towards the 50% Fibonacci retracement level of the June-October 2022 downturn, near 0.6725, can’t be ruled out.
However, the 100-DMA and the top line of the aforementioned channel, respectively near 0.6795 and 0.6835, can challenge the AUD/USD bulls afterward.
Should the Aussie pair buyers manage to keep the reins past 0.6835, they can retake the driver’s seat.
Meanwhile, the 38.2% Fibonacci retracement level of 0.6595 restricts the immediate downside of the AUD/USD pair. Following that, the yearly low marked in March around 0.6565 will be in the spotlight.
If the AUD/USD bears manage to conquer the 0.6565 support, multiple levels near 0.6530-25 can challenge the Aussie pair’s downside before giving control to the sellers.
Overall, AUD/USD remains on the bear’s radar even if the upside room appears limited.
AUD/USD: Daily chart
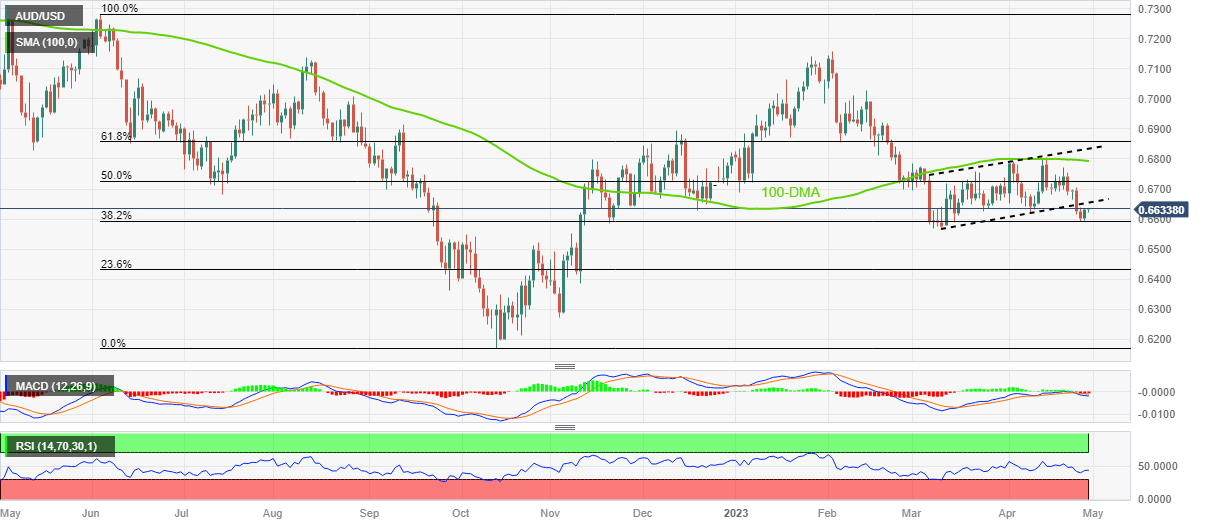
Trend: Limited upside expected
-
01:56
Fed to deliver a 25bp hike and communicate a conditional pause – Morgan Stanley
After conveying the likely peak of interest rates at the major central banks during early Week, Morgan Stanley (MS) provided detailed expectations for the next week’s Federal Open Market Committee (FOMC) monetary policy meeting.
MS said they expect the Fed to deliver a 25 basis points (bps) hike and communicate a conditional pause.
The research also states that their rates strategists see scope for markets to extract a dovish message from the Fed at the upcoming FOMC meeting. That said, the MS highlights news about recent banking system stress as a challenge for the US central bank hawks.
It’s worth noting that the MS anticipates softer second quarter (Q2) US Gross Domestic Product (GDP) data while expecting -0.4% figures for the Q2 2023 GDP.
Also read: Fed rates are unlikely to go anywhere near zero, even if US economy tips into recession – Morgan Stanley
-
01:47
EUR/USD Price Analysis: Extends recovery above 1.1030 ahead of key Eurozone data
- EUR/USD is marching north after a solid recovery from 1.1000 ahead of the Eurozone GDP and German HICP.
- The USD Index has slipped as investors are worried that an increase in the debt-ceiling will impact long-term rating of the US economy.
- EUR/USD is auctioning in an Ascending Triangle pattern, which indicates a volatility contraction.
The EUR/USD pair has stretched its recovery above 1.1030 in the Asian session. Earlier, the major currency pair sensed a significant buying interest from the psychological support of 1.1000 amid a correction in the US Dollar Index (DXY).
The USD Index has slipped further to near 101.00 as investors are worried that approval of the debt-ceiling increase proposal will impact the long-term rating of the United States economy.
On the Eurozone front, Friday’s preliminary Eurozone Gross Domestic Product (GDP) and German Harmonized Index of Consumer Prices (HICP) carry significant importance as they will be the latest economic indicators before the interest rate decision by the European Central Bank (ECB), which will be announced next week.
EUR/USD is auctioning in an Ascending Triangle chart pattern on an hourly scale, which indicates a volatility contraction. Upward-sloping trendline of the aforementioned chart pattern is plotted from April 10 low at 1.0837 while the horizontal resistance is placed from April 14 high at 1.0760.
The 20-period Exponential Moving Average (EMA) at 1.1030 is overlapping the asset, indicating a sideways performance.
Also, the Relative Strength Index (RSI) (14) is oscillating in the 40.00-60.00 range. The shared currency pair is expected to show a power-pack action after the release of the Eurozone economic data.
The major currency pair will capture more gains only after decisively surpassing the round-level resistance of 1.1100. An occurrence of the same will drive the asset towards a fresh 13-month high at 11.85, which is 31 March 2022 high followed by 28 February 2022 high at 1.1246.
On the flip side, a downside move below April 12 low at 1.0915 will drag the asset toward April 10 low at 1.0837 and April 03 low at 1.0788.
EUR/USD hourly chart
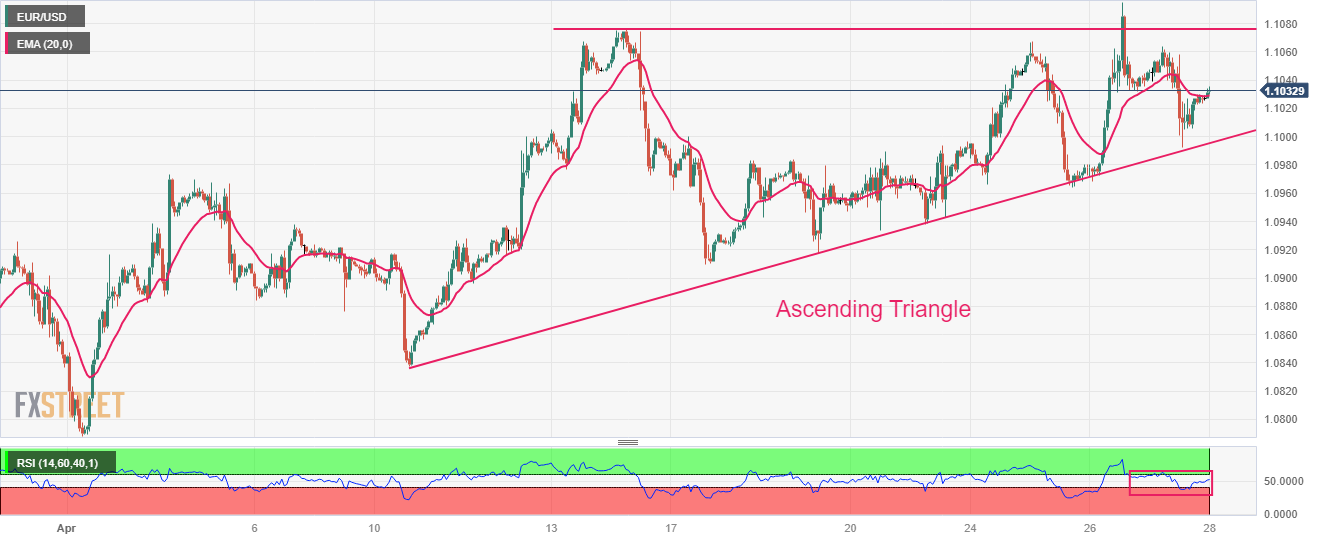
-
01:47
Japan Large Retailer Sales below expectations (3.8%) in March: Actual (3.2%)
-
01:42
WTI Price Analysis: Bears waiting to pounce but bulls are strong
- WTI bulls are attempting to correct and have formed a solid support ground.
- Bears could be willing to take the bulls on at a premium from below trendline resistance.
West Texas Intermediate, WTI, has rallied towards a key resistance area as the following charts will illustrate. However, while a subsequent sell-off might be expected while on the front side of the bearish trendline resistance, there has been a firm layer of support put together near $74.00. Nevertheless, while below $77.00, the bias is to the downside.
WTI daily chart

The trend is bearish while on the front side of the trendline and with room to go until $72.50.
WTI H4 charts

The prospects of a continuation of the correction toward $75.50s are good once $72.24 highs are cleared. However, given the firm support put in on the previous test to the downside, there is an even probability of a bullish continuation that could eventually take out the trendline resistance and open risks of a grind to the upside beyond $77.00 in a long squeeze back towards $79.00.

-
01:33
Gold Price Forecast: XAU/USD defends US GDP inflicted loss, Fed inflation clues eyed
- Gold price remains pressured after a volatile day that ended with minor XAU/USD losses.
- XAU/USD drops as United States GDP details signal upbeat inflation component favoring US Dollar bulls.
- First Republic Bank inflicted market fears also exert downside pressure on the Gold price but tech earning prod XAU/USD downside.
- Federal Reserve’s favorite inflation gauge eyed after upbeat Core PCE Price figures.
Gold price (XAU/USD) fades late Thursday’s corrective bounce off the weekly low as it drops to $1,986 during the early hours of Friday’s Asian session. In doing so, the precious metal keeps the previous day’s downside bias intact, mainly propelled by the United States' growth, inflation and employment figures. However, the upbeat performance of equities, led by the tech giant’s earnings, joins the anxiety ahead of the Fed’s preferred inflation gauge to prod the XAU/USD traders.
Gold Price lures bears on United States GDP’s upbeat details
Gold price justifies upbeat inflation signals from the United States data ahead of the next week’s Federal Open Market Committee (FOMC) monetary policy meeting.
On Thursday, the first readings of the US Gross Domestic Product (GDP) for the first quarter (Q1) of 2023, also known as Advance readings, marked mixed outcomes. That said, the headline US GDP Annualized eased to 1.1% from 2.0% expected and 2.6% prior but the GDP Price Index inched higher to 4.0% on an annualized basis from 3.9% prior and 3.8% market consensus. Further, the Personal Consumption Expenditure (PCE) Prices for Q1 rallied to 4.2% from 3.7% in previous readouts whereas the Core PCE figures also crossed 4.8% market forecasts and 4.4% prior with 4.9% mark for the said period. It should be noted that a slump in the weekly Initial Jobless Claims also allowed the US Dollar to remain firmer.
Following the data, the US Dollar Index (DXY) managed to print a notable upside, of around 30 pips, before paring some of its gains but posting a daily positive close on Thursday. The same initially pushed the Gold price to prod the weekly low surrounding $1,984 before trimming the losses, retreating from $1,990 of late.
It should be noted, however, that the risk-on mood, mainly led by the strong United States technology giants’ earnings and mixed US data, allowed Wall Street to have the biggest daily gain in a week. The same also propelled US Treasury bond yields and put a floor under the Gold price. Though, US banking fallout fears regain momentum amid reports that the First Republic Bank (FRB) plans to sell half its loan book to fill a $100B deposit flight gap, which in turn weighs on the XAU/USD, together with the hawkish Federal Reserve bets.
Additionally weighing on the Gold price could be the likely deadlock over the US debt ceiling talks as most policymakers have contrasting views. Recently, House Speak Kevin McCarthy said, “I won't pass a clean debt-limit increase.”
Fed’s favorite inflation gauge, First Republic Bank-induced banking jitters eyed
Moving on, the Gold price is likely to remain pressured amid the recently hawkish Federal Reserve (Fed) concerns and the market’s geopolitical fears, as well as due to banking FRB-led banking woes.
However, the quote’s further downside hinges on the Fed’s preferred inflation data, namely the US Core Personal Consumption Expenditure (PCE) Price Index for March, expected to ease to 4.5% YoY versus 4.6% prior. Should the inflation clues arrive as softer, the Gold price may pare recent losses while justifying the risk-on mood. However, strong prints of the data can allow the Fed to delay policy pivot, which in turn can trigger the much-needed Gold price pullback.
Also read: US Core PCE Preview: Why this is a lose-lose situation for the US Dollar
Gold price technical analysis
Gold price appears well-set to defy a six-week-old bullish channel formation with sustained trading below the 21-day Simple Moving Average (SMA).
That said, bearish signals from the Moving Average Convergence and Divergence (MACD) indicator and a descending but not below 50 Relative Strength Index (RSI) line, placed at 14, add strength to the downside bias.
However, a sustained break of the $1,980 support comprising the stated channel’s bottom line becomes necessary for the Gold price to lure the bears. Even so, February’s high near $1,960 and the 50-day SMA surrounding $1,930 could check the bearish moves afterward.
It’s worth mentioning that an upward-sloping support line from early November 2022, close to $1,890 by the press time, appears the last defense of the XAU/USD buyers, a break of which could reverse the bullish trend established in the last six months.
On the contrary, Gold price recovery needs to provide a daily closing beyond the 21-day hurdle of $1,997, as well as mark successful trading beyond the $2,000 mark to convince bulls.
Though, multiple swings around $2,010 can challenge the XAU/USD buyers before preparing them for a bumpy ride towards the north which includes $2,030 and $2,050 initial levels before the likely reversal point around $2,060, comprising the previously mentioned channel’s top line.
Overall, Gold price losses upside momentum as the markets prepare for the Federal Reserve’s preferred inflation gauge, as well as next week’s Federal Open Market Committee (FOMC) monetary policy meeting.
Gold price: Daily chart
-28042023-638182387418606880.png)
Trend: Further downside expected
-
01:30
Stocks. Daily history for Thursday, April 27, 2023
Index Change, points Closed Change, % NIKKEI 225 41.21 28457.68 0.15 Hang Seng 83.01 19840.28 0.42 KOSPI 10.98 2495.81 0.44 ASX 200 -23.6 7292.7 -0.32 FTSE 100 -21.02 7831.58 -0.27 DAX 4.72 15800.45 0.03 CAC 40 17.18 7483.84 0.23 Dow Jones 524.29 33826.16 1.57 S&P 500 79.36 4135.35 1.96 NASDAQ Composite 287.89 12142.24 2.43 -
01:23
AUD/NZD eyes 1.0800 as RBA policy comes into picture
- AUD/NZD is aiming to recapture the 1.0800 resistance ahead of the RBA policy.
- Due to consistently declining Australian inflation, the RBA is expected to keep interest rates steady at 3.6%.
- The RBNZ would consider a pause in the policy-tightening process amid softening of NZ inflation.
The AUD/NZD pair has extended its recovery above 1.0787 in the Asian session. The cross is expected to continue its recovery towards the round-level resistance of 1.0800. The Australian Dollar is showing resilience despite rising expectations of an unchanged interest rate policy from the Reserve Bank of Australia (RBA).
Australian inflation, released this week, has allowed the RBA to keep its Official Cash Rate (OCR) unchanged. The Australian Bureau of Statistics (ABS) reported that the quarterly Consumer Price Index (CPI) (Q1) accelerated by 1.4% at a higher pace as expected by the market participants but lower than the former pace of 1.9%. Annual inflation softened to 7.0%, a little higher than the estimates of 6.9% but lower than the prior release of 7.8%.
The monthly CPI indicator which has already softened heavily from its peak of 8.4% recorded in December has decelerated further to 6.1% from the consensus of 6.6% and the previous release of 6.8%. Due to consistently declining Australian inflation, RBA Governor Philip Lowe will keep interest rates steady at 3.6%.
Going forward, Australia’s Producer Price Index (PPI) figures will be of utmost importance. A deceleration in prices of goods and services by producers at their factory gates will strengthen the odds of a neutral policy stance by the RBA.
The New Zealand Dollar will be guided by the employment data, which will release on Wednesday. Inflation in New Zealand has also decelerated and it would allow the Reserve Bank of New Zealand (RBNZ) to consider a pause in the policy-tightening process.
-
01:15
Currencies. Daily history for Thursday, April 27, 2023
Pare Closed Change, % AUDUSD 0.66271 0.33 EURJPY 147.577 0.04 EURUSD 1.10242 -0.15 GBPJPY 167.142 0.33 GBPUSD 1.24948 0.21 NZDUSD 0.61457 0.48 USDCAD 1.35905 -0.33 USDCHF 0.89387 0.34 USDJPY 133.895 0.19 -
01:04
NZD/USD Price Analysis: Eyes another battle with 200-DMA resistance near 0.6150
- NZD/USD picks up bids to reverse late Thursday’s pullback from 200-DMA.
- Bearish MACD signals, steady RSI keeps Kiwi pair sellers hopeful.
- Three-week-old descending trend line adds to the upside filters.
- Upward-sloping support line from November 2022 becomes crucial to watch NZD/USD bears.
NZD/USD regains upside momentum after two failed attempts to cross the 200-DMA hurdles, grinds higher around mid-0.6100s during early Friday.
Not only the repeated failures to cross the 200-DMA hurdle, around 0.6160 by the press time, but the bearish MACD signals also weigh on the Kiwi pair prices. That said, a steady RSI (14) line signals further grinding of the NZD/USD.
It’s worth noting that the quote’s break of the 200-DMA resistance surrounding 0.6160 isn’t an open welcome for the bulls as a downward-sloping resistance line from early April, close to 0.6180 could challenge the pair’s further upside.
Even if the NZD/USD price rallies beyond 0.6180, multiple levels marked during late March around the 0.6200 threshold can act as the last defense of the bears.
On the flip side, the recent bottom around the 0.6100 round figure can prod the NZD/USD bears before directing them to the key support line stretched from November 2022, around 0.6090 at the latest.
Should the NZD/USD pair offers a daily closing below 0.6090, the previous monthly low of near 0.6085 and the mid-November 2022 bottom of around 0.6065 may act as an extra filter towards the south before welcoming the bears with open hands.
NZD/USD: Daily chart
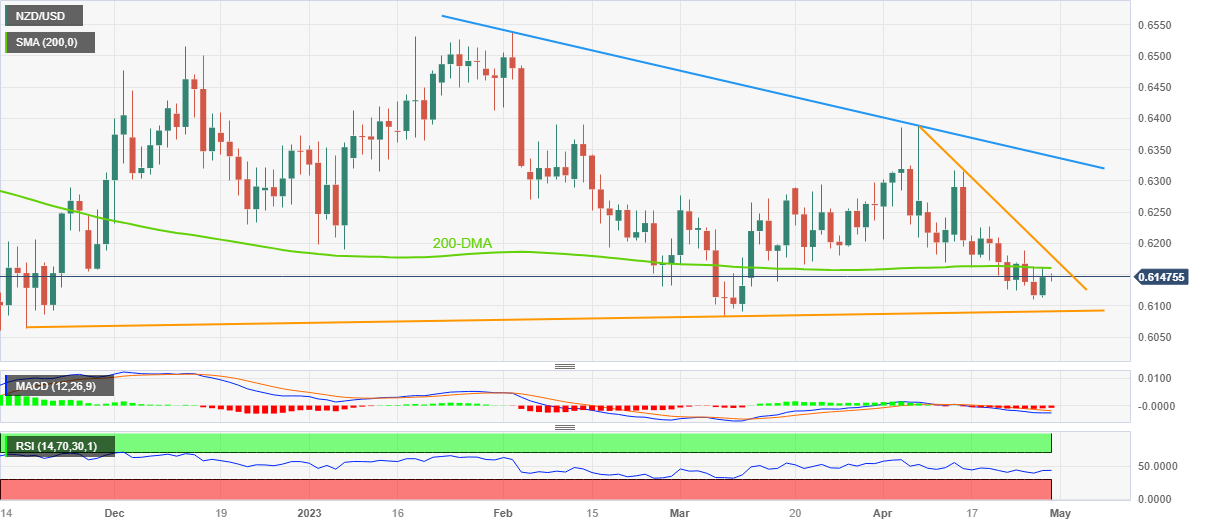
Trend: Further downside expected
-
01:00
Japan Retail Trade s.a (MoM) came in at 0.6%, above expectations (0.3%) in March
-
00:52
Japan Industrial Production (YoY) came in at -0.7% below forecasts (0.5%) in March
-
00:52
Japan Industrial Production (MoM) registered at 0.8%, below expectations (1.2%) in March
-
00:50
Japan Retail Trade (YoY) above forecasts (5.8%) in March: Actual (7.2%)
-
00:41
EUR/GBP finds buying interest near 0.8820 ahead of Eurozone GDP and German Inflation data
- EUR/GBP has shown some buying interest near 0.8820 as investors turn cautious ahead of Eurozone data.
- Eurozone GDP and German HICP carry significant importance as they will be the latest before ECB policy next week.
- An absence of UK’s inflation softening signals advocates more rate hikes from the ECB.
The EUR/GBP pair has sensed some attraction near 0.8820 after a perpendicular sell-off on Thursday. The cross is showing signs of recovery as investors are shifting their focus toward the Eurozone Gross Domestic Product (GDP) and German Harmonized Index of Consumer Prices (HICP) data.
The release of the preliminary Eurozone GDP and German HICP carries significant importance as they will be the latest economic data before the interest rate decision by the European Central Bank (ECB), which will be announced next week.
As per the consensus, preliminary Eurozone GDP has grown by 0.2% in the first quarter vs. a stagnant performance. On an annual basis, preliminary GDP is seen expanding by 1.4% at a slower pace than the 1.8% recorded earlier. ECB policymakers are confident that Eurozone will dodge the recession amid solid consumer spending due to labor shortage.
Meanwhile, preliminary monthly German inflation is seen accelerated by 0.8% vs. the 1.1% pace recorded in the prior month. This is going to provide some relief to ECB policymakers. However, more focus will be on core inflation figures as ECB policymakers believe that the core Consumer Price Index (CPI) has remained extremely stubborn.
Analysts at Danske Bank point see a 50bp rate hike more likely by ECB President Christine Lagarde, with no specific forward guidance but repeating a data-dependent approach to future policy decisions.
On the Pound Sterling front, the absence of inflation softening signals is strengthening the case for more rate hikes from the Bank of England (BoE). The street is anticipating a consecutive 25 bp rate hike from BoE Governor Andrew Bailey to 4.50% for its May monetary policy meeting.
-
00:34
USD/JPY eases below 134.00 on upbeat Japan inflation, Ueda’s first BoJ eyed
- USD/JPY fails to extend the previous day’s recovery moves, the first in three, after firmer Japan inflation data.
- Tokyo Consumer Price Index rose to 3.5% YoY in April, crosses market forecasts and prior.
- Risk-on mood, upbeat yields joined US Dollar rebound to previously favor Yen pair buyers.
- BoJ is expected to keep monetary policy unchanged, new Governor Ueda’s speech, economic forecasts will be the key.
USD/JPY drops to 133.80 during early Friday morning in Asia as strong Japan inflation data renews hawkish bets on the Bank of Japan’s (BoJ) future moves ahead of today’s monetary policy meeting.
That said, Tokyo Consumer Price Index (CPI) came in 3.5% YoY for April versus 2.6% expected and 3.3% prior whereas Tokyo CPI ex Food, Energy, known as the Core CPI, also increased to 3.8% YoY during the said month compared to 2.9% market forecasts and 3.4% previous readings. Further details of the publication revealed that Japan’s Unemployment Rate rose to 2.8% in March versus 2.5% expected and 2.6% prior whereas the Jobs/Applicants Ratio eased to 1.32 from 1.34.
With the upbeat inflation figures, the odds of witnessing a hawkish change in the Bank of Japan’s (BoJ) future communication become brighter, which in turn weighs on the USD/JPY of late, even if the BoJ is expected to keep the current monetary policy unchanged.
As a result, Friday’s BoJ becomes crucial for the USD/JPY pair traders as the aforementioned catalysts may allow the BoJ Governor Ueda to have entertainment during the first day of the BoJ ruling. That said, Ueda’s speech and economic forecasts for the Asian major will be crucial to watch for clear directions.
Also read: Bank of Japan Preview: New governor but old policy
It’s worth noting, however, that the risk-on mood, mainly led by the strong US tech earnings and mixed US data, allowed Wall Street to have the biggest daily gain in a week. The same also propelled US Treasury bond yields and favored the USD/JPY to snap a two-day downtrend on Thursday.
The first readings of the US Gross Domestic Product (GDP) for the first quarter (Q1) of 2023, also known as Advance readings, marked mixed outcomes. That said, the headline US GDP Annualized eased to 1.1% from 2.0% expected and 2.6% prior but the GDP Price Index inched higher to 4.0% on an annualized basis from 3.9% prior and 3.8% market consensus. Further, the Personal Consumption Expenditure (PCE) Prices for Q1 rallied to 4.2% from 3.7% in previous readouts whereas the Core PCE figures also crossed 4.8% market forecasts and 4.4% prior with 4.9% mark for the said period. It should be noted that a slump in the weekly Initial Jobless Claims also allowed the US Dollar to remain firmer.
Having witnessed the initial market reaction to the Tokyo inflation numbers, USD/JPY pair traders are likely to wait for the BoJ decision even if the Japanese central bank isn’t expected to alter the current monetary policy and has already ruled out hawkish moves in the near future. The reason could be linked to Kazuo Ueda’s first meeting as a Governor and the presence of the economic forecasts for release. On Thursday, Former BoJ Deputy Governor Masazumi Wakatabe mentioned that he will be surprised if the BoJ changes Yield Curve Control (YCC) on Friday. Previously, Bank of Japan´s (BoJ) Governor Kazuo Ueda spoke in the Japanese Parliament, known as Diet, while saying that the risk of a rise in inflation is driven by lost of market trust in Japan's finances low for now. The policymaker also tried to tame talks of inflation woes and indirectly suggests no change in this week’s monetary policy meeting, not even surrounding the YCC.
Following that, the US Core PCE Price Index for March, the Fed’s preferred inflation gauge, expected to ease to 4.5% YoY versus 4.6% prior, will be crucial to watch for the Yen pair traders, especially due to the next week’s Federal Open Market Committee (FOMC) monetary policy meeting.
Also read: US Core PCE Preview: Why this is a lose-lose situation for the US Dollar
Technical analysis
An impending bear cross on the MACD joins one-week-old descending resistance line, currently around 134.15, to restrict short-term USD/JPY upside.
-
00:34
Japan Tokyo CPI ex Food, Energy (YoY) came in at 3.8%, above forecasts (2.9%) in April
-
00:33
Japan Tokyo CPI ex Fresh Food (YoY) above expectations (3.2%) in April: Actual (3.5%)
-
00:30
Japan Tokyo Consumer Price Index (YoY) came in at 3.5%, above expectations (2.6%) in April
-
00:30
Japan Unemployment Rate came in at 2.8%, above forecasts (2.5%) in March
-
00:30
Japan Jobs / Applicants Ratio below expectations (1.34) in March: Actual (1.32)
-
00:17
GBP/JPY Price Analysis: Bulls to face 168.00, a price that capped previous rallies
- The GBP/JPY is upward biased after testing the 20-day EMA during the week, though it struggles at around 168.00.
- Oscillators showed mixed readings, though the RSI indicator aiming to 50 suggests a pullback in the near term.
The GBP/JPY snaps two days of gains and retreats modestly towards the 167.00 figure as the early stages of the Asian session are witnessed. The GBP/JPY exchange hands at around 167.16, diving 0.16%.
GBP/JPY Price Action
The daily graphic shows that the GBP/JPY remains upward biased, though it encountered a wall of resistance at around the 168.00 mark. Although it has printed back-to-back days of gains, failure to extend its rally past 168.00 keep downside risks looming. In addition, the Relative Strength Index (RSI) indicator continued to aim lower, suggesting that sellers are still hovering.
Meanwhile, the Rate of Change (RoC) shows buyers remain present, though a possible rally remains in play. If GBP/JPY buyers reclaim 168.00, that could exacerbate an upward move to December 13 swing high at 169.27. But first, there are some hurdles on the way north.
Firstly, the YTD is high at 167.97, nearby the 168.00 figure. A breach of the latter will expose the last December cycle high at 169.27.
Conversely, if GBP/JPY falls below 167.00, that would exacerbate a fall initially to the 20-day EMA at 165.85, followed by the latest week low of 165.42, before testing the 50-day EMA at 164.21.
GBP/JPY Daily Chart
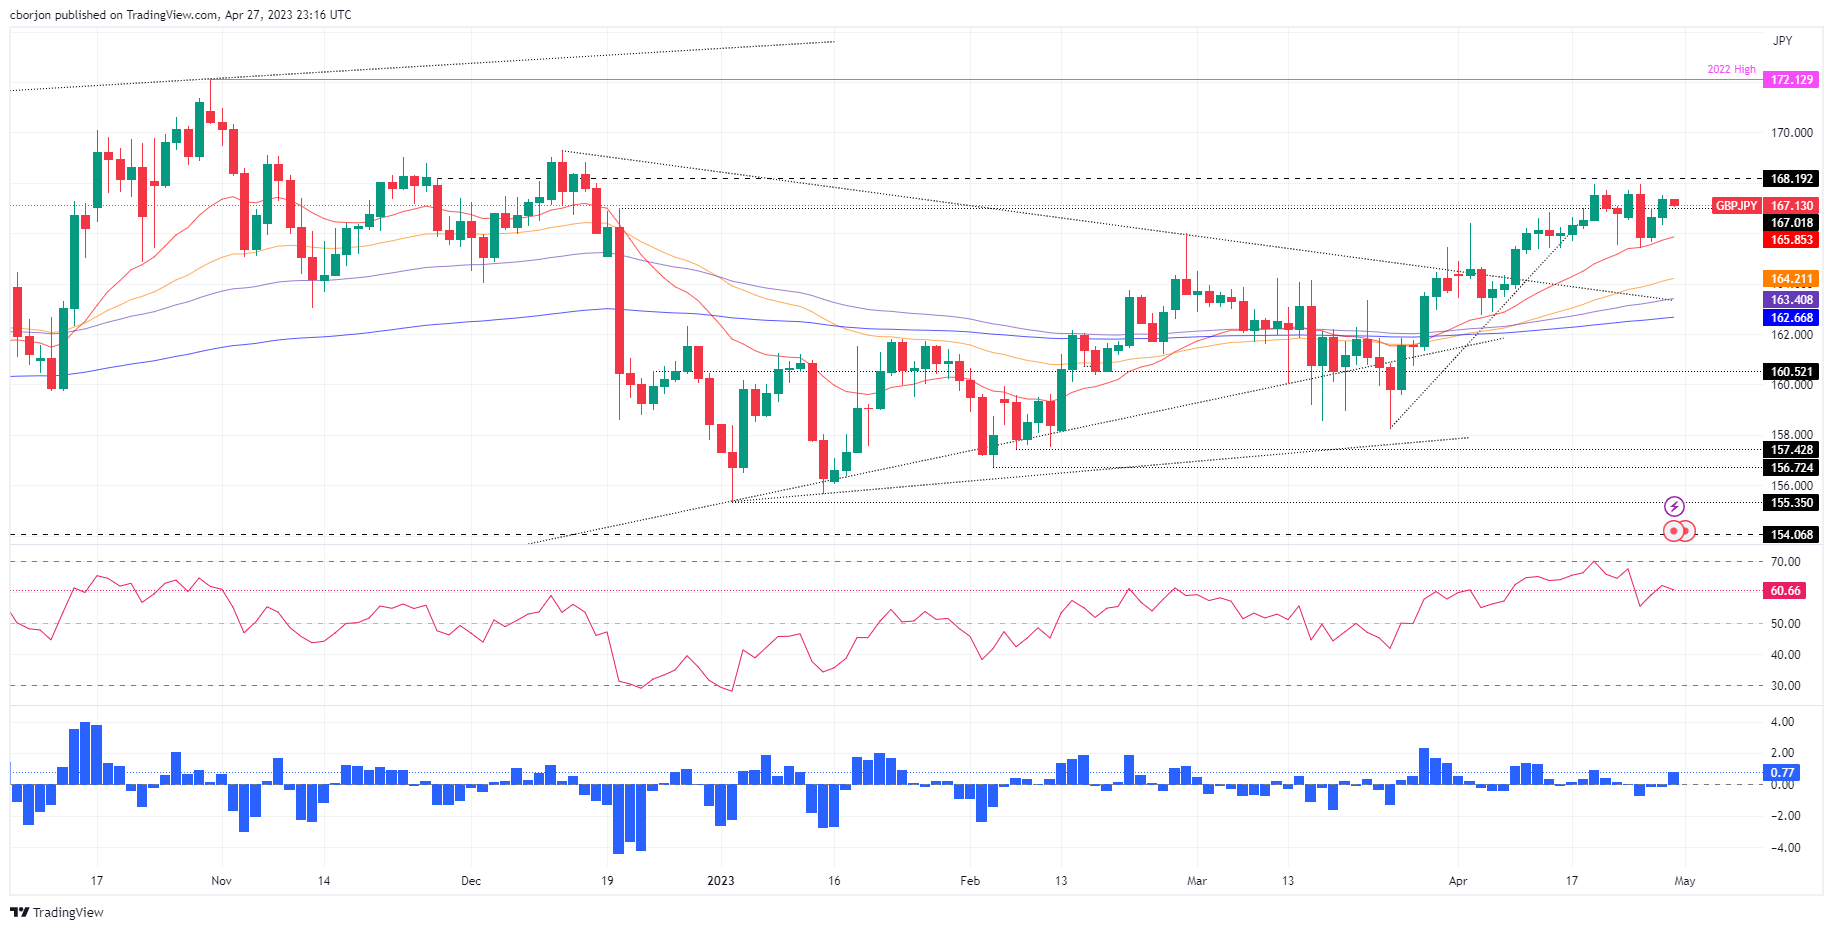
-
00:14
USD/CHF Price Analysis: Rebounds from 0.8930 amid a delay in US debt-ceiling increase proposal
- USD/CHF has sensed buying interest after a corrective move to near 0.8930.
- House Speaker McCarthy said the debt limit can't pass without dealing with the budget.
- S&P500 futures are showing minor losses after a super-bullish Thursday, indicating a caution amid overall upbeat market mood.
The USD/CHF pair has rebounded after a corrective move to near 0.8930 in the early Asian session. The Swiss Franc asset has sensed buying interest amid an absence of a clear path for an increase in the US debt-ceiling limit. House Speaker McCarthy said the debt limit can't pass without dealing with the budget, as reported by Bloomberg.
The US Dollar Index (DXY) has taken a sigh of relief amid a delay in the increase of the debt ceiling limit as an occurrence that will impact the long-term rating of the United States economy and will impact the US Dollar and domestic equities.
S&P500 futures are showing minor losses after a super-bullish Thursday, indicating a caution amid an overall upbeat market mood.
The Swiss Franc will remain in action ahead of the speech from Swiss National Bank (SNB) Chairman Thomas J. Jordan. SNB Jordan is expected to provide cues about the likely monetary policy action ahead.
USD/CHF has recovered sharply after a Double Bottom chart formation on a four-hour scale near 0.8863. The Swiss Franc asset is aiming to conquer the downward-sloping trendline plotted from March 08 high at 0.9439.
The major has climbed above the 20-and 50-period Exponential Moving Averages (EMAs) at 0.8921 and 0.8935 respectively, indicating solid short-term upside bias.
Meanwhile, the Relative Strength Index (RSI) (14) has stepped above 60.00. Sustainability above the same will activate the bullish momentum.
Should the asset decisively breaks above the 23.6% Fibo retracement around 0.9000, US Dollar bulls will drive the asset towards April 07 low at 0.9034 followed by 38.6% Fibo retracement plotted at 0.9082.
Alternatively, a downside move below April 17 low at 0.8922 will drag the asset toward April 13 low at 0.8860. A slippage below the latter will expose the asset to the round-level support at 0.8800.
USD/CHF four-hour chart
-638182339706885215.png)
-
00:10
US Dollar Index: DXY bulls defend US GDP led gains near 101.50 ahead of Fed’s preferred inflation
- US Dollar Index remains sidelined after a volatile day that ended with mild gains.
- US Real GDP came in softer for Q1 but details were impressive enough to lure Fed hawks.
- Challenges to sentiment from First Republic Bank, looming US debt ceiling talks also put a floor under DXY price.
- US Core PCE Price Index for March will be crucial as risk-on mood prod US Dollar bulls before FOMC.
US Dollar Index (DXY) steadies around mid-101.00s amid early Friday, after an active day that pleased buyers before paring some gains due to the US data releases and a cautious mood ahead of another key release.
Also challenging the greenback’s gauge versus the six major currencies is the recent improvement in the market sentiment mainly due to the upbeat performance of equities led by technology companies’ earnings. That said, the DXY jumped nearly 40 pips on the US GDP and PCE data releases before trimming half of the gains afterward. Even so, the US Dollar Index ended Thursday on the positive side.
The first readings of the US Gross Domestic Product (GDP) for the first quarter (Q1) of 2023, also known as Advance readings, marked mixed outcomes. That said, the headline US GDP Annualized eased to 1.1% from 2.0% expected and 2.6% prior but the GDP Price Index inched higher to 4.0% on an annualized basis from 3.9% prior and 3.8% market consensus. Further, the Personal Consumption Expenditure (PCE) Prices for Q1 rallied to 4.2% from 3.7% in previous readouts whereas the Core PCE figures also crossed 4.8% market forecasts and 4.4% prior with 4.9% mark for the said period. It should be noted that a slump in the weekly Initial Jobless Claims also allowed the US Dollar to remain firmer.
With this, a stronger-than-expected increase in the inflation component of the GDP renewed hawkish concerns about the Federal Reserve (Fed) and helped the US Dollar to pick up bids after the release.
Apart from the data, the banking fallout risks also favored the DXY bulls previously but the upbeat earnings from Meta Platforms, the parent company of Facebook, Instagram and Whatsapp, allowed the market sentiment to improve and weighed on the US Dollar afterward. That said, US banking fallout fears regain momentum amid reports that the First Republic Bank (FRB) plans to sell half its loan book to fill a $100B deposit flight gap.
Elsewhere, US policymakers are at loggerheads about the US debt ceiling extension even after passing the first step to kick-start the negotiations. Recently, House Speak Kevin McCarthy said, “I won't pass a clean debt-limit increase.”
Against this backdrop, Wall Street closed with notable gains and marked the biggest positive day of the week while yields also rose.
Moving on, the US Core PCE Price Index for March, the Fed’s preferred inflation gauge, expected to ease to 4.5% YoY versus 4.6% prior, will be important ahead of the next week’s monetary policy meeting of the US central bank, namely the Federal Reserve (Fed).
Also read: US Core PCE Preview: Why this is a lose-lose situation for the US Dollar
Technical analysis
A three-week-old symmetrical triangle, currently between 101.00 and 101.75, restricts short-term US Dollar Index (DXY) moves.
-
00:01
South Korea Industrial Output (YoY) came in at -7.6%, above expectations (-9.8%) in March
-
00:00
South Korea Service Sector Output above expectations (-0.3%) in March: Actual (0.2%)
-
00:00
South Korea Industrial Output Growth above expectations (1.3%) in March: Actual (5.1%)
-