Notícias do Mercado
-
23:58
RBA to officially drop its YCC policy on November 2 – Goldman Sachs
Goldman Sachs (GS) came out with its analytics ahead of the key Reserve Bank of Australia (RBA) monetary policy meeting, citing the Aussie central bank’s earlier decision to not defend the yield target.
The US bank expects the RBA to officially drop its Yield Curve Control (YCC) policy on November 02. The same hints at, “The risks around the meeting appear skewed in a hawkish direction as the Bank has limited options to forcefully push back against market pricing," per the GS.
Goldman also cites the Aussie core inflation below the 2.5% target and wage growth more subdued than the RBA's 3-4% criteria for liftoff to expect that, “RBA to remain a laggard in the medium-run in terms of liftoff relative to other G10 central banks.”
The same joins the bank’s bullish view on oil and bearish expectations for iron to mention that the AUD/CAD downside could become an attractive opportunity once the tactical risk event has passed.
Also read: AUD/USD retreats towards 0.7500 ahead of RBA
-
23:52
Japan Monetary Base (YoY) below expectations (10.4%) in October: Actual (9.9%)
-
23:50
Gold Price Forecast: XAU/USD battles previous support near $1,800 amid sluggish markets
- Gold struggles to extend Monday’s rebound near short-term resistance line.
- Market sentiment dwindles ahead of the key central bank events.
- Inflation concerns remain elevated despite recently mixed clues, Sino-American trade deal, US stimulus favored buyers of late.
- Gold Price Forecast: Cautious optimism underpins the metal
Gold (XAU/USD) remains shy of $1,800 despite Monday’s rebound, hovering around $1,790 amid early Tuesday’s Asian session. The yellow metal cheered recovery in the market’s mood and softer US dollar to consolidate Friday’s losses the previous day. However, cautious sentiment during the run-up to the key central bank meetings seems to challenge the metal’s immediate moves.
US President Joe Biden’s commitment to getting the multi-billion dollars worth of economic stimulus through the Senate this week underpinned the traders’ optimism earlier in the week.
Following that, comments from US Treasury Secretary Janet Yellen added to the market’s mild risk-on mood. The ex-Fed Boss Yellen hinted that the US-China Phase One trade deal and reciprocal easing of tariffs may tame inflation. The same highlights optimism towards reaching the much-awaited trade agreement among the world’s top two economies. Also favoring the risk-on mood could be US Treasury Secretary Yellen’s statements like, “I don’t think US economy is overheating.”
Additionally, a fourth consecutive daily fall in the US inflation expectations, per the 10-year breakeven inflation rate per the St. Louis Federal Reserve (FRED) data, also tamed tapering tantrums and helped gold buyers too. It's worth noting that the inflation gauge jumped to the highest since 2006 before portraying the latest pullback. On the same line was the US PMI data as the ISM Manufacturing PMI eased below the previous readings in June whereas the Markit PMIs also dropped past 59.2 market consensus and preliminary forecast for October.
However, the Fed Clevland’s version of the median PCE Inflation rate rockets higher of late, allowing the US Federal Reserve (Fed) hawks to remain hopeful.
That being said, firmer Wall Street benchmarks around the record tops and sluggish US Treasury yields printed positive mood on Monday but the recently downbeat S&P 500 Futures portray cautious sentiment and probe the gold buyers.
Moving on, inflation and central bankers remain hot topics for this week while headlines concerning the US-China trade deal and infrastructure spending package may offer additional filters to direct short-term gold moves.
Technical analysis
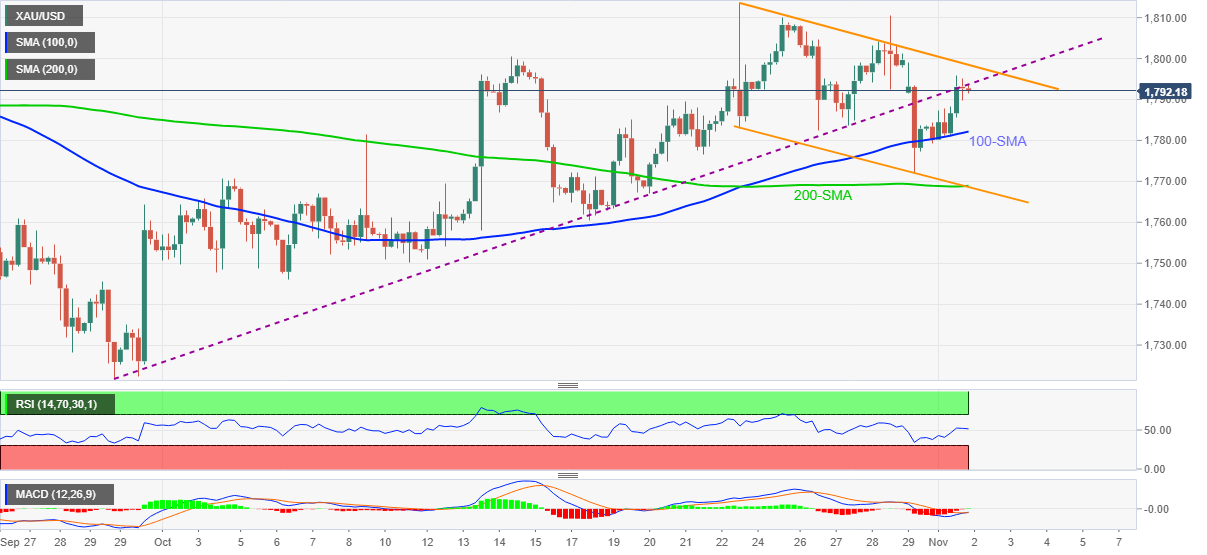
Having reversed Friday’s monthly support line break on Monday, gold pokes the support-turned-resistance, also keeping the bounce off 100-SMA, inside a weekly descending trend channel of late.
Given the firmer RSI conditions, not overbought, coupled with the MACD line teasing buyers, the upside momentum seems ready to overcome the bearish chart pattern with an upside break of $1,800 hurdle.
Following that, October’s peak near $1,813 will test the gold buyers ahead of fueling the run-up towards the key $1,834 resistance level, comprising tops marked during July and September.
Meanwhile, 100-SMA surrounding $1,781 restricts pullback moves before the channel’s support and 200-SMA offers a tough nut to crack for the gold sellers around $1,768.
During the quote’s weakness past $1,768, multiple supports near $1,745 will test the gold bears before directing them to the previous month’s bottom of $1,721.
Gold: Four-hour chart
Trend: Further recovery expected
-
23:32
AUD/NZD hovers around 1.0474 ahead of the RBA monetary policy statement
- AUD/NZD pair is subdued ahead of the RBA monetary policy statement.
- AUD/NZD: RBA to keep rates unchanged and abandon Yield Curve Control.
- RBA: Would the central bank drop the calendar reference, or stay put with it?
The AUD/NZD slides as the Asian session begins, down 0.10%, trading at 1.0476 at the time of writing. Later on Tuesday, the Reserve Bank of Australia will unveil its monetary policy statement. Market participants are expecting no change at the cash rate. Regarding forward guidance, most economists expect a drop of the calendar reference, as expressed in the last monetary policy meeting when the bank told conditions for a hike rate “will not be met until 2024.”
According to ANZ analysts, in a note to clients, said: “The problem with dropping the calendar reference is that it will likely encourage the market to solidify its expectation that rate hikes will happen in the early part of 2022.“ Concerning the Yield Curve Control, ANZ expects that the RBA would not use additional Yield Curve Control.
The base case scenario for the RBA is to hold rates, abandon the Yield Curve Control (YCC), and drop the calendar reference in the forward guidance. In the abovementioned outcome, the AUD/NZD pair would be under intense buying pressure, which would target 1.0500, followed by the 100-day moving average at 1.0520.
On the flip side, if the RBA holds rates, drop the Yield Curve Contro (YCC) but sticks to the calendar reference of 2024, the AUD/NZD could tumble towards 1.0400.
AUD/NZD Price Forecast: Technical outlook
Daily chart
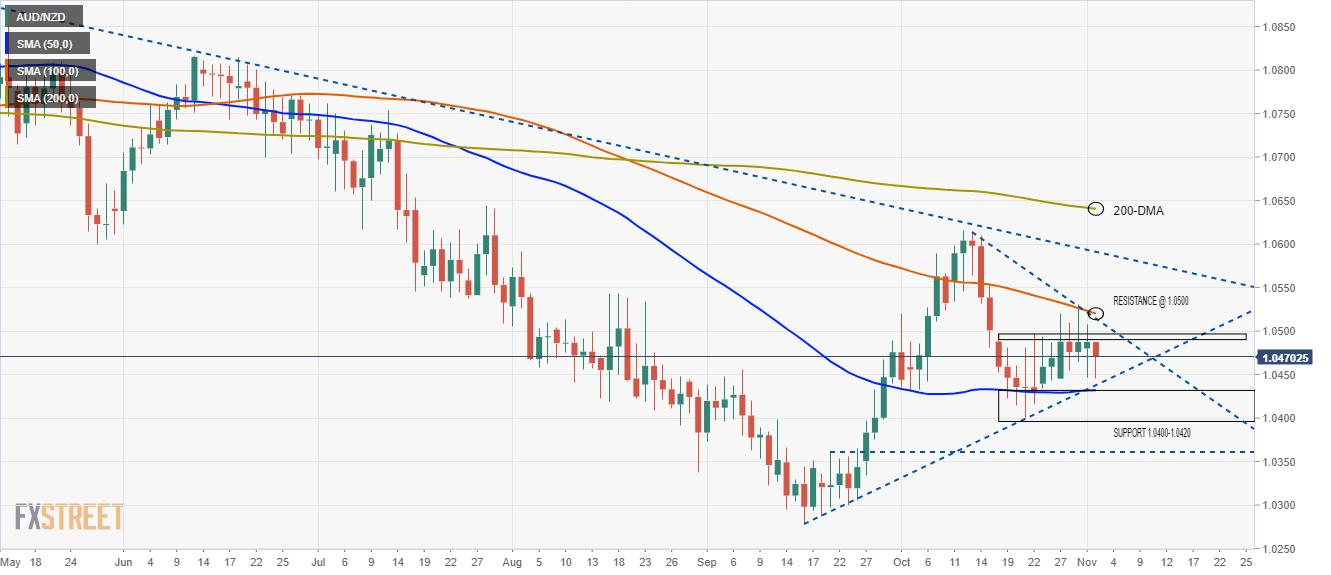
The AUD/NZD has a downward bias, as shown by the daily moving averages (DMA’s) above the spot price, except for the 50-DMA lying at 1.0423. The Australian dollar recovered some ground against the kiwi, supported by a rising slope trendline that travels from the September 16 low towards the October 22 low, which Is support.
For NZD buyers to accelerate the downtrend, they will need a daily close below the 1.0400 level. In that outcome, the first support level would be the September 21 resistance now turned support, at 1.0361.
On the flip side, AUD buyers will need to reclaim the 100-DMA at 1.05200. A breach of the latter would exert upward pressure on the AUD/NZD, leaving the 200-DMA exposed as the first resistance level at 1.0640.
Nevertheless, the pair has not been trading solely on technicals. Recent developments between both central banks have kept both currencies fighting, within a 1.0400 – 1.0500 range, without any clear trend, but the NZD has the upper hand, as it lifted interest rates, leaving the AUD trailing.
-
23:27
USD/CAD consolidates losses below 1.2400 as oil retreats to $83.00
- USD/CAD picks up bids to recover Monday’s losses, stays around four-month low since October 15.
- WTI eases amid cautious market sentiment ahead of the key central bank events.
- Inflation expectations trouble Fed hawks, stimulus hopes, US/Canada data came out mixed for October.
- Canada Building Permits, API Weekly Crude Oil Stock will decorate calendar but pre-Fed mood restricts short-term moves.
USD/CAD licks the week-start wounds near 1.2375 amid a quiet Asian session on Tuesday. The Loonie pair benefited from the broad US dollar weakness the previous day before the latest shift in the risk appetite questioned the recovery move.
The US Dollar Index (DXY) pared the heaviest daily jump since June on Monday as market sentiment improved amid hopes of further stimulus and easy US PMI data, not to forget the US-China headlines. However, fears ahead of the key central bank events underpin the US dollar’s safe-haven demand and recall the USD/CAD buyers of late.
US President Joe Biden remains hopeful of passing the infrastructure spending plan this week and favored the market’s mood even as Republicans showed refrain from altering their demands. On the same line were comments from US Treasury Secretary Janet Yellen concerning the US-China Phase One trade deal.
The diplomat hinted reciprocal easing of tariffs may tame the inflation while also saying, “I don’t think US economy is overheating.” The US inflation expectations, as the 10-year breakeven inflation rate per the St. Louis Federal Reserve (FRED) data, justify Yellen’s comments by dropping for the fourth consecutive day from levels last seen during August 2006 by the end of Monday’s North American trading. However, the Fed Clevland’s version of the median PCE Inflation rate rockets higher and keeps the Fed tapering woes alive.
Elsewhere, US ISM Manufacturing PMI eased below the previous readings in June whereas the Markit PMIs also dropped past 59.2 market consensus and preliminary forecast for October. On the other hand, Canada’s Markit Manufacturing PMI crossed 57.0 previous reading and 57.2 expectations to 57.7 for October.
Against this backdrop, S&P 500 Futures struggle to extend Wall Street gains and the US 10-year Treasury yields also wobble around 1.56% after a sluggish start to the week.
Given the cautious mood in the market ahead of the RBA, Fed and the BOE meetings, USD/CAD traders may attention to Canada’s main export item WTI crude oil for fresh impulse. The black gold recently eased to $83.00 amid fears emanating from the monetary policy decisions and the OPEC+ verdict. For an immediate basis, weekly inventory data from the industry source, namely the American Petroleum Institute (API), prior 2.318M, will entertain the oil traders, as well as direct immediate USD/CAD moves.
Technical analysis
Multiple levels marked during July restrict immediate USD/CAD between 1.2300 and 1.2425-30. Also acting as an upside filter is September’s bottom near 1.2495 whereas a clear downside break of 1.2300 will direct the bears toward the mid-May peak near 1.2200.
-
23:11
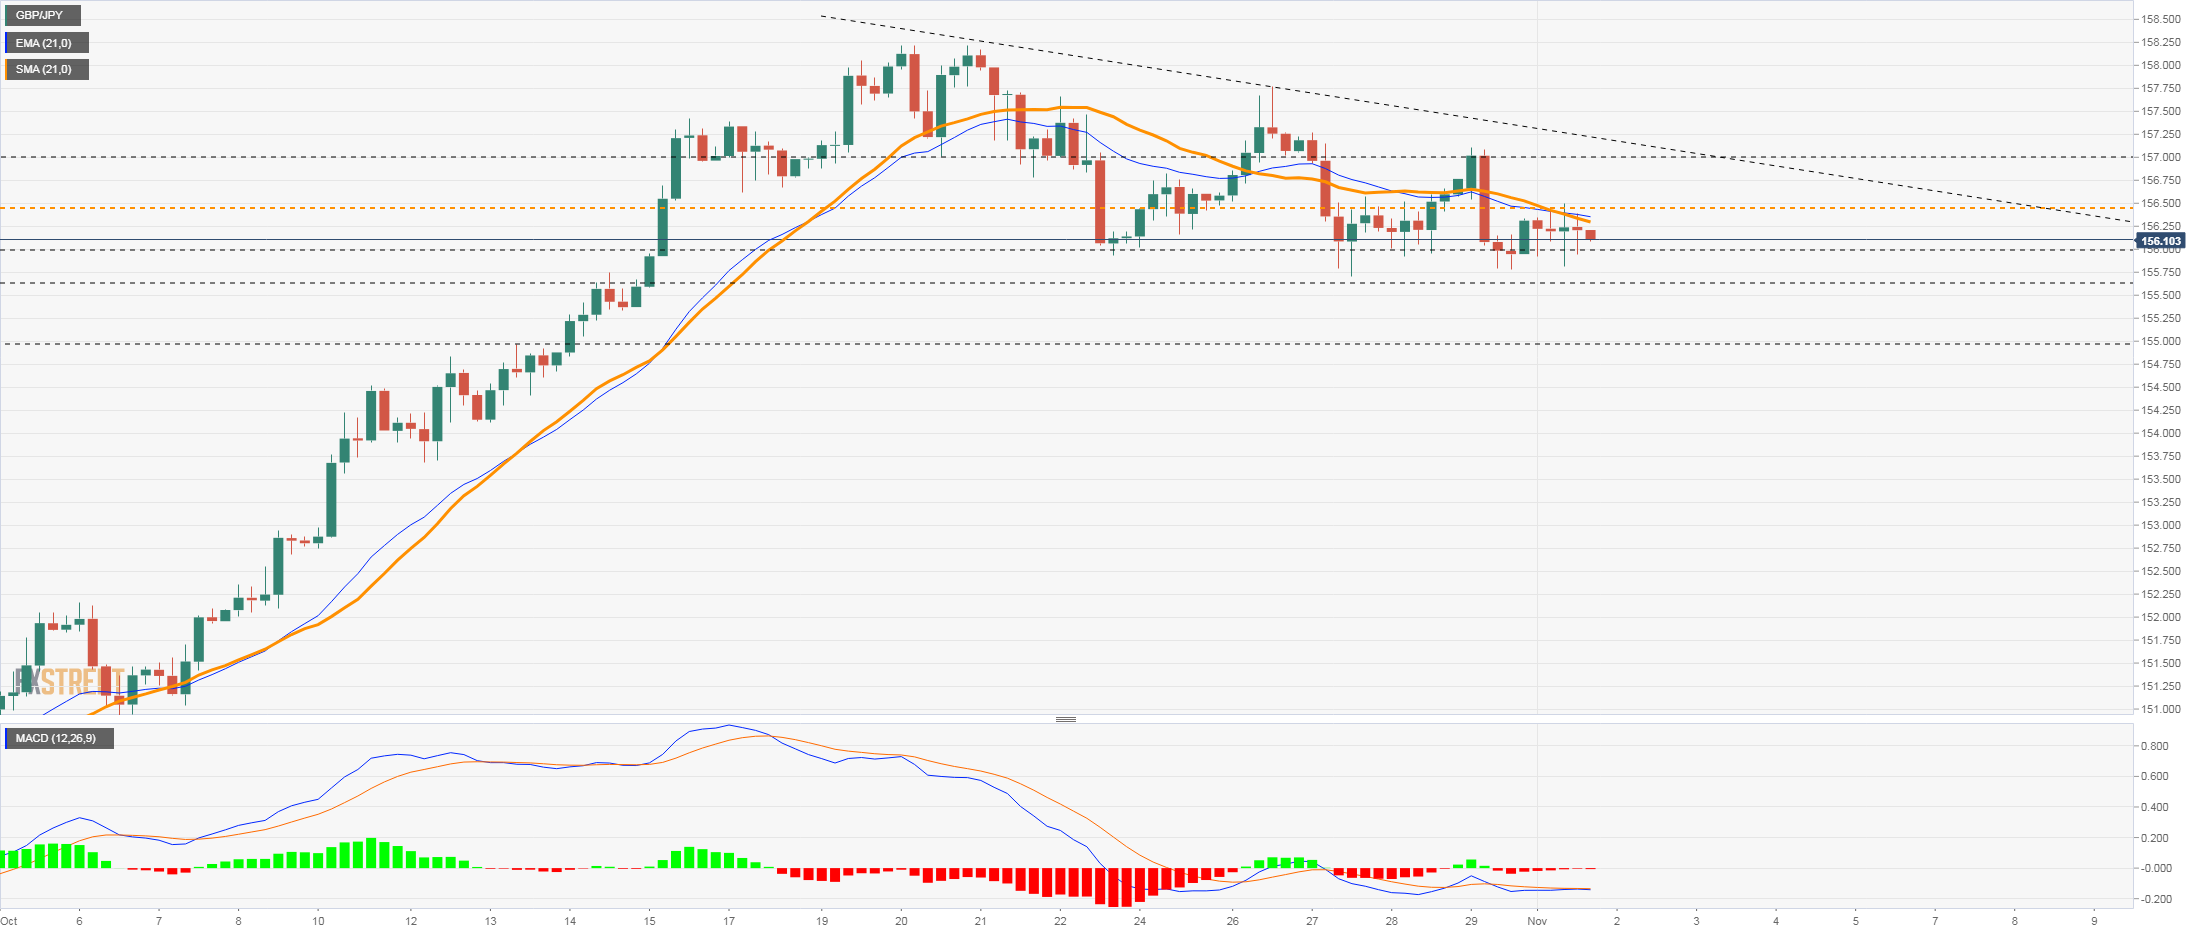
GBP/JPY Price Analysis: Bears seeking break of 155.70
- GBP/JPY is on the verge of a downside continuation as per the hourly chart.
- The bears will be on the lookout for a break of 155.70.
GBP/JPY is correcting the latest bearish impulse on an hourly basis and the following illustrates the prospects of a downside continuation.
GBP/JPY H1 chart
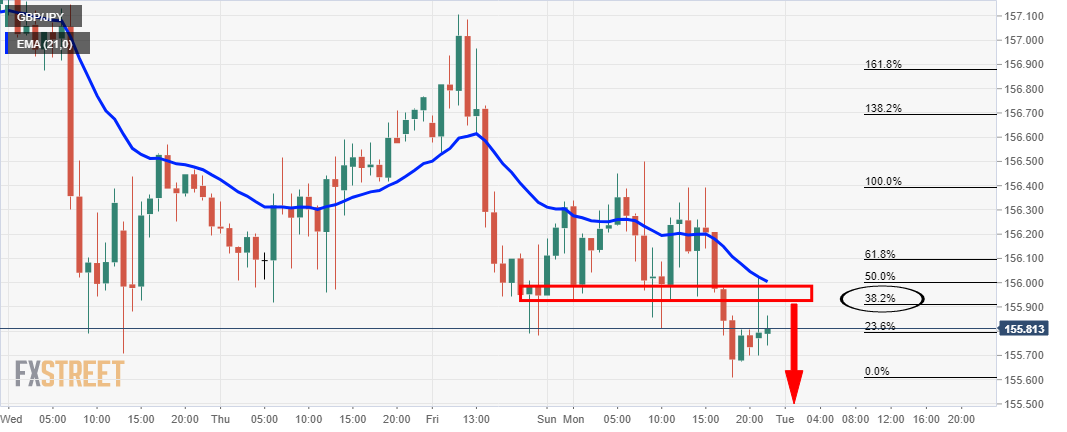
The above chart illustrates the recent hourly breakout below the hourly structure and a retest of the old support that would now be expected to act as resistance. The structure has a confluence of the 21-EMA and a 38.2% Fibonacci retracement level that reinforces the prospects of firm resistance.
GBP/JPY 15m chart
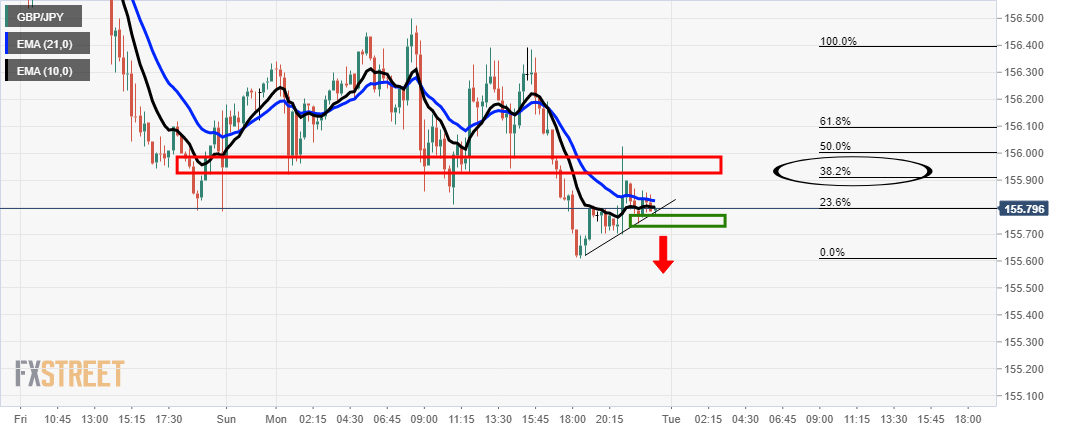
Meanwhile, from a 15-min perspective, the price will need to break below 155.70 support structure if there is going to be a higher probability of a downside continuation below the dynamic trendline support.
-
23:00
South Korea Consumer Price Index Growth (YoY) came in at 3.2%, above forecasts (3.15%) in October
-
23:00
South Korea Consumer Price Index Growth (MoM) meets forecasts (0.1%) in October
-
22:56
EUR/USD Price Analysis: Rebound remains elusive below monthly resistance
- EUR/USD faded bounce off three-week low, sidelined of late.
- 100-SMA, 200 SMA guard immediate upside ahead of the key short-term resistance line.
- One-month-old horizontal area restricts nearby downside ahead of yearly low.
- Sluggish RSI, key resistances challenge recovery moves, bears need conviction.
EUR/USD fails to extend the week-start rebound past 1.1600 during the initial Asian session on Tuesday.
The major currency pair’s corrective pullback from a three-week low crossed a horizontal area comprising multiple levels marked since September-end. However, 100-SMA recently challenged the EUR/USD recovery.
Given the steady RSI and a lack of momentum strength to cross the immediate key SMA, the pair’s recovery moves are likely to be reversed. Though, sellers await a clear downside break of the stated horizontal support zone near 1.1580-85 for fresh entry.
Following that, the yearly low around 1.1525, also the lowest since July 2020, will question the quote’s further weakness ahead of directing the bears towards the March 2020 peak of 1.1496.
Meanwhile, EUR/USD run-up beyond the immediate hurdle of 100-SMA, around 1.1610 by the press time, needs to cross the 200-SMA level surrounding 1.1635 to aim for the ascending trend line from early October, close to 1.1695.
In a case where the pair rise past 1.1695, also successfully pierce the 1.1700 threshold, late September highs near 1.1755 will be in focus.
EUR/USD: Four-hour chart
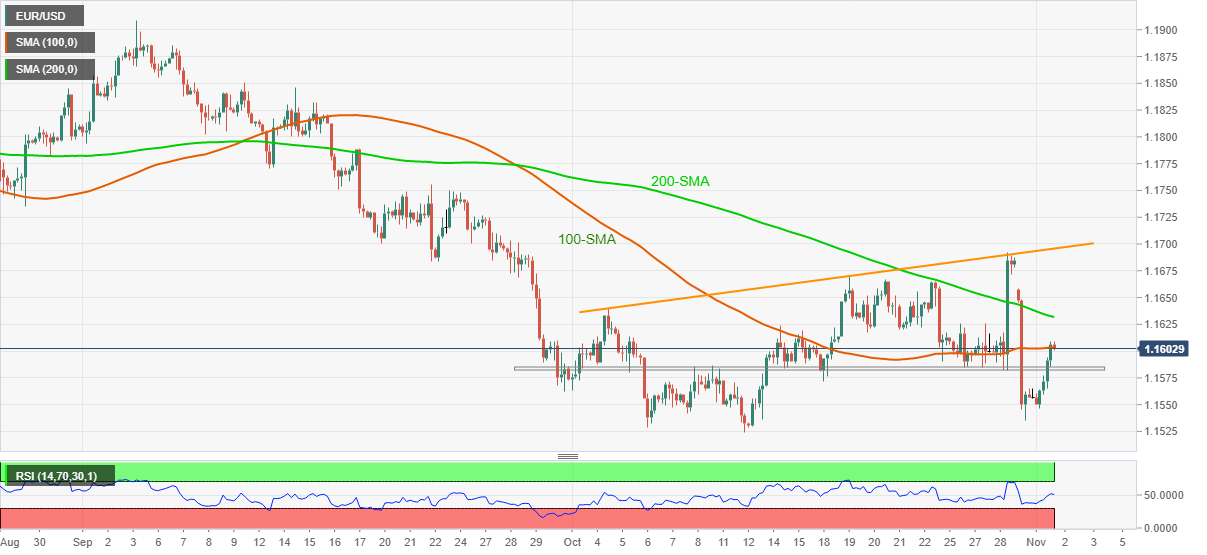
Trend: Bearish
-
22:38
AUD/USD retreats towards 0.7500 ahead of RBA
- AUD/USD consolidates the week-start gains around the multi-month high.
- Mixed clues, cautious optimism ahead of the key central bank events favored Aussie buyers of late.
- RBA’s forward guidance eyed amid hopes of dumping yield curve control, no rate change expected.
AUD/USD struggles to extend the previous day’s rebound from a one-week low, easing to 0.7515 amid the initial Asian session on the key Tuesday. In doing so, the Aussie pair seems to bear the burden of the pre-RBA mood amid cautious optimism in the market.
Having initially dropped on China’s downbeat official PMIs, AUD/USD benefited from firmer Caixin Manufacturing PMI from Beijing and mixed data at home during early Monday. Following that, optimism over the Sino-American trade deal and softer-than-previous US ISM Manufacturing PMI helped the AUD/USD buyers to keep the bounce off a one-week low. However, the cautious mood ahead of the Reserve Bank of Australia (RBA) monetary policy meeting challenges the quote of late.
Although China’s official PMIs portrayed the contraction in October activities, Caixin Manufacturing PMI offered a positive surprise and favored the AUD/USD prices. On the same line could be the US ISM Manufacturing PMI for October that eased below 61.1 prior readouts to 60.8, beating 60.6 market forecasts. The softer US data and firmer China figures also join mixed housing market data at home and Australia’s strong Commonwealth Bank PMI for October to favor AUD/USD recovery moves.
Additionally, comments from US Treasury Secretary Janet Yellen added to the market’s mild risk-on mood, The diplomat hinted that the US-China Phase One trade deal and reciprocal easing of tariffs may tame the inflation. The same highlights optimism towards reaching the much-awaited trade agreement among the world’s top two economies. Also favoring the risk-on mood could be US Treasury Secretary Yellen’s statements like, “I don’t think US economy is overheating.” Her comments on Inflation could be justified by the US inflation expectations as the 10-year breakeven inflation rate per the St. Louis Federal Reserve (FRED) data, dropped for the fourth consecutive day from levels last seen during August 2006 by the end of Monday’s North American trading. The same hints at the Fed’s cautious action during Wednesday’s meeting and favors the AUD/USD buyers.
It’s worth noting that the recent challenges to the global economic growth hints at a bit slower dialing back of the easy money policies across the globe and hence keep the AUD/USD bulls ahead of the key central bank meetings, including the Fed and Bank of England (BOE) decisions, on Wednesday and Thursday respectively. Furthermore, Australia’s opening up of the international borders and positive chatters over the US stimulus are some extra positive catalysts for the pair.
Amid these plays, US stocks remain remained firm around the record top whereas the US 10-year Treasury yields portrayed a sluggish start to the week. Further, the US Dollar Index (DXY) pared Friday’s heavy gains on Monday and helped the Aussie buyers too.
Looking forward, the AUD/USD traders will pay close attention to the RBA moves as the Aussie central bank indirectly has stopped yield curve controls and may formally accept the same, backed by the recent jump in the Aussie inflation data. However, RBA Government Philip Lowe earlier highlighted the need for the wage prices to remain firmer to push the central bank towards faster rate hikes, which in turn makes RBA forward guidance the key.
Read: Reserve Bank of Australia Preview: Reality check for Australian policymakers
Technical analysis
Having defied a downside break to the ascending support line from September 29, AUD/USD bulls struggle around the stated trend line near 0.7515 by the press time. Given the bullish MACD and firmer RSI, not overbought, the quote is expected to stay firmer, inching closer to the 200-DMA hurdle surrounding 0.7560. However, a three-month-old trend line resistance near 0.7565 will challenge any further advances amid nearly overbought RSI conditions. Meanwhile, the buyers’ inability to carry the rebound from a short-term key support line, around 0.7515 by the press time, will seek validation of a bearish impulse from August month’s peak of 0.7478 and the latest swing low close to 0.7450.
-
22:22
France's Beaune: Received first signals from UK authorities to speed up Brexit talks
Amid the escalating EU-UK tussle over Brexit, the French Europe Minister Clement Beaune said, per Reuters, “France received first signals from UK authorities to speed up talks, an answer to latest french proposals is expected by Wednesday.”
Additional comments
Has invited UK counterpart David Frost to Paris on Thursday for deeper talks about implementing EU-UK agreements.
That sanctions announced by France will not be applied before that meeting and investigation of new UK responses to fishing licences.
In response, the UK government spokesperson said, “We welcome the French government's announcement.”
The official announcement from No.10 adds, “We have said we are ready to continue intensive discussions on fisheries.”
Furthermore, the news also mentions the UK government saying, “We welcome France saying that in-depth discussions are needed to resolve a range of difficulties in UK-EU relationship.”
“Brexit minister Frost accepted invitation and looks forward to discussions in France on Thursday,” hints the UK Government spokesperson.
FX implications
GBP/USD traders seem to have failed to respond to a welcome change on the Brexit issue as the quote seesaws around 1.3660, around a three-week low by the press time early Tuesday morning in Asia.
-
21:45
New Zealand Building Permits s.a. (MoM) down to -1.9% in September from previous 3.8%
-
21:45
New Zealand: Building Permits, m/m, September -1.9%
-
21:43
NZD/USD keeps nearby trading range around 0.7200 on RBNZ’s Orr, cautious optimism
- NZD/USD grinds higher inside a 70-pips trading range following a positive week-start.
- RBNZ’s Orr expects housing prices to ease over medium term.
- Market sentiment improves amid hopes of stimulus, softer US ISM PMI.
- No major data at home keep Kiwi at the mercy of overseas catalysts, RBA will be the key.
NZD/USD hovers around the upper end of the short-term range, teasing 0.7190 figures at the start of Tuesday’s Asian session. The Kiwi pair recently reacted to comments from Reserve Bank of New Zealand (RBNZ) Governor Adrian Orr while hopes of US stimulus, a bit softer US ISM Manufacturing PMI and US-China headlines also favored the latest positive performance.
While accepting the fact that New Zealand’s (NZ) housing market challenges monetary and financial stability, RBNZ’s Orr also said, per Reuters, “Expect to see an easing in house prices over the medium term.”
Read: RBNZ’s Orr: Unsustainable level of house prices poses monetary, financial stability challenges
Given the RBNZ’s already-announced rate hike and the likely reduction in the US-NZ carry due to the Fed’s anticipated tighter monetary policy going forward, such comments from the RBNZ leader probe the NZD/USD bulls. The same fundamental logic could be applied to NZ’s neighbor and close trading partner Australia which inches closer to a rate hike amid firmer inflation, highlighting today’s Reserve Bank of Australia (RBA) monetary policy meeting. However, NZ is still the first major central bank to announce the rate lift and buyers remain hopeful of further advances ahead of any strong clues from either the RBA or the Fed concerning rate hikes, which is likely far from here.
Elsewhere, the US ISM Manufacturing PMI for October eased below 61.1 prior readouts to 60.8, beating 60.6 market forecasts. While the easing of the US private manufacturing gauge tests the Fed tapering woes, the activity figures are comfortably higher during the last four months and hence favor Fed hawks, also challenging the NZD/USD buyers.
Further, US Treasury Secretary Janet Yellen hints that the US-China Phase One trade deal and reciprocal easing of tariffs may tame the inflation. The same highlights optimism towards reaching the much-awaited trade agreement among the world’s top two economies. Also favoring the risk-on mood could be US Treasury Secretary Yellen’s comments stating, “I don’t think US economy is overheating.”
Additionally, an easing in the US inflation expectations, as measured by the 10-year breakeven inflation rate per the St. Louis Federal Reserve (FRED) data, dropped for the fourth consecutive day from levels last seen during August 2006 by the end of Monday’s North American trading. The same hints at the Fed’s cautious action during Wednesday’s meeting and favor the NZD/USD buyers.
Alternatively, the US and the European Union (EU) joined hands to overcome the steel and aluminum tariffs to battle China over its high productions, suggesting the Sino-American rift.
Above all, the market’s wait-and-watch approach ahead of the key central bank meetings allowed the US Dollar Index (DXY) to consolidate Friday’s heavy gains, the biggest since the mid-June and helped the NZD/USD to witness a positive start to the week.
Looking forward, there are no major data/events at home and hence the quote is likely to rely on the RBA verdict for fresh impulse. Given the firmer Aussie inflation and the RBA’s pause on yield curve control, forward guidance will be the key to watch.
Technical analysis
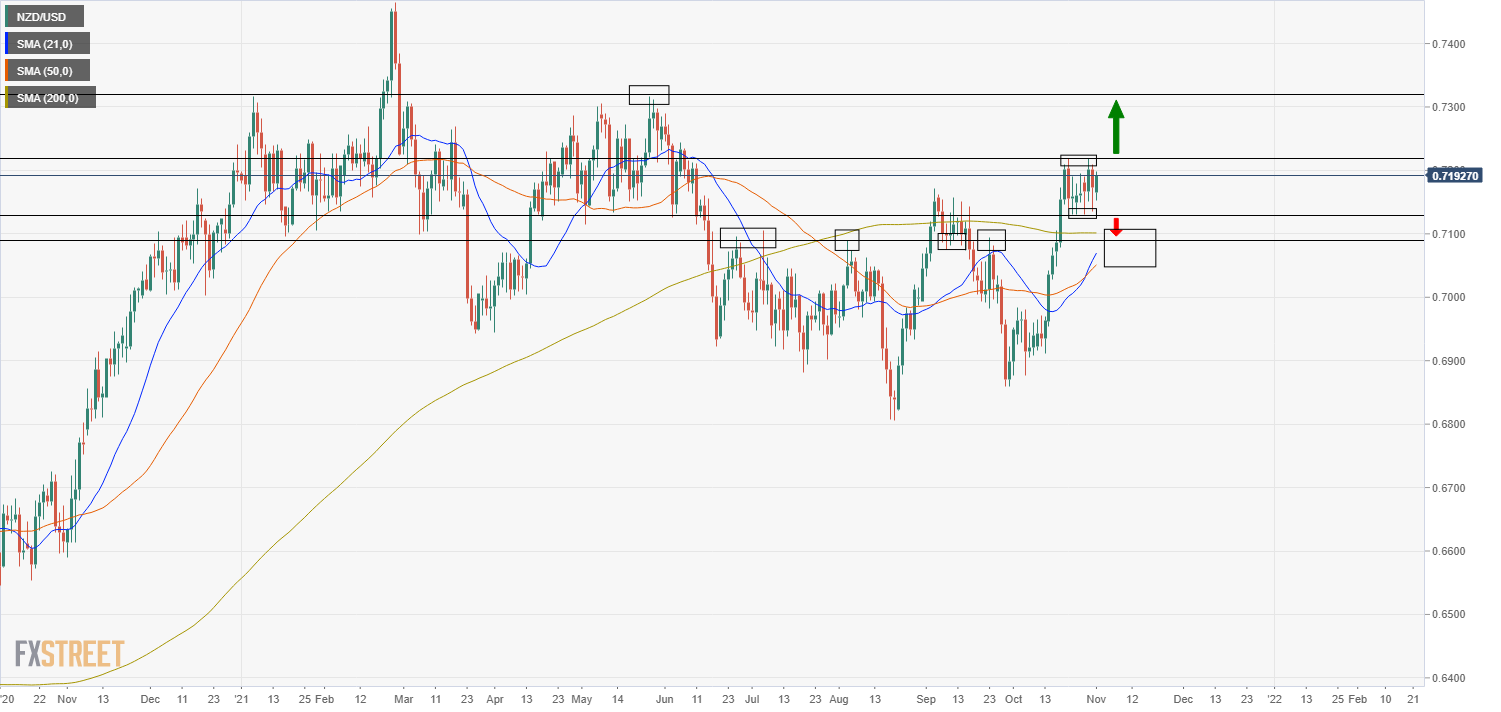
NZD/USD grinds higher inside a 70-pip trading range between 0.7150 and 0.7220, with a firmer RSI line keeping buyers hopeful before hitting the overbought region. Meanwhile, 100-SMA and an ascending trend line act as additional downside filters around 0.7095 and 0.7055 respectively. On the contrary, an upside clearance of 0.7220 will need validation from a four-month-old resistance line near 0.7230 before aiming May’s high near 0.7320.
-
21:04
USD/CHF Price Analysis: Positive divergence at a 4-hour chart could cap a move towards 0.9000
- USD/CHF slumps to fresh three-month lows, beneath 0.9100.
- Broad US Dollar weakness across the board weighed on the USD/CHF.
- USD/CHF: The pair trades within a bearish flag, but USD bulls need to reclaim 0.9150.
- USD/CHF: In the 4-hour chart, a positive divergence between price action and RSI indicates the pair could be headed to the upside.
The USD/CHF slides to fresh three-month lows, down 0.70%, trading at 0.9095 during the New York session at the time of writing. Mild risk-off market sentiment has kept the USD weaker across the board, except for risk-sensitive currencies, like the AUD and the GBP.
The US Dollar Index, which tracks the performance against a basket of six peers, declines 0.25%, down to 93.89, while the US 10-year Treasury yield remains flat at 1.558%. Furthermore, investors seem convinced that the Fed would hike rates by the beginning of the second half of 2022,
USD/CHF Price Forecast: Technical outlook
Daily chart
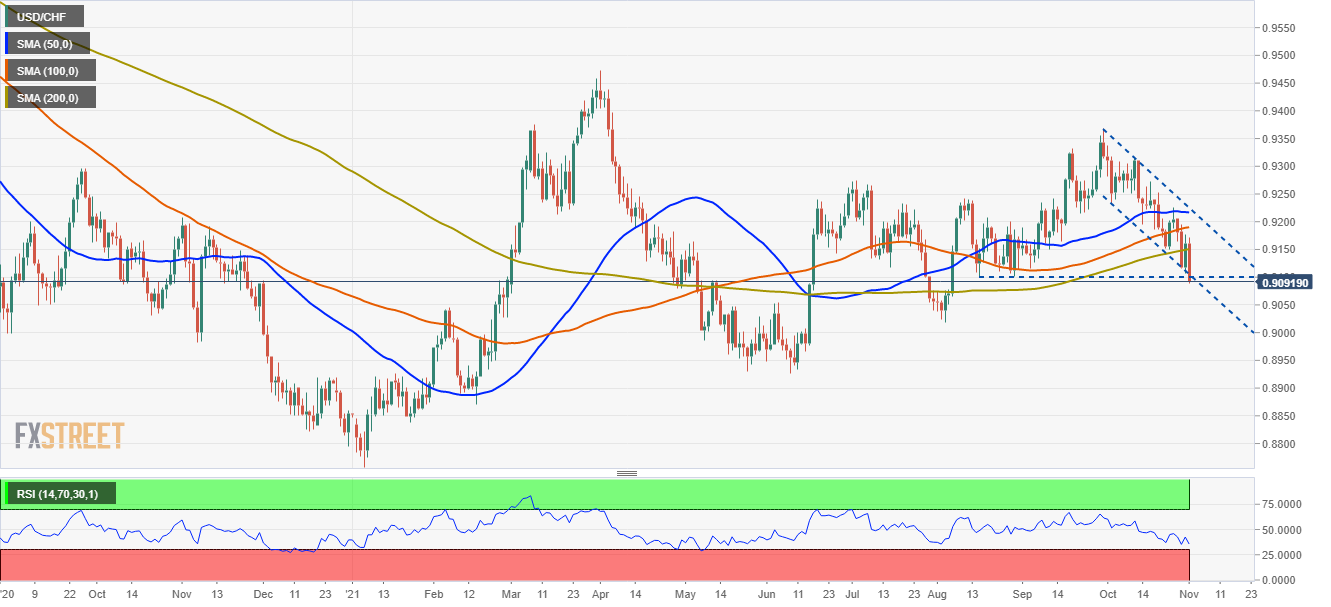
The USD/CHF is trading below the trend-setter 200-day moving average (DMA) which lies at 0.9147. Furthermore, the downward trend accelerated, pushing the pair towards the bottom trendline of a bullish flag channel, which would invalidate the pattern in case of being broken.
In the outcome of a downside break, the next support would be the August 4 low at 0.9018. A breach of the latter could send the pair tumbling towards the June 15 low at 0.8965.
Conversely, if USD bulls keep the price within the channel, they need a daily close above the 200-DMA around 0.9147. In that outcome, the immediate resistance would be the 100-DMA at 0.9186.
The Relative Strenght Index (RSI), a momentum indicator at 34, shows a slight positive divergence, which usually signals that the pair will reverse the recent downtrend to the upside.
4-hour chart
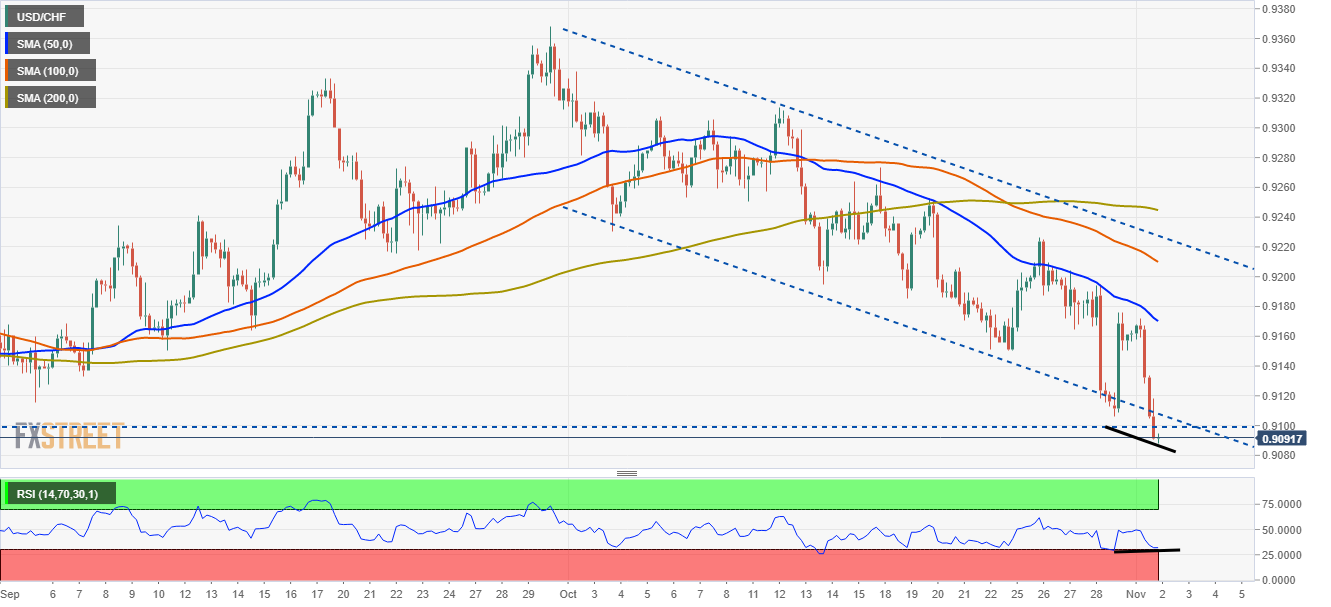
he USD/CHF 4-hour chart depicts the pair has a solid downward bias, represented by the simple moving averages (SMA’s) above the spot price and successive lower-highs and lower-lows development. However, the Relative Strength Index (RSI) at 32 shows a positive divergence, meaning that despite lower lows in price action, the RSI is printing higher lows,
indicating that the pair could move to the upside. Nevertheless, to confirm its validity, the USD/CHF needs to reclaim 0.9100.
-
20:42
RBNZ’s Orr: Unsustainable level of house prices poses monetary, financial stability challenges
The Reserve Bank of New Zealand's governor, Adrian Orr, has just stated that the unsustainable level of house prices poses monetary, financial stability challenges.
Key notes
House prices and housing affordability are affected by both supply and demand factors.
House prices have become more unsustainable over the past 12 months.
Well advanced in work to commence consulting on additional ‘debt servicing ratio’ tools.
Expect to see an easing in house prices over the medium term.
-
20:40
GBP/USD remains at two-week lows, unreactive as UK/France fishing tensions show signs of easing
- GBP was the worst performing G10 currency on Monday, with GBP/USD remains subdued around 1.3650-1.3700.
- News that France has postponed a deadline for an agreement with the UK over fishing rights hasn’t moved markets.
- While cross-channel tensions are one key theme this week, whether the BoE hikes rates or not is another.
GBP is the worst performing G10 currency on Monday, down about 0.2% versus the US dollar, but down about 0.6% versus the euro. That has meant that GBP/USD has traded subdued between 1.3650-1.3700 for the majority of the day, its lowest in about two and a half weeks. Tensions with France over fishing have escalated in recent days and are widely being attributed as behind Monday’s underperformance.
But the latest news on this front has been positive; according to Reuters, on Monday evening at the sidelines of the COP26 summit, French President Emmanuel Macron announced that his government would be postponed by one day the deadline for a resolution of the ongoing fishing row with the UK. Previously the French government had said that it would be implementing stricter checks on trucks coming into the EU from Britain and would be banning British trawlers from docking at French ports from 2300GMT on Monday. France claims that the UK has not fulfilled its pledges in the Brexit deal in terms of giving fair access to French fishing boats in UK waters. Talks between the UK and France were ongoing on Monday and Macron said that such talks must continue. “We'll see where we are tomorrow at the end of the day,” said Macron.
UK PM Boris Johnson’s rhetoric/tone to the press on the escalating spat over fishing access with France was fairly measured, with the PM merely pledging that the UK will take proportional action. The UK PM and French President will have spent a great deal of time in the presence of each other on Monday and over the last few days, given both of their presence at the G20 (which has now ended) and the start of COP26 (which ends in two weeks) and this finally appears to have resulted in an easing of tensions. But one day is not long for the two sides to reach an agreement, so the risk of the spat escalating in an actual trade/legal battle remains high and is a key story for GBP traders to watch this week. If France is to follow through with its threats against the UK, this arguably does pose an (albeit small) downside risk to the UK economy by further exacerbating the supply chain disruptions/bottlenecks currently hampering growth.
Another key theme to watch this week is Thursday’s Bank of England meeting; economists and money markets are split on whether or not the bank is going to go ahead with a 15bps rate hike. There are four hawkish Monetary Policy Committee (the committee of nine who vote on interest rates, sometimes referred to as the MPC) members who likely favour a hike, including Governor Andrew Bailey, Chief Economist Huw Pill, Deputy Governor Dave Ramsden, and External MPC member Michael Saunders. These members have expressed worries about inflation expectations becoming deanchored amid the recent surge in CPI to multi-year highs and amid expectations this surge is going to worsen next year. Meanwhile, there are three MPC members, including external members Catherine Mann, Jonathon Haskell and Silvana Tenreyro who would rather wait until at least December to observe how the labour market develops in wake of the end of the government’s furlough scheme in September (much of the labour market data for October won’t be out until December). Deputy Governors Jon Cunliffe and Ben Broadbent have not given indicated which camp they fall in yet, and their votes will ultimately swing whether or not there is a hike or not.
-
20:13
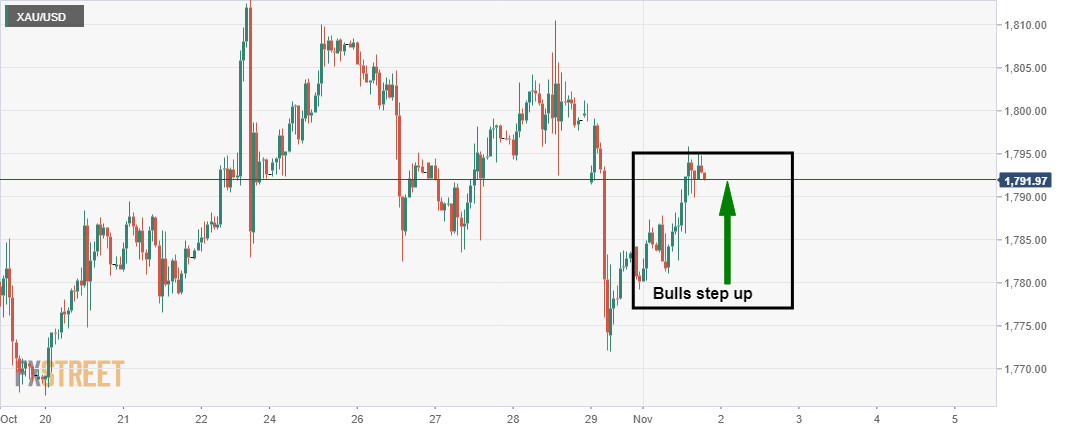
EUR/USD bulls step up and defend key territory
- EUR/USD finds its footing in preparation for the big events ahead this week.
- The US dollar has given back a significant portion of Friday's bid as markets get set for the Fed.
EUR/USD recovered the end of month drop on Monday, rising from a low of 1.1546 to a fresh high of 1.1608 on the day as the greenback gives back a significant portion of Friday's bid. At the time of writing, EUR/USD is higher by some 0.37% as the focus switched from US data to the mid-week US Federal Reserve interest rate meeting.
For the pair, it is now a battle of the central banks and data as strong EU data is now starting to test the European Central Bank's dovish resolve. In contrast today, the US ISM Manufacturing index eased 0.3pts in October to 60.8, however arguably, it is still indicating a strong expansion in the manufacturing economy for the 17th consecutive month. Analysts at ANZ Bank explained that optimism about future growth prospects is high and positive growth comments outweighed cautious ones by a ratio of 4:1.
Meanwhile, the US dollar has eased on Monday versus its main rivals on Monday, after posting its biggest daily rise in more than four months in the previous session, as traders position themselves ahead of this week's highly anticipated US Federal Reserve policy meeting.
US jobs in focus
Additionally, the US labour market will be in focus this week as well. On Friday, the Nonfarm payrolls will take centre stage no matter the outcome of the Fed. ''However, the labour market has lagged notably behind, with the labour force as well as employment still down sharply from the pre-COVID level,'' analysts at TD Securities explained, adding that the reasons behind the labour-force gap are numerous but mostly virus-related.
''We remain of the view that persistent labour-market scarring stemming from the pandemic remains a low-probability scenario, as the recovery has been swifter than that post-2008-9. In turn, we continue to expect the Fed to remain patient while achieving the maximum employment goal set under its new policy framework.''
-
19:48
Forex Today: Dollar bulls on pause ahead of critical central banks’ announcements
What you need to know on Tuesday, November 2:
The greenback edged lower against most major rivals on Monday, but its bullish potential remains intact. Market participants were cautiously optimistic pushing global equities higher and favoring a modest uptick in government bond yields. However, several central banks will unveil fresh decisions on monetary policy, including the RBA on Tuesday, US Federal Reserve on Wednesday and the Bank of England on Thursday. All of them are expected to introduce changes to their monetary policies, amid persistent inflationary pressures.
The EUR/USD pair trades around 1.1600, while GBP/USD remained under pressure in the 1.33660 price zone.
The positive tone of equities helped AUD/USD to recover above the 0.7500 threshold heading into the RBA’s monetary policy announcement. The USD/CAD pair trades around 1.2369.
Commodities are ending Monday with gains, with gold trading around $1,792 a troy ounce and WTI flirting with $84.00 a barrel.
Wall Street advanced, although gains were modest. Treasury yields ticked higher, although that on the 10-year Treasury note stood below 1.60%.
Shiba Inu prints bullish continuation pattern towards $0.00011
Like this article? Help us with some feedback by answering this survey:
Rate this content -
19:39
S&P 500 Index consolidates recent gains, remains above 4600
- The S&P 500 is consolidating at record levels above 4600.
- Dip-buyers and bargain-hunters will be eyeing retests of support at 4550 and around 4460-4480.
After closing above the 4600 level for the first time last Friday, meaning the index ended the month up nearly 7.0% (its best month since November 2020), the index has been consolidating. On an intra-day basis, the index has swung within a 4595-4620ish range and is right now trading close to 4610, putting it on course for another record close. Given the sheer pace of gains in recent weeks, it would seem reasonable to see a period of relative underperformance going forward or perhaps even a bit of a profit-taking driven technical retracement. One key level that any potential patient but dip-hungry equity bulls would be looking at would be the high from back in September at around 4550, which acted as a decent area of resistance and then support as it was broken through in October. If this level is a little too obvious and if stops are triggered, deepening the pullback, the next area to look at would be the 4460-4480 zone, where a late August high, the 21 and 50-day moving averages each resides. Again, this might be another place the dip-buyers want to get involved.
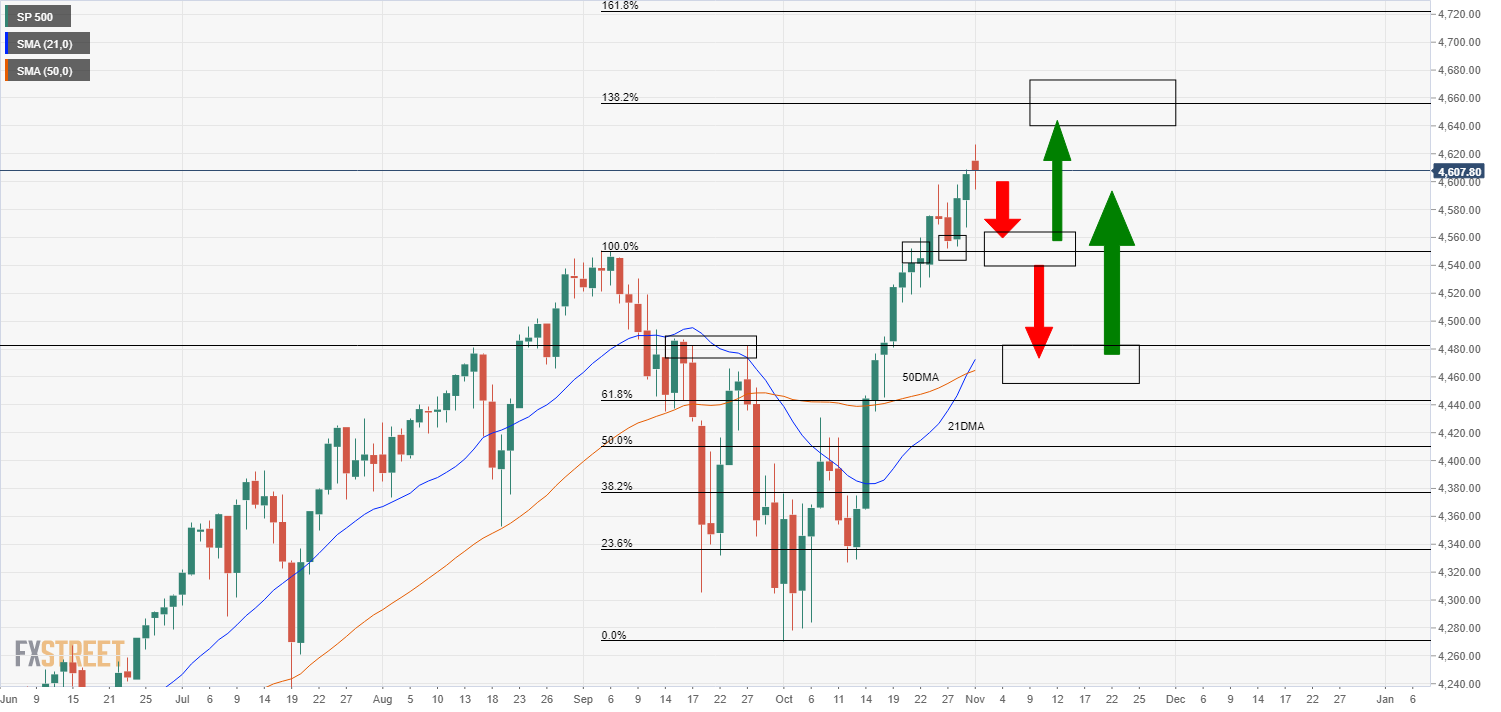
Of course, whether or not dip-buyers will actually show up or not will depend on whether any retracement lower is predominantly being driven by position adjustment or an actual deterioration in the fundamental backdrop. A negative economic shock (perhaps a new, highly dangerous Covid-19 variant, or a fresh spike in energy prices) could fulfill this criterion, as could a hawkish shift in Fed policy that is deemed by market participants as a “policy mistake” (i.e. that the Fed’s overly hawkish stance will hurt growth or even trigger a recession). Equity investors don’t seem overly worried about these risks right now and Q3 corporate earnings have, thus far, been (mostly) bumper. But if any such negative fundamental scenarios were to unfold, dip-buyers would be well to be a little more cautious.
-
19:38
EUR/GBP advances towards 0.8500 despite BoE hawkish tone in the last weeks
- EUR/GBP edges higher on the back of the EUR/USD, as the Sterling weakens against the greenback.
- Worse than expected, German Retail Sales, ignored by investors as the EUR/GBP kept trading north.
- EUR/GBP: From a technical perspective has a downward bias, as long as EUR/GBP remains below 0.8530.
The EUR/GBP climbs to two-week highs during the New York session, trading at 0.8495, up 0.53% at the time of writing. A mild risk-off market mood keeps risk-sensitive currencies like the British pound from appreciating, despite the hawkish rhetoric by important BoE members, as the BoE will unveil its monetary policy on Thursday of this week.
The European Central Bank (ECB) held its monetary policy meeting last week, where the bank kept unchanged interest rates. Also, despite rising inflationary pressures, with the Eurozone CPI expanding by 4.1%, it maintained its dovish stance, pushing backward investors’ intentions of a rate hike until late 2023.
Furthermore, the single currency is rising on the back of the EUR/USD, rising some 0.40%. Contrarily the British pound slides 0.20% against the greenback as both central banks head to their monetary policy meetings later in the week.
On the macroeconomic front, German Retail Sales for September on an annual basis collapsed, shrank 0.9% against a 1.8% increase foreseen by analysts. Despite the dismal report, the EUR/GBP continued its upward trend throughout the day.
EUR/GBP Price Forecast: Technical outlook
Daily chart
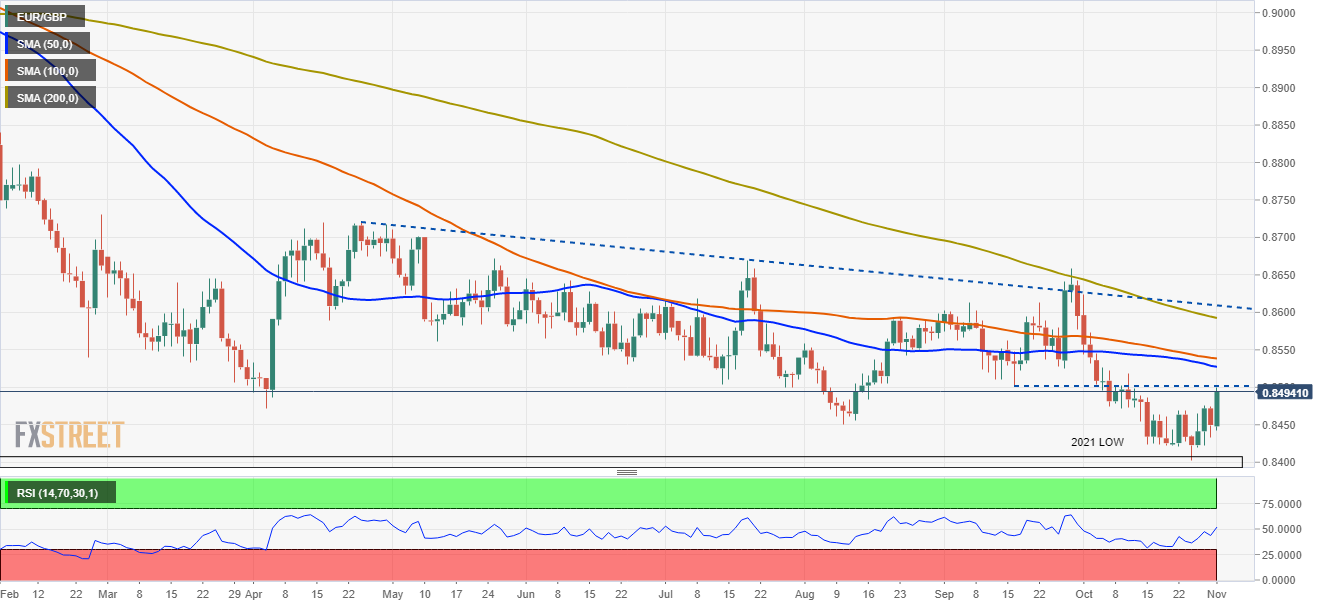
The EUR/GBP cross-currency pair has a downward bias, portrayed by the daily moving averages (DMA’s) located above the spot price. At press time, the pair is approaching the confluence of the 50 and the 100-DMA around 0.8520-30 area, which would oppose strong resistance for EUR buyers. However, the Relative Strength Index (RSI) at 53 aims higher, a bullish signal that diverges with price action.
To continue the downward trend, EUR/GBP sellers will need to hold the price below the September 16 low at 0.8500. In that outcome, EUR sellers could push the pair towards a renewed re-test of 0.8402, which is 2021 low.
For EUR/GBP buyers to confirm its upward bias, they will need a daily close above 0.8530. In that outcome, the following resistance would be the 200-DMA at 0.8588.
-
19:18
Gold Price Forecast: Bulls stepping off the gas in meeting daily resistance
- Gold move sin to test the bearish commitment at a daily counter trendline.
- All eyes are on the Fed this week while the US dollar gives back a significant portion of the recent surge to the upside.
- XAU/USD’s drop below $1,780 an ominous sign ahead of Fed
The price of gold is some 0.6% higher on the day following a solid climb into daily resistance in the highs of the day of $1,795.82. XAU/USD has travelled from a low of $1,779.23 while the US dollar eased versus its main rivals on Monday.
The greenback has corrected a significant portion of the biggest daily rise in more than four months which occurred in the previous session. Hedge funds are cutting back bearish bets ahead of this week's highly-anticipated US Federal Reserve policy meeting where the Fed is widely expected to announce its tapering plans.
Fed in focus
''Financial markets are priced aggressively for hikes in 2022, but the Fed is unlikely to endorse or push back on those expectations at this point as we await more inflation evidence,'' analysts at Societe Generale argued. We also have US Employment trends in focus and these are expected to regain momentum. The analysts at Societe general are anticipating a 520k job gain for Nonfarm Payrolls at the end of this week.
Staying with the Fed, traders across global markets have aggressively raised their outlook for policy tightening, as an energy crunch and snarled supply chains drive inflation higher, leading market participants to price the risk of a faster exit.
Analysts at TD Securities note that US Treasuries are pricing in the first hike by July 2022 and a 90% chance of a hike in June, despite the fact that tapering is on course to only end by June.
''We reiterate that pricing for Fed hikes remains far too hawkish, but insofar as the outlook for actual hikes becomes increasingly dependent on the Fed's jobs mandate, this week's nonfarm payrolls number could steal the show, the analysts added. Nonetheless, they say, ''as an ongoing CTA selling program winds down, recent pressure on gold could soon abate.''
Gold technical analysis
The moves on Monday have undermined the opening bearish bias seen at the start of the week with the grind to the upside as follows:
As illustrated, the downside prospects were eliminated with a conservative bid as London opened up which has seen the price move in on daily resistance as follows:
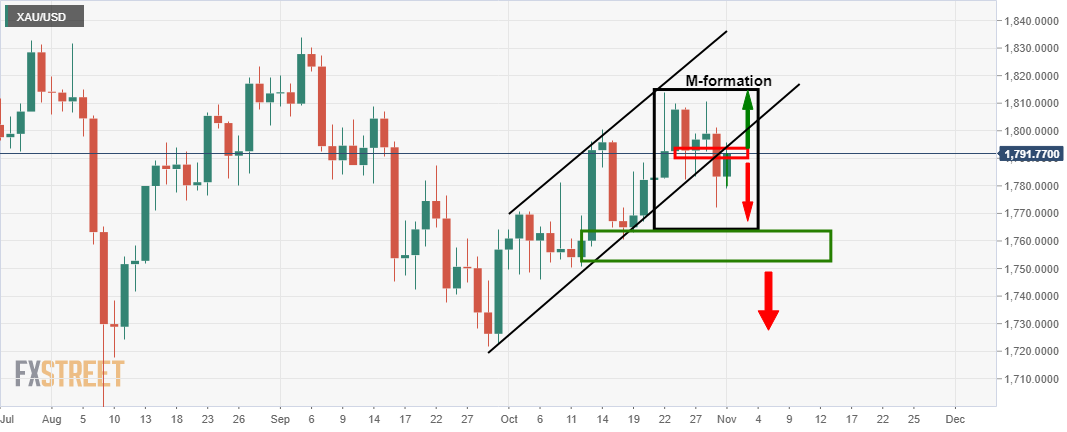
The price is now at a crossroads whereby a break of the neckline of the M-formation will leave a bullish bias for the days ahead, while a rejection at the counter trendline will put the bears back in charge.
-
19:07
USD/JPY reverts to 114.00 as attention shifts from Japan election to state-side risk events
- USD/JPY has pulled back to the 114.00 level from Asia Pacific session highs around 114.50.
- The pair was initially boosted following Japan PM’s Kishida’ LDP party securing a surprise majority at the weekend general election.
- Focus now shifts to key global events, like the FOMC meeting, US jobs and ISM services data.
During Monday’s Asia Pacific session, USD/JPY hit its highest level in about one and a half weeks at just below 114.50, meaning it only came within about 20 pips of the annual high printed roughly two weeks ago around 114.70. During European and US trade, however, the pair has eased back and is currently flirting with the 114.00 level, meaning it currently trades, leaving it roughly at the midpoint of its 113.20s-114.70ish range over the last two/three weeks.
Surprise LDP majority
The big news out of Japan from the last few days has been the result of the general election held on Sunday; Prime Minister Kishida’s LDP party did better than feared and, against expectations, managed to hold onto a majority in the lower house of parliament, albeit with fewer seats than held in the term that just ended. The news has eased fears that Kishida was on course for a short stint as PM, as had been the case for his predecessor Yoshida Suga, and keeps the prospect of further fiscal stimulus before the end of the year on the table. Thus, Japanese stocks saw substantial gains on Monday, with the Nikkei 225 gaining north of 2.5% on the session – according to some traders, the risk on tone to the Japanese trading session, which also seemed to have a positive spillover effect on global risk appetite, was touted as weighing on the Japanese yen early on Monday.
Focus shifts to state-side events
With the election out of the way, focus in Japanese markets and for the Japanese yen returns to global dynamics. The most important calendar events this week will be the upcoming Fed and BoE meetings, as well as US jobs and ISM Services data. Monday saw the release of the October US ISM Manufacturing PMI survey did not have much impact on FX markets (including on USD/JPY). But the survey did add allude to current economic themes in the US, such as that economic growth, though slower, remains robust, as does demand, but that supply bottlenecks continue to hold back economic activity by slowing manufacturing output, while input costs remain sharply elevated.
Watch yield developments
As has been the case more often than not in recent months, USD/JPY is likely to follow developments in US bond markets, particularly any shifts in the US/Japan 10-year yield differentials. The US 10-year fell back below 1.60% last week and has since struggled to regain ground as inflation expectations pullback from recent highs; 10-year breakevens are back to just above 2.50% having been close to 2.70% at the start of last week. But US real yields have been picking up in recent days, which has mostly offset the drop in inflation expectations, with the US 10-year TIPS yield now at around -0.95% having been as low as -1.15% just four sessions ago. If hawkish FOMC vibes and strong US data this week can support further upside in the TIPS without resulting in too much downside for inflation expectations, then this should push nominal 10-year yields higher again, perhaps back towards recent highs around 1.70%, which would likely be enough to push USD/JPY back towards recent highs in the upper 114.00s.
-
19:05
RBA Preview: Forecasts from 10 major banks, an opportunity to mould the market mood
The Reserve Bank of Australia (RBA) will announce its decision on monetary policy on Tuesday, November 2, at 03:30 GMT. As we get closer to the release time, here are the forecasts by the economists and researchers of 10 major banks regarding the upcoming central bank's decision. Rates are expected to remain unchanged but the RBA is expected to change its guidance following stronger core inflation.
Westpac
“The RBA Board meeting for November is not expected to see any changes to policy settings. The focus will be on the wording and guidance around the likely timing of the initial rate rise in the upcoming cycle. Currently, RBA guidance is: ‘will not increase the cash rate until actual inflation is sustainably within the 2 to 3 percent target range. The central scenario for the economy is that this condition will not be met before 2024’. We anticipate an early timing, forecasting an initial rate hike in the March quarter 2023, likely at the February meeting. Core inflation, surprising to the high side, to now be inside the target band for the first time since 2015, lends weight to an earlier timing than envisaged by the RBA.”
Standard Chartered
“The upcoming RBA policy meeting will be an interesting one. We think the RBA may adjust some of its monetary settings at the upcoming meeting. While the central bank is unlikely to make changes to the QE purchase of AUD4 B a week, it may change its phrasing related to QE purchases to ‘until mid-February 2022’ (from ‘until at least mid-February 2022’). Second, the RBA may now note that the core scenario warranting a hike may materialise earlier than 2024, albeit with a wider range of plausible scenarios (versus ‘condition will not be met before 2024’). Third, it may remove the YCC measure as the RBA has not conducted any purchases to lower the target bond yield ahead of the policy meeting.”
ING
“The RBA meets to discuss policy although we believe the bank will remain in supportive mode as the economy recovers.”
TDS
“We expect the RBA to announce an end to its Yield Target Framework next week. This follows the RBA's decision to not defend the yield on the Apr'24s even after trading significantly above the 10bps target. As for QE we expect the Bank to leave its guidance unchanged, continuing to purchase bonds at a weekly AUD4 B rate through to Feb.”
BBH
“Rates are expected to remain steady at 0.10%. However, it appears that the markets may force the bank to formally abandon Yield Curve Control and adjust its forward guidance. The RBA did not intervene to maintain the 0.10% yield on the targeted April 2024 bond, instead of allowing it to close out the week near 0.72%. If YCC is abandoned, then the RBA will also have to acknowledge that liftoff is likely to come before the current guidance for 2024. In turn, AUD would likely strengthen and so the economy will face a double whammy of higher interest rates and a stronger currency. Of note, the swaps market is pricing 75-100 bp of tightening over the next twelve months. The bank will release its Statement on Monetary Policy Friday, which will contain new macro forecasts.”
Deutsche Bank
“Two-year yields last week rose from 0.15% on Wednesday morning to 0.775% at the close on Friday as the RBA were conspicuous by their absence in defending the 0.1% target on the April 24 bond. I’ve absolutely zero idea what they are going to do tomorrow which should help you all tremendously but their absence again this morning gives a decent indication. I was taught economics in an era where central banks liked to keep an element of mystery and surprise. As such I’ve always disliked the forward guidance era as it encourages markets to pile on to much riskier, one-way positions that a normally functioning market should naturally allow. But to go from forward guidance to silence (that rhymes) is a recipe for huge market turmoil if the facts change. It's unclear if the full implications of last week’s carnage at the global front end has yet been cleared out.”
SocGen
“The target for the cash rate and three-year government bond yields (for the April 2024 bonds) will be maintained at 0.10%. The government bond purchase programme will also continue at the rate of AUD4 B a week until at least mid-February 2022. Policymakers are expected to maintain their near-term growth outlook that a material decline in 3Q21 GDP will be followed by an instant bounce-back in 4Q21 based on the increase in vaccination rates and the easing of COVID-19 restrictions. The RBA will likely continue to say that wage and price pressures remain subdued, and that inflation is running at around 1.75% in underlying terms, though the near-term forecasts for trimmed mean inflation may be revised up to reflect the 3Q data. The RBA will also maintain its current ultra-accommodative forward guidance in terms of rate hikes to 2024 in the closing paragraph of the policy statement.”
Natixis
“The RBA is expected to signal its intention to move away from its unconventional policy measures aimed at stabilizing the economy from the pandemic. Specifically, the Reserve Bank is anticipated to terminate its YCC and to discontinue to purchase government bonds in February 2022. Our call on YCC termination and tapering is that the RBA will keep a lot of flexibility to avoid a too rapid steeping of the curve as the cash rate is not expected to be increased until 2023. Our main scenario is that the Reserve Bank will fully scrap the YCC next March after updating their economic outlook on the February State of Monetary Policy. The good news is that the protracted wage weakness gives some room to the RBA as the expectation of second-round effects on inflation from wages are much lower than in the US economy.”
MUFG
“While we can anticipate the RBA bringing forward rate hike plans from the current guidance for no hikes before 2024, it is one hell of a long shot to expect the RBA to completely capitulate and start planning for hikes as soon as next year and joining the Norges Bank, RBNZ, BoE, BoC and Fed. The RBA remains concerned that underlying inflation pressures have been uncomfortably low over the last six years averaging only around 1.6%Y/Y. Similar to the ECB, we do not expect the RBA to be in a rush to respond to the current period of higher inflation. As a result, we doubt that recent AUD strength can be sustained beyond the near-term.”
ANZ
“We think the RBA will expect inflation to be 2% or higher for the duration of its forecast horizon. This would make its view that inflation will not be ‘sustainably within the 2 to 3 per cent target range’ until 2024, untenable. We anticipate the RBA will shift its forward guidance to expecting a rate hike in the second half of 2023. A change in forward guidance removes the rationale for the yield target. The RBA has two options: drop it altogether or shift to a shorter bond such as the Apr-23 ACGB. We think shifting to a bond that has just 18 months until it matures is not worth the effort, so we expect the yield target policy to be dropped. It has served its purpose. The RBA’s failure to defend the yield target recently supports our expectation.”
See – Reserve Bank of Australia Preview: Reality check for Australian policymakers
-
18:30
AUD/USD meets a critical level of hourly support, central banks in focus
- AUD/USD is meeting support by the hourly 21 EMA and eyes are on the upside.
- The focus is on the RBA and Fed as the major risk events for the week ahead.
AUD/USD AUD/USD is edging back to flat during the New York day, travelling between a low of 0.7486 and a high of 0.7536 so far and within an almost two-week range.
The Australian dollar gained 4% in October, the most in 10 months, helped by high commodity prices amid energy shortages in Europe and Asia and amid speculation the bank will drop a commitment to keep yields on short term bonds at record lows.
RBA in focus
Meanwhile, traders braced for Australia's central bank meeting this week that could mark a retreat from its dovish rate policy. As for positioning, net AUD short positions have moved lower for a third straight week, but they still have not captured the recent sharp moves in money market rates. ''The RBA still has not intervened to maintain the 0.10% yield on the targeted April 2024 bond,'' analysts at Brown Brothers Harriman explained.
''Due to the lack of any action by the RBA, markets expect the bank to abandon Yield Curve Control tomorrow and tacitly acknowledge that liftoff is likely to come before the current guidance for 2024. If this were to happen, AUD would likely strengthen and so the economy would face a double whammy of higher interest rates and a stronger currency,'' the analysts added. Moreover, the swaps market is pricing in around 75 bp of tightening over the next twelve months.
DXY on the backfoot
Meanwhile, the US dollar is on the back foot versus its main rivals on Monday flowing its biggest daily rise in more than four months in the previous session. The Federal Reserve is eyed as a major risk event this week also, ahead of the all-important Nonfarm Payrolls on Friday.
The Fed is widely expected to announce a tapering of stimulus, a factor that has fueled the greenback's rise in recent weeks. The dollar index DXY, which measures the US currency against six rivals, was down 0.24% at 93.907 at the time of writing.
AUD/USD technical analysis
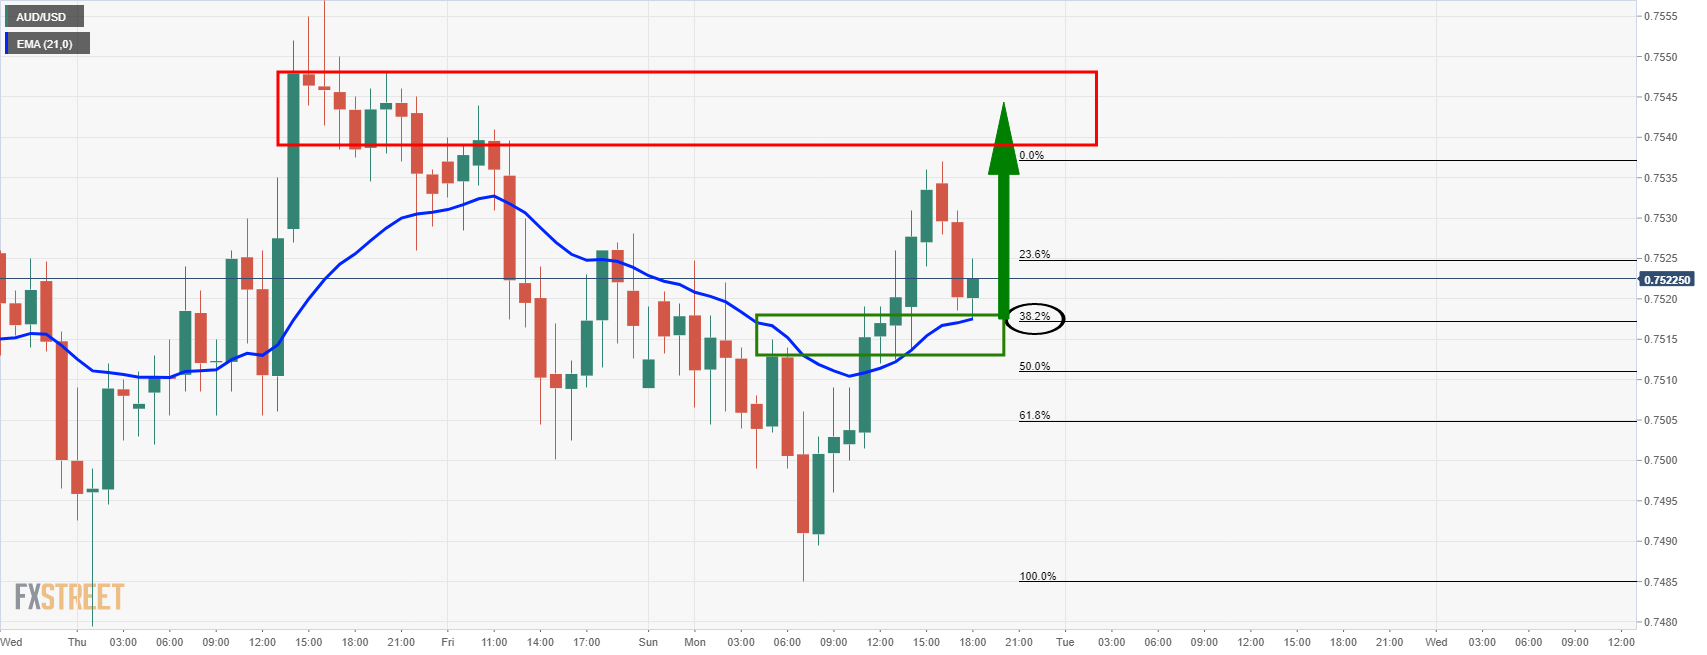
The price has corrected a significant portion of the recent bullish impulse to meet the hourly 21-EMA and there are now prospects of an upside continuation for the sessions ahead from this support zone.
-
18:24
Silver Price Forecast: XAG/USD climbs above $24.00 despite high US T-bond yields
- XAG/USD reclaims $24.00 on broad US dollar weakness across the board.
- The market sentiment is mild-negative, portrayed by US equities, with just the Dow Jones rising.
- XAG/USD: From a technical perspective, silver is tilted to the upside, but as risk events lie ahead, caution is warranted.
Silver (XAG/USD) edges higher during the New York session, gains 0.60%, trading at $24.00 at the time of writing. A weaker greenback despite higher US T-bond yields with the 10-year note rising two and a half basis points at 1.579% boosts the precious metal, in line with gold, which is also advancing 0.65% at press time.
The market sentiment is mixed as US stock indices fluctuate between gainers and losers amid absent European traders, as the Eurozone observes a holiday. Furthermore, inflation has been the trend in the last couple of weeks.
This week, three major central bank monetary policy meetings would give investors the general overview of policymakers, which could spur movement in silver. If policymakers view inflation as temporary, this could trigger safe-haven asset buying as a hedge for inflation, as that would indicate that central banks would extend the easy money cycle. On the other hand, a hawkish tone in the Reserve Bank of Australia, the Federal Reserve, and the Bank of England could send yields higher, which would weaken XAG/USD.
XAG/USD Price Forecast: Technical outlook
4-hour chart
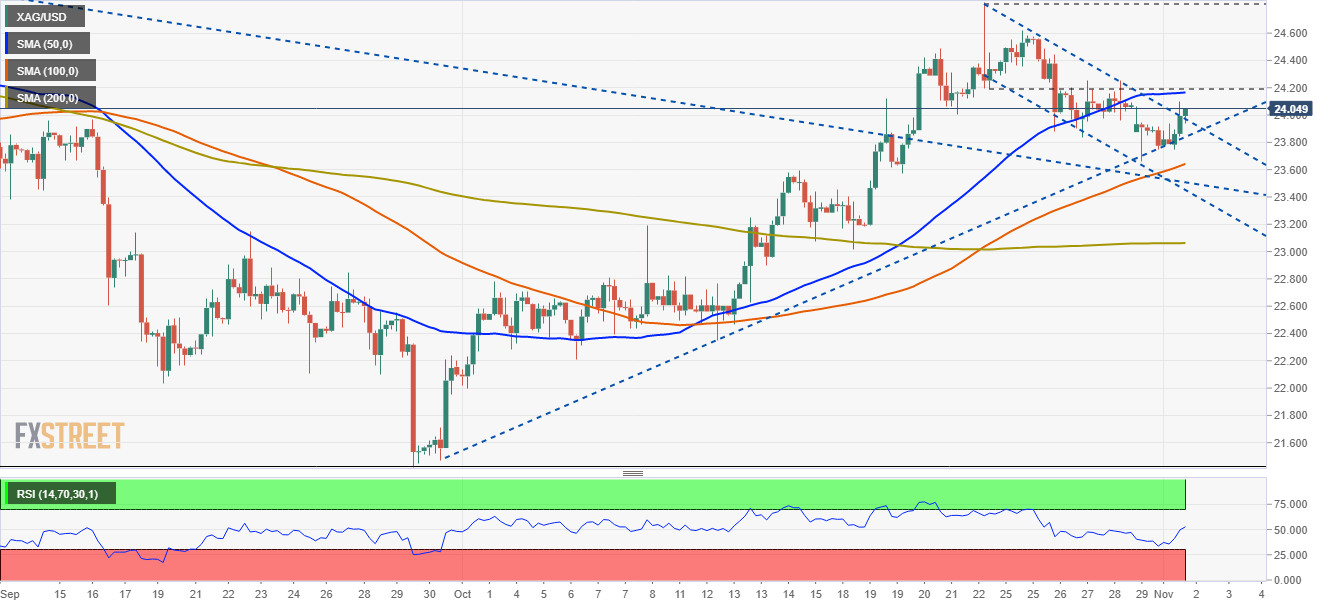
Silver price broke beneath an upslope support trendline, which now turned resistance, that would spur a bearish signal, but at press time, XAG/USD is pressuring to regain above it. Furthermore, a bullish flag was broken to the upside, confirming the upward bias.
Nevertheless, the confluence of the upward slope trendline and the 50-simple moving average at $24.14 would oppose strong resistance for XAG/USD bulls, who would need a break above the latter to spur an upside move towards the October 22 high at $24.80.
On the flip side, failure at the abovementioned could send silver tumbling towards the 100-simple moving average (SMA) at $23.60.
The Relative Strength Index (RSI), although slightly flattish at 49, suggests a downward bias, but there is a slight positive divergence, which means the price is headed to the upside
-
17:43
GBP/USD stalls at hourly support in a weak US dollar environment
- GBP/USD is holding in a consolidation zone in New York trade, little changed as investors await the BoE.
- Traders await the next impetus and weigh Brexit risk and US fundamentals.
GBP/USD is down some 0.15% on the day so far after travelling from a high of 1.3693 to a low of 1.3641. Sterling has been pressured at the start of the week and fell to the lowest level vs the greenback in over two weeks as investors weigh the Bank of England's policy stance vs. the ongoing spat between the UK and EU that has morphed into a disagreement with France over fish.
The latest on this front comes with the British Foreign Secretary Liz Truss who has said that Paris had “behaved unfairly” and made “completely unreasonable threats”, with the two sides at loggerheads over the number of licences the UK has handed French vessels keen to fish in its territorial waters.
BoE in focus
Meanwhile, the Bank of England is expected to hike by 15bp, but also to push back against some of the tightening bets through their inflation forecasts. Nevertheless, there are prospects for GBP weakness. Traders, in this regard, will be on the lookout for dialled down hawkishness in an overpopulated long position in speculative positions. Net positioning on the pound rose by 8.6% of open interest, reaching +10%, in the week ending 26 October which likely allows scope for some short-squeezing.
''GBP net longs positions jumped higher as speculation increased that the BoE could bring forward rate hikes,'' analysts at Rabobank explained. ''GBP had been slow to react to speculation about a possible 2021 BoE rate rise given fears of a policy mistake. Focus on the November 4 BoE policy meeting.''
Fed taper eyed
Across the pond, the US dollar has eased versus its main rivals on Monday flowing its biggest daily rise in more than four months in the previous session. The Federal Reserve is widely expected to announce a tapering of stimulus, a factor that has fueled the greenback's rise in recent weeks. The dollar index DXY, which measures the US currency against six rivals, was down 0.18% at 93.95 at the time of writing.
-
17:23
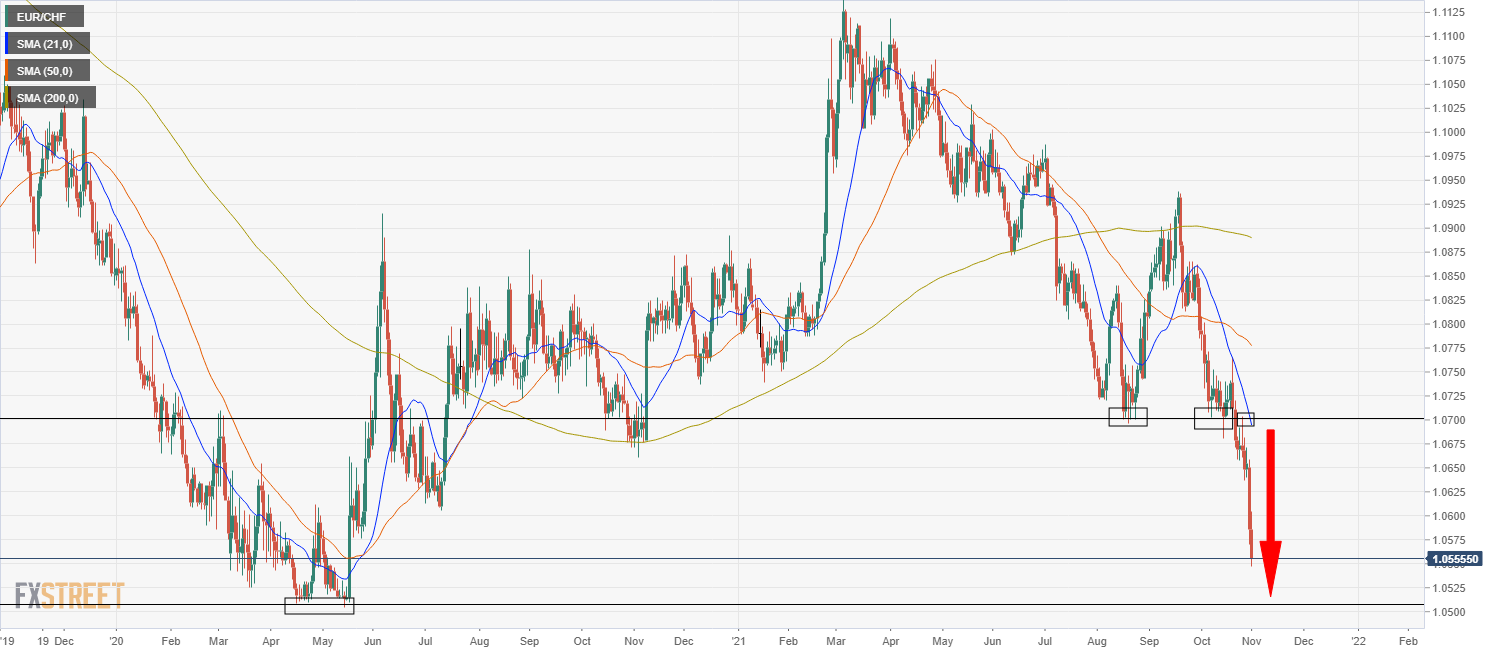
EUR/CHF hits fresh 18-month lows under 1.0550, eyes post-pandemic lows at 1.0500
- EUR/CHF has picked up where it left things off in October and has continued to decline to fresh multi-month lows.
- Technicians will be eyeing a test of the post-pandemic lows around 1.0500.
- Recent CHF strength has perplexed some analysts and traders.
After falling 1.9% over the course of October from close to 1.0800 to under 1.0600, negative momentum in EUR/CHF has carried over into the first trading day of November. The pair printed fresh 18-month lows when it briefly slipped below the 1.0550 level in earlier trade. Bearish momentum has gathered pace since EUR/CHF saw a significant break below what had been a solid area of support at 1.0700 on 21 October and then failed to break back above this level on the retest. Technicians and bears will have multi-year lows at the 1.0500 level, set last May, in their sights.
CHF strength catches many off guard
Recent strength in the swiss franc has caught many an analyst and trader off guard, given that it seems not to reflect recent fundamental developments. These fundamental developments can pretty much be summed up as 1) a spike in global inflationary pressures (though not really in Switzerland) leading to a hawkish repricing of interest rate expectations for most major G10 central banks (again, though not really for Switzerland) and 2) a risk-on environment for stocks that has seen major US and European equity bourses surge back to record levels after September’s sell-off. The former suggests that CHF should have weakened as a result of a dwindling yield appeal and the latter suggests CHF weakness as a result of dwindling safe-haven demand.
The fact that the drop in EUR/CHF has accelerated in wake of what was largely viewed as a hawkish showing from the ECB and its President Lagarde last Thursday is doubly perplexing; markets have brought their ECB rate hike bets even further forward since last week’s ECB meeting, now seeing a 10bps hike in July and a 20bps hike in October, in anticipation (one would assume) that the ECB loses its nerve with regards to inflation, drops its “inflation is transitory stance” and starts hiking by the middle of the year. Perhaps the view of FX market participants buying CHF is that all of these pro-inflationary developments in Europe (driven primarily by the spike in energy costs), and the associated more hawkish ECB stance, will be a negative for long-term Eurozone growth prospects, capping the ECB’s terminal interest rate, thus actually, in the end, being a positive for EUR vs CHF yield/carry differentials.
What to watch this week
A modest MoM slowdown in Swiss Manufacturing output growth, as indicated by modest fall in October Manufacturing PMI to 65.4 from last month’s 68.1 reading, and a hefty jump in Swiss Sight Deposits (indicating that the SNB has been intervening to try to slow the CHF rally) weren’t enough to significantly slow the swiss franc’s ascent. EUR/CHF traders will now switch their focus to the release of Final October Eurozone Manufacturing PMI data, Swiss October CPI and Swiss September Retail Sales, all out on Tuesday in the European morning. Thereafter, focus is likely to switch to broader macro themes, like the Fed and BoE rate decisions and the US jobs report.
-
16:43
USD/CAD breaks below 1.2400 on good Canadian Manufacturing PMI ahead risk events
- USD/CAD stalls at 1.2400, retreated to 1.2350 on good Canadian macroeconomic data.
- Positive market mood, and rising crude oil prices, boost the CAD prospects.
- Canadian IHS Markit Manufacturing PMI reading was better than expected.
The USD/CAD slides during the New York session, down 0.27%, trading at 1.2356 at the time of writing. A risk-on market mood, alongside rising crude oil prices, boosts the Canadian dollar.
During the Asian session, the US Dollar was firmly bid, trading as high as 1.2400. However, once the Canadian IHS Markit PMI Manufacturing reading was released, the pair broke beneath the 1.2400 figure as renewed optimism surrounded the Loonie.
US Dollar Index below 94 again, despite rising US T-bond yields
In the meantime, the US Dollar Index, which measures the greenback's performance against a basket of six peers, slumps 0.18%, breaking below 94, sitting at 93.95. Contrarily, the US T-bond 10-year benchmark note, which dramatically influences the US dollar, rises three and a half basis points, up to 1.589%.
Canadian IHS Markit Manufacturing PMI reading was better than expected
On the macroeconomic front, the Canadian economic docket featured the IHS Markit Manufacturing PMI for October rose to 57.7, better than the 57.2 expected and higher than the September reading. That motivated CAD bulls, which promptly spurred a downward move towards the 1.2350 familiar level, but lacked the conviction to push the pair towards 1.2300, as the Federal Reserve November meeting, is around the corner.
Concerning the US economic docket, the Institute for Supply Management (ISM) revealed the Manufacturing PMI for October, which rose to 60.8 more than the 60.6 estimated. Although the reading was good, it fell short against the September reading. Moreover, the new orders slumped to a 16-month low as factories continued to experience raw materials shipment delays.
USD/CAD Price Forecast: Technical outlook
Daily chart
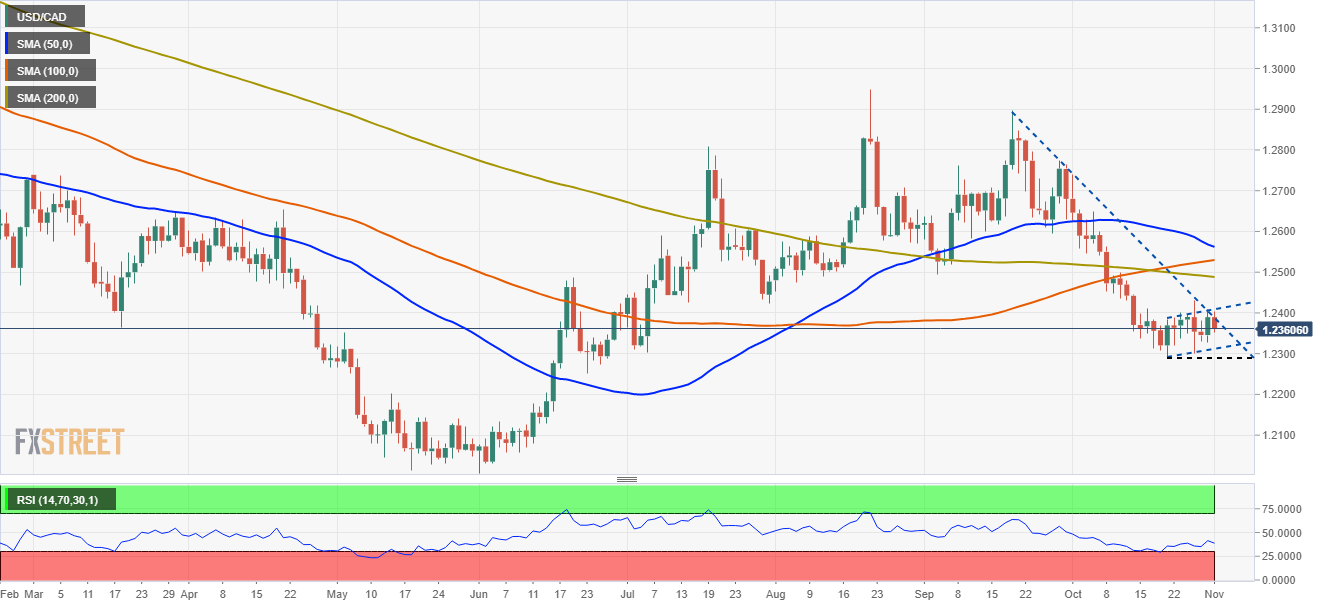
The USD/CAD pair unsuccessfully tested a downslope resistance trendline, which caused a retracement from 1.2400 towards 1.2360, in line with the downward bias depicted by daily moving averages (DMA's) located above the spot price. Furthermore, the price action of the last eight days has formed a bearish flag, which in case of a downward break, would open the door for 1.2278, immediately followed by the June 23 low at 1.2252.
The Relative Strength Index (RSI) is at 37, well below the 50-mid line edging slightly lower, indicating that bears are in control. However, fundamental and macroeconomic news suggests that market participants would remain on the sidelines, awaiting the Federal Reserve meeting.
-
16:37
BoE Preview: A close call – Danske Bank
On Thursday, the Banko of England (BoE) will announce its decision on monetary policy. According to analysts from Danske Bank, it is a close call whether the central bank hikes or not. On balance, they expect the BoE to keep monetary policy unchanged.
Key Quotes:
“The Bank of England (BoE) meeting on Thursday 4 November is going to be a key market mover this week. What was unthinkable in the beginning of the year, is now a real possibility. Will the BoE raise the Bank Rate or not? Investors have more or less fully priced in a 15bp rate hike while economists are evenly divided between unchanged and a 15bp rate hike. The sudden hawkish shift in September was a major driver of higher yields also in Europe, so BoE’s policy decision is also going to be interesting from a broader market perspective.”
“Bank of England has not pushed back on market pricing, but to some extent it probably also reflects that BoE policymakers have very different views on the economy. It is much more difficult for central banks to communicate to markets when policymakers disagree on the fundamental analysis of what is going on. If we are wrong, we expect a dovish hike, as we expect the BoE to say a hiking cycle will be “gradual and limited”.”
“A dovish rate hike is probably also what is needed for the hawks to get support from neutral and dovish BoE policymakers.”
“Markets are pricing in very aggressive rate hikes from the Bank of England until 2022 (a total of 125bp rate hikes from now until year-end 2022), which we believe is wrong – and at least very different from what the Bank of England communicated at the last meeting. We expect a total of 65bp rate hikes on the same horizon. It is also notably that markets are pricing lower rates starting from 2024.”
-
16:32
GBP/JPY Price Analysis: Bearish bias while below 156.50, key support around 155.50
- GBP/JPY moving sideways around 156.00 with a modest bearish bias.
- The negative momentum is easing; consolidation under 156.00 to trigger more losses.
The GBP/JPY continues to make lower highs but it failed to print fresh lows. It keeps getting rejection from under 156.00. A consolidation clearly under 156.00 should open the doors to more losses, targeting 155.65 first and then 155.35. The next support stands at 154.95.
On the upside, a firm recovery above 156.50, would put the price above the 21-SMA, improving the outlook for the pound. The next level to watch is the 157.00 zone followed by a downtrend line at 157.20. A break higher would negate the bearish bias, strengthening further the positive outlook.
Technical indicators are tilted to the downside but showing not much force. During the week, key economic reports in the US are due and also the Federal Reserve and Bank of England decisions, so volatility could rise sharply.
On a wider perspective, the correction in GBP/JPY from multi-year highs reached the 155.50/70 support area. A slide below should point to more losses. While if it holds above it could resume the upside move.
Technical levels
-
16:26
NZD/USD probing 0.7200, set to remain rangebound ahead of key risk events
- NZD/USD is probing the 0.7200 level and NZD is an outperformer on Monday, but the pair is within recent ranges.
- Catalysts for a break out of recent ranges include Wednesday’s NZ jobs data or FOMC meeting, or US NFP.
Despite a lack of any specific fundamental catalysts relating to New Zealand, the kiwi is one of the better performing G10 currencies on Monday, with NZD/USD nursing gains on the day of about 0.4%. Currently probing the 0.7200 level, the pair remains well within the well-established 0.7130-0.7220 range of the last week and a half. A stronger than expected number for the headline US ISM Manufacturing index for October (which came in at 60.8 versus forecasts for 60.5), as well as further increases in the employment subindex to 52 and prices paid index to an elevated 85.7, has thus far failed to result in broader USD strength, which is for now allowing NZD/USD to remain supported. The report contained further evidence that US (and hence global) manufacturing continues to suffer badly from supply chain disruptions, with auto production affected particularly badly, which should strengthen the Fed’s growing conviction that the supply side-driven inflation may take longer to fade.
Risk Events
Indeed, this week’s Fed meeting is a key event and will be a key driver of NZD/USD on Wednesday, as will the remainder of this week’s US data, such as the ISM Services PMI survey release (Wednesday) and October Labour Market Report (Friday). But FX market participants should also take note of key jobs data being released in New Zealand this week; the Q3 labour market report is set for release early on during Wednesday’s Asia Pacific session and the unemployment is seen dropping under 4.0% and potentially to its lowest since 2008. Westpac note that “employment indicators have all been notably strong over recent months, with job advertisements well above pre-Covid levels, unemployment benefit numbers falling, and filled jobs accelerating”, suggesting that the data should be strong and support the RBNZ’s stance that a gradual withdrawal of monetary policy stimulus is warranted.
If the range breaks
If NZD/USD breaks to the north of its recently established range, then technicians would likely target a test of the 26 May high at just above 0.7300 as the next stop for the pair. Strong NZ jobs data with hawkish implications for RBNZ policymaking could be a catalyst for a push in this direction. Conversely, if NZD/USD breaks its range to the south, the most immediate support to look at is around the 0.7100 level in the form of a bunch of recent lows and highs, as well as the 200-day moving average.
-
16:01
US ISM Manufacturing: Activity remains strong despite persistent supply issue – Wells Fargo
Data released on Monday showed the ISM Manufacturing Index dropped in October from 61.1 to 60.8; a reading above expectations. According to analysts at Wells Fargo, the report demonstrated that activity remains strong despite persistent supply issues. They point out purchasing managers across industries continue to cite strong demand.
Key Quotes:
“October's ISM manufacturing report demonstrates that activity remains strong despite persistent supply issues. The overall index slid to 60.8 last month, largely due to a 6.9 point drop in new orders. That said, purchasing managers across industries continue to cite strong demand. The largest gains came from two components that continue to be at the center of supply issues: prices paid and supplier deliveries.”
“The employment component of the ISM has diverged from other employment readings in recent months. But squaring the expansionary reading for October with the pickup in the other regional PMI employment indices bodes well for manufacturing hiring in October's nonfarm payroll report to be released Friday.”
“Our pressure gauge continues to demonstrate little, if any, improvement in supply issues. The number of ships on average awaiting port space off the West Coast rose to a record 67 in October and the price of shipping a container across the Pacific Ocean remains more than six times above pre-pandemic norms.”
-
15:37
USD/MXN jumps to highest in almost three weeks near 21.00
- Mexican peso under pressure across the board amid concerns about the economy.
- USD/MXN eyes 21.00, up for the fifth consecutive day.
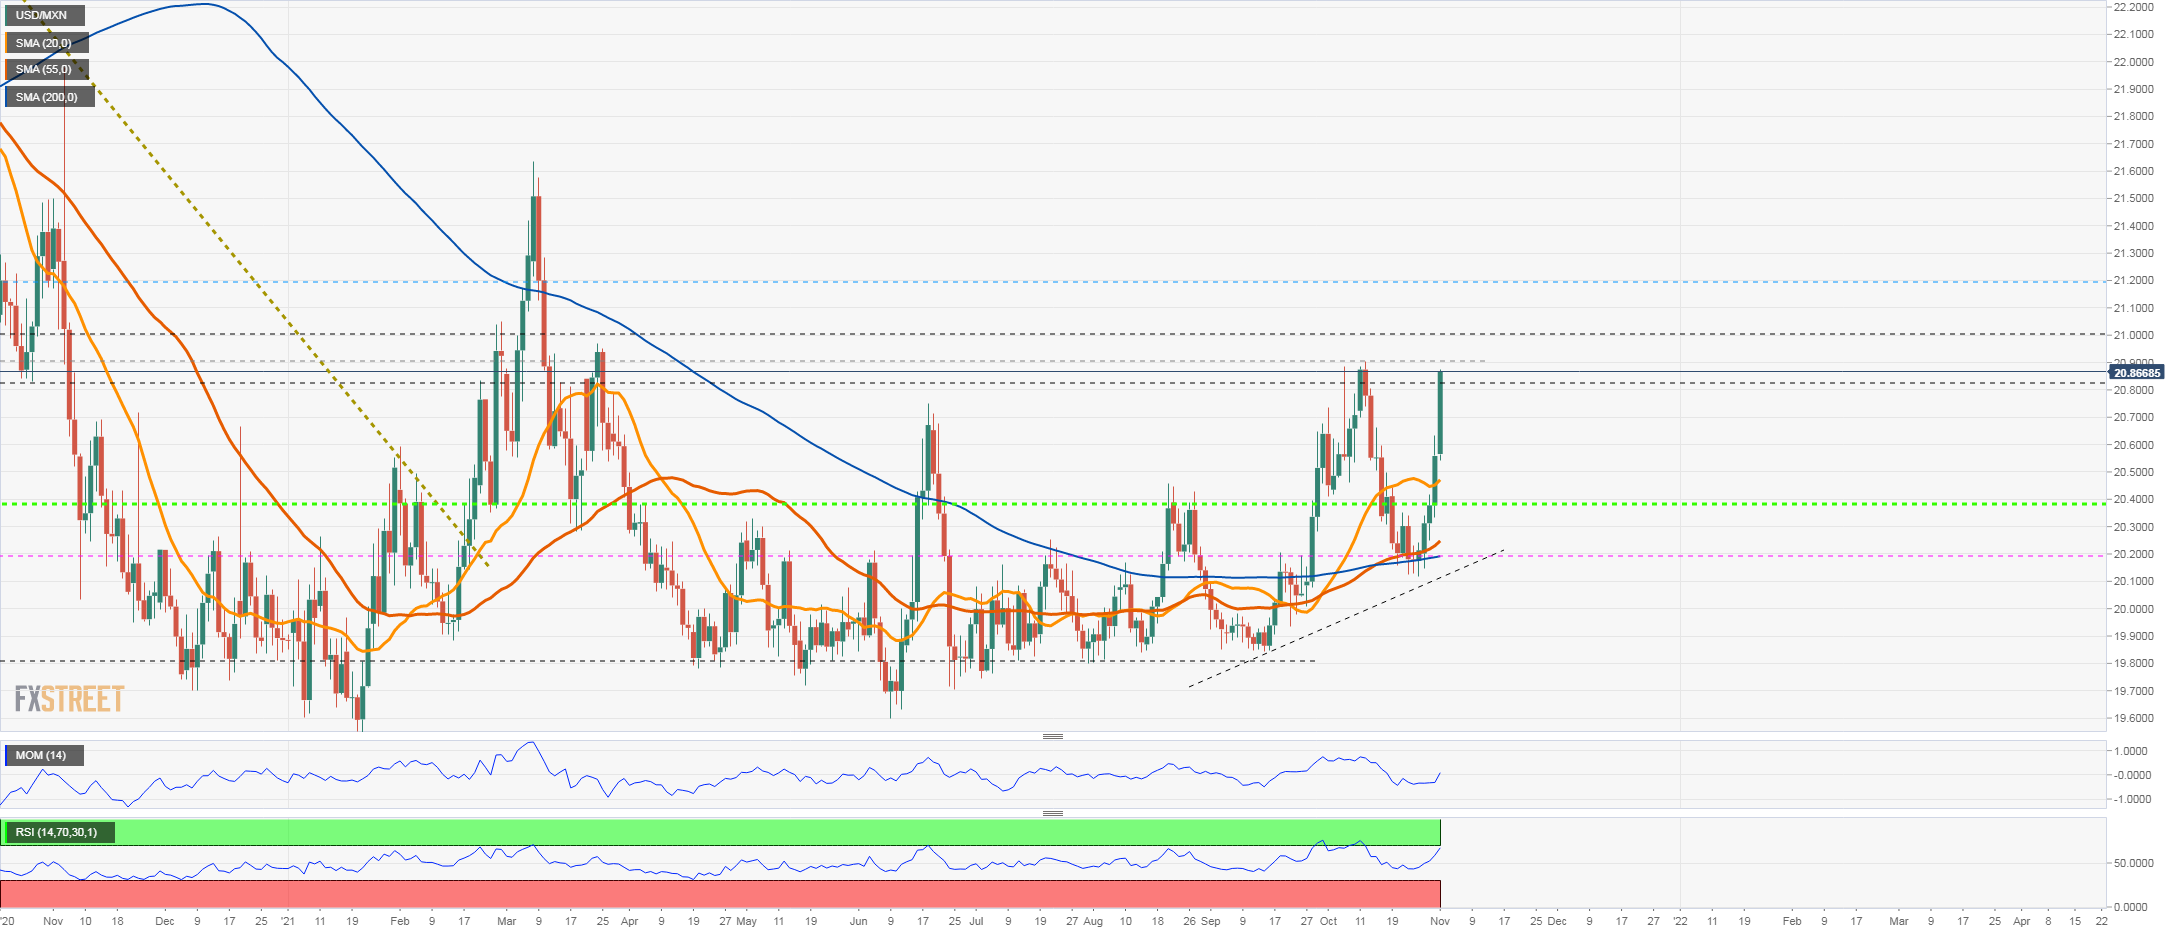
The USD/MXN is rising for the fifth consecutive day on Monday and it has accelerated the move reaching 20.85, the highest level since October 12. It remains near the highs with the bullish tone intact.
The MXN is being affected by increasing concerns about the health of the Mexican economy after it was reported last week a GDP contraction for the first time since the recovery from the COVID begun. At the same time, inflation remains elevated forcing the Bank of Mexico to raise rates.
The deterioration in the economic outlook weighs on the Mexican peso that continues among the worst performers. Not even an improvement in global risk appetite and in crude oil prices helped the currency.
Higher interest rates in the US are also affecting MXN. On Wednesday, the Federal Reserve will announce its decision on monetary policy that could impact on yields. Another relevant event will be the release of the US employment report on Friday.
The rally of the USD/MXN looks now at the 20.89 October highs. If it breaks higher, attention would turn to the 21.00 zone. The immediate short-term support has been moved to 20.70 and 20.50.
Technical levels
-
15:37
WTI buoyant above $84.00 with OPEC+ set to ignore international calls for faster output hikes
- WTI is currently trading above $84.00, up about 1.0% on the day and not far from annual highs at $85.50.
- Expectations that OPEC+ will not cave to international pressure and will continue to slowly increase oil production is supportive.
- Traders should also keep an eye on OPEC+ compliance to its deal, which is currently excessively strong.
Front-month futures of the American benchmark for sweet light crude, called West Texas Intermediary (commonly abbreviated to WTI) has slipped back from earlier session highs of just under $85.00 per barrel in recent trade, though continues to trade above the $84.00 per barrel level, for now, meaning the futures contract is still trading with gains on the day of about 1.0% and is less than $1.50 (or 1.5%) from the annual highs printed last week at close to $85.50.
Prices are higher at the start of the week despite an announcement by Chinese authorities during the Monday Asia Pacific session that they had released gasoline and diesel reserves in order to stabilise prices in some regions of the country, as traders instead focus on this Thursday’s OPEC+ meeting. Commodity strategists do not expect the cartel to deviate from its long-established policy of easing its output cuts at a gradual pace of 400K barrels per month, despite pressure from the international community (particularly from oil importers) to increase output at a faster rate. Over the weekend, US President Joe Biden insisted that oil-producing G20 countries boost output in order to ensure the strength and stability of the post-pandemic global economic recovery, though oil ministers from a number of OPEC+ nations have not taken notice and have, in recent days, thrown their support behind the cartel’s current output cut easing plans.
Analysts Bullish
The tone of analysts and market commentators on oil remains largely bullish; Goldman Sachs on Monday reaffirmed their $90.00 per barrel year-end target for Brent (currently trading just above $84.00), given their expectations for a supply deficit of 2.5M barrels per day. Analysts at oil brokerage PVM agree that the “fundamentals have not changed, and the oil market will remain tight in the near-term”, and a recent poll of 41 analysts and economists conducted by Reuters showed that Brent is expected to average around $80.00 per barrel for the rest of the year. One common theme underpinning the bullishness exhibited by many analysts is expectations that the shortage of natural gas in Europe will feed into higher oil demand as power companies switch strategically from using costlier natural gas to relatively less costly derivatives of crude oil.
Strong Compliance
Another OPEC+-related theme for oil traders to consider is the cartel’s excellent compliance to its current output cut deal; Reuters just published a survey that found that compliance with the pact rose to 118% in September, up from 114% in August. A number of OPEC+’s smaller producers have failed in recent months to keep up with the allowed increases in oil production under the cartel’s pact owing to a variety of idiosyncratic factors; the biggest drop was seen in Nigeria, where output fell by 70K barrels after a pipeline shutdown. Strong compliance is another factor underpinning bullish oil market conditions and a drop back to 100% or even below is one risk to watch, as it could encourage some profit-taking on profitable long-oil positions.
-
15:24
EUR/USD hovers around 1.1580 after mixed US PMI data
- The single currency begins November on the right foot after printing its third-consecutive month of losses.
- The market sentiment is mixed, thus mildly boosting the shared currency against the greenback.
- US ISM Manufacturing PMI figure was better than expected but trailed September’s reading.
The shared currency begins November on the right foot, advances 0.24%, trading at 1.1583 at the time of writing. The EUR/USD slid for the third consecutive month due to firm US dollar, higher US T-bond yields, and the expectations of a bond-tapering announcement, which increased on the Federal Reserve September 22 meeting. Also, reinforcing the abovementioned, Fed Chairman Jerome Powell, on a virtual event organized by the Bank of International Settlements, said, “I do think it is time to taper” but reiterated that it is not time to hike interest rates.
The market sentiment is mixed due to thin liquidity conditions as the Eurozone is on a public holiday. As of writing, US equity markets fluctuate between gainers and losers, with the Dow Jones Industrial being the highlight, touching 36,000 for the first time. Meanwhile, the greenback slides in the session, as shown by the US Dollar Index, which measures the buck’s performance against a basket of six rivals, down 0.05%, clings to 94.08.
On the macroeconomic front, the Eurozone economic docket featured the German Rerail Sales for September on an annual basis shrank 0.9% versus 1.8% foreseen by analysts, as data revealed by Destatis on Monday. The single currency barely blinked on the report announcement.
US ISM Manufacturing PMI figure was better than expected but trailed September’s reading
On the other hand, across the pond, the Institute for Supply Management (ISM) revealed the PMI Manufacturing for October, which rose to 60.8 more than the 60.6 expected but fell short against the September reading. Furthermore, the new orders dropped to a 16-month low as factories continued to experience raw materials shipment delays.
The hardest-hit industry was the motor vehicle. The industry witnessed the worst period for motor vehicle production since early 2009.
The EUR/USD reaction at the report was muted, as the pair has been range-bound between the 1.1560-1.1575 range. Further, the dynamics of the single currency would lie in the hands of the USD, as the Federal Reserve will host its November monetary policy meeting where market participants expect a bond-taper announcement to begin by mid-November.
On Tuesday, the economic docket will feature IHS Markit PMI Manufacturing indices for most of the Eurozone countries, and ECB’s Elderson will cross the wires.
EUR/USD Price Forecast: Technical outlook
Daily chart
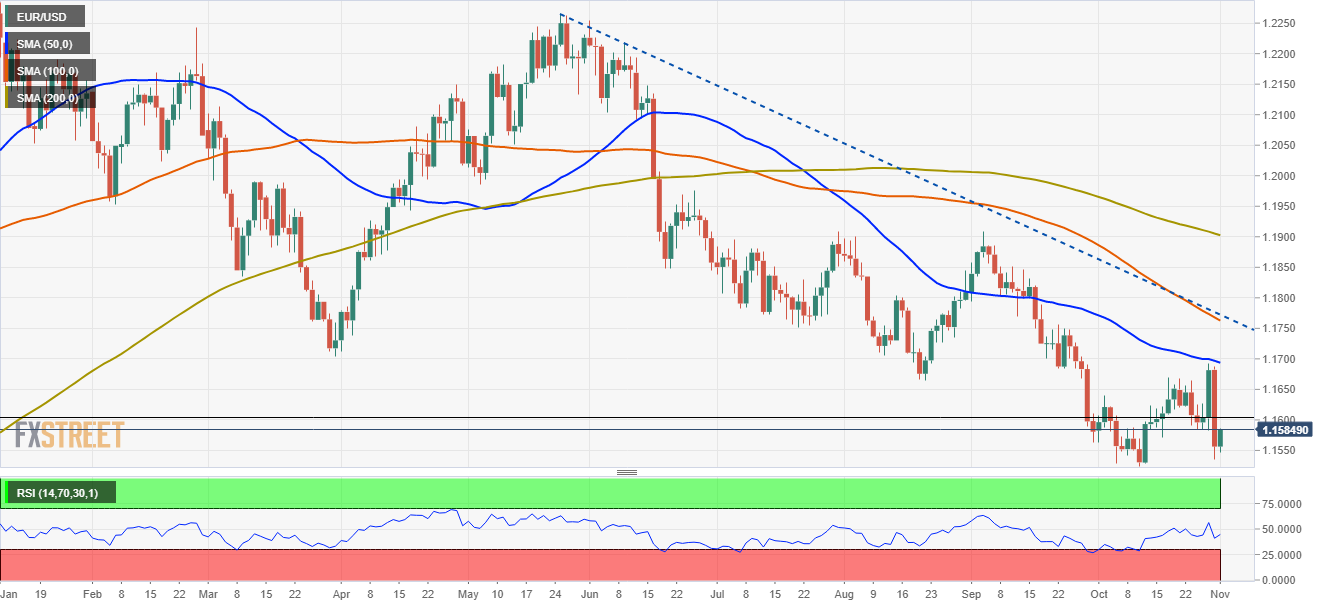
The EUR/USD has a downward bias, as witnessed by the daily moving averages (DMA’s) located above the spot price, with the 50-day being the closest one to the recent price action. At press time, the pair tests the October 28 low at 1.1581 previous support now turned resistance. Furthermore, momentum indicator like the Relative Strength Index (RSI) at 44 is below the 50 central line, exerting additional selling pressure on the pair.
In the case of a daily close above the latter, that would expose the 1.1600 figure, which in that case and following the trend, could be viewed as an opportunity for USD bulls to open fresh bets against the shared currency, in a renewed attempt towards 2021 low at 1.1524. However, caution is warranted as Fed’s November meeting is around the corner.
-
14:05
US: ISM Manufacturing PMI retreats to 60.8 in October vs. 60.6 expected
- October ISM Manufacturing PMI came in slightly better than the market expectation.
- US Dollar Index holds above 94.00 after the data.
The economic activity in the US manufacturing sector expanded at a pace in October with the ISM's Manufacturing PMI arriving at 60.8. This reading came in lower than September's print of 61.1 but surpassed the market expectation of 60.6.
Further details of the publication revealed that the Employment Index edged higher to 52 from 50.2 and the Prices Paid Index jumped to 85.7 from 81.2. Finally, the New Orders Index declined to 59.8 from 66.7.
Commenting on the data, "all segments of the manufacturing economy are impacted by record-long raw materials lead times, continued shortages of critical materials, rising commodities prices and difficulties in transporting products," noted Timothy R. Fiore, Chair of the Institute for Supply Management Manufacturing Business Survey Committee. "However, panel sentiment remains strongly optimistic, with four positive growth comments for every cautious comment."
Market reaction
The US Dollar Index edged slightly higher after this report and was last seen trading flat on the day at 94.13.
-
14:00
United States ISM Manufacturing PMI registered at 60.8 above expectations (60.6) in October
-
14:00
United States ISM Manufacturing Prices Paid came in at 85.7, above expectations (78.4) in October
-
14:00
United States Construction Spending (MoM) below expectations (0.4%) in September: Actual (-0.5%)
-
14:00
United States ISM Manufacturing Employment Index registered at 52 above expectations (49.6) in October
-
14:00
United States ISM Manufacturing New Orders Index below expectations (66.9) in October: Actual (59.8)
-
13:54
US: Markit Manufacturing PMI declines to 58.4 in October vs. 59.2 expected
- US Markit Manufacturing PMI edged lower in October.
- US Dollar Index stays in a consolidation phase above 94.00.
The economic activity in the US manufacturing sector continued to expand in October, albeit at a slightly slower pace than it did in September, with IHS Markit's Manufacturing PMI declining to 58.4 (final) from 60.7. This reading fell short of the flash estimate and the market expectation of 59.2.
Commenting on the data, “October saw US manufacturers report yet another near-record lengthening of supply chains, with shortages of components constraining production growth to the lowest since July of last year," noted Chris Williamson, Chief Business Economist at IHS Markit. "Although production growth has now slipped below the pre-pandemic long-run average due to the supply and labor constraints, demand growth – as measured by new order inflows – remains well above trend despite easing in October."
Market reaction
The US Dollar Index continues to fluctuate in a tight range above 94.00 after this data.
-
13:54
AUD/USD Price Analysis: Bulls have the upper hand, RBA eyed for fresh impetus
- AUD/USD attracted some dip-buying on Monday and refreshed daily tops in the last hour.
- A modest USD pullback extended some support to the pair amid the prevalent risk-on mood.
- Investors now look forward to the RBA on Tuesday ahead of the critical FOMC policy meeting.
The AUD/USD pair showed resilience below the key 0.7500 psychological mark and attracted some dip-buying on the first day of a new week. The pair built on its steady intraday ascent and climbed to fresh daily tops, around the 0.7525 region during the early North American session.
The US dollar struggled to preserve its modest intraday gains, instead witnessed a modest pullback from two-and-half-week tops. This, along with the risk-on mood, acted as a tailwind for the perceived riskier aussie and assisted the AUD/USD pair to find decent support near the 0.7485 region.
The upside, however, seems limited as investors might refrain from placing aggressive bets heading into this week's key central bank event risks. The Reserve Bank of Australia will announce its policy decision on Tuesday and set the tone ahead of the critical FOMC policy update on Wednesday.
Looking at the technical picture, the recent strong positive move witnessed over the past one month or so stalled near the very important 20-day SMA. The mentioned barrier, currently around the 0.7555 region, should now act as a key pivotal point and help determine the near-term trajectory.
Meanwhile, technical indicators on the daily chart are holding comfortably in the bullish territory and support prospects for additional gains. That said, it will still be prudent to wait for a sustained move beyond the 200-DMA before positioning for a further appreciating move for the AUD/USD pair.
The next relevant resistance is pegged near July monthly swing highs, around the 0.7600 round figure, which if conquered should pave the way for a move towards testing the 0.7650-55 intermediate hurdle. The AUD/USD pair could extend the momentum further and aim to reclaim the 0.7700 mark.
On the flip side, the 0.7485-80 region now seems to have emerged as immediate strong resistance. A convincing break below might prompt some long-unwinding and accelerate the slide towards the 0.7400 mark. The corrective pullback could further get extended towards the 0.7325-20 static support.
AUD/USD daily chart
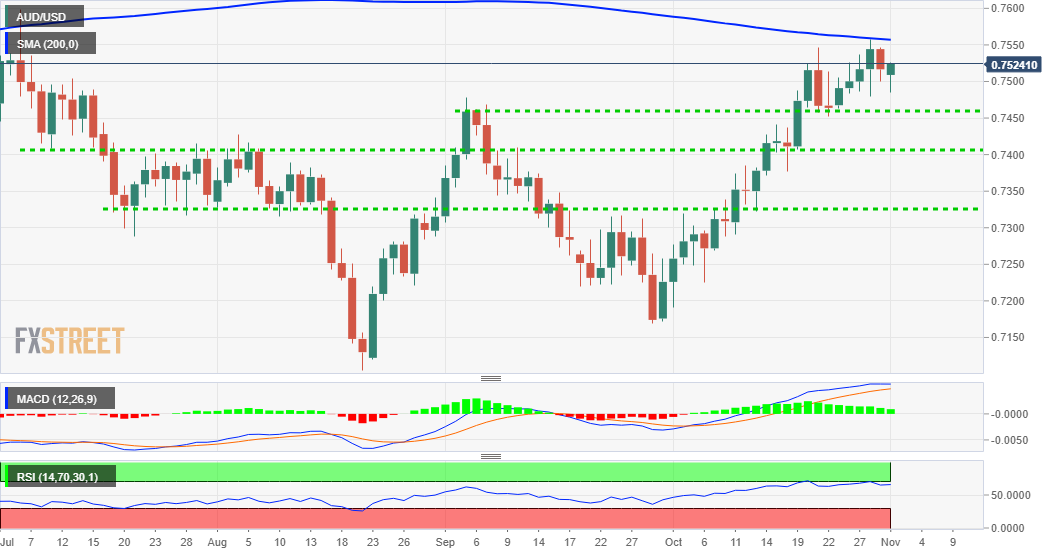
Technical levels to watch
-
13:48
S&P 500 Index notches new record high above 4,600
- Wall Street's main indexes started the new week higher.
- Energy shares post strong gains on rising crude oil prices.
- Technology stocks underperform after the opening bell on Monday.
Major equity indexes in the US started the new week on a firm footing. At the moment, the S&P 500 is trading at a new all-time high of 4,613, rising 0.17% on a daily basis. In the meantime, the Dow Jones Industrial Average is rising 0.45% at 35,984 and the Nasdaq Composite is gaining 0.15% at 15,520.
Among the 11 major S&P 500 sectors, the Energy Index is up more than 1% fueled by a 1.8% increase witnessed in US crude oil prices. On the other hand, the Technology Index is losing 0.28% after the opening bell.
Later in the session, the ISM Manufacturing PMI will be featured in the US economic docket.
S&P 500 chart (daily)
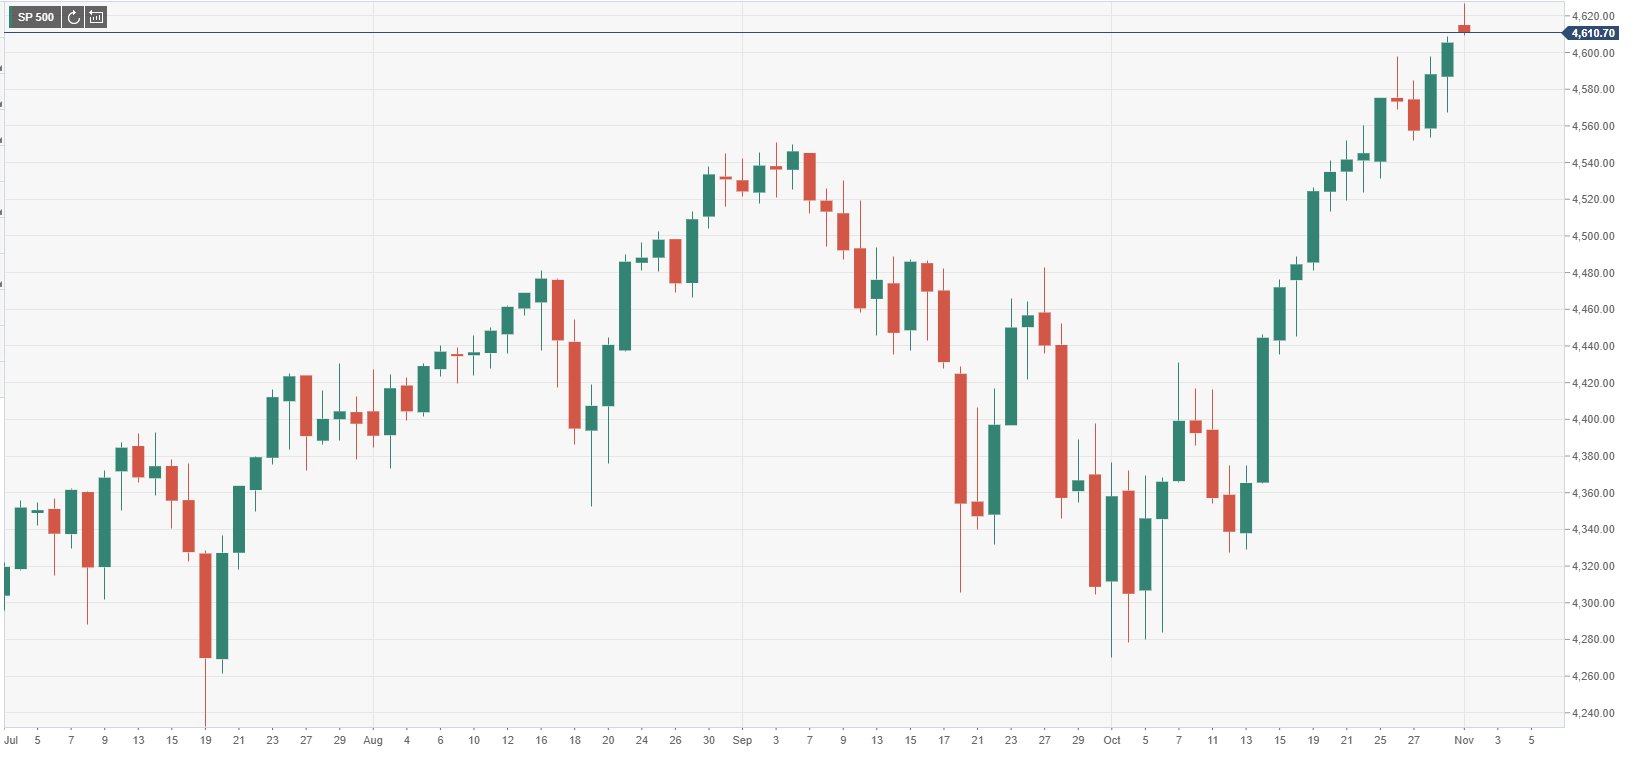
-
13:45
United States Markit Manufacturing PMI came in at 58.4, below expectations (59.2) in October
-
13:45
U.S.: Manufacturing PMI, October 58.4 (forecast 59.2)
-
13:43
Gold Price Analysis: XAU/USD steadies around $1790 as key US data eyed
- Spot gold is subdued close to $1790 ahead of the release of US ISM Manufacturing PMI.
- XAU/USD may remain subdued ahead of key events later in the week including the FOMC meeting and US NFP.
A rally in the US dollar last Friday that saw the Dollar Index (DXY) surge from the low 93.00s back to the north of the 94.00 took the wind out of spot gold (XAU/USD)’s sail at the end of last week, pushing the precious metal back to the south of its 200-day moving average (DMA) at $1792/oz and even briefly below both its 50 and 21DMAs at just above $1780 and $1777 respectively. But XAU/USD (+0.3% this morning) has regained some composure at the start of the new week and month and is currently trading just under the $1790 level, more than $15 (or nearly 1.0%) above last week’s lows.
That’s mostly down to the fact that the DXY has eased back from overnight highs around 94.30 and is at risk of breaking below the 94.00 level again ahead of the release of the much anticipated ISM Manufacturing PMI report at 1400GMT. Note that the time difference between the London and New York is currently four hours (rather than the usual five), given that the UK reverted back from daylight saving time over the weekend and the US does not until this weekend, hence why the ISM data is being released one hour earlier than usual in UK time. In terms of what to expect; consensus expectations are for the headline ISM Manufacturing PMI index number to come in at 60.5, a light moderation from September’s 61.1, indicating that growth in the sector remains robust in early Q4. Market participants will be on the lookout for fresh evidence as to the impact of ongoing supply chain disruptions and bottlenecks on US industry, however.
If weaker than expected data was enough to push the DXY back below the 94.00 level, this would likely help propel spot gold prices back towards the $1800 level and perhaps back above its 200DMA. The fact that weaker than expected US ISM data might also weigh on US real yields (which have already been subdued in recent weeks with the 10-year TIPS yield around -1.0%) would be of further help to the precious metal – remember that non-yielding gold has an inverse correlation to real yields, with rising real yields increasing the opportunity cost of holding gold and thus reducing its appeal.
Most likely, if the data is close to expectations, the broader market reaction is likely to be subdued. A host of further key central bank and economic data releases await later in the week, many of which overshadow today’s ISM manufacturing survey release, including monetary policy decisions from the Fed (Wednesday), BoE (Thursday), and RBA (Tuesday), and US NFP (Friday). These are likely to be the key drivers of gold this week; a dovish Fed outcome and weaker US jobs and ISM data could see XAU/USD testing resistance around $1810, while a hawkish outcome and strong data could see XAU/USD drop towards support around $1750.
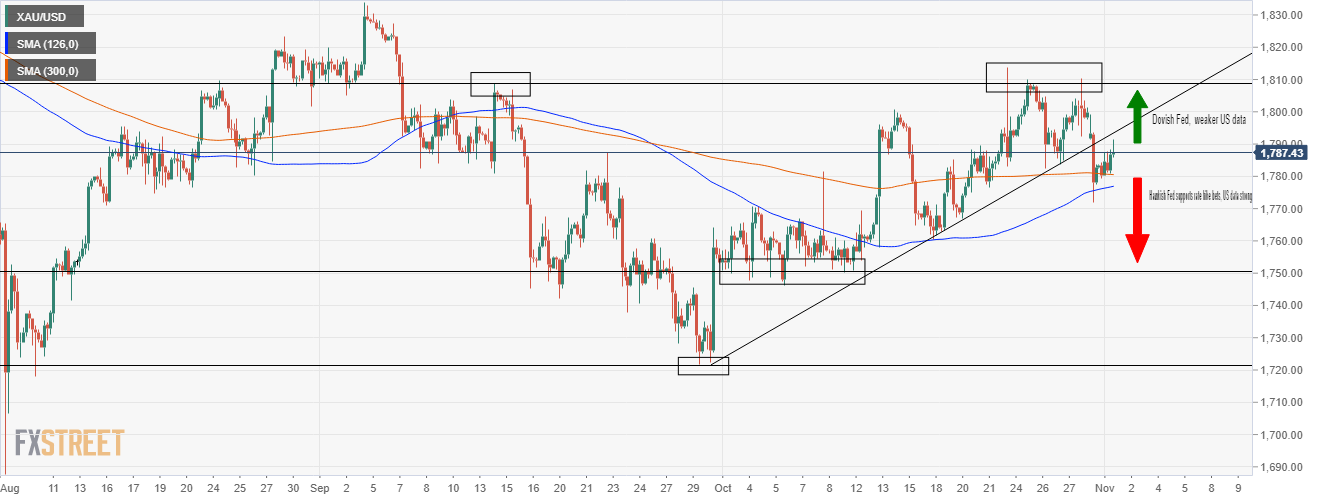
-
13:39
Canada: Markit Manufacturing PMI improves to 57.7 in October vs. 57.2 expected
- Canada Markit Manufacturing PMI continued to edge higher in October.
- USD/CAD continues to fluctuate below 1.2400 on Monday.
The business activity in Canada's manufacturing sector continued to expand at a robust pace in October with the Markit Manufacturing PMI rising to 57.7 from 57 in September. This print came in better than the market expectation of 57.2.
Commenting on the data, "latest PMI data revealed that Canada's manufacturing sector performed strongly, continuing 2021’s run of robust growth," said Shreeya Patel, Economist at IHS Markit. "Concerns surrounding supply were reinforced with severe delivery delays and near-record increases in costs again evident in October."
Market reaction
The USD/CAD pair showed no immediate reaction to this report and was last seen losing 0.07% on the day at 1.2378.
-
13:30
Canada Markit Manufacturing PMI came in at 57.7, above forecasts (57.2) in October
-
13:16
When is the US ISM Manufacturing PMI and how could it affect EUR/USD?
US ISM Manufacturing PMI overview
The Institute of Supply Management (ISM) will release its latest manufacturing business survey result, also known as the ISM Manufacturing PMI at 14:00 GMT this Monday. The index is anticipated to ease from a four-month high level of 61.1 to 60.4 in October, still pointing to robust growth in the manufacturing sector activity. Given that the Fed looks more at the labour market and inflation than growth, investors will also keep a close eye on the Employment and Prices Paid sub-component.
How could it affect EUR/USD?
Ahead of the key release, the risk-on mood prompted some profit-taking around the safe-haven US dollar and assisted the EUR/USD pair to move away from over two-week lows touched on Friday. That said, elevated US Treasury bond yields should help limit the USD losses. A stronger headline print will reaffirm hawkish Fed expectations and revive the USD demand, capping the upside for the major.
Conversely, a weaker reading is likely to be overshadowed by prospects for an early policy tightening by the Fed, which should continue to act as a tailwind for the greenback. This, in turn, suggests that the path of least resistance for the EUR/USD pair remains to the downside and the attempted recovery move runs the risk of fizzling out rather quickly.
Meanwhile, Valeria Bednarik – Chief Analyst at FXStreet – offered a brief technical outlook and important technical levels to trade the major: "According to the 4-hour chart, the bearish case is still in place, despite the ongoing recovery. The pair stands below all of its moving averages, with the 20 SMA crossing below the 100 SMA. Technical indicators, in the meantime, hold within negative levels, with neutral-to-bearish stances. The pair needs to break below 1.1523, the year low, to resume its decline, aiming then to 1.1470, a long-term static support area."
Key Notes
• EUR/USD Forecast: Focus remains on inflation and central banks
• EUR/USD Forecast: Euro bears retain control in quiet start to the week
• EUR/USD Price Analysis: Defends critical daily support line amid light trading
About the US ISM manufacturing PMI
The Institute for Supply Management (ISM) Manufacturing Index shows business conditions in the US manufacturing sector. It is a significant indicator of the overall economic condition in the US. A result above 50 is seen as positive (or bullish) for the USD, whereas a result below 50 is seen as negative (or bearish).
-
13:02
Brazil HSBC PMI Manufacturing down to 51.7 in October from previous 54.4
-
12:58
GBP/USD bounces at 1.3650, but upside capped amid worsening UK/EU tensions
- GBP/USD is off 1.3650ish lows but is seeing its upside capped amid heightened EU/UK tensions.
- The UK/France “fishing row” is escalating and risks evolving into a trade/legal battle.
- FX markets will likely remain subdued ahead of key events this week including BoE and Fed meetings and US NFP.
GBP/USD has seemingly found some support at 1.3650 and in recent trade has gradually risen back to around 1.3675. FX markets are broadly trading with a lack of conviction at the moment and will likely continue to do so ahead of the release of the US ISM Manufacturing PMI survey at 1400GMT. Even then, the rest of the week is packed with risk events, including monetary policy decisions from the Fed, BoE and RBA and labour market data out of the US, Canada and New Zealand – as a result, traders may want to keep their powder dry for now as they see how things play out, reducing the likelihood of big FX market moves.
The heavy manner in which GBP/USD is currently trading - the pair isn’t currently demonstrating much eagerness to challenge its 21-day moving average at 1.3694, the psychological 1.3700 level or resistance in the form of the 18 and 27 October lows around 1.3710 – may be a reflection of concerns regarding UK/France & EU relations. Indeed, there appears to be no end in sight to the rapid escalation of the “fishing row” between the UK and France, with the latter threatening to impose cross channel trade-related restrictions and enforce new restrictions on UK fishing boats in French waters if the UK doesn’t grant more licenses to the French fishing industry, while the latter is now threatening to sue France over these threats. Meanwhile, tensions between the UK and EU as a whole regarding the Northern Ireland Protocol remain front and centre, with the UK on the cusp of triggering Article 16, which would allow it to take unilateral action to address problems with trade arrangements in the country.
Looking ahead to the rest of the week; the aforementioned Fed monetary policy meeting and labour markets reports, as well as the ISM PMI surveys, will be key to watch as indicators of broader USD direction, but for pound sterling, watching how Brexit-related events unfold and Thursday’s Bank of England meeting will be key. At the moment, money market pricing sees the prospect of a 15bps rate hike from the bank (to take rates to 0.25%) as a coin toss. Meanwhile, the bank’s economic forecasts are seen as a key determinant of longer-term BoE rate hike expectations.
-
12:44
USD/CHF slides to 0.9130-25 area, back closer to two-month lows set on Friday
- USD/CHF met with fresh supply on Monday and eroded a major part of Friday’s recovery gains.
- A modest USD pullback from over two-week tops seemed to be the only factor exerting pressure.
- The downside seems limited amid the risk-on mood, rising US bond yields, hawkish Fed expectations.
The USD/CHF pair extended its steady intraday descent heading into the North American session and dropped to fresh daily lows, around the 0.9130 region in the last hour.
The pair met with some fresh supply on the first day of a new week and has now reversed a major part of Friday's recovery gains from the 0.9100 mark, or two-month lows. The US dollar witnessed a modest intraday pullback following an early uptick to the highest level since October 13. This, in turn, exerted some pressure on the USD/CHF pair, though a combination of factors should help limit deeper losses.
Investors now seem convinced that the Fed would be forced to adopt a more aggressive policy response to contain stubbornly high inflation. The speculations were further fueled by Friday's US Core PCE Price Index, which indicated that consumer cost pressures are getting entrenched. Hawkish Fed expectations triggered a fresh leg up in the US Treasury bond yields, which should act as a tailwind for the greenback.
Moreover, investors might also refrain from placing aggressive bets, rather prefer to wait on the sidelines ahead of the critical two-day FOMC monetary policy meeting starting Tuesday. This makes it prudent to wait for a sustained break below the 0.9100 mark before positioning for any further depreciating move. Traders now look forward to the release of the US ISM Manufacturing PMI for some short-term impetus.
Technical levels to watch
-
12:28
UK PM Johnson's spokesman: We want France to step back from sanction threats
British Prime Minister Boris Johnson's spokesman told reporters on Monday that they want to see France step back from the sanction threats it had made, as reported by Reuters.
The spokesman further noted that Britain's ambassador in Paris had been in regular contact with French officials.
Market reaction
These comments don't seem to be having a noticeable impact on the British pound's performance against its major rivals. At the time of press, the GBP/USD pair was down 0.1% on a daily basis at 1.3678.
-
12:04
USD/JPY eases from over one-week tops, still well bid above 114.00 mark
- USD/JPY gained positive traction for the second straight session on Monday.
- The risk-on mood undermined the safe-haven JPY and remained supportive.
- A modest USD pullback from over two-week tops capped gains for the major.
The USD/JPY pair maintained its bid tone through the mid-European session, albeit has retreated a few pips from one-and-half-week tops touched earlier this Monday. The pair was last seen hovering around the 114.20-25 region, still up nearly 0.25% for the day.
Japanese Prime Minister Fumio Kishida's Liberal Democratic Party won more seats than expected in the general election and lifted expectations for additional measures to stimulate the economy. This, in turn, boosted investors' sentiment, which was evident from a generally positive tone around the equity markets. The risk-on impulse undermined the safe-haven Japanese yen and pushed the USD/JPY pair higher for the second straight session on Monday.
However, a modest US dollar pullback from two-and-half-week tops failed to impress bullish traders or provide any additional boost to the USD/JPY pair. The intraday positive move faltered just ahead of mid-114.00s, though any meaningful pullback is likely to remain limited amid a goodish pickup in the US Treasury bond yields. Investors might also prefer to wait on the sidelines heading into this week's critical FOMC monetary policy meeting.
The markets seem convinced that the Fed would be forced to adopt a more aggressive policy response to contain stubbornly high inflation. The speculations were fueled by Friday's US Core PCE Price Index – the Fed's preferred inflation gauge – that held near 30-year highs and indicated that consumer cost pressures are getting entrenched. This was seen as a key factor behind the latest leg up in the US bond yields, which could act as a tailwind for the USD.
The Fed is scheduled to announce its decision on Wednesday and influence the USD price dynamics. Apart from this, Friday's release of the closely-watched US monthly jobs report (NFP) will play a key role in determining the near-term trajectory for the USD/JPY pair. In the meantime, traders on Monday will take cues from the release of US ISM Manufacturing PMI and the broader market risk sentiment to grab some short-term opportunities around the major.
Technical levels to watch
-
12:00
Turkey Exports remains unchanged at $20.8B in October
-
11:43
US Treasury Sec. Yellen: I don't think US economy is overheating
US Treasury Secretary Janet Yellen said on Monday that she doesn't think that the US economy is overheating, as reported by Reuters.
Yellen added that the labour force participation in the US has declined and noted they jobs are still 5 million below pre-pandemic levels.
Regarding the inflation outlook, "the US inflation is higher than in recent years but it's pandemic-related," she argued. "I believe inflationary pressures will ease, we do not have an economy overheating in the longer sense."
Market reaction
These comments don't seem to be having a noticeable impact on the dollar's performance against its rivals. As of writing, the US Dollar Index was down 0.07% on the day at 94.07.
-
10:29
EUR/GBP clings to gains near two-week tops, around 0.8470-75 region
- EUR/GBP caught some fresh bids on Monday and climbed to over two-week tops.
- Brexit jitters acted as a headwind for the British pound and remained supportive.
- Hawkish BoE expectations held bulls from placing aggressive bets around the cross.
The EUR/GBP cross maintained its bid tone through the first half of the European session and was last seen hovering around the 0.8470 area, just below over two-week tops set earlier this Monday.
Following Friday's downfall, the EUR/GBP cross regained traction on the first day of a new week and is now looking to build on its recovery from YTD lows, around the 0.8400 mark touched last week. The British pound's relative underperformance comes amid the ongoing dispute over the post-Brexit fishing rights between the UK and France.
In the latest development, France seized a British boat last week and the UK threatened to take retaliatory action. On Sunday, the UK Prime Minister Boris Johnson and French President Emmanuel Macron met to ease the tension, though remain at loggerheads. Apart from this, a row over the Northern Ireland Protocol acted as a headwind for the sterling.
On the other hand, a subdued US dollar demand extended some support to the shared currency, which was seen as another factor that provided a modest lift to the EUR/GBP cross. That said, expectations for an imminent rate hike move by the Bank of England held traders from placing aggressive bearish bets around the GBP and capped gains for the cross.
On the economic data front, the UK Manufacturing PMI was finalized at 57.8 for September as against the 57.7 estimated originally. The data, however, did little to provide any meaningful impetus. The focus remains on the upcoming BoE monetary policy meeting on Thursday, which will help determine the near-term trajectory for the EUR/GBP cross.
Technical levels to watch
-
09:45
AUD/USD trades with modest losses around 0.7500 mark, lacks follow-through
- AUD/USD edged lower for the second successive day on Monday amid a modest USD strength.
- The downside remains cushioned ahead of the key central bank events – RBA/FOMC meetings.
The AUD/USD pair quickly recovered a few pips from the early European session lows and was last seen trading with only modest intraday losses, around the key 0.7500 psychological mark.
The pair extended Friday's retracement slide from the 0.7555-60 region, or the highest level since early July and witnessed some follow-through selling on the first day of a new week. This marked the second successive day of a negative move for the AUD/USD pair and was sponsored by a modest US dollar strength.
The USD remained well supported by expectations that the Fed would be forced to adopt a more aggressive policy response to contain stubbornly high inflation. The speculations were fueled by Friday's US Core PCE Price Index – the Fed's preferred inflation gauge – that held steady near 30-year highs in September.
Meanwhile, fears of a faster than expected rise in inflation, along with signs of a global economic slowdown have raised concerns about the risk of stagflation. This further benefitted the safe-haven greenback, through a generally positive tone around the equity markets helped limit losses for the perceived riskier aussie.
Apart from this, rising bets for an interest rate hike by the Reserve Bank of Australia (RBA) extended some support to the AUD/USD pair. Hence, the market focus will remain glued to this week's key central bank event risks. The RBA will hand down its policy update on Tuesday, while the Fed is scheduled to announce its decisions on Wednesday.
In the meantime, traders might prefer to wait on the sidelines and refrain from placing aggressive bets, which should lead to an extension of a subdued/range-bound price action. That said, Monday's release of the US ISM Manufacturing PMI might influence the USD and provide some impetus later during the early North American session.
Technical levels to watch
-
09:32
United Kingdom Markit Manufacturing PMI came in at 57.8, above forecasts (57.7) in October
-
09:31
UK Final Manufacturing PMI revised higher to 57.8 in October, beats estimates
The UK manufacturing sector activity expanded in October, the final report from IHS Markit confirmed on Monday.
The seasonally adjusted IHS Markit/CIPS UK Manufacturing Purchasing Managers’ Index (PMI) was revised higher from 57.7 to 57.8 in October, beating expectations of 57.7.
Key points
New order growth ticks higher despite drop in new export work.
Selling prices rise at record pace.
Rob Dobson, Director at IHS Markit, commented on the survey
“Growth of UK manufacturing production slowed further during October, with output volumes rising only slightly and at the weakest pace for eight months. Strained global supply chains are disrupting production schedules, while staff shortages and declining intakes of new export work are also stymieing the upturn.”
“This low growth environment is occurring in tandem with a severe upshot in inflationary pressures, with manufacturers reporting both a near-record increase in input costs and record rise in selling prices.”
GBP/USD reaction
At the press time, GBP/USD is trading around 1.3660, stuck in range after Friday’s steep sell-off. The spot is down 0.22% on the day.
-
09:15
USD/CAD remains confined in a range below 1.2400 mark
- USD/CAD struggled to capitalize on Friday’s weaker Canadian GDP-led gains.
- Hawkish Fed expectations underpinned the USD and extended some support.
- Investors eye US ISM PMI for some impetus ahead of the key FOCM meeting.
The USD/CAD pair lacked any firm directional bias on Monday and remained confined in a narrow trading band, below the 1.2400 mark through the early European session.
The pair, so far, has struggled to gain any meaningful traction and continued with its sideways consolidative price action on the first day of a new week. As investors looked past Friday's disappointing Canadian GDP print for August, a more hawkish Bank of Canada acted as a tailwind for the domestic currency and capped the upside for the USD/CAD pair.
It is worth recalling that the BoC surprised investors last Wednesday by abruptly ending its bond-buying programme and pulling forward its expected timeline for interest rate hikes. The Canadian central bank forecast that inflation is on pace to hit the 2% target in the second or third quarter of 2022, setting the stage for an early interest rate hike move.
That said, a combination of factors continued lending some support to the USD/CAD pair. A softer tone around oil prices held traders from placing aggressive bullish bets around the commodity-linked loonie. Apart from this, a modest US dollar strength further collaborated to limit the downside for the major, at least for the time being.
The USD stood tall near two-and-half-week tops and drew support from growing acceptance that the Fed would be forced to adopt a more aggressive policy response to contain stubbornly high inflation. The speculations were further fueled by Friday's release of the Core PCE Price Index – the Fed's preferred inflation gauge – that held steady near 30-year highs in September.
Hence, the market focus will remain on the outcome of a two-day FOMC policy meeting, scheduled to be announced on Wednesday. In the meantime, traders might take cues from Monday's release of the US ISM Manufacturing PMI. This, along with oil price dynamics, might provide some impetus and allow traders to grab some short-term opportunities around the USD/CAD pair.
Technical levels to watch
-
09:10
Greece Markit Manufacturing PMI climbed from previous 58.4 to 58.9 in October
-
09:09
FX option expiries for November 1 NY cut
FX option expiries for November 1 NY cut at 10:00 Eastern Time, via DTCC, can be found below.
- EUR/USD: EUR amounts
- 1.1625 920m
- 1.1700 522m
- GBP/USD: GBP amounts
- 1.3700 306m
- USD/JPY: USD amounts
- 111.00 945m
- USD/CHF: USD amounts
- 0.9320 858m
- AUD/USD: AUD amounts
- 0.7480 434m
- 0.7550 361m
- 0.7600 500m
- USD/CAD: USD amounts
- 1.2350 747m
-
09:02
EUR/USD Price Analysis: Defends critical daily support line amid light trading
- EUR/USD has found some support near 1.1540 prize zone.
- 21-DMA could challenge the road to recovery for the EUR bulls.
- The EUR sellers continue to target the yearly lows at 1.1524.
EUR/USD is looking to extend its rebound from two-week lows of 1.1535, as the US dollar is reversing Friday’s massive rally amid the improving market mood.
The greenback rallied hard on Friday, as the Fed’s rate hike expectations ramped on rising US price pressures, as showed by the US PCE Price Index. The month-end buying into the dollar also boded ill for the major.
Meanwhile, dovish ECB and mixed Eurozone macro news weighed negatively on the euro. Attention now turns towards the US ISM Manufacturing PMI data and the sentiment on Wall Street for fresh trading impetus. Note that most major European markets are closed in observance of a public holiday.
Looking at EUR/USD’s daily chart, the price is bouncing off the rising trendline support, connecting the yearly lows of 1.1524 and Friday’s low of 1.1535, at 1.1538.
If the recovery momentum picks up pace, then the horizontal 21-Daily Moving Average (DMA) at 1.1597.
Further up, the 1.1650 psychological barrier will come into play.
The 14-Day Relative Strength Index (RSI) is edging higher towards the midline, currently at 42.93, suggesting that the downside remains intact while the leading indicator stays below the 50.00 central line.
EUR/USD: Daily chart
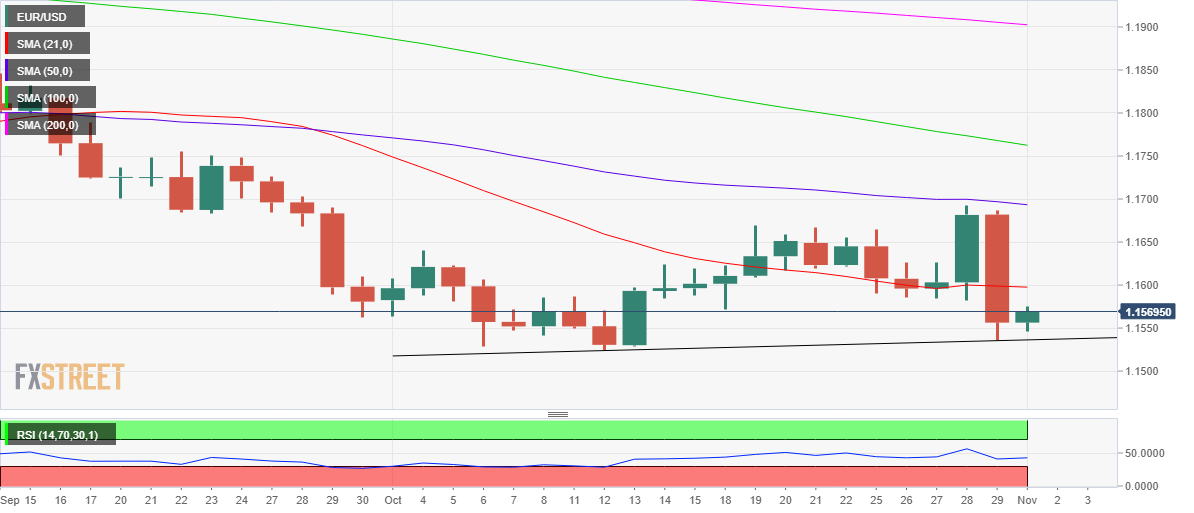
Alternatively, a daily closing below the aforesaid support line will threaten the 2021 low of 1.1524.
The next stop for EUR sellers is seen at the 1.1500 round figure. On selling resurgence, the July 2020 levels around mid-1.1400s will be tested.
EUR/USD: Additional levels to consider
-
08:30
Switzerland SVME - Purchasing Managers' Index below expectations (65.5) in October: Actual (65.4)
-
08:20
GBP/USD bounces off multi-week lows, finds some support near mid-1.3600s
- GBP/USD dropped to near three-week lows during the early part of the trading action on Monday.
- Brexit jitters weighed on the British pound and exerted some pressure amid a modest USD strength.
- Investors now seemed reluctant to place aggressive bets heading into the key central bank meetings.
The GBP/USD pair witnessed some selling during the early European session and dropped to near three-week lows in the last hour, albeit quickly recovered a few pips thereafter. The pair was last seen trading with only modest intraday losses, around the 1.3665-70 region.
Following a brief consolidation through the first half of the trading action on Monday, the GBP/USD pair met with a fresh supply and was weighed down by a combination of factors. The ongoing dispute over the post-Brexit fishing rights between the UK and France, along with a row over the Northern Ireland Protocol acted as a headwind for the British pound.
In the latest development, France seized a British boat last week and the UK threatened to undertake retaliatory action. On Sunday, the UK Prime Minister Boris Johnson and French President Emmanuel Macron met to ease the tension, though remain at loggerheads. Apart from this, a modest US dollar strength exerted some pressure on the GBP/USD pair.
The USD stood tall near two-and-half-week tops amid growing acceptance that the Fed would be forced to adopt a more aggressive policy response to contain stubbornly high inflation. The speculations were further fueled by Friday's release of the Core PCE Price Index – the Fed's preferred inflation gauge – that held steady near 30-year highs in September.
That said, expectations for an imminent rate hike by the Bank of England helped limit any deeper losses and assisted the GBP/USD pair to find some support near mid-1.3600s. Investors also seemed reluctant to place aggressive bets heading into this week's key central bank events, the FOMC policy meeting ending on Wednesday and the BoE decision on Thursday.
Hence, it will be prudent to wait for some follow-through selling before traders start positioning for an extension of last week's rejection slide from the 1.3830-35 heavy supply zone. Market participants now look forward to the final UK Manufacturing PMI. Apart from this, the US ISM Manufacturing PMI might provide some impetus to the GBP/USD pair.
Technical levels to watch
-
08:07
Russia HSBC Manufacturing PMI increased to 51.6 in October from previous 49.8
-
08:03
Netherlands, The Markit Manufacturing PMI climbed from previous 62 to 62.5 in October
-
07:40
USD/JPY climbs to over one-week tops, eyeing mid-114.00s
- A combination of factors pushed USD/JPY higher for the second straight session on Monday.
- A positive risk tone undermined the safe-haven JPY and remained supportive of the move up.
- The USD benefitted from hawkish Fed expectations and provided an additional lift to the pair.
The USD/JPY pair edged higher through the early European session and climbed to one-and-half-week tops, around the 114.35 region in the last hour.
The pair build on its recovery move from two-week lows, around the 113.25 region touched last Thursday and gained some follow-through traction on the first day of a new week. This marked the second successive day of a positive move for the USD/JPY pair and was sponsored by a combination of factors.
Japanese Prime Minister Fumio Kishida’s victory in snap elections raised hopes for additional stimulus and boosted investors' sentiment. This was evident from a generally positive tone around the equity markets, which undermined the safe-haven Japanese yen and extended some support to the USD/JPY pair.
Traders further took cues from a modest US dollar strength and seemed unaffected by the disappointing release of the official Chinese PMI prints over the weekend. The USD stood tall near two-and-half-week tops and remained well supported by expectations for an early policy tightening by the Fed.
Data released on Friday showed that the Fed's preferred inflation gauge held steady near 30-year highs and indicated that consumer cost pressures are getting entrenched. This fueled speculations that the Fed would be forced to adopt a more aggressive policy response to contain stubbornly higher inflation.
Hence, the market focus will remain on the outcome of a two-day FOMC monetary policy meeting, starting this Tuesday. The Fed is scheduled to announce its decision during the US session on Wednesday, which will influence the USD price dynamics and determine the near-term trajectory for the USD/JPY pair.
In the meantime, Monday's release of the US ISM Manufacturing PMI will be looked upon for some impetus later during the early North American session. Apart from this, the broader market risk sentiment should further allow traders to grab some short-term opportunities around the USD/JPY pair.
Technical levels to watch
-
07:30
Sweden Purchasing Managers Index Manufacturing (MoM) above forecasts (59.5) in October: Actual (64.4)
-
07:06
Gold Price Forecast: XAU/USD struggles to gain traction as traders await key central bank meetings
- Gold gained some positive traction on Monday and moved away from over one-week lows.
- Worries about the risk of stagflation turned out to be a key factor that benefitted the metal.
- The uptick lacked bullish conviction heading into this week’s key central bank event risks.
Gold edged higher during the early part of the trading action on Monday and moved away from over one-week lows touched in the previous session, albeit lacked any follow-through. Data released on Friday showed that the Fed's preferred inflation gauge – the Core PCE Price Index – held steady near 30-year highs, suggesting that consumer cost pressures are getting entrenched. This validated expectations that the Fed would be forced to adopt a more aggressive policy response to contain stubbornly high inflation and weighed heavily on the non-yielding yellow metal. Apart from this, a strong pickup in the US dollar demand exerted additional pressure on the dollar-denominated commodity and contributed to Friday's sharp intraday decline.
Meanwhile, fears about a faster-than-expected rise in inflationary pressures, along with signs of a global economic slowdown have been fueling concerns about the risk of stagflation. This, in turn, was seen as a key factor that assisted the safe-haven XAU/USD to find some support ahead of the $1,770 level and gain some positive traction on the first day of a new week. That said, a modest USD strength kept a lid on any meaningful upside for gold, at least for the time being. Investors also seemed reluctant to place fresh bets, rather might prefer to wait on the sidelines heading into this week's key central bank event risks. The Reserve Bank of Australia will hand down its policy update on Tuesday, while the Fed and the Bank of England are scheduled to announce their decisions on Wednesday and Thursday, respectively.
Despite the RBA’s dovish stance, saying that conditions for a rate hike are unlikely to be met before 2024, the money markets have priced in three hikes by the end-2022. Moreover, market players seem convinced that the Fed would be forced to adopt a more aggressive policy response to contain stubbornly high inflation. Investors have also been betting on the prospects for an imminent BoE rate hike move by the end of this year. Hawkish central bank outlooks should continue to act as a headwind for gold, warranting some caution for bullish traders. This makes it prudent to wait for a strong follow-through buying before positioning for any meaningful appreciating move. Market participants now look forward to the release of the US ISM Manufacturing PMI for some impetus later during the early North American session.
Technical outlook
From a technical perspective, repeated failures near the $1,810-12 resistance zone and the subsequent fall on Friday suggests that the recent positive move has run out of steam. This might have already set the stage for a slide towards testing the $1,762 support area. The corrective pullback from multi-week tops could further get extended towards October monthly swing lows, around the $1,745 area.
On the flip side, any meaningful recovery now seems to confront stiff resistance near the $1,790-92 region (100/200-day SMAs confluence) and remain capped near the $1,800 mark. A sustained strength beyond could allow bulls to make a fresh attempt to clear the $1,810-12 barrier and push gold prices towards the $1,832-34 heavy supply zone.
Levels to watch
-
07:02
German Retail Sales unexpectedly drop by 0.9% YoY in September vs. 1.8% expected
- German Retail Sales fell by 0.9% YoY in September vs. 1.8% expected.
- Retail Sales in Germany stood at -2.5% MoM in September vs. 0.6% expected.
Germany's Retail Sales dropped sharply by 2.5% MoM in September versus 0.6% expected and 1.1% last, the official figures released by Destatis showed on Monday.
On an annualized basis, the bloc’s Retail Sales came in at -0.9% in September versus 0.4% recorded in August and 1.8% estimated.
FX implications
The euro shows little reaction to the downbeat German Retail Sales data.
At the time of writing, the major trades at 1.1554, almost unchanged on the day.
About German Retail Sales
The Retail Sales released by the Statistisches Bundesamt Deutschland is a measure of changes in sales of the German retail sector. It shows the performance of the retail sector in the short term. Percent changes reflect the rate of changes of such sales. The changes are widely followed as an indicator of consumer spending. The positive economic growth usually anticipates "Bullish" for the EUR, while a low reading is seen as negative, or bearish, for the EUR.
-
07:00
Germany Retail Sales (MoM) below expectations (0.6%) in September: Actual (-2.5%)
-
07:00
Germany Retail Sales (YoY) came in at -0.9%, below expectations (1.8%) in September
-
06:35
Forex Today: Majors tread water ahead of US PMI data
Here is what you need to know on Monday, November 1:
The greenback outperformed its rivals on the last trading day of October and the US Dollar Index (DXY) climbed to its highest level since mid-October. At the start of the new month, major currency pairs stay relatively quiet and the trading action is likely to remain subdued due to thin trading conditions. In the second half of the day, the ISM Manufacturing PMI for October will be featured in the US economic docket.
Wall Street: US House Democrats want to vote on President Joe Biden's "Build Back Better" and infrastructure bills on Tuesday after adding the latest revisions to the $1.75 trillion bill on Sunday. US stock index futures register modest gains in the early European session.
The benchmark 10-year US Treasury bond yield is moving sideways around 1.5% but investors remain focused on the flattening yield curve. Meanwhile, the 10-year German bond yield approaches the positive territory for the first time since May 2019.
Over the weekend, World leaders voiced their commitment to solving the global supply chains issues. "We have to take action now, together with our partners in the private sector, to reduce the backlogs that we’re facing," Biden said at the G20 summit.
EUR/USD faced heavy bearish pressure in the second half of the day on Friday and erased all the gains it posted following the European Central Bank (ECB) meeting on Thursday. On Monday, the pair continues to move sideways around 1.1550 but stays dangerously close to the 2021-low it set at 1.1524 in early October.
GBP/USD is trading at its weakest level since mid-October around 1.3660 pressured by the renewed Brexit concerns and broad-based USD strength.
AUD/USD edges lower at the start of the week but stays afloat above 0.7500 for the time being. Earlier in the day, the data from China showed that the Caixin Manufacturing PMI improved modestly to 50.6 in October, surpassing the market expectation of 50.
USD/JPY shot above 114.00 on Friday and preserves its bullish momentum on Monday with the dollar strength providing a boost.
Gold failed to hold above $1,800 last week and staged a sharp U-turn on Friday. Currently, XAU/USD is moving sideways around $1,780.
Cryptocurrencies: After rebounding above $60,000, Bitcoin spent the weekend fluctuating in a relatively tight range with $62,000 area acting as near-term resistance. Ethereum staged a technical correction after renewing all-time highs but it doesn't seem to be having a difficult time holding above $4,000.
-
06:01
AUD/USD Price Analysis: 10-DMA probes bears around 0.7500
- AUD/USD struggles to keep the rebound after confirming rising wedge bearish formation.
- MACD signals ease bullish bias, September’s top add to downside filters.
AUD/USD bears take a breather following Friday’s Rising Wedge confirmation, down 0.10% intraday around 0.7510 heading into Monday’s European session.
Although the receding bullish MACD signals joined rising wedge breakdown to favor the Aussie pair the previous day, the 10-DMA level of 0.7500 challenges the quote’s immediate downside.
Hence, the quote remains sidelined until breaking either the previous support line, near 0.7545, or the 10-DMA level of 0.7500.
However, market sentiment improves of late, suggesting the further intraday recovery moves of the AUD/USD prices, due to its risk barometer status.
Meanwhile, a downside break of the 0.7500 DMA support needs validation from September’s peak surrounding 0.7475-80 to convince the Aussie bears.
To sum up, AUD/USD bulls seemed to have tired and the bears are ready to retake controls but a daily closing below 10-DMA becomes necessary for the clear south-run.
AUD/USD: Daily chart
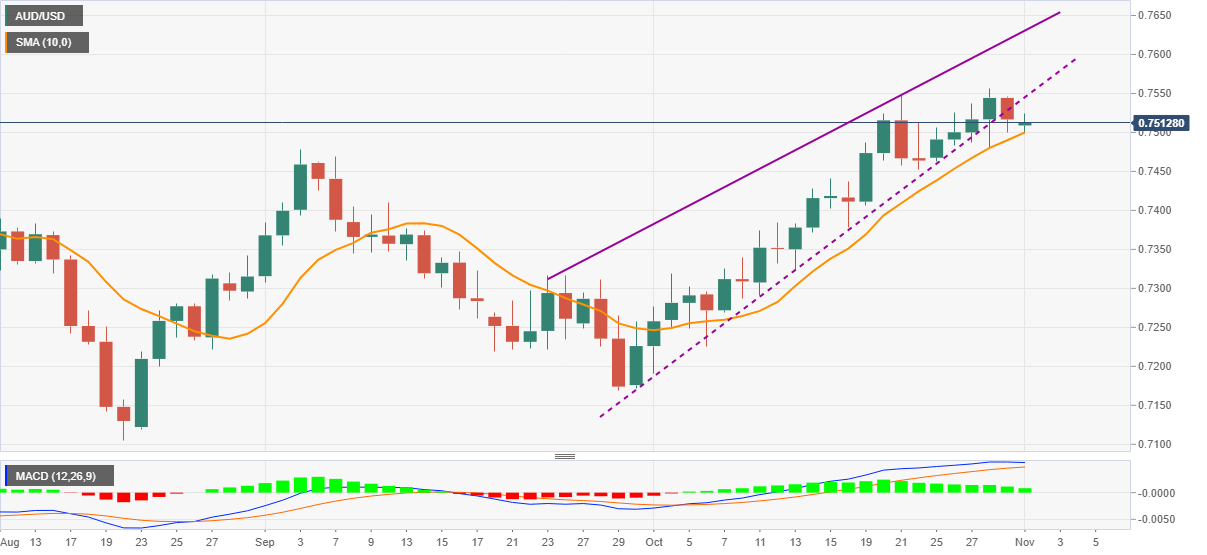
Trend: Further weakness expected
-
05:37
USD/INR Price News: Indian rupee regains below 75.00 despite pre-Fed woes
- USD/INR keeps Friday’s rebound following three-week downside, eases of late.
- US-China trade deal termed as win-win situation, even for inflation concerns.
- Fed tapering tantrums remain elevated, India’s active covid cases fall to the lowest since February.
- US ISM Manufacturing PMI, China headlines may entertain traders ahead of Wednesday’s Fed meeting.
USD/INR retreats from intraday high, declining to 74.90 ahead of Monday’s European session.
Although the recently positive headlines for the risk catalysts help the Indian rupee (INR) pair to consolidate gains made since Friday, the cautious sentiment ahead of Wednesday’s US Federal Reserve (Fed) monetary policy meeting keeps the pair buyers hopeful.
US Treasury Secretary Janet Yellen’s comments saying that, per Reuters, the reciprocal lowering of tariffs could help ease inflation recently underpinned the risk-on mood. Earlier in Asia, China’s upbeat Caixin Manufacturing PMI and hopes of US stimulus favored firmer sentiment.
However, firmer US Core PCE Price Index data, the Fed’s preferred inflation gauge, keeps the tapering tantrums on the table and favors the US Treasury yields, as well as the US dollar. On the same line were fears of China’s economic transition amid downbeat official PMI, published on Sunday, together with the energy and financial crisis at home.
At home, India reports the lower active coronavirus cases since February 26 whereas the virus-led fatalities also dropped by 251 versus 446 reported the previous day. It’s worth noting that the firmer COVID-19 vaccine jabbing in India has negatively affected the virus woes but the economy struggles to overcome the pandemic-led economic hardships and the looming fears of power cuts, which in turn doesn’t allow the Reserve Bank of India (RBI) to remain supportive of the easy money policies.
It should be noted that October’s IHS Markit PMI for India battle fears of firmer oil prices of late. Moving on, US ISM Manufacturing PMI, expected 60.4 versus 61.1, may entertain intraday traders ahead of the key Wednesday.
Technical analysis
A three-week-old falling trend channel formation challenges USD/INR bulls between 75.05 and 74.55. Adding strength to the channel’s upper line is the 20-DMA while bearish MACD signals keep sellers hopeful.
-
05:32
Japan PM Kishida: Full stimulus plan to be compiled by mid-November
Japanese Prime Minister Fumio Kishida said on Monday, his government is looking to compile the full economic stimulus plan by mid-November.
Additional comments
To include targeted payouts to temporary workers, families with children in need.
Wil consider resuming "go to" subsidised travel programme.
To unveil government's COVID-19 response around the same time.
Japan to start booster shots in December.
Will create a system that will allow all people who need to be hospitalised with covid-19 to get into hospitals.
Will expand free coronavirus tests substantially.
Will compile 'large-scale' stimulus package around mid-November.
Will consider resuming "go to" subsidised travel programme.
Stimulus package will include targeted payouts to temporary workers, families with children in need of aid to weather pandemic's impact.
Will pass through parliament extra budget by end of this year.
I will visit allied countries as soon as possible to meet their leaders.
Will leave for Britain to attend cop26 on Tuesday.
Stimulus package will include investment on clean energy, funding aid to Asia.
Must issue govt bonds to fund necessary near-term steps to protect people's livehood from pandemic.
I will decide on the future of Secretary General Amari after a thorough discussion with him.
Japan must ensure it retains market trust over its finances but revitalising economy comes first.
Want to advance the conversation on separate surnames for married couples.
But through conversations with voters I feel that this system is at this point not fully accepted yet.
We still have work to do to deepen understanding among citizens for the revision of the constitution.
Market reaction
USD/JPY is rising 0.25% on the day, currently trading at 114.27 amid the sell-off in the Japanese equities and broad-based US dollar strength.
The Japanese Prime Minister Fumio Kishida's ruling LDP defied expectations and held on to a majority in Sunday's parliamentary election.
-
05:31
Australia RBA Commodity Index SDR (YoY) came in at 40.7%, above expectations (28%) in October
-
05:29
US Treasury Sec. Yellen: Expect China to meet trade deal commitments
US Treasury Secretary Janet Yellen said on Monday that they expect China to fulfill the trade deal commitments.
Additional quotes
“But eventually lowering tariffs in a reciprocal way could be a desirable outcome.”
“Lowering tariffs could have "disinflationary" effect.”
“Current inflation surge is a result of supply bottlenecks, higher energy prices.”
“Inflation should ease in 2H 2022.”
-
05:11
USD/IDR Price News: Rupiah pares losses above $14,000 on firmer Indonesia Inflation
- USD/IDR keeps Friday’s rebound despite Indonesia’s firmer CPI, PMI data.
- Fed tapering concerns underpin US dollar ahead of the key Wednesday.
- Fears of China losing economic momentum off the pandemic also challenge IDR.
USD/IDR stays firmer around $14,240, recently easing to $14,235, ahead of Monday’s European session. The Indonesian rupiah (IDR) pair recently ignored firmer Indonesia numbers amid fears concerning China and economic growth at home.
Indonesia’s headline Inflation matches the 1.66% YoY forecast, versus 1.6% prior whereas the figures bear +0.11% market consensus and -0.04% prior with +0.12% figures on MoM. Further, Core Inflation rose past 1.3% previous readouts to 1.33% during October. Additionally, Indonesia HIS Markit PMI for October also rose past 52.2 in September to 52.7.
It’s worth noting that the Bank Indonesia (BI) has recently eased credit card rules. During its latest monetary policy meeting in October, the BI matched wide market expectations of inaction while suggesting a rate hike move in 2022.
Elsewhere, the Fed tapering tantrums underpin the US dollar and the Treasury yields. However, cautious optimism in equities markets and the US stimulus hopes challenge the risk-off mood. Also challenging the USD/IDR bears is the fears that the Asian major China, also Indonesia’s strong trading partner, seems to lose underlying economic recovery momentum from the pandemic as supply crunch and credit crisis challenge the bulls.
Given the firmer US inflation and chatters surrounding Fed tapering, USD/IDR may remain firmer but cautious mood ahead of Wednesday’s Fed verdict may challenge the pair’s advances.
Technical analysis
Although an eight-day-long rising support line, around $14,170, keeps USD/IDR bulls hopeful, 50-DMA and a downward sloping trend line from August 20, around $14,250-55, question the pair’s short-term advances.
-
04:47
Asian Stock Market: Trades mixed as China PMI, pre-Fed fears join stimulus hopes
- Asian shares dwindle despite China Caixin PMI’s positive surprise, Japan’s Nikkei 225 rally on PM Kishida’s re-election.
- US inflation woes underpin Fed tapering concerns, EU-US join to battle China over steel, aluminum.
- Australia eases international border restrictions for the first time in nearly 18 months.
- RBA, NZ inflation, Fed meeting are the key events of the week.
Asian equities fail to portray clear direction even as Japan’s Nikkei 225 jumps over 2.0% during early Monday. The reason could be multiple, including the pre-Fed cautious, fears over supply concerns weighing on the economic rebound off the pandemic and the US stimulus hopes.
Amid these plays, the MSCI’s index of Asia-Pacific shares outside Japan drops 0.50% heading into Monday’s European session.
Although China’s Caixin Manufacturing PMI contrasts the official PMI readings for October, the underlying details highlight supply crunch and raise doubts on the further economic strength of the world’s second-largest economy. Also portraying the factory growth sluggishness is the PMIs from South Korea. Amid these plays, markets in China and South Korea trade mixed whereas shares in Hong Kong print 1.25% losses at the latest.
On the contrary, Japan’s Jibun Bank Manufacturing PMI rose past 53.0 expected and prior data to 53.2. The same joined Prime Minister Fumio Kishida’s victory in snap elections to back the Japanese market bulls.
Elsewhere, Australia opens international borders after 18 months whereas New Zealand sounds cautious over lifting the virus-led activity restrictions. The same joins fears of economic recovery concerning China to probe bulls on the ASX 200 and the NZX 50 respectively.
S&P 500 Futures rise 0.20% around the record top as US stimulus hopes battle Fed tapering chatters. The same underpins the US 10-year Treasury yields to remain firmer by the press time.
Markets in Indonesia and India remain mildly bid amid receding COVID-19 fears and expectations that the festive season will underpin economic growth after a few months of sluggish economic momentum.
Looking forward, the monetary policy meeting of the Reserve Bank of Australia (RBA) will precede New Zealand (NZ) jobs report and the US Federal Reserve (Fed) meeting to entertain the Asia-Pacific traders. For now, US ISM Manufacturing PMI, expected 60.4 versus 61.1, may entertain investors.
Read: S&P 500 Futures print mild gains as stimulus hopes battle firmer US Treasury yields
-
04:16
Indonesia Core Inflation (YoY) rose from previous 1.3% to 1.33% in October
-
04:16
Indonesia Inflation (YoY) meets expectations (1.66%) in October
-
04:15
Indonesia Inflation (MoM) came in at 0.12%, above expectations (0.11%) in October
-
04:12
USD/TRY Price Analysis: Consolidates around $9.59, weekly triangle in focus
- USD/TRY eases inside one-week-old ascending triangle amid bearish Momentum line.
- Three-week-old rising support line challenge bears, bulls need $9.6330 break for run-up to refresh all-time high.
USD/TRY traders struggle inside a one-week-old bullish chart formation during the pre-European session on Monday. The pair’s consolidation from record top takes clues from a downbeat Momentum line, flashing 0.10% intraday loss around $9.5970 by the press time.
Even so, the support line of the stated triangle and 20-SMA challenge the pair sellers near $9.5540, a break of which will direct the quote towards an ascending support line from October 8, close to $9.4960 at the latest.
In a case where the USD/TRY consolidation lasts longer than $9.4960, the October 19 peak of $9.3765 will be in focus.
Meanwhile, bulls await a clear upside break of the $9.6330 level, comprising the resistance line of the stated triangle, to take fresh entries.
Following that, the latest record peak of $9.8505 and the $9.9000 threshold will gain the USD/TRY bull’s attention.
To sum up, the pair remains in a bullish consolidation mode and may correct further should it confirms the rising triangle breakdown.
USD/TRY: Four-hour chart
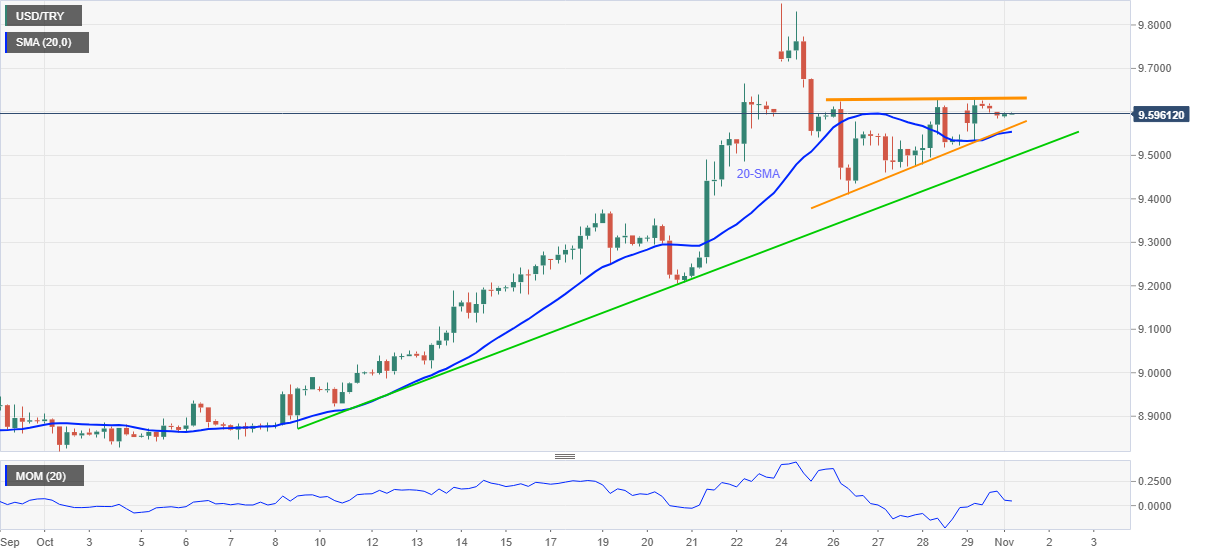
Trend: Further upside expected
-
03:55
NZ PM Ardern: Auckland will remain at Level 3 restrictions
New Zealand Prime Minister Jacinda Ardern announced on Monday, the country’s biggest city of Auckland will remain in lockdown at Level 3.
“Some restrictions in Auckland will be eased next week,” said PM Ardern.
She added that retail might recommence.
This comes after the South Pacific Island nation reported 162 new Delta covid variant cases in the community this Monday, bringing the total number of confirmed cases in the country's community outbreak to 3,510.
Among the new infections, 156 were recorded in the largest city of Auckland, per Reuters.
Market reaction
NZD/USD is easing off high on these headlines, trading at 0.7169, up 0.06% on the day, at the press time.
-
03:53
EUR/USD bears flirt with 1.1550 as Fed week begins, US ISM PMI eyed
- EUR/USD remains pressured, fades corrective pullback following the heaviest daily slump in 4.5 months.
- Market sentiment dwindles amid Fed tapering chatters, EU-US peace over steel, aluminum.
- US dollar defends Friday’s jump on firmer Treasury yields.
- German Retail Sales, ISM Manufacturing PMI can entertain traders, Wednesday’s Fed meeting becomes the key.
EUR/USD remains sidelined around 1.1550, following the heaviest daily fall since mid-June, heading into Monday’s European session. Having witnessed the European Central Bank’s (ECB) failed attempt to hide hawkish intentions, the market turns towards the US Federal Reserve (Fed) with high hopes of tapering hints.
Steady prints of the Fed’s preferred inflation gauge, the US Core PCE Price Index, bolstered the tapering concerns on Friday, favoring the US Dollar Index (DXY) to rally the most since the mid-June. That said, the data remained firmer around 3.6%, versus a 3.7% market forecast, for September.
On the other hand, the Eurozone GDP returned to the pre-pandemic levels, +2.2% QoQ, during the Q3 and the October month’s inflation also rose 4.1%, firming up odds of the ECB’s next move to be a rate hike than the otherwise. However, the regional central bank has already played its role and the ECB policymakers have recently been searching for clues to avoid any strong bullish action, which in turn allowed the US Dollar to garner the market’s attention and gain.
Elsewhere, the US joins hands with the European Union (EU) over steel and aluminum tariffs to challenge Beijing’s steel industry whereas US President Joe Biden marked “god willing” to portray optimism concerning the Build Back Better framework.
Amid these plays, US 10-year Treasury yields rise 1.6 basis points (bps) to 1.57% while the US Dollar Index (DXY) stays firmer above 94.00 at the latest.
Looking forward, German Retail Sales for September, expected .8% YoY versus 0.4% prior, will precede the US ISM Manufacturing PMI for October, market forecast 60.4 against 61.1, to entertain short-term traders. However, major attention will be on Wednesday’s Fed verdict with eyes on tapering hints.
Technical analysis
The EUR/USD pair’s U-turn from 50-DMA takes clues from the MACD line’s inability to reach the positive region, also tilt southwards before that, to favor the bears. Also signaling the quote’s further weakness is the downside break of three-week-old horizontal support, now resistance around 1.1590.
-
03:53
GBP/USD: In bearish consolidation below 1.3700 amid escalating Brexit concerns
- GBP/USD off two-week lows, downside risks prevail below 1.3700.
- Brexit concerns escalate amid the UK-French fishing row, weighs on the pound.
- USD holds firmer amid hawkish Fed’s expectations, BOE likely to hint at rate hikes.
GBP/USD is under pressure below 1.3700, trying to find its feet after Friday’s severe blow. The bears retain control amid a broadly stronger US dollar and looming Brexit risks.
The US dollar index continues to hold the higher ground near two-week tops amid rising expectations of a sooner-than-expected Fed rate hike, as Friday’s PCE Price Index accelerated to 4.4% YoY in September vs. 4.2% previous.
The same is being reflected in the Treasury yields, with the benchmark 10-year rates up 1.50% so far. This week, markets have fully priced in that the Fed will announce a tapering of its bond-buying.
Brexit in focus
Meanwhile, growing Brexit concerns will continue to undermine the British currency amid an escalating row over fishing rights between the UK and France. Over the weekend, French President Emmanuel Macron said the row was “a test” of the UK’s “credibility”, in a Financial Times (FT) interview.
Separately, the head of the French ports of Calais and Boulogne, Jean-Marc Puissesseau warned, “It will be a drama, it will be a disaster.”
Maroš Šefčovič, Vice-President of the European Commission in charge of Interinstitutional Relations and Foresight, said, “he is concerned the (UK) Government will refuse to engage with (Northern Ireland) proposals put forward by Brussels.”
Gear up for a big week, the pair will likely remain confined within a narrow, with all eyes on the Fed and BOE policy decision while Friday’s NFP release will also hog the limelight. In the meantime, traders will take cues from the UK Final Manufacturing PMI and the US ISM Manufacturing index.
GBP/USD: Technical levels to consider
-
03:09
Gold Price Forecast: XAU/USD bounces but $1800 appears elusive ahead of a Big week – Confluence Detector
- Gold price rebounds but not out of the woods yet amid firmer USD, yields.
- Gold’s fate hinges on the all-important Fed decision and US NFP release.
- XAU/USD’s drop below $1,780 an ominous sign ahead of Fed.
Gold bulls are coming up for the last dance ahead of the all-important US Federal Reserve (Fed) policy decision, with odds of hints of an earlier-than-expected rate hike higher after Friday’s PCE inflation came in hotter. The US dollar remains broadly higher in tandem with the Treasury yields starting out a fresh month. The US Nonfarm Payrolls (NFP) release this Friday will also help determine the next direction in gold price.
Read: Gold Chart of the Week: Possible bear scalp for the open, longer-term outlook is mixed
Gold Price: Key levels to watch
The Technical Confluences Detector shows that gold is approaching powerful resistance at $1789 on its road to recovery. That hurdle is the convergence of the Fibonacci 38.2% one-month and SMA100 one-day.
A sustained move above the latter is needed to take on the $1792 barrier, which is the confluence of the SMA200 one-day and SMA10 four-hour.
Up next, gold bulls eye $1796, the intersection of the SMA100 one-hour, SMA5 one-day and Fibonacci 61.8% one-week.
The Fibonacci 23.6% one-month at $1798 will be on the buyers’ radars if the bullish momentum remains unabated.
The meeting point of the previous day’s high and pivot point one-day R1 around $1801 will be the level to beat for gold bulls.
On the flip side, strong support is now seen at the previous resistance at $1782, where the SMA50 one-day and Fibonacci 23.6% one-week merge.
The next critical demand area is aligned around $1778-$1780, where the SMA100 four-hour, Fibonacci 23.6% one-day and the previous low four-hour coincide.
Further south, the confluence of the previous day’s low and Fibonacci 61.8% one-month at $1772 will test the bullish commitments.
Here is how it looks on the tool
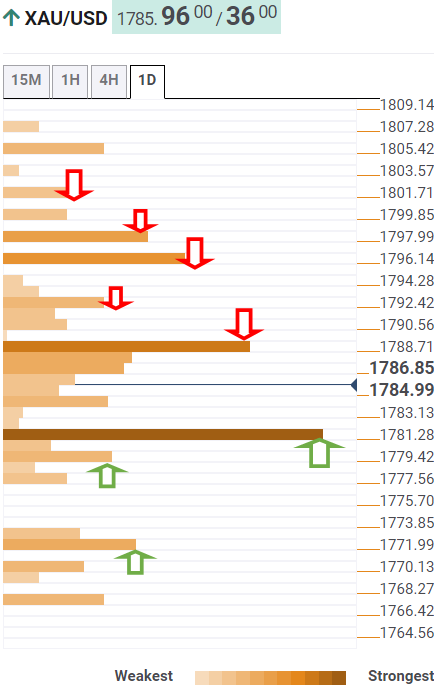
About Technical Confluences Detector
The TCD (Technical Confluences Detector) is a tool to locate and point out those price levels where there is a congestion of indicators, moving averages, Fibonacci levels, Pivot Points, etc. If you are a short-term trader, you will find entry points for counter-trend strategies and hunt a few points at a time. If you are a medium-to-long-term trader, this tool will allow you to know in advance the price levels where a medium-to-long-term trend may stop and rest, where to unwind positions, or where to increase your position size.
-
02:37
S&P 500 Futures print mild gains as stimulus hopes battle firmer US Treasury yields
- S&P 500 Futures takes rounds to record top flashed on Friday.
- US President Joe Biden reiterates readiness to rollout stimulus this week.
- US-EU overcome steel, aluminum tussles to fight against China production.
- Fed tapering concerns underpin US Treasury yields, US ISM PMI eyed for short-term direction ahead of Wednesday monetary policy decision.
S&P Futures walk on tight rope amid contrasting catalysts amid early Monday. While US President Joe Biden keeps US investors hopeful, the pre-Fed sentiment is gradually grinding the bulls.
“The Build Back Better framework — which is, God willing, going to be voted on as early as — sometime this coming week,” said US President Biden per the White House communiqué dated October 31. Before that, the Democrats were struggling to get Republicans’ support for the infrastructure spending plan but Biden showed readiness to go ahead alone if needed.
It should be noted that the positive start to the Q3 earnings season and receding covid fears also underpin the equities.
However, firmer US Treasury yields keep the equities pressured amid steady prints of the Fed’s preferred inflation gauge. That said, the US Core PCE Inflation data remained firmer around 3.6%, versus a 3.7% market forecast, for September.
It should be noted that China’s official PMIs printed another set of downbeat figures for October but the Caixin Manufacturing PMI offered a positive surprise. Further, the US-China tensions escalate as the US joins hands with the European Union (EU) over steel and aluminum tariffs to challenge Beijing’s steel industry.
Against this backdrop, US 10-year Treasury yields rise 1.6 basis points (bps) to 1.57% while the US Dollar Index (DXY) stays firmer above 94.00 after posting the heaviest daily jump since mid-June.
Looking forward, the US ISM Manufacturing PMI, expected 60.4 versus 61.1, may entertain investors ahead of Wednesday’s Federal Reserve (Fed) monetary policy meeting. Even if the event isn’t accompanied by Fed Chair Jerome Powell’s press conference and economic forecasts, hopes of tapering keep the case interesting.
Read: Market Turning Points: SPX could still progress a little higher
-
02:30
Commodities. Daily history for Friday, October 29, 2021
Raw materials Closed Change, % Brent 84.5 0.18 Silver 23.871 -0.75 Gold 1782.728 -0.92 Palladium 1986.12 -0.21 -
02:28
OPEC+ may consider boosting output by 600K barrels to 1M bpd this week – KPMG
Ahead of OPEC and its allies (OPEC+) monthly meeting on November 4, Regina Mayor global head of energy at KPMG said that the alliance may increase their planned output boost slightly this week.
more to come ...
-
02:13
NZD/USD Price Analysis: 50-HMA probes bounce off weekly horizontal support
- NZD/USD seesaws around intraday high amid firmer RSI.
- Sustained rebound from short-term key hurdle directs bulls toward late October top.
NZD/USD defends late Friday’s recovery moves around 0.7175 during early Monday. The kiwi pair bounced off a horizontal area comprising multiple lows since October 22 the previous day. The upside momentum also take clues from China's Caixin Manufacturing PMI for October, 50.6 versus 50.00 expected and prior.
Read: China Caixin PMI beats expecttions by 0.6, AUD supported slightly
However, 50-HMA challenges the immediate upside around 0.7175 ahead of directing the quote towards the double tops marked during late October, near 0.7220. It’s worth noting that the recently improving RSI line and the pair’s sustained recovery from short-term horizontal support favor buyers.
In a case where the NZD/USD prices rise beyond 0.7220, a theoretical run-up of around 90 pips will aim for May’s high near 0.7320.
On the flip side, the pullback move may again aim for the 0.7130 horizontal support area with the 0.7150 level acting as an intermediate halt.
During the quote’s weakness past 0.7130, October 17 peak around 0.7100 and the late September’s high near 0.7095 will challenge the NZD/USD weakness before highlighting October 17 top near 0.6985.
NZD/USD: Hourly chart
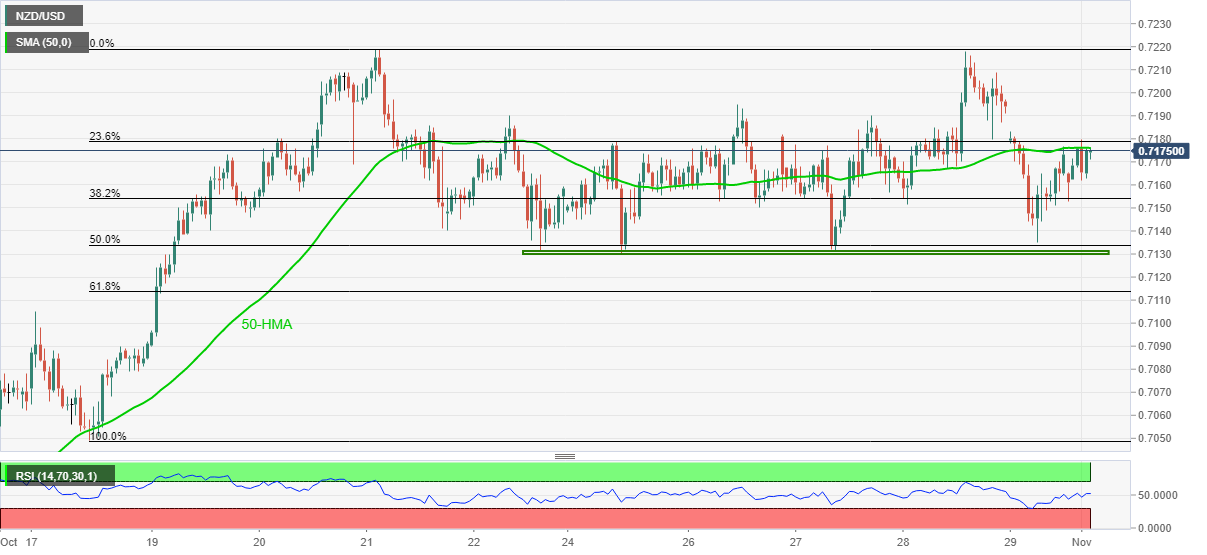
Trend: Further recovery expected
-
02:11
PBOC provides window guidance to local banks on property loans
The People’s Bank of China’s branches have provided window guidance to local banks on property loans, Reuters reports, citing a story carried by the Financial News.
Additional takeaways
“China central bank branches tell local banks to keep total local property loan volumes stable.”
“China central bank branches tell local banks to conduct cross-region adjustments to property loans.”
“A surge in Chinese junk dollar bond yields in October, briefly reaching 20%, has made it all but impossible for stressed developers to refinance their maturing debt. Such firms have just over $2 billion of onshore and dollar-bond payments due in November,” according to data compiled by Bloomberg.
Market reaction
AUD/USD remains pressured but continues to defend 0.7500 amid mixed markets and upbeat Chinese Caixin Manufacturing PMI.
The RBA made no offer to buy the April 2024 yield target bond on Monday ahead of the central bank’s monetary policy decision on Tuesday.
-
02:08
USD/INR Price news: The bull flag continues to play out, eyes on the downside
- USD/INR bears stepping in at critical resistance.
- The bullish flag pattern is so far not giving out to the upside.
USD/INR has been a drawn-out process from the bull's perspective which have been seeking a breakout of the bull flag from a daily perspective. There have been some near misses along the way ad the following illustrates the potential path of trajectory for the coming sessions at the start of the week.
USD/INR Daily chart
-637713290608287448.png)
The above chart is a bullish flag formation. The bulls are waiting for a breakout.
-637713289040638874.png)
Zooming in, we can see, as illustrated, the price is testing a horizontal area of resistance. Taking a closer look, this is an M-formation. This can be seen better on a line chart as follows:
-637713291860225666.png)
The neckline of the M formation would be expected to act as resistance and given the 38.2% Fibo retracements, there is the extra conviction at trendline resistance.
-
01:56
AUD/USD defends 0.7500 on surprise uptick in China Caixin Manufacturing PMI
- AUD/USD bounces off intraday low to consolidate Friday's losses.
- China Caixin Manufacturing PMI part ways from official NBS PMI to rise to 50.6 in October.
- Australia eases international border restrictions for the first time in nearly 18 months.
- US ISM Manufacturing PMI, risk catalysts eyed ahead of Tuesday’s RBA.
AUD/USD remains on the back foot around 0.7515, despite recently picking up bids from the intraday low of 0.7504 on China Caixin PMI during early Monday. In doing so, the Aussie pair licks Friday's wounds amid mixed clues and cautious sentiment ahead of tomorrow’s RBA.
China’s Caixin Manufacturing PMI rose past 50.00 expected and previous readouts to 50.6 in October. The figures differ from the official NBS data released over the weekend. The headline NBS Manufacturing unexpectedly dropped to 49.2 in October from 49.6 booked in September, versus 49.7 forecast. Further, the Non-Manufacturing PMI fell to 52.4 in the reported month from September’s reading of 53.2 and against the expectations of 52.9.
Earlier in the day, Australia’s Commonwealth Bank Manufacturing PMI for October grew past 57.3 forecast and market consensus to 58.2. Also on the positive side was the ANZ Job Advertisements for October, 6.2% versus -2.8% prior. It should be noted, however, that September’s housing figures from Australia came in downbeat and favored sellers, backed by the firmer US Treasury yields.
In addition to the mixed data, Australia’s easing of international border restrictions for the first time in pandemic also should have favored the AUD/USD prices. “In one of the world's toughest responses to the coronavirus pandemic, Australia slammed its international border shut 18 months ago, barring foreign tourists and banning citizens from either exiting or arriving unless granted an exemption,” said Reuters.
Alternatively, firmer US Treasury yields keep exerting downside pressure on the Aussie pair. Steady prints of the Fed’s preferred inflation gauge joined optimism concerning the US stimulus to propel the US Dollar Index (DXY) the most since mid-June on Friday, weighing on the AUD/USD prices in turn. That said, the US Core PCE Inflation data remained firmer around 3.6%, versus a 3.7% market forecast, for September.
The same bolstered traders’ fears over the US inflation and Fed tapering chatters, as could also be sensed in the latest speech from Fed Chairman Jerome Powell, on October 22, where he dumped ‘transitory’ concern for inflation.
Also favoring the US dollar is the recent US-China tussles as the US joins hands with the European Union (EU) over steel and aluminum tariffs to challenge Beijing’s steel industry.
Against this backdrop, the US 10-year Treasury yields rise two basis points (bps) to 1.575% whereas S&P 500 Futures print 0.20% intraday gain by the press time.
Moving on, cautious sentiment ahead of tomorrow’s Reserve Bank of Australia (RBA) monetary policy meeting can test the AUD/USD moves. However, US ISM Manufacturing PMI, expected 60.4 versus 61.1, may entertain AUD/USD traders. Also important will be the updates concerning China and inflation.
Technical analysis
AUD/USD fades Friday’s bounce off a convergence of a two-week-long support line and 50-SMA amid bearish MACD signals. Also keeping sellers hopeful of breaking the 0.7500 support confluence is the bear’s gradual tightening of the grips, as portrayed by the pair’s late October moves compared to MACD and signal lines’ behavior.
Read: AUD/USD Price Analysis: Retreats towards 0.7500 key support
-
01:47
China Caixin Manufacturing PMI beats expectations by 0.6, AUD supported slightly
October Markit PMIs across Asia are released, with China being the focus (sponsored by Caixin). This was expected to be unchanged at 50, the threshold between expansion and contraction, as power outages and supply chain disruptions persist.
The data has arrived as follows:
50.6 which beats expectations of 50.
This is a welcome outcome considering the weekend data. The data arrived as follows: Manufacturing PMI 49.2 vs the expected 49.7, prior 49.6. This was the second month of contraction in a row. Meanwhile, Non-manufacturing PMI fell to 52.4 vs the expected 52.9, prior 53.2 leaving the Composite down at 50.8 vs the prior 51.7. October's manufacturing and non-manufacturing PMI demonstrated the effects of intensive policy actions on the economy. It showed that growth has lost momentum, with construction and real estate under pressure. Supply-side pressures are evidently weighing on activity. Some restrictions are easing such as in coal, however, which will be expected to support electricity production and usage while there is a little softening in credit availability.
AUD/USD reaction
AUD/USD is slightly better off trading towards flat on the day and off the lows.
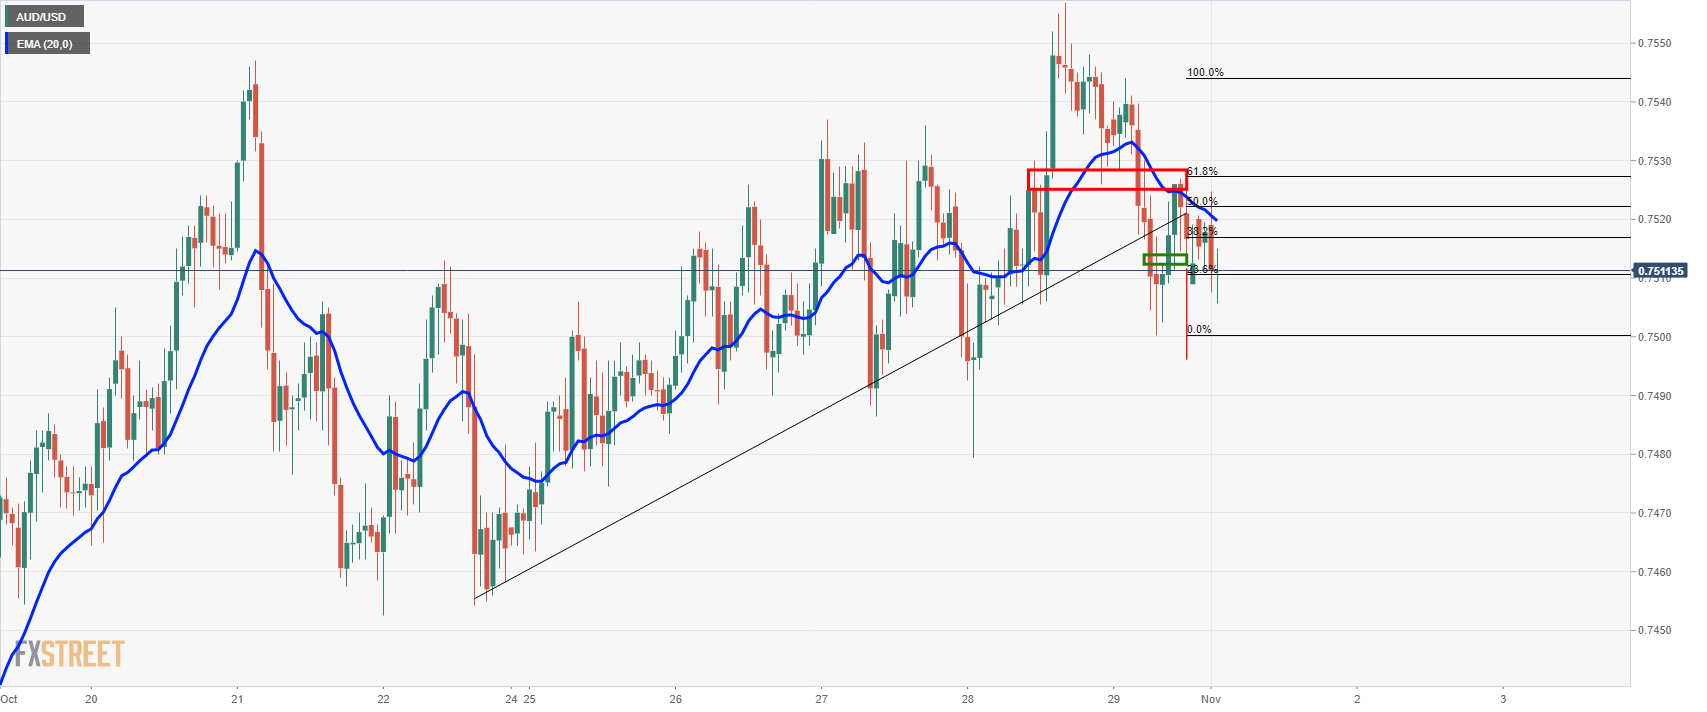
The price is on the verge of a critical test of the dynamic support following a touch of the 61.8% Fibonacci retracement level and a rejection at the 20-EMA. If the support breaks, the downside will be in play for the open this week.
About Caixin PMI
The Caixin China Manufacturing PMI™, released by Markit Economics, is based on data compiled from monthly replies to questionnaires sent to purchasing executives in over 400 private manufacturing sector companies.
-
01:46
China Caixin Manufacturing PMI came in at 50.6, above forecasts (50) in October
-
01:45
China: Markit/Caixin Manufacturing PMI, October 50.6 (forecast 50)
-
01:32
Silver Price Analysis: XAG/USD sellers brace for $23.40 around monthly support line
- Silver fades bounce off one-week low, stays below 10-DMA.
- 21-DMA, 50-DMA confluence restricts short-term downside.
- Tops marked in September-October challenge bulls amid descending RSI/MACD line.
Silver (XAG/USD) remains on the back foot around $23.80, down 0.30% intraday during Monday’s Asian session. The bright metal dropped to the lowest in one week, also slipped below 10-DMA, the previous day but refrained from providing a daily close beneath an ascending support line from September 30.
Even so, the receding RSI line from the nearly overbought territory and MACD’s easing bullish bias keep the silver sellers hopeful. In doing so, the metal bears target a convergence of 21 and 50-DMA around $23.40.
It’s worth noting that a six-week-old horizontal area near $23.10-15 will challenge the XAG/USD bears afterward.
Meanwhile, recovery moves remain less welcome until staying below the 10-DMA level of $24.10.
Also challenging silver buyers is the $24.60 and tops marked during September and October, near $24.85.
To sum up, silver sellers are tightening the grips but the short-term DMA confluence may challenge the bearish impulse.
Silver: Daily chart
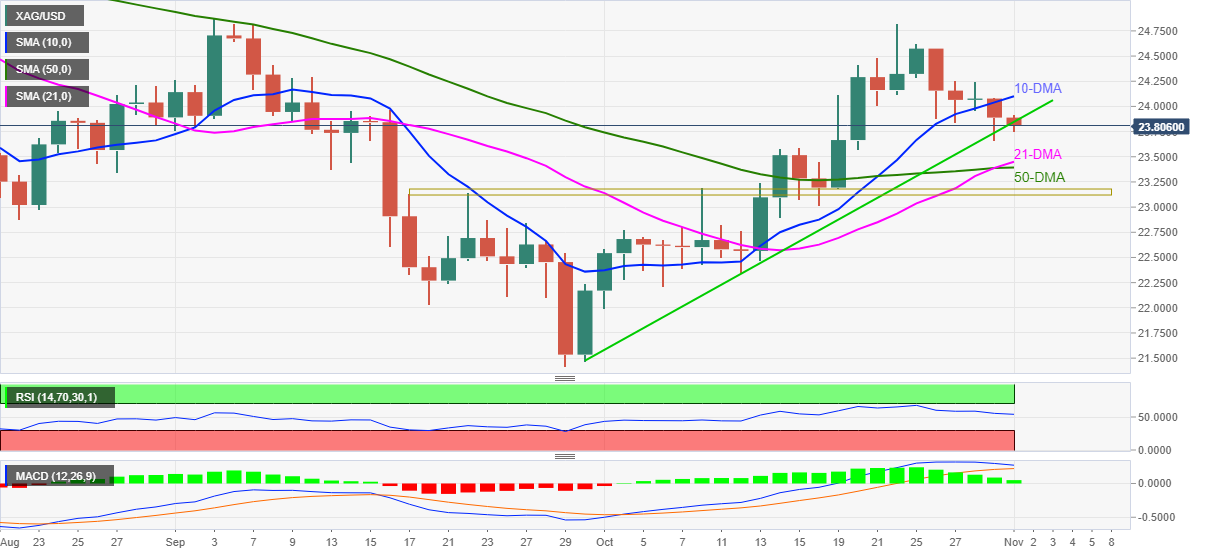
Trend: Further weakness expected
-
01:18
USD/INR fix: 6.4192 vs est 6.4174
In recent trade today, the People’s Bank of China (PBOC) set the yuan (CNY) at 6.4192 vs. the estimated 6.4174 and previous 6.3907.
About the fix
China maintains strict control of the yuan’s rate on the mainland.
The onshore yuan (CNY) differs from the offshore one (CNH) in trading restrictions, this last one is not as tightly controlled.
Each morning, the People’s Bank of China (PBOC) sets a so-called daily midpoint fix, based on the yuan’s previous day closing level and quotations taken from the inter-bank dealer.
-
01:15
US dollar bulls could be back for more, but Fed looms
- US dollar awaits the Federal Reserve and critical US jobs data.
- Rate hike timings will be the main focus as tapering is a done deal and priced in.
The price of the US dollar rallied sharply on Friday as global stocks fell for which at the start of Asia, some corrections are taking shape. In fact, the US dollar index outperformed all the majors on Friday, so a correction in the price is to be expected. However, this is offering the stronger hands a discount to buy the dollar cheaper. The technical analysis is shown below which illustrates the upside potential from an hourly perspective
Meanwhile, all eyes will be on the Federal Reserve this week and the Nonfarm Payrolls report on Friday. The Fed is widely expected to announce its tapering start and plans this week.
''Financial markets are priced aggressively for hikes in 2022, but the Fed is unlikely to endorse or push back on those expectations at this point as we await more inflation evidence. Employment trends are expected to regain momentum, and we anticipate a 520k job gain for Nonfarm Payrolls,'' analysts at Societe Generale explained.
US dollar H1 chart analysis
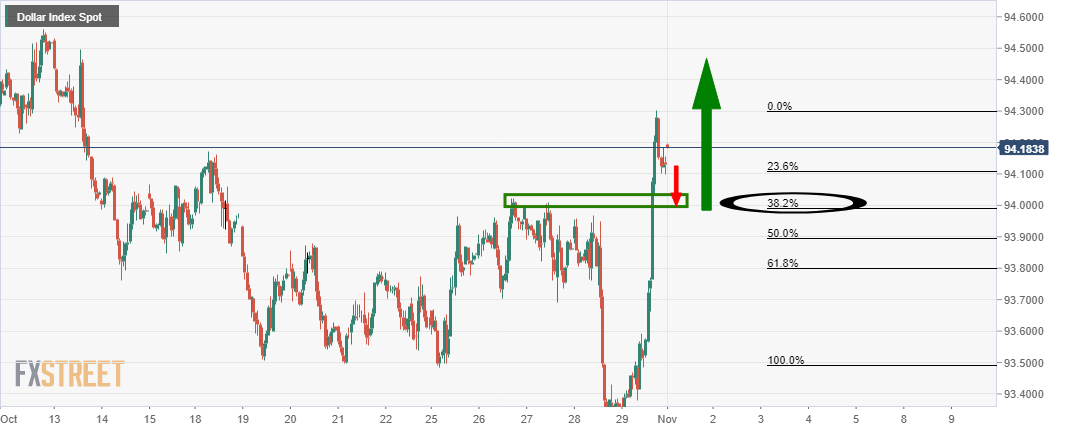
As seen, there is still some downside to go before the price meets a key liquidity area on the DXY chart, an index that measures the US dollar vs a basket of currencies. This also has a 38.2% Fibonacci retracement level in confluence with the 94 figure which adds more conviction to the potential support area.
With that being said, the price is finding some support for the first level of structure that meets with the 23.6% Fibo as follows:
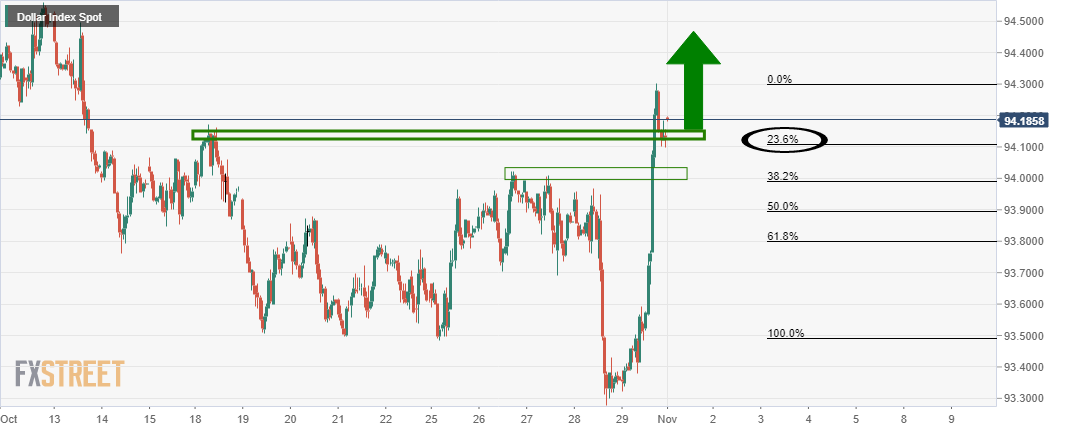
-
01:06
US inflation expectations print three-day pullback from 15-year top
US inflation expectations, as measured by the 10-year breakeven inflation rate per the St. Louis Federal Reserve (FRED) data, dropped for the third consecutive day from levels last seen during August 2006 by the end of Friday’s North American trading.
In doing so, the risk barometer fades recovery moves from late September while flashing the 2.51% mark at the latest.
It should, however, be noted that the firmer inflation data and hopes of the Fed tapering keep the US Treasury yields stronger even as inflation expectations step back from a multi-year high. That said, the US Core PCE Inflation data remained firmer around 3.6%, versus a 3.7% market forecast, for September.
It’s worth noting that the US dollar jumped the most since mid-June on Friday and is up 0.06% around 94.18 by the press time of early Monday with eyes on Wednesday’s US Federal Reserve (Fed) meeting.
Given the firmer price pressure, the recent easing in the inflation expectations may not dampen the Fed tapering concerns. However, the further moves should be watched closely for fresh impulse and stronger clues for Wednesday’s Fed event.
Read: US Fed will leave crisis mode
-
00:56
AUD/USD Price Analysis: Retreats towards 0.7500 key support
- AUD/USD remains on the back foot amid firmer US dollar.
- 50-SMA, 13-day-old ascending trend line challenges short-term declines.
- Bearish MACD, rising resistance line from October 12 keep sellers hopeful.
AUD/USD drops back towards 0.7500, down 0.03% intraday around 0.7515 during Monday’s Asian session. In doing so, the quote fades Friday’s bounce off a convergence of a two-week-long support line and 50-SMA amid bearish MACD signals.
Also keeping sellers hopeful of breaking the 0.7500 support confluence is the bear’s gradual tightening of the grips as portrayed by the pair’s late October moves compared to MACD and signal lines’ behavior.
Hence, the quote is likely to break the 0.7500 support and aim for October 27 swing low near 0.7450.
It should be noted, however, that a join of 100-SMA and a bit broader support line from late September, around 0.7440, will challenge the AUD/USD weakness afterward.
Alternatively, recovery moves may aim for 0.7540 before heading towards the short-term resistance line near 0.7460.
However, a sustained run-up past 0.7560 enables the AUD/USD bulls to challenge the late June’s swing high around 0.7620.
AUD/USD: Four-hour chart
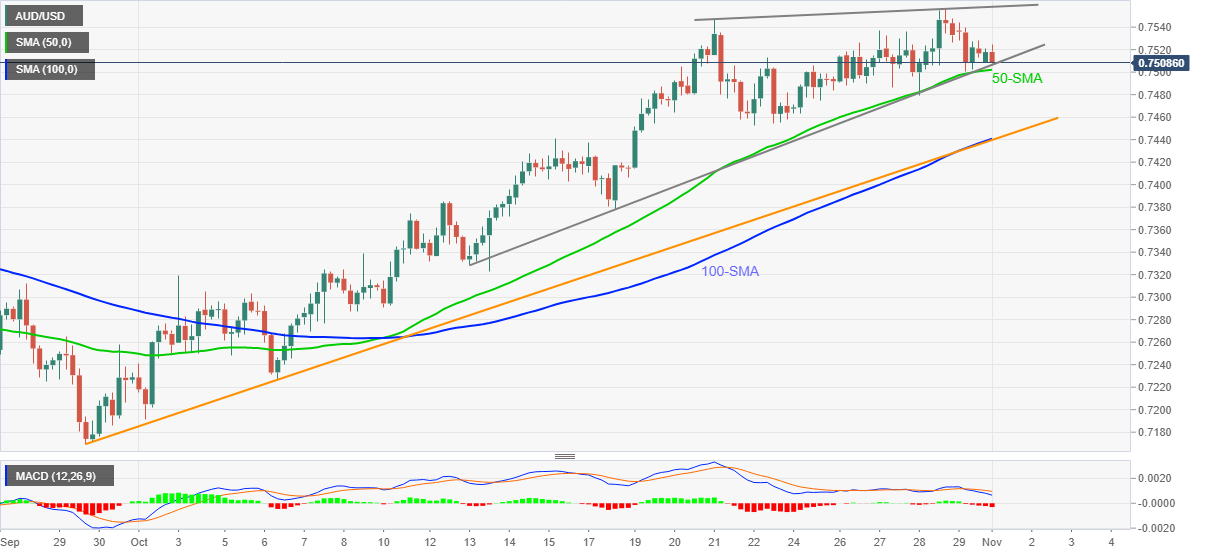
Trend: Further weakness expected
-
00:35
USD/JPY advances above 114.00 on firmer Treasury yields, risk-on mood
- USD/JPY extends Friday’s rebound from a two-week low.
- Japan’s Kishida wins snap elections, LDP keeps majority power.
- US stimulus hopes join Fed tapering concerns to underpin US Treasury yields, equities.
- US ISM Manufacturing PMI, inflation chatters can entertain traders.
USD/JPY remains on the front foot above 114.00, recently easing from an intraday top of 114.25, amid the initial Tokyo trading hour on Monday. In doing so, the yen pair rises for the second consecutive day with 0.30% intraday gains at the latest.
In addition to Monday’s headlines suggesting Prime Minister Fumio Kishida’s victory in snap elections, firmer US Treasury yields and a mildly positive risk appetite also underpin the USD/JPY advances of late.
''While Kishida's conservative Liberal Democratic Party (LDP) was projected to emerge with fewer seats in the powerful lower house than it won in the last election in 2017, the party retained its majority, exit polls by public broadcaster NHK showed early on Monday,'' Reuters reported. The same should call for more stimulus and rejection to a sales tax hike as Japan’s PM Kishida hinted earlier, which in turn can add to the positive mood and weigh on the Japanese yen’s safe-haven demand.
Alternatively, Steady prints of the Fed’s preferred inflation gauge joined optimism concerning the US stimulus to propel the US Dollar Index (DXY) the most since mid-June on Friday, fueling the USD/JPY prices in turn. That said, the US Core PCE Inflation data remained firmer around 3.6%, versus a 3.7% market forecast, for September. The same bolstered traders’ fears over the US inflation and Fed tapering chatters, as could also be sensed in the latest speech from Fed Chairman Jerome Powell, on October 22, where he dumped ‘transitory’ concern for inflation. Amid these plays, the US 10-year Treasury yields rose two basis points (bps) to 1.575% by the press time.
It should be noted that the recently escalating US-China tussles and the Bank of Japan’s (BOJ) comparatively weaker stand against the US Federal Reserve (Fed), as far as monetary policy tightening is concerned, also underpin the US Treasury yields and the US dollar.
Looking forward, US ISM Manufacturing PMI, expected 60.4 versus 61.1, may entertain USD/JPY traders ahead of Wednesday’s Fed decision. Although an absence of Fed Chair Powell’s press conference and economic forecast may dim the charm of the key event, hawkish expectations keep the day on the USD/JPY buyer’s radar.
Technical analysis
USD/JPY keeps Friday’s short-term falling wedge breakout to direct the bulls toward the yearly top around 114.70, also the three-year peak, until the quote stays beyond 113.95.
-
00:32
Australia ANZ Job Advertisements up to 6.2% in October from previous -2.8%
-
00:32
Japan Jibun Bank Manufacturing PMI above forecasts (53) in October: Actual (53.2)
-
00:32
WTI Price Analysis: Price meets M-formaiton neckline resistance
- Oil prices are being pressured at a key level of daily resistance.
- Bears can look to the 79 figure as a potential downside target.
WTI is stalling on the bullish cycle that has been in place since the end of summer 2021. Super high prices could well be struck by the law of gravity in the coming days and weeks ahead and the following analysis illustrates the bearish bias building on a daily basis.
WTI daily chart
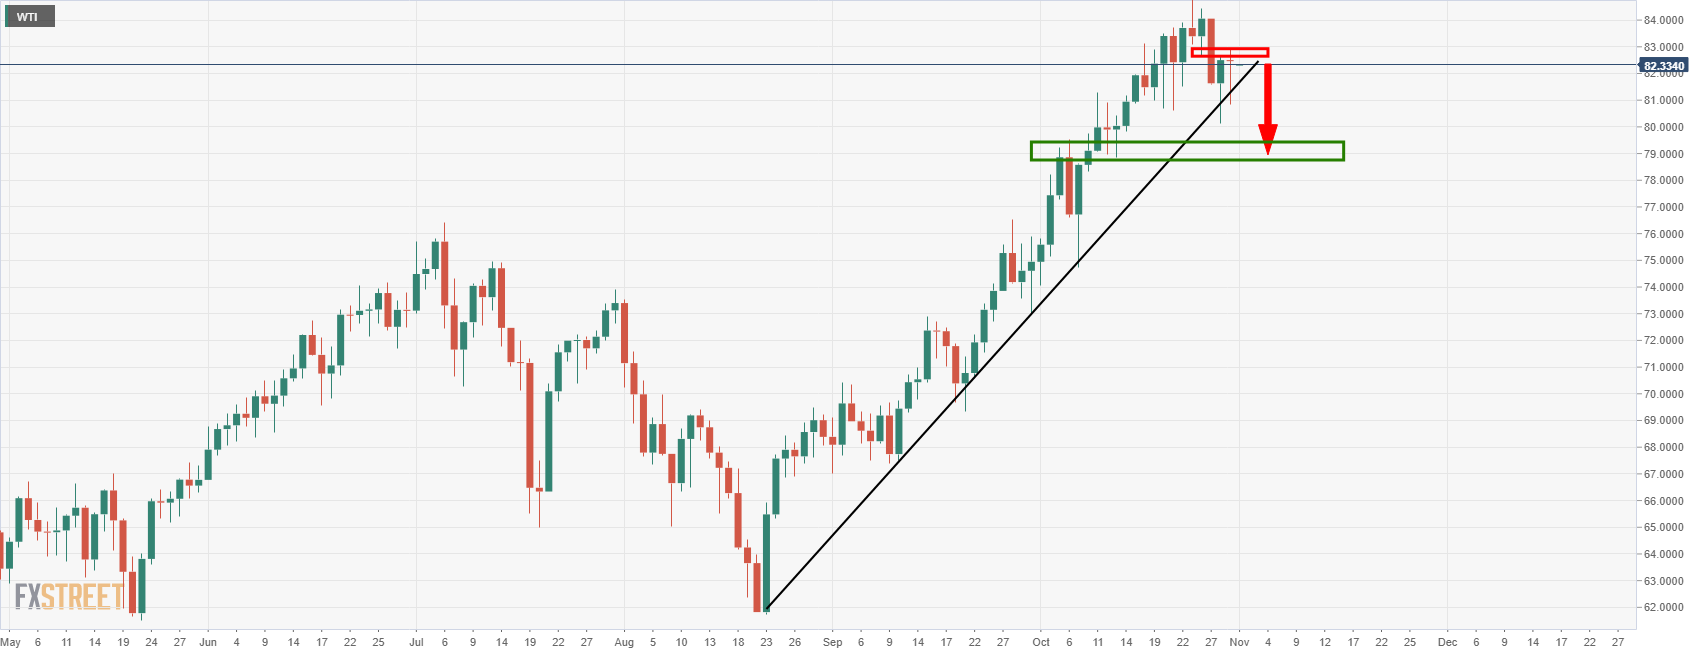
The above analysis illustrates that the price is forming a top with the risk of a break of the dynamic support line. Zooming in, we can also see that the price is meeting the neckline of the M-formation and horizontal resistance as follows:
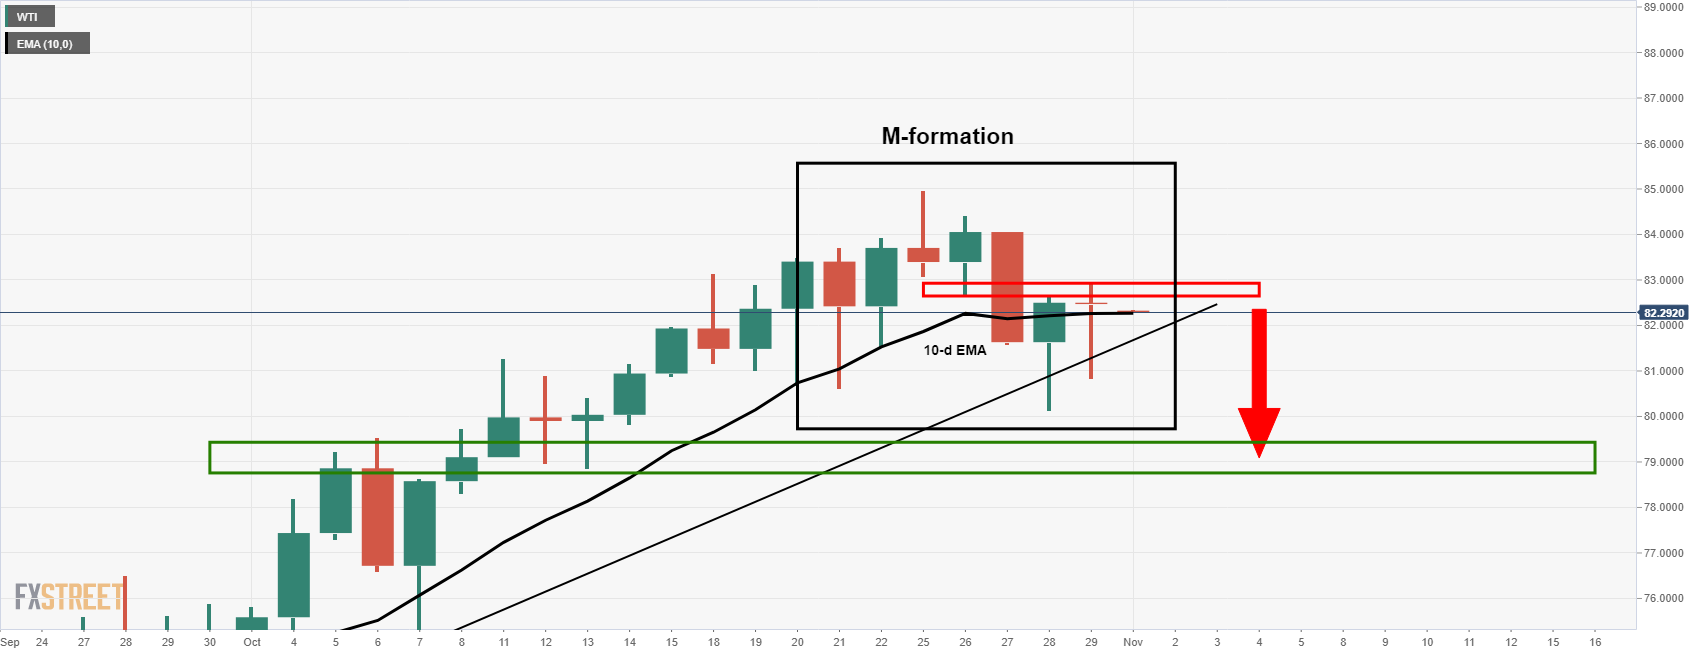
The resistance comes in at 82.70 with room to go to 83.40 before the air becomes thin and potentially gives way to a bullish continuation. The M-formation is better visualized on a line chart as follows:
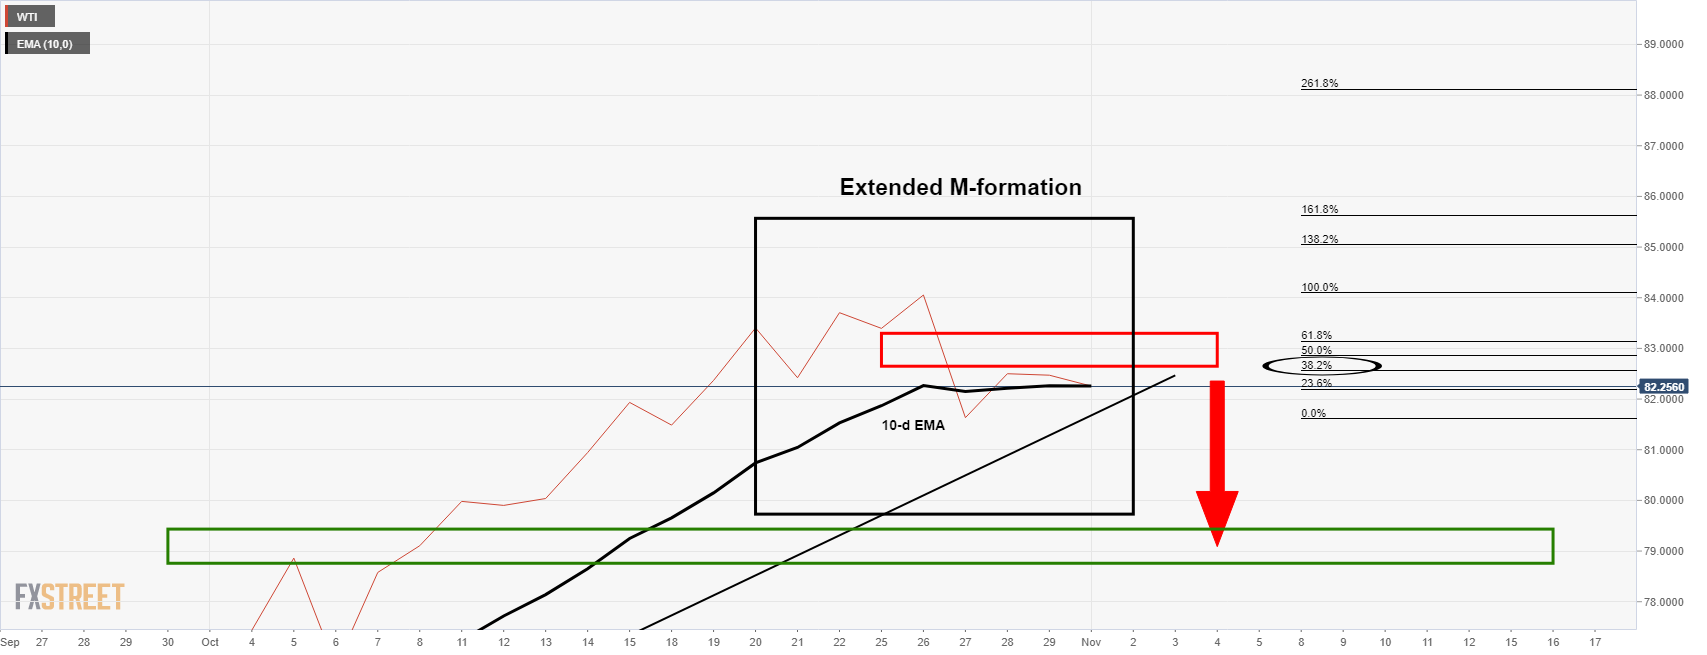
The 38.2% Fibonacci also has a confluence of this resistance area which meets the 10-day EMA. A break below the 10-day EMA, as well as the trendline support, would be a highly bearish development for the day ahead. Bears could look to target the next major liquidity zone between 78.80 and 79 the figure.
-
00:31
Australia Investment Lending for Homes dipped from previous 1.5% to 1.4% in September
-
00:31
Australia Home Loans came in at -2.7% below forecasts (-2%) in September
-
00:30
Japan: Manufacturing PMI, October 53.2
-
00:30
Australia: ANZ Job Advertisements (MoM), October 6.2%
-
00:30
Schedule for today, Monday, November 1, 2021
Time Country Event Period Previous value Forecast 00:30 (GMT) Australia ANZ Job Advertisements (MoM) October -2.8% 00:30 (GMT) Japan Manufacturing PMI October 51.5 01:45 (GMT) China Markit/Caixin Manufacturing PMI October 50 50 07:00 (GMT) Germany Retail sales, real unadjusted, y/y September 0.4% 1.8% 07:00 (GMT) Germany Retail sales, real adjusted September 1.1% 0.6% 08:30 (GMT) Switzerland Manufacturing PMI October 68.1 65.5 09:30 (GMT) United Kingdom Purchasing Manager Index Manufacturing October 57.1 57.7 13:45 (GMT) U.S. Manufacturing PMI October 60.7 59.2 14:00 (GMT) U.S. Construction Spending, m/m September 0% 0.4% 14:00 (GMT) U.S. ISM Manufacturing October 61.1 60.5 21:45 (GMT) New Zealand Building Permits, m/m September 3.8% 23:50 (GMT) Japan Monetary Policy Meeting Minutes -
00:15
AUD/NZD Price Analysis: Bearsish pressures are building
- AUD/NZD bears are on the lookout for an opportunity.
- The bearish structure is in the making and the eyes are on the 1.0350s.
AUD/NZD finally met the M-formation's neckline target and now the emphasis is on the downside so long as the resistance holds up into the Reserve Bank of Australia meeting. The following illustrates the downside potential and opportunity fro a daily and 4-hour fractal basis:
AUD/NZD daily chart
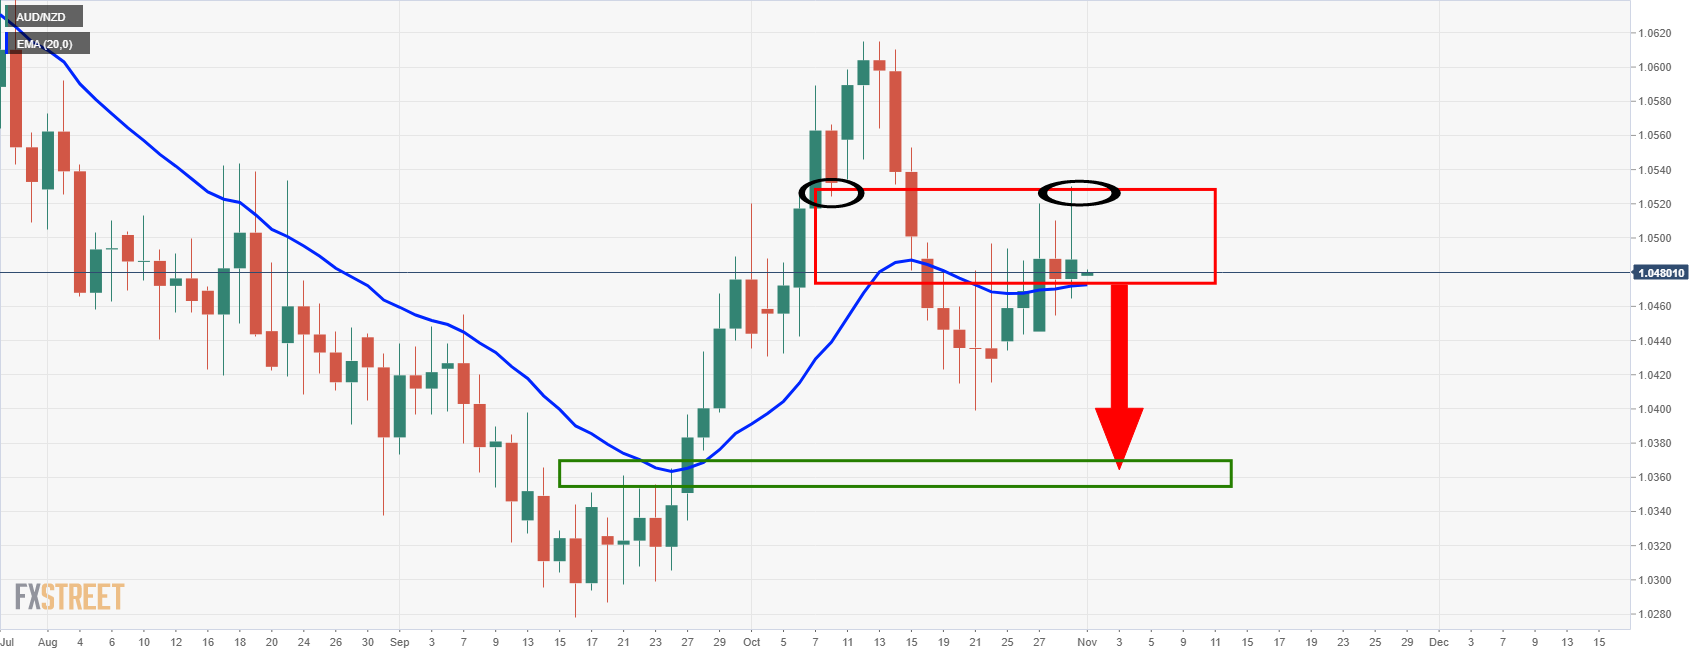
As illustrated, the price has met the neckline of the M-formation and is now on the verge of a downside continuation. Of course, the RBA will be definitive of this technical setup, but this is one for the watch list for the coming sessions.
From a 4-hour perspective, the bears will want to see some bearish formation developed from which to protect a stop loss above structure in order to target the next liquidity zone to the downside in the 1.0320/50 zone.
AUD/NZD 4-hour chart
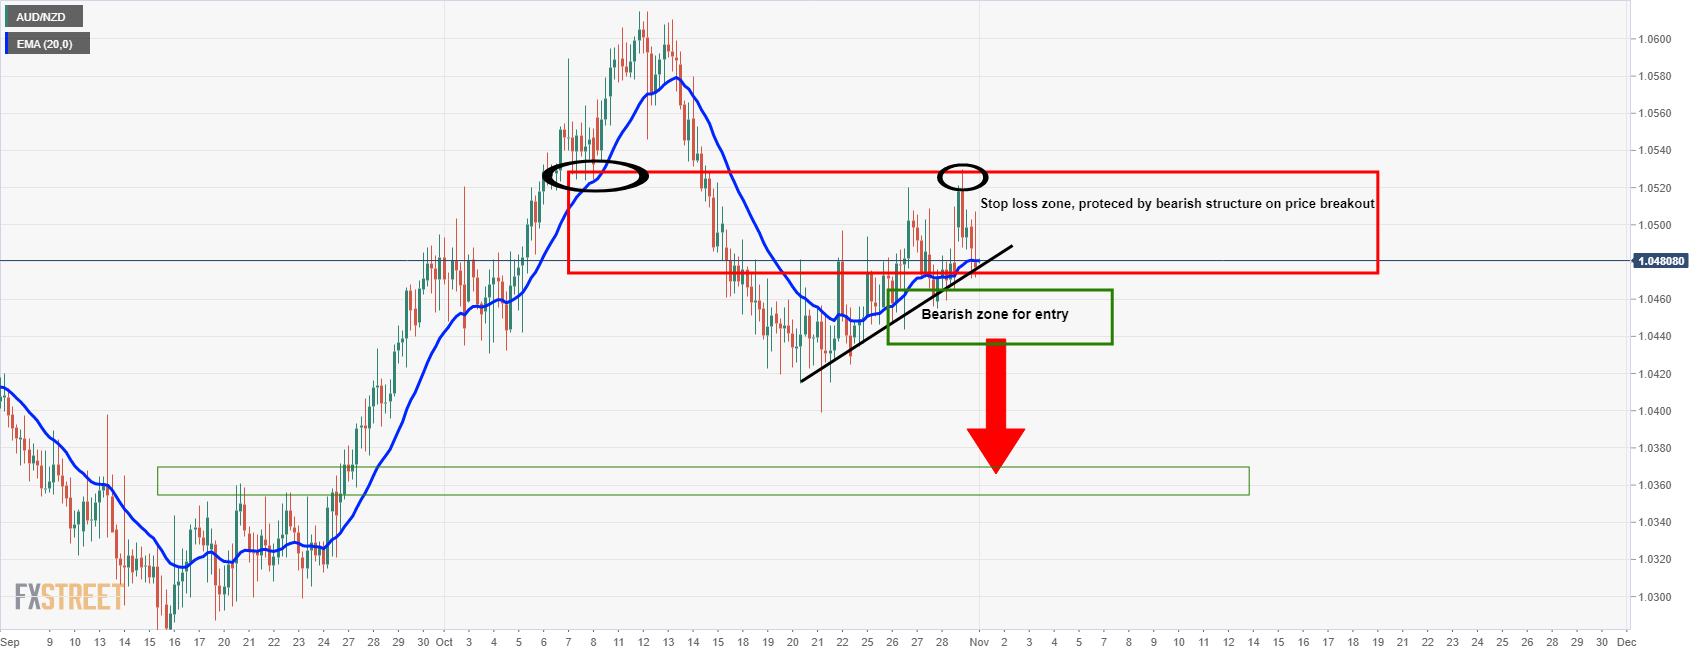
The above illustrates the potential shorting opportunity for the coming days ahead. A break of the dynamic support will be the first step towards a bearish opportunity on a retest of what will be a counter trendline.
-
00:15
Currencies. Daily history for Friday, October 29, 2021
Pare Closed Change, % AUDUSD 0.75198 -0.3 EURJPY 131.752 -0.67 EURUSD 1.15614 -1.02 GBPJPY 156.022 -0.38 GBPUSD 1.36914 -0.73 NZDUSD 0.71646 -0.46 USDCAD 1.23817 0.33 USDCHF 0.91497 0.37 USDJPY 113.949 0.35 -
00:12
US Dollar Index Price Analysis: DXY bulls cheer bounce off 93.40-35 key support
- DXY bulls keep reins following the heaviest daily jump since mid-June.
- 50-DMA, five-month-old support line joins firmer Momentum to challenge bear’s entry.
- 61.8% FE lures buyers, August month’s peak acts as short-term support.
US Dollar Index (DXY) defends Friday’s heavy run-up beyond 94.00, up 0.05% around 94.20 during Monday’s Asian session.
The greenback gauge jumped the most in 4.5 months the previous day following its bounce off 50-DMA and an ascending support line from June. Also backing the DXY bulls is the firmer Momentum line.
Hence, the US Dollar Index seems ready to challenge the yearly top surrounding 94.55 during the further upside.
However, a 61.8% Fibonacci Expansion (FE) of September-October upside, followed by the latest pullback to 93.27, around 94.90 will challenge the DXY buyers afterward.
Meanwhile, the 94.00 threshold and August month’s high near 93.70 can test the short-term bears before directing them to the 93.40-35 support confluence including 50-DMA and the multi-day-old support line.
In a case where the DXY bears manage to conquer the 93.35 level on a daily closing basis, tops marked during July and early September, respectively near 93.20 and 92.90, can act as buffers during the anticipated fall to September’s low of 91.94.
US Dollar Index: Daily chart
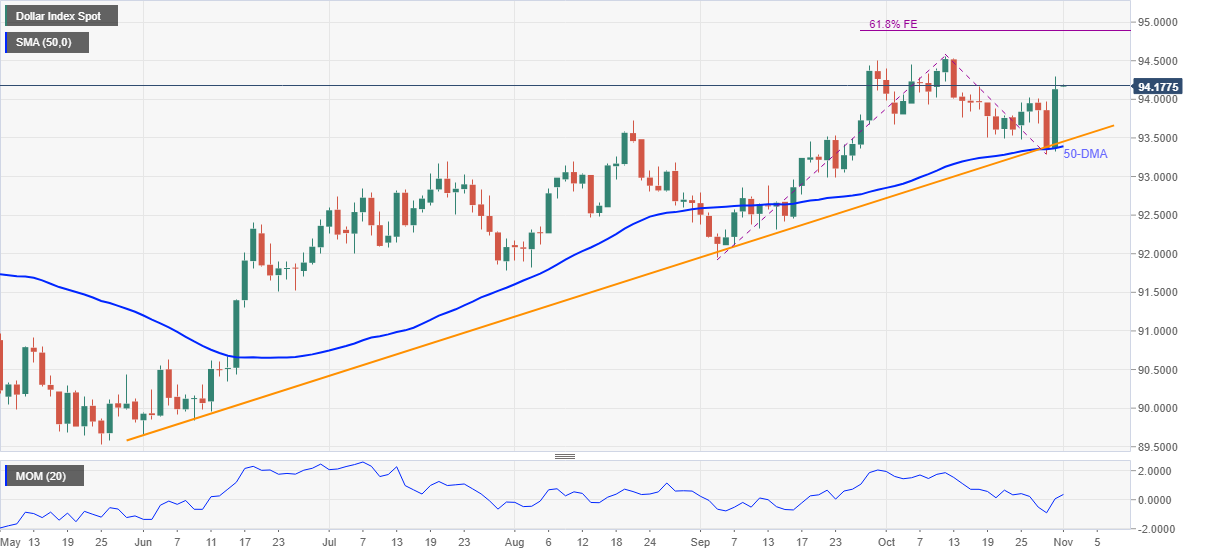
Trend: Further upside expected
-