Notícias do Mercado
-
23:40
USD/CAD faces barricades around 1.3580 as focus shifts to FOMC minutes
- USD/CAD has sensed selling pressure after failing to surpass the 1.3580 resistance.
- Risk-sensitive currencies are gaining traction as investors are expecting a weak move by the USD Index.
- The release of the FOMC minutes and Canadian employment data will remain in the spotlight.
The USD/CAD pair is displaying some volatile moves in the early Tokyo session after failing to overstep the immediate resistance of 1.3580. The Loonie asset is attracting offers led by improving investors’ risk appetite and an expansion in the oil price.
Risk-sensitive currencies are gaining traction as investors are expecting a carry-forward of weak performance by the US Dollar Index ahead. The USD Index witnessed a steep fall on Friday after surrendering the crucial support of 103.50. Meanwhile, S&P500 futures have initiated action on a positive note, which indicates that the risk profile is getting cheerful.
This week, the release of the Federal Open Market Committee (FOMC) will hog the limelight. The FOMC minutes will provide the rationale behind hiking interest rates by 50 basis points (bps) in December’s monetary policy by the Federal Reserve (Fed).
Previewing this week's upcoming events from the US, TD Securities analysts said that they expect the minutes of the FOMC's December policy meeting shed additional light on the Fed's policy outlook for 2023. Analysts at TD securities are of the view that the terminal rate will reach a range of 5.25-5.50% by the May FOMC meeting.
On the Loonie front, investors will focus on the release of the Canadian employment data, which will release on Friday. Analysts at TD Securities said that they expect employment to rise by 8K in December with the labor market starting to cool down. The Unemployment Rate could trim to 5.2% and the wage range could push higher to 5.5% on an annual basis. An increment in wage growth might keep inflation at elevated levels.
Meanwhile, the oil price has pushed higher to near $80.50 as investors see a peak in Covid-19 cases in China, which will put the economy back on track. It is worth noting that Canada is a leading exporter of oil to the United States and higher oil prices support the Canadian Dollar.
-
23:03
AUD/USD seeks support around 0.6800 ahead of Caixin Manufacturing PMI
- AUD/USD is looking for an immediate cushion around 0.6800 ahead of Caixin Manufacturing PMI data.
- After scrutiny of the Chinese official PMI and consensus, Caixin Manufacturing PMI is likely to remain downbeat.
- This week, the spotlight will remain on the release of the FOMC minutes.
The AUD/USD pair is looking for demand after dropping to near the round-level support of 0.6800 in the early Asian session. The Aussie asset is displaying some volatility after the release of the S&P Global Manufacturing PMI data. The economic data has dropped to 50.2 vs. the consensus and the prior release of 50.4.
The US Dollar Index (DXY) has yet to return to active mode after the long-truncated week. However, Friday’s action is telling a detailed story. After a consolidation for 15 trading sessions, the USD Index delivered a downside break of the consolidation formed in a range of 103.46-104.57. Carry-forwarded price action on Tuesday might bring more pain to the US Dollar.
Going forward, the Australian Dollar is likely to display sheer volatility due to the release of the Caixin Manufacturing PMI data. The expression from consensus indicates a decline in the Manufacturing PMI to 48.8 vs. the former release of 49.4. Also, the observation from the reading of official Chinese Manufacturing PMI data indicates a decline in the extent of manufacturing activities. Official China’s Manufacturing PMI data dropped to 47.0 vs. the expectations of 49.2 and the former release of 48.0.
A decline in the extent of Manufacturing PMI in China could be the outcome of a spike in Covid-19 cases after reopening measures taken by the Chinese administration to put the economy back on track. It is worth noting that Australia is a leading trading partner of China and a higher-than-anticipated PMI might support the Australian Dollar.
On the United States front, investors will keep an eye on the release of Thursday’s Federal Open Market Committee (FOMC) minutes. The minutes from December’s monetary policy by the Federal Reserve (Fed) will provide a detailed explanation behind hiking interest rates by 50 basis points (bps).
-
22:42
GBP/JPY Price Analysis: Falls to 4-month lows around 157.40s
- GBP/JPY drops below a three-month-old upslope trendline, down since last week’s high close of around 3%.
- The RSI at oversold conditions suggests the GBP/JPY could be bottoming, but the RoC suggests that sellers remain in charge.
- GBP/JPY Price Analysis: Break below 157.00 would exacerbate a fall to 154.00.
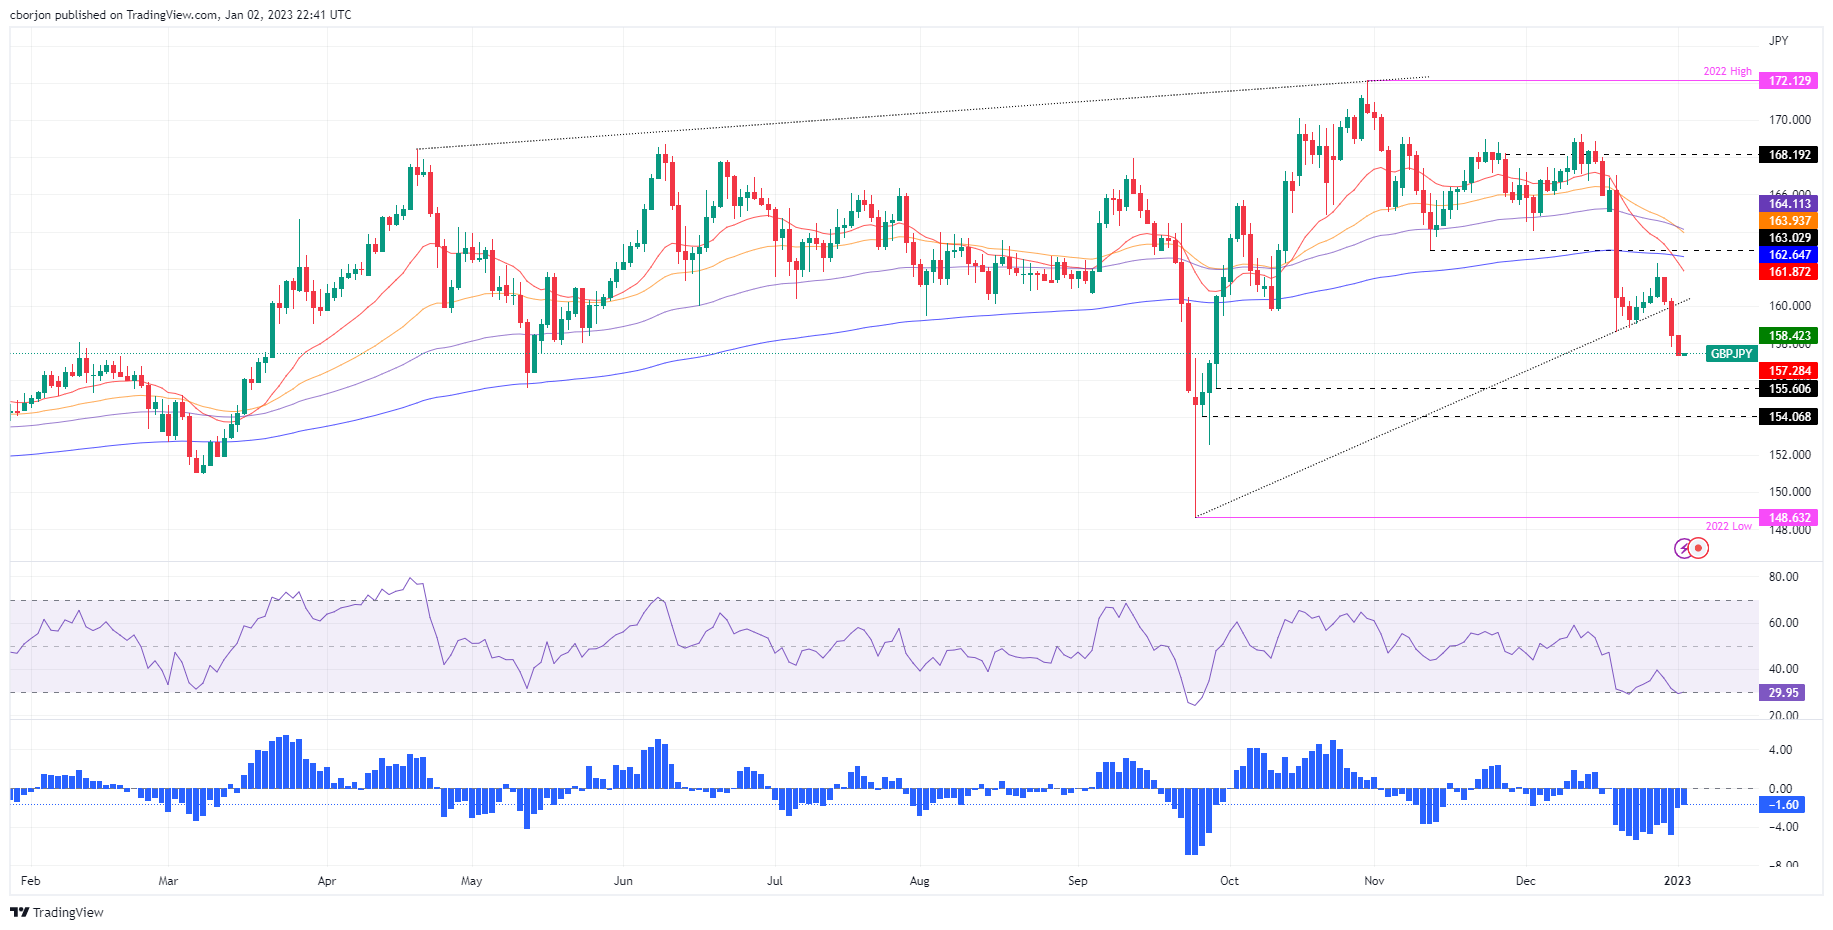
The GBP/JPY plunged more than 100 pips on Monday, extending its losses to three consecutive days, once price action dived below the 200-day Exponential Moving Average (EMA). Furthermore, the cross of the 20-day EMA beneath the 200-day EMA exacerbated the acceleration of the downtrend, as the GBP/JPY gets poised to fall toward the 155.00 mark. At the time of writing, the GBP/JPY is trading at 157.46, below its opening price by 0.69%.
GBP/JPY Price Analysis: Technical outlook
After clearing a three-month-old upslope support trendline drawn from September lows around 148.60s, the GBP/JPY fall increased its velocity. Last Thursday, the GBP/JPY formed a bearish engulfing candle pattern, followed by a tall red candle that cleared on its way south of the 160.00 figure and the previously mentioned trendline. Oscillators like the Relative Strength Index (RSI) entered oversold conditions, while the Rate of Change (RoC) shows that sellers remain gathering momentum. Therefore, the GBP/JPY might continue to fall further.
Therefore the GBP/JPY first support would be the September 29 daily low of 155.60, followed by the 155.00 mark, ahead of the September 27 swing low of 154.07.
As an alternate scenario, if GBP/JPY buyers reclaim 159.00, that could open the door to 160.00, close of the previously mentioned upslope trendline, which would be resistance, ahead of the 20-day EMA at 161.86.
GBP/JPY Key Technical Levels
-
22:31
Gold Price Forecast: XAU/USD aims to recapture $1,830 as Fed to declare higher interest rate peak
- Gold price is looking to recapture the crucial resistance of $1,830.00 ahead.
- Fed’s higher interest rate peak might put the US Dollar Index back in action.
- Gold price is auctioning in an Ascending Triangle that indicates a volatility contraction.
Gold price (XAU/USD) settled around $1,823.00 on Friday after failing to surpass the same resistance despite a sell-off in the US Dollar Index (DXY). The precious metal delivered a gradual upside move from the psychological support of $1,800.00 after sheer pain in the USD Index.
The USD Index delivered a breakdown of the two-week consolidation formed in a narrow range of 103.47-104.57 as investors shrugged off uncertainty over China’s Covid-19 situation. A sheer pace in the reopening phase of the Chinese economy has spiked the number of infections, which has triggered short-term pain in economic prospects. However, the economic projections have started attracting optimism from the think tanks in the market.
Meanwhile, the Gold price could face immense pressure if rumors of higher interest rate peak by the Federal Reserve (Fed) get more air. A note from TD Securities claims that "Note that the Committee signaled expectations of a substantially higher terminal rate for 2023 despite implementing a downshift in the pace of rate increases to 50 basis points (bps) at the December meeting. We are of the view that the terminal rate will reach a range of 5.25-5.50% by the May Federal Open Market Committee (FOMC) meeting."
Gold technical analysis
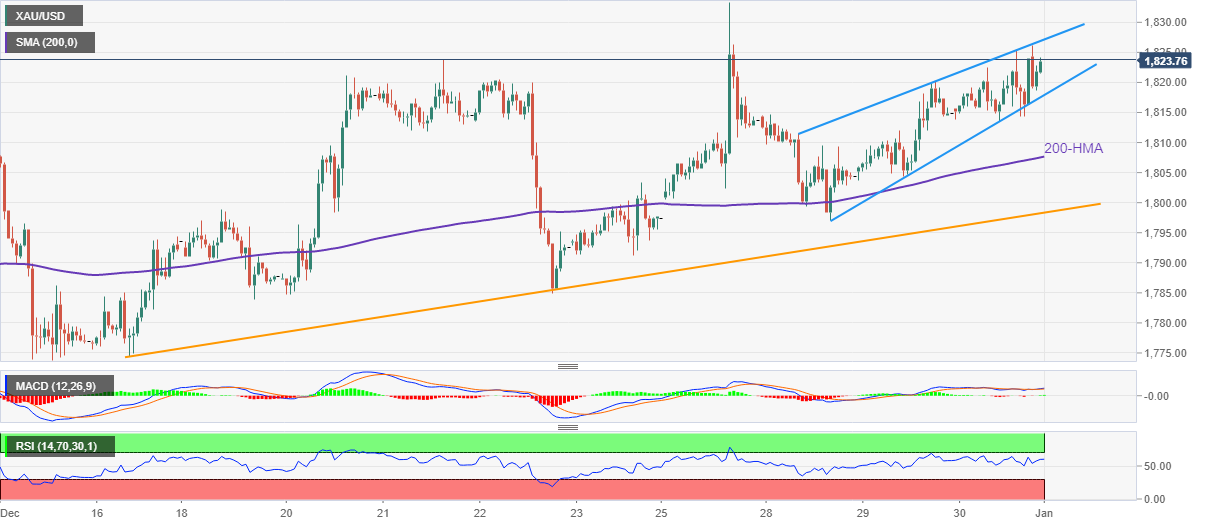
Gold price is auctioning in an Ascending Triangle chart pattern on a four-hour scale. The horizontal resistance of the aforementioned chart pattern is placed from December 13 high at $1,824.55 while the upward-sloping trendline is plotted from December 16 low at $1,774.36.
Advancing 20-and 50-period Exponential Moving Averages (EMAs) at $1,814.77 and $1,807.43 respectively add to the upside filters.
Meanwhile, the Relative Strength Index (RSI) (14) has shifted into the bullish range of 60.00-80.00 from the 40.00-60.00 range, which indicates more upside ahead.
Gold four-hour chart

-
22:25
Australia S&P Global Manufacturing PMI came in at 50.2 below forecasts (50.4) in December
-
22:00
GBP/USD juggles below 1.2050 as investors await US ISM Manufacturing PMI
- GBP/USD is displaying a sideways auction below 1.2050 amid the festive market mood.
- This week, the US ISM Manufacturing PMI data will be of utmost importance.
- Economists at ANZ Bank expect a continuation of pain for the Pound Sterling in CY2023.
The GBP/USD pair is displaying back-and-forth moves in a narrow range below the critical resistance of 1.2050 in the early Asian session. The Cable is expected to get back in action after a potential trigger as the market participants are still in a festive mood post-New Year celebrations.
It is critical to observe the risk profile for now as the action part is missing from the market after a holiday-truncated week. The majority of the western markets remained closed on Monday as investors were welcoming CY2023 for better prospects. The US Dollar Index (DXY) is yet to come into action mode and may display a healthy decline if it carry-forward Friday’s action.
The USD Index delivered a downside break of the consolidation formed in a range of 103.47-104.57 for the past week. The commentary from International Monetary Fund (IMF) could trigger volatility in the US Dollar. Managing Director Kristalina Georgieva of the IMF cited on the CBS Sunday morning news program that “For much of the global economy, 2023 is going to be a tough year as the main engines of global growth - the United States, Europe, and China – all may experience weakening activity,”.
This week, investors will keep an eye on the United States ISM Manufacturing PMI data, which will release on Wednesday. As per the consensus, the ISM Manufacturing data will escalate to 49.6 vs. the former release of 49.0. Apart from that, investors will keep New Orders Index on the radar, which might climb to 48.1 against the prior release of 47.2.
Meanwhile, economists at ANZ Bank expect a continuation of pain for the Pound Sterling in CY2023. A note from ANZ Bank states that “The fundamental backdrop for the United Kingdom is filled with uncertainty. Over the short term, households will have to deal with elevated inflation, higher taxes, and the increased costs of servicing debt. This will dent consumption and dampen the already subdued growth outlook. All of these are GBP negative.”
-
21:49
EUR/JPY Price Analysis: Broadening formation suggests downward pressure lies ahead
- EUR/JPY tumbles beneath the 140.00 figure as the cross dives below the 200-DMA and the 20-day crosses below the 100-DMA.
- A megaphone top formation suggests that downward pressure lies ahead on the EUR/JPY.
- EUR/JPY Price Analysis: Once it clears 138.80, a fall to 135.51 is on the cards.
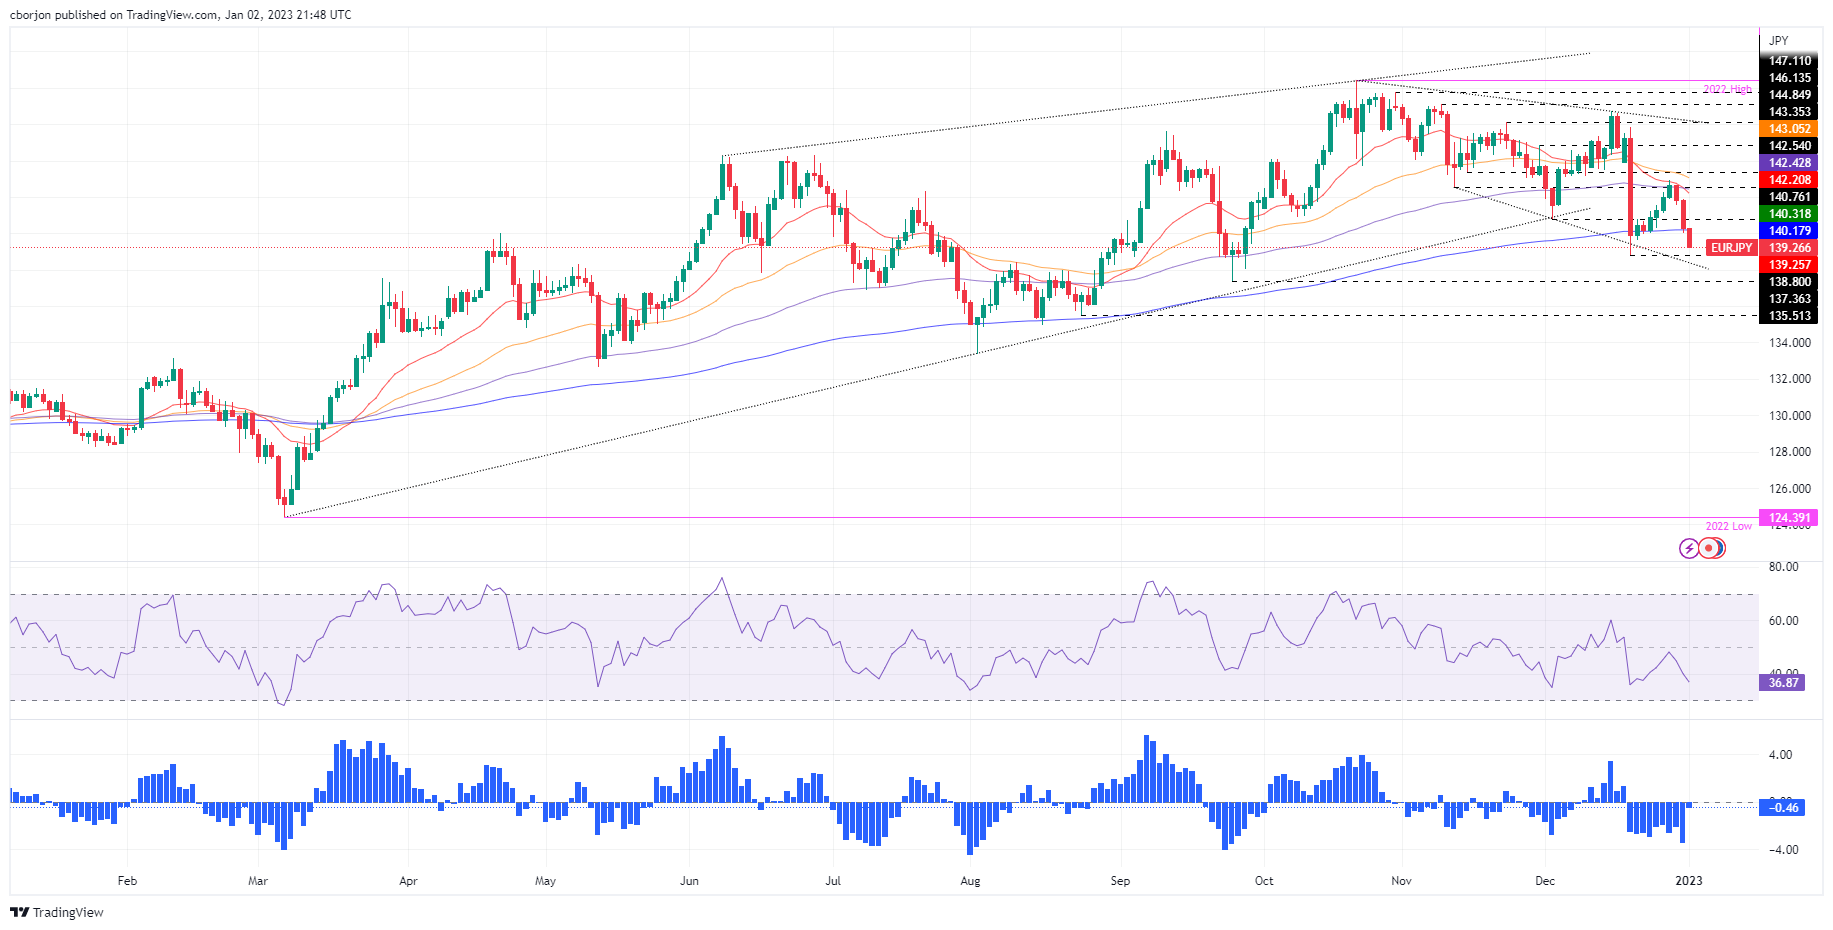
The EUR/JPY drops below the 200-day Exponential Moving Average (EMA) at 140.18, extending its losses to three consecutive trading days, falling 2.40% since peaking around the last week's high of 142.93. Hence, the EUR/JPY is trading at 139.26, below its opening price, after hitting a daily high of 140.31.s
EUR/JPY Price Analysis: Technical outlook
From a daily chart perspective, the EUR/JPY is forming a megaphone top formation, usually a bearish formation, which was confirmed once the cross-currency pair broke below the 200-day EMA. Also, the 20-day EMA crossed below the 100-day EMA, exacerbating an acceleration of the downtrend, as sellers eye a break below the December 2022 low of 138.80.
Oscillators like the Relative Strength Index (RSI), aiming toward oversold conditions and the Rate of Change (RoC) staying below its zero line, confirm that sellers are in charge.
Therefore, the EUR/JPY first support would be the December low of 138.80. A breach of the latter will expose the September 26 daily low of 137.36, followed by the August 24 swing low of 135.51.
As an alternate scenario, if the EUR/JPY climbs back above the 200-day EMA, a rally toward the 20-day EMA at 142.21 is on the cards. Once cleared, it would expose the 100-day EMA at 142.43.
EUR/JPY Key Technical Levels
-
19:19
Forex Today: US Dollar mixed as financial markets return to normal
What you need to take care of on Tuesday, January 3:
The US Dollar started the year advancing against most of its major rivals but ended it unevenly across the FX board. The EUR was the weakest, as EUR/USD retreated from the 1.0700 area towards the current 1.0650 price zone, while the AUD was the strongest, with AUD/USD holding above the 0.6800 threshold.
GBP/USD and USD/JPY finished Monday unchanged at 1.2045 and 130.75, respectively, while USD/CAD edged higher and settled at around 1.3560.
Most Asian stock markets remained closed, while some European ones were also inactive. The European benchmarks that actually operated on Monday posted modest gains. Wall Street remained closed.
There was no activity in bond markets, nor among commodities, with market players awaiting the next Asia opening for direction. Chances skew towards a downbeat mood after Chinese data released over the weekend indicated a steeper economic contraction in December 2022.
The macroeconomic calendar will include some interesting releases this week, with EU and German inflation updates and the S FOMC Meeting Minutes. On Tuesday, Germany will publish the preliminary estimate of the December Consumer Price Index, foreseen up by 10.7% YoY. Next Wednesday, the US will release employment figures, while the December Nonfarm Payroll report is scheduled for Friday.
Top 3 Price Prediction Bitcoin, Ethereum, Ripple: Forecasting the first moves of 2023
Like this article? Help us with some feedback by answering this survey:
Rate this content -
19:03
USD/CHF Price Analysis: Climbs to 0.9250s on broad US Dollar strength
- The USD/CHF downfall stalled around 0.9200 as a triple bottom emerged.
- A falling wedge and oscillator flashing selling pressure waning could pave the way for further upside in the USD/CHF.
- USD/CHF is poised for a break above 0.9300 as it eyes a test of the 20-day EMA.
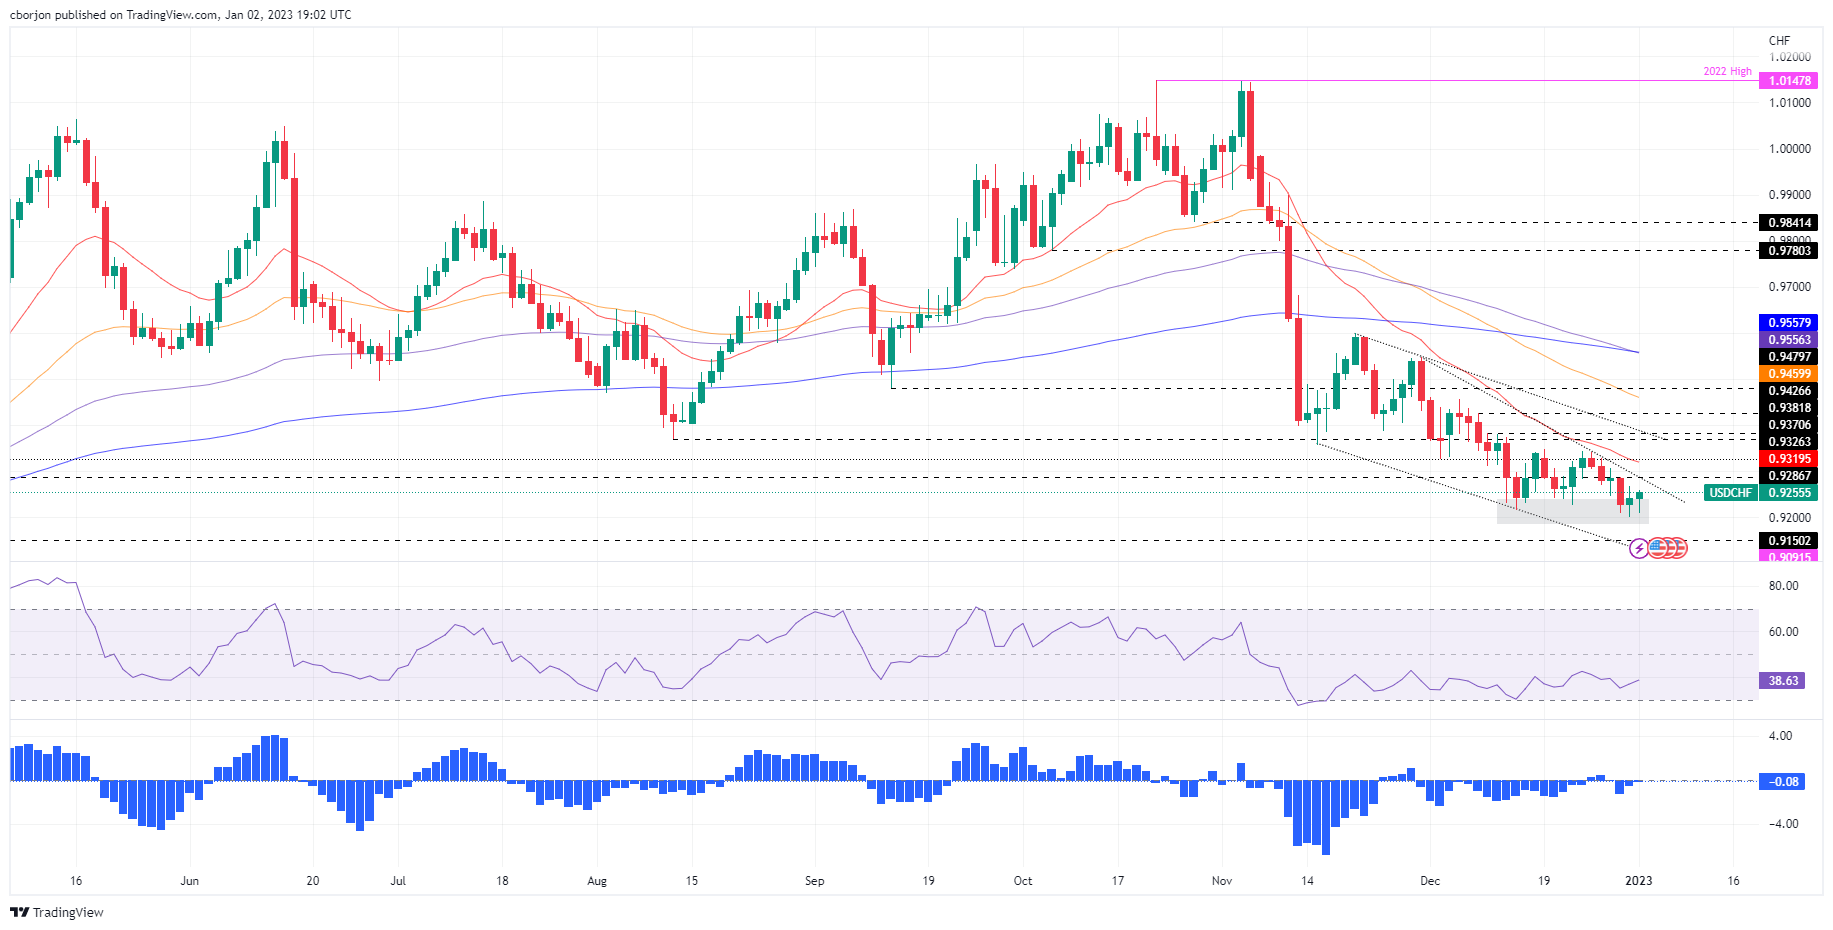
The Swiss Franc (CHF) bounces at around 0.9200 and climbs toward 0.9250s amidst the North American session, which witnessed light liquidity conditions in the observance of 2023 new year’s eve. Therefore, the lack of US and Swiss economic data left traders adrift to market mood and technical. At the time of writing, the USD/CHF is trading at 0.9255, above its opening price by 0.15%.
USD/CHF Price Analysis: Technical outlook
The daily chart displays the pair as downward biased, but it also appears to have bottomed at around 0.9200. Since December, the USD/CHF pair’s inability to break below 0.9200, forming a triple bottom, opened the door for a leg-up, though low liquidity conditions since the last week keep the USD/CHF pair unable to test the 0.9300 figure. The Relative Strength Index (RSI) remains in bearish territory, capping any rallies toward 0.9300, while the Rate of Change (RoC) displays that selling pressure is waning.
Also, the USD/CHF is forming a falling wedge that it’s bullish. Therefore, the USD/CHF might test the 0/9300 figure, closely followed by a challenge of the 20-day Exponential Moving Average (EMA) at around 0.9319. The break above will expose the top-trendline of a descending channel around 0.9370, followed by the 0.9400 figure.
USD/CHF Key Technical Levels
-
18:00
Brazil Trade Balance registered at 4.8B above expectations (3B) in December
-
17:27
NZD/USD drops to the 0.6310s as China’s manufacturing activity slows
- NZD/USD retraces after hitting 0.6370, as investors’ sentiment remains upbeat.
- Weaker than expected, China’s PMIs would likely hurt the NZD/USD climbing prospects to the 0.6400 area.
- IMF’s Georgieva:” Global economy faces a tougher year than 2022.”
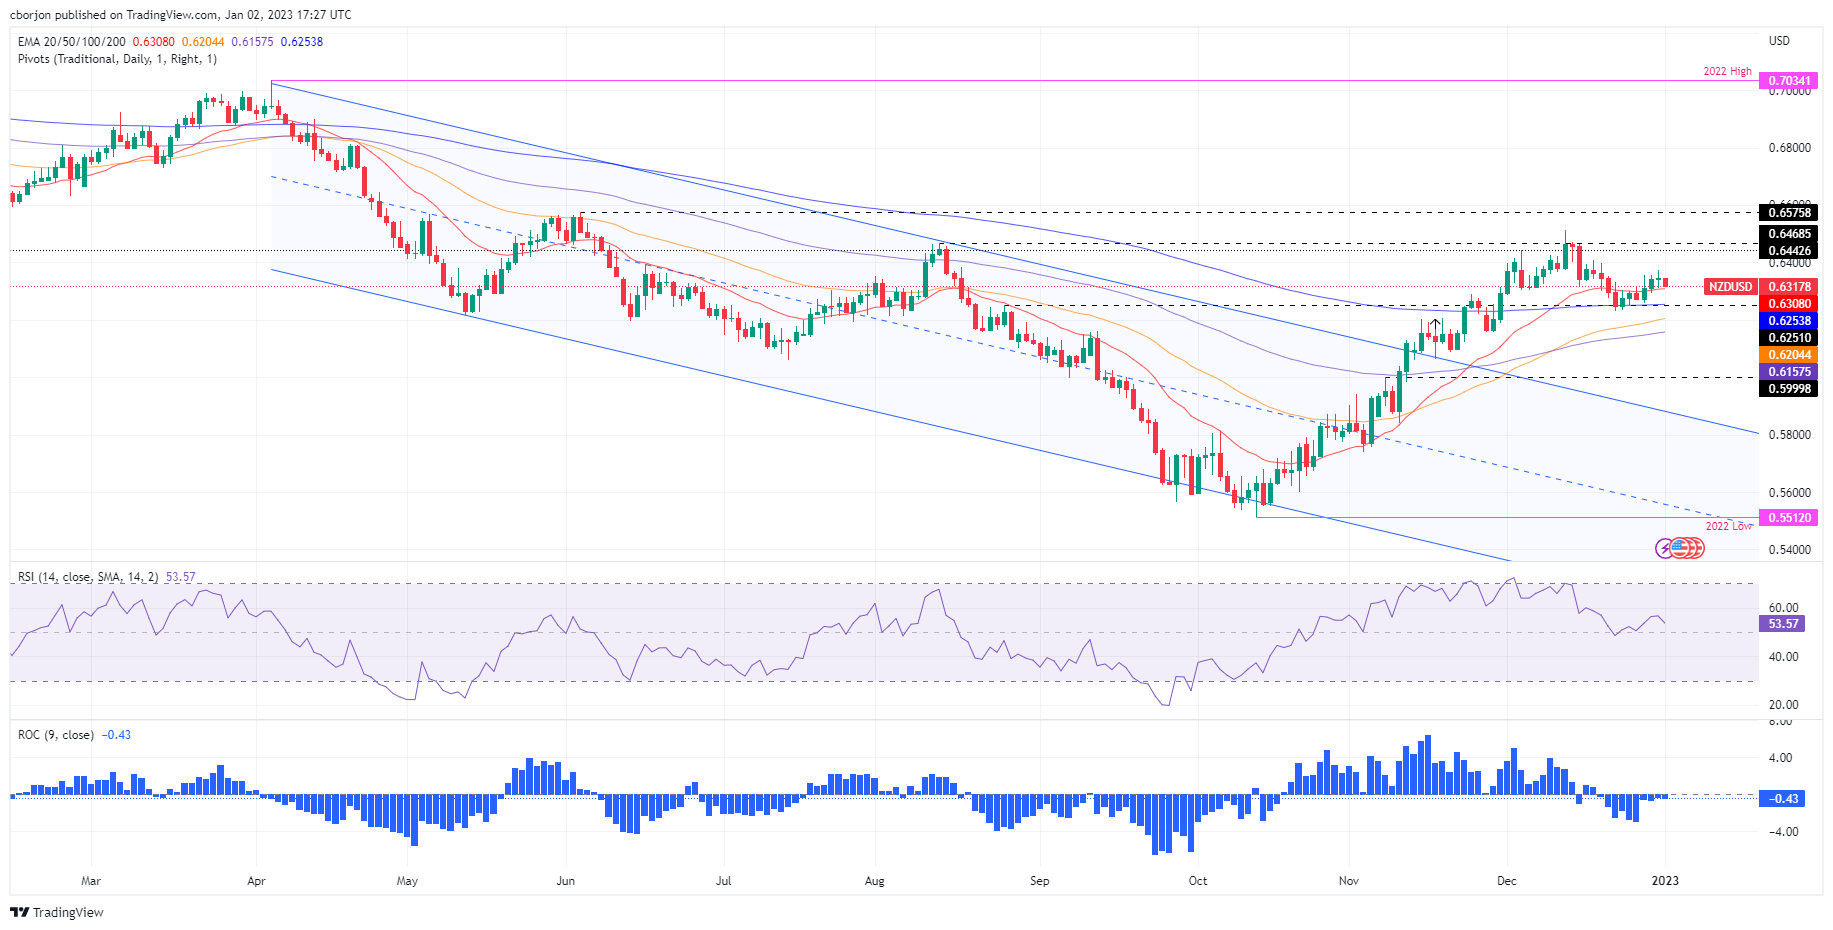
The New Zealand Dollar (NZD) retraces from two-week highs around 0.6370s vs. the USD Dollar (USD) and stumbles to 0.6310s amidst a dull North American session, with US financial markets closed on the observance of new year’s eve. Hence, the NZD/USD drops 0.42% after hitting a daily high of 0.6345, trading at 0.6318.
European equities finished with gains, courtesy of an improvement in market mood. An absent New Zealand and United States (US) economic docket keep most G8 currency pairs within familiar ranges ahead of a pack worldwide economic calendar. Nevertheless, worst than expected, China’s PMIs revealed by the National Bureau of Statistics (NBS) show a gloomy outlook for the second-largest economy in the world. Figures came at 47.0 from 48.0 in November, its most significant drop since the early days of the pandemic.
That said, the NZD/USD pair edged lower, while the US Dollar Index, a gauge of the greenback’s performance against six currencies, advanced 0.14% to 103.63, rebounding at around six-month lows hit during the last week at 103.38.
Aside from this, the International Monetary Fund (IMF) director Kristalina Georgieva said the global economy faces “a tougher year than the year we leave behind.” Georgieva added that 1/3 of the global economy would hit a recession, impacted mainly by the three largest economies, the US, EU, and China, which “are all slowing down simultaneously.”
NZD/USD Price Analysis: Technical outlook
From a daily chart perspective, the NZD/USD pair remains upward biased, though headed for consolidation, as the 20-day Exponential Moving Average (EMA) at 0.6308 acts like a magnet, dragging the exchange rate toward its price level. Oscillators like the Relative Strength Index (RSI) and the Rate of Change (RoC), aim towards their mid-line, suggesting that buying pressure is easing. But if the NZD/USD pair remains above 0.6300, that could pave the way toward higher prices.
Therefore, the NZD/USD first resistance would be 0.6400. Break above would expose the August 12 daily high of 0.64668, followed by 0.6500.
-
16:26
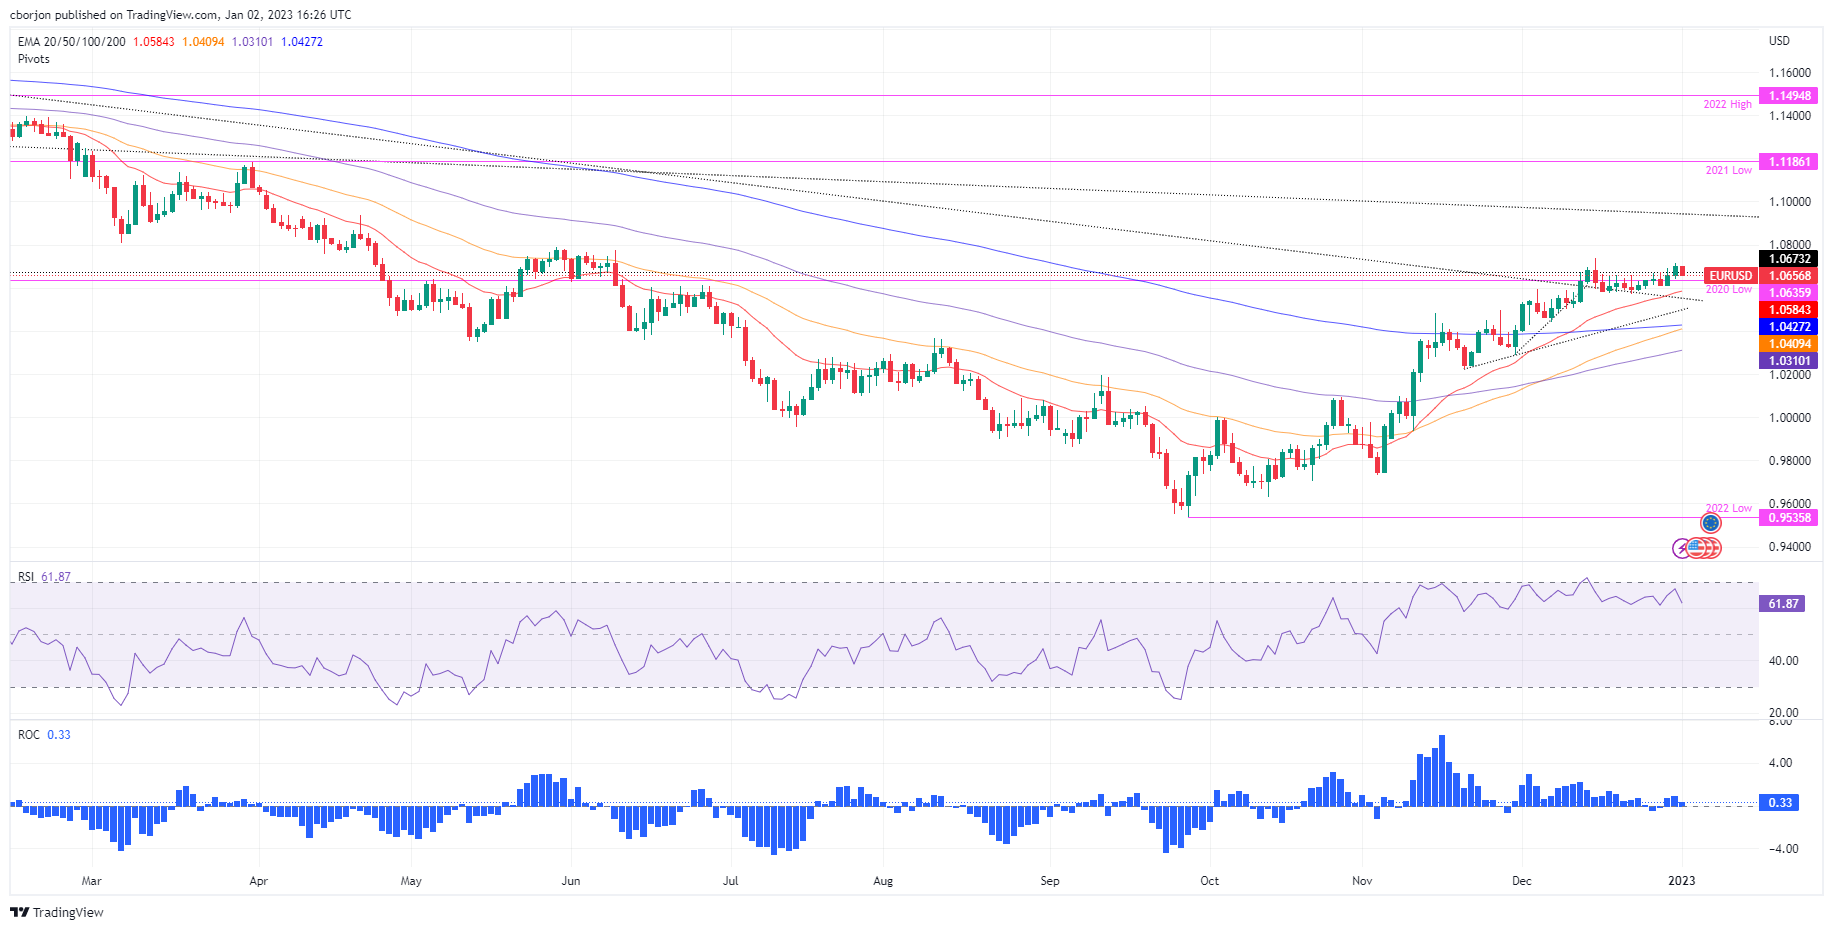
EUR/USD struggles around the two-week high of 1.0700, tumbles to 1.0650s
- Eurozone S&P Global Manufacturing PMIs were mixed and weighed on the EUR.
- European Central Bank Nagel said the ECB needs to take further action to tackle inflation.
- EUR/USD Price Analysis: Failure to crack 1.0700, to pave the way to 1.0600 and below.
The Euro (EUR) sheds some ground against the US Dollar (USD) on the first trading day of 2023 amidst thin liquidity conditions in the financial markets. The release of S&P Global PMIs in the Eurozone failed to bolster the shared currency on Monday. At the time of writing, the EUR/USD is trading at 1.0657 after hitting a daily high of 1.0699.
European equities are trading in the green. S&P Global revealed the Purchasing Managers Index (PMI) for factory activity in the EU, which came mixed with Spain and France’s Manufacturing PMI exceeding estimates, contrarily to Germany, which extended its downward trajectory to 47.1. Italy and the whole Euro area remained unchanged, each at 48.5 and 47.8.
In the meantime, the Bundesbank President and European Central Bank (ECB) policymaker Joachim Nagel crossed newswires on a german newspaper, and he said he’s optimistic that Germany can avoid a serious economic slump. Nagel added that the ECB was not seeing a wage spiral and reiterated that the ECB needs to take further action to curb inflation expectations.
In the meantime, the US Dollar Index, a measure of the buck’s value against a basket of peers, climbs 0.14% to 103.63, off six-month lows hit during the last week at 103.38. the lack of US and Canadian economic data keeps traders leaning on market mood and technicals.
Ahead of the week, the Eurozone economic docket will feature employment data in Germany alongside the inflation rate. Regarding the US economic calendar, the S&P Global Manufacturing PMI for December is expected to remain at 46.2, which could be a prelude to the Institute for Supply Management (ISM) factory activity on Wednesday.
EUR/USD Price Analysis: Technical outlook
The EUR/USD daily chart suggests the pair might be peaking at around 1.0700, unable to crack in December, and it’s trimming some of its early gains, edged toward 1.0660s. Even though it broke above an eight-month-old downslope trendline, the EUR/USD faltered to extend its gains, opening the door for a re-test of the previously mentioned trendline at around 1.0550. Oscillators like the Relative Strength Index (RSI) and the Rate of Change (RoC) started to aim down, suggesting that sellers are beginning to gather momentum. Therefore, the EUR/USD first support would be the 1.0600 mark, followed by the 20-day Exponential Moving Average (EMA) at 1.0584, ahead of 1.0550.
-
16:09
AUD/USD rises to test last week's highs near 0.6820
- AUD/USD consolidates last week’s gains above 0.6800.
- A quiet session across financial markets, Wall Street is closed.
- Key events ahead: FOMC minutes on Wednesday and NFP on Friday.
The AUD/USD up marginally on Monday after posting on Friday, the highest daily close in almost three weeks above 0.6800. Price action remains limited on a quiet session for FX.
The pair is moving sideways on a small range amid low volume. It is trading at daily highs at 0.6818, slightly below last week’s high of 0.6820. Earlier it bottomed at 0.6792.
Risks look biased to the upside in the short term. The Aussie faces initial resistance at 0.6820 and then at 0.6845. On the flip side, the first support stands at 0.6770. A key dynamic support stands at 0.6705, a short-term uptrend line; a break lower would point to further losses.
From holidays to key data
Wall Street is closed on Monday. Markets will return to normal on Tuesday after two weeks of subdue action.
On Tuesday the S&P Global Manufacturing PMI for December is due in Australia and in the US. On Wednesday the US will release the ISM Manufacturing and the Federal Reserve the FOMC December meeting minutes. The key report of the week will be on Friday, the US official employment report. Non-farm payrolls are expected to slow down to 200K in December from 263K of November.
Technical levels
-
15:03
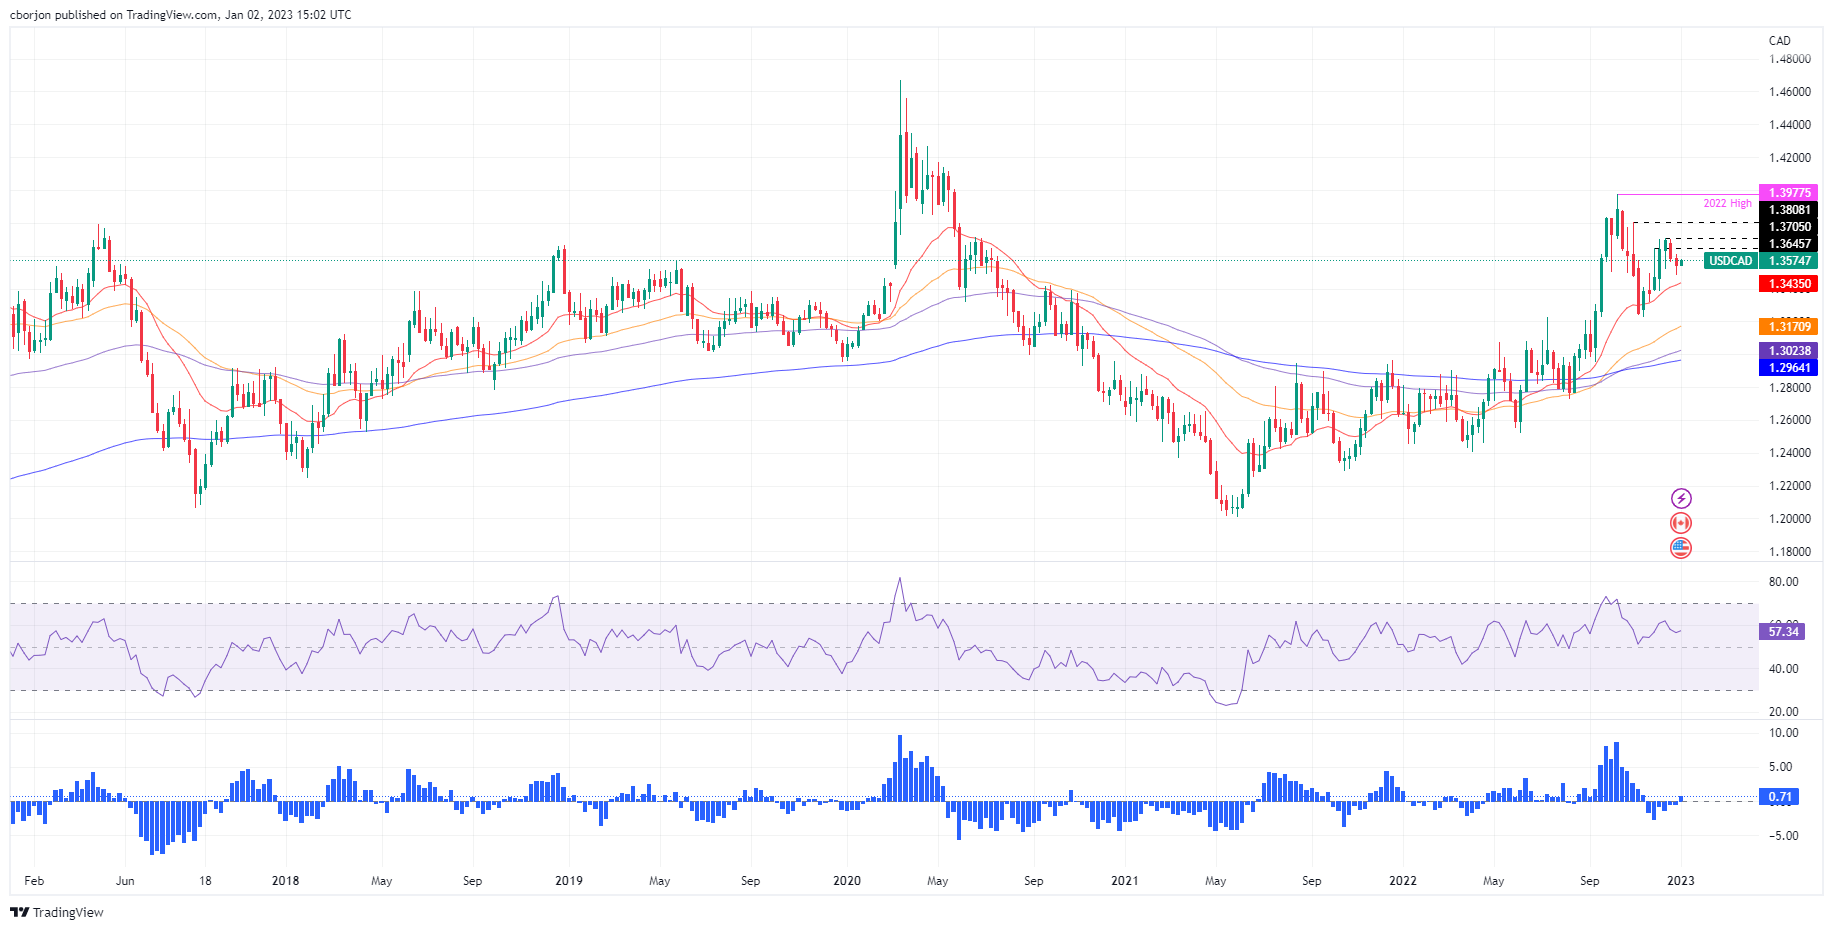
USD/CAD creeps higher around 1.3570s amidst thin liquidity conditions
- The US Dollar regains some composture and climbs against the Canadian Dollar.
- Canadian and US S&P Global Manufacturing PMIs for December would update the current state of factory activity.
- USD/CAD Price Analysis: Range-bound, unable to break above/below the 1.35/1.36 range.
The USD/CAD bounces off nearby the 50-day Exponential Moving Average (EMA) at 1.3532 and rises toward the 20-day EMA, during the first trading day of 2023 in the North American session, amidst thin liquidity conditions, as most markets remain closed on the observance of new year’s eve. At the time of typing, the USD/CAD is trading at 1.3573 after hitting a low of 1.3535.
European equities are trading on a higher note in low-volume conditions. The US Dollar Index, a gauge of the buck’s value against a basket of six currencies, advances 0.14% to 103.63, off six-month lows hit during the last week at 103.38. the lack of US and Canadian economic data keeps traders leaning on market mood and technicals.
Ahead of the week, Tuesday’s economic docket will feature the S&P Global Manufacturing PMIs for both countries, with Canada’s PMI expected to drop to 49.2, below the previous month’s reading of 49.6. Concerning the US, the PMI is estimated to stay unchanged compared to November’s 46.2 reading. Meanwhile, the ISM Manufacturing PMI reading for Wednesday is expected to further contract below the 49.0 mark, increasing the odds of a recession in the United States. Additional to the ISM report, the US docket will release December’s Federal Reserve (Fed) last meeting minutes, which would shed some light regardings the 2023 monetary policy overview.
USD/CAD Price Analysis: Technical outlook
From a daily chart perspective, the USD/CAD remains within familiar technical levels, unable to crack the bottom/top of the 1.3500/1.3600 range, capped by the 20 and 50-day EMAs. Oscillators like the Relative Strength Index (RSI) and the Rate of Change (RoC) exited from the bearish territory, opening the door for further USD/CAD upside. However, until the USD/CAD pair decisively breaks above 1.3600, that could open the door toward 1.3700. On the flip side, if the USD/CAD tumbles below 1.3500, that could pave the way for fresh four-week lows below 1.3484.
-
14:58
USD/JPY falls to test December lows on a quiet day
- Japanese Yen remains strong across the board.
- US Dollar posts mixt results on a low volume session.
- USD/JPY prints fresh daily lows at 130.61.
The USD/JPY is testing the December lows near 130.60, falling for the third day in a row on a quiet session with US markets closed. Price action remains limited across the FX board and the Yen is among the top performers.
The pair is falling for the third consecutive day and is approaching the December intraday low at 130.56. A slide below would put the USD/JPY at the lowest level since August 2. Last Friday, it posted the lowest daily close since early June.
The bias remains bearish for USD/JPY. A slide under 130.50 would expose the next support at 130.35 and then the 130.00. Earlier on Monday, the pair tested levels above 131.00 but it was rejected and pulled back. A consolidation above could trigger a deeper bullish correction. Only a break above 135.20 would change the current bearish short-term outlook to neutral/bullish.
Key data ahead
Wall Street is closed on Monday. On Tuesday, market activity will return to normal. The economic calendar shows key events ahead in the US with the FOMC minutes on Wednesday and the official US employment report on Friday. The employment numbers and the FOMC minutes will likely weigh on market expectations regarding monetary policy.
The USD/JPY lost more than 5% in December after losing 8.50% in November. The decline was helped by the change in the Bank of Japan's Yield Curve Control allowing a bigger price range in the 10-year JGB. Market participants saw that as a sign of a potential shift in BoJ's ultra-dovish monetary policy, reducing the divergence with the Fed.
Technical levels
-
12:58
Trade underperformance of China may extend – TD Securities
Previewing the upcoming data releases from China, analysts at TD Securities said that they think the trade underperformance may extend as external demand is likely to be soft in 2023.
Continued pressure on activity in December and January
"While in the very near-term, consumer caution will cap consumption spending and in turn imports."
"Faltering goods demand may further hurt exports this month though imports may see a slight improvement from last month given the rapid easing in COVID restrictions."
"After the easing in COVID restrictions, virus cases have increased and pressure on health facilities has intensified. Thus, mobility has worsened and consumer sentiment also declined as consumers become increasingly cautious. We expect continued pressure on activity in Dec and Jan before the economy starts to show signs of improvement."
-
11:57
GBP/USD retreats to 1.2050 in quiet session
- GBP/USD came under modest bearish pressure on Monday.
- Trading action is likely to remain subdued during the American trading hours.
- US economic docket will feature several key data releases later in the week.
GBP/USD stretched lower to the 1.2050 area in the early European morning after having spent the Asian session moving sideways in a very tight range slightly below 1.2100.
Markets seem to have turned cautious on the first trading day of 2023 but trading volumes remain thin with the observance of the New Year holiday in major economies. Investors grow increasingly concerned over the impact of the surging number of coronavirus cases in China on the global economic activity as the country stays on the reopening path.
Additionally, the data from China over the weekend revealed that NBS Manufacturing PMI and the Non-Manufacturing PMI declined to 47 and 41.6 in December, respectively, pointing to a contraction in business activity ay an accelerating pace.
The FOMC will publish the minutes of its December meeting on Wednesday and investors will look for fresh clues regarding the Fed's near-term policy outlook.
The ISM Manufacturing and Services PMI surveys, the ADP's private sector employment report and December Nonfarm Payrolls data will also be featured in the US economic docket later in the week.
In the absence of high-impact macroeconomic data releases from the UK, the USD's market valuation and reaction to the high-tier events should continue to drive GBP/USD's action.
Technical levels to watch for
-
11:31
Employment in Canada to rise by 8K in December – TD Securities
Previewing the upcoming jobs report from Canada, analysts at TD Securities said that they expect employment to rise by 8,000 in December with the labour market starting to cool down.
Wages to push higher to 5.5% y/y
"This should push the unemployment rate back to 5.2%, although we expect full-time employment to drive the headline print amid scarce labour supply."
"We also look for wages to push higher to 5.5% y/y with help from muted base effects, while hours worked should see a modest increase."
-
11:25
USD weakness remains dominating subject on FX market – Commerzbank
Ulrich Leuchtmann, Head of FX and Commodity Research at Commerzbank, notes that EUR/USD stays near 6-month highs to start the new year and the US Dollar Index holds near six-month lows
Eurozone is facing a recession
"USD weakness remains the dominating subject on the FX market. Because the market still does not believe the Fed’s affirmations that it will not cut the key rate. It has revised its expectations a little since the last FOMC meeting, but not substantially."
"This mistrust must not surprise, as the FOMC members have been incorrect with their forecasts too many times in the past. I still remember very clearly their – in retrospect – absurd dots from 2009 and the following years."
"In contrast all those who celebrated New Year’s eve in a T-shirt in Europe are likely to feel less concerned about a shortage of gas. This factor that had been putting pressure on the euro, which had already eased in Q4, is thus disappearing even more quickly."
"Of course, the Eurozone is facing a recession. However, if this is one that is “only” due to a tightening of monetary policy it will not be as damaging for the EUR exchange rates as a recession caused by a shortage of gas would have been."
"And in comparison to the US where the real economy is having to deal with a much more aggressive Fed monetary policy the FX market seems to consider the ECB's policy as not that unattractive any longer."
"Our colleagues in macro research like to refer to the long-term risks of inflation of the more cautious ECB interest rate policy. These dangers are not likely to be concrete enough for the FX market yet. It will take some time yet before it prices these in. I am not sure whether that will become an issue this year or whether that is more likely to become the subject of my outlook for 2024."
-
11:01
Portugal Consumer Confidence down to -38.1 in December from previous -37.7
-
11:01
Portugal Business Confidence remains unchanged at 1.2 in December
-
10:12
Fed terminal rate to reach range of 5.25-5.50% by May meeting – TDS
Previewing this week's upcoming events from the US, TD Securities analysts said that they expect the minutes of the FOMC's December policy meeting shed additional light on the Fed's policy outlook for 2023.
Job creation likely gained momentum in December
"Note that the Committee signalled expectations of a substantially higher terminal rate for 2023 despite implementing a downshift in the pace of rate increases to 50bp at the December meeting. We are of the view that the terminal rate will reach a range of 5.25-5.50% by the May FOMC meeting."
"Job creation likely gained momentum in December, with payrolls strengthening at the close of the year in the latest indication of still tight US labor-market conditions. The UE rate likely fell as well to 3.6%, while we expect wage growth to remain high at 0.4% m/m after accelerating to 0.6% in Nov. Separately, we look for the ISM services index to have slowed back to October levels."
-
09:52
EUR/USD starting to gain positive traction – Societe Generale
Societe Generale analysts note that markets are pricing in a 3.5% European Central Bank (ECB) terminal rate following hawkish comments.
EUR/USD is starting to gain positive traction
"A bulging macro release calendar and the prospect of a truckload of new primary bond issuance could herald a furious start to the new year and catch investors flat-footed without much time to digest the switchover from 2022 to 2023 after the impressive round-up of the year last week."
"The race in 10y Bund yields to above 2.50% (IRS 3.20%) and the daily close in EUR/USD above 1.07 stood out on Friday and capped an extraordinary month of December when both the ECB and BoJ shook up the playbook for 2023."
"The hawkish remarks from a number of ECB officials over the festive period but notably from President Lagarde and Schnabel resulted in a significant re-pricing of the terminal rate to 3.50%, an increase of 65bp in one month. Slow to react at first, EUR/USD is starting to gain positive traction as the rhetoric translates into tighter nominal and real Treasury/Bund spreads."
"Croatia may not have anticipated the volatility in bond yields but it still introduced coins and notes yesterday, expanding the club to 20, at funding terms that are still considerably more attractive than those of the other 19 members since 1999."
-
09:24
ECB's Nagel: We need to take further action
European Central Bank policymaker Joachim Nagel told the German trade journal Zeitschrift für das gesamte Kreditwesen on Monday that he is optimistic that they can avoid a serious economic slump.
"We're not seeing any wage-price spiral in the sense of a further increase in the inflation rate due to current wage agreements," Nagel added and reiterated that the ECB needs to take further action to curb inflation expectations.
Market reaction
EUR/USD showed no immediate reaction to these comments and was last seen trading at 1.0680, losing 0.2% on a daily basis.
-
09:00
Greece S&P Global Manufacturing PMI: 47.2 (December) vs previous 48.4
-
09:00
European Monetary Union S&P Global Manufacturing PMI meets expectations (47.8) in December
-
09:00
New year kicks off with continued focus on central banks and inflation – Danske Bank
"A new year kicks off with continued focus on central banks and inflation, as well as on signals of how long and deep a recession are we heading into," Danske Bank analysts note.
Focus on US manufacturing data and FOMC minutes
"For inflation pressures to cool off, further tightening of financial conditions and weaker economic activity is still needed."
"The week starts with December manufacturing PMIs being released from the euro area and from Scandinavia. Indices are widely expected to remain below the 50 threshold implying a recessionary environment albeit it seems that activity has continued to recover from October lows. Overnight, we will also get manufacturing PMI data from China."
"Later in the week, on Tuesday, December flash inflation print from Germany is due, while on Wednesday the focus will be on the US manufacturing data and FOMC minutes."
"Friday will be even more interesting as we will get the December flash inflation print from euro area ahead of US nonfarm payrolls in the afternoon."
-
08:55
Germany S&P Global/BME Manufacturing PMI came in at 47.1 below forecasts (47.4) in December
-
08:50
France S&P Global Manufacturing PMI above expectations (48.9) in December: Actual (49.2)
-
08:45
Italy S&P Global Manufacturing PMI in line with forecasts (48.5) in December
-
08:30
Austria Unemployment Rate rose from previous 6.2% to 7.4% in December
-
08:30
Austria Unemployment climbed from previous 257.5K to 309.7K in December
-
08:15
Spain S&P Global Manufacturing PMI registered at 46.4 above expectations (46.2) in December
-
07:31
Sweden Purchasing Managers Index Manufacturing (MoM) below expectations (46.3) in December: Actual (45.9)
-
06:53
Forex Today: Quiet start to 2023 as major markets remain closed
Here is what you need to know on Monday, January 2:
Major currency pairs remain stuck near Friday's closing levels on Monday amid thin trading conditions. Bond and stock markets will be closed in Europe and in the US in observance of the New Year holiday. S&P Global will release the final revisions to the December Manufacturing PMIs for Germany and the Eurozone.
Early Saturday, the data from China showed that business activity continued to contract at an accelerating pace in December. The NBS Manufacturing PMI dropped to 47 in December from 48 in November and the Non-Manufacturing PMI slumped to 41.6 from 46.7. Both of these readings missed analysts' estimates by a wide margin. Nevertheless, it's difficult to say what kind of an impact these data had on risk sentiment since Shanghai Composite and Hong Kong's Hang Seng indexes are closed on Monday.
Meanwhile, commenting on the coronavirus situation in China, "at present, the epidemic prevention and control is entering a new phase, it is still a time of struggle, everyone is persevering and working hard, and the dawn is ahead," said Chinese President Xi Jinping over the weekend.
EUR/USD gained traction and last Friday and closed the sixth straight week in positive territory. The pair moves sideways a few pips below 1.0700 on Monday.
GBP/USD edged slightly lower during the Asian trading hours and was last seen losing 0.2% on the day at 1.2075.
USD/JPY lost more than 150 pips in the last week of 2022 and registered its lowest weekly close since late May below 131.00. The pair is fluctuating in an extremely narrow range early Monday.
Following Thursday's rebound, Gold price continued to push higher on Friday and closed the week above $1,820.
Bitcoin managed to register modest gains on Sunday but failed to preserve its bullish momentum. BTC/USD moves up and down in a narrow channel slightly above $16,600 early Monday. Ethereum struggles to make a decisive move in either direction and remains stuck at around $1,200.
-
06:51
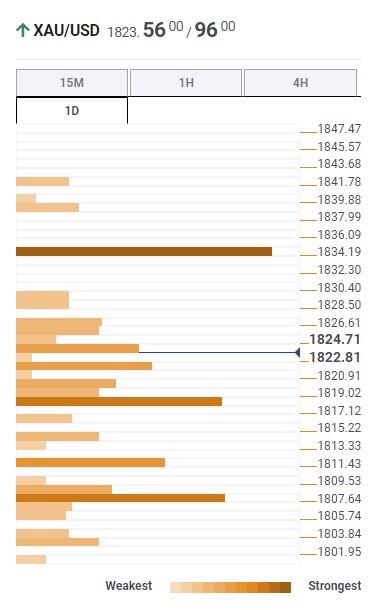
Gold Price Forecast: XAU/USD bulls need validation from $1,835 – Confluence Detector
- Gold price struggle for clear directions amid holiday mood.
- US Dollar Index rebounds amid risk-negative headlines surrounding China, pre-data caution.
- Fed Minutes, US NFP will be crucial as XAU/USD struggles around key resistance.
Gold price (XAU/USD) remains sidelined as holidays in major markets restrict the precious metal’s moves during early Monday. Also acting as an upside filter is the US Dollar’s rebound amid escalating fears from China, as well as headlines suggesting the US growth optimism, backed by comments from the International Monetary Fund’s (IMF) Managing Director Kristalina Georgieva. Even so, the recently softer US data, mainly surrounding inflation and activities, join an absence of the hawkish Fedspeak to keep Gold buyers hopeful.
That said, Gold traders may witness inaction during the rest of the day but the current week holds multiple key catalysts and hence become warrants caution. Among them, this week’s activity data from the US, Minutes of the latest Federal Open Market Committee (FOMC) meeting and December month employment numbers are crucial for clear directions.
Also read: Gold Price Annual Forecast: Will 2023 be the year Gold shines?
Gold Price: Key levels to watch
The Technical Confluence Detector shows that the Gold price grinds higher towards the $1,835 key hurdle comprising the previous weekly and monthly high, as well as the Pivot Point one-day R2.
Following that, a run-up towards June 2022 peak surrounding $1,880 can’t be ruled out.
Alternatively, pullback moves remain elusive beyond the $1,819 level that includes Fibonacci 61.8% on one-day and SMA10 on 4H.
In a case where the Gold price drops below $1,819, a convergence of the 200-HMA and Pivot Point one-day S2, around $1,808, will be crucial to watch.
Should the Gold bears keep the reins past $1,808, the odds of witnessing a slump toward the $1,800 threshold can’t be ruled out.
Here is how it looks on the tool
About Technical Confluences Detector
The TCD (Technical Confluences Detector) is a tool to locate and point out those price levels where there is a congestion of indicators, moving averages, Fibonacci levels, Pivot Points, etc. If you are a short-term trader, you will find entry points for counter-trend strategies and hunt a few points at a time. If you are a medium-to-long-term trader, this tool will allow you to know in advance the price levels where a medium-to-long-term trend may stop and rest, where to unwind positions, or where to increase your position
-
06:21
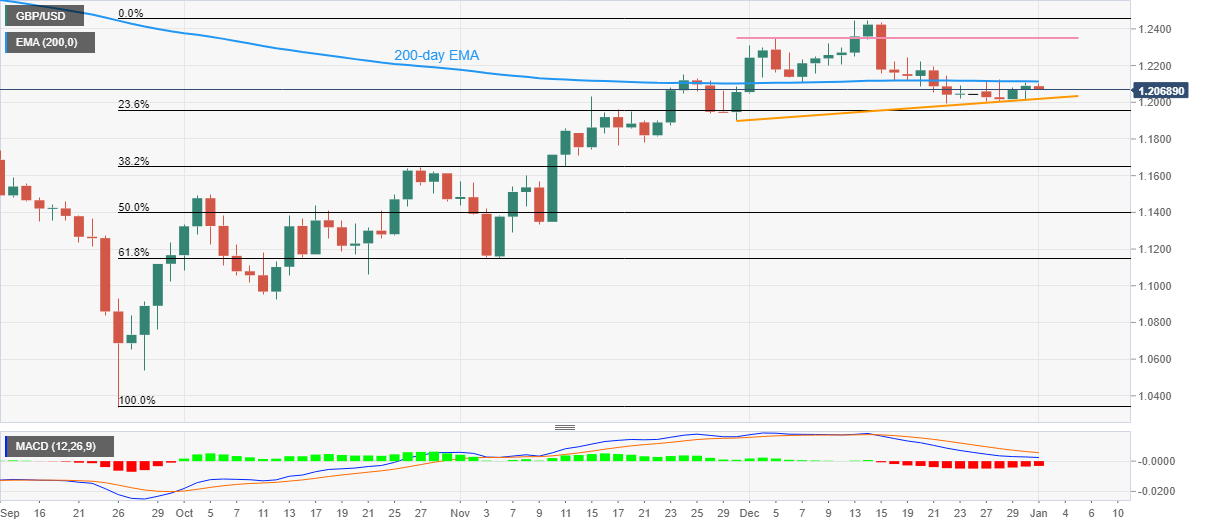
GBP/USD Price Analysis: Snaps two-day uptrend as 200-day EMA probes buyers
- GBP/USD fades bounce off the five-week-old support line, mildly offered of late.
- Bearish MACD signals suggest another attempt to break short-term support.
- Monthly horizontal resistance, December’s peak adds to the upside barriers.
GBP/USD renews its intraday low near 1.2070 during the first loss-making day in three, despite the market’s inaction during early Monday.
In doing so, the Cable pair takes a U-turn from the 200-day Exponential Moving Average (EMA) to recall the bears. Also keeping the GBP/USD sellers hopeful are the bearish MACD signals,
It’s worth noting, however, that a one-month-old ascending support line, close to 1.2020 by the press time, restricts short-term GBP/USD downside.
Following that, the late November swing low near 1.1900 could act as the last defense of the GBP/USD.
In a case where GBP/USD remains bearish past 1.1900, the odds of witnessing a slump towards the 38.2% Fibonacci retracement level of September-December 2022 upside, near 1.1650, can’t be ruled out.
Alternatively, a clear upside break of the 200-day EMA level surrounding 1.2115 could propel GBP/USD towards a one-month-long resistance line, close to 1.2355 at the latest.
Should the GBP/USD bulls occupy the driver’s seat past 1.2355, the previous monthly peak surrounding 1.2450 should gain the market’s attention.
Overall, GBP/USD is likely to witness a downside but the room towards the south appears limited.
GBP/USD: Daily chart
Trend: Limited downside expected
-
06:09
EUR/JPY declines towards 139.00 as German Inflation grabs attention
- EUR/JPY is likely to drop further to near 139.00 as investors are cautious about Euro ahead of German inflation.
- Rising wage growth is infusing fresh blood into the Eurozone inflation.
- The BOJ has raised inflation targets substantially for CY2023 and 2024.
The EUR/JPY pair dropped to the psychological support of 140.00 as investors got cautionary ahead of the release of the German Harmonized Index of Consumer Prices (HICP), which will release on Tuesday. The cross dropped sharply late Friday as investors poured funds into the Japanese Yen led by the bond-buying program from the Bank of Japan (BOJ) last week.
The Euro is likely to witness a power-pack action after the release of the German HICP. As per the projections, the inflation indicator is seen higher at 11.8% vs. the former release of 11.3%. Lately, European Central Bank (ECB) President Christine Lagarde cited the rising wage rate as responsible for the continuous escalation of inflationary pressures. ECB President cited that the central bank must prevent this from adding to already high inflation, as reported by Reuters.
Meanwhile, analysts at Natixis believe that “In the Eurozone, the real long-term interest rate is well below potential growth, and the mortgage rate is lower than nominal wage growth; monetary policy is therefore completely expansionary.”
Apart from the German Inflation data, investors will also focus on German Unemployment data. The Unemployment Change (Dec) is expected to escalate to 27K against the former release of 17K. While the jobless rate might trim to 5.5% from the former release of 5.6%.
On the Tokyo front, the higher inflation forecast by the Bank of Japan (BOJ) is supporting the Japanese Yen bulls. Nikkei reported that the BOJ is considering raising its inflation forecasts in January to show price growth close to its 2% target in fiscal 2023 and 2024. While the core Consumer Price Index (CPI) is seen rising around 3% in fiscal 2022, between 1.6% and 2% in fiscal 2023, and nearly 2% in fiscal 2024.
-
06:01
Netherlands, The Markit Manufacturing PMI rose from previous 46 to 48.6 in December
-
05:43
AUD/USD eyes 0.6850 as US Dollar Index faces selling pressure ahead of FOMC minutes
- AUD/USD is aiming to recapture the 0.6850 barrier as US Dollar Index has shifted into a bearish trajectory.
- Higher interest rate hikes by the Federal Reserve might impact the ISM Manufacturing PMI.
- The release of the FOMC minutes on Thursday will provide a detailed explanation of December’s policy.
- AUD/USD is hoping for a continuation of a six-day winning streak after sustaining above 0.6800.
AUD/USD settled the last trading session of CY2022 on a promising note after the US Dollar Index (DXY) faced immense pressure. The Aussie asset continued its winning spree for the sixth day despite less trading activity due to the festive week. Usually, the overall trading activity gets reduced sharply amid a holiday-truncated week as investors prefer to save themselves from unexpected wild gyrations.
The Australian Dollar managed to remain in a positive trajectory despite the vulnerable Covid-19 situation in China. Covid-19 cases have spiked sharply and the situation is beyond the control of medical facilities. This has triggered short-term pain in the extent of economic activities.
Risk-perceived assets like S&P500 ended 2022 on a cautious note as analysts have mixed responses over economic projections. On contrary, the risk-sensitive currencies witnessed firmer demand from the market participants. The US Dollar Index (DXY) delivered a downside break of the consolidation formed in a 103.37-104.57 range. While the return on 10-year US Treasury bonds continued their strength and rose to near 3.88%.
US ISM PMI seems crucial amid higher interest rates by the Federal Reserve
Investors are keenly waiting for the release of the United States ISM Manufacturing PMI data, which will release on Wednesday. It is crucial to understand the change in the extent of economic activities as the Federal Reserve is continuously hiking interest rates. In December’s monetary policy meeting, Fed chair Jerome Powell hiked interest rates by 50 basis points (bps) to 4.25-4.50%. This has compelled firms to skip their expansion plans as interest obligations could be extremely higher in the current period of time.
According to the estimates, the US ISM Manufacturing PMI data is expected to improve to 49.6 from the former release of 49.0. Apart from that, investors will focus on New Orders Index data that provide cues about the forward demand in the United States economy. The economic data is seen higher at 48.1 vs. the former release of 47.2.
Federal Open Market Committee hogs limelight
This week, the event of Federal Open Market Committee (FOMC) minutes will remain in the spotlight. The release of the FOMC minutes on Thursday will provide a detailed explanation of December’s monetary policy decision. Apart from that, the market participants will keep an eye on cues about economic projections and likely monetary policy action by Fed chair Jerome Powell ahead.
A scrutiny of Federal Reserve chair Jerome Powell’s speech in December’s monetary policy meeting clears that the central bank sees interest rate peak around 5.1%. Considering opinions from various Federal Reserve policymakers, the central bank will keep interest rates at their peak and continue for the entire CY2023 to achieve price stability.
Caixin Manufacturing PMI seems crucial amid China’s vulnerable Covid situation
The Chinese economy has attracted a significant decline in economic projections by think tanks after adopting a sheer pace in reopening the economy. After a firm protest by households for the rollback of lockdown restrictions, it seems necessary to check out the deviation in the figures from the prior release. As per the consensus, the Caixin Manufacturing PMI data is expected to drop marginally to 49.3 from the prior release of 49.4.
Observation from the Chinese official Manufacturing PMI shows a downbeat expression. Official China’s Manufacturing PMI data dropped to 47.0 vs. the expectations of 49.2 and the former release of 48.0.
AUD/USD technical outlook
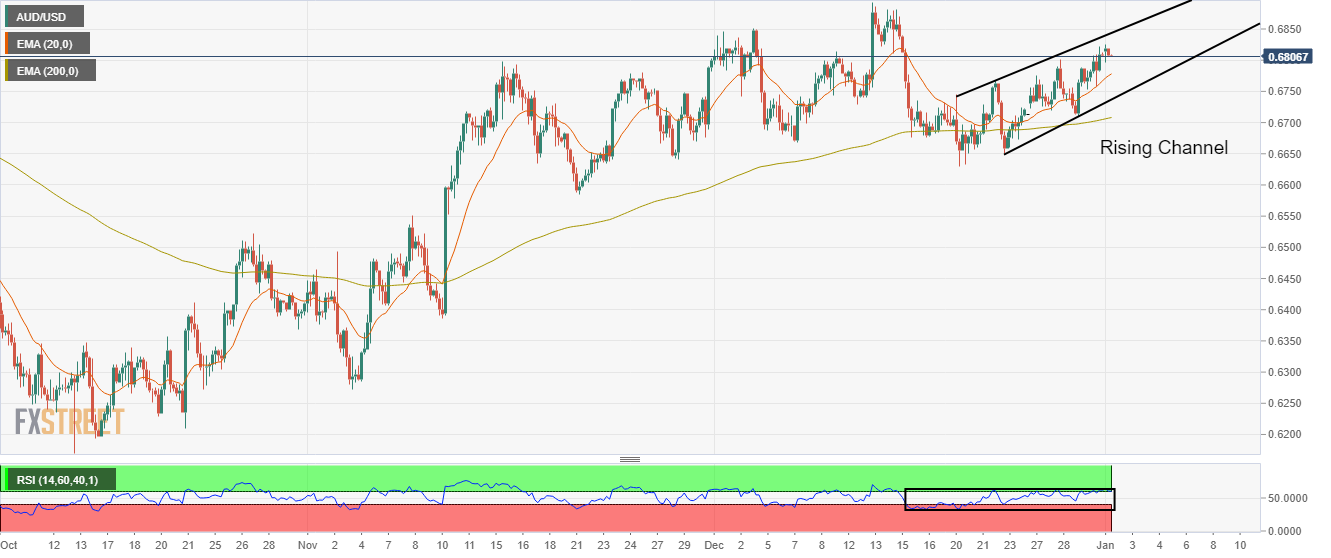
On a four-hour scale, the Aussie asset is auctioning in a Rising Channel chart pattern, which is highly neutral as it has formed after a sell-off move from December 13 high around 0.6900. The round-level resistance of 0.6800 has remained a critical barrier for the Australian Dollar for the past 15 trading sessions.
A recovery move in the Aussie asset has pushed it above the 20-period Exponential Moving Average (EMA) around 0.6747. Also, the 200-EMA at 0.6700 is still solid, which indicates that the long-term trend is still bullish.
The Relative Strength Index (RSI) (14) is struggling to shift into the bullish range of 60.00-80.00. An occurrence of the same will trigger bullish momentum.
-
05:13
USD/IDR Price News: Rupiah retreats to $15,560 despite firmer Indonesia Inflation, PMI data
- USD/IDR picks up bids to snap two-day downtrend as US Dollar rebounds during holiday-thinned markets.
- Indonesia Inflation, S&P Global PMI came in firmer for December, President Widodo expects 2023 growth above 5.0%.
- Markets remain inactive but doubts surrounding China seem to weigh on IDR.
- US PMIs, FOMC Meeting Minutes and the US employment report will be crucial to watch for clear directions.
USD/IDR prints to mild gains around $15,560, following a two-day downtrend, as US Dollar rebounds amid a sluggish trading day. In doing so, the Indonesia Rupiah (IDR) pair ignores downbeat Indonesia data.
That said, Indonesia's Inflation rose by 5.51% YoY versus 5.39% previous whereas the MoM figures grew by 0.66% compared to 0.09% prior release. It’s worth noting that Core Inflation grew by 3.36% YoY against 3.3% previous readings. Furthermore, Indonesia S&P Global PMI for December also improved to 50.9 versus 50.3.
Earlier in the day, Indonesia President Joko Widodo mentioned, per Reuters, that he expects 2023 growth above 5.0%.
It should be observed that the latest Indonesia Inflation figures are above the Bank Indonesia (BI) target range between 2.0% and 4.0%, which in turn should have propelled the IDR. However, economic fears surrounding China, as well as holidays in major markets seemed to have allowed the USD/IDR bears to take a breather.
Doubts over China’s economic recovery, due to the Covid outbreak, join the downbeat comments from the International Monetary Fund’s (IMF) Managing Director Kristalina Georgieva concerning Beijing, seem to underpin the US Dollar rebound. Even so, the latest headlines from Reuters seem to challenge the IDR bears by pushing back pessimism surrounding China. “Some people in China's key cities of Beijing, Shanghai and Wuhan braved the cold and a spike in COVID-19 infections to return to regular activity on Monday, confident of a boost to the economy as more recover from infections,” said Reuters.
Given the light calendar and off in multiple markets, not to forget recently mixed signals surrounding China, USD/IDR is likely to remain firmer. However, this week’s activity data from the US, Minutes of the latest Federal Open Market Committee (FOMC) meeting and December month employment numbers are crucial for clear directions.
Technical analysis
A successful trading beyond a five-month-old ascending support line, currently around $15,455, keeps USD/IDR buyers hopeful of challenging November 2022 peak of $15,821.
-
04:42
EUR/USD Price Analysis: Stays defensive above 1.0690 resistance-turned-support
- EUR/USD seesaws near seven-month high, snaps two-day winning streak.
- One-week-old previous resistance puts a floor under the prices even as buyers appear to run out of steam.
- 50-HMA, ascending trend line from December 22 act as additional downside filters.
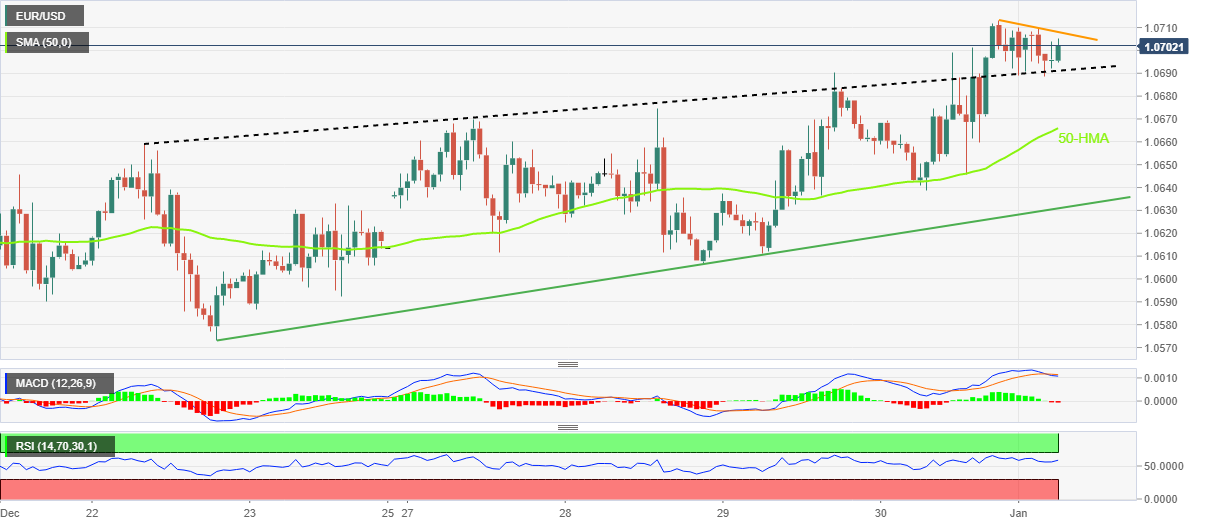
EUR/USD portrays exhaustion of the previous bull-run amid Monday’s holiday-inspired lackluster trading day.
Also read: EUR/USD portrays tepid start to 2023 after a volatile year, ECB vs. Fed talks, US NFP eyed
In doing so, the major currency pair fades the previous day’s upside break of the one-week-old resistance line, now support.
The EUR/USD pair’s retreat also takes clues from the bearish MACD signals and steady RSI, adding strength to the bearish bias.
However, a clear downside break of 1.0690 becomes necessary for the major currency pair to recall the bears.
Even so, 50-HMA and an upward-sloping support line from December 22, respectively near 1.0665 and 1.0630, could restrict the quote’s further downside.
In a case where the EUR/USD price remains weak past 1.0630, the late December swing low near 1.0570 could lure the pair bears.
Alternatively, buyers need validation from the immediate resistance line, as well as the monthly, respectively around 1.0708 and 1.0713, to direct prices towards May 2022 peak surrounding 1.0785.
Following that, the 1.0800 could probe the EUR/USD bulls before highlighting the late April 2022 swing high of 1.0936 as the key hurdle to the north.
Overall, EUR/USD remains on the buyer’s radar but a short-term pullback appears to brew of late.
EUR/USD: Hourly chart
Trend: Downside expected
-
04:19
USD/INR Price Analysis: Remain sideways below 83.00 amid a quiet market mood
- USD/INR is oscillating in a tight range for the past two weeks amid the absence of potential triggers.
- The 20-and 50-EMAs are on the verge of delivering a bearish crossover around 82.37.
- A break inside the bearish range by the RSI (14) will activate bearish momentum.
The USD/INR pair is displaying some volatility in its opening trade on Monday after the festive mood. The asset is oscillating in the midst of the two-week-long trading range and is likely to continue further as the market participants seem still busy enjoying New Year celebrations.
Meanwhile, the US Dollar Index (DXY) dropped sharply to near 15-day low of around 103.00 on Friday amid a recovery in the risk-appetite theme. The 10-year US Treasury yields climbed to 3.88% amid obscurity in the overall risk theme.
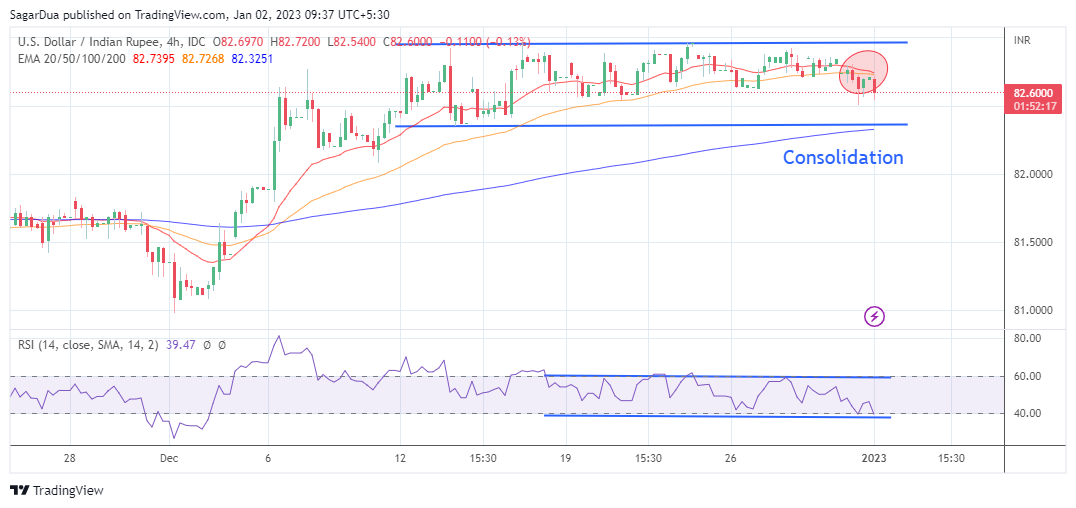
On a four-hour scale, the Indian Rupee asset is oscillating in a range of 82.35-82.96 for the past two weeks. This could be termed as an inventory adjustment, however, it is difficult to tag it as an accumulation or a distribution.
The 20-and 50-period Exponential Moving Averages (EMAs) are on the verge of delivering a bearish crossover around 82.37, which might trigger a short-term downtrend.
While, the 200-EMA at 82.33 is sloping north, which indicates that the upside trend is still solid.
The Relative Strength Index (RSI) (14) is on the verge of delivering a break into the bearish range of 20.00-40.00, which might trigger a bearish momentum.
Should the asset break below December 13 low around 82.35, the Indian rupee bulls will drag the asset towards December 9 low around 82.00 followed by November 25 low at 81.42.
On the contrary, a breakout of the consolidation above the round-level resistance of 83.00 will expose the asset to hit its all-time high at 83.29. A breach of the latter will send the major into unchartered territory.
USD/INR four-hour chart
-
04:18
Gold Price Forecast: XAU/USD begins 2023 on a cautious note above $1,800
- Gold price treads water as holidays in the key markets restrict XAU/USD moves.
- Challenges to sentiment from China, IMF comments could probe Gold buyers.
- Cautious mood ahead of Fed Minutes, US NFP may also challenge XAU/USD upside.
- US Dollar Index rebounds from seven-month low despite recently downbeat US data.
Gold price (XAU/USD) seesaw near $1,825 during early Monday, mostly unchanged, as holidays in multiple markets restrict the metal’s immediate moves despite the US Dollar’s rebound.
The quote’s latest inaction could also be linked to the mixed US data and recent challenges to the market sentiment, as well as the cautious mood ahead of this week’s top-tier data/events.
It’s should be noted that most of the recent US data, including the figures concerning inflation and activities, have been downbeat and tame the woes surrounding the price pressure in the world’s biggest economy. The same previously propelled the Fed to bolster the rates and trigger recession woes. Hence, softer data weigh on the hawkish Fed bets and question the US Dollar buyers.
Elsewhere, doubts over China’s economic recovery, due to the Covid outbreak, join the downbeat comments from the International Monetary Fund’s (IMF) Managing Director Kristalina Georgieva concerning Beijing also challenging the Gold price.
It’s worth noting, however, IMF’s Georgieva appears optimistic about the US growth conditions and hence puts a floor under the US Dollar’s latest moves.
Looking forward, Wednesday’s Minutes of the latest Federal Open Market Committee (FOMC) meeting, as well as Friday’s December month employment numbers for the US, will be crucial for Gold traders to watch.
Also read: Gold Price Annual Forecast: Will 2023 be the year Gold shines?
Gold price technical analysis
Gold price seesaws inside a three-day-old rising wedge bearish chart formation as bulls keep the reins around a six-month high.
That said, sluggish MACD and RSI conditions join the bearish chart pattern to challenge the XAU/USD buyers. As a result, Gold sellers could aim for further downside on breaking the $1,817 support, comprising the lower line of the stated wedge.
Even so, the 200-HMA and an ascending support line from mid-December, respectively around $1,807 and $1,798, could probe the downside momentum before giving control to the Gold bears.
Alternatively, an upside clearance of the $1,828 hurdle comprising the wedge’s top line, will defy the bearish chart formation.
It should be noted that the previous monthly high surrounding $1,835 acts as the last defense of the Gold bears ahead of directing the prices toward the June 2022 swing high near $1,880.
Gold price: Hourly chart
Trend: Limited upside expected
-
04:18
Indonesia Core Inflation (YoY) up to 3.36% in December from previous 3.3%
-
04:11
Indonesia Inflation (MoM) rose from previous 0.09% to 0.66% in December
-
04:11
Indonesia Inflation (YoY) climbed from previous 5.42% to 5.51% in December
-
03:43
USD/JPY sees a downside below 131.00 amid a weaker US Dollar Index
- USD/JPY is expected to surrender the 131.00 support as the USD Index has faced immense pressure.
- The FOMC minutes will provide a detailed explanation of December’s monetary policy decision.
- The BOJ is considering raising its inflation targets to 2% for CY2023 and 2024.
The USD/JPY pair is hovering around 131.00 after a less-confident rebound from 130.78 as settled on Friday. The asset is hoping for a continuation of weakness, which might drag the asset again below the immediate support of 131.00. The major is likely to face significant heat amid weakness in the US Dollar Index (DXY).
The USD Index remained in the grip of bears on Friday after surrendering its trading range of 103.47-104.57. The consolidation of two weeks displayed a breakdown as investors poured liquidity into risk-perceived currencies led by declining inflation expectations for CY2023. Analysts at Natixis cited the monetary policy expression by the Federal Reserve (Fed) is a restrictive one as the mortgage rate is higher than nominal wage growth in the United States economy.
While S&P500 remained choppy on Friday as the trading activity was trimmed dramatically amid a festive market mood but ended on a subdued note. The 10-year US Treasury yields advanced further to 3.88% as the demand for government bonds dropped.
This week, the critical event that will support the USD Index in gauging a decisive move will be the release of the Federal Open Market Committee (FOMC) minutes. The FOMC minutes will provide a detailed explanation of December’s monetary policy decision. Apart from that, the market participants will keep an eye on cues about economic projections and likely monetary policy action by Fed chair Jerome Powell ahead.
On the Tokyo front, clear inflation projections for the next two years by the Bank of Japan (BOJ) are supporting the Japanese Yen. Nikkei reported on Saturday that the BOJ is considering raising its inflation forecasts in January to show price growth close to its 2% target in fiscal 2023 and 2024.
-
02:49
USD/CAD Price Analysis: Bounces off 1.3520 support confluence
- USD/CAD reverses from intraday low, probes the previous daily loss.
- Convergence of 200-SMA, three-day-old ascending trend line restricts immediate downside.
- Bulls remain off the table unless crossing the previous support line from November.
- Downbeat RSI line, sustained trading below key trend line, SMA favor sellers.
USD/CAD takes a U-turn from the intraday low while picking up bids to 1.3560 amid the holiday-thinned trading session on Monday. In doing so, the Loonie pair bounces off the convergence of the 200-SMA and an upward-sloping support line from the last Wednesday.
That said, the quote’s failure to stay beyond the support-turned-resistance line from November 15, following the previous week’s bounce off the 200-SMA, joins sustained trading below the 50-SMA to keep USD/CAD sellers hopeful.
As a result, the Loonie pair is likely to conquer the 1.3520 support level and aim for the 1.3500 round figure.
However, the double bottom around 1.3485, marked in the last week, will be crucial for the USD/CAD bears to keep the reins.
Following that, the previous monthly low of around 1.3385 could lure the pair sellers ahead of November’s bottom surrounding 1.3225.
Meanwhile, the pair’s recovery moves could aim for the weekly resistance line, around 1.3570, before poking the 50-SMA level surrounding 1.3580.
Though, successful trading beyond the 1.5-month-old support-turned-resistance line, close to 1.3610 at the latest, becomes necessary for the USD/CAD bulls to retake control.
Overall, USD/CAD is likely to remain on the bear’s radar unless even as the downside room is limited.
USD/CAD: Four-hour chart
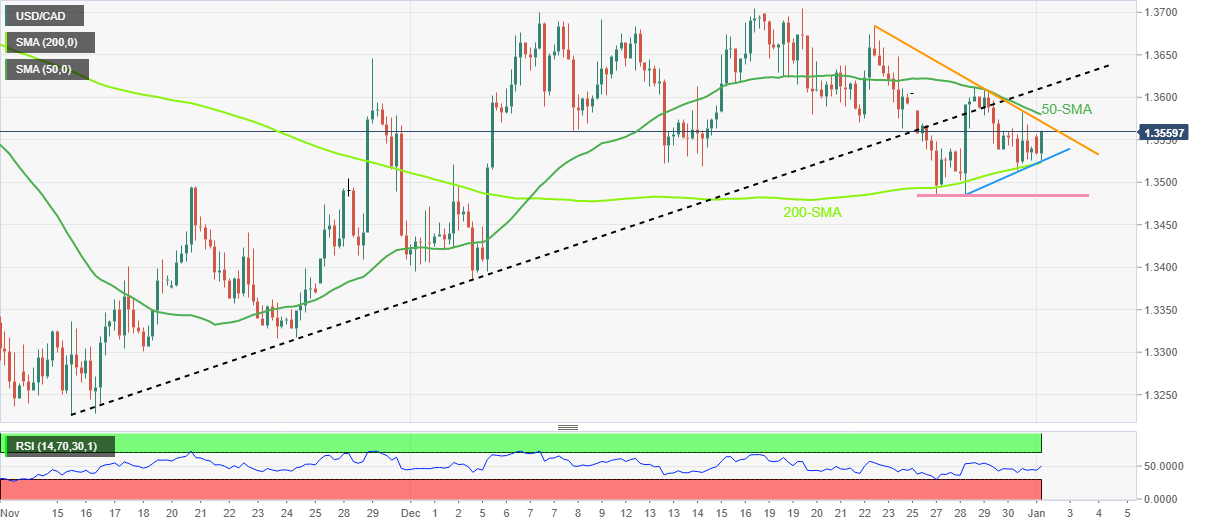
Trend: Further downside expected
-
02:30
Commodities. Daily history for Friday, December 30, 2022
Raw materials Closed Change, % Silver 23.926 0.15 Gold 1823.995 0.51 Palladium 1786.95 -1.27 -
02:20
GBP/USD stays pressured below 1.2100 on UK politics, focus on PMIs, Fed Minutes and NFP
- GBP/USD retreats from intraday high to snap two-day uptrend.
- British labor strike, UK PM Sunak’s push back to childcare reform joins geopolitical concerns to weigh on Cable.
- Holidays in UK, US restrict market moves as 2023 begins.
- Final readings of UK PMIs for December, US employment data and FOMC Minutes are this week’s crucial catalysts.
GBP/USD takes offers to pare intraday gains around 1.2080, teasing bears for the first time in three days, even as the holiday mood limits the Cable pair’s immediate moves.
Multiple negatives surrounding the UK seemed to have lured the GBP/USD bears of late. Among them, British Prime Minister (PM) Rishi Sunak’s shelving of the plans for a major overhaul of the childcare system aimed at saving parents money and helping them return to work, per The Telegraph, gains major attention.
On the same line are the updates surrounding the UK labor strikes as The Times report that the British ministers think unions will run out of money and have to back down but the unions reject the claim, accuse govt of sabotage & say they have financial firepower. Additionally, the UK’s sanctioning of Russian military commanders and Iranian businessmen, as well as the British Defense authorities’ request for more funding, also seemed to have probed the GBP/USD buyers of late.
Elsewhere, downbeat prints of the US data and the year-end consolidation dragged the US Dollar Index (DXY) to refresh a seven-month low the previous day. That said, Chicago Purchasing Managers’ Index crossed the market consensus of 41.2 and the 37.2 previous readings to print the 44.9 figures for December. Even so, the activity gauge signaled contraction for the fourth consecutive month.
Against this backdrop, Wall Street closed with mild losses but the US Treasury bond yields recovered, which in turn probes the GBP/USD bulls who previously held the reins.
Looking forward, a light calendar and off in multiple markets could offer a dull Monday but the British political plays could entertain the GBP/USD pair traders.
For the week, final readings of the UK’s activity numbers for December and the US employment report for the said month will be important for the GBP/USD pair traders to watch for clear directions. Also crucial will be the Minutes of the latest Federal Open Market Committee (FOMC) meeting mid the Fed’s rejection of dovish bias.
Overall, GBP/USD bulls seem to run out of steam but the lack of marker participation seems to limit the pair’s moves.
Technical analysis
A 200-SMA level around 1.2100 precedes the stated triangle’s upper line near 1.2110 to restrict short-term advances of the GBP/USD prices. It’s worth noting, however, that the bullish MACD signals and the firmer RSI (14), not overbought, join the 1.2000 psychological magnet to limit the Cable pair’s immediate downside.
-
01:54
NZD/USD Price Analysis: Justifies Friday’s bearish Doji below 0.6350
- NZD/USD prints mild losses around a two-week high, justifies the previous day’s bearish candlestick formation.
- Previous support line from October, bearish MACD signals also keeps sellers hopeful.
- 200-day EMA holds the key to Kiwi bear’s conviction.
NZD/USD holds lower ground near the intraday bottom of 0.6329 during the mid-Asian session on a sluggish Monday. The Kiwi pair’s latest inaction could be linked to the holidays in multiple markets, including New Zealand.
Even so, the quote prints mild losses while justifying the previous day’s bearish Doji candlestick. Also favoring the NZD/USD bears are the bearish MACD signals and the pair’s sustained trading below the previous support line from October 13, now resistance around 0.6400.
As a result, the Kiwi pair is likely to extend the latest weakness toward the 200-day Exponential Moving Average (EMA) support surrounding 0.6235.
During the fall, the 0.6300 round figure may act as an intermediate halt whereas the late November swing low around 0.6155 could challenge the NZD/USD bears afterward.
On the contrary, the Kiwi pair’s successful trading above 0.6400 support-turned-resistance could propel the quote toward the previous monthly high near 0.6515.
It’s worth noting that the NZD/USD pair’s sustained run-up beyond 0.6515 enables the bulls to aim for a June 2022 high of 0.6575.
Overall, NZD/USD is likely to extend the latest pullback but the downside room appears limited.
NZD/USD: Daily chart
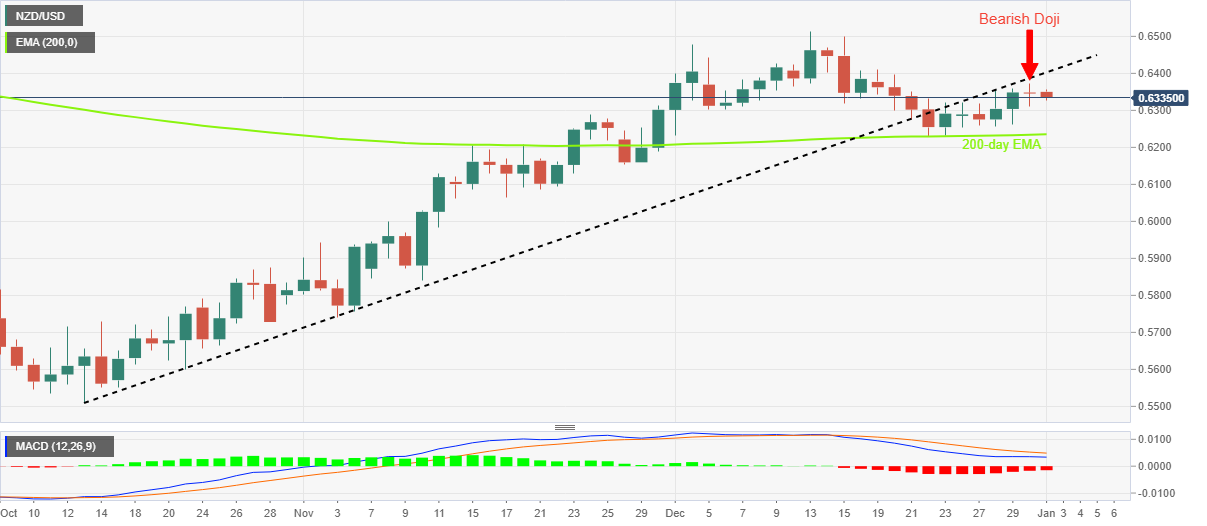
Trend: Limited downside expected
-
01:48
Silver Price Analysis: XAG/USD aims to shift auction profile above $24.00
- Silver price needs to overstep $24.30 for a volatility contraction breakout.
- The asset is displaying topsy-turvy moves in a range of 23.45-24.30 for the past two weeks.
- Advancing 200-EMA indicates that the upside trend is still solid.
Silver price (XAG/USD) is failing to sustain above the round-level resistance of $24.00. The white metal is expected to remain sideways as trading activity will remain quiet amid the festive mood. The US Dollar Index (DXY) dropped sharply on Friday after a consolidation breakdown of the 103.47-104.57 range.
S&P500 remained choppy on Friday but ended the last trading session of CY2023 with a mild sell-off. The 10-year US Treasury yields benefitted from caution in the global market and climbed to 3.88%.
On a four-hour scale, the Silver price is displaying a volatility contraction chart pattern that displays lackluster performance but a breakout of the same results in heavy volume and wider ticks. The asset is displaying topsy-turvy moves in a range of 23.45-24.30 for the past two weeks.
Meanwhile, the 50-period Exponential Moving Average (EMA) at $23.77 is overlapping with the Silver price, which indicates a consolidation on a short-term basis.
While, the 200-period EMA at $22.75 is aiming higher, which indicates that the upside trend is still solid.
The Relative Strength Index (RSI) (14) is oscillating in a 40.00-60.00 range, which indicates directionless movement as investors await fresh impetus for a decisive move.
For an upside, the Silver price needs to surpass December 21 high at $24.30, which will be a breakout of the volatility contraction and will drive the asset towards April 22 high at $24.67 followed by the psychological resistance at $25.00.
On the flip side, a break below December 16 low at $22.56 will drag the asset toward November 15 high at $22.25. A slippage below the latter will expose the asset for more downside toward November 24 high at $21.68.
Silver four-hour chart
-638082208684837338.png)
-
01:21
EUR/USD portrays tepid start to 2023 after a volatile year, ECB vs. Fed talks, US NFP eyed
- EUR/USD remains defensive at the highest levels in 12 days, struggles to extend two-day uptrend.
- Hawkish comments from ECB’s Lagarde contrast with German FinMin’s expectations and probe bulls.
- Holidays in multiple markets, festive mood also restrict EUR/USD moves.
- German PMIs for December eyed for intraday moves, major attention is on the FOMC Minutes, US FOMC and German inflation.
EUR/USD treads water around the 1.0700 threshold amid holidays in the global markets during early Monday. In doing so, the major currency pair struggles to justify hawkish comments from European Central Bank (ECB) President Christine Lagarde around the three-week high while struggling to extend the previous two-day uptrend.
That said, ECB’s Lagarde signaled that the bloc’s central bank must stop quick wage growth from fuelling inflation during her interview with a Croatian newspaper on Saturday, reported Reuters.
Following that, comments from Germany's Finance Minister (FinMin) Christian Lindner seemed to have challenged the EUR/USD bulls as he expects, per Reuters, that inflation in Europe's biggest economy to drop to 7% this year and to continue falling in 2024 and beyond, but believes high energy prices will become the new normal.
It’s worth noting that downbeat prints of the US data and the year-end consolidation dragged the US Dollar Index (DXY) to refresh a seven-month low the previous day. That said, Chicago Purchasing Managers’ Index crossed the market consensus of 41.2 and the 37.2 previous readings to print the 44.9 figures for December. Even so, the activity gauge signaled contraction for the fourth consecutive month.
It should be observed that the DXY printed the biggest yearly gains since 2015 but the EUR/USD pair could only ended up posting the second Year-on-Year loss as concerns surrounding the ECB appear more hawkish vis-à-vis the US Federal Reserve.
As a result, Wednesday’s Minutes of the latest Federal Open Market Committee (FOMC) meeting, as well as Friday’s December month employment numbers for the US, will be crucial for the pair traders to watch. Also important will be today’s final readings of Germany’s S&P Global/BME Manufacturing PMI for December, expected to confirm 47.4 initial readings, as well as the first prints of Germany’s key inflation gauge for December, namely Harmonized Index of Consumer Prices, likely to rise by 11.8% YoY versus 11.3% prior.
Given the likely firmer prints of German economics, the EUR/USD bulls are expected to keep the reins unless Fed surprises the markets with hawkish Minutes and/or US Nonfarm Payrolls (NFP) arrive in strong.
Technical analysis
Overbought RSI conditions probe EUR/USD bulls around the seven-month-high surrounding 1.0735. The pullback moves, however, remain elusive beyond the previous resistance line from May 2021, close to 1.0520 at the latest.
-
01:10
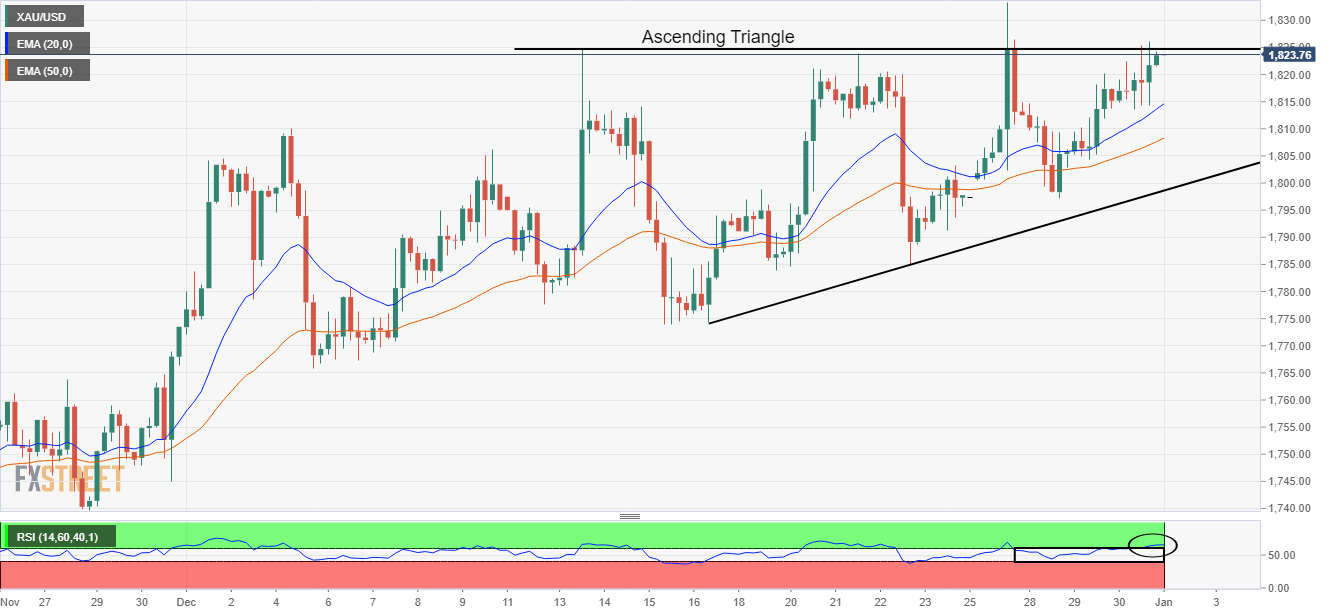
Gold Price Forecast: XAU/USD struggles to extend above $1,820 decisively ahead of US ISM data
- Gold price is facing pressure in surpassing the immediate hurdle of $1,823.00.
- Less trading activity is expected ahead amid the festive mood in the global market.
- Going forward, investors will keep an eye on US ISM Manufacturing PMI data.
Gold price (XAU/USD) is struggling to extend its upside journey above the immediate resistance of $1,823.00. The precious metal is expected to remain lackluster amid the festive mood for New Year celebrations, therefore, trading activity will remain quiet in various nations.
The US Dollar Index (DXY) settled the last trading session on a weak note after delivering a south-side break of the consolidation formed in a 103.47-104.57 range. The USD Index dropped to near the round-level support of 103.00. Meanwhile, S&P500 witnessed some sell-off on Friday as investors turned cautious for the CY2023 outlook, portraying ambiguity in the risk impulse.
Going forward, investors will focus on the United States ISM Manufacturing PMI data (Dec), which will release on Wednesday. As per the consensus, the ISM Manufacturing data will escalate to 49.6 vs. the former release of 49.0. Apart from that, investors will keep New Orders Index on the radar, which might climb to 48.1 against the prior release of 47.2. A decent improvement in demand anticipants may also support the US Dollar Index.
Gold technical analysis
Gold price is auctioning in an Ascending Triangle chart pattern on a four-hour scale. The horizontal resistance of the aforementioned chart pattern is placed from December 13 high at $1,824.55 while the upward-sloping trendline is plotted from December 16 low at $1,774.36.
Advancing 20-and 50-period Exponential Moving Averages (EMAs) at $1,814.77 and $1,807.43 respectively add to the upside filters.
Meanwhile, the Relative Strength Index (RSI) (14) has shifted into the bullish range of 60.00-80.00 from the 40.00-60.00 range, which indicates more upside ahead.
Gold four-hour chart
-
00:42
AUD/USD Price Analysis: Bulls retreat from 0.6825-20 hurdle
- AUD/USD pares intraday losses at the highest levels in 12 days.
- Sluggish RSI, MACD signals also favor pullback moves targeting previous resistance from mid-December.
- 200-SMA adds to the downside filters, bulls need validation from previous monthly high to keep the reins.
AUD/USD retreats from the short-term key resistance during Monday’s Asian session as bulls take a breather after a three-day uptrend. In doing so, the Aussie pair steps back from a three-week-old horizontal resistance amid nearly overbought RSI and sluggish MACD signals.
It’s worth noting, however, that the previous week’s successful upside break of a descending trend line from November 13, close to 0.6780 by the press time, keeps the AUD/USD buyers hopeful.
Even if the quote breaks the 0.6780 support, the 200-HMA level surrounding 0.6725 acts as the last defense of the AUD/USD buyers before giving control to the Aussie pair sellers.
In that case, the Aussie pair bears could quickly aim for the previous monthly low near 0.6690.
On the contrary, a successful upside break of the three-week-old horizontal resistance area surrounding 0.6820-25 could propel the pair towards the previous monthly high surrounding 0.6895.
Following that, the pair’s successful trading beyond the 0.6900 round figure, as well as September’s high near 0.6920, becomes necessary for the AUD/USD bulls to aim for an August 2022 high of around 0.7135.
Overall, AUD/USD remains on the buyer’s radar but the upside room appears limited.
AUD/USD: Hourly chart
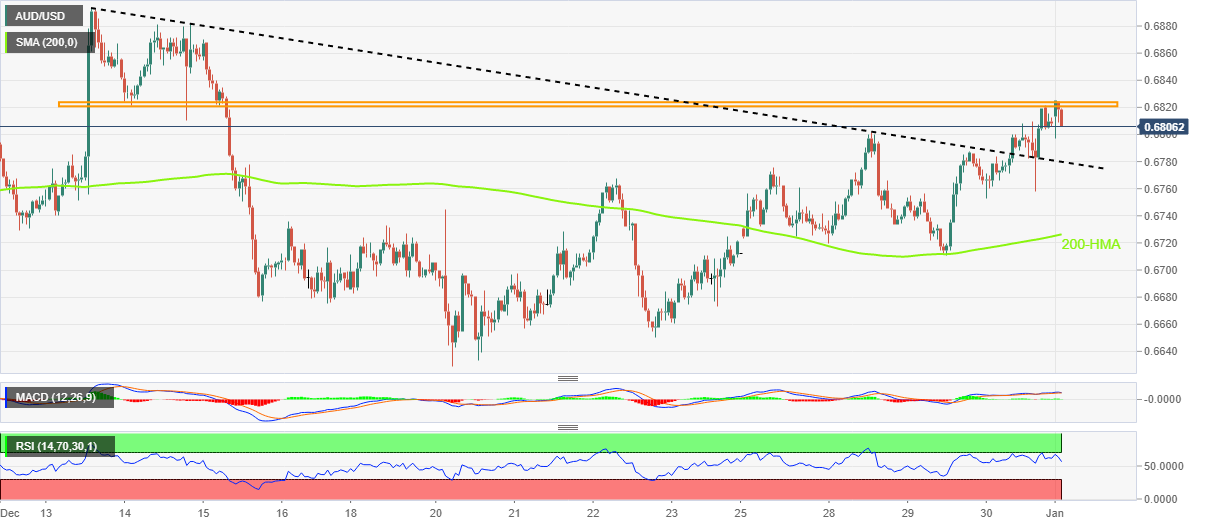
Trend: Pullback expected
-
00:31
WTI sees auction above $81.00 as Russia’s ban on crude sale triggers supply worries
- Oil price is likely to climb above $81.00 as China’s reopening measures secure firmer long-term demand.
- An announcement of an oil supply ban from Russia has triggered supply worries.
- The IMF sees the pain in CY2023 led by declining manufacturing activities in the United States, China, and Europe.
West Texas Intermediate (WTI), futures on NYMEX, settled the last trading session of CY2023 on a solid note. The oil prices climbed above $80.00 after sensing firmer demand on every dip, which bolstered the expression of more upside in the near future. The black gold is gaining attention as escalated supply worries led by the oil supply cease from Moscow have triggered the risk of equilibrium in the demand-supply mechanism ahead.
The threat of an oil supply ban from Russian President Vladimir Putin after an announcement of a price cap by G7 countries and the European Union triggered supply worries. Russian oil attracted a price cap as Western nations want less funding for augmenting the requirement of arms and ammunition to continue the war against Ukraine.
Also, optimism for oil demand in China is regaining track as a spike in Covid-19 cases is a short-term pain, which won’t sustain for a longer period. The Chinese administration is reopening the economy by dismantling lockdown measures at a sheer pace as it aims for a rebound in the extent of economic activities. The move is supporting upside bias for the oil price.
The latest commentary from International Monetary Fund (IMF) on global demand could pause oil’s upside journey. Managing Director Kristalina Georgieva of the IMF cited on the CBS Sunday morning news program that “For much of the global economy, 2023 is going to be a tough year as the main engines of global growth - the United States, Europe, and China – all may experience weakening activity,”.
-
00:31
South Korea S&P Global Manufacturing PMI below expectations (51) in December: Actual (48.2)
-
00:30
Stocks. Daily history for Friday, December 30, 2022
Index Change, points Closed Change, % NIKKEI 225 0.83 26094.5 0 Hang Seng 40.27 19781.41 0.2 ASX 200 18.6 7038.7 0.26 FTSE 100 -61 7451.7 -0.81 DAX -148.13 13923.59 -1.05 CAC 40 -99.71 6473.76 -1.52 Dow Jones -73.55 33147.25 -0.22 S&P 500 -9.78 3839.5 -0.25 NASDAQ Composite -11.61 10466.48 -0.11 -
00:19
USD/JPY bears flirt with 131.00 on hawkish BOJ concerns, Fed Minutes, US NFP in focus
- USD/JPY remains depressed near the multiday low even as market’s inaction probes bears.
- Chatters surrounding BOJ’s upward revision to inflation forecasts favor bears.
- US Dollar begins 2023 on a back foot after posting the biggest yearly gains since 2015.
USD/JPY licks its wounds near 131.00 as bears try to keep the reins during Monday’s sluggish session, mainly due to the New Year holidays in multiple markets including Japan. Even so, the Yen pair stays pressured at the lowest levels since August 2022, poked in the last month, amid hawkish concerns surrounding the Bank of Japan (BOJ).
Late on Friday, Nikkei Asia quotes anonymous sources to mention that the BOJ is considering raising its inflation forecasts in January to show price growth close to its 2% target in fiscal 2023 and 2024. “The proposed changes would show the core consumer price index rising around 3% in fiscal 2022, between 1.6% and 2% in fiscal 2023, and nearly 2% in fiscal 2024,” added the news.
Given the hopes of a strong BOJ inflation forecast, coupled with the latest tweak in the Yield Curve Control (YCC) policy, not to forget the Japanese central bank’s multiple market interventions in the last few days, the USD/JPY bears have more to cheer.
On the other hand, downbeat US data and an absence of Fedspeak weighed on the US Dollar Index (DXY). That said, Chicago Purchasing Managers’ Index crossed the market consensus of 41.2 and the 37.2 previous readings to print the 44.9 figures for December. Even so, the activity gauge signaled contraction for the fourth consecutive month. It should be noted that the year-end consolidation also exerted downside pressure on the DXY amid the sluggish sessions.
Against this backdrop, Wall Street closed with losses while the US 10-year Treasury bond yields rose 4.5 basis points (bps) to 3.879%, which in turn tried to challenge the USD/JPY bears, but could not.
Moving on, a lack of major data/events and the New Year holidays may restrict the USD/JPY pair’s intraday moves. However, Wednesday’s Minutes of the latest Federal Open Market Committee (FOMC) meeting, as well as Friday’s December month employment numbers for the US, will be crucial for the pair traders to watch as the bears seem running out of steam late, mainly due to the BOJ policymakers’ defense of the easy-money policies.
Technical analysis
Unless crossing a downward-sloping resistance line from late October, around 133.55 by the press time, the USD/JPY pair is likely to remain on the bear’s radar.
-
00:15
Currencies. Daily history for Friday, December 30, 2022
Pare Closed Change, % AUDUSD 0.68114 0.62 EURJPY 140.364 -0.97 EURUSD 1.07072 0.43 GBPJPY 158.44 -1.13 GBPUSD 1.20874 0.3 NZDUSD 0.63497 0.1 USDCAD 1.35304 -0.13 USDCHF 0.92417 0.21 USDJPY 131.074 -1.43 -