Notícias do Mercado
-
23:50
Japan Foreign Investment in Japan Stocks climbed from previous ¥-667.1B to ¥-265.1B in December 23
-
23:50
Japan Foreign Bond Investment rose from previous ¥-941.8B to ¥-459.5B in December 23
-
23:41
GBP/USD continues to auction below 1.2000 as risk-off mood heats, US ISM PMI in focus
- GBP/USD is continuously trading below 1.2000 amid caution in risk profile ahead of US Manufacturing data.
- The USD Index climbed to near two-week high around 104.40 after a solid recovery from 103.00.
- UK’s corporate debt has declined sharply amid aggressive policy tightening by the BoE.
The GBP/USD pair has shifted its business below the psychological support of 1.2000 in the early Asian session. The Cable has failed in taking control above 1.2000 amid a risk-off market mood. A significant drop in investors’ risk appetite ahead of the United States ISM Manufacturing PMI data and the Federal Reserve (Fed)’s minutes for December monetary policy has strengthened the US Dollar.
S&P500 continued its downside journey on Tuesday, portraying that the risk-aversion theme has been underpinned by the market participants. The US Dollar Index (DXY) climbed to near two-week high of around 104.40 after a solid recovery from 103.00.
Investors are worried that the Federal Reserve (Fed) might need to resort to more policy tightening to contain the stubborn inflation. A note from Bill Dudley, an analyst at Bloomberg, cited three focus areas for the Fed in CY2023. The first one is the tight labor market and lower Unemployment Rate that is propelling wage inflation. Second is underinvestment in the oil and gas sector as Russia could weaponize its hold on major oil supply, which could trigger inflation further. And, the third one is the budget deficit performance which is likely to be around 5% of the Gross Domestic Product (GDP) in 2023.
Meanwhile, investors are awaiting the release of the US ISM Manufacturing PMI for further cues, which is seen lower at 48.5 vs. the former release of 49.0. While the New Orders Index data is seen higher at 48.1 against 47.2 in the prior release.
On the United Kingdom front, falling appetite for corporate debt is raising red flags for economic prospects. According to a quarterly Deloitte CFP survey, 70% of UK CFOs have termed credit as ‘costly’ amid the most aggressive tightening policy by the Bank of England (BoE) in more than 30 years, as reported by Reuters. Meanwhile, the UK administration has removed the requirement of compulsory Covid tests for arrivals from China.
-
23:05
NZD/USD Price Analysis: Aims to refresh monthly low below 0.6200
- Risk-off profile ahead of FOMC minutes and US ISM PMI has strengthened the US Dollar.
- A shift in the auction profile below the 200-EMA has weakened the New Zealand Dollar.
- The RSI (14) has dropped firmly inside the bearish range, which indicates more weakness ahead.
The NZD/USD pair is oscillating below the critical hurdle of 0.6250 in the early Asian session. The Kiwi asset rebounded firmly after refreshing a monthly low at 0.6200 amid the risk aversion theme. Investors preferred to deploy their funds into safe-haven to dodge volatility ahead of United States ISM Manufacturing PMI and Federal Open Market Committee (FOMC) minutes.
The US Dollar Index displayed a firmer recovery after testing a 15-day low around 103.10 with less selling pressure, which pushed the asset above 104.30.
NZD/USD is auctioning below the 200-period Exponential Moving Average (EMA) at 0.6259. The Kiwi asset is hovering around its crucial resistance of 0.6248 after a recovery move, however, the downside bias is still solid.
The 20-and 50-EMAs have also delivered a bear cross at 0.6315, which strengthens the downside bias in the further auction.
Also, the Relative Strength Index (RSI) (14) has slipped sharply into the bearish range of 20.00-40.00, which indicates that the downside momentum is active now.
Should the Kiwi asset breaks below the round-level support of 0.6200, the US Dollar will get stronger and will drag the major below November 28 low at 0.6155 followed by November 28 low at 0.6087.
Alternatively, a recovery move above December 30 high at 0.6373 will drive the kiwi asst towards December 19 high at 0.6409. In case, the New Zealand Dollar pushes the asset above the latter, the major will march towards December 15 high at 0.6500.
NZD/USD four-hour chart
-638083838848252715.png)
-
23:03
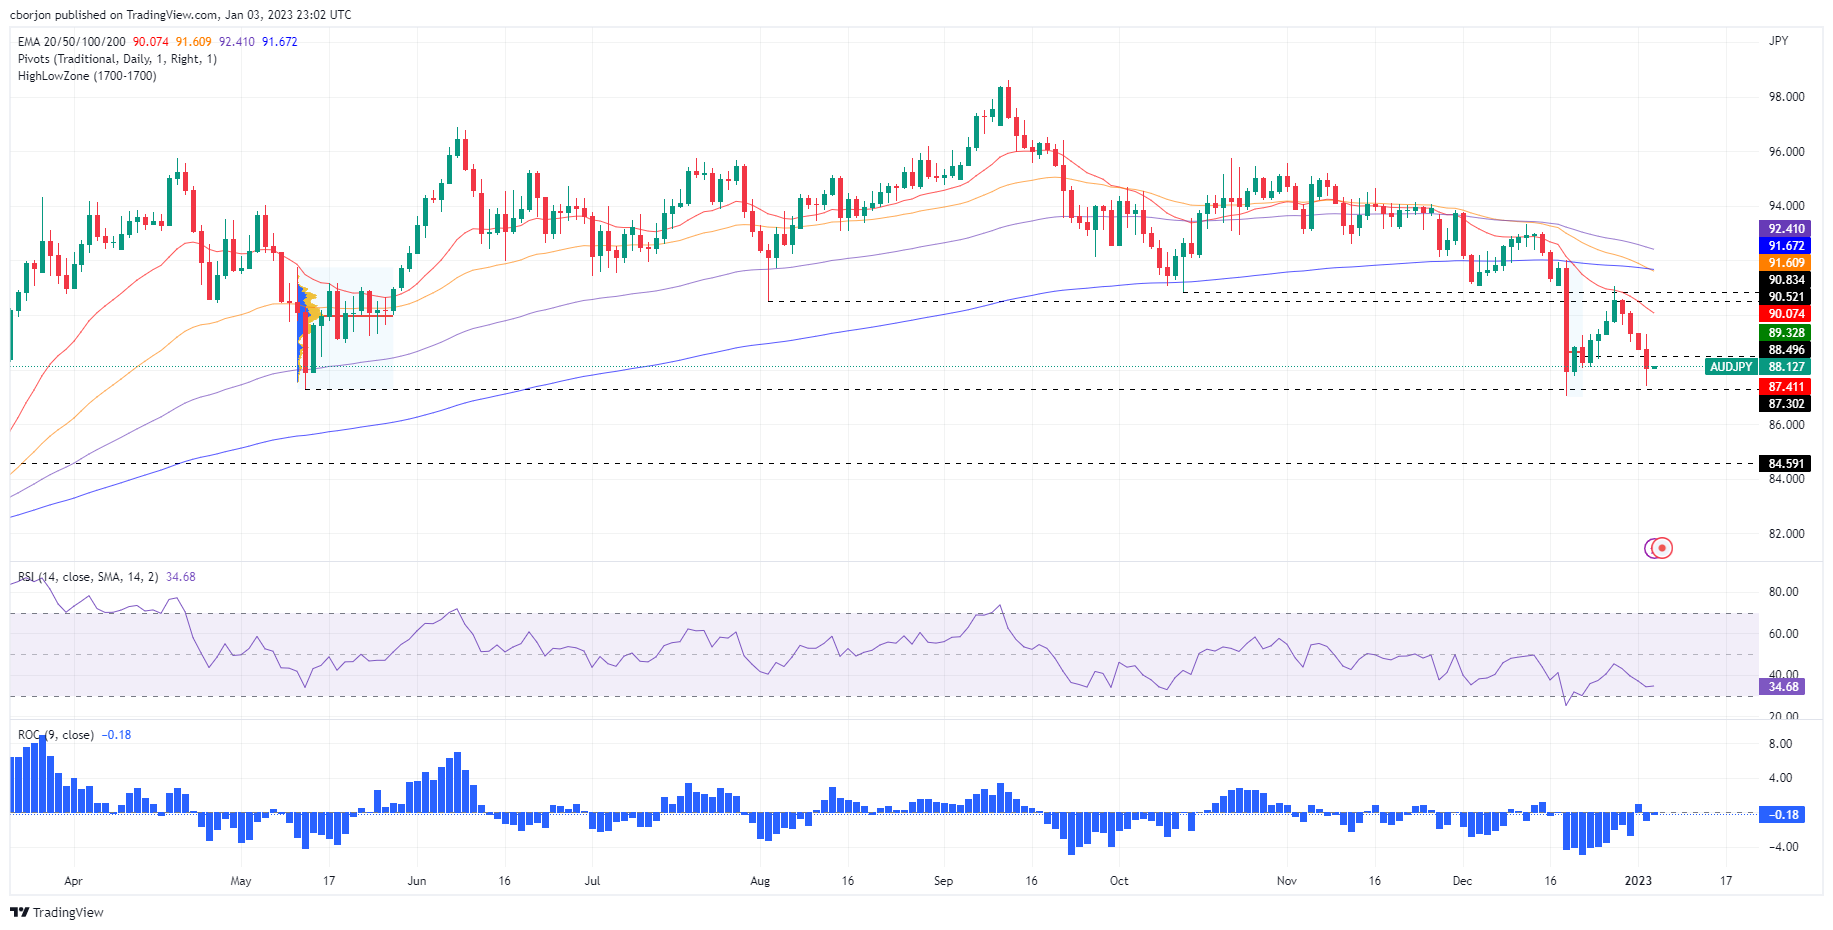
AUD/JPY Price Analysis: Hovers around 88.00 after hitting weekly lows of 87.40s
- Dampened sentiment kept the AUD/JPY trading in negative territory.
- AUD/JPY Price Analysis: Double bottom could be forming in the daily chart, targeting the 100-DMA around 92.41.
On Tuesday, the AUD/JPY reached a fresh two-week low around 87.41, though it finished the session around 88.07, extending its losses to four consecutive days after testing the 20-day Exponential Moving Average (EMA) around 90.92 on December 28. As Wednesday’s Asian session begins, the AUD/JPY is trading at 88.12.
AUD/JPY Price Analysis: Technical outlook
The AUD/JPY daily chart suggests the cross-currency as neutral-to-downward biased, though it should be said that a double bottom surfaced at around the 87.00 mark. The Relative Strength Index (RSI) remains in bearish territory but its slope shifted flat, while the Rate of Change (RoC) shows that selling pressure is waning.
If the AUD/JPY climbs above the 20-day EMA at 90.07 and clears the December 28 daily high at 91.05, the double bottom would be confirmed. Therefore, the AUD/JPY’s next resistance would be the confluence of the 50 and 200-day EMA around 91.60, followed by the 92.00 figure, ahead of the 100-day EMA at 92.41.
As an alternate scenario, the AUD/JPY first support would be the 88.00 mark. Break below will expose December’s low around 87.01, followed by March’s 15 swing low of 84.59.
AUD/JPY Key Technical Levels
-
22:38
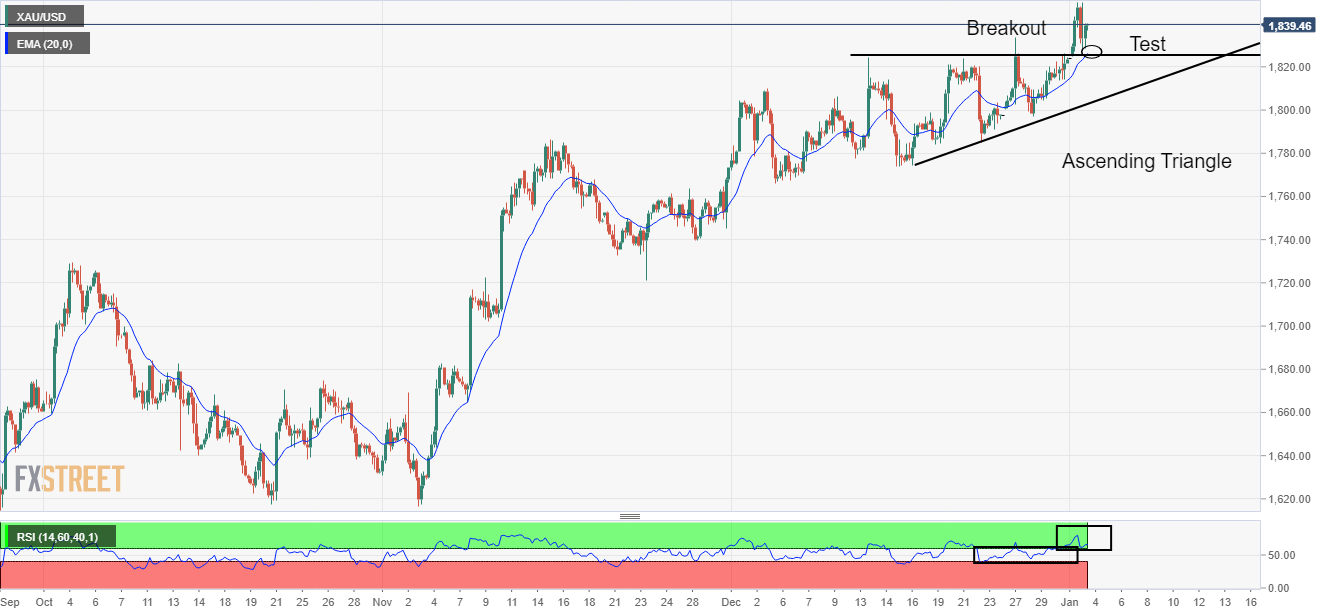
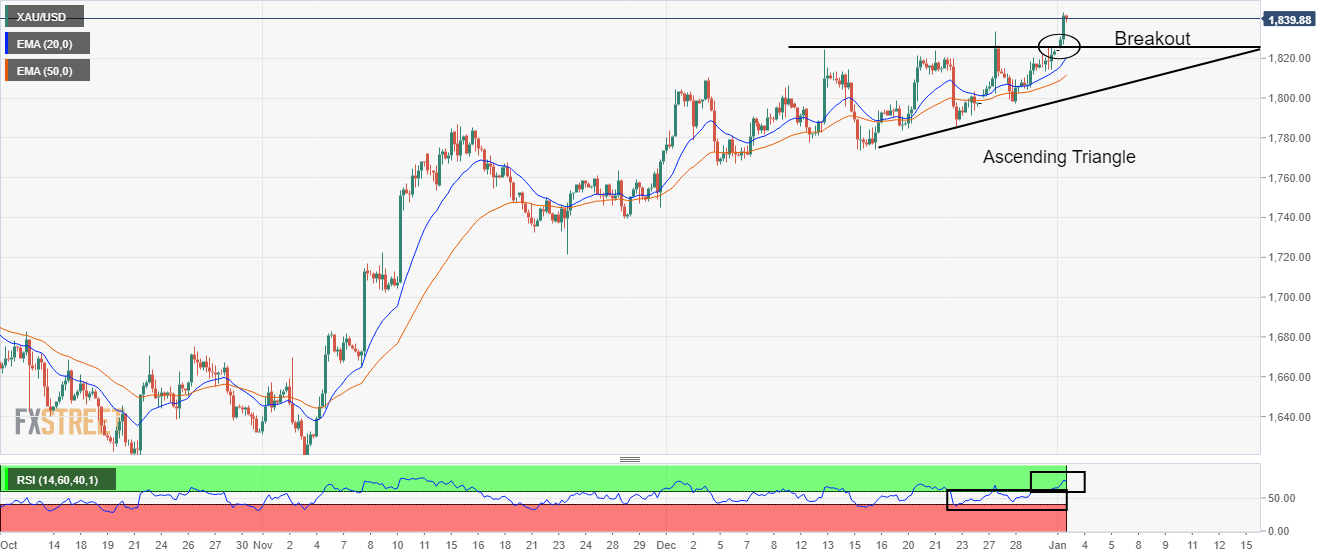
Gold Price Forecast: XAU/USD shows volatility contraction near $1,840, FOMC minutes eyed
- Gold price has dropped to test the breakout from the Ascending Triangle around $1,825.00.
- Expectations of a higher interest rate peak by the Fed have triggered a risk-off market mood.
- The USD Index has climbed above 104.30 amid bumper consensus for December’s NFP data.
Gold price (XAU/USD) has shifted into a sideways auction profile after recovery from the crucial support around $1,828.00 in the late New York session. Earlier, the precious metal slipped sharply after failing to kiss the critical resistance of $1,850.00. The yellow metal is displaying a volatility contraction ahead of the release of the Federal Open Market Committee (FOMC) minutes.
Risk-perceived assets like S&P500 witnessed heat on Tuesday as investors are expecting a hawkish policy outlook from the FOMC minutes, which will release on Thursday. As the inflation rate is still stubborn and the labor market is extremely tight, the Federal Reserve could look for more interest rate hikes to compensate for a healthy Consumer Price Index (CPI). The 10-year US Treasury yields dropped to 3.75% despite a risk aversion theme in the global market.
The US Dollar Index (DXY) climbed above 104.30 after defending the downside bias below the major support of 103.00. The USD Index is gaining strength in anticipation of higher employment generation by the United States economy in the month of December. Analysts at TD Securities are anticipating a very solid net gain in December at 350k.
Gold technical analysis
After a breakout of the Ascending Triangle chart pattern, Gold price has reversed to test the breakout region near the horizontal resistance of the chart pattern placed from December 13 high around $1,825.55. The 20-period Exponential Moving Average (EMA) around $1,825.00 is acting as major support for the Gold price.
The Relative Strength Index (RSI) (14) has shifted into the bullish range of 60.00-80.00 from the 40.00-60.00 range, which indicates more upside ahead.
Gold four-hour chart
-
22:23
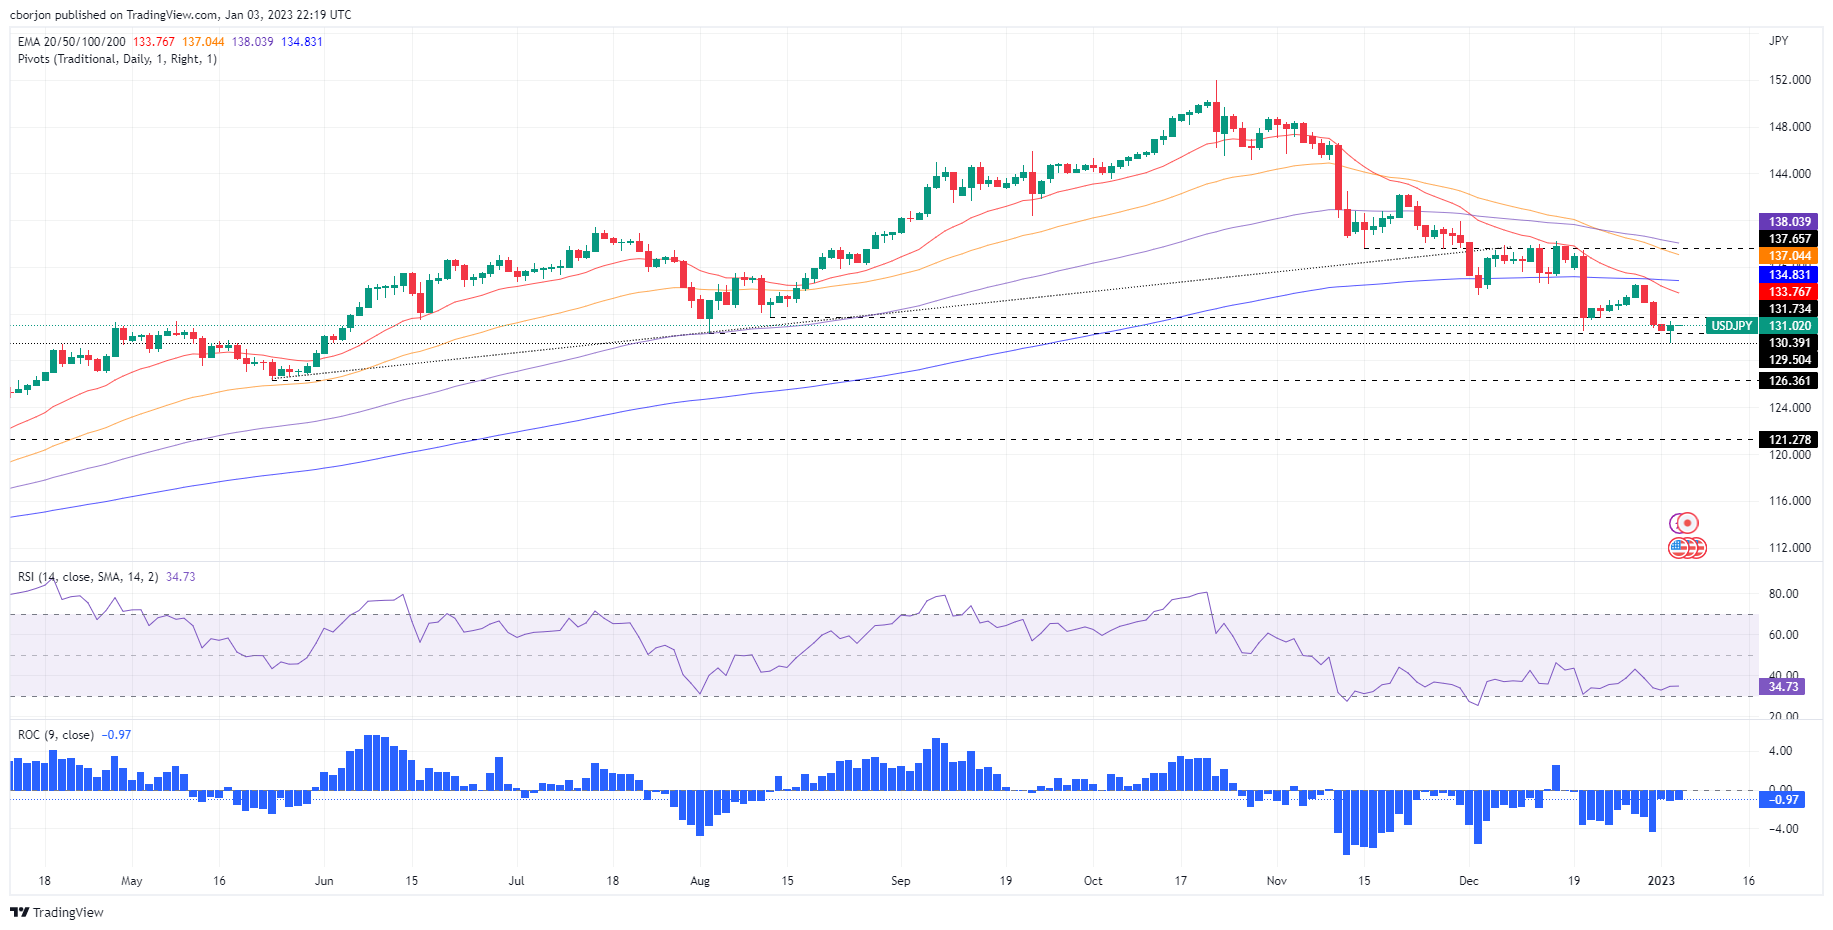
USD/JPY Price Analysis: Erases Monday’s losses, reclaims 131.00 on US Dollar strength
- The USD/JPY reached a six-month low at 129.50 but recovered some ground, albeit US Treasury yields fell.
- USD/JPY Price Analysis: Downward biased, but short term might test the 20-day EMA around 133.76.
The USD/JPY climbs sharply after dropping to eight-month low levels, last seen in June 2021 around 129.50, at around 130.90s, as the US Dollar (USD) emerges as the strongest currency in Tuesday trading. Therefore, the USD/JPY is trading at 131.01, above its opening price by 0.25%.
USD/JPY Price Analysis: Technical outlook
On Tuesday, the USD/JPY daily chart portrays the pair as downward biased. However, Tuesday’s price action formed a hammer preceded by a downtrend, suggesting that buyers outpaced sellers, suggesting that the USD/JPY might print a leg-up before continuing its downtrend. The bias would remain intact as long as the USD/JPY stays below the 20-day Exponential Moving Average (EMA) at 133.76. Otherwise, it would pave the way for a test of the 200-day EMA at 134.83, which, once cleared, could send the USD/JPY rallying to the 50-day EMA at 137.04
Oscillators like the Relative Strength Index (RSI) remain in bearish territory, while the Rate of Change (RoC) displays selling pressure waning.
Therefore, the USD/JPY first resistance would be the 132.00 mark. A breach of the latter would expose the December 30 daily high of 133.09, followed by the 20-day EMA at 133.76..
USD/JPY Key Technical Levels
-
22:08
USD/CAD juggles below 1.3700, upside seems favored ahead of US ISM PMI
- USD/CAD is expected to recapture 1.3700 amid risk-off market impulse.
- S&P500 faced pressure as investors turned risk-averse ahead of FOMC minutes.
- Higher interest rates by the Fed might be responsible for the lower consensus of the US ISM PMI.
The USD/CAD pair is displaying back-and-forth moves in a narrow range below the round-level resistance of 1.3600 in the early Asian session. The Loonie asset is expected to extend its upside journey by surpassing the immediate hurdle of 1.3680 amid caution in the global market.
S&P500 witnessed selling pressure as investors turned risk-averse ahead of the minutes of December’s Federal Open Market Committee (FOMC) meeting. The US Dollar Index (DXY) delivered a recovery move after remaining volatile and jumped above 104.30. Investors remained gung-ho over the USD Index on expectations of a hawkish policy outlook for CY2023 by the Federal Reserve (Fed).
Fed chair Jerome Powell cited in the last monetary policy meeting of CY2022 that the central bank will not shy from hiking interest rates if it feels the inability to tame the stubborn inflation.
But before the FOMC minutes, investors will keep an eye on the United States ISM Manufacturing PMI (Dec) data, which will release on Wednesday. According to the estimates, the economic data will drop to 48.5 vs. the former release of 49.0. The consequences of higher interest rates by the Fed have resulted in a lower volume of manufacturing activities as firms have postponed their expansion plans. Apart from that, New Orders Index data will hog the limelight, which is seen higher at 48.1 vs. the former release of 47.2.
On the Lonnie front, investors are keenly waiting for Friday’s employment data. As per the consensus, the Canadian economy has generated fresh 8K payrolls in December vs. the former release of 10.1K. The Unemployment Rate is seen higher at 5.2% against 5.1% recorded earlier.
-
21:00
South Korea FX Reserves came in at 423.16B, above expectations (406.48B) in December
-
20:36
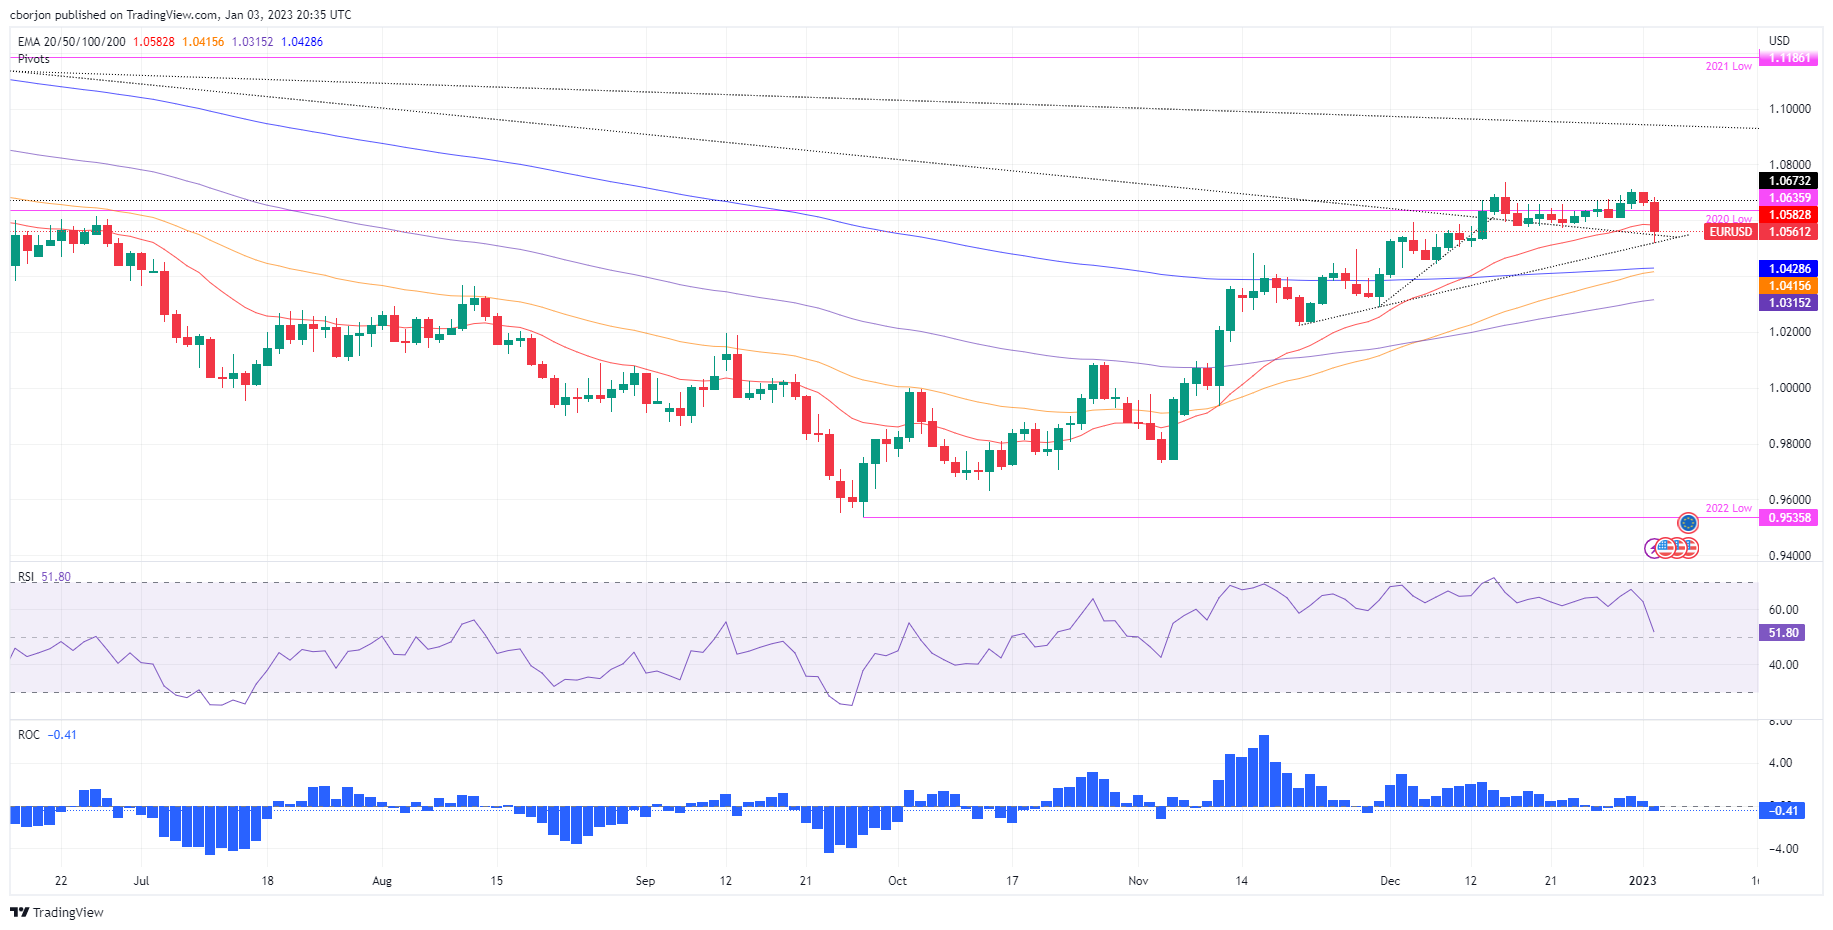
EUR/USD wobbles below 1.0600 on USD strength as traders eye Fed minutes
- US Dollar remains bid even though data showed Manufacturing PMI continues to decelerate.
- The Euro extends its losses spurred by Germany’s inflation edging down.
- The US Dollar Index recovered and reached fresh two-week highs, albeit US Treasury yields dropped.
- EUR/USD Price Analysis: Neutral biased, likely to find direction on fundamental news.
The Euro (EUR) plunges against the US Dollar (USD) during the North American session after hitting a daily high of 1.0683, but it has trimmed some of its earlier losses after reaching a six-week low at around 1.0519. Data released in the United States (US) and the Euro area (EU) showed factory activity weakening on both sides of the pond, though the US Dollar is emerging with the upper hand. Hence, the EUR/USD is trading at 1.0558 below its opening price by 0.99%.
US PMI stayed in recessionary reading, ignored by the USD bulls
Wall Street has extended its losses portraying a dampened sentiment. S&P Global revealed that Manufacturing PMI for December in the US was unchanged at 46.2, remaining in contractionary territory. Although data was negative for the US Dollar, the EUR/USD continued to remain in negative territory.
Siân Jones, Senior Economist at S&P Global Market Intelligence, said, “The manufacturing sector posted a weak performance as 2022 was brought to a close, as output and new orders contracted at sharper rates. Demand for goods dwindled as domestic orders and export sales dropped. Muted demand conditions also led to downward adjustments of stock holdings.”
Germany’s inflation slowed, weakening the Euro
In the Eurozone, its economic calendar witnessed the release of mixed S&P Global Manufacturing PMIs for December, which traders mainly ignored. On Tuesday, inflation in Germany for December, as measured by the Consumer Price Index (CPI), decelerated to 8.6% YoY vs. November’s 10% figure and beneath 9% estimates. Concerning the monthly reading, CPI dropped 0.8%.
Meanwhile, the Harmonised Index of Consumer Prices (HICP), the European Central Bank’s (ECB) preferred gauge of inflation, edged lower to 9.6% YoY, from 11.3%, compared to analysts’ estimate of 10.7%.
US Dollar remains strong, albeit US Treasury yields dropped
Elsewhere, the US Dollar Index (DXY), which measures the US Dollar value against a basket of six currencies, climbs close to 1%, at 104.522, and is weighing on the EUR/USD’s fall. Contrarily, the US 10-year Treasury bond yield remains down in the day, trimming its earlier losses, slightly down four bps, at 3.792%, stalling the US Dollar rally.
Ahead of the week, the US economic calendar will feature the ISM Manufacturing PMI for December alongside the US Federal Reserve (Fed) last meeting minutes. On the EU side, the docket will feature S&P Global Services and Composite PMIs for December.
EUR/USD Technical Analysis
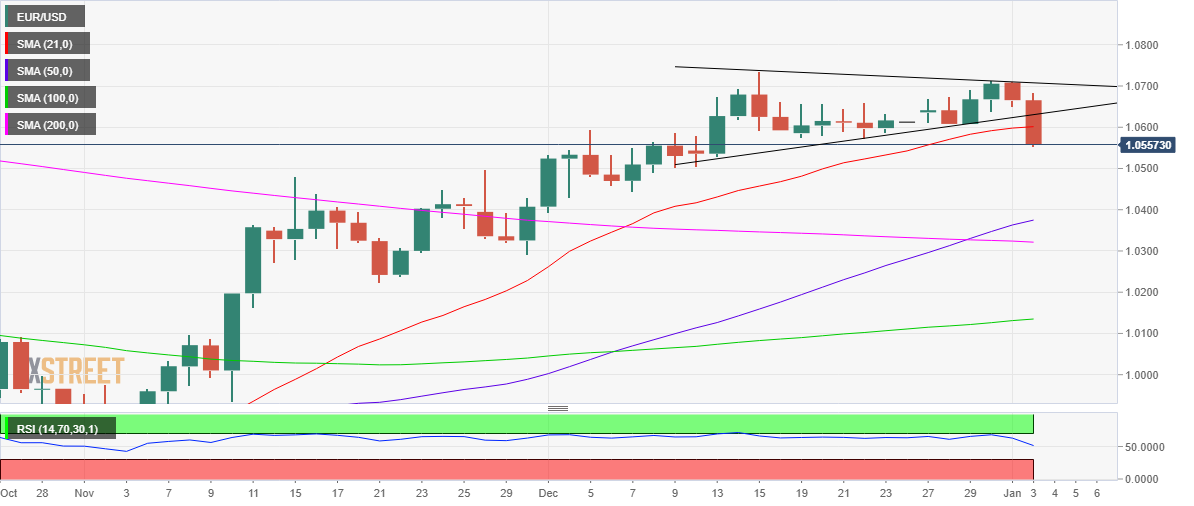
From a daily chart perspective, the EUR/USD pair shifted to a neutral biased after dropping below the 20-day Exponential Moving Average (EMA) at 1.0582. However, the intersection of two trendlines, nearby Tuesday’s daily low of 1.0519, capped the Euro’s fall, which recovered to the 1.0550s area. Nevertheless, surpassing the 20-day EMA would be difficult, and with fundamental news lurking on Wednesday’s docket, the EUR/USD might seesaw in the near term.
The EUR/USD key resistance levels are 1.0600, followed by the 2020 yearly low of 1.0636 and 1.0700. On the flip side, the EUR/USD first support would be 1.0519, followed by the 1.0500 mark. Break below will expose the 200-day EMA at 1.0428.
-
20:09
Forex Today: US Dollar to keep strengthening ahead of FOMC Minutes
What you need to take care of on Wednesday, January 4:
The US Dollar returned with a vengeance on Tuesday and soared against all of its major rivals. The greenback started the day on the back foot, but gained ground early in the European session, triggering stops and further accelerating its advance.
Financial markets were optimistic at the beginning of the day, with Asian shares up amid signs coronavirus infections may have peaked in China. Hopes the country will soon reverse the latest economic downturn faded, as the session developed, with Asian indexes ending the day around their opening levels. European and American indexes also advanced, although Wall Street quickly changed course and finished the day in the red.
EU countries reached an agreement on a coordinated approach to the COVID-19 situation, including implications for increased travel from China, according to the EU Health Security Committee Meeting.
On a positive note, Germany released the preliminary estimate of the December Harmonized Index of Consumer Prices (HICP), which rose at an annual pace of 9.6%, well below the 10.7% expected, and easing from 11.3% in November.
EUR/USD trades at around 1.0550, and in the wider perspective the slump seems corrective. The Pound was the most resilient, down to 1.1975 against the greenback. AUD/USD trades around 0.6730, while USD/CAD soared to 1.3680. Finally, USD/JPY ended the day little changed around 130.70 after trading as low as 129.49.
Gold soared to $1,850 and later retreated, ending the day with gains at around $1,836 a troy ounce. Crude oil prices collapsed, with WTI trading at around $76.70 a barrel.
Attention shifts to the US as the country will release the ISM Manufacturing PMI and the FOMC Meeting Minutes on Wednesday.
Ethereum v. Bitcoin battle continues as ETH offers more investment opportunities to traders
Like this article? Help us with some feedback by answering this survey:
Rate this content -
18:25
Australia S&P Global Manufacturing PMI came in at 50.2 below forecasts (50.4) in December
-
18:16
WTI sinks beneath $78.00 on global recession fears, upbeat USD
- Western Texas Intermediate erases last Friday’s gains, tumbles more than 3%.
- Technical factors and China’s Covid-19 crisis increased traders’ worries about diminishing oil demand.
- WTI Price Analysis: A daily close below the 20-DMA to pave the way towards $75.00.
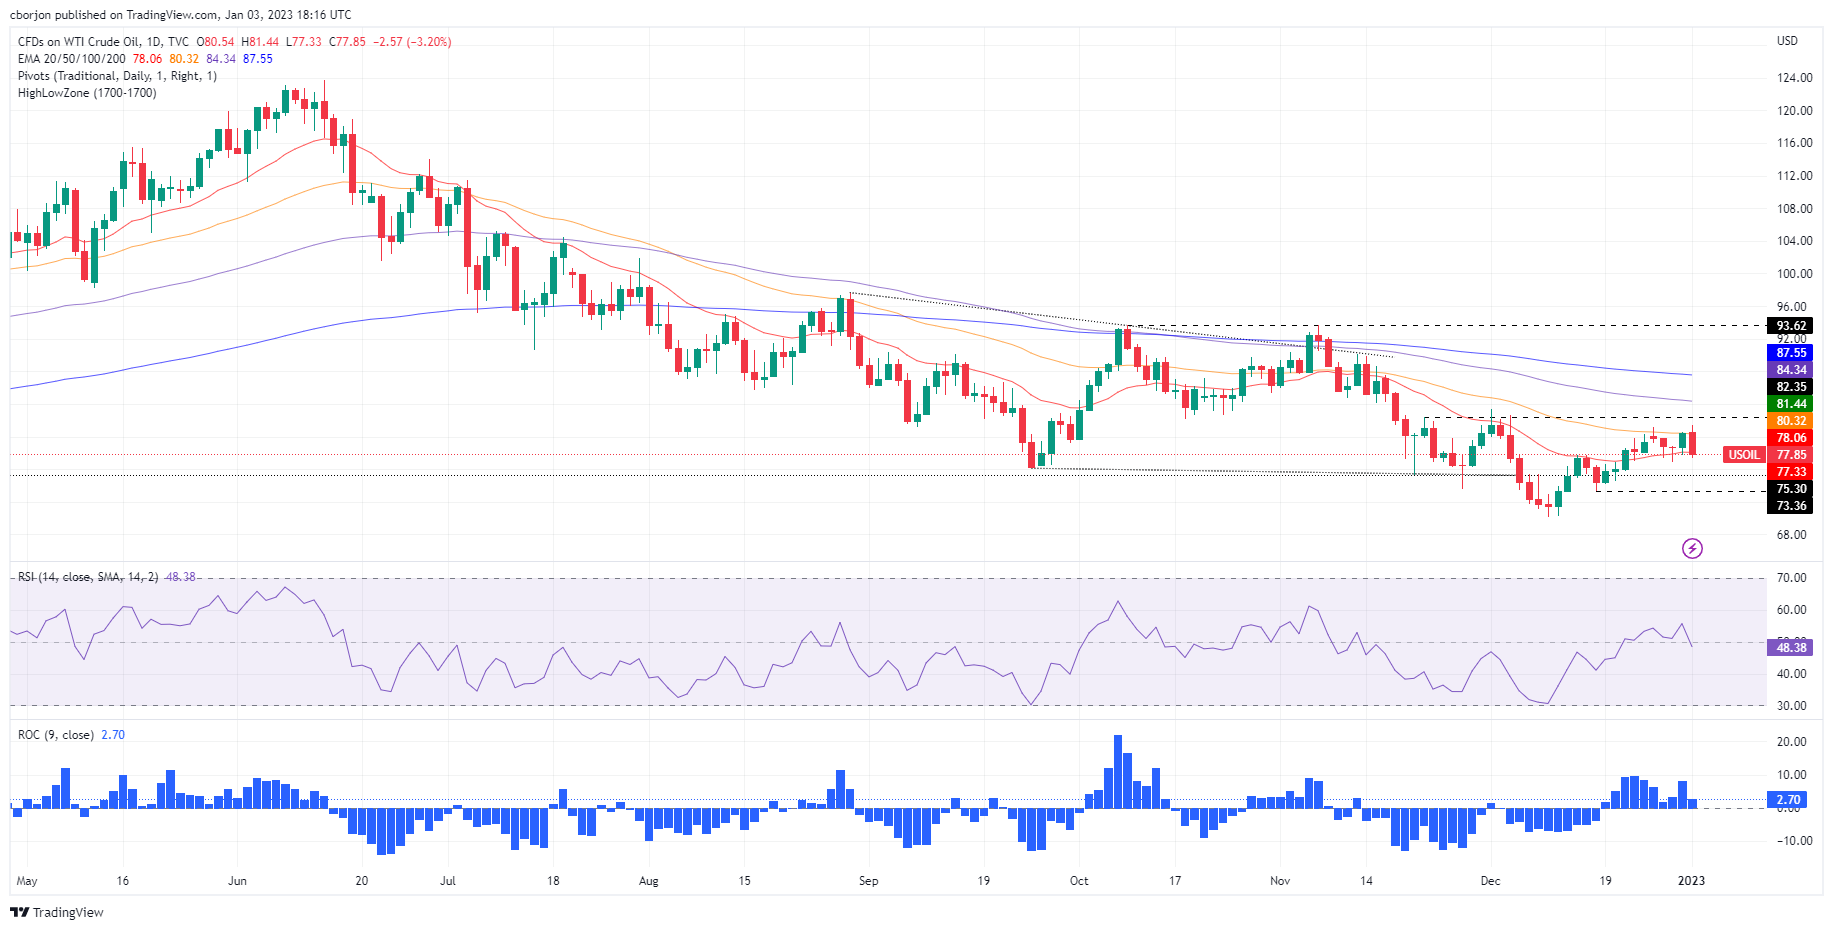
Western Texas Intermediate (WTI), the US crude oil benchmark tanks more than 3% on Tuesday, due to increased concerns of diminishing demand from China, as the country battles spurring Covid-19 cases amidst increasing worries for a worldwide recession. At the time of writing, WTI is trading at $77.78 per barrel, below its opening price, after reaching a high of $81.44.
WTI halted its upward trajectory at the 50-day Exponential Moving Average (EMA) at $80.32 a barrel. An increase of Covid-19 cases in China threatens to dampen demand in the second-largest economy and the world’s leading oil importer.
On Sunday, the International Monetary Fund (IMF) Director Kristalina Georgieva said that the global economy faces “a tough year, tougher than the year we leave behind.” Additional central bank tightening and weaker growth expected by the worldwide economy keep recessionary risk skewed to the upside.
Saxo Bank analysts wrote, “Another volatile year undoubtedly lies ahead with multiple uncertainties still impacting supply and demand. The two biggest that potentially will weigh against each other in the short term remain the prospect for a bumpy recovery in Chinese demand being offset by worries about a global economic slowdown.”
WTI Price Analysis: Technical outlook
From the daily chart perspective, WTI is neutral-to-downward biased. The 50-day EMA, around $80.31, capped the rally, while Tuesday’s price action is witnessing sellers stepping aggressively, dragging WTI’s price below $78.06, leaving the 20-day EMA above. If WTI achieves a daily close below the latter, it will exacerbate a fall toward the December 16 low at 73.36, ahead of the December 9 swing low of $70.10.
-
17:08
AUD/USD stalls at the 200-DMA and drops below 0.6800
- AUD/USD drops below 0.6800 toward the 20-day EMA at 0.6736.
- The US Dollar remains bid, irrespective of falling US bond yields, after the release of weak PMIs.
- Weak Chinese economic data dampened the prospects of the Australian Dollar.
- AUD/USD Price Analysis: Likely to remain range-bound in the 0.66/0.68 200 pip range.
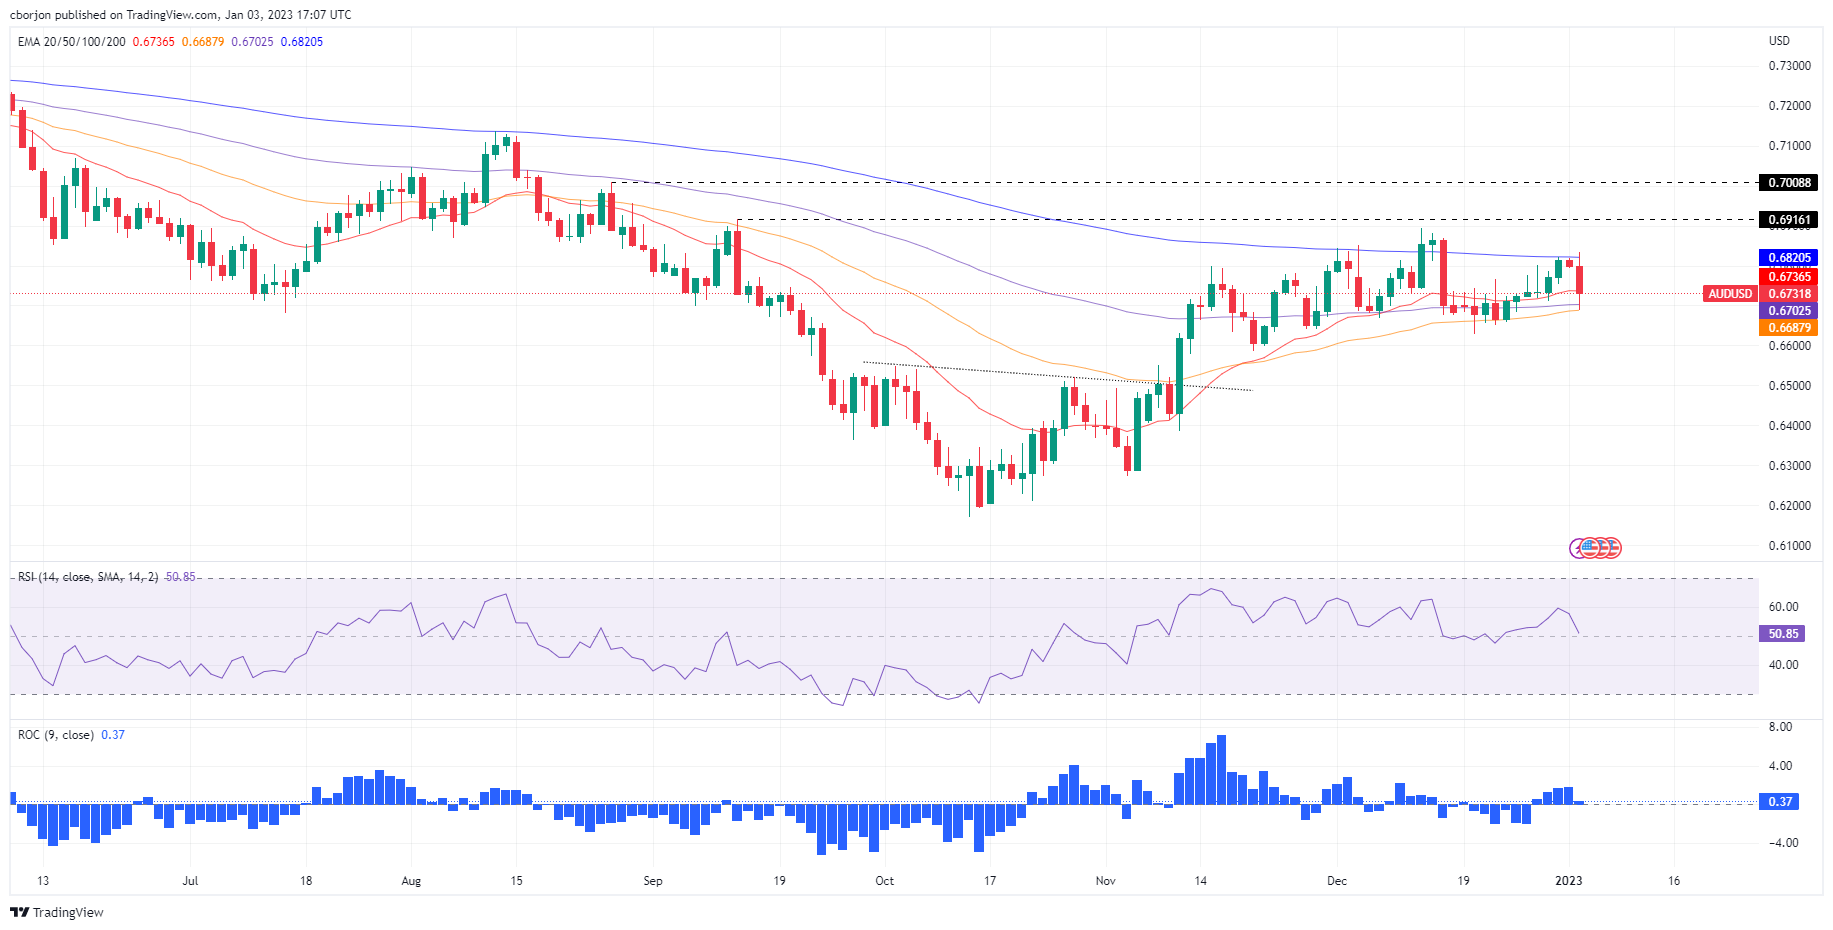
The Australian Dollar (AUD) plunges vs. the US Dollar (USD) as the AUD/USD pair fails to conquer the 200-day Exponential Moving Average (EMA), diving more than 60 pips or 0.99%, amidst a session driven by a strong US Dollar and negative sentiment. The AUD/USD is trading at 0.6728, below its opening price, after hitting a daily high of 0.6834.
AUD/USD tumbles due to a strong US Dollar
The beginning of 2023 has witnessed the US Dollar’s re-emergence, which is appreciating against most G8 currencies. The AUD/USD briefly pierced the 200-day EMA at 0.6820 but quickly reversed its earlier gains and dived as sentiment shifted sour, portrayed by Wall Street edging lower.
The first tranche of US economic data revealed that factory activity remained in contractionary territory, as the US S&P Global Manufacturing PMI for December’s final reading was unchanged at 46.2. Siân Jones, Senior Economist at S&P Global Market Intelligence, said, “The manufacturing sector posted a weak performance as 2022 was brought to a close, as output and new orders contracted at sharper rates. Demand for goods dwindled as domestic orders and export sales dropped. Muted demand conditions also led to downward adjustments of stock holdings.”
Elsewhere, the US Dollar Index (DXY), a gauge of the buck’s value vs. a basket of six currencies, edges up 1.12% at 104.653, hitting a new two-week high, hurting the prospects for higher AUD/USD prices.
On the Australian side, weak data revealed during the weekend on China slightly weighed on the Aussie Dollar (AUD). China’s Manufacturing PMI, announced by the National Bureau of Statistics (NBS), continued its downtrend to 47.0 vs. November’s 48. On the same side, the Caixin PMI declined to 49.0 in December, below the previous figures of 49.4.
Ahead into the week, the US economic docket remains busy with the release of the Federal Reserve’s (Fed) last meeting minutes, alongside the ISM Manufacturing PMI Index for December. Australia’s economic calendar will reveal the Reserve Bank of Australia’s (RBA) Chart pack.
AUD/USD Price Analysis: Technical outlook
From a daily chart perspective, the AUD/USD has continued to trade sideways since mid-November, trapped in a wide 0.6600/0.6800 range. It should be said that the AUD/USD inability to crack the 200-day Exponential Moving Average (EMA) suggests sellers are leaning toward it, which would pave the way for further losses. On the other hand, the bottom of the range, supported by the presence of the 20/50 and 100-day EMAs, would be difficult to surpass. So the AUD/USD might remain seesawing in the 0.66/0.68 200 pip range.
-
16:55
EUR/DKK: More intervention, another rate hike likely – Danske Bank
Analysts at Danske Bank point out that the Danmarks Nationalbank (central bank of Denmark) made another FX intervention in December. They consider it needs to raise interest rates again by 10 basis points less than the European Central Bank early on February.
Central Bank of Denmark intervenes again
“Danmarks Nationalbank (DN) sold another DKK5.8bn in FX intervention in December to floor EUR/DKK around the 7.4360-65 level. It comes on top of the DKK3.7bn it sold in November and brings the total amount of FX intervention since it widened the policy rate spread to ECB in September to DKK9.5bn.”
“EUR/DKK still trades close to the 7.4360-65 floor, which means DN will likely need to make a move on the policy rate again. We expect it hikes 10bp less than ECB on 2 February, i.e. it hikes 40bp in response to a 50bp ECB hike, and widens the spread to -35bp.”
“Government deposits were DKK161.8bn in December – that is more than enough to cover the DKK128bn gross financing need in 2023.”
-
16:44
USD/CHF holds onto strong daily gains looking at 0.9400
- US Dollar recovers momentum during the American session as market sentiment deteriorates.
- Swiss Franc falls across the board, EUR/CHF rises toward 0.9900.
- USD/CHF has best performance in weeks, gains 1.40%.
The USD/CHF is rising sharply on Tuesday amid a stronger US Dollar across the board and also amid a slide of the Swiss Franc. The pair peaked on European hours at 0.9398, the highest level since December 8 and then pulled back finding support at 0.9315. It is moving back toward daily highs as Wall Street extend losses.
The pair is back above the 20-day Simple Moving Average (now support at 0.9305) for the first time since early November. The recovery takes place after USD/CHF held above 0.9200. Above 0.9400, the next barrier is seen at 0.9430.
Dollar recovers momentum, Wall Street turns red
After a positive opening, the Dow Jones is falling by 0.53% and the Nasdaq drops by more than 1%. The deterioration in market sentiment is boosting the US Dollar after a previous correction. The DXY peaked at 104.85, and the pulled back to 104.15; as of writing it is at 104.65 up 1.15% for the day.
At the same time, US yields are also moving to the upside reversing an initial decline. The US 10-year yield stands at 3.78% and the two-year is back above 4.40%.
The Swiss Franc is among the worst performers amid a rally in Swiss bonds. The Switzerland 10-year bond yield is falling by 8.50% at 1.46%, moving away from the multi-year high it hit last week at 1.62%.
Technical levels
-
16:26
GBP/USD tumbles below 1.2000 on weak UK data, strong US Dollar
- The US Dollar strengthens as 2023 kicks in, as the US Dollar Index gains more than 1%.
- US S&P Global PMI was unchanged, though it remained in contractionary territory.
- Manufacturing activity in the UK plunges for the fifth straight month, adding to recession fears in the UK.
The Pound Sterling (GBP) trimmed some of its earlier losses against the US Dollar (USD) after plunging to the 100-day Exponential Moving Average (EMA), hitting a daily low of 11899. Nevertheless, the bounce was short-lived, even though the GBP/USD climbed to the 1.2000 figure but remained negative in the day. At the time of writing, the GBP/USD is trading at 1.1985, below its opening price by 0.48%.
Solid US Dollar and weak UK PMI weighed on the GBP/USD
Wall Street edges lower as sentiment deteriorates. The US S&P Global Manufacturing PMI for December’s final reading was unchanged at 46.2. Siân Jones, Senior Economist at S&P Global Market Intelligence, said, “The manufacturing sector posted a weak performance as 2022 was brought to a close, as output and new orders contracted at sharper rates. Demand for goods dwindled as domestic orders and export sales dropped. Muted demand conditions also led to downward adjustments of stock holdings.”
Aside from this, Tuesday’s trading session witnessed the greenback’s resurgence. The US Dollar Index (DXY), a gauge of the buck’s value vs. a basket of six currencies, edges up 1.12% at 104.653, hitting new two-week highs, a headwind for the GBP/USD.
On the UK front, Manufacturing PMI, revelated by S&P Global/CIPS, dropped to a 31-month low of 45.3, continuing its downtrend, as it trailed November’s 46.5. should be said that the index has remained below the 50 neutral mark for five consecutive months. Delving into the report, output, new orders, employment, and inventories, decelerated.
Elsewhere, the US economic docket remains busy with the release of the Federal Reserve’s (Fed) last meeting minutes, alongside the ISM Manufacturing PMI Index for December. On the UK front, Mortgage Approvals and Lending would be revealed.
GBP/USD Key Technical Levels
-
15:52
USD/JPY: Close below 130.41 to open doors to 126.36 – Rabobank
The USD/JPY is trading around 130.60/70, around the same level it closed on Monday. Earlier it bottomed at 129.49, the lowest level since early June. Analysts at Rabobank warn that a daily close below 130.40 could trigger more losses toward 126.40.
Still hawkish Fed is likely to limit to extent of further near-term downside
“The BoJ is due to meet again this month, on January 18. Given the tweaks made to its yield curve-control policy last month, there is a greater sense of anticipation that further adjustments could be forthcoming between now and the end of Governor Kuroda’s tenure in April and potentially as soon as this month. In the past 5 days, the JPY has appreciated by over 2% vs. the USD suggesting that the speculators are already positioning for a more hawkish outcome from the BoJ later this month. Implied market rates are pointing to a rate hike from the BoJ into positive territory within a 6 month view. Before it raises rates, however, the BoJ could first inject greater flexibility into its YCC policy. The market is likely to be disappointed if BoJ policy makers offer nothing new on the policy front this month.”
“USD/JPY has already fallen back substantially since its highs near 151.95 in late October. This factor combined with the still hawkish Fed is likely to limit to extent of further near-term downside in the currency pair. That said, the currency pair is currently trading close to near-term support at the May low of 130.41. A close below would open up scope for a fall to the May low around 126.36.”
-
15:25
NZD/USD rebounds from four-week lows, sill under 0.6300
- Kiwi trims losses versus US Dollar as DXY retreats.
- Wall Street turns negative after first minutes of trading.
- NZD/USD off lows, moving without clear direction.
The NZD/USD rebounded after hitting the lowest level since late November at 0.6199, climbing to 0.6285. The rebound lost strength as US markets turned negative after the initial half-hour of regular trading on Wall Street.
The Kiwi is still in negative for the day versus the Dollar, down 50 pips. The NZD/USD is attempting to recover 0.6250/60, a key technical level. If it is unable to do, the bearish pressure could return. Support levels are seen at 0.6230 and then 0.6200.
On the contrary, if NZD/USD consolidates above 0.6280, it would set the attention on the next resistance seen around 0.6310.
Dollar of lows, but still not giving up
The greenback lost momentum but so far it has not shown a conviction of a reversal. The decline so far looks like a correction and it could resume the upside, particularly if US equity prices remain in red. The DXY is up by 0.85%, off highs at 104.40. Earlier it reached at 104.85, the highest level since December 20.
Economic data from the US showed the S&P Global Manufacturing Index at 46.2 in December, unchanged from the flash reading. Construction spending rose in November by 0.2% against expectations of a 0.4% slide. On Wednesday, the ISM manufacturing is due and the Federal Reserve will publish the minutes of the latest FOMC meeting.
The GDT Price Index dropped by 2.8% versus market expectations of a 0.6% increase from the latest December auction.
Technical levels
-
15:00
United States Construction Spending (MoM) above expectations (-0.4%) in November: Actual (0.2%)
-
14:56
Silver Price Forecast: XAG/USD advances sharply toward $24.30s
- Silver rallied sharply, more than 1.60%, as liquidity conditions improved.
- A strong US Dollar was no excuse for XAG/USD to print solid gains, bolstered by falling US bond yields.
- US S&P Global Manufacturing PMI was unchanged, despite an ongoing economic slowdown.
- Silver Price Analysis: To remain upward biased above $24.29.
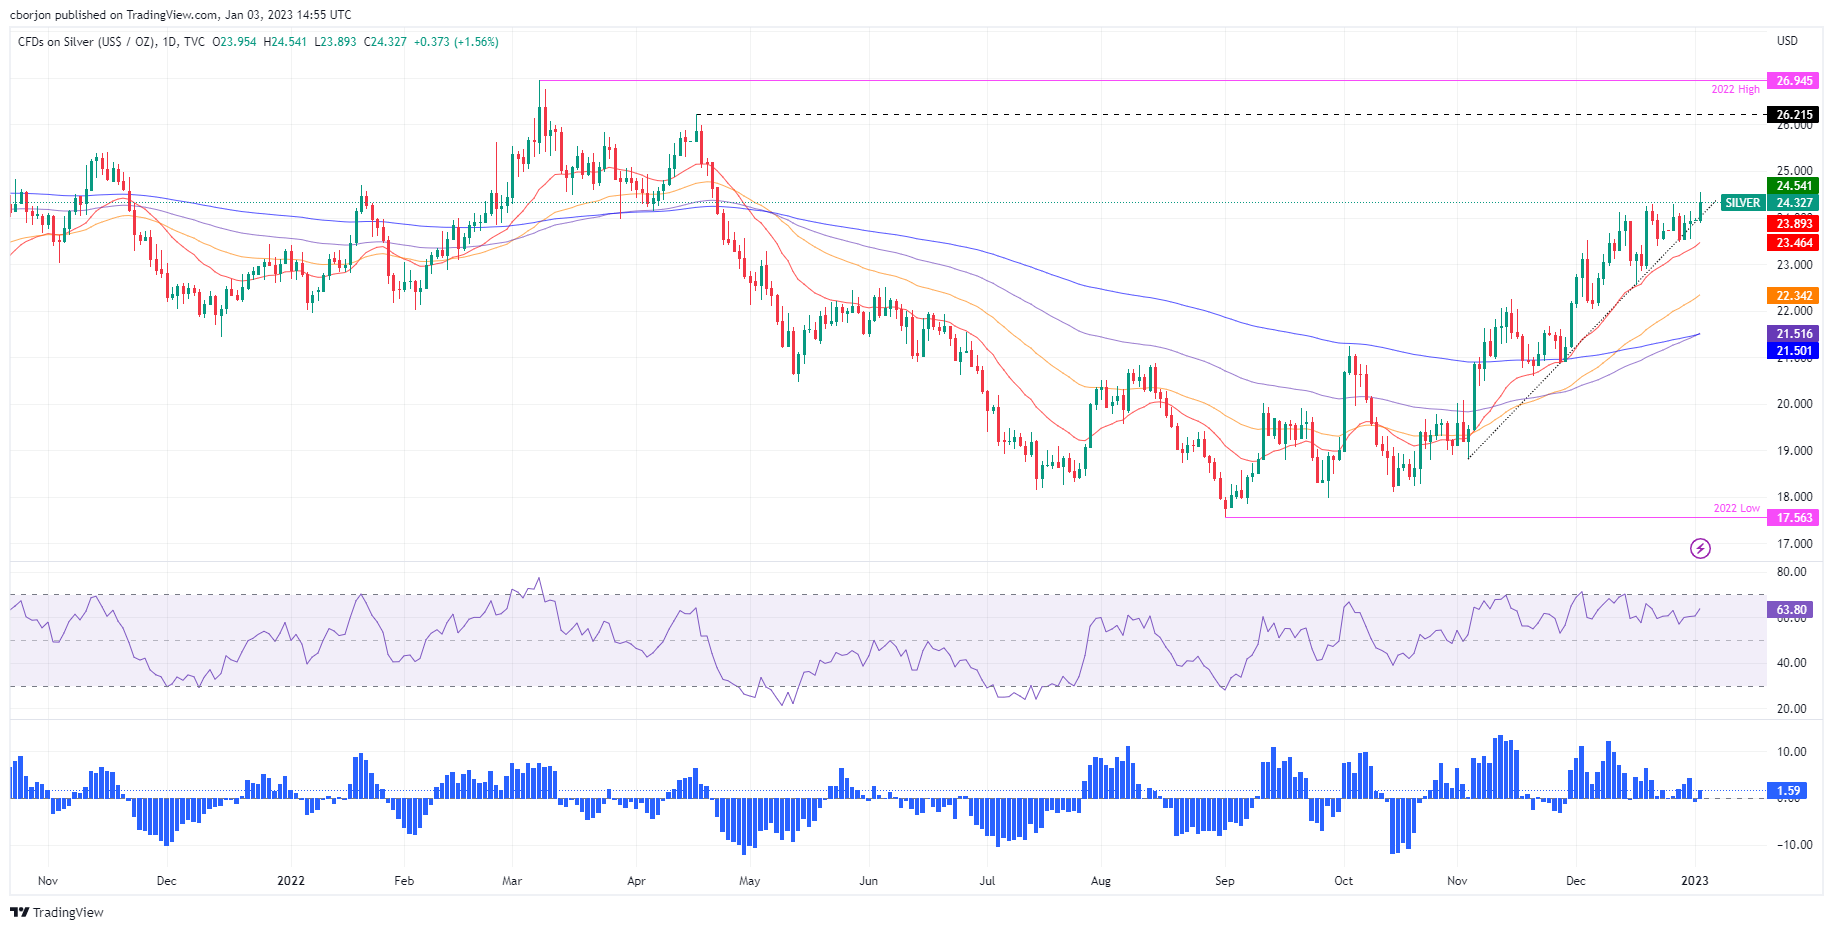
Silver price rallies sharply irrespective of a strong US Dollar (USD), though falling US Treasury yields underpinned the white metal. Wall Street is poised for a higher open, even though China’s PMIs showed factory activity eased, and its reopening improved traders’ mood. At the time of writing, the XAG/USD is trading at $24.35 a troy ounce.
The sentiment is upbeat, as shown by US equity futures pointing for a higher open. Over the weekend release of China’s PMI showed that manufacturing activity slowed down amidst Covid-19 lockdowns imposed in December. However, the relaxation of China’s zero-tolerance policy was cheered by investors at the beginning of 2023.
In the meantime, the US Dollar Index (DXY), a gauge of the buck’s value against a basket of peers, is recording solid gains of 0.81%, up at 104.326, failing to weigh on precious metal prices. US Treasury bond yields began the year on the back foot, as the 10-year benchmark note is tumbling eight and a half bps to 3.746%, as traders started to re-price a dovish Federal Reserve (Fed) in 2023.
Another factor weighing on precious metals prices is the fall of US Real Yields, as shown by the US 10-year TIPS bond yield, plunging 12 bps, down at 1.471%, compared to last week’s close of 1.473%.
The XAG/USD continued its uptrend after hitting a daily low of $23.89 after a flat Monday session. A daily close above December’s monthly high of $24.29 could pave the way for a new trading range within the $24.29-$26.21 range.
At the time of publishing, the US S&P Global Manufacturing PMI for December was unchanged at 46.2. According to the report, factory activity was weaker through 2022, sparked by a contraction in output, new orders, and muted demand conditions.
Silver Price Analysis: XAG/USD Technical Outlook
The XAG/USD daily chart depicts the white metal remaining bullish biased. The Relative Strength Index (RSI) sits comfortably in bullish territory nearby overbought conditions, while the Rate of Change (RoC) suggests that buying pressure is beginning to build. Also, the XAG/USD is supported by a two-month-old upslope trendline and by the 20-day Exponential Moving Average (EMA) around $23.47, which has been tracking silver prices since mid-November. Therefore, further XAG/USD upside is expected.
The XAG/USD first resistance would be $24.50. Break above will expose the $25.00 figure, followed by April 18 daily high at $26.21.
-
14:45
United States S&P Global Manufacturing PMI in line with forecasts (46.2) in December
-
14:45
New Zealand GDT Price Index came in at -2.8% below forecasts (0.6%)
-
14:30
Canada S&P Global Manufacturing PMI meets forecasts (49.2) in December
-
14:29
Germany: No real easing of inflationary pressure – Commerzbank
Data released on Tuesday showed inflation slowed in December in Germany more than expected. The Consumer Price Index (CPI) declined to 8.6% in December from 10% in November. Commerzbank Chief Economist Dr. Jörg Krämer point out that core inflation increased further and added inflation will likely rise again in January.
Government's one-off payments lowered inflation
“German inflation fell sharply from 10.0% to 8.6% mainly because the government took over the monthly payments for gas for many citizens in December.”
“If energy and food prices are excluded, core inflation rose further in December – from 5.0% to an estimated 5.1%. This once again shows the strong impact of special effects in December and that there is no real easing of inflationary pressure.”
“Inflation is likely to increase again in January because the government will not once again take over the payments for gas and district heating. However, inflation is unlikely to return to double digits. This is because the statisticians will take the electricity and gas price brakes into account in the price statistics from January.”
“Germans will continue to suffer from high inflation for a long time due to the ECB's slow approach, even if the gas and electricity price brakes should depress inflation this year.”
-
14:12
Gold Price Forecast: XAU/USD recovers momentum from $1,830 as DXY trims gains
- Gold prices correct to the $1,830 area as Dollar’s strength eases.
- Some bullish moment prevails while above $1,830 and the 20-hour SMA.
- Wall Street is set to open with gains.
Gold prices are having a volatile session on Tuesday after resuming normal trading activity. Earlier XAU/USD peaked at $1,849.99, level last seen back in May and then started to pullback, finding support at $1,830. Before Wall Street’s opening bell it is hovering slightly below $1,840.
The key driver in Gold’s correction was a rally of the US Dollar against G10 currencies. The DXY is off highs, up by 1%. Now it is retreating across the board, favoring the bounce back to the upside in the yellow metal.
Economic data released on Tuesday showed inflation slowed in Germany in December more than expected. German bond yields are falling with the 10-year yield down by almost 3% at 2.36%, far from the 2.57% of last week. US yields are also lower with the 10-year at 3.74%.
The decline in yields and the rebound in risk appetite during the last hours, offered support to Gold prices and a modest boost back to the $1,840 area. S&P futures are up by 0.63%.
If XAU/USD recovers levels above $1,840 another test of $1,850 seems likely as it would reinforce the bullish outlook. On the contrary, a slide below $1,830 could trigger a reversal, leaving XAU/USD vulnerable.
Technical levels
-
13:41
EUR/USD stages modest rebound, trades above 1.0550
- EUR/USD dropped to freh multi-week low on Tuesday.
- Annual CPI in Germany declined to 8.6% in December.
- Wall Street's main indexes look to open in positive territory.
EUR/USD declined sharply in the early European session and touched its lowest level in three weeks at 1.0520 before staging a modest rebound. As of writing, the pair was trading at 1.0560, where it was still down nearly 1% on a daily basis.
The renewed US Dollar strength earlier in the day weighed heavily on EUR/USD. The risk-positive market environment, however, helped the pair limit its losses for the time being. At the time of press, US stock index futures were up between 0.4% and 0.8% on the day, pointing to a positive opening in Wall Street's main indexes.
In the meantime, the data from Germany revealed on Tuesday that inflation, as measured by the Consumer Price Index (CPI), declined to 8.6% on a yearly basis in December from 10% in November. This reading came in below the market expectation of 9% and made it difficult for the Euro to gather recovery momentum.
S&P Global's December Manufacturing PMI will be the only data featured in the US economic docket and it is expected to come in at 46.2, matching the flash estimate. The US Dollar's valuation is likely to continue to drive EUR/USD's action in the second half of the day with American investors returning from the three-day weekend.
Technical levels to consider
-
13:03
Germany: Annual CPI declines to 8.6% in December vs. 9% expected
- Inflation in Germany declined at a stronger pace than expected in December.
- EUR/USD continues to trade deep in negative territory below 1.0550.
Inflation in Germany, as measured by the Consumer Price Index (CPI) declined to 8.6% in December's flash estimate from 10% in November. This reading came in lower than the market expectation of 9%. On a monthly basis, the CPI was down 0.8% in December.
Meanwhile, the Harmonised Index of Consumer Prices (HICP), the European Central Bank's (ECB) preferred gauge of inflation, edged lower to 9.6% on a yearly basis from 11.3%, compared to analysts' estimate of 10.7%.
Market reaction
EUR/USD showed no immediate reaction to these figures and the pair was last seen losing 1.2% on the day at 1.0535.
-
13:01
Germany Harmonized Index of Consumer Prices (YoY) below forecasts (10.7%) in December: Actual (9.6%)
-
13:01
Germany Harmonized Index of Consumer Prices (MoM) came in at -1.2%, below expectations (-0.5%) in December
-
13:00
Germany Consumer Price Index (YoY) came in at 8.6% below forecasts (9%) in December
-
13:00
Germany Consumer Price Index (MoM) came in at -0.8%, below expectations (-0.4%) in December
-
13:00
Singapore Purchasing Managers Index below expectations (50) in December: Actual (49.7)
-
12:48
Chinese recovery to be an inflationary force – Danske Bank
"A Chinese recovery will have a positive spill-over to the global economy but also be an inflationary force through its' effect on commodity prices," Danske Bank analysts said.
Reopening to improve home buyer sentiment
"As seen in other countries, reopening of the economy is set to unleash pent-up demand. In China, both services and goods consumption has been depressed over the past year due to the cloud of uncertainty from the zero-covid policy and we look for a rebound in both types of spending."
"The zero-covid policy also worsened the property crisis as it has pushed down home sales through all of 2022. We expect the reopening to improve home buyer sentiment, which in combination with more forceful easing measures towards the property sector is likely to lead to a turnaround here as well."
"We also look for improving business confidence to drive a turn higher in private investments. The government has vowed to support the private sector in 2023, which could entail more positive measures and signals to underpin private investments, not least in the tech sector and manufacturing."
-
12:06
US Dollar starting off 2023 with a bang – BBH
Analysts at BBH note that the US Dollar Index climbed to its highest level since December 19 at 104.85 with markets returning from holidays.
Euro trading at lowest level since December 12
"With little in the way of new fundamental developments, this appears to be largely a technical move magnified by skewed positioning as dollar shorts get stopped out. A break above 104.893 would set up a test of the December 7 high near 105.822. "
"The euro is trading at the lowest level since December 12 and has retraced nearly half of the late November-mid-December rally. A break below $1.0460 is needed to set up test of the November 30 low near $1.0290."
"Sterling is leading this move lower in the foreign currencies and is already testing its November 30 low near $1.19. A break below would set up a test of the November 21 low near $1.1780."
"USD/JPY broke below the August 2 low near 130.40 to trade as low as 129.50 today before reversing on broad-based dollar gains. That break sets up a test of the May low near 126.35."
-
12:01
Anticipating a very solid net NFP gain in December at 350K – TD Securities
Analysts at TD Securities note that Friday's December jobs report from the US is likely to grab the most attetion from market participants later this week.
FOMC minutes to shed light on officials' policy views for 2023
"In particular, if our above-consensus payrolls forecast comes to fruition: We are anticipating a very solid net gain in December at 350k."
"On the other hand, the ISM surveys are likely to suggest output continued to lose momentum during the last month of the year. This is particularly the case for the manufacturing sector."
"Lastly, we expect the December FOMC minutes to shed additional light on Fed officials' policy views for 2023. Note that at the meeting the Committee signaled broad expectations for a substantially higher terminal rate this year.""
-
11:36
There is a potential dovish shift on the FOMC this year – BBH
Previewing this week's upcoming key macroeconomic events, analysts at BBH noted that the minutes of the Federal Reserve's December policy meeting will be very important.
There is a potential dovish shift on the FOMC this year
"At the December meeting, the Fed downshifted to 50 bp hike. However, Chair Powell delivered a very hawkish message at his press conference and so the minutes should help fill in the picture. We continue to believe markets are underestimating the Fed. WIRP suggests a 25 bp hike February 1 is fully priced in, with over 30% odds of a larger 50 bp move. Another 25 bp hike March 22 is fully priced in, with nearly 50% odds of one last 25 bp hike in Q2 that would take the Fed Funds rate ceiling up to 5.25%. However, the swaps market continues to price in an easing cycle by year-end and we just don’t see that happening. Barkin speaks Friday."
"There is a potential dovish shift on the FOMC this year. Goolsbee, Harker, Logan, and Kashkari are now voting members of the FOMC. Harker and Logan are considered centrists, Kashkari has transformed into a hawk, and Goolsbee is an unknown quantity. While we hesitate to call these new voters dovish, they replace a group of noted hawks made up of Bullard, Mester, George, and Collins, who become non-voters in 2023. All seven members of the Board of Governors and Williams (New York Fed is a permanent voter) will remain voters this year."
-
11:30
Chile IMACEC dipped from previous -1.2% to -2.5% in November
-
11:15
China’s economy likely to rebound earlier than previously expected – Commerzbank
Commerzbank Senior Economist Tommy Wu thinks China’s economy will likely rebound earlier than previously expected, thanks to the sudden Covid reopening.
Government looks keen to prioritize economic recovery in 2023
"First, the speed of outbreak is probably much faster than previously expected, with most people having or eventually will get infected in a matter of weeks after the U-turn in Covid policy made in early December. Currently, cities are battered by infections. But infections will spread, as many households will take advantage of the Chinese New Year holiday, which starts on 22 January, to travel back to their hometown or for leisure."
"Next, once the majority of the population get infected by Covid, or at least the perception of that happening given that there’s no reliable data available, people will feel comfortable to come out and spend again. This will facilitate a full-blown recovery. Economic activity could see a significant recovery in Q2, or even as soon as March, much earlier than previously expected by us and the markets."
"It also seems unlikely that the authorities will reimpose controls despite a spike in infections. The government looks keen to prioritize economic recovery in 2023 and seems to prefer quickly getting over with the Covid situation to jump start the economy rather than dragging it out further."
"The abrupt U-turn of Covid policy, which is uncharacteristic of the Chinese government, poses an upside risk to our 2023 growth forecast which is currently at 4%."
-
10:55
GBP/USD slumps to fresh multi-week lows near 1.1900
- GBP/USD came under heavy bearish pressure on Tuesday.
- US Dollar outperforms its rivals as investors return from holidays.
- Investors keep an eye on political developments in the UK.
After having spent the Asian session in a very tight range slightly below 1.2100, GBP/USD fell sharply in the European morning and touched its lowest level in a month near 1.1900. The pair was last seen losing 1.1% on the day at 1.1915.
Despite a lack of fundamental drivers, the US Dollar started the day on a firm footing with investors returning from the New Year holiday. The US Dollar Index, which lost nearly 1% in the last two trading days of 2022, rose decisively and advanced above 140.70, where it was up 1.2% on a daily basis.
Meanwhile, political jitters in the UK seem to be putting additional weight on the Pound Sterling. The Telegraph reported over the weekend that British Prime Minister Rishi Sunak had shelved the childcare reform that was designed to help parents save money and return to work. Additionally, the first of five consecutive days of national rail strikes have gone underway on Tuesday.
Later in the day, November Construction Spending and S&P Global's December (final) Manufacturing PMI from the US will ve looked upon for fresh impetus. Ahead of these data releases, Wall Street's main indexes remain on track to open in positive territory with US stock index futures rising arounf 1% during the European trading hours. Nevertheless, the risk positive market environment is yet to detail the US Dollar's rally.
Technical levels to watch for
-
10:17
USD/CAD recovers above 1.3600 on renewed US Dollar strength
- USD/CAD gained traction in the early European session on Tuesday.
- US Dollar Index posts strong daily gains near 104.50.
- WTI continues to fluctuate in tight range slightly above $80.
USD/CAD gathered bullish momentum and advanced beyond 1.3600 in the European session on Tuesday following a drop toward 1.3500 earlier in the day. At the time od press, USD/CAD was up 0.4% on the day at 1.3625.
The broad-based US Dollar strength seems to be fueling the pair's rebound ahead of the Manufacturing PMI data from Canada and the US.
With market participants returning from the New Year holiday early Tuesday, the market volatility heightened and the US Dollar started to outperform its rivals despite the improving market mood.
The US Dollar Index, which tracks the US Dollar's performance against its major rivals, was last seen rising 1.1% on the day at 104.60. It's difficult to pinpoint the catalyst behind the renewed US Dollar strength as the 10-year US Treasury bond yield is down more than 2% and US stock index futures are up more than 1%.
In the second half of the day, S&P Global will release the December Manufacturing PMI surveys for Canada and the US. Since the US PMI data will be a revision, the market reaction to Canada PMI is likely to drive the action.
Meanwhile, the barrel of West Texas Intermediate fluctuates in a tight channel at around $80.00, allowing the US Dollar's valuation to steer the pair's movements. Traders are trying to figure out how the reopening steps taken by China will influence the energy demand outlook.
Technical levels to watch for
-
09:41
USD/JPY rebounds from multi-month lows, trades above 130.00
- USD/JPY staged a decisive recovery in the early European morning.
- The pair returned into the negative territory after coming in within a touching distance of 131.00.
- Falling US Treasury bond yields make it difficult for the pair to gather momentum.
USD/JPY reversed its direction and sharply rose toward 131.00 after having touched its lowest level since late May at 129.50 during the Asian trading hours. The pair, however, lost its bullish momentum and was last seen losing 0.25% on the day at 130.40.
The sudden US Dollar strength in the European morning provided a boost to the pair on Tuesday. Earlier in the day, the Japanese yen gathered strength on growing expectations of a hawkish Bank of Japan (BOJ) policy shift. Over the weekend, Nikkei reported that the BOJ was considering raising its inlation forecasts for 2023 and 2024 in January.
Meanwhile, the benchmark 10-year US Treasury bond yield is down more than 2% on a daily basis slightly below 3.75%, making it difficult for the pair to preserve its bullish momentum.
Nevertheless, the US Dollar Index is still up 1% on the day despite the positive shift witnessed in risk sentiment.
With trading conditions normalizing following the New Year holiday, the market action remains irregular early Tuesday. US stock index futures are up more than 1%.
USD/JPY technical levels to consider
-
09:36
AUD/USD attacks 0.6700 amid a massive 1.50% sell off
- AUD/USD is attempting a dead cat bounce above 0.6700.
- The US Dollar demand remains unabated despite the risk rally.
- The Aussie pair awaits the US Manufacturing data for some respite.
AUD/USD is seeing a tepid bounce from one-week lows of 0.6695 but bulls remain cautious above the 0.6700 barrier. The US Dollar is holding the upper hand across the FX board so far this Tuesday, as investors look for solace in the greenback on the first trading day of the year.
China’s covid concerns, high inflation and risks of an imminent recession worldwide have continued to sap investors’ confidence. Markets could be creating fresh US Dollar positions to fend off those risks while gearing up for a fresh economic release from the US later this Tuesday. The US S&P Global Manufacturing PMI will be published in the American session alongside a few minority reports.
Meanwhile, the Aussie fails to capitalize on the risk flows and upbear Chinese Caixin Manufacturing PMI data, as the US Dollar strength remains the main market driver, thus far. China's Caixin Manufacturing PMI for December dropped to 49.0 vs. 48.8 expected and 49.4 previous.
AUD/USD: Technical levels to consider
-
09:30
United Kingdom S&P Global/CIPS Manufacturing PMI came in at 45.3, above expectations (44.7) in December
-
09:18
Gold Price Forecast: XAU/USD pulls back from seven-month high at $1,850
- Gold price turns south after facing rejection at the $1,850 key level.
- The US Dollar rebound gathers steam in the European session.
- Sell-off in the US Treasury yields cap the downside in the Gold price.
Gold price is seeing a quick retracement from fresh seven-month highs of $1,850 reached in the early European morning. The ongoing retreat in the bright metal is owing to an impressive wave of US Dollar buying seen across the financial markets, as the first full trading day of 2023 kicks in.
The resurgent US Dollar demand is being witnessed despite a fresh risk rally in the European stock markets, with the pan-European Euro Stoxx 50 climbing 1.50% so far. The market mood remains underpinned by the expectations of a reopening in China from Covid-related restrictions while the country’s manufacturing sector showed a slight improvement in December.
Meanwhile, the pullback in the Gold price appears limited, as the weakness surrounding the US Treasury bond yields gathers steam and bodes well for the non-yielding precious metal.
Gold traders now await US S&P Global Manufacturing PMI for December and the Wall Street open for further trading cues.
Gold price: Technical levels to watch
-
08:59
EUR/USD tumbles to 1.0550 as US Dollar finds solid demand
- EUR/USD is smashed by a solid rebound in the US Dollar on Tuesday.
- Risk-on profile, weak Treasury yields fail to deter US Dollar bulls.
- EUR/USD is teasing a symmetrical triangle breakdown on the daily chart.
EUR/USD is heavily sold off below 1.0600, correcting sharply from two-week highs above 1.0700. The sharp upswing in the US Dollar across the board is smashing the Euro, despite the upbeat market environment.
As markets return from the long New Year weekend, they prefer to seek safety in the US Dollar ahead of the key economic events from the US this week. The first relevant US economic data will be released on Tuesday, the S&P Global Manufacturing PMI. Although the Fed December meeting minutes and Nonfarm Payrolls will hold the key.
The recent hawkish comments from European Central Bank policymaker Joachim Nagel also fail to offer any support to the Euro, as EUR/USD sheds 0.90% to trade at 1.0570, at the time of writing. The pair also shrugs off the sluggish performance in the US Treasury bond yields, as the US Dollar demand dominates.
Meanwhile, an unexpected improvement in the German labor market is doing little to please Euro bulls. Germany’s Unemployment Rate dipped to 5.5% in December while the Unemployment Change dropped by 13K vs. expectations of +15K in the reported period. All eyes now turn toward the German inflation data for fresh trading impetus.
EUR/USD: Technical outlook
EUR/USD has breached the rising trendline support at 1.0630, with a daily closing below it awaited to confirm a symmetrical triangle breakdown.
Further down, the pair has also taken out the critical 21-Daily Moving Average (DMA) support at 1.0601, exposing the 1.0500 round level.
The 14-day Relative Strength Index (RSI) has dipped sharply toward the 50.00 level from around 70.00, justifying the latest downtick.
On the other side, EUR/USD needs to recapture the 21DMA support-turned-resistance to attempt a tepid bounce. Further up, the triangle support now resistance will come into play.
EUR/USD: Daily chart
EUR/USD: Additional technical levels to watch
-
08:55
Germany Unemployment Rate s.a. in line with expectations (5.5%) in December
-
08:55
Germany Unemployment Change came in at -13K, below expectations (15K) in December
-
08:30
Switzerland SVME - Purchasing Managers' Index registered at 54.1 above expectations (53.3) in December
-
07:47
Forex Today: Markets turn cautious following long weekend
Here is what you need to know on Tuesday, January 3:
With trading conditions finally normalizing following the New Year holiday, investors seem to have adopted a cautious stance early Tuesday. Eurostoxx futures are down more than 5% ahead of the opening and US stock index futures trade virtually unchanged. The US Dollar Index clings to small daily gains and the benchmark 10-year US Treasury bond yield retreats toward 3.8%. Unemployment and Consumer Price Index (CPI) data from Germany will be featured in the European economic docket and S&P Global will release the December Manufacturing PMI (final) for the US.
Earlier in the day, the data from China revealed that the Caixin Manufacturing PMI declined to 49 in December. This reading came in slightly higher than the market expectation of 48.8. Meanwhile, Zhao Chenxin, Deputy Director at China’s National Development and Reform Commission (NDRC), “China's difficulties in 2022 were greater than anticipated but the economy will rebound in 2023," said earlier in the day. Shanhagi Composite and Hang Seng indexes both remain on track to close the day more than 1% higher. Nevertheless, the risk rally doesn't seem to have carried over into the European session.
EUR/USD lost its traction after climbing above 1.0700 and closed in negative territory on Monday. The pair stays relatively quiet at around 1.0650 in the early European morning. Annual CPI in December is forecast to edge lower to 9% in December from 10% in November.
GBP/USD snapped a two-day winning streak and closed below 1.2050 on Monday. The pair managed to stage a modest rebound during the Asian trading hours and was last seen trading modestly higher on the day at 1.2070.
USD/JPY came under renewed bearish pressure and dropped below 130.00 for the first time since late May. According to Nikkei, the Bank of Japan is considering raising its inlation forecasts for 2023 and 2024 in January. Investors seem to be pricing in a hawkish tilt in the BoJ's policy outlook following this headline.
Gold price gathered bullish momentum in the Asian session and continued to push higher in the European morning. XAU/USD was last seen trading at its highest level since mid-June near $1,850.
Bitcoin continues to edge higher following Monday's modest rebound and trades in positive territory slightly above $16,700. Ethereum gained more than 1% on Monday and seems to have gone into a consolidation phase at around $1,200.
-
07:05
Fed Minutes to reveal divergence between doves and hawks on terminal rate – Citibank
Strategists at Citigroup are of the opinion that the Minutes of the US Federal Reserve (Fed) December meeting could underscore the divergence between doves and hawks on how high the terminal rate should go.
Key quotes
"We will also be looking for any guide on what could determine the size of the hike at the February meeting, but would not expect any concrete guidance."
“Continue to expect a 50 basis points hike in February.”
-
07:01
Turkey Producer Price Index (YoY) declined to 97.72% in December from previous 136.02%
-
07:01
Turkey Producer Price Index (MoM) fell from previous 0.74% to -0.24% in December
-
07:01
Turkey Consumer Price Index (YoY) came in at 64.27% below forecasts (66.53%) in December
-
07:01
Turkey Consumer Price Index (MoM) came in at 1.18% below forecasts (2.58%) in December
-
06:56
FX option expiries for Jan 3 NY cut
FX option expiries for Jan 3 NY cut at 10:00 Eastern Time, via DTCC, can be found below.
- EUR/USD: EUR amounts
- 1.0580 1.1b
- 1.0700 327m
- GBP/USD: GBP amounts
- 1.2200 412m
- USD/CHF: USD amounts
- 0.9200 401m
- 0.9750 345m
- USD/CAD: USD amounts
- 1.3300 388m
-
06:19
USD/JPY: Yen benefits from BoJ’s JGB purchases – Commerzbank
Ulrich Leuchtmann, Head of FX and Commodity Research at Commerzbank expresses his take on the impact of the Bank of Japan (BoJ) bond purchases on the Japanese Yen.
Key quotes
“The Bank of Japan’s (BoJ) decision to allow higher JGB yields had spontaneously been interpreted as the beginning of the end of ultra-expansionary monetary policy not only by me.“
“It seemed to be the general interpretation. In the meantime the market no longer seemed to be 100% certain whether that was correct. Because the BoJ justified its explanation with purely market-technical reasons. USD-JPY temporarily traded with a 134 handle.”
“However, in particular the fact that Japanese central bankers will have to defend the new upper limit for JGB yields with even more determination resulted in a reversal. USD-JPY is once again trading at levels around 131.00 (while I write this), so roughly where the currency pair was trading following the BoJ decision.”
-
06:18
USD/JPY Price Analysis: Surrenders 130.00 as risk-off profile fades
- USD/JPY has dropped below the psychological support of 130.00 amid a recovery in the risk-on profile.
- The sustainability of the asset below the 200-EMA indicates that the long-term trend is bearish.
- An oscillation in the bearish range by the RSI (14) signals more weakness ahead.
The USD/JPY pair surrendered the psychological support of 130.00 in the early European session. The major has witnessed a steep fall after slipping below 130.50 in Tokyo amid an improvement in investors’ risk appetite.
S&P500 futures have managed to shift into the green trajectory after a weak opening post-long weekend, which signals that the risk aversion theme has faded. The US Dollar Index (DXY) is struggling to sustain above a two-week low around 103.15.
On the daily scale, the asset has surrendered the horizontal support placed from August 2 low around 130.40. The 20-period Exponential Moving Average (EMA) at 134.00 is continuously acting as a major barricade for the US Dollar. Also, the asset has shifted comfortably below the 200-EMA at 135.00, which indicates that the long-term trend is bearish.
Meanwhile, the Relative Strength Index (RSI) (14) has shifted into the bearish range of 20.00-40.00, which indicates that the bearish momentum is already active.
It would be prudent to wait for a pullback move to near the psychological resistance of 130.00 for building short positions, which will drag the asset towards May 4 low at 128.63 followed by May 24 low at 126.36.
On the flip side, a rebound move above December 29 high at 134.50 will drive the asset toward December 7 low around 134.00. A breach above the latter will send the asset toward December 20 high at 137.47.
USD/JPY daily chart
-638083234119528065.png)
-
05:51
Focus on German and Eurozone inflation this week – TDS
Analysts at TD Securities (TDS) provide a snippet on what they expect from the upcoming German and Eurozone inflation data.
Key quotes
“While headline inflation in Germany and the euro area likely fell due to a decline in petrol prices and lower electricity inflation, another increase in core inflation should keep the pressure on the ECB.”
“Looking ahead, headline inflation should start to come down faster in 2023 due to base effects and government subsidies, such as the electricity and gas brakes in Germany.”
-
05:44
Gold Price Forecast: XAU/USD aims to shift auction profile above $1,840 ahead of Fed minutes
- Gold price is looking to shift its business above $1,840.00 after an Ascending Triangle breakout.
- The US Dollar Index has attempted a recovery after dropping to near 103.15.
- Higher interest rates by the Fed could be responsible for weaker consensus for US ISM PMI data.
Gold price (XAU/USD) has displayed a sheer north-side move after surpassing the critical resistance of $1,823.00 in the Asian session. The precious metal is aiming to shift its auction profile above the $1,840.00 resistance amid a decline in safe-haven’s appeal.
A sheer recovery move in the S&P500 futures has shifted the traction towards the risk appetite theme. Meanwhile, the US Dollar Index (DXY) has attempted a rebound after dropping to near the crucial support at 103.15. Investors should brace for volatility in the FX domain ahead of the release of Wednesday’s United States ISM Manufacturing PMI data (Dec). According to the estimates, the economic data will drop to 48.5 vs. the former release of 49.0.
The reasoning behind lower consensus for ISM PMI data could be the higher interest rates by the Federal Reserve (Fed) due to which firms have postponed their expansion plans to avoid higher interest obligations.
Apart from the Manufacturing PMI, the release of the Federal Open Market Committee (FOMC) minutes will hog the limelight. Investors will keenly observe the economic projections and cues about the monetary policy outlook for CY2023.
Gold technical analysis
Gold price has delivered a breakout of the Ascending Triangle chart pattern formed on a four-hour scale. The horizontal resistance of the aforementioned chart pattern is placed from December 13 high at $1,824.55 while the upward-sloping trendline is plotted from December 16 low at $1,774.36.
Advancing 20-and 50-period Exponential Moving Averages (EMAs) at $1,820.00 and $1,812.07 respectively add to the upside filters.
Meanwhile, the Relative Strength Index (RSI) (14) has shifted into the bullish range of 60.00-80.00 from the 40.00-60.00 range, which indicates more upside ahead.
Gold four-hour chart
-
05:42
China’s Foreign Minister Qin: Deeply impressed by hard-working Americans
New Chinese Foreign Minister Qin Gang lauded Americans, suggesting that ties between the world’s biggest economies could be improving despite recent tensions over Taiwan.
“I have been deeply impressed by so many hard-working, friendly and talented American people that I met,” Qin said in a Tweet on Tuesday.
I “made many friends across the US,” Qin added.
Market reaction
AUD/USD is fading its bounce to return below 0.6800 despite the above comments. The pair is losing 0.13% on the day to trade at 0.6792, at the press time.
-
05:33
Australia RBA Commodity Index SDR (YoY) registered at 15.6%, below expectations (24.8%) in December
-
05:19
GBP/USD reaches out for 1.2100 as Dollar trips again ahead of US PMI
- GBP/USD jumps back toward 1.2100 amid risk recovery.
- US Dollar rebound fizzles out, USD/JPY sell-off weighs.
- GBP/USD bounces off 200DM, RSI enters into the bullish zone.
GBP/USD is holding onto the latest upswing toward 1.2100, as bulls jump back into the game amid holiday-thinned market conditions.
The main catalyst behind the pair’s renewed upside is the fresh round of selling seen in the US Dollar across the board. As the broad market sentiment is improving, the safe-haven US Dollar is fading its recovery attempts amid a subdued performance in the US Treasury bond yields. Upbeat Chinese Caixin Manufacturing is helping lift the overall market mood, with the US S&P 500 futures wiping out entire losses.
The fresh move lower in the US Dollar is also driven by the USD/JPY sell-off, as the Japanese yen rallies hard on speculations that the Bank of Japan (BoJ) is on course to exit from its ultra-loose easy monetary, as the year 2023 kicks in. In absence of any high-impact data from both sides of the Atlantic, risk trends and the US Dollar price action will continue, although the US S&P Global Manufacturing PMI could offer some trading incentives to Cable.
From a short-term technical perspective, the GBP/USD pair is extending its range play below the 21 and 200-Daily Moving Averages (DMA) for the third straight trading day.
GBP bulls continue defending the 200DMA at 1.2036, looking to take out the daily highs at 1.2085 in a bid to recapture the 1.2100 round figure.
The 14-day Relative Strength Index (RSI) is heading higher above the midline, justifying the renewed uptick.
GBP/USD: Daily chart
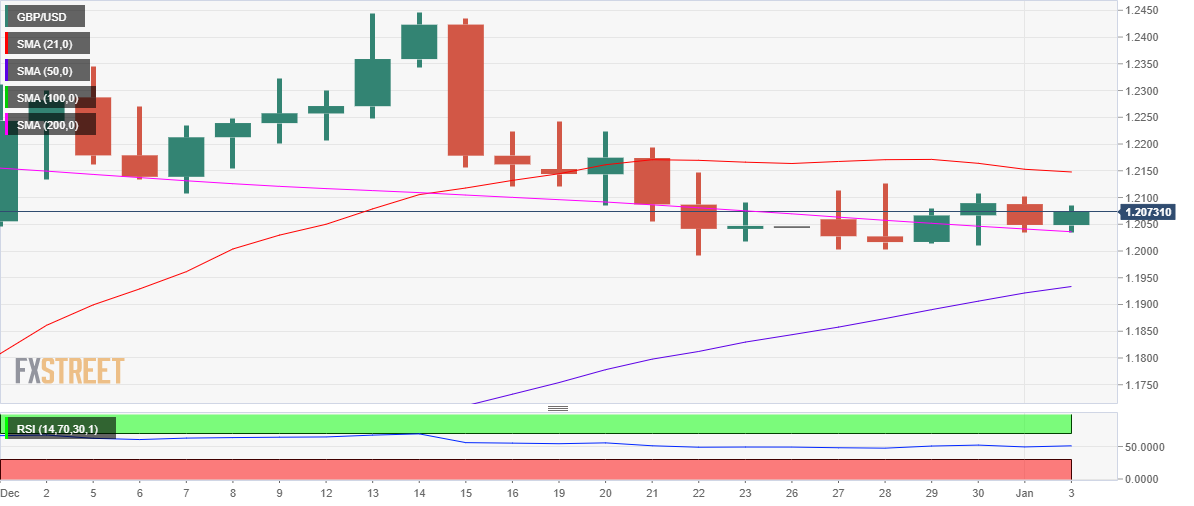
On the downside, Cable needs a sustained move above the 200DMA before challenging the 1.2000 barrier.
A breach of the latter could trigger a fresh sell-off toward the bullish 50DMA at 1.1933.
GBP/USD: Additional technical levels
-
05:14
USD/CAD senses immense selling pressure above 1.3600 as risk-on profile recovers
- USD/CAD has displayed an A-shape sell-off as investors have shrugged off China’s Covid-inspired uncertainty.
- FOMC minutes will provide cues about the monetary policy outlook for CY2023.
- The Loonie bulls are likely to dance to the tunes of Canada’s employment data.
The USD/CAD pair has displayed a perpendicular downside move after testing the previous week’s high around 1.3606 in the early Asian session. The Lonnie asset has dropped vigorously to near 1.3545 and is expected to extend its downside journey as the risk-averse theme has lost its traction.
A value-buying context in the S&P500 futures has made the market mood cheerful in the Asian session. Also, risk-perceived currencies have gained positive traction. Meanwhile, the US Dollar Index (DXY) has turned sideways after a sheer drop to near 103.15. The USD index is hovering near its crucial support, therefore, sheer volatility is expected from the counter ahead.
Investors are shifting their focus toward the minutes of the Federal Open Market Committee (FOMC), which will release on Thursday, as it will disclose the rationale behind hiking the interest rates by 50 basis points (bps) and pushing them to 4.25%-4.50%. Federal Reserve (Fed) chair Jerome Powell has already cleared that interest rates will peak around 5.1%. Inflationary pressures in the United States are extremely stubborn, therefore, investors should expect the continuation of higher interest rates straight to the end of CY2023.
Meanwhile, Loonie investors are awaiting the release of Friday’s employment data. The Bank of Canada (BoC) may continue facing troubles as wage prices are escalating in the economy. Higher employment bills will keep inflation at elevated levels and may force BOC Governor Tiff Macklem to tighten policy further.
On the oil front, oil price are struggling to sustain above $80.00 as the street is expecting an increase in the number of Covid-19 infections ahead. Analysts at Capital Economics have warned that "China is entering the most dangerous weeks of the pandemic".
-
04:42
Asian Stock Market: Traces recovery in S&P500 futures, oil struggles around $80.00
- Chinese stocks have displayed a responsive buying action after an upbeat Caixin Manufacturing PMI data.
- Japanese markets are closed on account of the Market Holiday.
- Oil price is struggling to sustain above $80.00 amid ambiguity in the sentiment of market participants.
Markets in the Asian domain have followed the footprints of S&P500 futures as the latter recovered sharply in early trade. United States equities futures have recovered their entire losses delivered in early Asia, portraying a recovery in the risk appetite theme.
At the press time, Shanghai gained 0.55%, Hang Seng jumped 1.66%, and Nifty50 remained flat. Japanese markets are closed on account of the Market Holiday.
Chinese stocks have witnessed a responsive buying action after the release of better-than-expected Caixin Manufacturing PMI data. After the release of downbeat China’s official Manufacturing PMI data and the vulnerable Covid-19 situation, market participants were expecting a sheer drop in the extent of manufacturing activities. However, the economic data has been released at 49.0 higher than the projections of 48.8.
Caution in the Chinese market still persists as the epidemic situation has gone beyond the control of medical authorities. Analysts at Capital Economics have warned that "China is entering the most dangerous weeks of the pandemic". The Covid-19 situation in China is expected to get vulnerable further as infections get accelerated while celebrations of the Lunar New Year.
The US Dollar Index (DXY) has refreshed its day’s low at 103.15 after failing to capitalize on the firmer opening move. The USD index is likely to remain on tenterhooks ahead of the release of the United States ISM Manufacturing PMI data. As per the consensus, the economic data is seen lower at 48.5 vs. the former release of 49.0.
On the oil front, oil prices are struggling to sustain above the crucial resistance of $80.00. Investors are confused about whether to support oil price after considering the long-term benefits of China’s reopening or to punish the black gold due to short-term pain in China’s oil demand led by accelerating Covid-19 cases.
-
04:19
Australia S&P Global Manufacturing PMI came in at 56.9, above expectations (50.4) in December
-
04:05
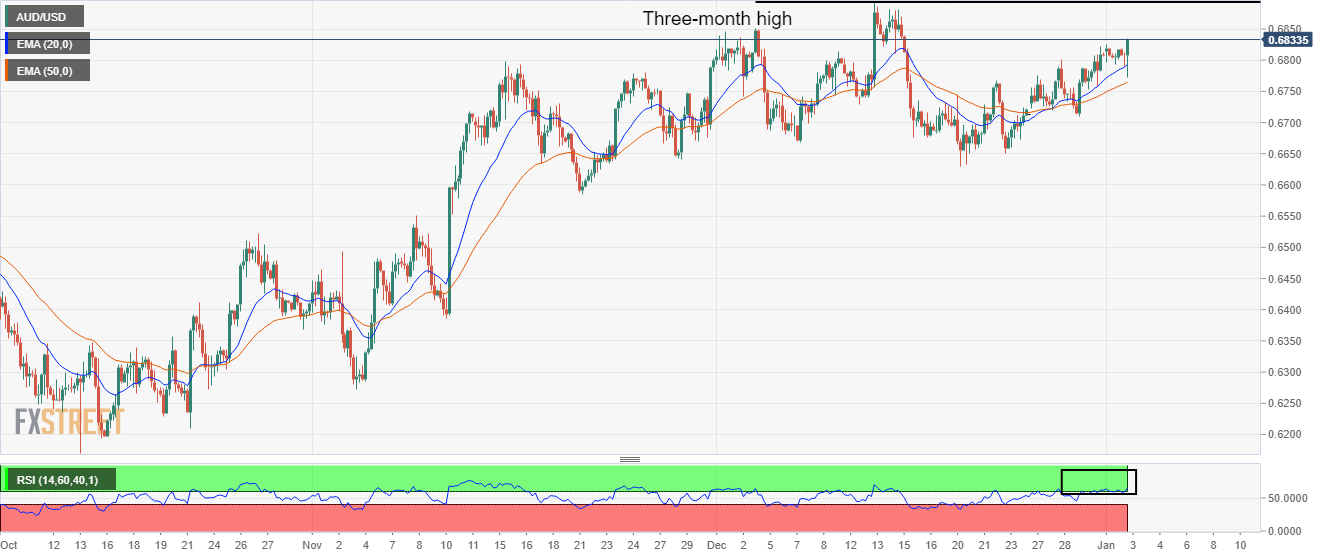
AUD/USD Price Analysis: Soars above 0.6830 on upbeat Caixin Manufacturing PMI
- AUD/USD has climbed above 0.6830 as the risk-on profile has rebounded firmly.
- Better-than-projected release of the Caixin Manufacturing PMI data has supported the Australian Dollar.
- The RSI (14) has shifted into the bullish range of 60.00-80.00, which indicates that the bullish momentum has been activated.
The AUD/USD pair has got immense strength after the release of better-than-anticipated Caixin Manufacturing PMI data. The economic data landed at 49.0 higher than the former release of 48.8 despite a spike in Covid-19 infections after the Chinese administration adopted a sheer pace for reopening the economy.
The US Dollar Index (DXY) has dropped below 103.20 despite a recovery move in the opening session. Meanwhile, S&P500 futures have recovered their entire losses displayed in early Asia, portraying a firmer rebound in the risk-appetite theme.
On a four-hour scale, the Aussie asset is marching towards the horizontal resistance, which is a three-month high, placed from December 13 high at 0.6893. The Australian Dollar has picked strength after a mild correction to near the 20-period Exponential Moving Average (EMA) at 0.6792. Also, the 50-period EMA at 0.6765 is advancing, which indicates that the upside bias is still solid.
Meanwhile, the Relative Strength Index (RSI) (14) has shifted into the bullish range of 40.00-60.00, which indicates that the bullish momentum has been triggered.
Going forward, a break above December 5 high around 0.6850 will drive the Aussie asset towards a three-month high around 0.6900. A breach of the latter will confirm more upside towards August 30 high at 0.6956.
On the contrary, a downside move below December 29 low at 0.6710 will drag the major further towards December 22 low at 0.6650 followed by November 21 low at 0.6585.
AUD/USD four-hour chart
-
03:34
EUR/USD recovers sharply to near 1.0680 as US Dollar Index drops, German Inflation eyed
- EUR/USD has picked bids after dropping to near 1.0680 as the USD Index has lost strength.
- The major currency pair might continue its sideways performance ahead of German Inflation.
- A recovery in S&P500 futures is portraying the availability of value-buying at lower levels.
The EUR/USD pair has sensed buying interest after dropping to near 1.0650 in the Asian session. The major currency pair has recovered as the rebound move in the US Dollar Index (DXY) has faded. Broadly, the major is displaying a sideways auction profile as investors are awaiting the release of the Eurozone Harmonized Index of Consumer Prices (HICP) data for fresh impetus.
The US Dollar Index has sensed selling pressure after failing to extend its recovery above the immediate resistance of 103.50. The USD Index is declining sharply and is likely to re-test its critical support at 103.00. Meanwhile, S&P500 futures have recovered sharply after kicking off the session on a weak note. A responsive buying action near lower levels indicates the existence of value-buying at lower levels. This also indicates a sheer recovery in the risk appetite of the market participants.
According to the consensus, the German HICP (Dec) will escalate to 11.8% vs. the former release of 11.3%. It seems that the inflationary pressures in Germany have been propelled by rising wage rates. European Central Bank (ECB) President Christine Lagarde cited higher wage rates as responsible for more juice to already firmer inflation. ECB President cited that the central bank must prevent this from adding to already high inflation, as reported by Reuters.
On the United States front, the release of the Federal Open Market Committee (FOMC) will remain in focus. Investors will keep an eye on the policy outlook for CY2023 and current economic prospects for taking informed decisions.
-
02:38
USD/JPY: Volatile trading extends but to the downside in Asia
- USD/JPY hit fresh six-month lows below 130.00 in Asia this Tuesday.
- The Japanese yen rallied on BoJ speculation and negative Asian stock markets.
- The US Dollar rebound cushions the downside in USD/JPY ahead of US PMI.
USD/JPY is under intense selling pressure near the 130.00 level, having hit fresh six-month lows at 129.82 in the last hour. The sudden downturn got triggered after the pair faced rejection at daily highs of 131.40, witnessing a wild swing of around 160 pips in a couple of hours.
The Japanese yen sees massive inflows
The downswing in the pair was mainly triggered by a fresh spurt of the Japanese Yen buying, as the US equity futures skidded at the open and bolstered the safe-haven flows into the Yen. Moreover, speculation surrounding the potential for a hawkish pivot by the Bank of Japan (BoJ) to tackle inflation could be attributed to the massive JPY strength in early trades.
Lower liquidity due to a public holiday in Japan also exaggerated the moves in the major. Looking ahead, the US S&P Global Manufacturing PMI will be eyed, as it’s the first macroeconomic release out of the US at the start of 2023. Although the US Federal Reserve December meeting minutes, due on Wednesday, will grab attention, as it would show many members saw risks that interest rates would need to go higher for longer.
USD/JPY: Technical levels to consider
-
02:06
NZD/USD slips to near 0.6300 despite better-than-anticipated Caixin Manufacturing PMI
- NZD/USD has slipped firmly to near 0.6300 as the US Dollar Index has climbed above 103.60.
- A release of the upbeat Caixin Manufacturing PMI at 49.0 has failed to support the New Zealand Dollar.
- Investors have turned cautious after the New Year celebrations and a long weekend.
The NZD/USD pair has witnessed a sell-off in the Asian session despite upbeat China’s Caixin Manufacturing PMI data. The Kiwi asset has dropped to near the round-level support of 0.6300 despite figures remaining better than expectations but lower than the former release. The release of the economic data at 49.0 vs. the projections of 48.8 might support the New Zealand Dollar ahead, being one of the leading trading partners of China.
Going forward, the status of China’s promotion of foreign trade and the capital attraction will remain in focus. China’s State Administration of Foreign Exchange (SAFE) Director Pan Gongsheng said on Tuesday, “China will use exchange rate policy tools to promote foreign trade, expand foreign capital stock and to manage its FX reserve assets in 2023,”
Meanwhile, the risk-perceived assets are facing the heat of long weekend-inspired volatility. The risk appetite of the market participants has trimmed dramatically as investors are cautionary in making positions before settling in the market. S&P500 futures have witnessed decent selling pressure from the market participants as investors are concerned above economic prospects in CY2023.
The US Dollar Index (DXY) has climbed to near 103.50 after a recovery move from the crucial support of 103.20. After the release of the Caixin Manufacturing PMI, investors will shift their focus toward the United States ISM Manufacturing PMI data, which will release on Wednesday.
-
02:03
Gold Price Forecast: XAU/USD attempts another run above $1,825 despite USD bounce
- Gold price challenges six-month highs in a cautious start to 2023.
- US Dollar rebounds amid tepid sentiment as S&P 500 futures drop.
- Gold price awaits acceptance above $1,825 to validate an ascending triangle.
Gold price is challenging six-month highs while holding gains above the $1,825 key resistance level so far this Tuesday. Gold price is seeing a continuation of the recent uptrend at the start of 2023, despite the bounce in the US Dollar across the board.
Concerns over a potential global economic recession, China’s covid resurgence and higher inflation are weighing on the market sentiment, driving demand for the traditional safe-haven Gold price. Expectations that the US Federal Reserve (Fed) will continue its fight against raging inflation this year, by continuing its tightening cycle, keep investors’ sentiment broadly undermined.
The risk-off flows are also helping the US Dollar find a floor, capping the upside in the bright metal. Further, the US Treasury bond yields finished the final week of 2022 on an upbeat note, limiting the upside attempts in the non-yielding Gold price.
Attention now turns toward the first relevant US economic data due to be released this year, the S&P Global Manufacturing PMI for December, for fresh trading impetus. Markets will also closely await the Wall Street open for further cues on risk sentiment.
Gold price technical analysis: Daily chart
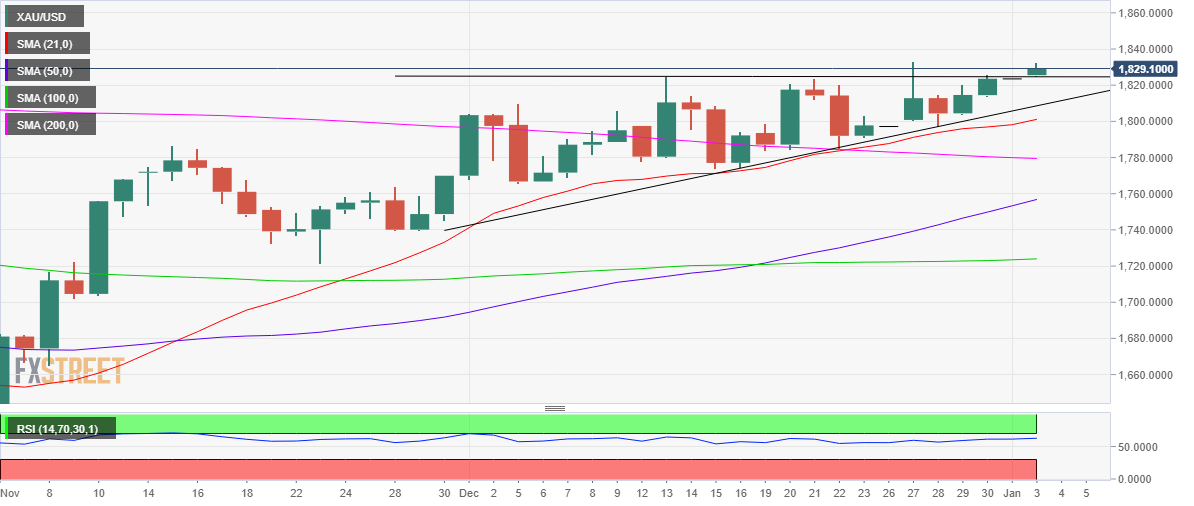
From a short-term technical perspective, Gold price is once again testing bearish commitments above the critical horizontal trendline (triangle) resistance at $1,825 this Tuesday.
Gold bulls need a daily closing above the horizontal trendline (triangle) resistance to confirm the ascending triangle breakout. Buyers will then aim for a fresh upswing toward the psychological $1,850 level. Ahead of that the $1,840 round figure could come into play.
The 14-day Relative Strength Index (RSI) is inching higher above the midline, backing the ongoing uptrend while the bullish crossovers continue to lend support to Gold bulls.
Alternatively, immediate support is seen at Friday’s low of $1,814. The next critical support awaits at the rising trendline (triangle support line) of $1,808. A breach of the latter could put the $1,800 threshold at risk, where the bullish 21-Daily Moving Average (DMA) hangs around.
Gold Price: Additional levels
-
01:58
AUD/USD drops below 0.6780 despite upbeat Caixin Manufacturing PMI
- AUD/USD has witnessed a sell-off despite better-than-projected Caixin Manufacturing PMI data.
- China’s Manufacturing PMI has landed at 49.0, higher than the consensus of 48.8.
- S&P500 futures have displayed a sell-off, portraying a risk-off market mood.
The AUD/USD pair is displaying a perpendicular fall and has dropped sharply to near 0.6773 despite the IHS Markit reporting better-than-anticipated Caixin Manufacturing PMI data. The economic data has landed at 49.0, higher than the consensus of 48.8 but lower than the prior release of 49.4.
The street was expecting a decline in the PMI numbers after observing negative cues from China’s official Manufacturing PMI data. Last week, China’s official Manufacturing PMI data dropped to 47.0 vs. the expectations of 49.2 and the former release of 48.0. It is worth noting that Australia is a leading trading partner of China and the extent of manufacturing activities in China impact the Australian Dollar.
In early Tokyo, the Australian Dollar didn’t react much to the S&P Global Manufacturing PMI data. The economic data has dropped to 50.2 vs. the consensus and the prior release of 50.4.
Meanwhile, investors are getting risk-averse and surrendering longs in risk-perceived assets. S&P500 futures have witnessed a steep fall after a long weekend in the Asian session. The US Dollar Index (DXY) has displayed a rebound move after dropping to near 103.20. The USD Index is gaining traction as the street is expecting a higher interest rate peak by the Federal Reserve (Fed) to combat stubborn inflation in the United States economy.
There is no denying the fact that the headline Consumer Price Index (CPI) in the US economy has dropped after peaking around 9.1%. The labor market is still tight and attracting higher wages for maintaining the equilibrium, which could fetch the traction back into the inflation gamut. Analysts at TD Securities are of the view that the terminal rate will reach a range of 5.25-5.50% by the May Federal Open Market Committee (FOMC) meeting."
-
01:48
China's Caixin Manufacturing PMI drops to 49.0 in December vs. 48.8 expected
China's Caixin Manufacturing PMI for December dropped to 49.0 vs. 48.8 expected and 49.4 previous, showing that the country’s covid containment continued to negatively impact the output at the end of 2022.
While output fell at a softer rate compared to November, total new orders fell at a quicker pace.
Wang Zhe, Senior Economist at Caixin Insight Group said, “Both manufacturing supply and demand continued to shrink last month. Fallout from the pandemic was a drag on production and sales, with the subindexes for output and total new orders staying below 50 for the fourth and fifth straight months, respectively.”
“Due to the economic downturn and weak demand overseas, the reading for new export orders also remained in contraction for the fifth straight month,” Wang added.
AUD/USD holds lower ground below 0.6800
The upbeat print of the Chinese Manufacturing PMI fails to lift the Aussie Dollar, as AUD/USD is testing lows near 0.6775, down 0.41% on the day, at the time of writing.
-
01:48
China Caixin Manufacturing PMI came in at 49, above expectations (48.8) in December
-
01:23
China's SAFE: Will promote trade, capital inflows
China’s State Administration of Foreign Exchange (SAFE) Director Pan Gongsheng said on Tuesday, “China will use exchange rate policy tools to promote foreign trade, expand foreign capital stock and to manage its FX reserve assets in 2023,” Yicai.com reports.
Additional quotes
“SAFE is ready to support cross-border financial cooperation under trade agreements such as the CPTPP and Digital Economy Partnership Agreement.”
“China will develop foreign access to its bond market, further the use of panda bonds, and expand currency pools for multinational companies looking to invest in the domestic economy.”
Related reads
- China’s NDRC: Economy will rebound in 2023
- US Dollar Direction in 2023: Ranking of seven currencies and their drivers
-
01:17
PBOC sets USD/CNY reference rate at 6.9475 vs. 6.9646 previous
On Tuesday, the People’s Bank of China (PBOC) set the USD/CNY central rate at 6.9475 versus Monday's fix of 6.9646 and market expectations of 6.9477.
-
01:14
GBP/USD Price Analysis: Inside the woods ahead of FOMC minutes
- GBP/USD is oscillating in a 1.2000-1.2126 range for the past 10 trading sessions.
- The 200-EMA around 1.2027 is acting as a major cushion for the Cable.
- A 40.00-60.00 range oscillation by the RSI (14) indicates an absence of a potential trigger.
The GBP/USD pair has delivered an upside break of the consolidation formed in a narrow range of 1.2040-1.2046 in the Asian session. The Cable asset has climbed above 1.2060 but is still likely to remain inside the woods as the market mood is still quiet.
It is difficult to ascertain the risk profile at the current juncture as the trading activity is still low. Meanwhile, S&P500 futures have initiated the week on a bearish note, portraying caution ahead of the release of the Federal Open Market Committee (FOMC) minutes this week.
On a four-hour scale, the Cable asset is tightly holding the cushion from the 200-period Exponential Moving Average (EMA) around 1.2027. As the 200-EMA has turned flat, a rangebound performance is likely to persist ahead till the absence of a potential trigger. For the past 10 trading sessions, the Cable is oscillating in a range of 1.2000-1.2126.
The Relative Strength Index (RSI) (14) is continuously oscillating in a 40.00-60.00 range, which indicates volatility contraction, which will be followed by a breakout in the same.
Should the Cable break above December 26 high at 1.2126, Pound Sterling bulls will drive the major towards the round-level resistance at 1.2200. A breach of the latter will drive the pair towards December 12 high around 1.2300.
Alternatively, a break below the psychological support of 1.2000 will drag the Cable towards November 18 high around 1.1950 followed by November 30 low at 1.1900.
GBP/USD four-hour chart
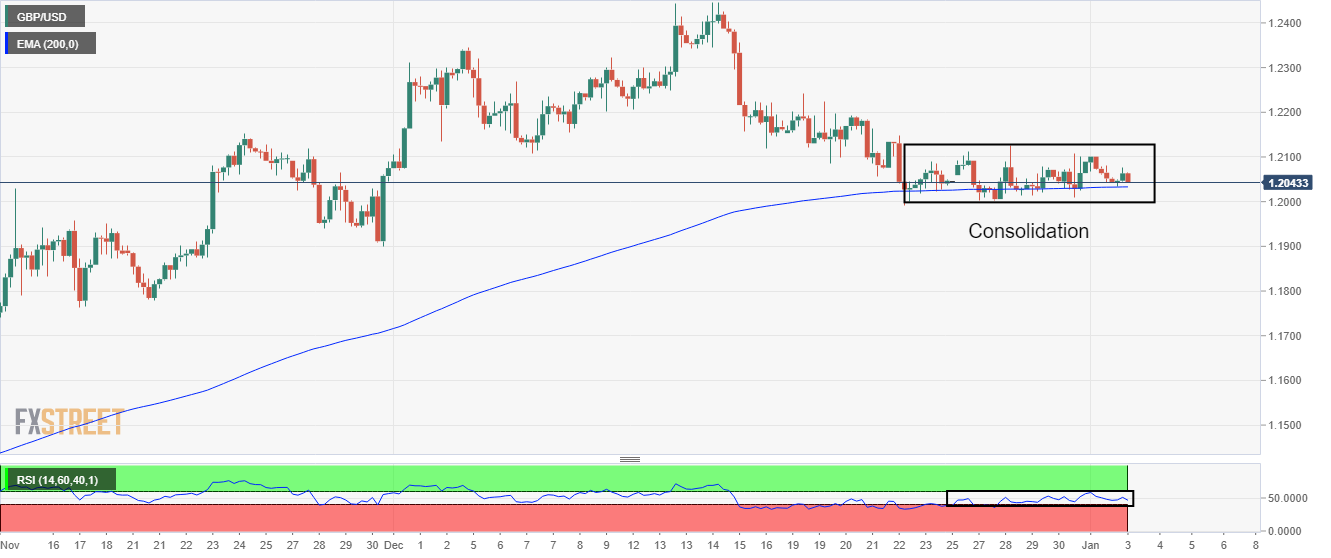
-
01:07
China’s NDRC: Economy will rebound in 2023
Citing Zhao Chenxin, Deputy Director at China’s National Development and Reform Commission (NDRC), the 21st Century Business Herald reported on Tuesday, “China's difficulties in 2022 were greater than anticipated but the economy will rebound in 2023.”
Additional takeaways
“The NDRC will support projects linked to local government bonds and will accelerate the release of special loans for equipment renewal and promote growth in manufacturing. “
“Foreign investment should be encouraged, and the catalog of accessible industries should be revised.”
“Private enterprise and investment will be supported and guided to participate in national development strategies.”
Market reaction
Despite the upbeat comments, AUD/USD is losing ground below 0.6800, down 0.29% on the day at 0.6782, at the time of writing.
-
00:52
USD/JPY struggles to surpass 131.00 as investors await US ISM PMI for fresh cues
- USD/JPY has sensed hurdles around 131.00 ahead of US ISM Manufacturing PMI data.
- S&P500 futures are expected to react to weaker economic projections from the IMF.
- For the achievement of higher inflation targets by the BOJ, the central bank needs to infuse more liquidity into the economy.
The USD/JPY pair is facing firmer barricades in overstepping the critical resistance of 131.00 in the early Tokyo session. The asset is hovering around a 12-day low and is therefore expected to remain on the tenterhooks.
The risk profile is still confusing as the market may take sufficient time to settle after a festive mood and a long weekend. S&P500 futures are displaying subdued performance as the equity domain of the United States will react to the economic projections provided by the International Monetary Fund (IMF).
Managing Director Kristalina Georgieva of the IMF cited on the CBS Sunday morning news program that “For much of the global economy, 2023 is going to be a tough year as the main engines of global growth - the United States, Europe, and China – all may experience weakening activity,”.
Going forward, the trading action from the US Dollar Index (DXY) will display the mood of the market. The major trigger that will impact the USD Index will be the United States ISM Manufacturing PMI data. According to the estimates, the US ISM Manufacturing PMI data is expected to improve to 49.6 from the former release of 49.0. Apart from that, investors will focus on New Orders Index data that provide cues about the forward demand in the United States economy. The economic data is seen higher at 48.1 vs. the former release of 47.2.
On the Tokyo front, a continuation of ultra-loose monetary policy could impact the Japanese Yen. The Bank of Japan (BOJ) has already set inflation targets for CY2023 and 2024 close to 2%, which will require more hikes in wage rates and continuous release of liquidity in the market to support the aggregate demand.
-
00:30
Stocks. Daily history for Monday, January 2, 2023
Index Change, points Closed Change, % KOSPI -10.73 2225.67 -0.48 DAX 145.67 14069.26 1.05 CAC 40 120.81 6594.57 1.87 -
00:15
Currencies. Daily history for Monday, January 2, 2023
Pare Closed Change, % AUDUSD 0.67963 -0.1 EURJPY 139.277 -0.49 EURUSD 1.06584 -0.35 GBPJPY 157.303 -0.35 GBPUSD 1.20436 -0.24 NZDUSD 0.63112 -0.21 USDCAD 1.3564 0.14 USDCHF 0.92317 0.13 USDJPY 130.606 -0.17 -
00:13
EUR/USD Price Analysis: Consolidation continues ahead of German Inflation
- A lengthy consolidation may result in a volatility expansion ahead.
- Advancing 50-and 200-EMAs support bullish bias for EUR/USD.
- The RSI (14) has returned to the 40.00-60.00 range after failing to sustain inside the bullish range.
The EUR/USD pair has delivered a wild gyration in a 30-pips range above 1.0650 in the early Tokyo session. The major currency pair is gaining traction as investors are returning to trading arsenal after celebrating New Year.
On Tuesday, the Euro is likely to dance to the tunes of German Harmonized Index of Consumer Prices (HICP) data. According to the consensus, the German HICP (Dec) will escalate to 11.8% vs. the former release of 11.3%. Meanwhile, the US Dollar Index (DXY) is expected to display volatile moves as investors are shifting their focus toward the release of the Federal Open Market Committee (FOMC) minutes.
EUR/USD is auctioning in a 1.0576-1.0736 range on a four-hour scale for the past three weeks. A lengthy consolidation usually results in a volatility contraction that brings wide ticks and heavy volume in the counter.
The major currency pair has rebounded after dropping around the 50-period Exponential Moving Average (EMA) at 1.0650. Also, the 200-EMA at 1.0500 is advancing, which indicates that the upside trend is still solid.
Meanwhile, the Relative Strength Index (RSI) (14) has returned to the 40.00-60.00 after failing to sustain in the bullish range of 60.00-80.00.
For an upside move, the asset needs to break above December 15 high at 1.0736, which will drive the major towards June 9 high at 1.0774 followed by the round-level resistance at 1.0800.
On the flip side, a breakdown of December 19 low at 1.0576 will drag the asset towards December 7 high around 1.0550. A slippage below the latter will expose the asset for more weakness towards December 9 low around 1.0500.
EUR/USD four-hour chart
-638083015275179706.png)
-
00:02
Singapore Gross Domestic Product (QoQ) registered at 0.2%, below expectations (0.4%) in 4Q
-
00:01
Singapore Gross Domestic Product (YoY) came in at 2.2% below forecasts (4%) in 4Q
-