Notícias do Mercado
-
20:00
DJIA +0.38% 25,422.26 +96.10 Nasdaq -0.02% 7,801.36 -1.33 S&P +0.33% 2,836.69 +9.47
-
18:03
U.S.: Baker Hughes Oil Rig Count, August 859
-
17:01
European stocks closed: FTSE 100 +83.17 7659.10 +1.10% DAX +69.43 12615.76 +0.55% CAC 40 +18.00 5478.98 +0.33%
-
15:10
U.S ISM non-manufacturing registered 55.7 percent, which is 3.4 percentage points lower than the June reading of 59.1 percent
U.S ISM non-manufacturing registered 55.7 percent, which is 3.4 percentage points lower than the June reading of 59.1 percent. This represents continued growth in the non-manufacturing sector at a slower rate. There was a notable decrease in the Business Activity Index, which fell to 56.5 percent, 7.4 percentage points lower than the June reading of 63.9 percent.
What respondentes are saying:
"Business is strong in both our commercial-construction and residential-service areas." (Construction)
"Current local and national conditions are good. On track to meet goals and projections for 2018." (Finance & Insurance)
"There has been little change in business activity, despite all of the political turmoil. Patients get sick regardless of what is going on in the economy." (Health Care & Social Assistance)
"Vendors continue to report that they are seeing significant increases in order volume this year. They report having to hire more staff to keep up with the increase in orders." (Management of Companies & Support Services)
-
15:00
U.S.: ISM Non-Manufacturing, July 55.7 (forecast 58.6)
-
14:45
U.S.: Services PMI, July 56 (forecast 56.2)
-
14:33
U.S. Stocks open: Dow +0.02%, Nasdaq +0.15%, S&P +0.06%
-
13:45
Canada's merchandise trade deficit narrowed from $2.7 billion in May to $626 million in June
Canada's merchandise trade deficit with the world narrowed from $2.7 billion in May to $626 million in June, the smallest deficit since January 2017. Total exports increased 4.1%, mainly on higher exports of energy products and aircraft. Total imports edged down 0.2%.
In real (or in volume) terms, exports rose 2.1% and imports were down 1.3%.
Exports rose 4.1% to $50.7 billion in June, the first time they have surpassed the $50 billion mark. Widespread increases throughout the product sections were led by energy products, and aircraft and other transportation equipment and parts. Excluding energy products, exports were up 3.4%. Year over year, total exports rose 9.2%.
-
13:43
U.S revised trade deficit was $46.3 billion in June, up $3.2 billion from $43.2 billion in May
The U.S. Census Bureau and the U.S. Bureau of Economic Analysis announced today that the goods and services deficit was $46.3 billion in June, up $3.2 billion from $43.2 billion in May, revised.
June exports were $213.8 billion, $1.5 billion less than May exports. June imports were $260.2 billion, $1.6 billion more than May imports.
The June increase in the goods and services deficit reflected an increase in the goods deficit of $3.1 billion to $68.8 billion and a decrease in the services surplus of less than $0.1 billion to $22.5 billion.
-
13:41
Wall Street. Stocks before the bell
(company / ticker / price / change ($/%) / volume)
ALCOA INC.
AA
42.9
0.42(0.99%)
1420
Apple Inc.
AAPL
206.88
-0.51(-0.25%)
305751
Barrick Gold Corporation, NYSE
ABX
11.05
0.11(1.01%)
12349
Caterpillar Inc
CAT
138.1
0.09(0.07%)
11801
Ford Motor Co.
F
9.96
0.04(0.40%)
11250
Freeport-McMoRan Copper & Gold Inc., NYSE
FCX
15.54
0.11(0.71%)
22488
General Electric Co
GE
13.16
-0.01(-0.08%)
48901
Goldman Sachs
GS
234.23
0.24(0.10%)
317
Home Depot Inc
HD
195.96
0.30(0.15%)
2190
Home Depot Inc
HD
195.96
0.30(0.15%)
2190
Intel Corp
INTC
49.56
0.08(0.16%)
14197
International Business Machines Co...
IBM
143.26
0.30(0.21%)
1183
Microsoft Corp
MSFT
107.75
0.18(0.17%)
33254
Pfizer Inc
PFE
39.57
-0.08(-0.20%)
2364
Procter & Gamble Co
PG
81.78
-0.22(-0.27%)
180
The Coca-Cola Co
KO
46.26
0.08(0.17%)
2742
Twitter, Inc., NYSE
TWTR
32.87
0.05(0.15%)
389565
UnitedHealth Group Inc
UNH
256.25
0.17(0.07%)
361
Visa
V
139.26
0.34(0.24%)
8719
Yandex N.V., NASDAQ
YNDX
35.87
-0.08(-0.22%)
8027
-
13:41
U.S average hourly earnings rose 0.3% in July, as expected
In July, average hourly earnings for all employees on private nonfarm payrolls rose by 7 cents to $27.05. Over the year, average hourly earnings have increased by 71 cents, or 2.7 percent. Average hourly earnings of private-sector production and nonsupervisory employees increased by 3 cents to $22.65 in July.
-
13:38
U.S non farm payrolls rose less than expected in July, the unemployment rate edged down by 0.1%
Total nonfarm payroll employment rose by 157,000 in July, and the unemployment rate edged down to 3.9 percent, the U.S. Bureau of Labor Statistics reported today. Employment increased in professional and business services, in manufacturing, and in health care and social assistance.
In July, the unemployment rate edged down by 0.1 percentage point to 3.9 percent, following an increase in June. The number of unemployed persons declined by 284,000 to 6.3 million in July. Both measures were down over the year, by 0.4 percentage point and 676,000, respectively.
-
13:36
Analyst coverage initiations before the market open
Tesla (TSLA) initiated with a Hold at Canaccord Genuity; target $336
-
13:30
U.S.: Unemployment Rate, July 3.9% (forecast 3.9%)
-
13:30
U.S.: Private Nonfarm Payrolls, July 170 (forecast 189)
-
13:30
U.S.: Nonfarm Payrolls, July 157 (forecast 190)
-
13:30
U.S.: Manufacturing Payrolls, July 37 (forecast 22)
-
13:30
U.S.: Labor Force Participation Rate, July 62.9%
-
13:30
U.S.: Government Payrolls, July -13
-
13:30
U.S.: International Trade, bln, June -46.3 (forecast -46.5)
-
13:30
U.S.: Average workweek, July 34.5 (forecast 34.5)
-
13:30
U.S.: Average hourly earnings , July 0.3% (forecast 0.3%)
-
13:30
Canada: Trade balance, billions, June -0.63 (forecast -2.3)
-
12:41
Company News: American Intl (AIG) Q2 earnings missed analysts’ estimate
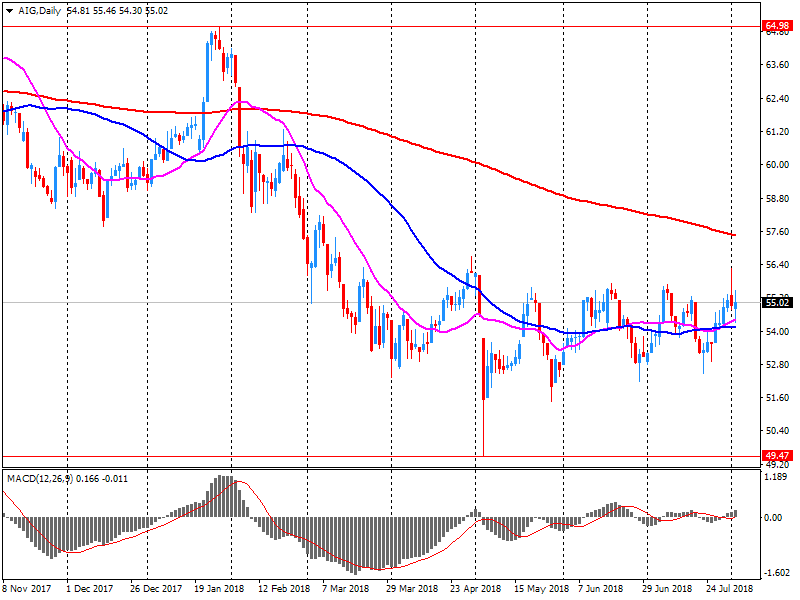
American Intl (AIG) reported Q2 FY 2018 earnings of $1.05 per share (versus $1.19 in Q2 FY 2017), missing analysts' consensus estimate of $1.21.
AIG closed Thursday's trading session at $55.16 (+0.31%).
-
12:31
Today’s NFP report is forecasted to show a healthy U.S labor market, with +193K new jobs and an unemployment rate of +3.9%
Many will focus on wage growth, a print of +2.8% could support another dollar leg up as the market prices out four rate increases this year.
-
12:29
In June 2018 compared with May 2018, the seasonally adjusted volume of retail trade increased by 0.3% in the euro area (EA19) and remained stable in the EU28
In June 2018 compared with May 2018, the seasonally adjusted volume of retail trade increased by 0.3% in the euro area (EA19) and remained stable in the EU28, according to estimates from Eurostat, the statistical office of the European Union. In May, the retail trade volume increased by 0.3% in the euro area and by 0.6% in the EU28. In June 2018 compared with June 2017 the calendar adjusted retail sales index increased by 1.2% in the euro area and by 1.9% in the EU28.
The 0.3% increase in the volume of retail trade in the euro area in June 2018, compared with May 2018, is due to rises of 0.7% in "food, drinks and tobacco" and of 0.6% in automotive fuels, while non-food products fell by 0.3%. In the EU28, the unchanged volume of retail trade is due to increases of 0.4% in "food, drinks and tobacco" and of 0.1% in automotive fuel, while non-food products fell by 0.4%.
-
10:00
Eurozone: Retail Sales (MoM), June 0.3% (forecast 0.4%)
-
10:00
Eurozone: Retail Sales (YoY), June 1.2% (forecast 1.4%)
-
09:53
July data highlighted a disappointing start to the third quarter for the UK service sector
July data highlighted a disappointing start to the third quarter for the UK service sector, with business activity and incoming new work rising at softer rates than in June. There were also signs that difficulties filling staff vacancies persisted in the service economy, which contributed to the weakest rise in payroll numbers since August 2016.
At 53.5 in July, down from 55.1 in June, the seasonally adjusted IHS Markit/CIPS UK Services PMI Business Activity Index signalled the slowest expansion of service sector output since April. Nonetheless, the latest reading was comfortably above the 50.0 no-change mark and pointed to a solid upturn in business activity.
-
09:30
United Kingdom: Purchasing Manager Index Services, July 53.5 (forecast 54.7)
-
09:03
The pace of euro area economic expansion eased in July, ceding most of the momentum gained in the prior survey month
At 54.3, the final IHS Markit Eurozone PMI Composite Output Index was down from 54.9 in June and unchanged from the earlier flash estimate.
Rob Dobson, Director at IHS Markit said: "The final PMI numbers confirm the euro area economy started quarter three on a softer footing. July saw rates of expansion in both output and new orders cede the momentum recaptured in the prior survey month, returning to a picture of sliding growth rates seen through much of the year-to-date. "If the headline index continues to track at its current level, quarterly GDP growth over the third quarter as a whole would be little-changed from the softer-thanexpected expansion of 0.3% signalled by official Eurostat data for quarter two".
-
09:02
The headline seasonally adjusted IHS Markit France Services Business Activity Index registered 54.9 in July, down from June’s 55.9
9. The rate of expansion, however, remained marked overall. Output growth was driven by the Post & Telecommunications sub-sector, followed by Transport & Storage companies. Buoyant economic conditions and higher client demand were cited by panellists as factors supporting growth.
Alex Gill, Economist at IHS Markit which compiles the France Services PMI survey, said: "The French service sector lost some momentum but continued to grow at a robust pace at the start of the third quarter. New orders, output and employment all rose at rates above their historical averages, while a pickup in business confidence suggests the sector looks well-placed as we move into the second half of the year."
-
09:01
Germany: Services PMI, July 54.1 (forecast 54.4)
-
09:01
Germany’s service sector started the third quarter on a robust footing,
Germany's service sector started the third quarter on a robust footing, with business activity growth solid overall and little-changed from June's fourmonth high. Moreover, new business increased at the fastest rate in nine months. The latest survey revealed further marked inflationary pressures, however, as output prices rose at the strongest rate in the survey's 21-year history. The seasonally adjusted IHS Markit Germany Services PMI Business Activity Index registered 54.1 in July, down only fractionally from 54.5 in June. The latest reading signalled a solid overall rise in business activity, albeit one that was marginally weaker than the trend shown over the past year-and-a-half. Service sector activity has risen continuously since June 2013.
-
09:00
Eurozone: Services PMI, July 54.2 (forecast 54.4)
-
08:50
France: Services PMI, July 54.9 (forecast 55.3)
-
08:34
FTSE +19.39 7595.32 +0.26% DAX +25.28 12571.61 +0.20% CAC +2.22 5463.20 +0.04%
-
08:31
BoE Gov Carney: Weak Productivity Is A Big Part Of Economic Puzzle @LiveSquawk
-
08:17
The Swiss consumer price index (CPI) fell by 0.2% in July 2018 compared with the previous month
The consumer price index (CPI) fell by 0.2% in July 2018 compared with the previous month, reaching 101.8 points (December 2015=100). Inflation was 1.2% compared with the same month of the previous year. These are the results from the Federal Statistical Office (FSO).
The 0.2% drop compared with the previous month can be explained by several factors including falling prices for clothing and footwear due to seasonal sales. The prices of airfares also declined. In contrast, prices for dental services and berries increased.
-
08:15
Switzerland: Consumer Price Index (MoM) , July -0.2% (forecast -0.3%)
-
08:15
Switzerland: Consumer Price Index (YoY), July 1.2% (forecast 1.2%)
-
08:04
Bank of Japan meeting minutes
"The Bank, in accordance with the short-term policy interest rate of minus 0.1 percent and the target level of the long-term interest rate, both decided at the previous meeting on April 26 and 27, 2018, had been providing funds through purchases of Japanese government bonds (JGBs) and other measures.5 In this situation, 10-year JGB yields had been at around 0 percent, and the shape of the JGB yield curve had been consistent with the guideline for market operations.
In the money market, interest rates on both overnight and term instruments had generally been in negative territory. The uncollateralized overnight call rate had been in the range of around minus 0.03 to minus 0.08 percent. As for interest rates on term instruments, yields on three-month treasury discount bills (T-Bills) had been more or less unchanged on average and recently had been in the range of minus 0.10 to minus 0.15 percent."
-
07:57
Australian retail turnover rose 0.4 per cent in June
Australian retail turnover rose 0.4 per cent in June 2018, seasonally adjusted, according to the latest Australian Bureau of Statistics (ABS) Retail Trade figures.
This follows a 0.4 per cent rise in May 2018.
"Food retailing (0.4 per cent) led the rises," said Ben James, Director of Quarterly Economy Wide Surveys. "Clothing, footwear and personal accessories rose 1.7 per cent, following a 2.3 per cent rise in May."
There were also rises for cafes, restaurants and takeaways (0.9 per cent) and household goods (0.4 per cent). Other retailing (0.0 per cent) was relatively unchanged, whilst department stores (-1.2 per cent) fell in June 2018.
In seasonally adjusted terms, there were rises in Victoria (1.1 per cent), New South Wales (0.4 per cent), Western Australia (0.2 per cent), the Australian Capital Territory (1.2 per cent), and Tasmania (0.9 per cent). South Australia (0.0 per cent) was relatively unchanged in June 2018. There were falls in Queensland (-0.3 per cent) and the Northern Territory (-0.4 per cent).
The trend estimate for Australian retail turnover rose 0.3 per cent in June 2018 following a rise of 0.4 per cent in May 2018. Compared to June 2017, the trend estimate rose 3.1 per cent.
-
07:56
Business activity growth across China slowed at the start of the third quarter
Business activity growth across China slowed at the start of the third quarter, according to the latest Caixin China Composite PMI data (which covers both manufacturing and services). This was shown by the Composite Output Index falling from 53.0 in June to 52.3 in July. The slowdown in overall growth momentum was broad-based, with both manufacturers and service providers in China registering weaker increases in activity in the latest survey period. Notably, service sector output rose at the slowest rate for four months in July, as illustrated by the seasonally adjusted Caixin China General Services Business Activity Index falling from 53.9 in June to 52.8. Meanwhile, manufacturing production rose only modestly.
-
07:54
Options levels on friday, August 3, 2018
EUR/USD
Resistance levels (open interest**, contracts)
$1.1702 (2695)
$1.1659 (1072)
$1.1626 (154)
Price at time of writing this review: $1.1582
Support levels (open interest**, contracts):
$1.1547 (2852)
$1.1499 (3524)
$1.1450 (1740)
Comments:
- Overall open interest on the CALL options and PUT options with the expiration date August, 13 is 90777 contracts (according to data from August, 2) with the maximum number of contracts with strike price $1,1850 (5337);
GBP/USD
Resistance levels (open interest**, contracts)
$1.3152 (827)
$1.3105 (1017)
$1.3070 (299)
Price at time of writing this review: $1.3009
Support levels (open interest**, contracts):
$1.2947 (2419)
$1.2930 (356)
$1.2899 (1026)
Comments:
- Overall open interest on the CALL options with the expiration date August, 13 is 25263 contracts, with the maximum number of contracts with strike price $1,3600 (3205);
- Overall open interest on the PUT options with the expiration date August, 13 is 30212 contracts, with the maximum number of contracts with strike price $1,2950 (2419);
- The ratio of PUT/CALL was 1.20 versus 1.20 from the previous trading day according to data from August, 2.
* - The Chicago Mercantile Exchange bulletin (CME) is used for the calculation.
** - Open interest takes into account the total number of option contracts that are open at the moment.
-
07:51
Futures: Eurostoxx 0,0% DAX +0,1% FTSE -0,1% CAC 40 0,0%
-
02:45
China: Markit/Caixin Services PMI, July 52.8 (forecast 54.0)
-
02:30
Australia: Retail Sales, M/M, June 0.4% (forecast 0.3%)
-
00:01
Commodities. Daily history for August 02’ 2018:
Raw materials
Closing price
% change
Oil
69.00
+1.98%
Gold
1,216.50
-0.90%
-
00:00
Stocks. Daily history for August 02’ 2018:
Index
Change items
Closing price
% change
Nikkei
-234.17
22512.53
-1.03%
TOPIX
-17.67
1752.09
-1.00%
CSI 300
-76.43
3370.96
-2.22%
KOSPI
-36.87
2270.20
-1.60%
FTSE 100
-76.98
7575.93
-1.01%
DAX
-190.72
12546.33
-1.50%
CAC 40
-37.39
5460.98
-0.68%
DJIA
-7.66
25326.16
-0.03%
S&P 500
+13.86
2827.22
+0.49%
NASDAQ
+95.40
7802.68
+1.24%
-