Notícias do Mercado
-
23:47
Fed’s Mester: Fed will need to hike rates above 5% and hold them there for a while
“Federal Reserve will need to hike rates above 5% and hold them there for a while,” said Federal Reserve Bank of Cleveland leader Loretta Mester late Tuesday.
The policymaker also stated that the recent bank tighter credit may result from turmoil.
Additional comments
Tightening monetary policy needed to cool too hot inflation.
How much more the fed hikes depends on economy and how it reacts.
Tighter financial conditions should create restraint on economy.
Banking sector resilient, stresses appear to have eased since last month.
Fed balance sheet cuts aiding rate-hike cycle.
Fed closely watching banking system for signs of stress.
Expects inflation to ease to 3.75% by end of year, 2% by 2025.
Expects growth to moderate this year.
Expects jobless rate to rise to between 4.5% and 4.75% this year.
Market implications
The news might have allowed the US Dollar bears to take a breather at the lowest levels in two months, making rounds to 101.50 by the press time.
Also read: Forex Today: Dollar under pressure, Gold jumps and US yields tumble
-
23:43
USD/CHF juggles near fresh 19-month low below 0.9060 as US labor market cools down
- USD/CHF is hovering near a fresh 19-month low below 0.9060 ahead of US economic data.
- The cooling US labor market has infused confidence among investors that the Fed would call for an early pause.
- After weak US Manufacturing PMI, Services PMI are also expected to contract ahead.
The USD/CHF pair is displaying a back-and-forth action above 0.9050 in the early Tokyo session. The Swiss Franc asset is expected to continue its downside momentum amid an absence of recovery signs after a plunge. The downside bias for the US Dollar has strengthened as the cooling United States labor market has propelled an unchanged policy stance from the Federal Reserve (Fed) for its May policy meeting.
The US Dollar Index (DXY) witnessed an intense sell-off on Tuesday after US Job Openings data dropped below 10 million for the first time since 2021. Market pundits considered it as a sign of cooling US labor market, which would allow Fed chair Jerome Powell to remain light on interest rates in May’s monetary policy meeting.
S&P500 futures are showing nominal gains in the early Asian session after ending Tuesday’s session on a bearish note, portraying an attempt of recovery in the risk appetite of the market participants. The demand for US government bonds soared as odds for a steady Fed policy zoomed led by declining labor demand and contracting manufacturing activities. The 10-year US Treasury yields have dropped below 3.34%.
For further action, US Automatic Data Processing (ADP) Employment and ISM Services PMI data will be keenly watched. According to the estimates, the US economy has hired additional 200K talent in March, lower than the former release of 242K.
After weaker-than-anticipated US Manufacturing PMI, Services PMI is also set to contract further. The Services PMI is seen declining to 54.5 from the former release of 55.1. And, New Orders Index is expected to soften firmly to 57.6 vs. February’s figure of 62.6.
On the Swiss franc front, the monthly Consumer Price Index escalated by 0.2% but remained below expectations of 0.4% and the former release of 0.7%. Also, annual CPI has softened to 2.9% from the consensus and the former release of 3.2% and 3.4% respectively. Softening inflationary pressures are going to delight Swiss National Bank (SNB) policymakers.
-
23:37
Silver Price Forecast: Options market signals discomfort with XAG/USD rally to $25.00
Silver price (XAG/USD) seesaws around one-year high, making rounds to $25.00 during Wednesday’s initial Asian session after rising the most in three weeks the previous day.
In doing so, the bright metal portrays the market’s cautious mood ahead of the key US ISM Services PMI and ADP Employment Change for March. Also challenging the XAG/USD bulls are the signals from the options market suggesting the buyer’s doubt about the latest run-up in the bright metal’s prices.
That said, a one-month risk reversal (RR) of the Silver price, a gauge of the spread between the call and put options, prints the first daily loss mark in five while marking the -0.390 figure by the end of Tuesday’s North American session. It’s worth noting, however, that the weekly RR up for the fourth consecutive time, to 0.2000 by the press time, whereas the monthly options market signals are also firmer so far in April after posting the biggest gains in a year in March.
Hence, the short-term traders of the XAG/USD seem to have a lesser liking for the latest run-up in the Silver price, which in turn may trigger the quote’s pullback in a case where the scheduled US data print firmer outcomes and allow the US Dollar to rebound.
Also read: Silver Price Analysis: XAG/USD buyers eye $25.00 after breaking resistance around $24.25
-
23:29
GBP/USD Price Analysis: Bulls have limited room towards the north, 1.2550 in focus
- GBP/USD bulls take a breather at 10-month high, seesaws after rising the most in three weeks.
- Clear upside break of 1.2445-50 horizontal hurdle, bullish MACD signals favor Cable pair buyers.
- Rising wedge, overbought RSI teases sellers to take a risk and aim for 50-DMA, 100-DMA convergence.
GBP/USD buyers sit tightly in the driver’s seat while riding along the lines of the highest levels since June 2022, sidelined near 1.2500 during early Wednesday.
The Cable pair marked the biggest daily gains in three weeks the previous day after crossing an important horizontal resistance comprising multiple tops marked since mid-December 2022, now immediate support around 1.2450-45. Adding strength to the upside momentum were the bullish MACD signals.
It’s worth noting, however, that the RSI (14) line is near the overbought territory and suggests a pullback in the GBP/USD prices before mark the next leg towards the north. Also teasing the Cable pair sellers is the existence of a one-month-old rising wedge bearish chart pattern, currently between 1.2550 and 1.2390.
Should the quote drops below 1.2390, it confirms the bearish formation and can refresh the 2023 bottom, around 1.1800 by the press time. However, a convergence of the 50-DMA and the 100-DMA, close to 1.2155-50 acts as an important support to watch during the anticipated fall.
On the flip side, a clear upside break of the 1.2550 hurdle, comprising the stated wedge’s top line, defies the bearish chart pattern and can propel the GBP/USD prices toward the May 2022 high of around 1.2665.
That said, the 1.2600 round figure and September 2020 low near 1.2675 act as extra upside filters for the Cable pair buyers to watch during the quote’s further upside.
GBP/USD: Daily chart
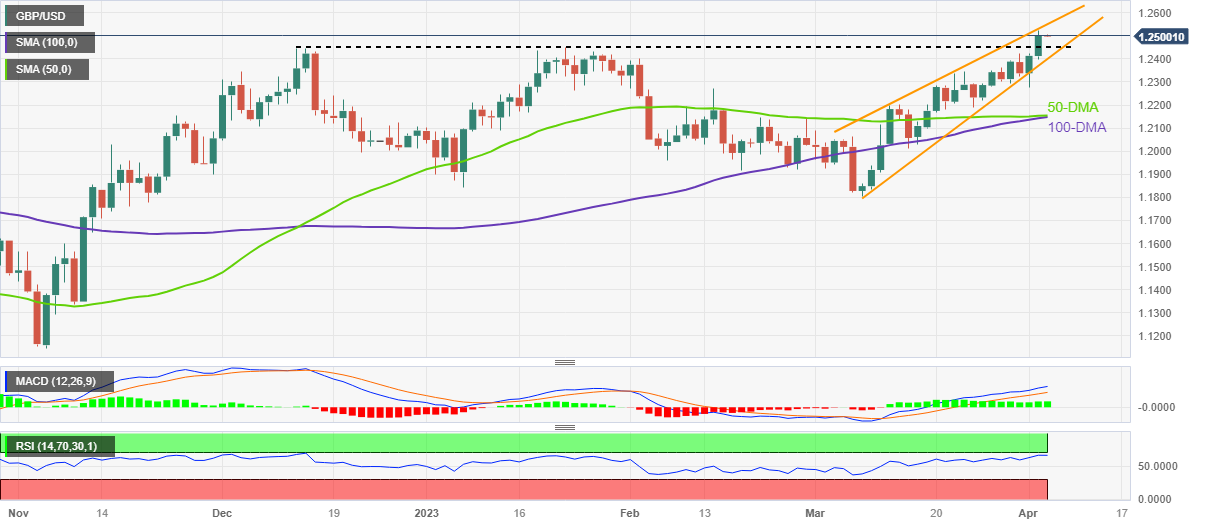
Trend: Limited upside expected
-
23:09
EUR/USD turns sideways around 1.0950 as investors await US Employment for fresh impetus
- EUR/USD is oscillating around 1.0950 ahead of US Employment and ISM Services PMI data.
- A significant decline in US Job Opening indicates that the US labor market is cooling now.
- The ECB would continue hiking rates as a recent jump in the oil price could spark Eurozone inflation.
The EUR/USD pair is displaying a sideways action after an upside move above 1.0970 in the early Asian session. The shared currency pair is expected to continue its lackluster move as investors are awaiting the release of the United States Automatic Data Processing (ADP) Employment and ISM Services PMI data.
S&P500 ended Tuesday’s gains with decent losses as investors turned cautious ahead of US economic reports, portraying a drop in the risk appetite of the market participants. The US Dollar Index (DXY) has refreshed its monthly low near 101.46 as investors are anticipating the maintenance of status-quo by the Federal Reserve (Fed) for its May monetary policy meeting.
As per the CME Fedwatch tool, chances for an unchanged interest rate decision stand near 60%. The Fed is required to shift its focus towards contracting manufacturing activities to safeguard the United States economy from falling into recession. The release of the US economic data on Wednesday would provide more clarity.
According to the consensus, the US economy has added fresh 200K jobs in March than the former additions of 242K. Hopes for one more rate hike from the Fed could be propelled if the US labor market continues to remain tight. However, the release of weak Job Openings data on Tuesday indicates that the labor market is cooling now. Data released on Tuesday indicates lower talent acquisition requests at 9.9 million, compared to 10.5 million in January and 10.4 million as expected by the market participants.
In addition to US Employment data, US ISM Services PMI will also keep investors busy. The US ISM Services PMI (Mar) is expected to contract to 54.5 from the former release of 55.1. Also, New Orders Index that reflects forward-demand would drop to 57.6 from the prior release of 62.6.
On the Eurozone front, European Central Bank (ECB) policymakers would get delighted as consumer inflation expectations for the next 12 months fall to 4.6% in February vs. 4.9% in January. However, it seems that the data has yet not incorporate the recent rise in the oil price, which could have spoiled the mood. Therefore, ECB President Christine Lagarde would continue hiking rates ahead.
-
23:07
NZD/USD traders await the RBNZ
- NZD/USD is in the hands of the bulls in the 0.63s.
- RBNZ is going to be the main scheduled event for the day ahead.
The New Zealand Dollar rallied to the highest levels in over six weeks, amid a weakening US Dollar and poor US data. At the time of writing, NZD/USD is sitting in the 0.63 area, although as analysts at ANZ Bank said, ´´it is struggling to capitalize on the freefall in the USD DXY (which is approaching February’s low) in the wake of soft JOLTS jobs data there, and fresh financial instability fears.´´
The greenback was pressured after a plunge in US factory activity raised concerns over slowing economic growth. The US manufacturing PMI fell in March to the lowest since May of 2020. US factory orders declined for a second straight month, down 0.7% in February after falling 2.1% in January from the 1.7% jump in December. This data comes on the heels of the Institute for Supply Management (ISM) that yesterday reported that its Manufacturing PMI fell to 46.3 last month. This was the worst since May 2020, from 47.7 in February. Last week’s PCE data, the Federal Reserve´s preferred inflation measure, was also mixed and weighed on the greenback. However, while headline and core both came in a tick lower than expected, super core accelerated for a second straight month to 4.63% YoY which is the highest since October. ´´This is not the direction that the Fed desires and so we look for the hawkish tilt in Fed comments to continue,´´ analysts at Brown Brothers Harriman explained.
RBNZ in focus
´´While the Kiwi is at the upper end of recent trading ranges, it is well off its February high, and it has underperformed on major crosses,´´ analysts at ANZ Bank said. ´´A bullish take on that is that there is plenty of room for that gap to be closed without significant technical barriers. A hawkish RBNZ today might help with that today, especially if the focus is on rebuilding and resilience, rather than engineering a recession. But what happens in the US matters an awful lot too!´´
´´We continue to forecast the OCR to peak at 5.25% with one further hike in May. Yesterday’s release of the Quarterly Survey of Business Opinion provided little to suggest any change to how the RBNZ behaves today. Business sentiment has improved, lifting off a record low. However, 61% of respondents expect conditions to deteriorate, versus 74% in Q4 and a historical average of -7%,´´ the analysts said.
It is wirth noting that the RBNZ has lifted its policy rate by a total of 450 basis points, bringing the cash rate to a 41-year record of 4.75%, well above the RBNZ's medium-term target of 1%-3%.
-
23:04
AUD/USD prods pullback from five-week high near 0.6750, RBA’s Lowe, US data eyed
- AUD/USD licks its wounds after posting RBA-induces losses near five-week high.
- RBA paused rate hike trajectory and called the Aussie bears, RBA Statement defends hawks.
- Softer US data, positive sentiment and challenges to US Dollar’s reserve currency status drown US Dollar.
- RBA’s Lowe need to defend hawkish Statement to recall Aussie pair buyers, US data important too.
AUD/USD bears take a breather around mid-0.6700s during early Wednesday as traders await Reserve Bank of Australia (RBA) Governor Philip Lowe’s speech after the Aussie central bank paused the rate hike trajectory and pleased sellers the previous day.
After 10 consecutive rate increases, the RBA announced the status quo of its current monetary policy with the benchmark rate being 3.60% at the latest. In doing so, the Australian central bank justifies the recent downside of Australian inflation and Retail Sales data while also saying, “Board expects that some further tightening of monetary policy may well be needed.”
Risk-on mood joins news suggesting recent challenges to the US Dollar’s reserve currency status appear to weigh on the greenback.
Bloomberg released a news report suggesting the US Dolllar’s less acceptance as a reserve currency in Russia while highlighting the greenback’s latest weakness. “Chinese Yuan has surpassed the US Dollar as the most traded currency, in monthly trading volume, for the first time in Russia in February,” said the news while also adding that the gap has continued to widen in March.
In the last week, Brazil and China agreed to pause the US Dollar’s usage as an intermediary in trade transactions.
Alternatively, Russian Foreign Minister Sergei Lavrov raised fears of escalating Moscow-Brussels tussle by saying, “The European Union (EU) has "lost" Russia.” The policymaker also added that Moscow will deal with Europe in a tough fashion if need be. The US-China tension is also on the spoke as Beijing keeps reiterating its dislike for the US-Taiwan ties but Washington seems to ignore it. China’s Consulate General in Los Angeles spokesperson criticized a meeting between Taiwan President Tsai Ing-wen and US House Speaker Kevin McCarthy on early Tuesday.
Talking about the data, US Factory Orders for February came in -0.7% MoM versus -0.5% expected and downwardly revised -2.1% prior. Further, the US JOLTS Job Openings dropped to the lowest levels since May 2021 while flashing 9.931M figure for February versus 10.4M expected and 10.563M revised prior.
Amid these plays, Wall Street closed in the red while the yields are down amid softer US data.
Moving on, RBA Governor Lowe’s speech will be crucial for the AUD/USD pair traders to watch as traders will look for clues of how the policymakers may renew the rate hike trajectory, which in turn can propel the Aussie price.
On the other hand, US ISM Services PMI for March and ADP Employment Change for the said month will be important for any sign of recovery of the US Dollar.
Also read: US ADP Jobs/ISM Service PMI Preview: Slowing but still positive
Technical analysis
Despite the latest pullback, the AUD/USD prices remain beyond the 200-DMA support of 0.6745, which in turn suggests the recovery towards a convergence of the 100-DMA and 50-DMA surrounding 0.6805.
-
22:59
WTI holds above $80.00 per barrel as traders digest OPEC+ cuts, weak global PMIs
- On Tuesday, soft US economic data increased worries about a curtailed oil demand.
- US crude oil inventories withdrew more than 4 million barrels last week.
- WTI Price Analysis: The breaks of a 7-month-old downslope resistance trendline can pave the way for further gains.
Western Texas Intermediate (WTI) holds to its previous day’s gains, clings above the $80.00 per barrel psychological level as traders diggest over-the-weekend news of the OPEC planned cuts. WTI is trading at $80.96 PB, gains 0.71%.
Wall Street finished Tuesday’s session with losses after US jobs data revealed a deceleration in the labor market. The US JOLTs report showed a decrease in job openings of 632,000 from January’s 10.6 million to 9.9 million in February. Factory Orders plunged 0.7% MoM in February, slightly improving after January’s 2.1% plunge.
Given the backdrop and the recent release of global manufacturing PMIs weakening, it raised concerns about oil demand.
The commodities complex rose, led by Gold prices (XAU/USD) reaching new YTD highs at $2,025.17, while Silver (XAG/USD) broke the $25.00 mark.
Latest data revealed by the Organization of Petroleum Exporting Countries (OPEC), brought the total volume of cuts to 3.66 million BPD, including a 2 million barrel cut in October 2022, equal to about 3.7% of global demand.
In the meantime, US crude oil inventories withdrew more than 4 million barrels last week, according to sources citing American Petroleum Institute figures.
Furthermore, money market futures expect the US Federal Reserve to keep rates unchanged at 5.00%.
WTI Technical analysis
Following the OPEC+ crude oil output headline, WTI gapped over $6.00, breaking a 7-month-old downslope resistance trendline. That lifted WTIs towards $80.00 PB. Nevertheless, for a bullish continuation, buyers need to crack the YTD high at $81.75, which would clear the path to test the November 7 high at $93.73. On the flip side, any falls below $80.00 could send WTI’s diving towards $75.00.
-
22:00
South Korea FX Reserves above expectations (424.64B) in March: Actual (426.07B)
-
21:53
Gold Price Forecast: XAU/USD bulls jump on US Dollar weakness, busting out of the coil
- Gold price busts out of the coil.
- Gold price bulls eye higher still but a pull back could be warranted.
Gold price climbed to the highest in more than a year on Tuesday, finally busting through and holding above the $2,000 mark as the US Dollar and bond yields fell. Yet more US data weighed on the greenback and consequently helped the yellow metal rally out of a coiled formation. At the time of writing, the Gold price is trading at $2,020 and is 1.8% higher.
US job openings in February fell to the lowest level in nearly two years and there was a continued decline in factory orders. Job openings, a measure of labor demand, decreased from 632,000 to 9.9 million on the last day of February, the lowest since May 2021, according to the monthly Job Openings and Labor Turnover Survey, or JOLTS report. ´´he largest drop in openings was in professional and business services, followed by healthcare. Accommodation and food services, saw openings fall back to the middle of 2022 levels. Construction job openings picked up despite the sector’s interest rate sensitivity,´´ analysts at ANZ Bank said.
US factory orders declined for a second straight month, down 0.7% in February after falling 2.1% in January from the 1.7% jump in December. This data comes on the heels of the Institute for Supply Management (ISM) that yesterday reported that its Manufacturing PMI fell to 46.3 last month. This was the worst since May 2020, from 47.7 in February.
The data echoed, in part, last week’s PCE data, the Federal Reserve´s preferred inflation measure, which was mixed. However, while headline and core both came in a tick lower than expected, super core accelerated for a second straight month to 4.63% YoY which is the highest since October. ´´This is not the direction that the Fed desires and so we look for the hawkish tilt in Fed comments to continue,´´ analysts at Brown Brothers Harriman explained.
Meanwhile, the rate futures market priced in a roughly even chance of a 25 basis-point rate hike in May, with rest of the odds tilted towards a pause from the Fed. On Monday, the probability of a 25-bp hike was more than 65%. The money markets have also factored in Fed cuts by end-December. In late morning trading, the US Dollar index dropped to a two-month low of 101.45 DXY and was last down 0.39% at 101.64.
Gold technical analysis
As per the pre-market open weekly Gold price analysis, Gold, Chart of the Week: XAU/USD bulls remain in control, the Gold price indeed rallied:
Prior Gold price analysis
We had a bullish pennant on the daily and 4-hour charts:
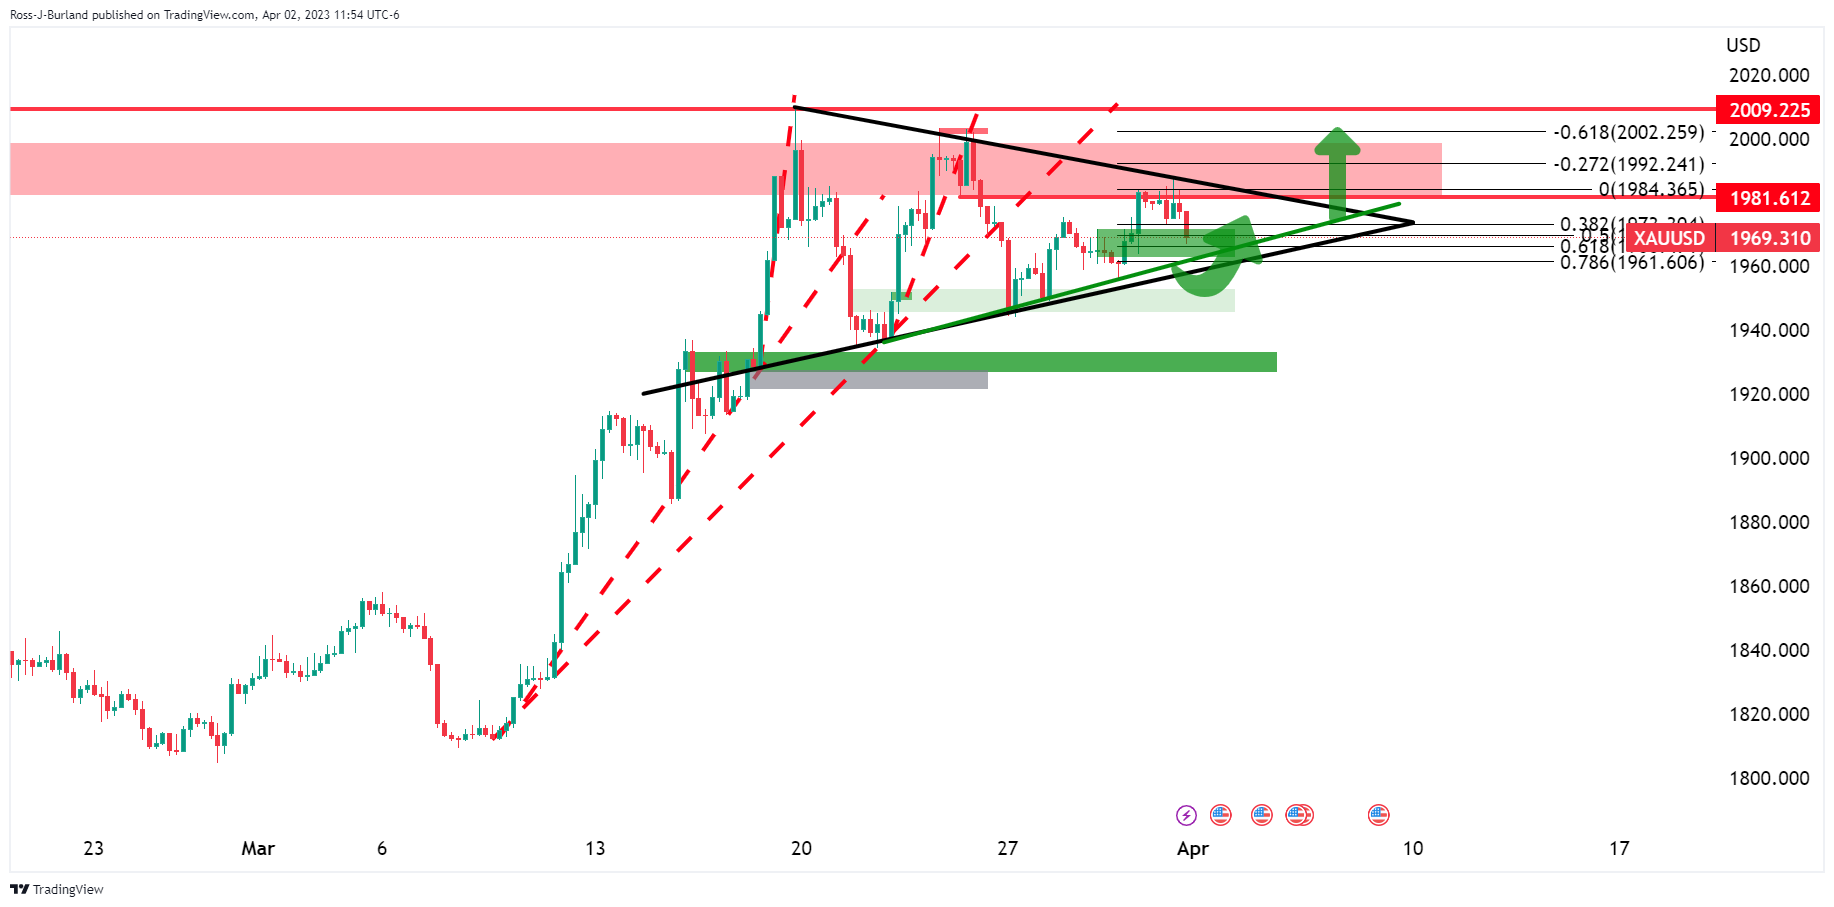
Gold price updates

The Gold price bulls were back in the market after an anticipated drive from around the supporting area. The Gold price bulls needed to commit at this juncture to get and stay above $2,010.
Gold price update, live chart
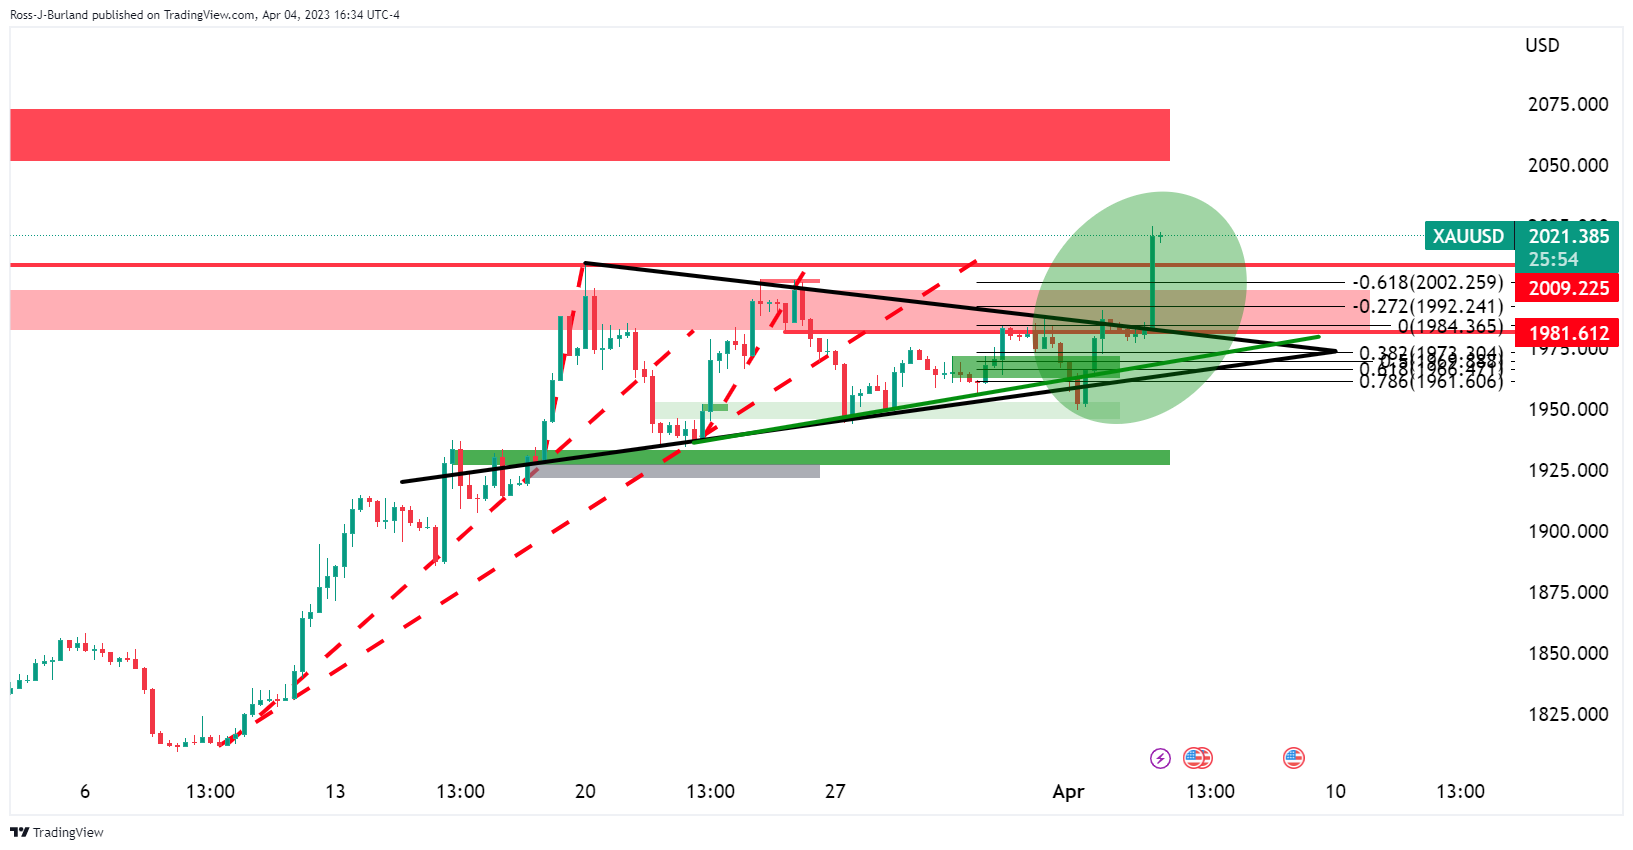
The bullish pennant thesis played out as illustrated in the live chart above.
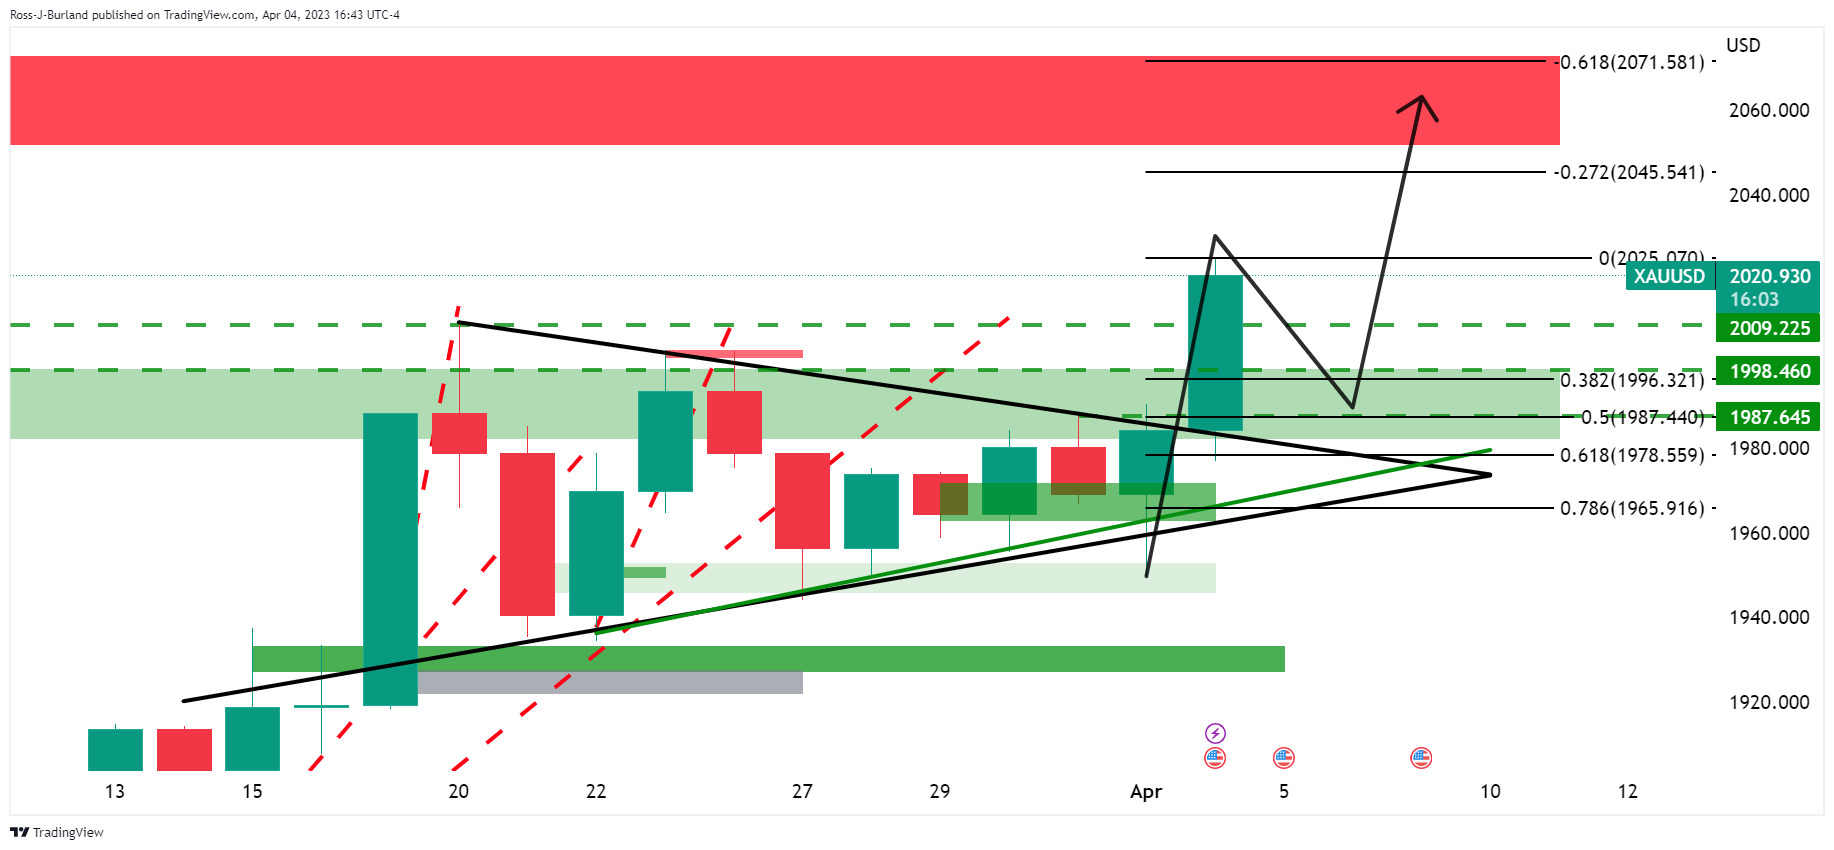
On the following daily chart, the price has rallied through resistance, and if there is not just a continuation right off the bat into $2,050s, then the Fibonacci scale comes into play. We have the 38.2% Fibonacci retracement aligned with the $2,000 area that could come back under pressure for a retest, if not lower, prior to the next bullish impulse and an eventual upside continuation:
-
21:47
Forex Today: Dollar under pressure, Gold jumps and US yields tumble
Data from the US weighed on the US Dollar, which remains under pressure ahead of more employment figures, including NFP on Friday. The ADP Employment report is due on Wednesday. The key event on Asian hours will be the Reserve Bank of New Zealand’s decision. RBA Lowe will speak after the central bank's pause. The Greenback looks set to extend losses but could receive help from the new economic reports.
Here is what you need to know on Wednesday, April 5:
The US Dollar Index posted the lowest close in two months on Tuesday after falling for the second day in a row. Economic data did not help the Dollar on Tuesday. The JOLTs report showed job openings fell to 9.93 million, the lowest level since May 2021, while Factory Orders fell by 0.7%.
The US economic figures pushed US yields further to the downside and were not cheered by Wall Street. The Dow Jones lost 200 points or 0.59%, the Nasdaq declined by 0.52%, and the S&P 500 by 0.58%.
The Japanese Yen outperformed during the American session, favored by lower yields and the deterioration in market sentiment. As a result, USD/JPY lost ground for the second day in a row, breaking below 132.00.
EUR/USD continued to move higher and approached 1.1000. The Pound also outperformed as GBP/USD jumped to 1.2500, breaking decisively above December and January highs.
The Australian Dollar weakened following the pause from the Reserve Bank of Australia (RBA); however, the AUD/USD still looks bullish, holding above 0.6720. RBA Governor Lowe will speak on Wednesday.
On Wednesday, the Reserve Bank of New Zealand will announce its decision. A 25 basis points rate hike to 5% is expected. NZD/USD is trading above 0.6300, at the highest since mid-February.
RBNZ Preview: Forecasts from eight major banks, decelerating hikes as recession is looming over New Zealand
Crude oil prices finished flat on Tuesday, holding on to Monday’s rally following the OPEC+ output cut. If prices resume the upside, it would be another problem for central bankers around the world.
Gold bulls welcomed lower US yields. XAU/USD finally rose above $2,000, and it holds near the recent highs at the $2,020 area, with a strong momentum. Silver joined the rally, and soared to $25.00, the highest level in a year.
Like this article? Help us with some feedback by answering this survey:
Rate this content -
21:39
United States API Weekly Crude Oil Stock climbed from previous -6.076M to -4.346M in March 31
-
20:34
USD/MXN rises above 18.1000 despite a soft USD
- The US JOLTs report showed a decrease of 632,000 job vacancies in February.
- Factory Orders in the US fell in February, caused by higher borrowing costs.
- Money market futures estimate a 57% chance of a pause in the Fed’s tightening cycle.
Despite the greenback’s weakness, the Mexican Peso (MXN) losses ground vs. the US Dollar (USD). Deterioration in market sentiment and worse-than-expected economic data from the United States (US) spurred capital outflows from emerging market economies. At the time of writing, the USD/MXN is trading at 18.1170, above its opening price by 0.34%.
USD/MXN climbs on risk-off mood
US equities remain to trade in negative territory, while US Treasury bond yields plunge. Data released by the US Department of Labor showed that job vacancies dropped by 632,000 to 9.9 million, as shown by February’s JOLTs report. At the same time, Factory Orders fell in February, dropping 0.7% MoM, slightly recovering from January’s 2.1% plunge.
Following the latest reports, investors increased their bets that the US Federal Reserve (Fed) will pause its tightening cycle. Money market futures estimate a 57% chance of a pause, compared to Monday’s 43% odds. The forecast for 25 bps lies at a 43% chance.
The US Dollar Index (DXY), a gauge that measures the performance of six currencies vs. the American Dollar (USD), drops 0.44% and sits at 101.591, sponsored by falling US Treasury bond yields. The US bond yields plunge was spurred by traders repricing a less aggressive Federal Reserve.
An absent Mexican economic docket left USD/MXN traders adrift to sentiment and US Dollar dynamics. Bad news for the US economy is beginning to weigh on the greenback, with investors shifting towards growth as inflation cools.
USD/MXN Technical analysis
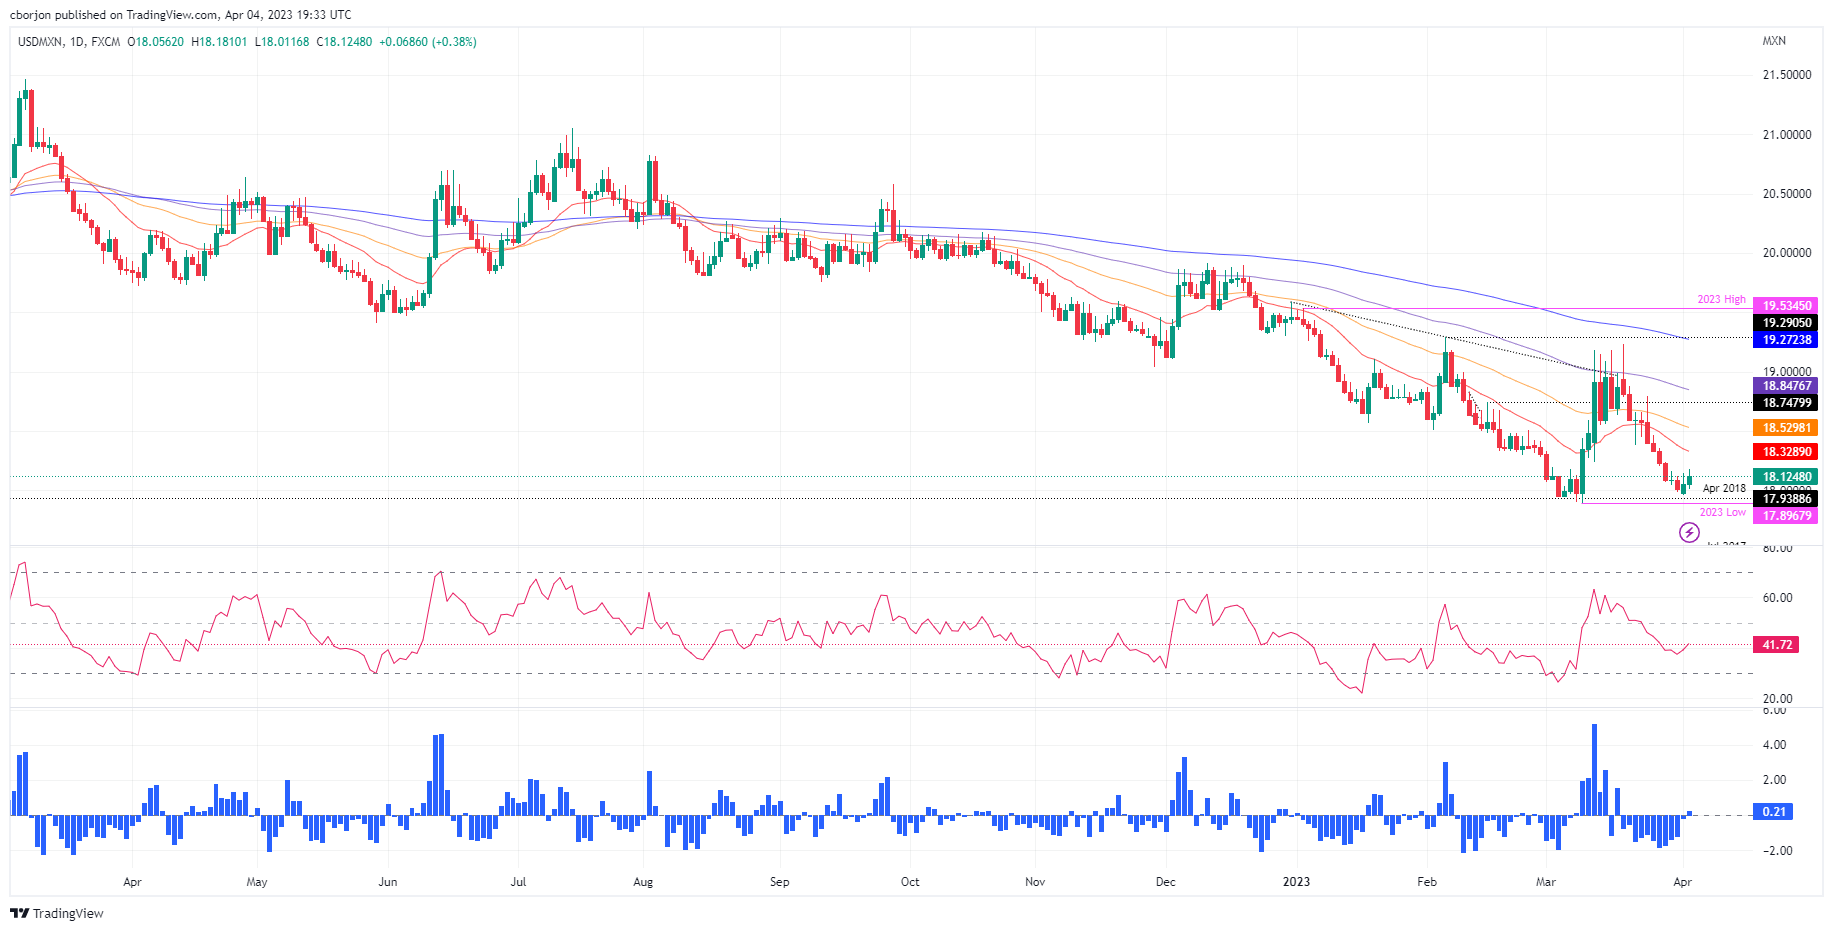
The USD/MXN appears to have bottomed at around the weekly low of 17.9644, reached on Monday. A double bottom emerged though the USD/MXN needs to reclaim the 20, 50, and 100-day EMAs in the near term, so the chart pattern could remain in play. Therefore, if the USD/MXN cracks the 100-day EMA at 18.8477, that could open the door for further upside. That said, the USD/MXN next resistance would be the 19.0000 figure, followed by the March 20 high at 19.2327 and the February 6 high at 19.2905, before aiming towards the YTD high at 19.5345.
-
20:32
USD/CHF Price Analysis: Bullish correction eyed, but bears to commit below 0.9150
- USD/CHF bears could be headed for a test of the 0.8920s.
- The bears will need to commit below 0.9150 on a correction.
As per the prior analysis, USD/CHF Price Analysis: Bears are in the market and eye a break of 0.9120, the bears stayed with the course and busted to lower levels as the following will illustrate.
USD/CHF prior analysis
USD/CHF daily chart

It was noted that the M-formation was bearish with the price struggling at the neckline resistance...
Update

USD/CHF H1, prior analysis chart
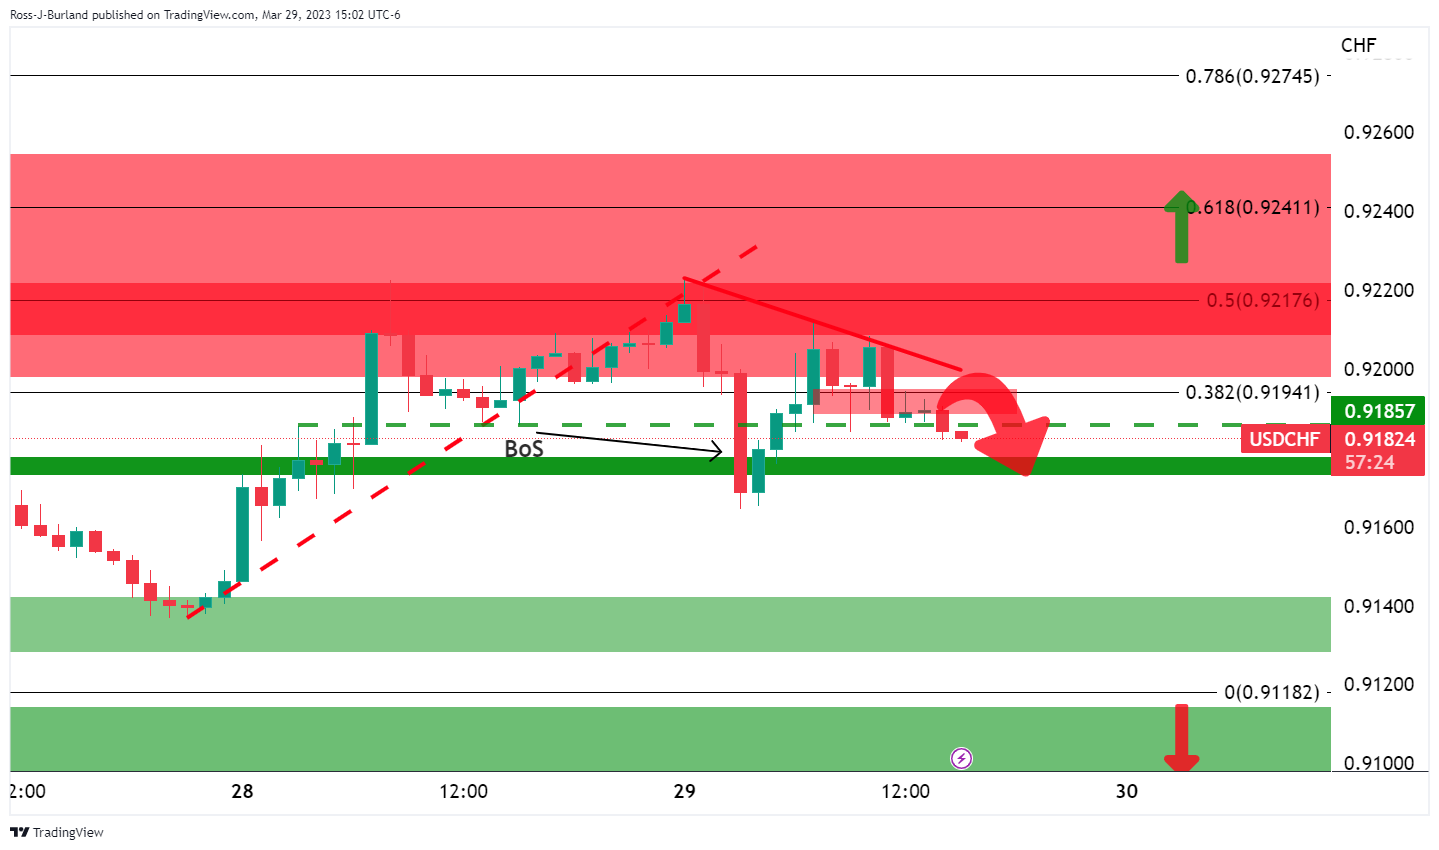
The resistance on the hourly chart was showing that the price was being resisted after the break of structure, BoS, from the prior day.
Update

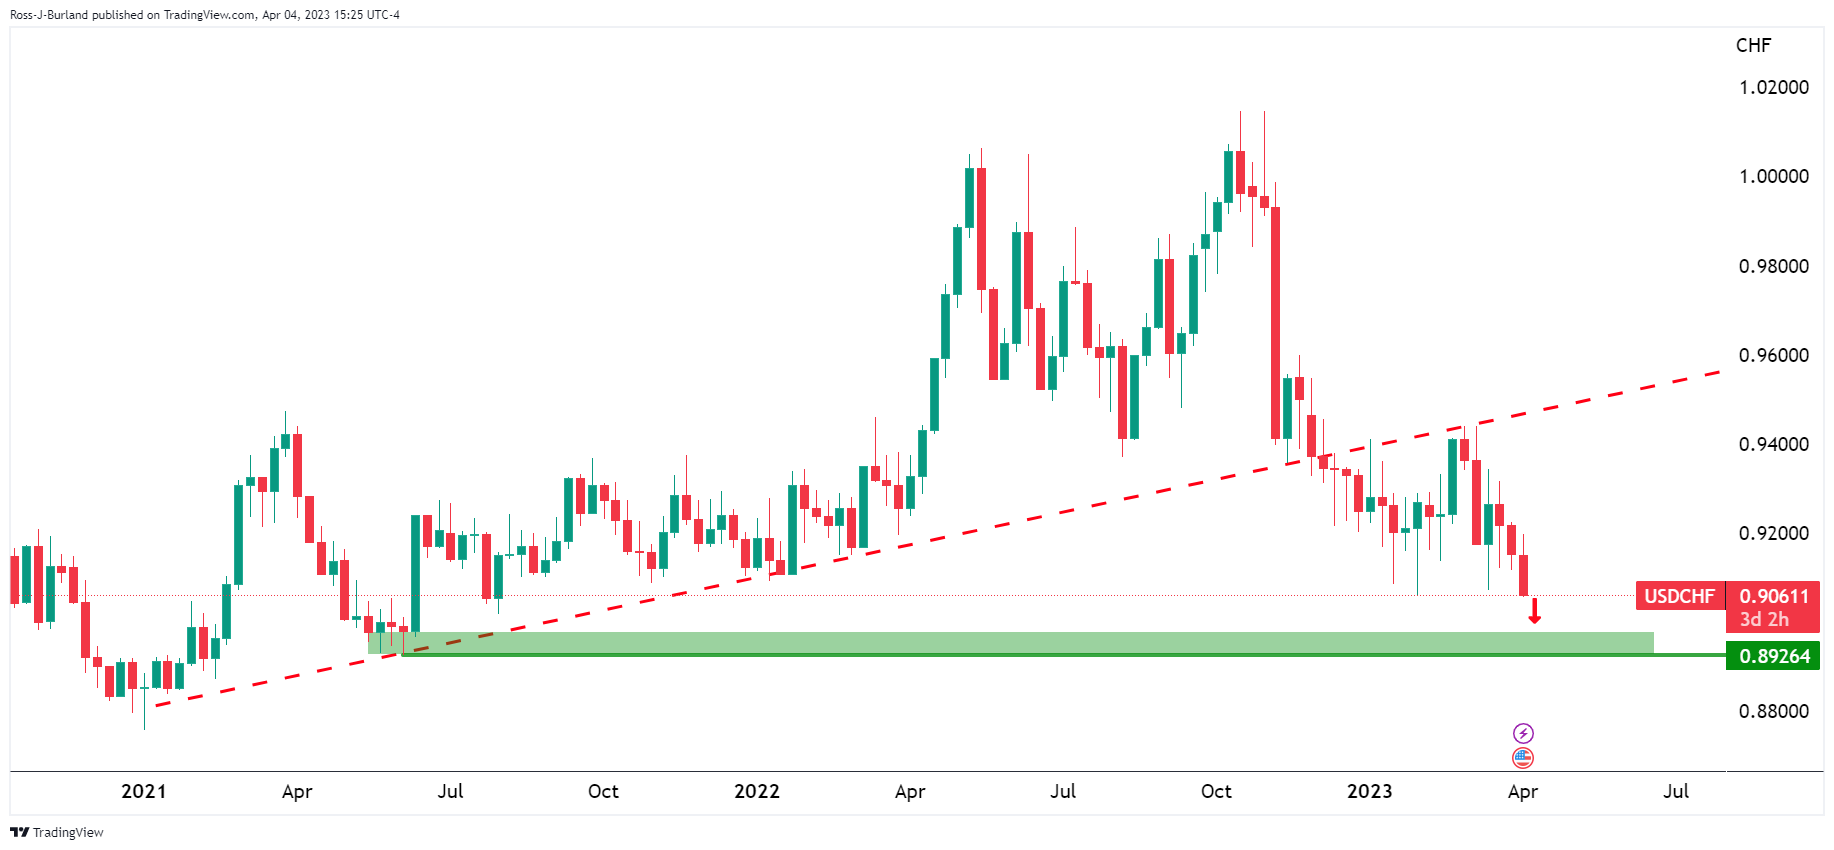
At this juncture, it would appear that the momentum is with the bears that are headed for a test of the 0.8920s as per the following weekly chart:
Meanwhile, the daily chart shows that the bears have broken structure as follows:
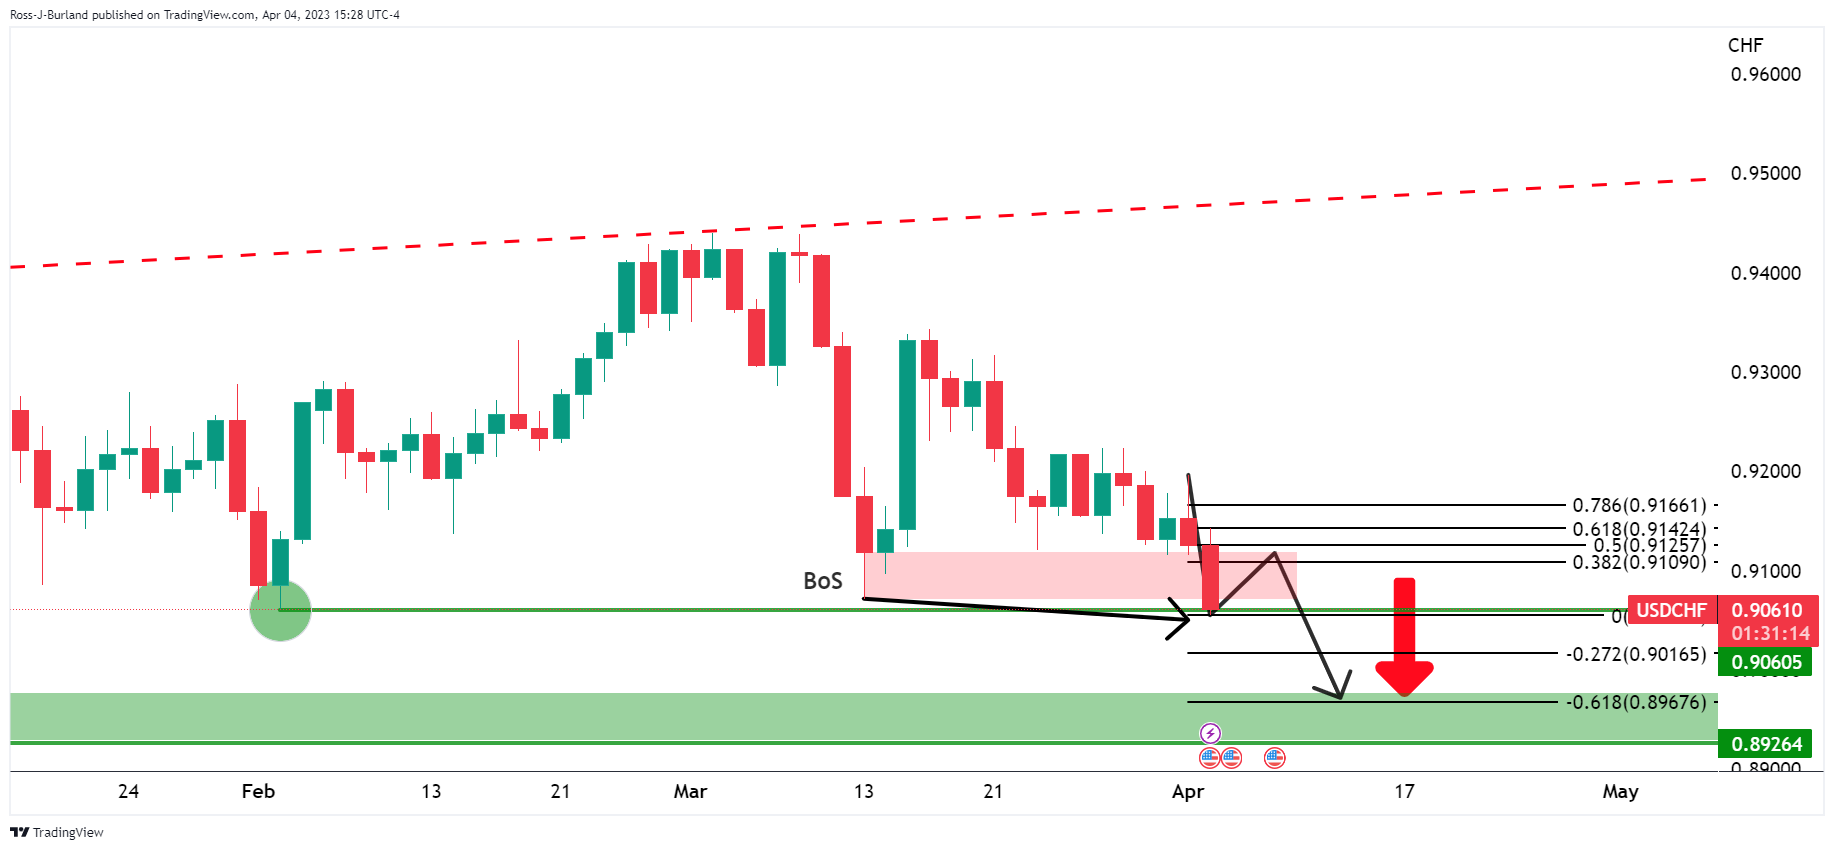
The bears are meeting prior support of 0.9060 and have pierced the level to 0.9055. There could be a correction here but if the bears commit below 0.9150, the likelihood will be for a downside continuation as per the weekly support area.
-
19:13
AUD/USD bears in the market but China could be its savior
- AUD/USD pressured by RBA rate decision.
- RBA held the policy rate at 3.60%.
- RBA Statement says inflation has peaked, labour market remains very tight, some further tightening may well be needed.
AUD/USD remains offered in the mid-US session morning with the Reserve Bank of Australia leaving interest rates unchanged Tuesday. The RBA's softer guidance over the need for further rate increases has reinforced expectations that it's close to or has ended its rate-rise cycle. At the time of writing, AUD/USD is trading at 0.6740 and down from 0.6793 highs. The pair fell to as low as 0.6720 after the rate decision.
However, the Aussie decline was slowed due to another drop in the US Dollar that tumbled to a two-month low on Tuesday in choppy trading. The US data is disappointing the bulls of late which are reinforcing investor bets that the Federal Reserve is nearly done with its own tightening cycle.
Data today showed that US job openings in February dropped to the lowest level in nearly two years. at the same time, there was a continued decline in factory orders. Job openings, a measure of labor demand, decreased 632,000 to 9.9 million on the last day of February, the lowest since May 2021, according to the monthly Job Openings and Labor Turnover Survey, or JOLTS report. U.S. factory orders declined for a second straight month, down 0.7% in February after falling 2.1% in January from the 1.7% jump in December. This data comes on the heels of the Institute for Supply Management (ISM) that yesterday reported that its Manufacturing PMI fell to 46.3 last month. This was the worst since May 2020, from 47.7 in February.
Meanwhile, last week’s PCE data, the Federal Reserve´s preferred inflation measure, were mixed. However, while headline and core both came in a tick lower than expected, super core accelerated for a second straight month to 4.63% YoY and is the highest since October. ´´This is not the direction that the Fed desires and so we look for the hawkish tilt in Fed comments to continue,´´ analysts at Brown Brothers Harriman explained.
Nevertheless, on Tuesday, the rate futures market priced in a roughly even chance of a 25 basis-point rate hike in May, with rest of the odds tilted towards a pause from the Fed. On Monday, the probability of a 25-bp hike was more than 65%. The money markets have also factored in Fed cuts by end-December. In late morning trading, the dollar index dropped to a two-month low of 101.45 DXY and was last down 0.39% at 101.64.
Not all bad for AUD
For the Aussie, MUFG currency analyst Lee Hardman said in a note that while the expectations are that the RBA is close to or has ended its rate-rise cycle, negative for AUD, ´´it's partially offset by bets other G10 central banks are at similar points.´´ He argues that ´´the AUD also remains driven more by the outlook for global growth, particularly for China's economy. Stronger growth in China as its economy continues to fully reopen this year supports our forecast for the Australian dollar to strengthen."
-
18:51
Silver Price Analysis: XAG/USD buyers eye $25.00 after breaking resistance around $24.25
- XAG/USD’s breakout of technical resistance opened the door to testing $25.00.
- XAG/USD’s pullback would expose a prior’s resistance trendline turned support around $24.25.
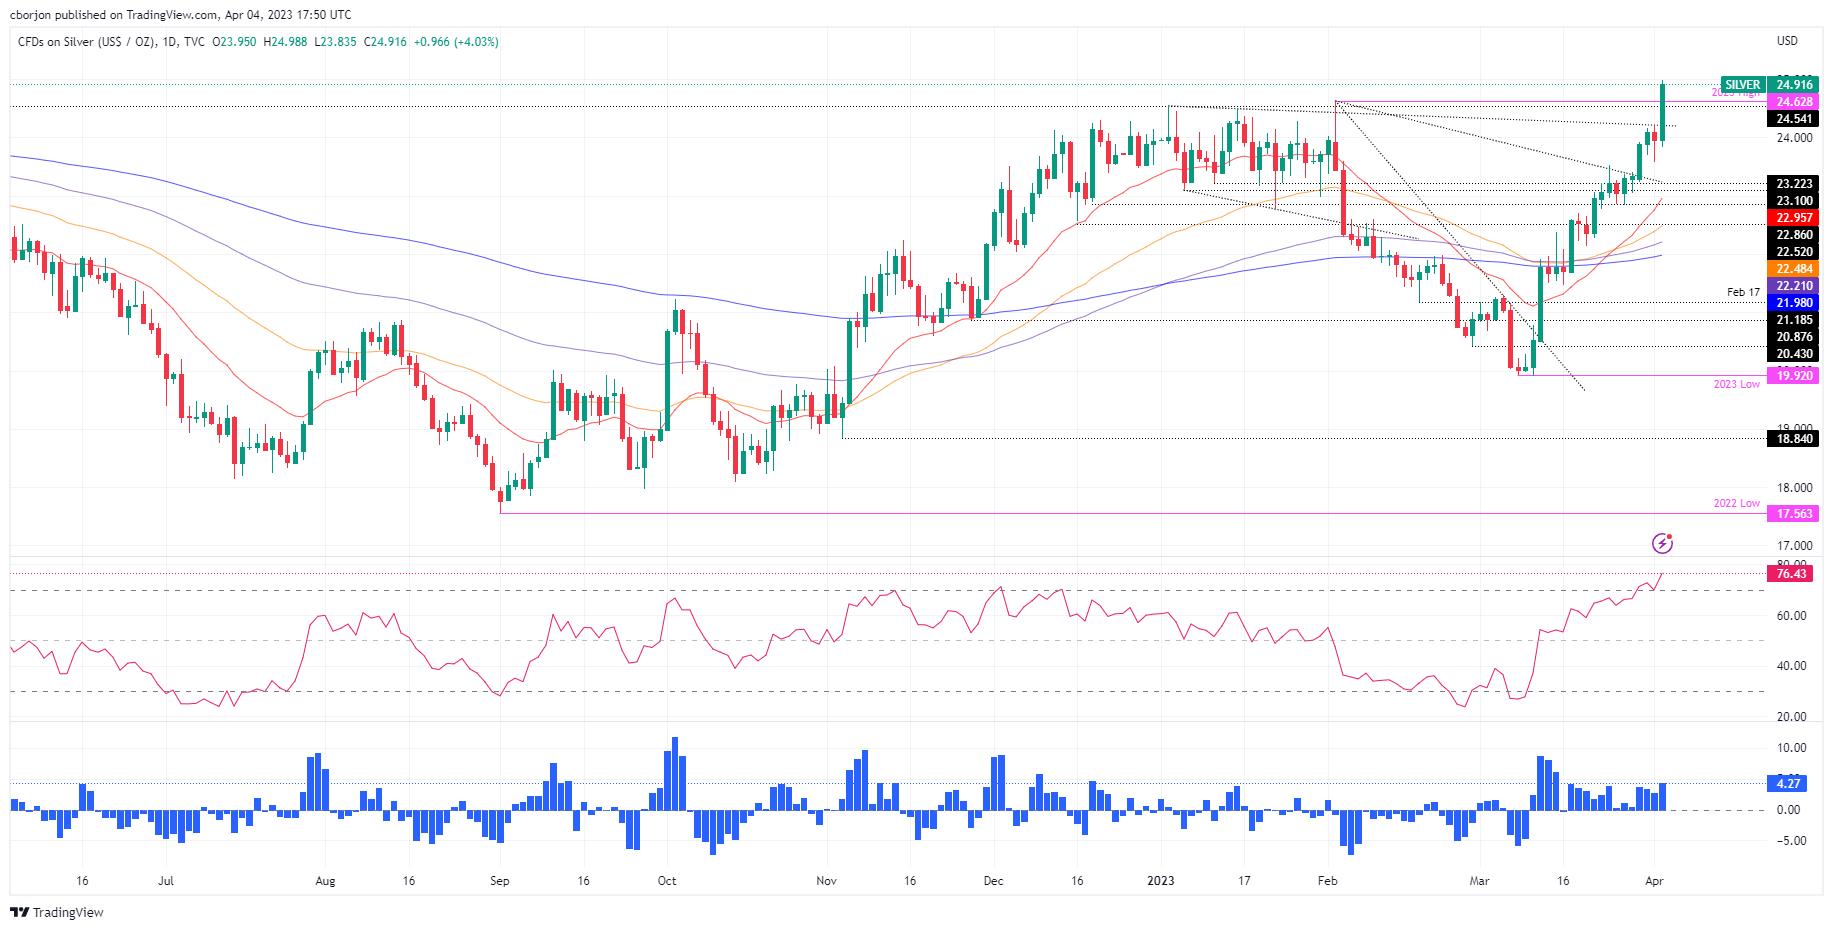
Silver price is eyeing to extend its gains past the $25.00 a troy ounce after hitting a new YTD high at $24.98. Since then, the XAG/USD retreaded some of those gains and hovers around the $24.80-$24.95 area, gaining 4.03%.
XAG/USD Price action
From a daily chart perspective, the XAG/USD is upward biased. The break of a four-month-old downslope resistance trendline opened XAG’s door to test the $25.00 mark, which, once cleared, could pave the way for further upside, with risks at April 18 daily high at $26.21, followed by 2022 high at $26.94.
Oscillators like the Relative Strength Index (RSI) entered overbought conditions, but remained below 80, seen as the overbought peak, after a strong uptrend. The Rate of Change (RoC) continues to push higher, though it remains shy of hitting its peak after the RoC soared after Silver’s bottom was around $19.92.
In the event of a pullback, XAG/USD’s first support would be the four-month-old resistance trendline turned support at $24.20-35, followed by the $24.00 psychological level. Once broken, that would exacerbate a dip towards the hanging man low at $23.57.
XAG/USD Daily chart
XAG/USD Technical levels
-
18:01
EUR/USD rises above 1.0900 on growing speculation for a Fed pause
- US JOLTs reports revealing a drop of 32,000 job openings, increasing assumptions that the labor market is cooling.
- The US Department of Commerce reported a 0.7% MoM drop in orders.
- ECB’s Makhlouf: The impact of rate hikes is “well underway,” as it emphasizes that the ECB must be ready to tackle inflation.
The EUR/USD edges above the 1.0900 figure for the second consecutive day after data from the United States (US) shifted expectations that the US Federal Reserve (Fed) would pause its tightening cycle. At the time of writing, the EUR/USD is trading at 1.0947 after hitting a low of 1.0882.
EUR/USD rises above 1.0900 as bad US economic data turns negative for the US Dollar
Sentiment shifted sour as of late after a round of labor market data in the US has shown signs of cooling down. Job openings in February, reported in the JOLTs reports, dropped from 10.4 million to 9.931 million, a drop of 32,000. This could be a prelude that the labor market is cooling. Further data will be revealed during the week, with ADP Employment figures shown on Wednesday, followed by Initial Jobless Claims and the US Nonfarm Payrolls report.
At the same time, Factory Orders in the US dropped for the second straight month. Orders plummeted 0.7% MoM, worst than the estimated 0.5% decrease, as the US Department of Commerce reported.
The EUR/USD rose from 1.0886 towards 1.0973, its daily high, before stabilizing at around 1.0947, sponsored by broad US Dollar weakness. The US Dollar Index, which tracks the value of a basket of six currencies vs. the American Dollar (USD), falls 0.41%, at 101.628, blamed on falling US T-bond yields.
On the European front, the Producer Price Index (PPI) for February continued its downward trend, while the German Balance of Trader for the same period remained flat at €16B. In the meantime, the European Central Bank (ECB) Governing Council member, Gabriel Makhlouf, said that the impact of higher borrowing costs is “well underway.” He added that the ECB must remain steadfast and ready to act as required” to ensure inflation returns to target over the medium-term.
EUR/USD Technical analysis
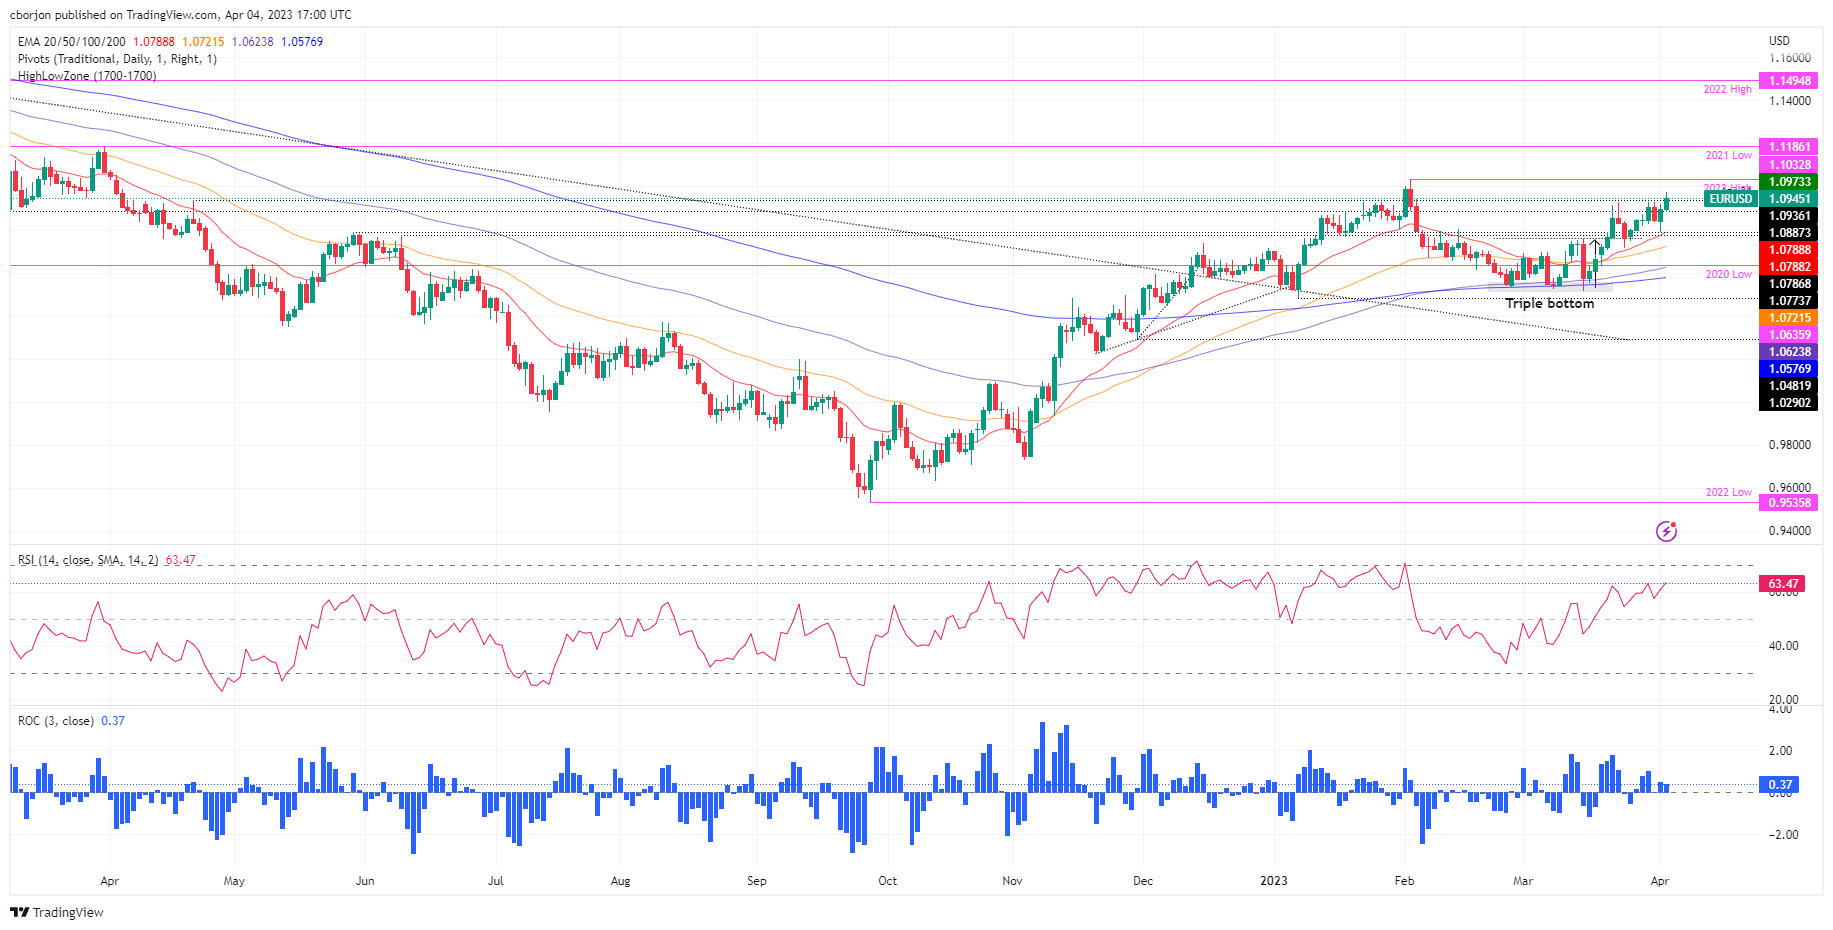
From a daily chart perspective, the EUR/USD triplet bottom remains in play, targeting 1.1000. On Monday, the EUR/USD dipped and tested the 20-day EMA at 1.0788 before skyrocketing above 1.0900. That exacerbated a continuation of the uptrend and has opened the door for further upside. The EUR/USD first resistance would be 1.0973, followed by 1.1000, and then the YTD high at 1.1033. On the other hand, the EUR/USD first support would be 1.0900, followed by the 20-day EMA At 1.0788.
-
17:31
USD/CAD rises above 1.3450 despite broad USD weakness
- USD/CAD gained traction and climbed above 1.3450 in the American session.
- The US Dollar Index stays deep in negative territory below 102.00 after weak US data.
- WTI declined to $80 area following earlier advance.
Following Monday's sharp decline, USD/CAD stayed relatively quiet during the European trading hours on Tuesday. After retreating toward 1.3400 in the early American session, however, the pair regained its traction and turned positive on the day above 1.3450.
The data from the US revealed on Tuesday that Factory Orders declined at a faster pace than expected in February. More importantly, the US Bureau of Labor Statistics reported that job openings on the last day of February dropped to 9.9 million from 10.5 million in January, pointing to softening in labor market conditions. In turn, the US Dollar (USD) came under heavy selling pressure and the US Dollar Index fell to its lowest level since early February below 101.50.
Despite the persistent USD weakness, USD/CAD managed to reverse its direction with the commodity-sensitive loonie struggling to find demand amid retreating crude oil prices.
The barrel of West Texas Intermediate (WTI), which touched its highest level in over two months near $82, was last seen trading in negative territory at around $80.00. Later in the session, the American Petroleum Institute's Weekly Crude Oil Stock report will be watched closely by market participants.
Meanwhile, Wall Street's main indexes stretch lower after a mixed opening, helping the USD stay resilient against the CAD.
Technical levels to consider
-
17:00
USD/JPY drops to six-day lows near 131.50 as US yields tumble
- US economic data triggered a rally in US Treasury bonds.
- DXY boke below 102.00 to the lowest since early February.
- USD/JPY drops for the second day in a row, down more than 200 pips from the weekly high.
The USD/JPY fell sharply after the release of US economic data pointed to a slowdown. The pair tumbled from 132.80 to 131.53, reaching the lowest since March 29.
The pair remains under pressure under 131.80, with the US Dollar weaker across the board. The DXY is falling 0.48%, trading at 101.57, on its way to the second-lowest daily close since May 2022.The JOLTs report showed a decline to 9.9 million job openings, the lowest reading in two years. In a different report, Factory Orders dropped for the second month in a row, by 0.7% below the slide expected of 0.5%. The ADP Employment report and the ISM Service Sector PMI are due on Wednesday.
After the reports, US yields sank. The US 10-year yield dropped to 3.35% and the 2-year to 3.84%. The moves in the bond market boosted the Japanese currency which rose across the board.
Technical indicators in USD/JPY 4-hour chart point to another test of the daily lows around 131.50. A break lower would expose the next support that is seen at the 131.10 area. The Dollar needs to regain levels above 132.50 to alleviate the bearish pressure.
Technical levels
-
16:50
GBP/USD hits a new YTD high above 1.2500 on upbeat sentiment, weak US jobs data
- GBP/USD remains trading nearby the YTD highs hit at 1.2525.
- US JOLTs reports drop to the lowest level in two years; could this be a prelude to a jump in the Unemployment Rate?
- BoE Pill focused on incoming data to decide his stance at the May meeting.
The Pound Sterling (GBP) climbs above 1.2500 and hits a new YTD high at 1.2525, on risk on impulse in the FX space and overall US Dollar (USD) weakness. Economic data released in the United States (US) flashes the economy is slowing down, a headwind for the greenback. At the time of writing, the GBP/USD is trading at 1.2499, above its opening price by 0.72%.
GBP/USD stays positive, despite sentiment shifting sour
Wall Street reversed its course and turned red. The US JOLTs reports, sought by the US Federal Reserve (Fed) as they monitor labor market data, dropped to their lowest level in two years. Figures showed a decrease of 32K to 9.9 million job openings on the last day of February, its lowest since May 2021. Meanwhile, Factory Orders in the US fell for two consecutive months, printing a 0.7% MoM plunge, worst than an estimated contraction of 0.5%, according to the US Commerce Department.
On the data release, the GBP/USD increased from around 1.2465 to its new YTD high at 1.2525. The Fed has constantly reiterated the tightness of the labor market, and a decrease in job vacancies, could help inflation to continue its downward trajectory. Despite OPEC’s latest crude oil production cut, that could make Fed’s job easier.
On Wednesday, the ADP Employment Change report, followed by jobless claims on Thursday, and the US Nonfarm Payrolls data, would update the effect of higher rates on the labor market.
On the UK front, Bank of England (BoE) speakers had been crossing the wires. Of late, the BoE Chief Economist Huw Pill commented that his May rate decision would be focused on “data flow and its interpretation in the forecast.” Earlier, Sylvana Tenreyro, a BoE Monetary Policy Committee (MPC) member, said that a “looser stance is needed to meet the inflation target.”
GBP/USD Technical analysis
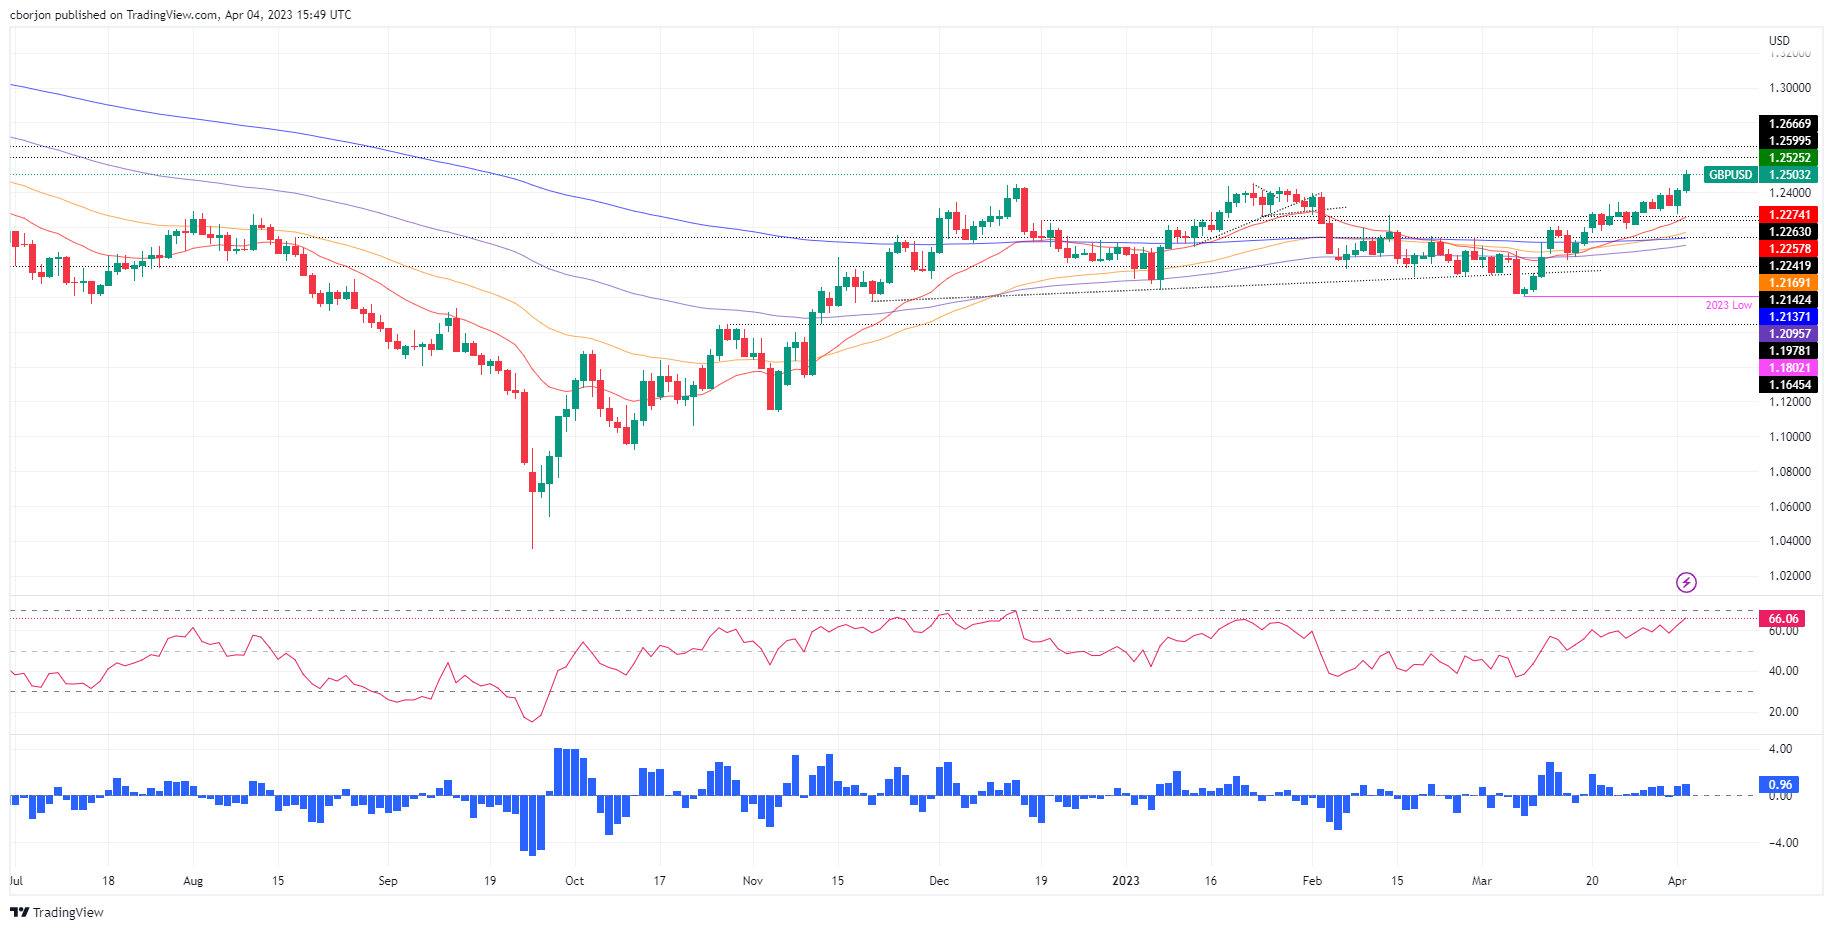
From a daily chart perspective, the GBP/USD turned bullish after cracking the February 14 daily high of 1.2270. Additionally, oscillators like the Relative Strength Index (RSI) and the Rate of Change (RoC) justified the case for higher prices. RSI is still in bullish territory, with space before turning overbought. For a bullish continuation, the GBP/USD must achieve a daily close above 1.2500 to test the newly hit YTD high at 1.2525. A breach of the latter will expose the June 7 high at 1.2599, with upside risks at May 27 daily high at 1.2667. Otherwise, a daily close below 1.2500 could pave the way for a pullback. The first demand area would be 1.2400, followed by the 20-day EMA at 1.2274.
-
16:07
BoE's Pill: There is a lot of policy-in-the-pipeline still to come through
Bank of England Chief Economist Huw Pill said on Tuesday that caution is still needed in assessing inflation prospects on account of the potential persistence of domestically generated inflation, as reported by Reuters.
Key takeaways
"The onus remains on ensuring enough monetary tightening is delivered to see the job through."
"There is a lot of policy-in-the-pipeline still to come through."
"Caution is still needed in assessing inflation prospects on account of the potential persistence of domestically generated inflation."
"MPC need to remain vigilant to signs of tightening financial conditions."
"I will base my may rate decision on data flow and its interpretation in the forecast."
"Recent developments in indicators of inflation persistence have been mixed."
"Wage developments, particularly higher frequency indicators of current momentum, appear to be easing."
"MPC should be cautious viewing better prospects for activity as something inherently inflationary."
"Relative to where we were a few months ago, the difficult trade-off facing monetary policy has eased."
Market reaction
GBP/USD preserves its bullish momentum on Tuesday and was last seen rising 0.75% on the day at 1.2505.
-
16:00
New Zealand GDT Price Index dipped from previous -2.6% to -4.7%
-
16:00
Gold Price Forecast: XAU/USD to shed some gains if the higher Oil price sparks inflation fears – Commerzbank
Gold price jumped above $2,010, reaching the highest level since March of last year. However, economists at Commerzbank believe that the yellow metal could correct lower if higher Oil price sparks inflation fears.
Gold price benefiting from economic concerns
“Gold's strength was by no means intuitive: after all, the significant rise in the Oil price brought about by the decision taken by the OPEC+ members pushes up inflation, whereas the fall in the Purchasing Manager’s Index points to faltering economic momentum, which should ease price pressures. The reaction should therefore come as a surprise in the former case in particular.”
“Doesn’t higher inflation point to higher interest rates, which should weigh on the Gold price? This was probably not the market’s first thought, however. Instead, its first reflex was presumably to switch to ‘crisis’ mode and focus on possible economic risks.”
“It cannot be ruled out that the Gold price will shed at least some of the gains it chalked up yesterday if the higher Oil price sparks inflation fears and thus rate hike speculation.”
-
16:00
Denmark Currency Reserves down to 599.2B in March from previous 600B
-
15:30
EUR/USD open to a push towards 1.1250 as ECB sticks to its guns – Credit Suisse
Economists at Credit Suisse look for EUR/USD to push towards 1.1250.
EUR still being carried by the ECB
“At the start of Q1 we wrote ‘a hawkish ECB framework, lower energy prices in Europe and a market fixation with US disinflation potential all leave room for EUR/USD to push again towards 1.0950 near-term.’ With that framework intact/strengthened post US bank failures in March and a stubborn ECB, we expect an extension now to 1.1250.”
“The key view risk is that banking stress spills over into Europe or that political tensions exacerbate, though the 1.0500 level should be strong support.”
-
15:15
US: JOLTS Job Openings decline to 9.9 million in February vs. 10.4 million expected
- Job openings in the US declined sharply in February.
- US Dollar Index stays under bearish pressure below 102.00.
The data published by the US Bureau of Labor Statistics (BLS) revealed on Tuesday that the number of job openings on the last business day of February stood at 9.9 million, compared to 10.5 million in January. This reading came in below the market expectation of 10.4 million.
"Over the month, the number of hires and total separations changed little at 6.2 million and 5.8 million, respectively," the BLS noted in its press release. "Within separations, quits (4.0 million) edged up, while layoffs and discharges (1.5 million) decreased."
Market reaction
The US Dollar Index turned south after this data and was last seen losing 0.35% on the day at 101.67.
-
15:15
Breaking: Gold rises above $2,010/oz to highest level in a year
- XAU/USD is up by more than 1%, rises $35 in an hour.
- Price was already higher and received another boost after US data.
- US yields and the US Dollar are falling sharply.
Gold price jumped above $2,010 following the release of US economic data reaching the highest level since March of last year. XAU/USD is rising 1% so far on Tuesday, boosted by a weaker US Dollar and lower US Treasury bond yields.
XAU/USD peaked at $2,024/oz, the strongest level since March 9, 2022. As of writing, it trades at $2,020
Dollar and yield tumble
XAU/USD accelerated to the upside after the beginning of the American session and following the release of US employment data. Job openings fell to 9.93 million from 10.5 million in February, below the 10.4 million expected. A different report showed that Factory Orders fell 0.3% in February, against expectations of a 0.5% decline, and January’s figures were revised lower from -1.6% to -2.1%.
Those number sent US yields sharply lower. The US 10-year stands at 3.38%, the lowest since March 27 while the 2-year dropped from above 4.00% to 3.83%. The DXY broke decisively below 102.00 falling to 101.60, the lowest in two months.
Technical levels
-
15:06
United States IBD/TIPP Economic Optimism (MoM) up to 47.4 in April from previous 46.9
-
15:04
US: Factory Orders decline by 0.7% in February vs. -0.5% expected
- Factory Orders in the US declined more than expected in February.
- US Dollar Index stays in negative territory below 102.00.
The data published by the US Census Bureau revealed on Tuesday that new orders for manufactured goods, Factory Orders, decreased $3.9 billion, or by 0.7%, in February to $536.4 billion. This print followed January's decline of 2.1% and came in worse than the market expectation for a decrease of 0.5%.
"New orders for manufactured durable goods in February, down three of the last four months, decreased $2.7 billion or 1.0 percent to $268.4 billion, unchanged from the previously published decrease," the publication further read.
Market reaction
The US Dollar stays under selling pressure after this data and the US Dollar Index was last seen losing 0.2% on the day at 101.82.
-
15:04
USD/CAD: Downtrend might continue for a little bit longer – Commerzbank
The Canadian Dollar was able to benefit from the USD weakness yesterday. Economists at Commerzbank expect the USD/CAD pair to extend its decline.
USD is having a tough time at present
“In our view, imminent rate cuts are not a fait accompli yet, the BoC will probably want to see further hard facts first. As a result, the market may be forced to delay its rate cut expectations which could support CAD.”
“Moreover, USD is having a tough time at present so that the downtrend in USD/CAD might continue for a little bit longer. On the other hand, the BoC’s rate decision next week is approaching and the market is likely to act increasingly carefully in the run-up.”
-
15:01
United States JOLTS Job Openings below forecasts (10.4M) in February: Actual (9.931M)
-
15:00
United States Factory Orders (MoM) registered at -0.7%, below expectations (-0.5%) in February
-
14:45
USD/MXN: Seasonals do not tend to favour a stronger Peso in April – SocGen
The MXN rallied to below 18.00 against the USD after Oil prices took off following the production cut by OPEC. But economists at Société Générale note that seasonals do not favour the Peso in April.
Downside risk for MXN if US yields march higher after ISM and payrolls
“The question from here is whether the Peso can strengthen towards the levels close to 17.45 of 2017. Seasonals do not tend to favour a stronger MXN in April.”
“The MXN is up 8% in Q1 and leapfrogged the CLP as best performing currency this year. Speculative investors trimmed long positions though for a second straight week, but the long base remains elevated in historical terms at 21%. This poses downside risk if US yields march higher after ISM and payrolls.”
-
14:25
EUR/USD Price Analysis: Next up barrier of note comes at the 2023 high
- EUR/USD fades the earlier bull run to new tops near 1.0940.
- Bulls now shift their attention to the YTD peak near 1.1030.
EUR/USD climbs to new multi-week highs near 1.0940 and deflates afterwards following a late bounce in the dollar.
The likelihood of extra advances appears favoured for the time being. Against that, the pair needs to clear the April high at 1.0938 (April 4) prior to a potential test of the 2023 high at 1.1032 (February 2).
Looking at the longer run, the constructive view remains unchanged while above the 200-day SMA, today at 1.0343.
EUR/USD daily chart
-
14:21
USD to remain under pressure, how to manage this decline? – UBS
The US currency has come under renewed pressure, falling 2% in March. Economists at UBS expect the US currency to remain under pressure and advise investors to consider various steps to manage this decline.
Investors can add Gold to portfolios
“We believe the main pillars of US Dollar strength last year-aggressive tightening by the Federal Reserve and a resilient US economy-are unlikely to support the currency going forward.”
“Non-USD investors should strengthen their home bias with a currency hedge or asset shift. This is a natural move for non-USD based investors who have accumulated large savings in the dollar and face the risk of depreciation.”
“Investors should also consider increasing exposure to select G10 currencies. We have the AUD as our most preferred currency, which we expect to benefit from China's recovery. We also see upside for the JPY and the CHF, as both countries benefit from low inflation. We also favor a select basket of emerging market currencies for carry.”
“Investors can add Gold to portfolios. The Gold price measured in USD tends to rise when the Dollar falls on a trade-weighted basis and when US interest rates are declining.”
-
14:03
NZD/USD to drift higher but at a more modest pace – MUFG
The New Zealand Dollar was close to unchanged in March. Economists at MUFG expect the Kiwi to lag as economy slows.
RBNZ may be close to done
“The greater the banking sector turmoil, the greater the risk to global growth which would see NZD underperform as a high-beta G10 currency. This would be reinforced if the New Zealand economy weakens further.”
“One further 25 bps hike on 5th April appears likely but we would expect that to be the last. The OIS market still has 50 bps of tightening so as the economy weakens further, short-term yields could come further lower. This could see NZD/USD underperform but through the remainder of the year we would expect NZD/USD to drift higher but at a more modest pace.”
“NZD/USD Q2 2023 0.6300 Q3 2023 0.6400 Q4 2023 0.6600 Q4 2024 0.6500.”
-
13:55
United States Redbook Index (YoY): 3.7% (March 31) vs 2.8%
-
13:30
Canada Building Permits (MoM) above expectations (2%) in February: Actual (8.6%)
-
13:22
USD Index Price Analysis: Extra weakness could revisit the 2023 low
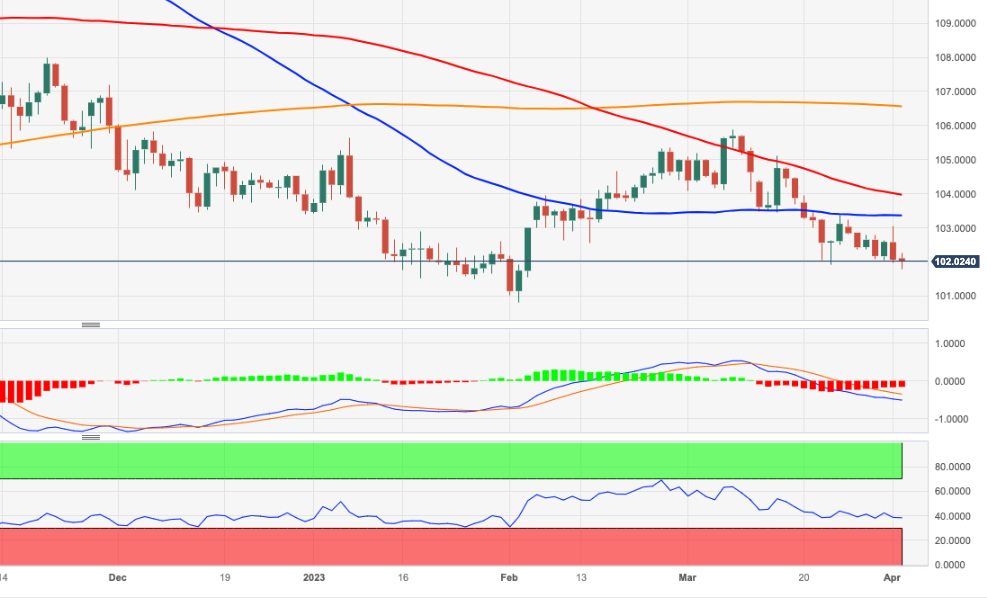
- DXY remains offered and drops to new lows near 101.80.
- Further losses could revisit the YTD low near 100.80 seen in February.
DXY comes under pressure and struggles to regain some upside traction around the 102.00 region on Tuesday.
Against that, the persistence of the bearish mood could force the index to breach the so far April low at 101.79 (April 4). Once the latter is cleared, DXY could then head towards the 2023 low around 100.80 (February 2).
Looking at the broader picture, while below the 200-day SMA, today at 106.53, the outlook for the index is expected to remain negative.
DXY daily chart
-
13:07
USD/CAD: April is the best month of the calendar year for the Loonie over the past 20 years or so – Scotiabank
The Loonie rebound that really started to get going late in March is set to extend this month as April is good for the CAD from the seasonality point of view, economists at Scotiabank report.
Undertone remains bullish
“The CAD typically trades somewhat stronger in Q2/Q3 after a soft Q1. April is the best month of the calendar year for the CAD over the past 20 years or so (CAD strengthens 75% of the time for an average return of around 1% or a little more).”
“Trend momentum signals are leaning USD-bearish on the intraday and daily studies while the market is effectively chopping (or hesitating) around trend support at 1.3430, the odds of a deeper USD drop towards 1.3275/1.3325 are growing.”
“USD resistance is 1.3445/50 and (stronger) at 1.3490/00.”
-
12:35
EUR/USD should make progress toward a retest of the early 2023 peak at 1.1030 – Scotiabank
EUR/USD extends gains through the low 1.09 area. Economists at Scotiabank expect the pair to retest the early 2023 peak at 1.1030.
Sustained bull trend
“The technical set up here – sequential higher highs and higher lows on the short-term charts and solid bull trend momentum on the intraday, daily and weekly oscillators – points to a sustained bull trend which should make progress towards a retest of the early 2023 peak at 1.1030 – and perhaps more.”
“While ECB comments on rate prospects have become a bit more nuanced (aside from Holzmann’s comments yesterday that a 50 bps hike was still on the cards), there has been enough concern expressed by policymakers about rising core inflation to keep a half-point move as a risk for the May policy decision (even if markets are pricing more along the lines of +25 bps).”
-
12:31
Indonesia: Further improvement in base metal industry – UOB
Economist Enrico Tanuwidjaja and junior Economist Agus Santoso at UOB Group assess the recent developments in the base metal industry in Indonesia.
Key Takeaways
“Indonesia has a large natural resources advantage contributing to its total exports. However, most commodities are exported in the form of raw materials, thus lacking in value-added. To answer for higher global demand and reap higher exports revenue in the imminent future, Indonesia must embark on increasing its down streaming capacity and capability, starting with the base metals.”
“The base metal industry is important in itself and furthermore, has a spillover effect to various sectors. Increasing demand for manufactured base metal commodities has led the government to expand downstream to various base metal commodities such as nickel, copper, bauxite and tin.”
“The government has prepared 3 strategic steps to encourage the implementation of downstream in Indonesia such as strengthening infrastructure, regulatory deregulations, and developing industrial ecosystems.”
-
12:28
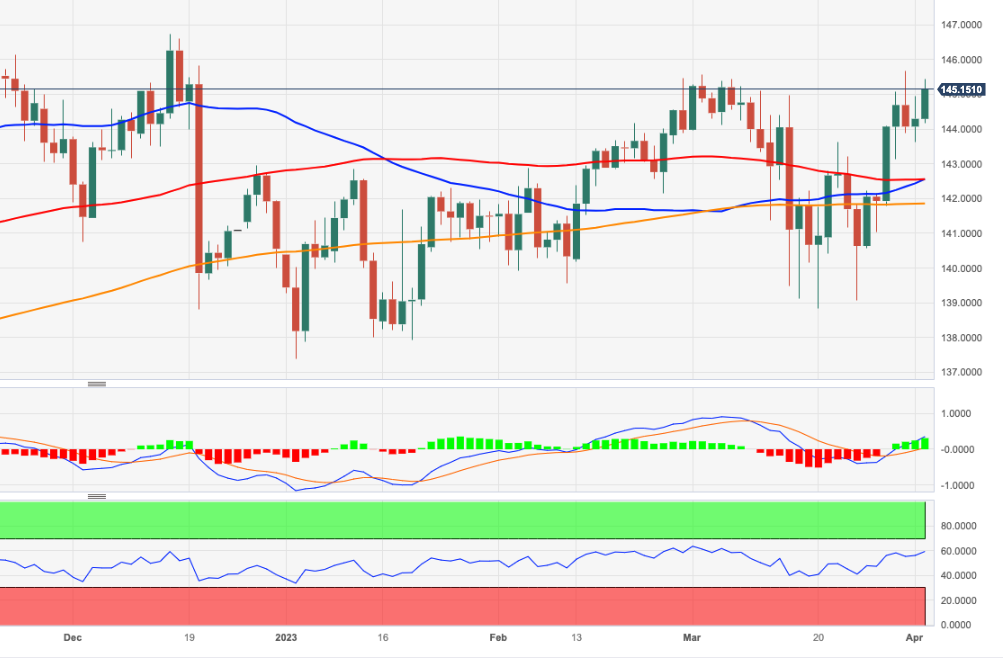
EUR/JPY Price Analysis: Next on the upside comes 146.70
- EUR/JPY adds to Monday’s positive price action beyond 145.00.
- The next resistance level emerges around the 146.70 zone.
EUR/JPY picks up further pace following the promising start of the week and advances north of the 145.00 barrier on Tuesday.
A daily close above the 2023 top at 145.67 (March 31) should motivate the cross to shift its focus to the December 2022 top around 146.70 (December 15) in the short-term horizon.
In the meantime, extra gains remain on the table while the cross trades above the 200-day SMA, today at 141.82.
EUR/JPY daily chart
-
12:27
GBP/USD: Sustained break above 1.2445 implies upside potential toward 1.30 – Scotiabank
GBP/USD gains accelerate through key resistance at 1.2445. This is a strong bullish signal for the GBP, economists at Scotiabank report.
A major bull move in the Pound is developing
“Gains in the GBP through the mid-1.24 area that has capped the Pound since last year are a bullish technical signal that augurs for more strength ahead.”
“Assuming there is no quick reversal of the breakout, the move implies upside potential in Cable towards 1.30 over the next 3-6 months.”
“Solid-looking bull trend signals on the short, medium and long-term DMI oscillators lend a lot of credence to the idea that a major bull move in the Pound is developing here.”
-
12:20
EUR/USD: Move beyond 1.0930 essential for further up move – SocGen
EUR/USD recovered from 1.0788 but ran into resistance in the familiar 1.09 area. The pair must surpass 1.0930 to enjoy further gains, economists at Société Générale report.
A deeper pullback is likely on a break under 50-DMA
“While we remain constructive on the euro outlook, it is worth asking how far and how fast the single currency can strengthen if the ECB shifts into slower tightening gear. At least three council members (Villeroy, Stournaras and Centeno) believe there is not far to go.”
“A move beyond 1.0930 can result in an extended up move.”
“If a break below 50-DMA at 1.0730/1.0710 materializes, a deeper pullback is likely.”
-
12:05
China: Recovery remained firm in March – UOB
UOB Group’s Economist Ho Woei Chen reviews the latest set of data releases in the Chinese economy.
Key Takeaways
“Better-than-expected manufacturing and non-manufacturing PMIs indicate that China’s economic recovery continued to gain traction in Mar, led by the services sector while the manufacturing sector may hold up stronger than initially thought.”
“Nonetheless, the components of the PMIs suggest that there remains weakness in the economic recovery. Employment in both the manufacturing and nonmanufacturing sectors contracted in Mar while the decline in output/ selling prices may indicate demand weakness and weak profitability. Furthermore, softening external demand and geopolitical tensions continue to pose risk to China’s manufacturing sector.”
“Given a relatively high base of comparison, we forecast GDP to expand by around 3.4% y/y in 1Q23 (4Q22: 2.9% y/y).”
-
11:46
AUD/USD set for a race higher through the rest of 2023, but risk aversion periods will slow the advance – MUFG
The Australian Dollar weakened modestly further in March. Economists at MUFG Bank see upside scope but tempered by bouts of risk aversion.
RBA unlikely to cut rates this year
“With China re-opening likely to provide support for growth this year, we do not expect the RBA to cut rates this year.”
“AUD/USD should be set for a move higher through the rest of the year although periods to risk aversion will see AUD suffer more, which will slow the move higher.”
“AUD/USD: Q2 2023 0.6800 Q3 2023 0.7000 Q4 2023 0.7200 Q1 2024 0.7100.”
-
11:36
US Dollar stays under pressure following Monday’s slide
- US Dollar continues to lose value against its major rivals on Tuesday.
- EUR/USD could target 1.1000 once it confirms 1.0900 as support.
- Bloomberg reported Chinese Yuan replaced US Dollar as the most traded foreign currency in Russia.
The US Dollar (USD) stays on the back foot on Tuesday after having registered losses against its major rivals on Monday. Although markets are pricing in a nearly 60% probability of the US Federal Reserve (Fed) raising its policy rate by 25 basis points (bps) in May, the currency is having a hard time finding demand. The risk-positive market atmosphere and news of the USD losing some of its appeal as reserve currency seems to be forcing the US Dollar Index (DXY) to stay on the back foot.
Daily digest market movers: US Dollar on the back foot for the second straight day
- Bloomberg reported on Tuesday that Chinese Yuan has surpassed the US Dollar as the most traded currency, in monthly trading volume, for the first time in Russia in February. According to the outlet, the gap has continued to widen in March.
- Last week, Brazil and China have reached an agreement to stop using the US Dollar as an intermediary in trade transactions.
- The CME Group FedWatch Tool shows that markets are pricing in a 58% probability of the Fed raising its policy rate by 25 basis points (bps) to the range of 5-5.25% in May.
- On Sunday, Saudi Arabia announced that several producers in OPEC+ will participate in voluntary output cuts from May to the end of the year. The group’s total output will be reduced by more than 1.5 million barrels per day in that period.
- The barrel of West Texas Intermediate (WTI) started the week with a large bullish gap and touched its highest level since late January above $82. Following a consolidation phase, WTI holds comfortably above $80.
- Federal Reserve Bank of St. Louis President James Bullard said on Monday that the unexpected decision by OPEC to lower output could make the Fed’s jobs of bringing inflation down back to 2% target more challenging.
- ISM’s Report on Business revealed on Monday that the headline Manufacturing PMI declined to 46.3 in March from 47.7 in February, revealing a contraction at an accelerating pace in the manufacturing sector’s economic activity.
- The Prices Paid Index of the PMI survey, the inflation component, dropped to 49.2 from 51.3. This reading suggests that input inflation in the sector softened in March.
- Fueled by the upbeat performance of energy shares, the S&P 500 closed in positive territory on Monday.
- US stock index futures trade modestly higher on Tuesday.
- February Factory Orders and JOLTS Job Openings will be featured in the US economic docket on Tuesday.
- Later in the week, the ISM Services PMI survey, ADP private sector employment data and the US Bureau of Labor Statistics’ March jobs report could influence the US Dollar valuation.
Technical analysis: US Dollar shows no signs of life against Euro
Despite the modest retreat seen at the beginning of the week, EUR/USD has managed to gather bullish momentum. The Relative Strength Index (RSI) indicator on the daily chart rose above 60 and the 20-day Simple Moving Average (SMA) made a bullish cross with the 50-day SMA. Both of these technical developments suggest that the pair’s bullish bias remains intact and there is more room on the upside before it turns technically overbought.
EUR/USD trades above 1.0900 (psychological level, static level) and it could target 1.1000 (end-point of the latest uptrend, psychological level) and 1.1035 (multi-month high set in early February) as long as that support holds.
On the downside, 1.0800 (psychological level, static level) aligns as first important support level before 1.0730/1.0750 area (20-day SMA, 50-day SMA) and 1.0660 (100-day SMA).
How does Fed’s policy impact US Dollar?
The US Federal Reserve (Fed) has two mandates: maximum employment and price stability. The Fed uses interest rates as the primary tool to reach its goals but has to find the right balance. If the Fed is concerned about inflation, it tightens its policy by raising the interest rate to increase the cost of borrowing and encourage saving. In that scenario, the US Dollar (USD) is likely to gain value due to decreasing money supply. On the other hand, the Fed could decide to loosen its policy via rate cuts if it’s concerned about a rising unemployment rate due to a slowdown in economic activity. Lower interest rates are likely to lead to a growth in investment and allow companies to hire more people. In that case, the USD is expected to lose value.
The Fed also uses quantitative tightening (QT) or quantitative easing (QE) to adjust the size of its balance sheet and steer the economy in the desired direction. QE refers to the Fed buying assets, such as government bonds, in the open market to spur growth and QT is exactly the opposite. QE is widely seen as a USD-negative central bank policy action and vice versa.
-
11:18
PBOC Governor Yi: Will safeguard Yuan, financial stability to boost employment and economic growth
The People’s Bank of China (PBOC) Governor Yi Gang made some comments on the exchange rate value and financial stability in a statement on Tuesday.
“China will safeguard Yuan and financial stability to boost employment and economic growth,” Governor Yi said.
Market reaction
The Chinese proxy, the Australian Dollar, is unperturbed by the comments. The AUD/USD was last seen trading at 0.6750, down 0.45% on the day.
-
11:10
Sterling seasonals turn bullish in April – SocGen
The Pound wrapped up the first quarter of the year as the best currency in G10. Economists at Société Générale note that GBP seasonals turn bullish in April.
Sterling’s seasonal sweet spot
“Seasonal trends place the GBP/USD pair in the sweet spot in April with gains in eight of the last ten years.”
“GBP/USD has rebounded towards last December/January high of 1.2450. This hurdle must be overcome to affirm extension in the up move.”
“Last week's low of 1.2210/1.2190 is an important support zone.”
-
11:02
EUR/USD: Decisive break above 1.0930 could usher in greater momentum toward 1.1030 – OCBC
EUR/USD retreated slightly after having climbed above 1.0900 on Monday. A sustained break above 1.0930 would clear the way toward 1.1030, economists at OCBC Bank report.
Bias to buy dips
“EUR reversed its earlier losses overnight amid USD softness. But the rise above 1.09-handle was stalled in its tracks again. This is the fourth time in two weeks that EUR’s rally had stalled at again.”
“Bullish momentum on daily chart intact though there are tentative signs of it easing while RSI fell.”
“Support at 1.0780, 1.0730 levels (21, 50-DMAs) before 1.0650 (100-DMA).”
“Bias to buy dips.”
“Key resistance remains at 1.0930 (triple top). Decisive break above could usher in greater momentum towards 1.1030 (2023 high).”
-
10:46
RBNZ Preview: Forecasts from eight major banks, decelerating hikes as recession is looming over New Zealand
The Reserve Bank of New Zealand (RBNZ) will announce its monetary policy decision on Wednesday, April 5 at 02:00 GMT and as we get closer to the release time, here are the expectations as forecast by the economists and researchers of eight major banks.
RBNZ is expected to hike the key Official Cash Rate (OCR) by 25 basis points (bps) from 4.75% to 5.00%. Eyes will be on the language in the statement amid no updated forecasts and Governor Orr’s presser.
ANZ
“We expect the RBNZ will raise the OCR 25 bps to 5.00%. If that’s not to be, we see a 50 bps hike as likelier than a pause. On balance, local data since the February MPS has not convincingly tilted things in either direction. But global financial sector wobbles suggest a degree of caution is appropriate, which the RBNZ can now afford given they are fairly confident the OCR is now in contractionary territory. We continue to forecast the OCR to peak at 5.25% with one more hike to come in May.”
Standard Chartered
“We believe the RBNZ is approaching the end of its hiking cycle. We maintain our forecast for a last 25 bps rate hike in April, taking the terminal policy rate to 5%, well short of the current RBNZ projection of 5.5%. We expect slowing inflation and a weak growth backdrop to allow the RBNZ to turn more dovish.”
TDS
“The February Monetary Policy Statement made clear the Bank thinks further hikes are needed and we expect the RBNZ to hike its OCR by 25 bps to 5.00%. The Bank is likely to acknowledge the recent turmoil in US and European financials, but conclude NZ banks are in good shape. A tightening in offshore lending standards and Fed Funds terminal rate forecasts shifting lower imply downside risk to our 5.50% RBNZ terminal rate forecast. Unless the RBNZ suggests that terminal may be lower, NZD should be contained on the crosses but NZD is more likely to be a function of broad USD/Fed pricing dynamics.”
Rabobank
“The RBNZ will deliver their latest OCR decision, where a hike of 25 bps is expected to take the OCR to 5.00%. We expect the same outcome. The 0.6% contraction in Q4 GDP might prompt some pause for thought, and the RBNZ does have a reputation for shooting from the hip. Still, the prospect of structurally higher energy prices should be enough to tip the RBNZ over the line.”
NAB
“We think the RBNZ/MPC will largely hold to its February MPS line, by delivering a 25 bps hike in the OCR and maintaining a hawkish tilt in its commentary and minutes.”
Citi
“The MPC is expected to step down its pace of rate hikes and we expect this would be last hike in the current cycle, implying a terminal policy rate of 5.00%. A 5% terminal rate would be lower than the Bank’s guidance of the OCR at 5.5%. However, we believe that the data in NZ has deteriorated a lot earlier than the RBNZ’s bullish forecast and should justify not only stepping down its pace of rate hikes from 50 bps to 25 bps but also should signal the end of the tightening cycle because the impact of previous rate hikes is still filtering through the economy. If correct, and this is the last hike the RBNZ delivers in the tightening cycle, then the Statement from the MPC will likely need to be open the possibility for less hawkish forward guidance. Similar to the BoC, the RBNZ could signal that further tightening could be necessary to help alleviate inflation concerns. Either way, the RBNZ is likely to push against any nascent expectations of interest rate cuts this year.”
Wells Fargo
“We expect the central bank to continue tightening monetary policy. With inflation still elevated, we expect the RBNZ to deliver a 25 bps rate hike at its April meeting to 5.00%, and then deliver one last 25 bps hike in May to a peak of 5.25%.”
ING
“We expect the RBNZ to hike by 25 bps to 5.0% and to maintain a hawkish tone, which can support NZD. The slower pace of tightening is warranted by external and domestic downside risks to the economy and a lower inflation outlook. These same factors make us doubt that the 5.50% peak rate (projected by the RBNZ) will be reached.”
-
10:43
Germany forecast to skirt recession – Reuters
Citing sources who have seen the so-called Joint Economic Forecasts, to be presented in Berlin on Wednesday, Reuters reported on Tuesday that the German economy is likely to narrowly skirt recession and post modest growth in the first quarter of the year.
Key takeaways
“Joint Economic Forecasts expect a 0.1% expansion in the gross domestic product in the first quarter. This follows a 0.4% contraction in the fourth quarter of 2022.”
“The five economic institutes which prepare the Joint Economic Forecasts predict GDP growth in Germany of 0.3% in 2023, up from a predicted contraction of 0.4% in the autumn.”
“For 2024, the institutes - four German and one Austrian - forecast GDP growth of 1.5%, down from 1.9% previously.”
“The economic institutes predict inflation of 6.0% in 2023, before slowing to 2.4% in 2024.”
Market reaction
The Euro is catching fresh bids on the above report, as EUR/USD is adding 0.33% on the day to trade at 1.0930.
-
10:40
AUD/USD: Decline could extend on failure to overcome 0.6850 – SocGen
AUD/USD formed a Head and Shoulders and has embarked on a phase of pullback. Failure to recapture 0.6850 could trigger fresh selling, analysts at Société Générale report.
Below 0.6550, next potential support aligns at 0.6400
“AUD/USD confirmed a Head and Shoulders and almost achieved the target at 0.6550 last month. It has staged a bounce and is attempting a break above the 200-DMA. Neckline of the pattern at 0.6850 is short-term resistance. If the pair fails to overcome this, the decline could extend.”
“First support is at 0.6680/0.6650, the 50% retracement of the rebound. Break below could mean extension in downtrend towards 0.6550 and 0.6400, the 76.4% retracement from last October.”
-
10:31
BoE’s Tenreyro: BoE might need to cut rates sooner than thought
Bank of England (BoE) interest rate-setter Silvana Tenreyro said on Tuesday, “I expect that the high current level of bank rate will require an earlier and faster reversal, to avoid a significant inflation undershoot.”
Additional quotes
“With bank rate moving further into restrictive territory, I think a looser stance is needed to meet the inflation target.”
“Looser stance can be achieved either through lower bank rate today or through lower bank rate in future.”
“In the absence of further counterbalancing cost-push shocks, I judge inflation is likely to fall well below target.”
“Cannot be complacent about the ability of QE to substitute for an interest-rate policy if, when inflation falls, we find ourselves still in a world of low equilibrium interest rates
“High-frequency private-sector regular pay growth has fallen back sharply in recent months.”
“Terms of trade shock to the UK has unwound faster than I expected.”
“I expect lower price inertia from second-round effects via wage growth, given a lower rate of headline inflation.”
“We will see less of a drag on demand and the output gap from further falls in real income.”
Market reaction
Despite the dovish remarks from the BoE policymaker, GBP/USD is holding its latest uptick near 1.2500, adding 0.73% on the day.
-
10:28
USD should continue to struggle amid economic concerns – Commerzbank
The FX market is increasingly concerned about the US economy. Hardly surprising therefore that USD is currently struggling. Economists at Commerzbank expect the greenback to remain under pressure.
Economic concerns affect USD
“If signs mount that the US economy is cooling significantly, the market might feel confirmed in its assumption that the US central bank might start cutting interest rates in the second half of the year, whereas the ECB for example continues to attract attention with reasonably hawkish comments so that rate cuts are not playing much of a role for now.”
“A data highlight is due on Friday in the shape of the labor market report. Even though the data is likely to point towards a relatively tight labor market, the report would probably have to be phenomenal to dispel the economic concerns on the market. Of course that cannot be excluded but we expect a further slowing in the number of new jobs. As a result USD should continue to struggle.”
-
10:15
New Zealand: RBNZ could hike again in April – UOB
Economist at UOB Group Lee Sue Ann sees the RBNZ raising the OCR by 25 bps at the April 5 event ahead of a potential pause in the next months.
Key Quotes
“We now think the RBNZ will have to dial back on further rate hikes, especially in light of the looming policy-induced recession and surging migration domestically.”
“We are pencilling in a 25bps hike in the OCR to 5.00%, after which we expect a pause in the current tightening cycle.”
-
10:15
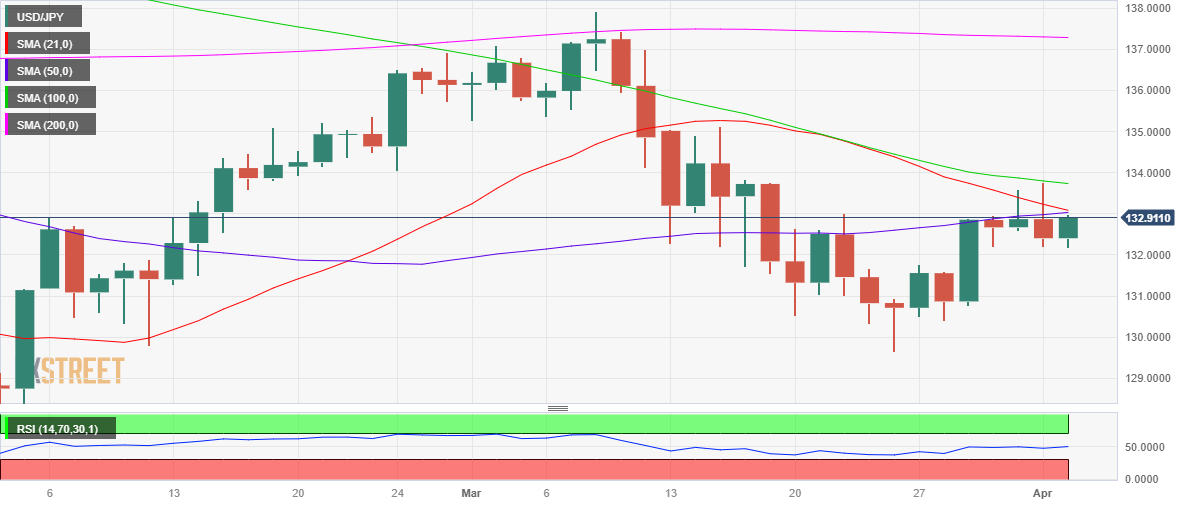
USD/JPY retakes 133.00 ahead of US data
- USD/JPY is challenging 133.00 again amid rebounding US Treasury bond yields.
- European stocks advance while US S&P 500 futures turn positive.
- Bearish 50DMA support is in sight amid the pullback from multi-week highs.
USD/JPY is regaining the upside traction in the European session, as risk sentiment rebounds on firmer European equities while the US S&P 500 futures turn positive on the day.
The positive shift in the market mood has reduced the demand for safe havens such as the US government bonds and the US Dollar, lifting the US Treasury bond yields across the curve. The benchmark 10-year US Treasury bond yields are up 0.71% on the day at 3.456%.
Earlier in Asian trading, the major faced rejection just shy of the 133.00 mark and turned south to test the 135.50 psychological level. The pair was last seen trading at 132.91, adding 0.40% on the day.
The further upside in the USD/JPY pair could depend on Wall Street performance, as the US Dollar is resuming its downside below 102.00 against its major rivals. On the data docket, the United States will feature the JOLTS Job Openings and the Factory Orders data in the North American session.
From a short-term technical perspective, USD/JPY is running into a critical resistance of the horizontal 50-Daily Moving Average (DMA) at 133.00.
The 14-day Relative Strength Index (RSI) is edging lower but holds well above the midline, suggesting that the upside momentum is likely to remain intact.
However, a potential 21 DMA and 50 DMA bearish crossover could warrant caution for USD/JPY buyers.
Therefore, bulls need acceptance above the 50 DMA barrier on a daily closing basis to break from the recent trading range and target the 133.50 static resistance.
On the flip side, a sustained move below the 132.50 demand area will threaten intermittent support near 132.20. Further south, the 132.00 round figure will be the last line of defense for bulls.
USD/JPY: Daily chart
USD/JPY: Additional technical levels
-
10:01
A higher EUR/USD certainly looks the direction of travel for the rest of the year – ING
EUR/USD remains well supported and not far off recent highs at 1.0900/0930. Economists at ING expect the pair to extend its race higher throughout the rest of 2023.
ECB hawks still pushing for a 50 bps hike in May
“ECB hawks such as Austria's Robert Holzmann suggested that a 50 bps ECB hike was 'still in the cards for May'. That would seem unlikely (a 22 bps hike is currently priced), but serves as a reminder that the ECB lags the Fed in its tightening cycle and that the ECB will be a lot slower to ease policy.”
“Overall, we suspect that the market will be reluctant to chase EUR/USD above 1.10 yet given concerns about the regional US banking system. But a higher EUR/USD certainly looks the direction of travel for the rest of the year.”
-
10:00
European Monetary Union Producer Price Index (MoM) came in at -0.5%, below expectations (-0.3%) in February
-
10:00
European Monetary Union Producer Price Index (YoY) came in at 13.2%, below expectations (13.5%) in February
-
09:44
ECB Survey: Consumer inflation expectations for next 12 months fall to 4.6% in February
Following are the key takeaways from a survey of consumer expectations for inflation, conducted by the European Central Bank (ECB) on a monthly basis.
Median inflation expectations for the next 12 months fall to 4.6% in February vs 4.9% in January.
Consumers anticipated a 1.2% increase in nominal income over the next 12 months, down from 1.3% in January.
Expectations for nominal income growth over the next 12 months edged down slightly, while expectations for nominal spending growth edged up.
Expectations for economic growth over the next 12 months became less negative and expectations for the unemployment rate in 12 months’ time decreased;
Consumers’ expectations for growth in the price of their home over the next 12 months and for mortgage interest rates 12 months ahead increased slightly.
Market reaction
EUR/USD Is off the highs but holds the recovery gains above 1.0900 on the above findings. The pair is currently trading at 1.0915, up 0.19% on the day.
-
09:42
USD/CNY: Continued improvement in China’s economy should support Yuan down the road – Commerzbank
Economists at Commerzbank discuss Asian currencies outlook, and in particular, the Chinese Yuan. In their view, CNY should streghtne down the road.
Elevated Oil prices likely to be a negative factor for Asian currencies
“In FX, elevated Oil prices amid the OPEC+ decision to cut Oil production are likely to be a negative factor for CNY and Asian currencies in general.”
“USD/CNY will probably hover close to 6.90 in the near term. But the continued improvement in China’s economy should support CNY down the road.”
-
09:15
Turkey Exports climbed from previous $18.6B to $23.6B in March
-
09:10
Forex Today: US Dollar stays on the back foot ahead of mid-tier data
Here is what you need to know on Tuesday, April 4:
Following the rebound witnessed at the beginning of the week, the US Dollar Index turned south on disappointing ISM Manufacturing PMI data and closed deep in negative territory on Monday. The index extends its slide in the early European session despite the cautious market mood. JOLTS Job Opening and Factory Orders data for March will be featured in the US economic docket. Investors will also keep a close eye on comments from central bank officials.
The ISM's monthly survey revealed on Monday that the business activity in the US manufacturing sector continued to contract at an accelerating pace in March. The Price Paid sub-index also dropped below 50, revealing a decline in input inflation. After this report, the US Dollar came under renewed bearish pressure and the benchmark 10-year US Treasury bond yield dropped below 3.5%. On Tuesday, the US Dollar Index stays at lowest level in two months below 102.00 and the 10-year yield fluctuates slightly above 3.4%. Meanwhile, US stock index futures trade modestly lower, pointing to a cautious market stance.
During the Asian trading hours, the Reserve Bank of Australia (RBA) announced that it left the policy rate unchanged at 3.6% as expected. In its policy statement, the RBA noted that it expects some further tightening of monetary policy may well be needed. Following Monday's impressive rally, AUD/USD lost its traction after the RBA event and was last seen losing nearly 0.5% on the day at 0.6750.
After having stayed in a consoldation phase near $80 for the majority of the day on Monday, the barrel of West Texas Intermediate started to edge higher on Tuesday and was last seen rising 1% on the day at $81.15. The Joint Ministerial Monitoring Committee (JMMC) of the Organization of the Petroleum Exporting Countries and its allies (OPEC+) confirmed on Monday that voluntary oil production cuts will amount to 1.66 million barrels per day.
Although EUR/USD retreated slightly after having climbed above 1.0900 on Monday, it seems to have regained its traction early Tuesday. As of writing, the pair was trading at its highest level since early February at around 1.0930. European Central Bank (ECB) policymaker Mario Centeno is scheduled to speak later in the day.
GBP/USD has gathered bullish momentum and reached its highest level since June 2022 above 1.2450 on Tuesday. Bank of England policymaker Silvana Tenreyro and Chief Economist Huw Pill will be delivering speeches.
USD/JPY closed in negative territory on Monday but managed to stage a rebound early Tuesday. The pair was last seen rising 0.2% on the day at 132.70.
Gold price capitalized on falling US T-bond yields and climbed above $1,980 on Monday. XAU/USD seems to have gone into a consolidation phase early Tuesday near that level.
Bitcoin extended its downward correction on Monday but managed to shake off the bearish pressure. At the time of press, BTC/USD was trading modestly higher on the day at $28,000. Ethereum registered small losses on Monday but failed to make a decisive move. ETH/USD stays relatively calm slightly above $1,800 early Tuesday.
-
09:08
USD/CNH clings to the mixed outlook – UOB
According to UOB Group’s Markets Strategist Quek Ser Leang and Senior FX Strategist Peter Chia, USD/CNH is still seen trading within the 6.8500-6.9200 range for the time being.
Key Quotes
24-hour view: “We highlighted yesterday that the outlook for USD is mixed and we expected it to trade in a choppy manner between 6.8600 and 6.8950. USD subsequently traded in a range of 6.8741/6.9006 before closing largely unchanged at 6.8741 (-0.01%). The outlook remains mixed and today, we expect USD to trade in a range of 6.8600/6.8900.”
Next 1-3 weeks: “There is not much to add to our update from yesterday (03 Apr, spot at 6.8800). As highlighted, the recent build-up in downward momentum has faded quickly. For now, the outlook for USD is mixed and it is likely to trade between 6.8500 and 6.9200 for now.”
-
09:05
EUR/USD prints 2-month highs near 1.0940 ahead of data, ECB
- EUR/USD adds to Monday’s gains past the 1.0900 level.
- The greenback extends the bearish note seen on Monday.
- ECB Survey, EMU Producer Prices next on tap in the calendar.
The optimism around the European currency – and the risk complex in general – appears well and sound and now lifts EUR/USD to multi-week highs around 1.0940 on Tuesday.
EUR/USD up on weaker dollar, looks at data
EUR/USD advances for the second consecutive session and leaves behind the key resistance area around 1.0930, extending further Monday’s rebound from the sub-1.0800 region
The persistent offered bias in the greenback continues to underpin the marked uptrend in the pair, which seems to have met extra legs in the recent hawkish tone from some ECB-speakers as well as the probability that the Fed might enter a pause-mode in May.
Earlier in the euro area, Germany’s trade surplus came at €16B in February. Later in the session will come EMU’s Producer Prices followed by the ECB Consumer Expectations Survey.
Across the ocean, February’s Factory Orders, the IBD/TIPP Economic Optimism index, JOLTs Job Openings and the speech by FOMC L. Cook (permanent voter, centrist) are also due.
What to look for around EUR
EUR/USD regains the key 1.0900 mark and above and seems ready to challenge the 2023 peaks in the 1.1030.35 band, always amidst the persistent weakness surrounding the dollar.
In the meantime, price action around the single currency should continue to closely follow dollar dynamics, as well as the incipient Fed-ECB divergence when it comes to the banks’ intentions regarding the potential next moves in interest rates.
Moving forward, hawkish ECB-speak continue to favour further rate hikes, although this view appears in contrast to some loss of momentum in economic fundamentals in the region.
Key events in the euro area this week: Germany Balance of Trade, ECB Consumer Expectations Survey, EMU Producer Prices (Tuesday) - Germany, EMU Final Services PMI (Wednesday) – Germany Construction PMI (Thursday).
Eminent issues on the back boiler: Continuation, or not, of the ECB hiking cycle. Impact of the Russia-Ukraine war on the growth prospects and inflation outlook in the region. Risks of inflation becoming entrenched.
EUR/USD levels to watch
So far, the pair is gaining 0.23% at 1.0920 and a break above 1.0938 (monthly high April 4) would target 1.1032 (2023 high February 2) en route to 1.1100 (round level). On the flip side, the next support comes at 1.0741 (55-day SMA) seconded by 1.0712 (low March 24) and finally 1.0661 (100-day SMA).
-
09:03
US Dollar Index can stay offered near 102.00 ahead of Friday's NFP – ING
The US Dollar Index is now around 3% below its stressed peak of mid-March. Economists at ING expect DXY to hover around 102.00 ahead of Friday’s Nonfarm Payrolls report.
Will Jolts job opening data finally drop sharply?
“Actions by the Fed to address Dollar money market stress have allowed investors to (correctly) draw the conclusion that tighter credit conditions make a US hard landing and a sharp Fed easing cycle more likely – a cleanly bearish story for the Dollar. Helping the Fed in this task would clearly be some welcome US data. This would ideally show both easing price pressures and signs of easing constraints in the US labour market.”
“Today sees the release of US Jolts Job Opening data for February. A sharp decline here would probably be read as a mildly bearish Dollar factor – adding support to the 2H23 Fed easing cycle.”
“DXY can probably stay offered near 102.00 ahead of Friday's NFP and further readings (on Thursday evening) on US bank takeup of Fed funding facilities.”
-
09:00
Brazil Fipe's IPC Inflation below forecasts (0.47%) in March: Actual (0.39%)
-
08:46
Natural Gas Futures: No changes to the consolidation theme
Considering advanced prints from CME Group for natural gas futures markets, open interest rose further on Monday, this time by nearly 11K contracts. In the same direction, volume increased for the second session in a row, now by around 67.3K contracts.
Natural Gas: Support remains below the $2.00 mark
Prices of the natural gas started the new trading week within the broad consolidative phase in place since mid-March. Monday’s price action was on the back of increasing open interest and volume and exposes further range bound for the time being. On the downside, the next support remains in the sub-$2.00 mark per MMBtu (February 22).
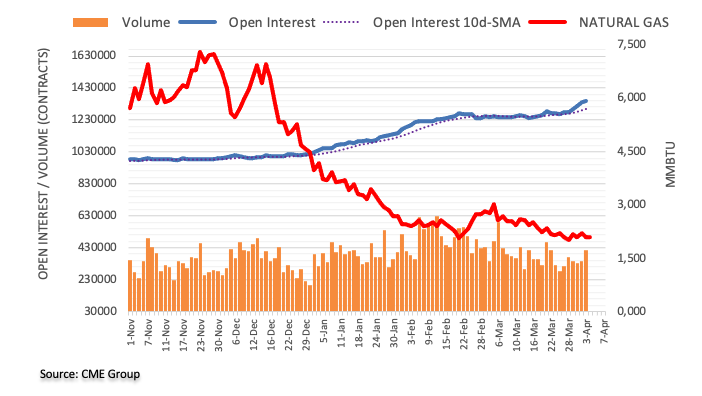
-
08:34
RBA pauses, but negative effect on AUD to be limited as further rate hikes are on the cards – Commerzbank
The Reserve Bank of Australia (RBA) left the monetary policy rate unchanged at 3.60%. However, the Aussie is unlikely to weaken significantly as the end of the rate hike cycle might not yet have been reached, economists at Commerzbank report.
RBA not excluding further rate hikes
“RBA left its key rate unchanged at 3.6%. After the RBA hiked its key rate by a total of 3.5 percentage points over the past quarters it now sees scope to wait for the effects of monetary policy tightening so far. On the other hand, it remained concerned that it might see a wage-price spiral and confirmed that it would pay close attention to the evolution of labour costs and the price setting behaviour of firms. It thus signalled that the end of the rate hike cycle might not yet have been reached.”
“In an initial reaction, AUD eased slightly as there had been some market participants who had expected a rate hike. However, as the statement sounds quite hawkish, with the RBA not excluding further rate hikes, the negative effect on the AUD is likely to be limited. In particular, since the market might have to lower its rate cut expectations for this year a little in view of the RBA’s hawkish approach.”
-
08:11
GBP/USD to struggle to break 1.25 as BoE's Huw Pill speech could weigh on Sterling – ING
Sterling continues to perform well and is certainly taking advantage of a weaker Dollar. Today, a speech from BoE's Huw Pill could weaken the GBP, economists at ING report.
Look out for a speech from Huw Pill
“GBP/USD is now approaching strong resistance in the 1.2450/2500 area. These levels could be tested today should the US data come in on the soft side.”
“Should Huw Pill choose to play up the welcome signs of easing constraints in the UK labour market, expectations of future BoE tightening may dwindle and Sterling should weaken. For that reason, we are reluctant to call for an early GBP/USD break above 1.25 and equally we think EUR/GBP should stay supported ahead of 0.8750.”
“We continue to target 0.90 later this year for EUR/GBP.”
-
08:02
Silver Price Analysis: XAG/USD approaches $24.00 trend line resistance
- Silver price pares the second consecutive daily losses around the highest levels in two months.
- Descending resistance line from Friday, bearish MACD signals lure sellers.
- Two-week-long ascending trend line, key EMAs put a floor under the XAG/USD price.
Silver price (XAG/USD) consolidates intraday losses, the second one in a row, around $23.90 as recovery moves approach the short-term key resistance lines during the early European session on Tuesday.
In doing so, the XAG/USD defends the previous day’s rebound from the 100-Exponential Moving Average (EMA), as well as a one-week-long ascending trend line.
However, a downward-sloping resistance line and bearish MACD signals are acting as immediate challenges for the Silver buyers to tackle if they wish to retake control.
Even if the quote rises past the $24.00 adjacent trend line resistance, the monthly high of $24.20 and February’s peak near $24.70 can test the XAG/USD bulls before directing them to April 2022 high near $26.25.
On the contrary, pullback moves may initially aim for the ascending support line from the last Wednesday, around $23.80 at the latest, a break that could highlight the 100-EMA level of $23.70.
Following that, ascending trend line from March 21 and the 200-EMA, respectively near $23.55 and $23.40 in that order, could challenge the Silver bears before giving them control.
Overall, Silver buyers appear to run out of steam but the bears have a long and bumpy road to travel before retaking the driver’s seat.
Silver price: Hourly chart
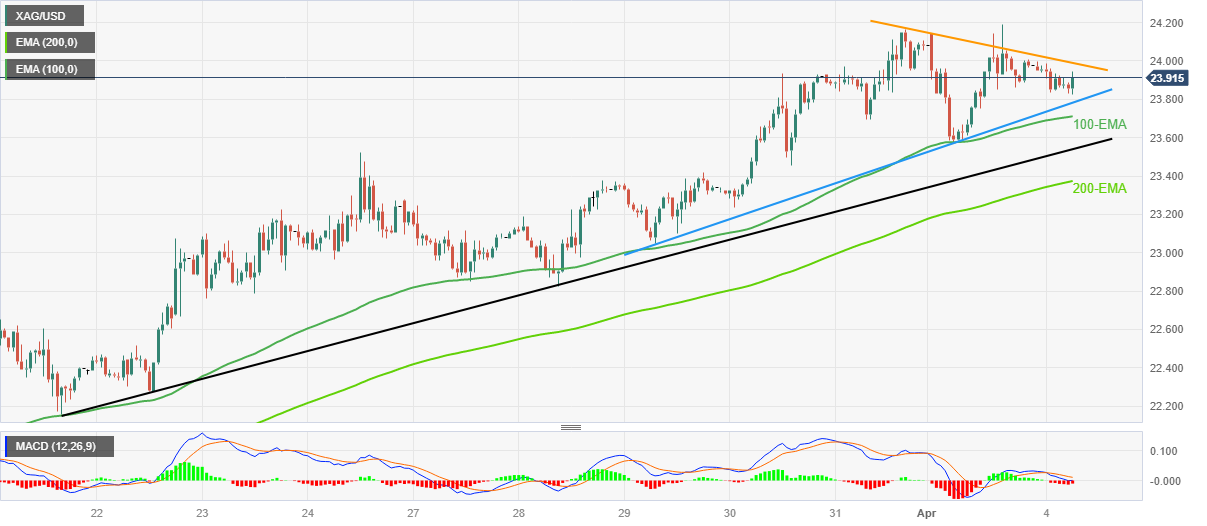
Trend: Limited upside expected
-
08:02
Spain Unemployment Change came in at -48.755K, below expectations (-0.15K) in March
-
07:59
USD/JPY: Dwindling bets for a test of 134.20 – UOB
The likelihood that USD/JPY could visit the 134.20 region seems to be losing momentum, comment UOB Group’s Markets Strategist Quek Ser Leang and Senior FX Strategist Peter Chia.
Key Quotes
24-hour view: “We expected USD to trade between 132.55 and 133.55 yesterday. However, USD traded in a wider range than expected (132.19/133.75). The price actions appear to be part of a broad consolidation range. Today, USD is likely to trade in a range of 131.90/133.40.”
Next 1-3 weeks: “Our latest narrative was from last Thursday (30 Mar, spot at 132.60) wherein the rebound in USD could extend to 134.20 but a sustained rise above this level is unlikely. Yesterday (03 Apr), USD rose briefly to 133.75 before retreating sharply. Upward momentum is beginning to slow and the chances of 134.20 coming into view are diminishing. However, only a break of 131.90 (no change in ‘strong support’ level from yesterday) would indicate that USD has moved into a consolidation phase.”
-
07:53
Crude Oil Futures: Jump in prices reinvigorates the uptrend
Open interest in crude oil prices extended the uptrend and rose by around 4.6K contracts at the beginning of the week according to preliminary readings from CME Group. Volume followed suit and rose sharply by around 812K contracts, the largest single-day build so far this year.
WTI: Next on the upside comes $82.60
Prices of the WTI leapt past the $81.00 mark per barrel on Monday in response to the decision by the OPEC+ to reduce the oil output. The strong bounce was on the back of increasing open interest and volume and leaves the door open to further upside in the very near term. Against that, the next target on the upside now emerges at the 2023 high at $82.60 (January 23).
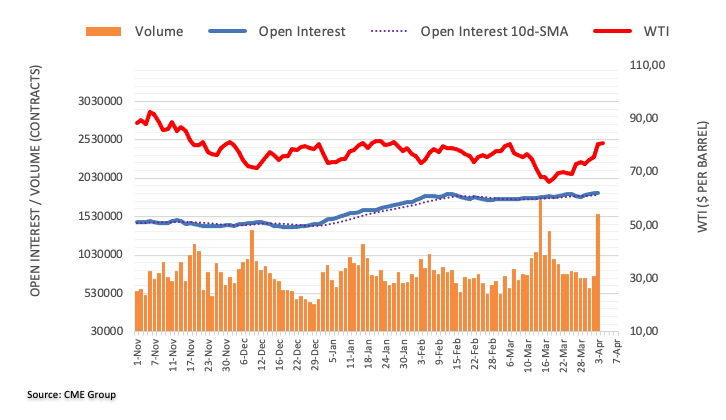
-
07:51
USD/INR: RBI to maintain a hawkish bias, helping to mitigate Rupee weakness – Commerzbank
Economists at Commerzbank discuss Thursday’s RBI decision and the outlook for the Indian Rupee.
We may even see another 50-75 bps hike in total this year
“RBI meets this Thursday and is expected to hike its key rate by another 25 bps to 6.75%. The output cut by OPEC+ probably cemented RBI’s rate hike decision. RBI is expected to maintain a hawkish bias given the strong momentum in the economy. We may even see another 50-75 bps hike in total this year. This in turn could help to mitigate INR’s weakness.”
“We look for sideways trading for USD/INR near term between the 81.50-83.00 range.”
-
07:49
GBP/USD Price Analysis: Bulls need to cross 1.2430 and 1.2450 to keep the reins
- GBP/USD picks up bids to pare intraday losses inside one-week-old bullish channel.
- Tops marked on Friday, Monday challenge Cable bulls ahead of the key 1.2445-50 resistance area.
- RSI conditions suggest that the buyers are running out of steam.
- Sellers need to defy bullish chart formation to retake control.
GBP/USD renews intraday high around 1.2430 as it prods a short-term resistance confluence during early Tuesday. In doing so, the Cable pair reverses the early Asian session losses while struggling with the two-day-old horizontal area, as well as the top line of a one-week-long bullish channel.
That said, multiple tops marked since early December 2022 offer an additional upside hurdle of around 1.2445.
It’s worth noting that the nearly overbought RSI (14) challenges the GBP/USD buyers as they jostle with the key upside hurdles.
Hence, the Cable pair’s latest run-up appears elusive unless the quote stays below 1.2450, a break of which could propel the quote towards May 2022 high near 1.2665-70.
The 1.2500 and 1.2600 round figure may act as intermediate halts during the expected rise past 1.2450.
Meanwhile, pullback moves may initially aim for 1.2400 and the 1.2340 support level ahead of highlighting the 200-Hour Moving Average (HMA) level of 1.2320.
Even so, the 1.2300 rounds figure and the stated channel’s bottom line, currently around 1.2290, can act as the last defense of the GBP/USD pair buyers before welcoming the bears.
Overall, GBP/USD is likely to remain firmer but the upside room is likely, which in turn suggests an immediate pullback before the next leg towards the north.
GBP/USD: Hourly chart
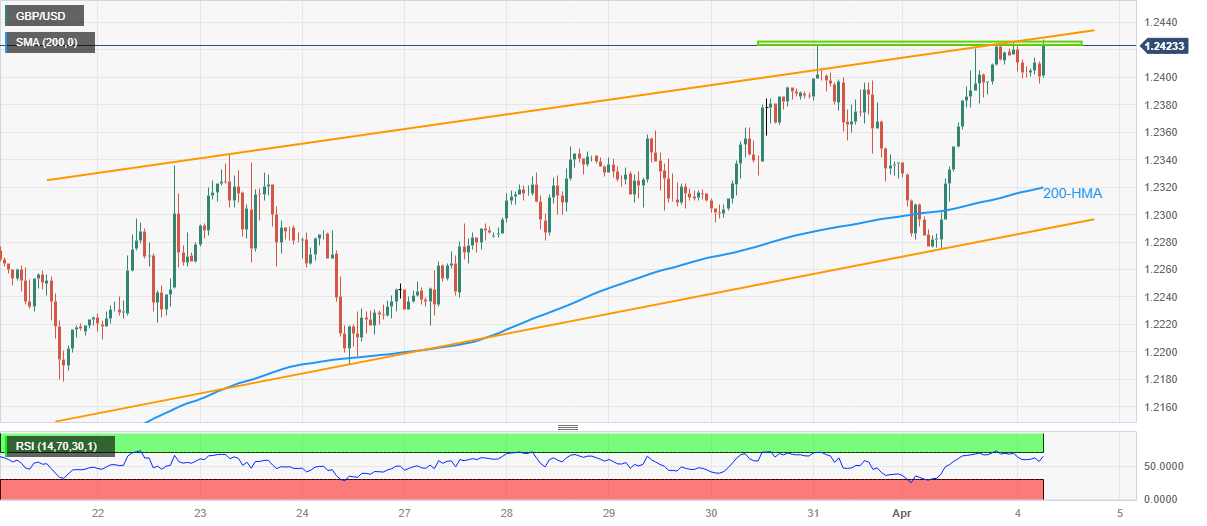
Trend: Limited upside expected
-
07:44
NZD/USD now targets 0.6365 in the short term – UOB
UOB Group’s Markets Strategist Quek Ser Leang and Senior FX Strategist Peter Chia note NZD/USD could now head towards the 0.6365 region in the near term.
Key Quotes
24-hour view: “We highlighted yesterday that NZD could test 0.6210. We added, ‘the major support at 0.6180 is unlikely to come under threat’. While NZD dipped 0.6205 in Asian trade, it reversed strongly from the low and soared to 0.6300. The rapid improvement in momentum is likely to lead to further NZD strength. However, overbought conditions suggest the major resistance at 0.6355 is unlikely to come into view today (there is another resistance at 0.6320). On the downside, a breach of 0.6255 (minor support is at 0.6275), would indicate that the current upward pressure has faded.”
Next 1-3 weeks: “Yesterday (03 Apr, spot at 0.6230), we held the view that NZD ‘is not ready to head higher in a sustained manner’ and we expected it to trade between 0.6170 and 0.6295. We did not anticipate the sharp rise to 0.6300. Upward momentum is building again and NZD is likely to head higher to 0.6365. Overall, only a break of the ‘strong support’ level, currently at 0.6230 would indicate that the build-up in momentum has fizzled out.”
-
07:39
USD Index remains under pressure near 102.00
- The index briefly pierces the 102.00 support early on Tuesday.
- US yields attempt a tepid rebound amidst the prevailing downtrend.
- Factory Orders, JOLTs Job Openings next on tap in the docket.
The USD Index (DXY), which gauges the greenback vs. a bundle of its main rivals, alternates gains with losses around the 102.00 neighbourhood on turnaround Tuesday.
USD Index looks at data, inflation concerns
The index trades in a vacillating mood near the 102.00 area, always against the backdrop of the broader bearish trend in place since early March, which saw DXY deflate from the vicinity of 106.00 to the current area near 102.00.
In the meantime, inflation concerns appear to have re-emerged following Monday’s jump in crude oil prices. This, in turn, seems to have reignited speculation of a 25 bps rate hike at the Fed’s May event.
Later in the US calendar, Factory Orders for the month of February are due seconded by the IBD/TIPP Economic Optimism index and the speech by FOMC L. Cook (permanent voter, centrist).
What to look for around USD
The index hovers around the 102.00 zone amidst alternating risk appetite trends and rising cautiousness ahead of the release of the US jobs report towards the end of the week.
Also weighing on the current bearish outlook for the dollar emerges the almost omnipresent view that the Federal Reserve could pause its ongoing tightening stance in May, which has been propped up by persevering disinflation, nascent weakness in some key fundamentals and fresh concerns surrounding the banking sector
In addition, dwindling hawkishness from Fed rate setters also seems to have removed some strength from the greenback, particularly since the latest FOMC gathering and events around SVB and other medium-size US lenders.
Key events in the US this week: Factory Orders (Tuesday) – MBA Mortgage Applications, ADP Employment Change, Balance of Trade, Final Services PMI, ISM Non-Manufacturing (Wednesday) – Initial Jobless Claims (Thursday) – Non-Farm Payrolls, Unemployment Rate, Consumer Credit Change (Friday).
Eminent issues on the back boiler: Persistent debate over a soft/hard landing of the US economy. Terminal Interest rate near the peak vs. speculation of rate cuts in 2024. Fed’s pivot. Geopolitical effervescence vs. Russia and China. US-China trade conflict.
USD Index relevant levels
Now, the index is advancing 0.08% at 102.13 and faces the next resistance level at 103.35 (55-day SMA) followed by 103.96 (100-day SMA) and then 105.88 (2023 high March 8). On the other hand, the breach of 101.91 (monthly low March 23) would open the door to 100.82 (2023 low February 2) and finally 100.00 (psychological level).
-
07:29
AUD/USD extends post-RBA loss to 0.6750 on firmer USD, US Factory Orders, Lowe’s speech eyed
- AUD/USD takes offers to refresh intraday low, reverses the biggest daily gain since January.
- Sour sentiment, light calendar and RBA’s pause to rate hike trajectory favor Aussie pair sellers.
- US-China, Russia-Europe headlines can join US Factory Orders to entertain AUD/USD traders.
- RBA’s Lowe, US Treasury bond yields will be crucial for clear directions.
AUD/USD takes offers to renew intraday low near 0.6755 as it stretches the Reserve Bank of Australia (RBA) induced losses amid the early hours of Tuesday’s European session. In doing so, the Aussie pair justifies the central bank’s dovish play, as well as takes clues from the downbeat sentiment and a corrective bounce of the US Dollar.
After 10 consecutive rate increases, the RBA announced the status quo of its current monetary policy with the benchmark rate being 3.60% at the latest. In doing so, the Australian central bank justifies the recent downside of Australian inflation and Retail Sales data while also saying, “Board expects that some further tightening of monetary policy may well be needed.”
On the other hand, the US Dollar Index (DXY) prints mild gains around 102.20 after falling the most since March 22 on Monday. The DXY’s latest rebound could be linked to the pause in the benchmark US Treasury bond yields’ previous fall. That said, the US 10-year and two-year Treasury bond yields lick their wounds around 3.42% and 3.98% after printing a four-day and two-day downtrend in that order.
Apart from the RBA moves and US Dollar’s rebound, risks emanating from China and Russia also exert downside pressure on the AUD/USD price due to the pair’s risk barometer status.
Russian Foreign Minister Sergei Lavrov raised fears of escalating Moscow-Brussels tussle by saying, “The European Union (EU) has "lost" Russia.” The policymaker also added that Moscow will deal with Europe in a tough fashion if need be. That said, China’s Consulate General in Los Angeles spokesperson conveyed their dislike for a meeting between Taiwan President Tsai Ing-wen and US House Speaker Kevin McCarthy on early Tuesday.
Additionally teasing AUD/USD sellers are mixed concerns about the OPEC+ move’s impact on inflation and the Federal Reserve’s (Fed) next action as hawkish bets recede. Late on Monday, US President Joe Biden shrugged off the OPEC+ move and said that it is not as bad as you think. However, US Federal Reserve Board Governor Lisa Cook, as well as US Treasury Secretary Janet Yellen flagged fears of higher inflation and challenges to global growth. While portraying the market’s bets on the Fed, the CME’s FedWatch Tool marks nearly 42% market bets on the Fed’s 0.25% rate hike in May, versus 52% flashed on Friday.
Amid these plays, S&P 500 Futures pause a four-day uptrend near the highest levels since February 16 but remain sluggish while depicting the market’s mood.
Looking forward, US Factory Orders for February, expected -0.5% versus -1.6% prior, may entertain intraday AUD/USD traders ahead of Wednesday’s speech from RBA Governor Philip Lowe. Should Governor Lowe resist accepting the dovish bias, the Aussie pair may witness a corrective bounce.
Technical analysis
AUD/USD bears remain hopeful unless the quote stays below a convergence of the 200-day EMA and an upward-sloping resistance line from mid-March, around 0.6820 by the press time. Even so, a daily closing below the 100-day EMA level of 0.6770 becomes necessary for the Aussie pair to suggest the quote’s further downside.
-
07:29
USD/ SGD to decline to 1.30 by Q4 – TDS
The Monetary Authority of Singapore (MAS) is likely to steepen the S$NEER slope by 50 bps. SGD should benefit from a further tightening of monetary policy settings, in the opinion of economists at TD Securities.
Selling USD/SGD on rallies up to around 1.34
“We expect the MAS to tighten monetary policy settings through a steepening in the slope of the S$NEER band at its April MPS, likely on 14 April.”
“SGD should benefit from a further tightening of monetary policy settings and we suggest selling USD/SGD on rallies up to around 1.34.”
“Expect USD/SGD to fall to 1.30 by Q4.”
-
07:24
GBP/USD faces a strong resistance at 1.2450 – UOB
In the opinion of UOB Group’s Markets Strategist Quek Ser Leang and Senior FX Strategist Peter Chia, GBP/USD needs to clear the 1.2450 region to allow for extra gains in the near term.
Key Quotes
24-hour view: “The sharp snap back that sent GBP soaring to a high of 1.2424 yesterday came as a surprise (we were expecting GBP to drop further). While GBP could continue to rise and break above 1.2450, overbought conditions suggest it might not be able to hold above this level, and the next resistance at 1.2500 is unlikely to come under threat. On the downside, a break of 1.2365 (minor support is at 1.2390) would indicate that GBP is not strengthening further.”
Next 1-3 weeks: “Yesterday (03 Apr, spot at 1.2310), we held the view that GBP ‘is not strengthening further’ and we expected it to trade in a range of 1.2190/1.2380. We did not anticipate the sharp bounce that sent GBP soaring above 1.2380 (high has been 1.2424). Upward momentum is building again but GBP has to break clearly above the major resistance at 1.2450 before a sustained rise is likely. The chances of a clear break of 1.2450 will remain intact as long as GBP stays above 1.2330 in the next few days. Looking ahead, the next resistance level above 1.2450 is at 1.2550.”
-
07:21
NZD/USD aims to sustain above 0.6300 as Reserve Bank of New Zealand to hike rates further
- NZD/USD is looking to keep its auction above 0.6300 amid the risk-on mood.
- A sudden jump in the odds of one more rate hike by the Federal Reserve has supported the USD Index in extending its recovery.
- The Reserve Bank of New Zealand is expected to extend rates further to 5% despite a bleak economic outlook.
- NZD/USD is gathering strength to deliver a breakout of the Flat Channel.
NZD/USD is displaying a back-and-forth action above the round-level resistance of 0.6300 in the early European session. The Kiwi asset is facing barricades in keeping its business above 0.6300 as the US Dollar Index (DXY) has extended its recovery above 102.20. The USD Index has stretched its recovery move amid a sudden rise in the odds of a 25 basis point (bp) interest rate hike from the Federal Reserve (Fed).
As per the CME Fedwatch tool, chances for one more 25 basis points (bps) rate hike to 5.00-5.25% have suddenly crossed above 58%. It seems that commentary from US Federal Reserve Board Governor Lisa Cook has provided a cushion to the USD Index. On Monday, Fed Governor Lisa Cook said that the US has low unemployment and high inflation. Thus, the Fed is currently focused on inflation and the disinflationary process is underway, but we are not there yet.
Meanwhile, S&P500 futures are showing choppy moves in the early European session amid a lack of clarity for the Federal Reserve’s interest rate guidance, however, the risk appetite theme is still solid. Rising chances of consecutive 25 bps rate hike from the Federal Reserve are failing to provide support to US Treasury Yields. Yields generated on 10-year US Treasury bonds seem sideways above 3.42%.
US ISM Manufacturing PMI lands below 50.0 straight for the fifth month
The US Dollar Index witnessed a steep fall on Monday after the release of the United States ISM Manufacturing PMI data below 50.0, consecutively for the fifth time, conveyed that the US growth rate is expected to show a crackdown this quarter. The economic data contracted to 46.3 from the consensus of 47.5 and the former release of 47.7.
Also, New Orders Index contracted to 44.3 from the expectations of 44.6, which indicates that forward demand is expected to remain subdued. Weaker-than-anticipated US Manufacturing PMI has bolstered the chances of a recession ahead. Firms are struggling to extend their production as higher rates by the Federal Reserve are barricading them from tapping advances. Also, rising inflationary pressures are creating a lot of burden on households, which are struggling to offset the impact of inflated goods. This has stemmed to the need of pause rates sooner to infuse confidence among investors.
Investors shift focus on US Employment data
Investors are expected to get meaningful guidance after the release of the US employment data this week. Friday’s Nonfarm Payrolls (NFP) data will be keenly watched as higher additions of fresh labor would indicate that the overall demand is solid and the labor cost index would continue to flex its muscles.
But before that, Wednesday’s US Automatic Data Processing (ADP) Employment Change (March) data will remain in the spotlight. According to the estimates, the economic data will release lower at 205K vs. the prior release of 242K.
RBNZ to hike rates further despite bleak economic outlook
The New Zealand economy has been contracting as households are still recovering from the flood situation and stubborn inflation, which has already added a lot of burdens. Reuters reported that New Zealand's economy is expected to have shrunk 0.3% this quarter, following a 0.6% contraction in the final three months of 2022, indicating a mild recession that is likely to prompt the RBNZ to slow its torrid pace of rate hikes.
However, New Zealand’s stubborn inflation is expected to be addressed initially by the Reserve Bank of New Zealand (RBNZ) to safeguard the economy against further turmoil. The inflation rate in the Kiwi economy is been latest recorded at 7.3% and is required to be tamed sooner with restrictive monetary tools. In a March 27-30 Reuters poll, over 90% of economists said Reserve BANK OF New Zealand Governor Adrian Orr would hike the Official Cash Rate (OCR) by 25 basis points (bps) to 5.00% at its April 5 meeting, the highest since December 2008.
NZD/USD technical outlook
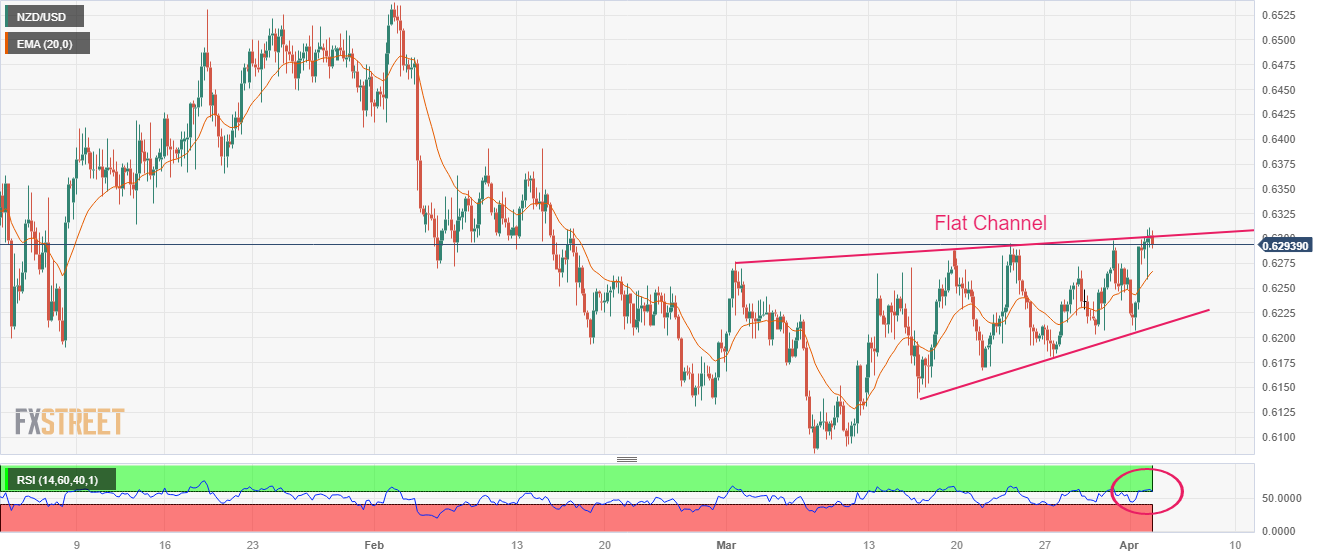
NZD/USD is gathering strength to deliver a breakout of the Flat Channel formed on a four-hour scale. A breakout of the flat channel will result in wider ticks and heavy volume. The 20-period Exponential Moving Average (EMA) at 0.6267 is providing support to the New Zealand Dollar bulls.
A decisive break into the bullish range of 60.00-80.00 by the Relative Strength Index (RSI) (14) will activate the bullish momentum.
-
07:20
Gold Futures: Door open to extra gains
CME Group’s flash data for gold futures markets noted traders increased their open interest positions by nearly 5K contracts on Monday, reversing at the same time Friday’s pullback. In the same line, volume went up by around 25.2K contracts after five straight drops.
Gold: A visit to $2000 remains in store
Prices of the ounce of troy of gold started the week on a positive foot and retested the $1990 region. The uptick was on the back of rising open interest and volume and this is indicative that further strength lies ahead for the precious metal. The next target on the upside, in the meantime, remains at the 2023 high at $2009 (March 20).
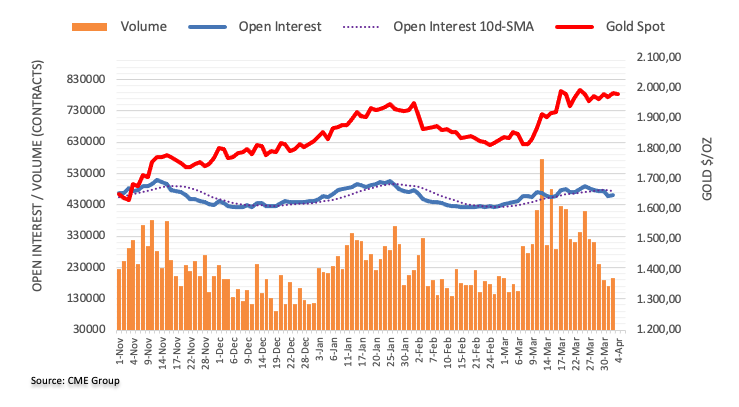
-
07:12
Gold Price Forecast: XAU/USD pullback targets $1,968 amid US Dollar rebound, sluggish yields
- Gold price retreats from intraday high to consolidate week-start gains.
- Mixed concerns about inflation, Fed challenge XAU/USD buyers amid light calendar.
- Geopolitical fears emanating from China, Russia also prod Gold buyers.
- US Factory Orders may entertain traders, yields eyed ahead of busy calendar.
Gold price (XAU/USD) prints mild losses around $1,980 as it consolidates the week-start losses heading into Tuesday’s European session. In doing so, the precious metal bears the burden of the US Dollar rebound, as well as a downbeat geopolitical headline, amid a sluggish Asian session.
US Dollar Index (DXY) prints mild gains around 102.20 after falling the most since March 22 on Monday. The DXY’s latest rebound could be linked to the corrective bounce in the US Treasury bond yield. That said, the US 10-year and two-year Treasury bond yields lick their wounds around 3.42% and 3.98% after printing a four-day and two-day downtrend in that order.
While tracing the recovery in yields, the market’s cautious mood amid a light calendar and anxiety ahead of the top-tier US jobs report joins the geopolitical risks emanating from China and Russia to underpin the US Dollar’s haven demand.
Late on Monday, Russian Foreign Minister Sergei Lavrov raised fears of escalating Moscow-Brussels tussle by saying, “The European Union (EU) has "lost" Russia.” The policymaker also added that Moscow will deal with Europe in a tough fashion if need be. Furthermore, the US-China tension is also on the table as Beijing keeps reiterating its dislike for the US-Taiwan ties but Washington seems to ignore it.
Additionally challenging the risk profile are the mixed concerns about the OPEC+ move’s impact on inflation and the Federal Reserve’s (Fed) next action as hawkish bets recede. Late on Monday, US President Joe Biden shrugged off the OPEC+ move and said that it is not as bad as you think. However, US Federal Reserve Board Governor Lisa Cook, as well as US Treasury Secretary Janet Yellen flagged fears of higher inflation and challenges to global growth. While portraying the market’s bets on the Fed, the CME’s FedWatch Tool marks nearly 42% market bets on the Fed’s 0.25% rate hike in May, versus 52% flashed on Friday.
Against this backdrop, S&P 500 Futures pause a four-day uptrend near the highest levels since February 16 while the yields lick their wounds.
Moving on, US Factory Orders for February, expected -0.5% versus -1.6% prior, may entertain Gold traders but major attention should be given to the risk catalysts for clear directions.
Gold price technical analysis
Gold price retreated from a two-week-old descending resistance line, around $1,990 by the press time, amid a looming bear cross on the MACD and downward-sloping RSI (14) line.
As a result, the XAU/USD sellers are likely to extend the latest fall towards the 10-Exponential Moving Average (EMA) level surrounding $1,968.
However, the Gold price weakness below $1,968 could quickly recall $1,930 and the $1,900 threshold, a break of which highlights 200-EMA support of $1,830.
Meanwhile, recovery moves need to cross the fortnight-long resistance surrounding $1,990 to convince the Gold buyers.
Even so, the $2,000 psychological magnet and an upward-sloping resistance line from mid-January, close to $2,027, may act as the last defense of the Gold bears.
Overall, Gold price is likely to remain firmer but a short-term pullback can’t be ruled out.
Gold price: Daily chart
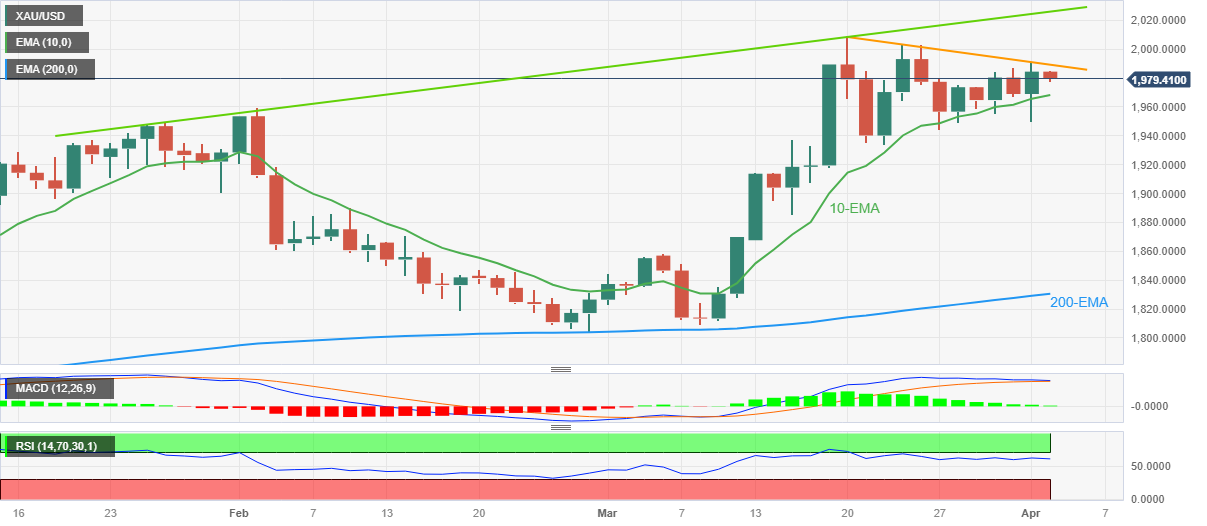
Trend: Limited downside expected
-
07:00
Germany Trade Balance s.a. below forecasts (€17B) in February: Actual (€16B)
-
07:00
Germany Imports (MoM) above forecasts (1.3%) in February: Actual (4.6%)
-
07:00
Germany Exports (MoM) above forecasts (1.4%) in February: Actual (4%)
-
06:59
Gold Price Forecast: Sustained break above $1,990 to keep XAU/USD buyers motivated
Just when it looked like Gold price is initiating a fresh downtrend on Monday, Gold price bulls jumped back on the bids. Acceptance above $1,990 is critical for XAU/USD bulls to extend control, FXStreet’s Dhwani Mehta reports.
Gold price looks to waver in the pennant, with upside risks intact
“The downside break from a two-week-old pennant formation appears elusive, as bulls now aim for a sustained break above the falling trendline resistance at $1,990 to validate a breakout. On confirmation of the pennant breakout, the rebound in XAU/USD could regain traction, eyeing the key $2,000 level. The next significant resistance levels are stacked up at the yearly high of $2,010 and the $2,050 psychological level.”
“The immediate support is seen at the rising trendline, now at $1,968, below which Gold sellers are likely to regain complete control. Monday’s low of $1,950 will be challenged on additional declines. The last line of defense for Gold bulls is seen at the strong support of $,1935, where the bullish 21-Daily Moving Average (DMA) aligns.”
-
06:50
USD/CHF Price Analysis: Rebounds from 0.9110 support confluence
- USD/CHF pares the previous day’s losses at three-week low.
- Convergence of one-week-old and two-month-long ascending trend lines puts a floor under Swiss Franc pair.
- Sluggish oscillators, strong resistances challenge pair buyers unless the quote stays below 200-SMA.
USD/CHF picks up bids to refresh its intraday high near 0.9140 as it consolidates the week-start losses at a multi-day low. With this, the Swiss Franc (CHF) bounces off short-term key support lines heading into Tuesday’s European session.
A one-week-long ascending trend line joins an upward-sloping support line from early February to highlight the 0.9110 level as the key downside support, from which the USD/CHF pair recovered recently.
It’s worth noting, however, that the MACD and RSI (14) struggle to convince USD/CHF bulls as they approach a three-week-long descending resistance line, close to 0.9180.
Also acting as a short-term important upside hurdle is the 100-SMA level surrounding 0.9195, quickly followed by the 0.9200 round figures.
In a case where the USD/CHF prices remain firmer past 0.9200, the 200-SMA hurdle of 0.9266 can act as the last defense of bears.
Alternatively, the aforementioned trend line confluence near 0.9110 appears a tough nut to crack for the USD/CHF bears on their return.
Following that, lows marked in March and February, respectively around 0.9070 and 0.9060 can challenge the pair sellers.
Should the quote remains bearish past 0.9060, the odds of witnessing a slump toward the 0.9000 round figure can’t be ruled out.
USD/CHF: Four-hour chart
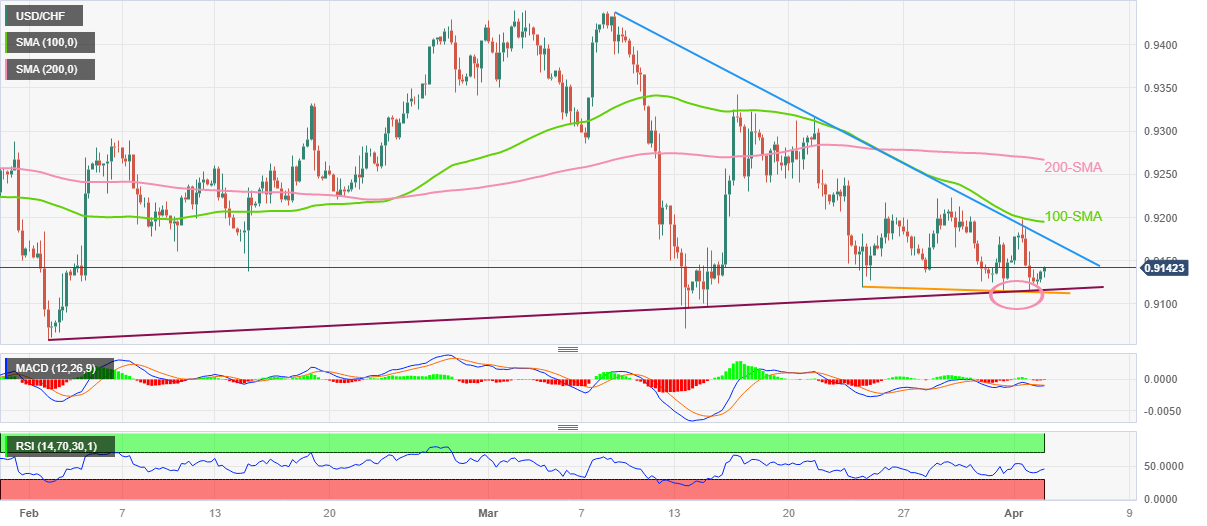
Trend: Limited recovery expected
-
06:39
EUR/USD: A sustained advance needs to clear 1.0930 – UOB
Further gains appear on the cards once EUR/USD surpasses the 1.0930 level, suggest UOB Group’s Markets Strategist Quek Ser Leang and Senior FX Strategist Peter Chia.
Key Quotes
24-hour view: “We expected EUR to decline further but we were of the view that ‘the major support at 1.0755 is unlikely to come under threat’. EUR dropped to 1.0786 in Asian trade and then snapped back up and soared to a high of 1.0916. The rapid advance has scope to rise above the major resistance at 1.0930. In view of the overbought conditions, EUR might not be able to hold above this level. The next resistance at 1.0970 is unlikely to come under threat. Support is at 1.0875, followed by 1.0840.”
Next 1-3 weeks: “Our view from yesterday (03 Apr, spot at 1.0815) wherein ‘the corrective pullback could extend to 1.0755’ was proven incorrect quickly as EUR snapped higher and took out our ‘strong resistance’ level of 1.0890. Despite the rapid rise, it is too early to tell if the recent EUR strength has resumed. EUR has to break and stay above 1.0930 before a sustained advance is likely. The likelihood of a clear break above 1.0930 will remain intact as long as EUR stays above 1.0800 in the next few days. Looking ahead, the resistance levels above 1.0930 are at 1.0970 and 1.1035.”
-
06:34
Asian Stock Market: Fails to capitalize on steady Fed policy bets, oil maintains auction above $80.00
- Asian stocks are displaying mixed signs despite fading hawkish Fed bets.
- Chinese equities are displaying decent losses as the impact of weak Caixin Manufacturing PMI data has not faded yet.
- The oil price is expected to accelerate to $100.00 after OPEC+ announced additional production cuts.
Markets in the Asian domain have failed to capitalize on rising expectations for a steady monetary policy by the Federal Reserve (Fed) for its May policy meeting. The fifth straight United States ISM Manufacturing PMI figure below 50.0 has deepened fears of a recession and anticipation of a rise in the Unemployment Rate.
Fears of recession in the US economy are likely to be tackled by a steady interest rate decision from the Fed. The US Dollar index (DXY) is facing hurdles in extending its recovery above 102.20. Meanwhile, S&P500 futures are showing nominal losses in the early European session, however, the market mood is quite positive.
At the press time, Japan’s Nikkei225 gained 0.31%, ChinaA50 dropped 0.46%, Hang Seng tumbled almost 1%, KOSPI jumped 0.31%. Nifty50 is closed on account of Mahavir Jayanti.
Chinese equities are displaying decent losses as the impact of weak Caixin Manufacturing PMI data has not faded yet. The economic data has landed at 50.0, lower than the consensus of 51.7 and the former release of 51.5. The Chinese economy is struggling in reviving growth despite dismantling pandemic controls and favoring monetary and non-monetary measures.
On the oil front, oil prices continued to remain sideways above $80.00 on Tuesday. An announcement of further production cuts by OPEC+ to provide balance to oil has stemmed expectations for the oil price at $100.00 in the coming quarter.
-
06:24
USD/CAD licks its wounds at six-week low above 1.3400 despite firmer Oil price
- USD/CAD picks up bids to pare intraday losses at 1.5-month low, prods six-day downtrend.
- US Dollar pares recent fall as mixed concerns about inflation, geopolitics weigh on sentiment amid sluggish session.
- Headlines from Russia, China challenge previous risk-on mood even as Fed bets ease.
- Canada Building Permits, US Factory Orders eyed for fresh impulse.
USD/CAD reverses intraday losses as it grinds higher past 1.3400 heading into Tuesday’s European session, near 1.3440 by the press time.
With this, the Loonie pair ignores firmer prices of the WTI crude oil, Canada’s key export item, while pausing a six-day downward trajectory near the lowest levels since mid-February.
WTI crude oil rises 0.50% intraday to $80.85 at the latest. It’s worth noting that the black gold posted the biggest daily jump in 11 months the previous day after the Organization of the Petroleum Exporting Countries (OPEC) and its allies led by Russia, known as OPEC+, announced a surprise output cut.
On the other hand, US Dollar Index (DXY) prints mild gains around 102.20 after falling the most since March 22 on Monday. The DXY’s latest rebound could be linked to the corrective bounce in the US Treasury bond yield. That said, the US 10-year and two-year Treasury bond yields lick their wounds around 3.42% and 3.98% after printing a four-day and two-day downtrend in that order.
It’s worth noting that the market’s cautious mood amid a light calendar and anxiety ahead of the top-tier US and Canadian jobs report joins the geopolitical risks emanating from China and Russia to underpin the US Dollar’s haven demand.
Russian Foreign Minister Sergei Lavrov raised fears of escalating Moscow-Brussels tussle by saying, “The European Union (EU) has "lost" Russia.” The policymaker also added that Moscow will deal with Europe in a tough fashion if need be. Furthermore, the US-China tension is also on the table as Beijing keeps reiterating its dislike for the US-Taiwan ties but Washington seems to ignore it.
Additionally challenging the risk profile are the mixed concerns about the OPEC+ move’s impact on inflation and the Federal Reserve’s (Fed) next action as hawkish bets recede. Late on Monday, US President Joe Biden shrugged off the OPEC+ move and said that it is not as bad as you think. However, US Federal Reserve Board Governor Lisa Cook, as well as US Treasury Secretary Janet Yellen flagged fears of higher inflation and challenges to global growth. While portraying the market’s bets on the Fed, the CME’s FedWatch Tool marks nearly 42% market bets on the Fed’s 0.25% rate hike in May, versus 52% flashed on Friday.
Talking about the data, the US ISM Manufacturing PMI dropped to the lowest levels since May 2020 in March, to 46.3 versus 47.5 expected and 47.7 prior. On the other hand, the Bank of Canada’s (BoC) latest quarterly Business Outlook Survey published on Monday said about half of the polled firms expect Canada to go into a mild recession over the next year, down from roughly two-thirds in the previous survey, per Reuters.
Looking forward, USD/CAD may consolidate recent losses amid sluggish markets and a light calendar. However, no major action is expected ahead of Friday’s US and Canadian employment data.
Technical analysis
Nearly oversold RSI (14) could join the 200-DMA level of 1.3380 to restrict short-term USD/CAD downside. Corrective pullback, however, needs validation from the 100-DMA hurdle of 1.3525.
-
06:07
AUD/JPY Price Analysis: Drops firmly below 90.00 as RBA keeps rates unchanged at 3.60%
- AUD/JPY has slipped sharply below 89.70 as RBA has kept a neutral stance on interest rates.
- Quick softening of Australia’s monthly PCI to 6.8% must have allowed the RBA to keep rates unchanged at 3.6%.
- A positive contribution to Japan’s inflation through international forces would only create troubles for BoJ policymakers.
The AUD/JPY pair has witnessed an intense sell-off as the Reserve Bank of Australia (RBA) has kept the monetary policy steady. The risk barometer has slipped sharply to near 89.70 and is expected to remain volatile ahead. RBA Governor Philip Lowe has kept the Official Cash Rate (OCR) unchanged at 3.60% as Australian Inflation has shown a quick decline in the past two months.
Australia’s monthly Consumer Price Index (CPI) indicator has softened quickly in the past two months to 6.8% from the peak of 8.4% registered in December. The spell of 10 consecutive rate hikes by the RBA has broken.
Meanwhile, the Japanese Yen has remained subdued amid rising oil prices. This would step-up Japan’s inflation ahead, however, a positive contribution to Japan’s inflation through international forces would only create troubles for Bank of Japan (BoJ) policymakers.
On a four-hour scale, AUD/JPY has sensed selling pressure after reaching near the supply zone placed in a narrow range of 90.19-90.25, around March 15 high. The selling pressure in the Australian Dollar is inspired by steady RBA monetary policy. The 20-period Exponential Moving Average (EMA) at 89.13 is scaling higher, which indicates that the short-term trend is bullish.
Meanwhile, the Relative Strength Index (RSI) is oscillating in the bullish range of 60.00-80.00, which indicates that the upside momentum is already active.
The Aussie Dollar would see more weakness if it would slip below the immediate support of 89.60. An occurrence of the same would expose the risk barometer to March 29 high at 88.70. A further breakdown would drag the cross toward March 28 low at 87.15.
On the flip side, a decisive move above April 04 high at 90.14 will drive the cross toward March 08 high at 90.92 followed by March 03 high at 92.25.
AUD/JPY four-hour chart
-638161815704793287.png)
-
05:55
Aussie yields plummet on RBA status quo, Governor Philip Lowe’s speech in focus
- Australia’s benchmark Treasury bond yields drop after RBA pauses 10-time rate hike trajectory.
- RBA Statement highlights the need for further rate hike, suggesting hawkish comments from Lowe.
- Fears surrounding China, Russia challenge bond buyers but receding hawkish Fed bets weigh on Aussie yields.
Australian bond markets welcome the Reserve Bank of Australia’s (RBA) inaction during early Tuesday. In doing so, the benchmark Treasury bond coupons plummet as traders rush for risk safety.
It’s worth noting that Australia’s benchmark 10-year Treasury bond yields dropped from 3.29% to 3.25% during the initial hour of RBA announcements. In doing so, the Aussie bond coupons fail to track their US counterparts as the US 10-year and two-year Treasury bond yields remain inactive around 3.42% and 3.98%.
That said, the RBA maintained the benchmark rate near 6.0% after increasing the RBA rate in the last 10 consecutive meetings. Following the interest rate announcements, the RBA Rate Statement said, “Board expects that some further tightening of monetary policy may well be needed.”
Also read: Breaking: RBA steers rates on a steady course at 3.60% in April, as expected
Apart from the RBA-linked moves, the market’s sour sentiment also weighs on the Aussie yields. Among the key catalysts, the US-China tension is a major one as Beijing keeps reiterating its dislike for the US-Taiwan ties but Washington seems to ignore it. On the same line could be the comments from Russian Foreign Minister Sergei Lavrov raised fears of escalating Moscow-Brussels tussle by saying, “The European Union (EU) has "lost" Russia.”
Looking forward, RBA Governor Philip Lowe’s comments, scheduled for early Wednesday will be crucial for the Aussie bond traders.
Also read: S&P 500 Futures dribble at six-week high, yields dwindle amid mixed concerns about inflation, Fed
-
05:38
AUD/USD drops below 0.6770 as RBA keeps policy unchanged
- AUD/USD has sensed selling pressure as the RBA has kept rates unchanged at 3.6%.
- The street was divided between a steady RBA policy and an 11th consecutive rate hike.
- The upside in the USD Index looks capped as investors are anticipating an early pause in the Fed’s policy-tightening spell.
The AUD/USD pair has slipped below 0.6770 as the Reserve Bank of Australia (RBA) has broken the policy-tightening spell after hiking rates straight 10 times. RBA Governor Philip Lowe has kept the Official Cash Rate (OCR) unchanged at 3.6%. The street was divided over the interest rate decision as Australia’s monthly Consumer Price Index (CPI) indicator has already conveyed that inflation has softened quickly in the past two months to 6.8% from the peak of 8.4% registered in December. It seems that RBA Governor Philip Lowe is highly optimistic about further softening in Australian inflation.
On Monday, the Australian Dollar remained in action after the release of the downbeat Caixin Manufacturing PMI data. The economic data has landed at 50.0, lower than the consensus of 51.7 and the former release of 51.5. The Chinese economy is struggling in reviving growth despite dismantling pandemic controls and favoring monetary and non-monetary measures. It is worth noting that Australia is the leading trading partner of China and weak manufacturing activities have a severe impact on the Australian Dollar.
Meanwhile, the US Dollar Index (DXY) is facing barricades after a recovery move to near 102.20. The upside in the USD Index looks capped as investors are anticipating an early pause in the Federal Reserve’s (Fed) policy-tightening spell. Deepening fears of a recession in the United States economy led by five straight ISM Manufacturing PMI contractions are advocating for a pause in the restrictive monetary policy regime.
This week, the US Automatic Data Processing (ADP) Employment Change (March) data will be keenly watched, which is scheduled for Wednesday. The economic data is seen lower at 205K vs. the prior release of 242K. Fewer additions of fresh labor could add to indicators favoring a pause in the rate-hiking spell.
-
05:36
AUD/NZD plummets 30-pips as RBA pauses rate hike trajectory, Governor Lowe, RBNZ in focus
- AUD/NZD slump pips as RBA announces no rate increase after lifting the rates in the last 10 consecutive times.
- NZIER criticizes RBNZ’s rate hike, suggesting likely signals of policy pivot and AUD/NZD rebound in future.
- RBNZ is expected to announce 0.25% rate hike on Wednesday.
- Lowe’s comments on RBA’s future path, RBNZ announcements will be crucial for clear directions.
AUD/NZD initially plummeted to 1.0738 on the Reserve Bank of Australia’s (RBA) interest rate pause before recently picking up bids to 1.0760 during early Tuesday.
In doing so, the exotic pair marks the bear’s dominance as the Aussie central bank pauses its rate hike trajectory after lifting the benchmark rates in the last 10 consecutive meetings.
Also read: Breaking: RBA steers rates on a steady course at 3.60% in April, as expected
Apart from the RBA moves, the challenges to sentiment emanating from China and inflation fears, as well as the Reserve Bank of New Zealand’s (RBNZ) likely rate hike, also seems to weigh on the AUD/NZD prices.
That said, the US-China tension is back on the table as Beijing keeps reiterating its dislike for the US-Taiwan ties but Washington seems to ignore it. On the same line could be the comments from Russian Foreign Minister Sergei Lavrov raised fears of escalating Moscow-Brussels tussle by saying, “The European Union (EU) has "lost" Russia.”
Against this backdrop, the S&P 500 Futures struggle for clear directions after Wall Street closed mixed whereas the US 10-year and two-year Treasury bond yields remain inactive around 3.42% and 3.98%.
Earlier in the day, the latest New Zealand Institute of Economic Research (NZIER) Quarterly Survey of Business Opinion (QSBO) signaled that the RBNZ tightening looks to be gaining traction in dampening demand. Hence, te
Having witnessed the initial reaction to the RBA’s Interest Rate Decision, AUD/NZD traders may wait for RBA Governor Philip Lowe’s comments, scheduled for early Wednesday, before portraying any further moves. Additionally important will be the RBNZ announcements as the New Zealand central bank’s rate hikes have recently gained criticism. Even so, the Auckland-based bank is up for a 0.25% rate hike and may weigh on the AUD/NZD if skipping any dovish remarks in the policy statements.
Technical analysis
Unless breaking a three-week-old descending resistance line, surrounding 1.0800, the AUD/NZD pair remain on the bear’s radar.
-
05:34
RBA: Board expects that some further tightening of monetary policy may well be needed
Following are the key headlines from the Reserve Bank of Australia’s (RBA) April monetary policy statement, via Reuters, as presented by Governor Phillip Lowe.
Expects that some further tightening of monetary policy may well be needed.
Board recognises that monetary policy operates with a lag and that the full effect of this substantial increase in interest rates is yet to be felt.
Board remains resolute in its determination to return inflation to target and will do what is necessary to achieve that.
Board took the decision to hold interest rates steady this month to provide additional time to assess the impact of the increase in interest rates to date and the economic outlook.
Path to achieving a soft landing remains a narrow one.
Australian banking system is strong, well capitalised and highly liquid.
Wages growth is continuing to increase in response to the tight labour market and higher inflation.
Board remains alert to the risk of a prices-wages spiral.
Inflation has peaked in australia, goods price inflation is expected to moderate over the months ahead.
Labour market remains very tight.
As economic growth slows, unemployment is expected to increase.
Growth in the australian economy has slowed.
-
AUD/USD drops below 0.6770 as RBA keeps policy unchanged
About RBA rate decision
RBA Interest Rate Decision is announced by the Reserve Bank of Australia. If the RBA is hawkish about the inflationary outlook of the economy and rises the interest rates it is positive, or bullish, for the AUD. Likewise, if the RBA has a dovish view on the Australian economy and keeps the ongoing interest rate, or cuts the interest rate it is seen as negative, or bearish.
-
-
05:30
Australia RBA Interest Rate Decision in line with forecasts (3.6%)
-
05:30
Breaking: RBA steers rates on a steady course at 3.60% in April, as expected
At its April monetary policy meeting, the Reserve Bank of Australia (RBA) board members decided to leave the Official Cash Rate (OCR) unchanged at 3.60% after ten consecutive interest rate hikes so far.
Markets had placed around an 85% chance the central bank will stand pat on rates this Tuesday.
AUD/USD reaction
In a knee-jerk reaction to the RBA decision, the AUD/USD pair dropped nearly 15 pips to test 0.6770 before recovering to 0.6785, where it was trading before the Policy announcement. The pair is trading modestly flat on the day.
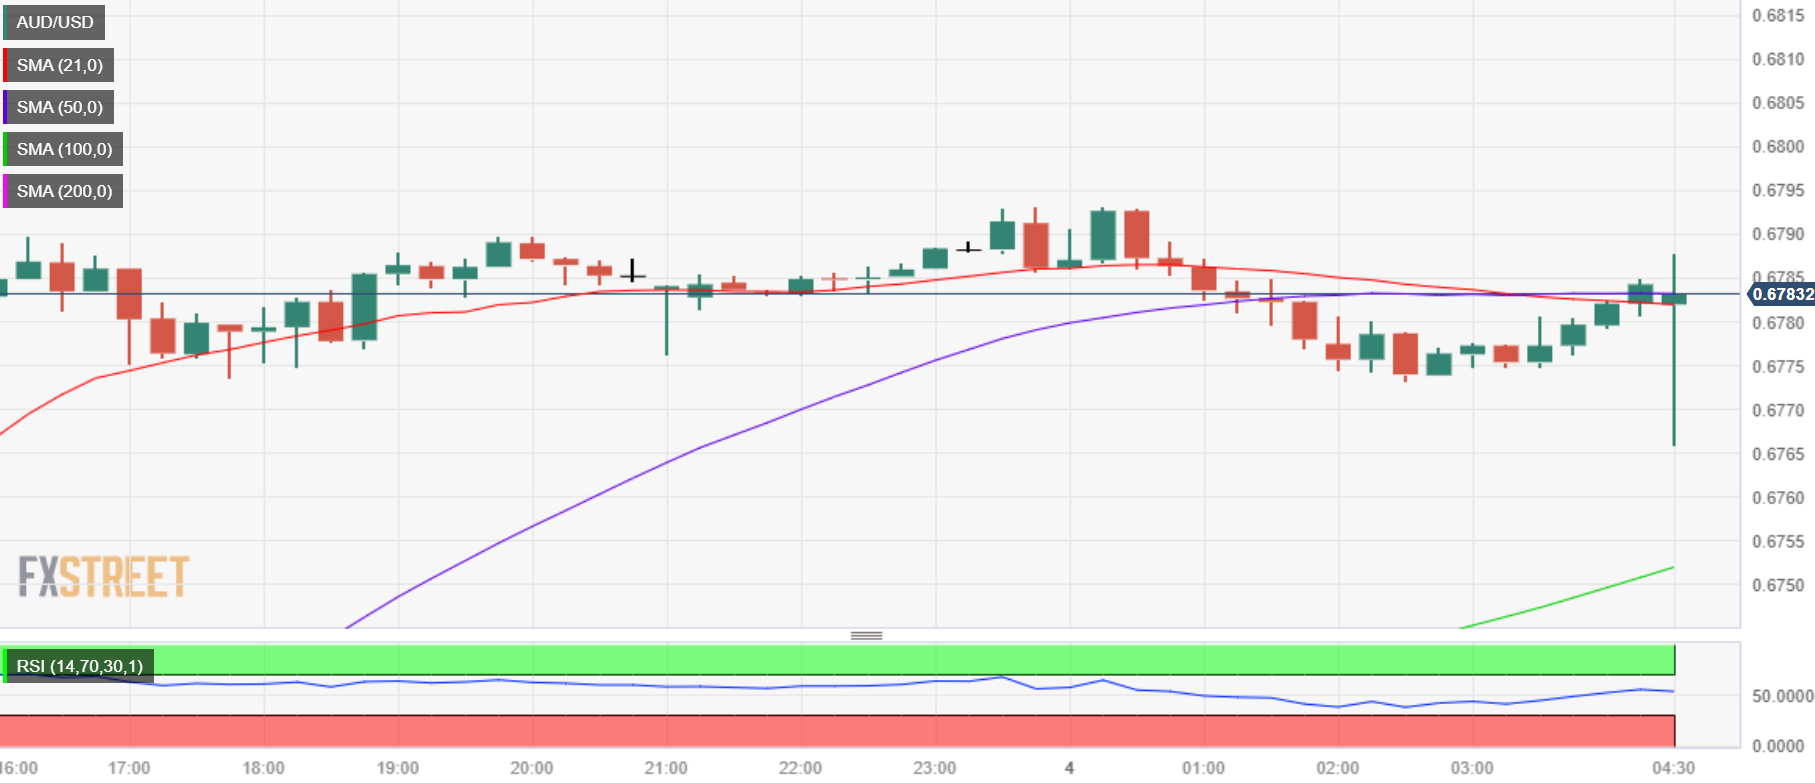
AUD/USD: 15-minutes chart
About RBA rate decision
RBA Interest Rate Decision is announced by the Reserve Bank of Australia. If the RBA is hawkish about the inflationary outlook of the economy and rises the interest rates it is positive, or bullish, for the AUD. Likewise, if the RBA has a dovish view on the Australian economy and keeps the ongoing interest rate, or cuts the interest rate it is seen as negative, or bearish.
-
05:20
EUR/USD retreats towards 1.0850 as US Dollar traces yields, US Factory Orders, Eurozone PPI eyed
- EUR/USD clings to mild losses near 1.0890 as it pares the week-start gains amid sluggish session.
- US Dollar tracks recovery in yields despite downbeat Fed bets, softer US data.
- Russia’s Lavrow indirectly warns Eurozone and weighs on Euro while fresh US-China tension also allows USD to lick its wounds.
- Second-tier US, EU data can entertain traders but risk catalysts are the key to follow for clear directions.
EUR/USD makes rounds to 1.0890-85 as the bulls take a breather amid a light calendar, as well as mildly offbeat sentiment, during early Tuesday. The Euro pair’s latest retreat could also be linked to the rebound in the US Treasury bond yields, which in turn allow the US Dollar to pare the week-start fall ahead of second-tier data.
US Dollar Index (DXY) prints mild gains around 102.20 after falling the most since March 22 the previous day. With this, the greenback’s gauge versus the six major currencies rebound from the one-week low. That said, the US 10-year and two-year Treasury bond yields lick their wounds around 3.42% and 3.98% after printing a four-day and two-day downtrend in that order.
Apart from the corrective bounce in yields, mixed concerns about the inflation and geopolitical woes surrounding Russia and China also weighed on the EUR/USD price. That said, the Organization of the Petroleum Exporting Countries (OPEC) and its allies led by Russia, known as OPEC+, announced a surprise output cut on Monday and renewed inflation fears. However, US President Joe Biden shrugged off the OPEC+ move and said that it is not as bad as you think. However, US Federal Reserve Board Governor Lisa Cook, as well as US Treasury Secretary Janet Yellen flagged fears of higher inflation and challenges to global growth.
Elsewhere, Russian Foreign Minister Sergei Lavrov raised fears of escalating Moscow-Brussels tussle by saying, “The European Union (EU) has "lost" Russia.” The policymaker also added that Moscow will deal with Europe in a tough fashion if need be. Furthermore, the US-China tension is also on the table as Beijing keeps reiterating its dislike for the US-Taiwan ties but Washington seems to ignore it.
Amid these plays, S&P 500 Futures pause a four-day uptrend near the highest levels since February 16.
Moving on, Eurozone Producer Price Index (PPI) for February will precede the US Factory Orders for the said month to direct intraday EUR/USD moves. However, major attention will be given to the risk catalysts after the recent escalation of the geopolitical woes, which in turn can allow the Euro pair to ease.
Technical analysis
Unless declining below the convergence of the 21-DMA and the 50-DMA, around 1.0730-25 by the press time, EUR/USD pair remains on the buyer’s radar.
-
05:03
China Consulate General: China firmly opposes Taiwan leader's transit in the US
Early on Tuesday, China’s Consulate General in Los Angeles spokesperson conveyed their dislike for a meeting between Taiwan President Tsai Ing-wen and US House Speaker Kevin McCarthy.
Key comments
No matter what capacity McCarthy meets with Tsai, it is another serious violation of the one-China principle.
McCarthy - Tsai meeting it is not conducive to regional peace, security and stability.
It is not in the common interests of the people of China and the United States.
We will closely follow developments and resolutely and vigorously defend national sovereignty and territorial integrity.
AUD/USD retreats
The headlines appear challenging the previous risk-on mood and weigh on the AUD/USD prices, down 0.06% intraday to near 0.6780 by the press time.
Also read: AUD/USD Price Analysis: Further upside hinges on 0.6820 breakout and RBA
-
05:01
GBP/USD Price Analysis: Rebounds from 1.2400 as hawkish Fed bets recede
- GBP/USD has shown a recovery move from 1.2400 as hawkish Fed bets have vanished dramatically.
- The USD Index is facing barricades in extending its recovery above 102.20.
- Weaker-than-anticipated US ISM Manufacturing PMI data has deepened fears of recession.
The GBP/USD pair has attempted a recovery after a marginal correction to near 1.2400 in the Tokyo session. The Cable resisted further correction as hawkish Federal Reserve (Fed) bets inspired by upbeat oil prices have receded significantly. All credit goes to weaker-than-anticipated United States ISM Manufacturing PMI data, which has deepened fears of recession.
S&P500 futures have recovered some of the losses registered in the Asian session, indicating a recovery in the risk appetite of the market participants. The US Dollar Index (DXY) is facing barricades in extending its recovery above 102.20 amid an absence of support from the economic indicators.
GBP/USD is gradually marching towards the horizontal resistance plotted from December 14 high at 1.2447 on a daily scale. Advancing 10-and 20-period Exponential Moving Averages (EMAs) at 1.2327 and 1.2257 respectively indicate that the upside momentum is extremely solid.
The Relative Strength Index (RSI) (14) is oscillating in the bullish range of 60.00-80.00. The momentum oscillator is not showing any sign of divergence or overbought situation, bolstering the upside bias.
A decisive move above December 14 high at 1.2447 will expose the asset to the psychological resistance at 1.2500 followed by June 08 high around 1.2600.
In an alternate scenario, a break below March 23 low at 1.2261 will accelerate the downside in the Cable toward the round-level support at 1.2200 and March 10 high at 1.2113.
GBP/USD daily chart
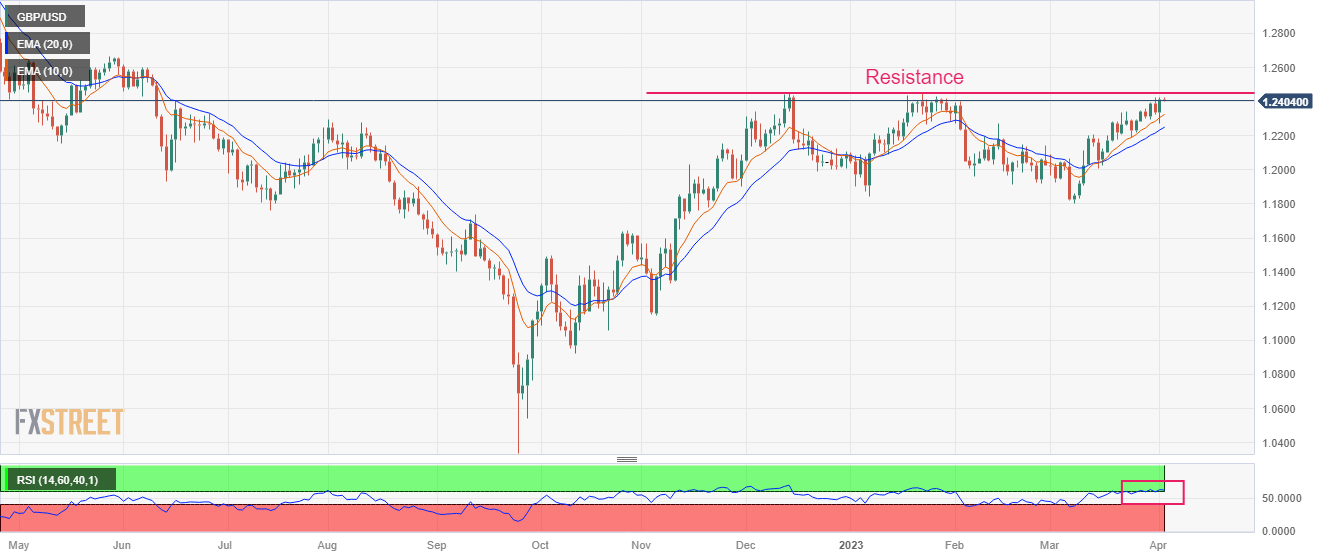
-
04:55
USD/INR Price News: Indian Rupee slides to 82.20 with eys on RBI Interest Rate Decision, US NFP
- USD/INR picks up bids to reverse Monday’s pullback from one-week high.
- Firmer Oil price, US Dollar’s consolidation weighs on Rupee amid India holiday.
- US Factory Orders may entertain intraday traders ahead of Wednesday’s RBI Interest Rate decision.
- Friday’s US NFP appears crucial amid receding hawkish Fed bets.
USD/INR regains upside momentum as bulls prod 82.22 level during early Tuesday, after a downbeat start of the week. In doing so, the Indian Rupee (INR) pair justifies the US Dollar’s corrective bounce amid the Indian holiday and a sluggish trading session of the day.
That said, the US Dollar Index (DXY) prints mild gains around 102.20 after falling the most since March 22 the previous day. With this, the greenback’s gauge versus the six major currencies rebound from the one-week low amid inactive markets.
The mixed concerns surrounding OPEC+ led shock to inflation and the Federal Reserve’s (Fed) next moves seem to have allowed the US Treasury yields and the US Dollar to pare recent losses.
On the same line could be the firmer Oil price, which in turn weighs on the INR due to India’s heavy reliance on energy imports and higher Current Account Deficit (CAD). That said, WTI crude oil rose nearly 7.0% to $81.00 the previous day, up 0.85% intraday to $80.85 by the press time.
It’s worth observing that the Indian Rupee’s latest weakness could be linked to the cautious mood ahead of the RBI.
While portraying the mood, the S&P 500 Futures struggle for clear directions after Wall Street closed mixed whereas the US 10-year and two-year Treasury bond yields remain inactive around 3.42% and 3.98%.
Looking forward, the holiday in India joins a light calendar elsewhere, apart from the US Factory Orders for February, which can allow the USD/INR pair to consolidate recent losses. However, the buyers should remain mindful of the likely hawkish plays of the Reserve Bank of India (RBI), scheduled for Wednesday, as well as the latest downbeat concerns surrounding the Fed.
It should be noted that Wednesday’s US ISM Services PMI, ADP Employment Change and Friday’s Nonfarm Payrolls (NFP), can act as additional catalysts to watch for clear directions, even if the pair traders remain confused after the RBI announcements.
Technical analysis
Despite repeated bounces off a 10-week-old ascending support line, around 82.10 by the press time, the bearish MACD signals and steady RSI (14) challenges USD/INR bulls unless the quote manages to cross descending resistance line from mid-March, near 82.50 at the latest.
-
04:30
Gold Price Forecast: XAU/USD defends $1,980 as steady Fed policy bets soar, US Employment in spotlight
- Gold price is defending the $1,980.00 support as odds for a steady Fed policy have soared.
- Downbeat US Manufacturing PMI has faded the expectations of one more consecutive rate hike from the Fed.
- The USD Index found a cushion near 102.00, however, the upside seems restrictive amid an absence of supportive indicators.
Gold price (XAU/USD) has sensed a cushion of around $1,980.00 after a gradual correction from above $1,990.00 in the Asian session. The precious metal has picked support as the odds for a steady monetary policy by the Federal Reserve (Fed) have soared. The yellow metal has gauged a cushion despite a recovery move by the US Dollar Index (DXY).
The USD Index found a cushion near 102.00 and has rebounded, however, the upside seems restrictive amid the absence of supportive indicators. Downbeat United States ISM Manufacturing PMI has faded the expectations of one more consecutive rate hike from Fed chair Jerome Powell. The US Manufacturing PMI has remained below 50.0, straight for five months, prompting expectations of a steady monetary policy to safeguard the US economy from falling into recession.
As per the CME Fedwatch tool, the odds of an unchanged interest rate decision by the Fed have soared above 56%.
Meanwhile, S&P500 futures are showing minimal losses in the Asian session, indicating signs of some long liquidation after a decent positive swing, portraying minor caution in the overall upbeat market mood.
Going forward, the US Automatic Data Processing (ADP) Employment Change (March) data will remain in the spotlight. Additions of fresh talent in the labor market are expected to land at 205K, lower than the former release of 242K.
Gold technical analysis
Gold price recovered sharply after a fake breakdown of the Symmetrical Triangle formed on an hourly scale. This indicates the presence of responsive buyers at lower levels, indicating that the downside is restricted.
The upward-sloping trendline of the chart pattern is plotted from March 22 low at $1,934.34 while the downward-sloping trendline is placed from March 20 high at $2,009.88. The Gold price is marching towards the upward-sloping trendline and it would be worth observing the price action there.
The 20-period Exponential Moving Average (EMA) at around $1,980.00 is providing support to the Gold bulls.
Meanwhile, the Relative Strength Index (RSI) (14) has slipped into the 40.00-60.00 range, which conveys exhaustion in the upside momentum.
Gold hourly chart

-
03:52
When is the RBA Interest Rate Decision and how could it affect AUD/USD?
After announcing 10 consecutive rate hikes so far, hawks at the Reserve Bank of Australia (RBA) appear running out of steam. However, some on the floors do expect the Aussie central bank to mark the one last hawkish dance before pausing the rate hike trajectory. That said, the RBA is up for an Interest Rate decision around 04:30 AM GMT on Tuesday.
It’s worth noting the RBA is likely to throw dice on the dove’s side as traders remain divided over the 25 basis points (bps) of a rate hike to the 3.60% benchmark rate.
Given the recently mixed statements in the RBA minutes and a contrasting play between inflation and wage numbers, not to forget the talks of policy pivot, the AUD/USD traders will be more interested in hearing about the end of the rate hike trajectory, making this event crucial.
Ahead of the event, Analysts at ANZ said,
We expect a 25bp hike in the cash rate from the RBA today, but the decision will be finely balanced. Looking at the four data releases Governor Lowe highlighted as guiding the decision, we see ongoing resilience: unemployment fell back to 3.5%; NAB business conditions remain robust, price and cost growth remain elevated and firms are still in hiring mode; retail sales were softer at +0.2% m/m, but services spending remained solid; and finally, the monthly CPI showed inflation momentum is not slowing as much as the fall in annual inflation would suggest. All that said, the probability of a pause is the highest it’s been in some time.
On the same line, FXStreet’s Matias Salord said,
Considering the current environment, with doubts about the future of the economy, the impact of the RBA could be short-lived, particularly if it proceeds without major surprises. What could impact the most is how officials see the economy and their outlook. The AUD/USD should benefit from an upbeat perspective. On the contrary, a cautious central bank opting to stay on hold and pointing out that it could stay that way for a while should be (very) negative for the Aussie.
How could the RBA decision affect AUD/USD?
AUD/USD retreats from the highest levels in five weeks while refreshing the intraday low near 0.6770. In doing so, the Aussie pair portrays the pre-RBA anxiety among traders. Also challenging the risk-barometer pair are the fears of EU-Russia tussles and the US-China tension, not to forget the market’s consolidation of the week-start moves amid a light calendar ahead of the RBA Interest Rate Decision.
That said, the RBA is likely to trouble trades even if it manages to announce a 0.25% rate hike, which also is less expected, as the recently softer data and a shift in the RBA’s tone join macro inflation woes.
Should the RBA shows readiness to pause the rate hike trajectory from the next meeting, or surprises the markets by doing the same in today’s RBA Rate Statement, the AUD/USD may have a further downside to trace.
Technically, a convergence of the 200-day EMA and an upward-sloping resistance line from mid-March, around 0.6820 by the press time, appears a tough nut to crack for the AUD/USD buyers.
Key quotes
Reserve Bank of Australia Preview: To pause or not to pause
AUD/USD aptly portrays pre-RBA anxiety at five-week top below 0.6800
AUD/USD Price Analysis: Further upside hinges on 0.6820 breakout and RBA
About the RBA interest rate decision
RBA Interest Rate Decision is announced by the Reserve Bank of Australia. If the RBA is hawkish about the inflationary outlook of the economy and rises the interest rates it is positive, or bullish, for the AUD. Likewise, if the RBA has a dovish view of the Australian economy and keeps the ongoing interest rate, or cuts the interest rate it is seen as negative, or bearish.
-
03:40
USD/JPY Price Analysis: Bounces off 132.30 support confluence but upside remains elusive
- USD/JPY rebounds from one-week-old ascending trend line, 100-SMA to reverse the week-start losses.
- Bearish MACD signals, previous failures to cross 200-SMA keep sellers hopeful.
- 50-SMA, 61.8% Fibonacci retracement acts as an extra filter to the south.
USD/JPY grinds near intraday high of around 132.80 during early Tuesday, following the downbeat start of the key week. In doing so, the Yen pair bounces from a convergence of the 100-bar Simple Moving Average (SMA) and one-week-old ascending trend line to reverse the previous day’s losses.
Although the Yen pair rebounds from the 132.30 support confluence, bearish MACD signals and the failure to cross the 200-SMA, around 134.00 by the press time, challenge the bulls.
Even if the USD/JPY crosses the 134.00 hurdle, a six-week-long horizontal resistance area near 135.10 can restrict the upside moves. It’s worth noting that 135.40 and 136.00 round figures are extra filters towards the north.
Should the quote remains firmer past 136.00, the odds of witnessing a fresh Year-To-Date high, currently around 137.90, can’t be ruled out.
On the flip side, a clear break of the 132.30 support confluence becomes necessary for the USD/JPY bear’s return.
Even so, the 61.8% Fibonacci retracement level of the USD/JPY pair’s February-March upside and 50-SMA, near 131.80, can act as the last defense of the buyers.
Following that, the 130.00 round figure and the previous monthly low near 129.65 may gain the USD/JPY seller’s attention.
Overall, USD/JPY is likely to extend the latest rebound but the recovery moves have limited upside room to cheer.
USD/JPY: Four-hour chart
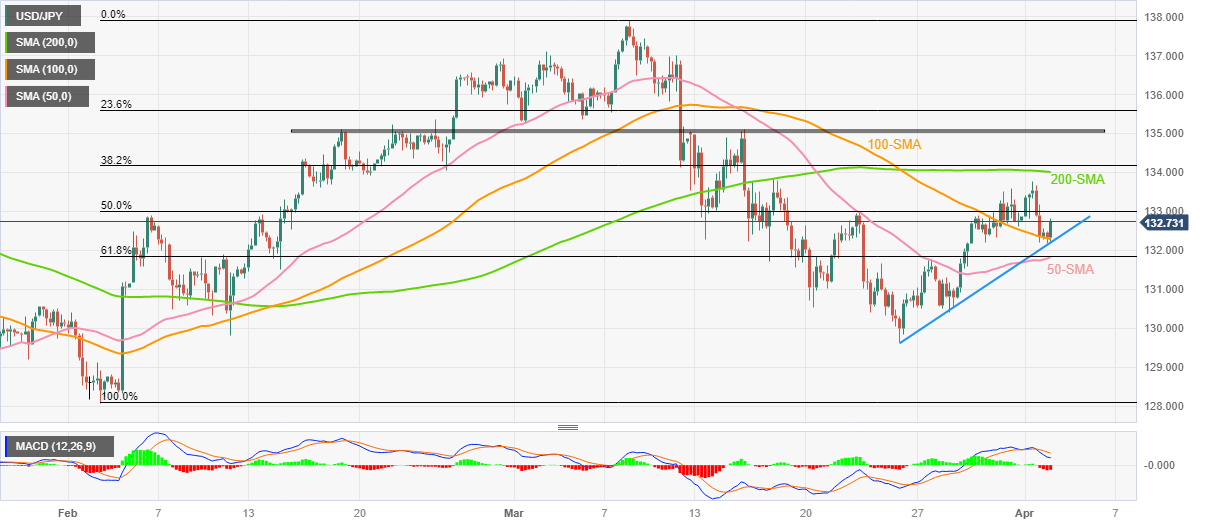
Trend: Pullback expected
-
03:30
Commodities. Daily history for Monday, April 3, 2023
Raw materials Closed Change, % Silver 23.975 -0.3 Gold 1984.12 0.91 Palladium 1460.16 0.56 -
03:19
USD/MXN Price Analysis: Mexican Peso sellers appear well-set to prod 18.15 hurdle
- USD/MXN picks up bids to extend the previous day’s recovery from three-week low.
- Upbeat oscillators, sustained break of 100-HMA and one-week-old descending trend line favor Mexican Peso sellers.
- Three-day-old horizontal resistance challenges USD/MXN bulls ahead of 200-HMA.
USD/MXN holds onto the week-start recovery from a multi-day low as it renews intraday top around 18.10 during early Tuesday. In doing so, the Mexican Peso (MXN) pair extends the previous day’s rebound from a one-week-old resistance-turned-support, as well as an upside break of the 100-Hour Moving Average (HMA).
Given the bullish MACD signals and firmer RSI (14), not overbought, the USD/MXN is likely to extend the latest run-up while justifying Monday’s bullish breakout of the 100-HMA and U-turn from the previous key resistance line.
However, a horizontal line comprising multiple hurdles marked since the last Thursday, near 18.15, appears a tough nut to crack for the USD/MXN buyers.
In a case where the Mexican Peso sellers dominate past 18.15, the 200-HMA resistance surrounding 18.28 can act as the last defense of the USD/MXN bears.
Meanwhile, pullback moves need validation from the 100-HMA support of 18.08 to convince intraday USD/MXN sellers.
Following that, the aforementioned resistance-turned-support of around the 18.00 round figure will be in the spotlight.
Should the USD/MXN manage to keep the reins past 18.00, the latest multi-month low surrounding 17.96 may check the bears before directing them towards the April 2018 bottom of near 17.93.
USD/MXN: Hourly chart
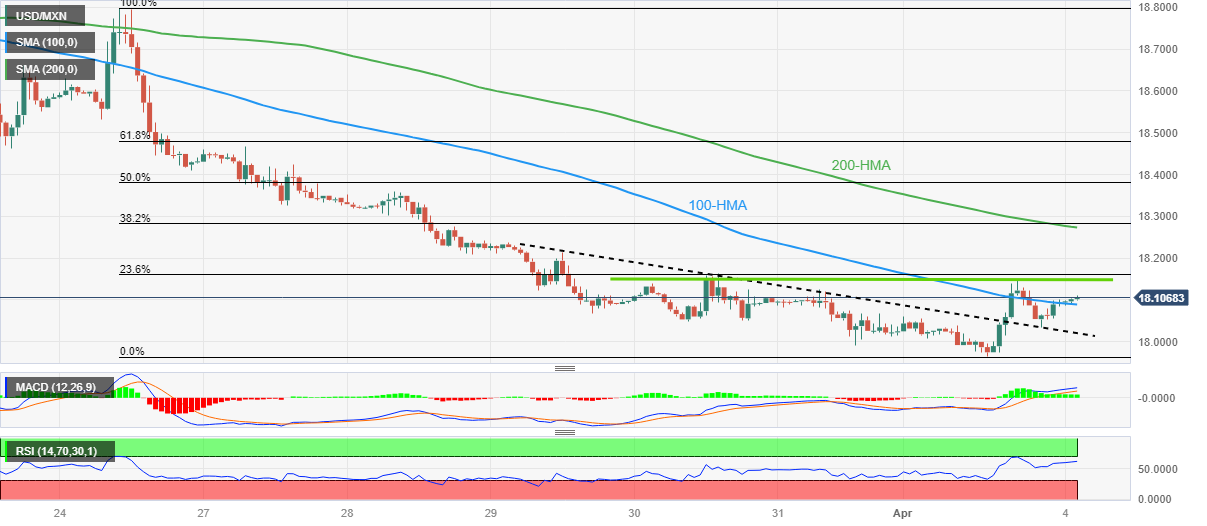
Trend: Further upside expected
-
03:02
S&P 500 Futures dribble at six-week high, yields dwindle amid mixed concerns about inflation, Fed
- Global markets remain dicey as traders reassert week-start moves amid a light calendar.
- S&P 500 Futures seesaw around multi-week high, prods four-day uptrend of late.
- US 10-year, two-year Treasury bond yields pause the previous fall but struggles to recover of late.
- OPEC+ shock gains mixed response amid downbeat US data, geopolitical challenges test optimists.
Traders remain unclear during early Tuesday as a light calendar joins mixed catalysts, after a cautiously optimistic start to the key NFP week.
That said, the mixed concerns over inflation and the Federal Reserve’s (Fed) next moves joined downbeat US data to trouble the market players of late.
While portraying the mood, the S&P 500 Futures seesaw around 4,151, after rising in the last four consecutive days to refresh a six-week high. On the other hand, the US 10-year and two-year Treasury bond yields also remain inactive around 3.42% and 3.98% after the longer-term bond coupons dropped in the last four consecutive days to 3.42% while the shorter one marked a two-day downtrend in the last to 3.97%.
The Organization of the Petroleum Exporting Countries (OPEC) and its allies led by Russia, known as OPEC+, announced a surprise output cut on Monday and renewed inflation fears. However, US President Joe Biden shrugged off the OPEC+ move and said that it is not as bad as you think, which in turn might have allowed the Gold price to remain firmer despite the inflation woes.
On the other hand, US Federal Reserve Board Governor Lisa Cook, as well as US Treasury Secretary Janet Yellen flagged fears of higher inflation and challenges to global growth.
However, softer US data and yields allowed traders to remain optimistic, especially amid the receding hawkish Fed bets. On Monday, the US ISM Manufacturing PMI dropped to the lowest levels since May 2020 in March, to 46.3 versus 47.5 expected and 47.7 prior. On the same line, the final readings of March’s S&P Global Manufacturing PMI eased to 49.2 compared to 49.3 initial estimations. The weaker PMI data traced the last week’s softer prints of the US Core Personal Consumption Expenditure (PCE) Price Index, the Fed’s preferred inflation gauge, to weigh on the market’s Fed bets. As a result, the CME’s FedWatch Tool marks nearly 45% market bets on the Fed’s 0.25% rate hike in May, versus 52% expected on Friday.
Elsewhere, Russian Foreign Minister Sergei Lavrov raised fears of escalating Moscow-Brussels tussle by saying, “The European Union (EU) has "lost" Russia.” The policymaker also added that Moscow will deal with Europe in a tough fashion if need be. Furthermore, the US-China tension is also on the table as Beijing keeps reiterating its dislike for the US-Taiwan ties but Washington seems to ignore it.
Looking ahead, US Factory Orders for February may entertain intraday traders amid a light calendar elsewhere. However, risk catalysts and cautious mood ahead of this week’s key US jobs report can check the optimists.
Also read: Forex Today: Markets remain upbeat despite OPEC+ surprise output cut; RBA next
-
02:57
Silver Price Forecast: XAG/USD corrects from $24.00 as USD Index shows recovery, US Employment eyed
- Silver price has failed to reclaim the immediate resistance of $24.00.
- The USD Index has built an intermediate cushion around 102.00 amid hawkish commentary from Fed Cook.
- The release of the US Employment data will provide clear guidance for May's monetary policy.
Silver price (XAG/USD) has corrected marginally after failing to surpass the $24.00 resistance in the Asian session. The white metal has shown a modest decline amid the recovery move displayed by the US Dollar Index (DXY). After building a cushion around 102.00, the USD Index has rebounded to near 102.15, however, the downside looks favored in hopes that the Federal Reserve (Fed) would choose a steady stance on interest rates in its May monetary policy meeting.
S&P500 futures are looking to recover the entire losses generated in early Asia. The overall market mood is cheerful therefore the demand for risk-perceived assets is healthy. The 10-year US Treasury yields have rebounded marginally to near 3.43% ahead of the United States Automatic Data Processing (ADP) Employment Change (March) data, which will release on Wednesday. As per the consensus, the US economy has added 205K jobs in March vs. the prior release of 242K.
Lower labor additions after a downbeat US ISM Manufacturing PMI will bolster the need for a pause in the policy-tightening spell by the Fed. As per the CME Fedwatch tool, more than 50% of investors are still anticipating one more 25 basis points (bps) rate hike to 5.00-5.25%. However, a big shuffle is expected after the release of the Employment data.
US Fed Board Governor Lisa Cook on Monday said that the US has low unemployment and high inflation. Thus, the Fed is currently focused on inflation and the disinflationary process is underway, but we are not there yet. The commentary has provided some cushion to the US Dollar.
Silver technical analysis
Silver price has dropped after observing a restricted upside near the previous week's high at $24.16 on an hourly scale. The white metal has slipped below the 20-period Exponential Moving Average (EMA) at $24.00, which indicates that the short-term trend has turned bearish. The asset is expected to find a cushion near Monday’s low at $23.58.
Meanwhile, the Relative Strength Index (RSI) (14) has slipped into the 40.00-60.00 range from the bullish range of 60.00-80.00, which indicates a loss in the upside momentum.
Silver hourly chart
-638161701164771308.png)
-
02:55
EUR/USD bulls could be throwing in the towel at key resistance
- EUR/USD bulls are testing key resistance.
- Eyes will turn to the US NFP on Friday.
EURUSD was last seen flat at 1.0894, having gained more than 0.5% on Monday but meeting resistance as the bulls start to move out. The sluggish U.S. economic data weighed on the greenback on Monday which enabled the euro to rally strongly.
The Institute for Supply Management (ISM) survey showed on Monday that manufacturing activity fell to the lowest level in nearly three years in March as new orders continued to contract, with all subcomponents of its manufacturing PMI below the 50 thresholds for the first time since 2009, sending the US Dollar lower.
Elsewhere, traders believe the European Central Bank will keep raising interest rates in the coming months to combat inflation. Data released on Friday showed an acceleration in core price growth in the euro area, while a measure of core inflation in the US arrived a touch lower than expected at 4.6%.
Meanwhile, last month, ECB President Lagarde said that the central bank was determined to get the inflation back on target and it won’t involve “trade-offs" despite the recent banking turmoil and risks of a recession. In addition, the renewed inflation fears after the OPEC+ group has jolted markets with plans to cut more production, a move which sent oil benchmarks jumping 6% on Monday.
Eyes on US jobs this Friday
Looking ahead, the focus this week will be on Friday's jobs report, although many markets will be closed for the Easter holiday.
´´US payrolls likely stayed firm at a still above-trend pace in March, though slowing from stronger prints in Jan-Feb,´´ the analysts at TD Securities explained.
´´We also look for the Unemployment Rate to stay unchanged at 3.6%, and wage growth to print a firm 0.3% MoM.´´
-
02:29
AUD/USD Price Analysis: Further upside hinges on 0.6820 breakout and RBA
- AUD/USD seesaws around five-week high after positing the biggest daily jump in three months.
- Convergence of 200-EMA, three-week-old ascending trend line challenges Aussie pair buyers.
- Hopes of dovish rate hike also raise doubts about bullish bias.
- Upbeat RSI, bullish MACD signals keep AUD/USD buyers hopeful unless the quote stays beyond 100-EMA.
AUD/USD aptly portrays the pre-RBA anxiety as it makes rounds to 0.6780-85 during early Tuesday, following the strongest daily run-up since early January.
Mixed concerns about the Reserve Bank of Australia’s (RBA) Interest Rate Decision challenge the AUD/USD bulls even if a clear upside break of the 100-day Exponential Moving Average (EMA) keeps them hopeful.
Also read: AUD/USD aptly portrays pre-RBA anxiety at five-week top below 0.6800
Adding strength to the upside bias are the bullish MACD signals and firmer RSI (14) line, not overbought.
However, a convergence of the 200-day EMA and an upward-sloping resistance line from mid-March, around 0.6820 by the press time, appears a tough nut to crack for the AUD/USD buyers.
Following that, the 0.6900 and the 0.7000 round figure may act as intermediate halts during the likely run-up targeting the mid-February swing high of around 0.7030.
Meanwhile, pullback moves need to conquer the 100-day EMA level of 0.6770 to convince short-term AUD/USD sellers.
Even so, 0.6720 and the previous day’s low surrounding 0.6650 could challenge the pair bears before giving them control. In that case, the Year-To-Date low of 0.6564 will be in focus.
AUD/USD: Daily chart

Trend: Limited upside expected
-
02:23
USD/CNY fix: 6.8699 versus the previous close of 6.8770
In recent trade today, the People’s Bank of China (PBOC) set the yuan at 6.8699 versus the previous close of 6.8770.
About the fix
China maintains strict control of the yuan’s rate on the mainland.
The onshore yuan (CNY) differs from the offshore one (CNH) in trading restrictions, this last one is not as tightly controlled.
Each morning, the People’s Bank of China (PBOC) sets a so-called daily midpoint fix, based on the yuan’s previous day's closing level and quotations taken from the inter-bank dealer.
-
02:11
USD/CHF eyes a bumpy ride below 0.9100 as Fed to pause rate hikes to dodge US recession
- USD/CHF is expected to witness a bumpy ride as the Fed is likely to announce an early pause in the rate-hiking spell.
- Escalated US recession fears after the release of a downbeat US ISM Manufacturing PMI are required to be tamed.
- The SNB will do everything to bring inflation down including hiking interest rates further as well as selling foreign currencies.
The USD/CHF pair is displaying topsy-turvy moves in a narrow range around the immediate support of 0.9120 in the Asian session. The Swiss Franc asset is expected to witness sheer selling pressure after surrendering the round-level support of 0.9100. The downside bias for USD/CHF is backed by rising expectations for a pause in the policy-tightening spell by the Federal Reserve (Fed).
Last week, Fed chair Jerome Powell in a private meeting with United States lawmakers anticipated one more rate hike in 2023. An absence of a time period fades the expectations of that rate hike in the May monetary policy tightening.
Also, escalated recession fears after the release of a downbeat US ISM Manufacturing PMI are required to be tamed, which could be done through infusing confidence among investors that the Fed is also focusing on securing the economy from contraction apart from focusing on achieving price stability.
Meanwhile, S&P500 futures are recovering marginal losses reported in the early Asian session as the risk appetite of the market participants is extremely solid. The US Dollar Index (DXY) has attempted a rebound after building a cushion near 102.00, however, the downside looks likely ahead. The demand for US government bonds has also seen some decline. This has led to a decline in the losses in 10-year US Treasury yields, which has pushed them to 3.43%.
On the Swiss Franc front, rising inflationary pressures are creating troubles for the Swiss National Bank (SNB). SNB Vice Chairman Martin Schlegel told Swiss broadcaster SRF in an interview broadcast on Monday that the Swiss National Bank will do everything it can to bring inflation down including hiking interest rates further as well as selling foreign currencies.
-
02:10
USD/CAD bears in control and target lower levels in support area
- USD/CAD bears are in control as oil price rallies and US Dollar stays soft.
- Canadian inflation expectations still provide a very high bar for near-term easing.
USD/CAD is flat on the day following a series of bearish impulses that has forced the price into fresh territories to the downside and deeper into a support area owing to the rally in the oil price. At the time of writing, USD/CAD is trading at 1.3431.
CAD was supported by West Texas Intermediate WTI crude oil that rose 6.3% on Monday to a high of the day at $81.51. The rally in the oil price came after the OPEC+ cartel surprised the market with a 1.1-million barrel per day cut to production to support prices with the cartel saying it will reduce output ahead of the group's ministerial meeting scheduled for Monday.
Domestically, the focus was on the Bank of Canada's Business/Consumer Surveys that painted a more dovish backdrop heading into the April BoC meeting, with a substantial improvement in capacity pressures and consumer inflation expectations, analysts at TD Securities said.
´´Firm-level inflation expectations remain elevated and consumer expectations for growth and income also ticked higher from Q4,´´ the analysts noted.
´´The BoC should be pleased with these results as they speak to weaker capacity pressures and moderating inflation pressures, but inflation expectations still provide a very high bar for near-term easing. The economy has also shown signs of a rebound in Q1, so if growth does not slow sharply in Q2 then the Bank of Canada may find it difficult to keep rates at 4.50%.´´ The analysts concluded that the report is bullish for CAD.
USD/CAD weekly chart

This leaves scope for more downside in USD/CAD and technically, the outlook is also bearish. While the M-formation could be deemed as a meanwhile bullish pattern, there is room for further downside, both near term and medium term.
USD/CAD daily chart

The daily chart shows the price moving strongly into support which gives rise to prospects of more to come before a correction is due.
-
02:01
AUD/JPY seesaws around three-week high of 90.00 as RBA rate hike seems a close call
- AUD/JPY makes rounds to multi-day high after rising the most in seven weeks the previous day.
- Sluggish yields, light calendar amplify pre-RBA anxiety as traders remain divided over the Aussie central bank’s next move.
- RBA may offer 0.25% rate hike amid a close call.
- Focus on Rate Statement due to chatters of pause in rate hikes.
AUD/JPY grinds higher around the 90.00 round figure as it portrays the market’s anxiety ahead of the Reserve Bank of Australia’s (RBA) Interest Rate Decision on early Tuesday.
The cross-currency pair, also known as the risk-barometer, rallied the most in seven weeks the previous day as traders brace for the dovish RBA hike and ignored inflation fears emanating from the Organization of the Petroleum Exporting Countries (OPEC) and its allies led by Russia, known as OPEC+, move.
It’s worth noting that the downbeat yields and mixed data from China and Australia also failed to stop the AUD/JPY bulls the previous day amid cautious optimism in the market. On Monday, the US 10-year Treasury bond yields dropped in the last four consecutive days to 3.42% at the latest while the two-year counterpart marked a two-day downtrend in the last to 3.97%.
That said, Australia’s TD Securities Inflation eased to 0.3% MoM and 5.7% YoY for March versus 0.4% and 6.3% respective priors. Further, China’s Caixin Manufacturing PMI for March drops to 50.0 from 51.6 prior and 51.7 market forecasts.
On the other hand, Japan’s Tankan Large Manufacturing Index for the first quarter (Q1) of 2023, a closely observed output guide by the Bank of Japan (BoJ), eased to 1.0 from 7.0 previous readings and 3.0 expected. On the other hand, Japan’s Jibun Bank Manufacturing PMI for March improved to 49.2 from 48.6 previous. However, the below-50 figure suggests a contraction in private manufacturing activities.
Amid these plays, the S&P 500 Futures struggle for clear directions after Wall Street closed mixed.
Looking ahead, the AUD/JPY traders should carefully watch signals for the RBA’s next moves amid a close call of announcing 25 basis points (bps) of a rate hike. Even if the Aussie central bank announces the rate hike, the bears could sneak in if the RBA Statement utters a policy pivot.
Also read: Reserve Bank of Australia Preview: To pause or not to pause
Technical analysis
Although a one-week-old ascending support line, around 89.00, puts a floor under the AUD/JPY price, the buyers need to cross the 50-day Exponential Moving Average (EMA) hurdle of around 90.00 to keep the reins.
-
01:44
Gold Price Forecast: XAU/USD traces dicey yields below $2,000 as Federal Reserve rate hikes appear difficult
- Gold price struggles to keep the week-start gains, sidelined of late.
- Downbeat United States economics, softer yields weigh on Federal Reserve bets, allowing XAU/USD to rise.
- US job numbers will be crucial to watch as Gold price approach the $2,000 key upside hurdle.
Gold price (XAU/USD) remains sluggish around $1,985 during early Tuesday, following a positive start to the Nonfarm Payrolls (NFP) weeks. The yellow metal’s latest inaction could be linked to a light calendar and lack of major data/events. However, downbeat United States statistics and softer Treasury bond yields exert downside pressure on the US Dollar and allow the XAU/USD buyers to keep the reins.
Gold price marches on softer yields, downbeat Federal Reserve bets
Gold price managed to cheer downbeat United States activity numbers on Monday, following Friday’s softer US inflation clues. That said, the US ISM Manufacturing PMI dropped to the lowest levels since May 2020 in March, to 46.3 versus 47.5 expected and 47.7 prior. On the same line, the final readings of March’s S&P Global Manufacturing PMI eased to 49.2 compared to 49.3 initial estimations. The weaker PMI data traced the last week’s softer prints of the US Core Personal Consumption Expenditure (PCE) Price Index, the Fed’s preferred inflation gauge, to weigh on the market’s Fed bets.
With this, the US 10-year Treasury bond yields dropped in the last four consecutive days to 3.42% at the latest while the two-year counterpart marked a two-day downtrend in the last to 3.97%. Further, the CME’s FedWatch Tool marked nearly 43% market bets on the Fed’s 0.25% rate hike in May, versus 52% expected on Friday.
Hence, softer US data and yields, not to forget receding hawkish calls of the Federal Reserve’s (Fed) next move, weigh on the US Dollar Index (DXY) and allow the Gold buyers to remain hopeful despite the latest retreat.
Softer China PMI, inflation woes fail to stop XAU/USD bulls
While cheering the softer United States data and yields, the Gold price fails to justify downbeat activity numbers from one of the world’s biggest XAU/USD consumers, namely China. That said, China’s Caixin Manufacturing PMI for March drops to 50.0 from 51.6 prior and 51.7 market forecasts. It’s worth noting that the dragon nation’s official activity data flashed mixed readings the previous week as the NBS Manufacturing PMI eased from the previous readings while the Non-Manufacturing PMI came in stronger.
On the other hand, the Organization of the Petroleum Exporting Countries (OPEC) and its allies led by Russia, known as OPEC+, announced a surprise output cut on Monday and renewed inflation fears. However, US President Joe Biden shrugged off the OPEC+ move and said that it is not as bad as you think, which in turn might have allowed the Gold price to remain firmer despite the inflation woes.
United States employment data eyed for Gold price directions
Given the light calendar on Wednesday, Gold price is likely to remain dicey and may witness a corrective pullback in a case where the market sentiment worsens and trigger a rebound in the United States Treasury bond yields, as well as the US Dollar. As a result, headlines surrounding inflation and banking, as well as the US Factory Orders for February, will be crucial to watch for intermediate directions. However, major attention should be given to Wednesday’s US ISM Services PMI, ADP Employment Change and Friday’s Nonfarm Payrolls (NFP) for a better view of the Gold price.
Also read: Gold Price Forecast: On its way to challenge sellers around $2,000
Gold price technical analysis
Despite the latest inaction, Gold price defends the week-start rebound from the 100-bar Simple Moving Average (SMA), as well as keeps the upside break of a one-week-old descending trend line. In doing so, the XAU/USD bulls gear up for battle with the $2,000 horizontal hurdle for one more time.
Given the firmer Relative Strength Index (RSI), placed at 14, and bullish signals from the Moving Average Convergence and Divergence (MACD) indicator, the XAU/USD is likely to cross the aforementioned key hurdle.
Following that, the previous monthly high of around $2,010 and the $2,050 round figure may act as intermediate halts during the likely run-up towards the year 2022 peak near $2,070.
Meanwhile, the 100-SMA precedes three-week-old horizontal support to restrict short-term Gold price downside around $1,950 and $1,935-33.
In a case where the XAU/USD slips beneath the $1,933 support, the $1,900 threshold will precede the 200-SMA support of $1,891 to act as the last defense of the Gold buyers.
Gold price: Four-hour chart
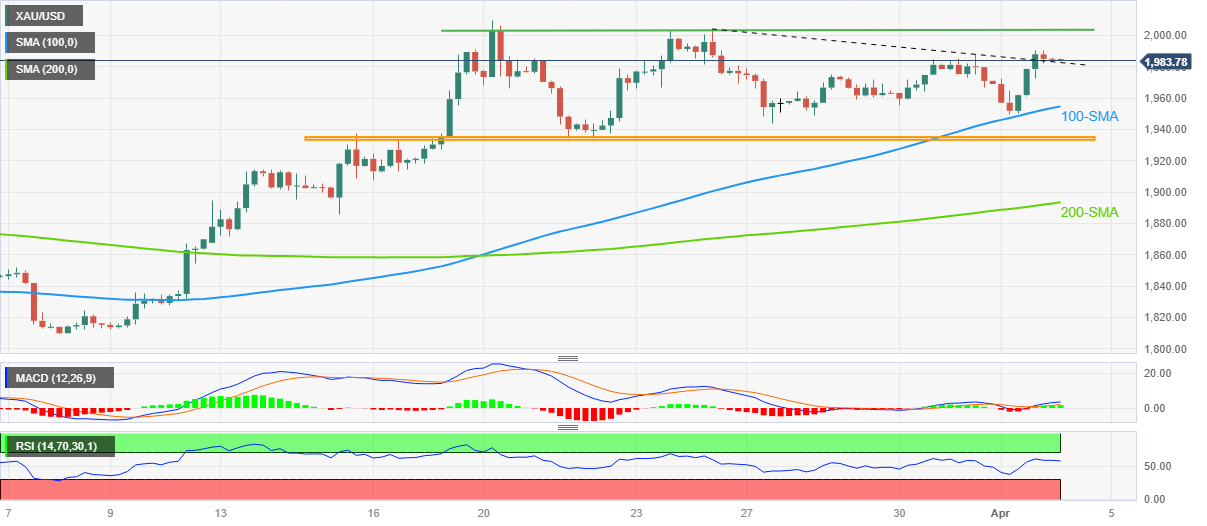
Trend: Further upside expected
-
01:42
GBP/USD bulls eye a higher high ahead of US Services
- GBP/USD staying on course for a higher high.
- All eyes will turn to US Sevices PMI and Friday´s NFP.
GBP/USD bulls stay in the game and have not thrown in the towel yet, testing the upside and scoring a high of 1.2425 so far after a day where the US Dollar fell swiftly in the US session. GBP/USD bulls capitalized on the move and the pair rallied from a low of 1.2274 to 1.2324.
Monday's economic reports that showed US manufacturing activity in March slumped to its lowest level in nearly three years as new orders continued to contract. The Institute for Supply Management (ISM) reported that its Manufacturing PMI fell to 46.3 last month. This was the worst since May 2020, from 47.7 in February.
Last week’s PCE data, the Federal Reserve´s preferred inflation measure, were mixed. While headline and core both came in a tick lower than expected, super core accelerated for a second straight month to 4.63% YoY and is the highest since October. ´´This is not the direction that the Fed desires and so we look for the hawkish tilt in Fed comments to continue,´´ analysts at Brown Brothers Harriman explained.
With regards to the Federal Reserve, credit disintermediation is central to the market’s expectation that the FOMC will start cutting interest rates from September, analysts at ANZ Bank said.
´´To validate that outlook, activity and credit data will need to start weakening precipitously in Q2. This week brings a full round of labour market data. It’s clearly early days in terms of banking turmoil impact, but the data will nonetheless have a significant impact on expectations for the May FOMC meeting. Currently, the market is 60% priced for a 25bp rate hike,´´ the analysts explained.
Traders will now await the Services data tomorrow and Nonfarm Payrolls on Friday. ´´We look for the ISM Services index to retreat after showing signs of stabilization at a still-firm level of ~55 in Jan-Feb,´´ analysts at TD Securities said.
US jobs eyed
Looking ahead, the focus this week will be on Friday's jobs report, although many markets will be closed for the Easter holiday.
´´US payrolls likely stayed firm at a still above-trend pace in March, though slowing from stronger prints in Jan-Feb,´´ the analysts at TD Securities explained.
´´We also look for the Unemployment Rate to stay unchanged at 3.6%, and wage growth to print a firm 0.3% MoM.´´
-
01:41
Argentina Tax Revenue (MoM) climbed from previous 2126.34B to 2336.94B in March
-
01:31
EUR/JPY Price Analysis: Formation of a symmetrical triangle conveys volatility contraction
- EUR/JPY has witnessed a buying interest after a gradual correction to near 144.20 on Japan’s open.
- Higher oil prices after the announcement of production cuts from OPEC+ have fueled inflation expectations in Eurozone.
- EUR/JPY is auctioning in a triangle pattern that indicates a sheer volatility contraction and conveys an absence of a potential trigger.
The EUR/JPY pair has sensed a buying interest after a gradual correction to near 144.20 in the early Asian session. The cross remained lackluster on Monday despite rising bets for an interest rate hike by the European Central Bank (ECB) ahead.
Higher oil prices after the announcement of production cuts from OPEC+ have fueled inflation expectations in Eurozone. This might force ECB President Christine Lagarde to continue its rate-hiking spell to keep weighing on inflationary pressures.
Meanwhile, the Japanese Yen managed to keep its feet firmer despite a solid rally in the oil price. It is worth noting that Japan is one of the leading importers of oil in the world and higher oil prices generally hurt the Japanese Yen.
On an hourly scale, EUR/JPY is auctioning in a Symmetrical Triangle chart pattern that indicates a sheer volatility contraction and conveys an absence of a potential trigger. The downward-sloping trendline of the chart pattern is placed from March 31 high at 145.67 while the upward-sloping trendline is plotted from March 30 low at 143.14.
Overlapping 20-period Exponential Moving Average (EMA) at 144.35 with the asset price indicates a sideways performance ahead.
Also, the Relative Strength Index (RSI) (14) is hovering in the 40.00-60.00 range, indicating a lackluster movement ahead.
Going forward, a break above April 03 high at 144.94 would drive the asset towards December 16 high at 146.72 followed by October 20 high around 147.30.
On the flip side, a break below March 30 low at 143.13 would drag the cross toward March 14 low at 142.53 and March 13 low at 141.57.
EUR/JPY hourly chart
-638161649734265452.png)
-
01:30
Stocks. Daily history for Monday, April 3, 2023
Index Change, points Closed Change, % NIKKEI 225 146.67 28188.15 0.52 Hang Seng 9.07 20409.18 0.04 KOSPI -4.52 2472.34 -0.18 ASX 200 45.2 7223 0.63 FTSE 100 41.3 7673 0.54 DAX -47.92 15580.92 -0.31 CAC 40 23.57 7345.96 0.32 Dow Jones 327 33601.15 0.98 S&P 500 15.2 4124.51 0.37 NASDAQ Composite -32.46 12189.45 -0.27 -
01:16
EUR/USD Price Analysis: Bulls eye 1.0930 key upside hurdle
- EUR/USD grinds higher after upbeat start to the NFP week.
- Bullish MACD signals, ascending RSI (14) line keeps buyers hopeful of overcoming 10-week-old horizontal resistance.
- Short-term DMA confluence, ascending trend line from September challenge Euro bears.
EUR/USD holds onto the week-start strength as bulls approach the all-important 1.0930 resistance, around 1.0910 by the press time of early Tuesday.
In doing so, the Euro pair justifies the bullish MACD signals and the upward-sloping RSI (14) line, not overbought.
Adding strength to the upside bias is the Euro pair’s successful trading beyond the convergence of the 21-DMA and the 50-DMA, around 1.0730-25 by the press time.
As a result, the EUR/USD buyers are likely to overcome the key resistance area comprising multiple levels marked since late January 2023.
Following that the Year-To-Date (YTD) high of 1.1033 may act as an extra filter towards the north before directing the EUR/USD bulls to the 61.8% Fibonacci Expansion (FE) of its November 2022 to March 2023 moves, near 1.1190.
It should be noted that the 1.000 psychological magnet may also check the Euro pair buyers.
Meanwhile, a downside break of the aforementioned DMA confluence, near 1.0730-25, isn’t an open invitation to the EUR/USD bears as an ascending support line from September 2022, close to1.0630 at the latest, could act as the last defense of the buyers.
In a case where the Euro pair remains below 1.0630, its slump to the previous monthly low of 1.0548 can’t be ruled out.
EUR/USD: Daily chart
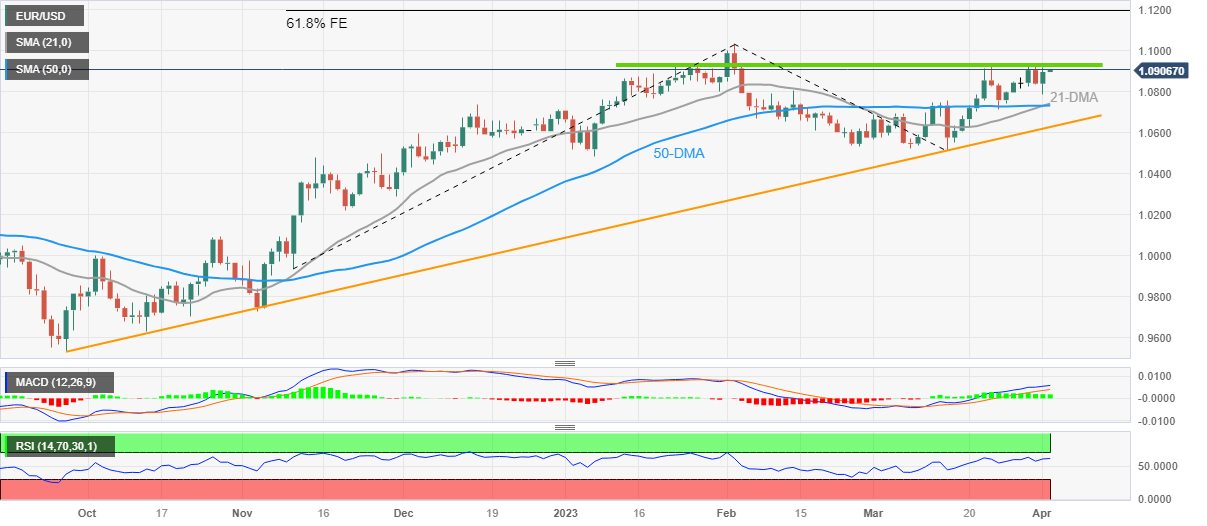
Trend: Further upside expected
-
01:15
Currencies. Daily history for Monday, April 3, 2023
Pare Closed Change, % AUDUSD 0.67828 1.53 EURJPY 144.359 0.09 EURUSD 1.09007 0.6 GBPJPY 164.419 0.24 GBPUSD 1.24176 0.76 NZDUSD 0.62927 0.73 USDCAD 1.34278 -0.58 USDCHF 0.91227 -0.35 USDJPY 132.42 -0.51 -
01:05
USD/JPY bears approach 132.00 as yields drop on softer US PMI, downbeat Fed concerns
- USD/JPY remains depressed after reversing from two-week high.
- Yields drop as US PMI traces downbeat inflation clues, receding hawkish Fed bets.
- Japan PM Kishida assures stable financial system at home, pledges more investments.
- Tuesday’s light calendar can allow Yen pair to consolidate recent losses if risk catalysts permit.
USD/JPY slides to 132.20 while extending the week-start reversal from the highest level in a fortnight. That said, the Yen pair’s latest losses could be linked to the downbeat US Treasury bond yields, as well as softer data, not to forget upbeat comments from Japan Prime Minister Fumio Kishida.
After assuring the stability of the financial system at home, Japan PM Kishida pledged more investment to please the Yen pair sellers. “It is necessary to speed up private investment through green transformation bonds to promote decarbonization domestically,” said Japan PM Kishida.
Talking about the yields, the US 10-year Treasury bond yields dropped in the last four consecutive days to 3.42% at the latest while the two-year counterpart marked a two-day downtrend in the last to 3.97%.
Softer US PMIs joined the market’s lack of inflation fears from the OPEC+ supply cuts and the resulting Oil price run-up to weigh on the yields. That said, the US ISM Manufacturing PMI dropped to the lowest levels since May 2020 in March, to 46.3 versus 47.5 expected and 47.7 prior. On the same line, the final readings of March’s S&P Global Manufacturing PMI eased to 49.2 compared to 49.3 initial estimations.
At home, Japan’s Tankan Large Manufacturing Index for the first quarter (Q1) of 2023, a closely observed output guide by the Bank of Japan (BoJ), eased to 1.0 from 7.0 previous readings and 3.0 expected. On the other hand, Japan’s Jibun Bank Manufacturing PMI for March improved to 49.2 from 48.6 previous. However, the below-50 figure suggests a contraction in private manufacturing activities.
It should be noted that the downbeat Fed calls also weigh on the yield and the USD/JPY prices. As per the latest read, the CME’s FedWatch Tool marked nearly 43% market bets on the Fed’s 0.25% rate hike in May, versus 52% expected on Friday.
Amid these plays, Wall Street closed mixed and the yields were down while the US Dollar Index (DXY) dropped the most in a fortnight the previous day to test the lowest levels in two months. Further, the S&P 500 Futures struggle for clear directions.
Moving forward, USDJPY may pare recent losses amid a light calendar but downbeat yields and inflation fears, led by the OPEC+ surprise, may weigh on the Yen pair ahead of this week’s key US jobs report, up for publishing on Friday.
Technical analysis
A U-turn from the 100-DMA, around 133.75 by the press time, directs USD/JPY towards an ascending support line from mid-January, close to 130.70 at the latest.
-
00:54
Japan Monetary Base (YoY) below expectations (1.3%) in March: Actual (-1%)
-
00:53
US Dollar Index eyes below 102.00 as weak US PMI prompts pause in Fed’s tightening spell
- The USD Index is expected to drift below 102.00 as the risk-on mood remains firmer.
- Weak US ISM Manufacturing PMI has prompted an early pause in Fed’s tightening spree.
- The release of the US Employment data will provide more clarity over Fed’s rate guidance.
The US Dollar Index (DXY) is displaying a back-and-forth action above the immediate support of 102.00 in the Asian session. The asset is prone to print a fresh two-month low below 102.00 as the risk appetite theme is underpinned by investors after inspiring by the anticipation of a pause in the policy-tightening process by the Federal Reserve (Fed).
S&P500 futures are showing nominal losses in the early Asian session. United States equities settled Monday’s session on a positive note as the Fed would announce an early pause to the rate-hiking spell. This led to a jump in the demand for US government bonds. The 10-year US Treasury yields have slipped to near 3.41%. The commentary from US Treasury Secretary Janet Yellen that the surprise announcement of oil production cuts by OPEC+ will add uncertainty to the global growth outlook has failed to spoil the upbeat market mood.
Weak PMI prompts an early pause in Fed’s tightening spree
The release of the downbeat US ISM Manufacturing PMI data on Monday has raised the chances of a recession in the economy. Monday’s Manufacturing PMI landed below 50.0 straight for the fifth time as higher rates by Fed chair Jerome Powell have trimmed the overall demand. A figure of 50.0 acts as a silver line that separates growth from contraction. The economic data contracted to 46.3 from the consensus of 47.5 and the former release of 47.7.
Apart from that, the New Orders Index that conveys forward demand has contracted to 44.3 from the expectations of 44.6, indicating a subdued demand outlook. Therefore, the Fed could consider a pause in the policy-tightening spell to trim accelerating recession fears ahead.
Employment data to provide more clarity
Investors would get meaningful clarity about the interest rate guidance after the release of the US Nonfarm Payrolls (NFP), which will release on Friday. Vigorous demand for labor would indicate that demand is still robust, which is why the hiring process is still active. But before that, Wednesday’s Automatic Data Processing (ADP) Employment Change (March) data will be keenly watched. As per the consensus, the economic data will release lower at 205K vs. the prior release of 242K.
-
00:37
Japan PM Kishida: Necessary to speed up private investment through green transformation bond
Japan Prime Minister Fumio Kishida crossed wires via Reuters early Tuesday while pledging to renew hydrogen basic strategy by around end of May.
The policymaker also showed readiness to support and expedite hydrogen supply chain.
“It is necessary to speed up private investment through green transformation bond to promote decarbonization domestically,” said Japan PM Kishida.
The policymaker assured the stability of the country’s financial system in a previous speech on Monday.
Also read: Japan's PM Kishida: Country’s financial system is generally stable
USD/JPY stays pressured
USD/JPY remains depressed near 132.20 after reversing from a 12-day high the previous day.
Also read: USD/JPY Price Analysis: Retraces after failing to crack the 200-DMA
-
00:29
WTI Price Analysis: Oil buyers need sustained break of $81.00 to keep the reins
- WTI crude oil buyers take a breather after posting the biggest daily jump in 11 months.
- Seven-week-old resistance line, overbought RSI (14) challenge Oil buyers.
- Oil bears remain off the table beyond $70.90 while one-week-long ascending trend line restricts immediate downside.
WTI crude oil remains sidelined near $80.30 as commodity traders look for fresh impulse to extend the biggest daily jump in 11 months during early Tuesday. In doing so, the black gold seesaws around a seven-week-long resistance line amid an overbought RSI (14).
Not only the $81.00 trend line hurdle and the overbought RSI (14) but the receding bullish bias of the MACD and multiple tops marked during January 2023 around $82.70 also challenge the WTI buyers.
In a case where the energy benchmark rises past $82.70, the odds of witnessing a run-up toward December 2022 high near $83.30 can act as the last defense of the Oil bears.
On the flip side, pullback moves can aim for the $80.00 round figure and the late Monday’s swing low around $79.00.
However, an upward-sloping support line from March 24 and the 200-SMA, respectively near $76.15 and $74.35, could challenge the Oil bears afterward.
Should the WTI bears keep the reins past $74.35, a fortnight-long support line near $70.80 and the $70.00 psychological magnet can lure the Oil sellers.
Overall, WTI crude oil buyers appear to run out of steam but the bears have a long way to travel before retaking control.
WTI: Four-hour chart
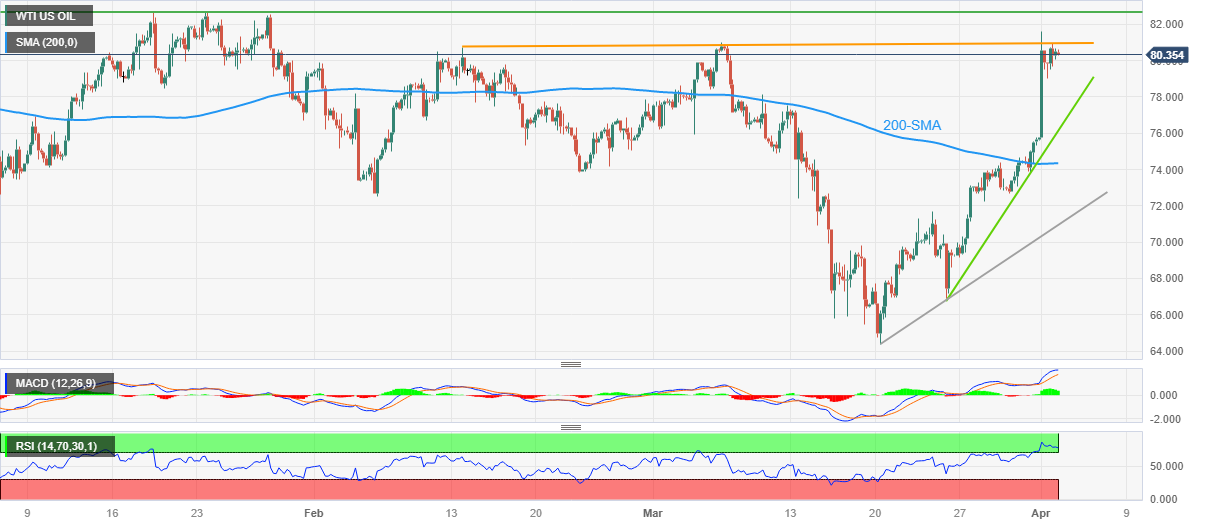
Trend: Limited upside expected
-
00:25
AUD/NZD juggles above 1.0770 ahead of RBA-RBNZ's interest rate policy
- AUD/NZD is consolidating above 1.0770 as investors await RBA-RBNZ policy for fresh impetus.
- Inflationary pressures in Australia and the New Zealand region have been extremely skewed from the desired rate.
- The RBNZ would look to hiking rates despite evidence of contraction in the New Zealand economy.
The AUD/NZD pair is oscillating in a narrow range above 1.0770 in the early Tokyo session. The cross has turned sideways as investors are awaiting the announcement of the interest rate decision by the Reserve Bank of Australia (RBA) and the Reserve Bank of New Zealand (RBNZ).
Inflationary pressures in Australia and the New Zealand region have been extremely skewed from the desired rate, therefore, more rate hikes from their central banks are in pipeline.
Australia’s monthly Consumer Price Index (CPI) indicator has conveyed that inflation has softened quickly in the past two months to 6.8% from the peak of 8.4% registered in December. However, more rate hikes from RBA Governor Philip Lowe cannot be ruled out as the central bank has a lot to go further to achieve price stability.
Analysts at Rabobank cited “It remains our view that the RBA will hike by a further 25 bps in April to take the cash rate to 3.85% ahead of a possible pause in May. The softer headline inflation print for February will not be sufficient for the RBA to abandon their tightening bias as labor market indicators, forward indicators, and the still comparatively high level of inflation all point to the need for further tightening.”
Also, a similar kind of interest rate hike is expected from RBNZ Governor Adrian Orr despite evidence of contraction in the New Zealand economy.
Over 90% of economists said the RBNZ would hike the Official Cash Rate (OCR) by 25 basis points (bps) to 5.00% despite the economy being expected to have shrunk 0.3% this quarter, following a 0.6% contraction in the final three months of 2022, Reuters reported after a March 27-30 poll.
-
00:11
AUD/USD aptly portrays pre-RBA anxiety at five-week top below 0.6800
- AUD/USD grinds within a choppy range after rising the most in three months the previous day.
- Broad US Dollar weakness, pre-RBA consolidation allowed Aussie bulls to ignore mixed data at home and in China.
- Cautious optimism underpins AUD/USD run-up despite mixed sentiment surrounding RBA.
- Clues of RBA rate hike pause will be crucial to watch and can drown the Aussie pair.
AUD/USD bulls take a breather around 0.6785, following the biggest daily jump in three months, as markets prepare for the Reserve Bank of Australia’s (RBA) Interest Rate Decision on early Tuesday. It’s worth noting that the Aussie pair seesaws inside a 20-pip trading range in the last few hours as traders seem divided between a rate 0.25% rate hike and a status quo monetary policy meeting.
The Aussie pair cheered broad US Dollar weakness while ignoring mostly downbeat data at home, as well as from the biggest customer China, the previous day.
That said, Australia’s TD Securities Inflation eased to 0.3% MoM and 5.7% YoY for March versus 0.4% and 6.3% respective priors. Further, China’s Caixin Manufacturing PMI for March drops to 50.0 from 51.6 prior and 51.7 market forecasts.
On the other hand, the US ISM Manufacturing PMI dropped to the lowest levels since May 2020 in March, to 46.3 versus 47.5 expected and 47.7 prior. On the same line, the final readings of March’s S&P Global Manufacturing PMI eased to 49.2 compared to 49.3 initial estimations.
The downbeat US PMI data joined Friday’s softer prints of the US Core Personal Consumption Expenditure (PCE) Price Index, the Fed’s preferred inflation gauge, to weigh on the market’s Fed bets. With this, the CME’s FedWatch Tool marked nearly 43% market bets on the Fed’s 0.25% rate hike in May, versus 52% expected on Friday.
In doing so, market players fail to justify the inflation fears emanating from the OPEC+ supply cuts and recently hawkish comments from US Federal Reserve Board Governor Lisa Cook, as well as US Treasury Secretary Janet Yellent’s fears for global growth due to the OPEC+ surprise.
It should be observed that US President Joe Biden shrugged off the OPEC+ move and said that it is not as bad as you think.
Against this backdrop, Wall Street closed mixed and the yields were down while the US Dollar Index (DXY) dropped the most in a fortnight the previous day to test the lowest levels in two months.
Looking ahead, AUD/USD moves rely on the RBA’s next moves amid a close call of announcing 25 basis points (bps) of a rate hike. Even if the Aussie central bank announces the rate hike, the bears could sneak in if the RBA Statement utters a policy pivot.
Also read: Reserve Bank of Australia Preview: To pause or not to pause
Technical analysis
A daily closing beyond the 100-DMA, around 0.6800 by the press time, becomes necessary for the AUD/USD bulls to keep the reins.
-
00:05
NZD/USD looks set for a smooth ride above 0.6300 ahead of RBNZ decision
- NZD/USD is expected to extend its upside journey above 0.6300 as Fed-RBNZ policy divergence would scrap.
- A 25 bps rate hike is expected from the RBNZ to 5%, the highest since December 2008.
- Downbeat US ISM Manufacturing PMI has raised concerns about further policy-tightening by the Fed.
The NZD/USD pair is hovering near the round-level resistance of 0.6300 in the Asian session. The Kiwi asset is expected to deliver a break above the aforementioned resistance as the interest rate decision by the Reserve Bank of New Zealand (RBNZ) on Wednesday is expected to scrap the Federal Reserve (Fed)-RBNZ policy divergence ahead.
In a March 27-30 Reuters poll, over 90% of economists said RBNZ Governor Adrian Orr would hike the Official Cash Rate (OCR) by 25 basis points (bps) to 5.00% at its April 5 meeting, the highest since December 2008. Reuters further added New Zealand's economy is expected to have shrunk by 0.3% this quarter, following a 0.6% contraction in the final three months of 2022, indicating a mild recession that is likely to prompt the RBNZ to slow its torrid pace of rate hikes.
Meanwhile, S&P500 futures are showing some losses in the early Asian session after a positive settlement on Monday, portraying minor caution in the overall risk appetite theme.
Caution has been stemmed in the market as United States Treasury Secretary Janet Yellen believes that the surprise announcement of oil production cuts by OPEC+ will add uncertainty to the global growth outlook. Higher oil prices are expected to strengthen a rebound in global headline inflation figures, which would refresh troubles for central banks ahead.
The US Dollar Index (DXY) is likely to extend its downside further below the immediate support of 102.00 as the release of the downbeat US ISM Manufacturing PMI has raised concerns about further policy-tightening by the Federal Reserve (Fed).
For further guidance, Wednesday’s US Automatic Data Processing (ADP) Employment Change (March) data will remain in the spotlight. As per the consensus, the economic data will release lower at 205K vs. the prior release of 242K.
-
00:04
GBP/JPY Price Analysis: Uptrend fades as a dragonfly doji surfaces in the daily chart
- GBP/JPY failed to break strong resistance at the confluence of technical indicators.
- A bearish scenario lies below 164.00, exposing crucial moving averages.
- On the upside, the GBP/JPY can test the YTD high at 166.00.
GBP/JPY barely advanced as the Asian session began after Monday’s rally challenged resistance but failed to capitalize on an upbeat sentiment. At the time of writing, the GBP/JPY exchanges hand at 164.32, consolidating within a 180-pip range.
GBP/JPY Price action
In the last few days, the GBP/JPY price action printed back-to-back candles that portray the uptrend are fading. Last Friday’s, an inverted hammer, followed by a dragonfly doji, depicts indecision amongst the GBP/JPY traders. Additionally, a four-month-old resistance trendline that passes around the 164.30-50 area capped any upward moves, suggesting that a pullback could be underway.
Oscillators like the Relative Strength Index (RSI) at bullish territory turned flat as buying pressure faded. The Rate of Change (RoC), turned neutral, opening the door for a retracement.
Should a bearish scenario arise, the GBP/JPY could pivot toward the 20-day Exponential Moving Average (EMA) at 162.53 before challenging the 100-day EMA At 162.20. A breach of the latter will expose the 50-day EMA at 162.03 before testing the 200-day EMA at 161.98.
For a bullish resumption, the GBP/JPY must crack 164.50, which, once cleared, and the pair would be heading to test two-month highs at 166.00. On further strength, the next upside target to keep in mind would be the December 13 daily high at 169.27.
GBP/JPY Daily chart
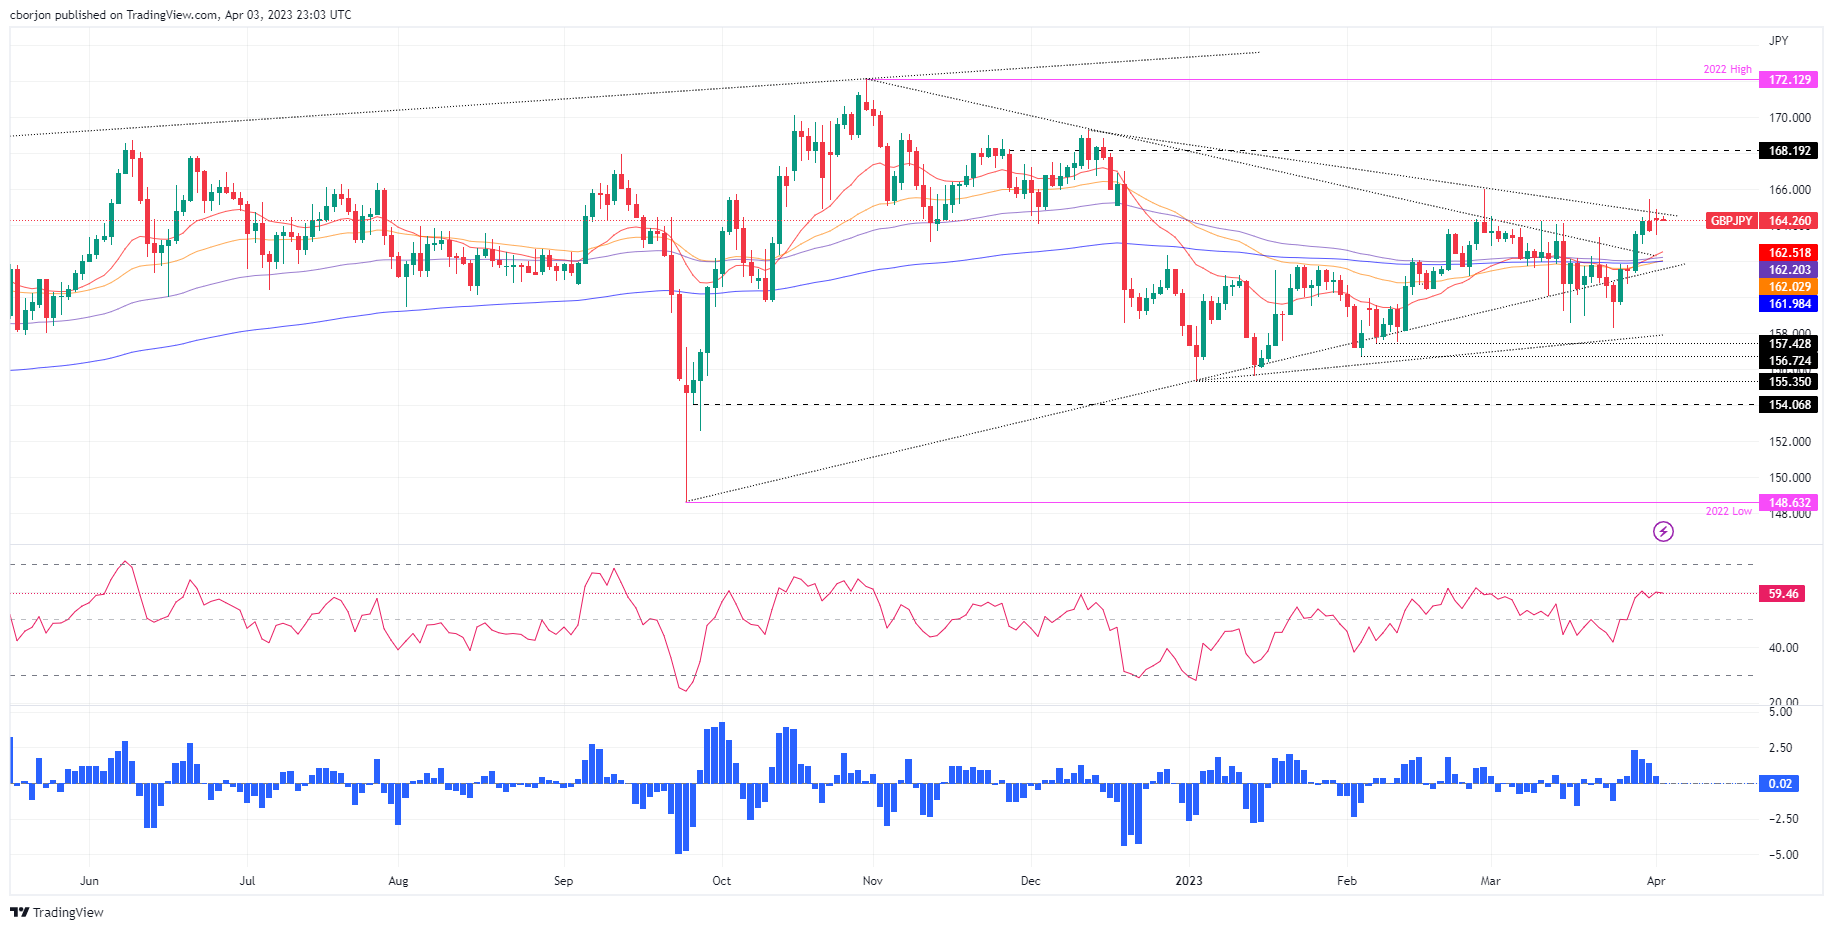
GBP/JPY Technical level
-
00:00
South Korea Consumer Price Index Growth (MoM) came in at 0.2%, below expectations (0.3%) in March
-
00:00
South Korea Consumer Price Index Growth (YoY) came in at 4.2%, below expectations (4.3%) in March
-