Notícias do Mercado
-
23:35
Commodities. Daily history for June 07’2018:
Raw materials
Closing price
% change
Oil
65.99
+1.95%
Gold
1,301.00
-0.03%
-
23:32
Stocks. Daily history for June 07’2018:
Index
Closing price
Change items
% change
Nikkei
+197.53
22823.26
+0.87%
SHANGHAI
-6.20
3108.98
-0.20%
ASX 200
+32.20
6057.30
+0.53%
NZ50
+86.07
8899.52
+0.98%
Euro Stoxx 50
-1.05
3459.77
0.03%
FTSE 100
-7.97
7704.40
-0.10%
DAX
-19.02
12811.05
-0.15%
CAC 40
-9.20
5448.36
-0.17%
DJIA
+95.02
25241.41
+0.38%
S&P 500
-1.98
2770.37
-0.07%
NASDAQ
-54.17
7635.07
-0.70%
-
23:27
Currencies. Daily history for June 07’2018:
Pare
Closed
% change
EUR/USD
$1,1797
+0,68%
GBP/USD
$1,3417
+0,02%
USD/CHF
Chf0,97981
-0,62%
USD/JPY
Y109,69
-0,40%
EUR/JPY
Y129,42
-0,23%
GBP/JPY
Y147,179
-0,38%
AUD/USD
$0,7624
-0,60%
NZD/USD
$0,7028
-0,10%
USD/CAD
C$1,29741
+0,24%
-
23:01
Schedule for today, Thursday, June 08’2018 (GMT+3)
Time
Country
Index
Period
Previous value
Forecast
03:00
China
Trade Balance
May
28.78
31.9
05:00
Japan
Eco Watchers Survey: Current
May
49
49.4
05:00
Japan
Eco Watchers Survey: Outlook
May
50.1
06:00
Germany
Current Account
April
29.1
06:00
Germany
Industrial Production s.a. (MoM)
April
1%
0.3%
06:00
Germany
Trade Balance (non s.a.), bln
April
25.2
06:45
France
Industrial Production, m/m
April
-0.4%
0.3%
07:15
Eurozone
ECB's Yves Mersch Speaks
12:00
United Kingdom
Housing Starts
May
0.1%
12:15
Canada
Capacity Utilization Rate
May
214
218
12:30
Canada
Unemployment rate
I кв
86%
85.2%
12:30
Canada
Employment
May
5.8%
5.8%
12:30
Canada
Wholesale Inventories
May
-1.1
17.5
14:00
USA
Baker Hughes Oil Rig Count
April
0.2%
0%
17:00
USA
Trade Balance
June
861
-
21:08
The main US stock indexes finished trading without a single dynamics
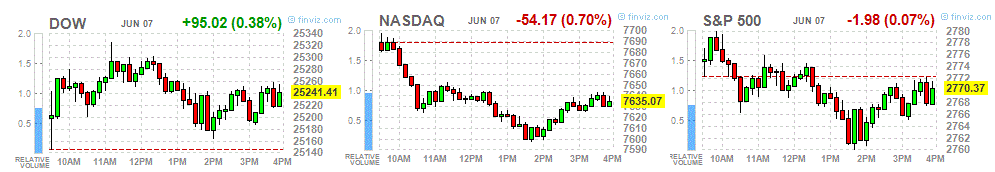
Major US stock indexes ended the trading session mixed. Technological stocks stopped their growth, and Nasdaq declined for the first time in five days, while the McDonald's stock surge allowed Dow to fix a moderate increase.
Market participants are also waiting for the Fed meeting, which is scheduled for June 12-13, and remain cautious on the eve of the G7 summit, which will be held on June 8-9.
Slight influence on the course of trading was provided by data from IBD / TIPP, which indicated that the index of economic optimism in the US improved in June, but was below expert predictions. The index rose in June by 0.3 points, to 53.9 points, while experts expected that it would increase to 54.2 points. The index is above the level of 50 points for 21 consecutive months (since October 2016), which is the longest series in the history of this study.
Quotes of oil rose by more than 2%, which was due to concern about a sharp decline in exports from Venezuela, although the increase in oil production in the US was holding back the price increase. Venezuela, which faces the threat of US sanctions and is in the midst of an economic crisis, is almost a month behind in sending crude oil to customers from its main export terminals. Chronic delays and a decline in production may violate contracts for the delivery of the state company PDVSA, if the backlog is not eliminated in the near future.
Most DOW components recorded a rise (21 out of 30). The leader of growth was the shares of McDonald's Corporation (MCD, + 4.35%). Outsider were shares of Intel Corporation (INTC, -1.97%).
Most sectors of the S & P finished trading in the red. The commodities sector grew most (+ 0.5%), while the technological sector showed the largest decline (-1.0%).
At closing:
Dow 25,240.58 +94.19 +0.37%
S&P 500 2,770.38 -1.97 -0.07%
Nasdaq 100 7,635.07 -54.17 -0.70%
-
20:00
DJIA +0.34% 25,232.40 +86.01 Nasdaq -0.73% 7,632.90 -56.35 S&P -0.12% 2,769.16 -3.19
-
20:00
U.S.: Consumer Credit , April 9.26 (forecast 13.75)
-
17:00
European stocks closed: FTSE 100 -7.97 7704.40 -0.10% DAX -19.02 12811.05 -0.15% CAC 40 -9.20 5448.36 -0.17%
-
15:48
EU officials are said to be dismissive of U.K. backstop plan
-
14:33
U.S. Stocks open: Dow +0.34% Nasdaq +0.07%, S&P +0.16%
-
14:20
Before the bell: S&P futures +0.08%, NASDAQ futures -0.08%
U.S. stock-index futures were flat on Thursday, after a solid growth in the first four sessions of June, which pushed the Nasdaq to new record highs. Investors are looking for more clues on global trade prospects, as key U.S. allies are set to meet at the G7 summit in Canada on June 8-9.
Global Stocks:
Index/commodity
Last
Today's Change, points
Today's Change, %
Nikkei
22,823.26
+197.53
+0.87%
Hang Seng
31,512.63
+253.53
+0.81%
Shanghai
3,108.98
-6.20
-0.20%
S&P/ASX
6,057.30
+32.20
+0.53%
FTSE
7,726.16
+13.79
+0.18%
CAC
5,463.13
+5.57
+0.10%
DAX
12,831.98
+1.91
+0.01%
Crude
$65.30
+0.88%
Gold
$1,305.80
+0.34%
-
13:48
Wall Street. Stocks before the bell
(company / ticker / price / change ($/%) / volume)
ALCOA INC.
AA
49.74
-0.39(-0.78%)
1171
Amazon.com Inc., NASDAQ
AMZN
1,696.37
0.62(0.04%)
20400
Apple Inc.
AAPL
193.95
-0.03(-0.02%)
115763
AT&T Inc
T
33.18
-0.20(-0.60%)
109769
Barrick Gold Corporation, NYSE
ABX
13.02
0.08(0.62%)
16993
Boeing Co
BA
373
1.44(0.39%)
10924
Caterpillar Inc
CAT
157
0.49(0.31%)
2518
Chevron Corp
CVX
124
0.62(0.50%)
3449
Cisco Systems Inc
CSCO
44.2
-0.06(-0.14%)
4391
Citigroup Inc., NYSE
C
68.63
0.40(0.59%)
16406
Exxon Mobil Corp
XOM
82.38
0.32(0.39%)
14609
Facebook, Inc.
FB
191.3
-0.04(-0.02%)
32234
FedEx Corporation, NYSE
FDX
258.5
1.95(0.76%)
2592
Ford Motor Co.
F
12.01
0.04(0.33%)
55167
Freeport-McMoRan Copper & Gold Inc., NYSE
FCX
18.27
0.07(0.38%)
93399
General Electric Co
GE
13.65
0.01(0.07%)
204989
General Motors Company, NYSE
GM
43.7
0.15(0.34%)
6129
Goldman Sachs
GS
233.51
1.28(0.55%)
14397
Google Inc.
GOOG
1,136.00
-0.88(-0.08%)
2390
International Business Machines Co...
IBM
145
0.29(0.20%)
744
International Paper Company
IP
59.02
0.03(0.05%)
138
Johnson & Johnson
JNJ
123
0.21(0.17%)
1830
JPMorgan Chase and Co
JPM
110.98
0.62(0.56%)
30919
McDonald's Corp
MCD
163.44
1.06(0.65%)
22207
Merck & Co Inc
MRK
61.97
0.04(0.06%)
733
Microsoft Corp
MSFT
102.5
0.01(0.01%)
43850
Nike
NKE
74.84
0.09(0.12%)
1572
Procter & Gamble Co
PG
74.48
0.13(0.17%)
1913
Starbucks Corporation, NASDAQ
SBUX
57.09
-0.08(-0.14%)
2162
Tesla Motors, Inc., NASDAQ
TSLA
318.5
-1.00(-0.31%)
54575
The Coca-Cola Co
KO
43.5
0.04(0.09%)
2222
United Technologies Corp
UTX
127
0.18(0.14%)
107
UnitedHealth Group Inc
UNH
249
0.35(0.14%)
2517
Verizon Communications Inc
VZ
48.32
-0.09(-0.19%)
1961
Visa
V
136.64
0.36(0.26%)
6136
Wal-Mart Stores Inc
WMT
84.7
0.14(0.17%)
1832
Walt Disney Co
DIS
102
0.09(0.09%)
13707
Yandex N.V., NASDAQ
YNDX
35.86
0.06(0.17%)
5000
-
13:45
Analyst coverage resumption before the market open
Verizon (VZ) resumed with a Hold at Jefferies; target $52
-
13:44
Downgrades before the market open
AT&T (T) downgraded to Hold from Buy at Jefferies
-
13:39
U.S initial jobless claims in line with expectations last week
In the week ending June 2, the advance figure for seasonally adjusted initial claims was 222,000, a decrease of 1,000 from the previous week's revised level. The previous week's level was revised up by 2,000 from 221,000 to 223,000. The 4-week moving average was 225,500, an increase of 2,750 from the previous week's revised average. The previous week's average was revised up by 500 from 222,250 to 222,750.
-
13:38
UK will leave the customs union when it leaves the EU: Official
-
13:30
U.S.: Initial Jobless Claims, June 222 (forecast 225)
-
13:30
U.S.: Continuing Jobless Claims, May 1741 (forecast 1738)
-
12:36
Turkey Central Bank Raises One-Week Repo Rate to 17.75% From 16.5%
-
Decided to Strenghten Monetary Tightening to Support Price Stability
-
Will Continue to Use All Monetary Policy Tools for Price Stability
-
Will Maintain Tight Stance in Monetary Policy Until Inflation Outlook Improves
-
-
11:57
May Confident David Davis Stays as BREXIT Secretary: Donnelly
-
10:43
Italian retail sales down 4.6% on year
In April 2018, both the value and volume of retail trade show a fall respectively of -4.6% and -5.4% comparing to April 2017, following strong growth in March 2018.
Notwithstanding the monthly volatility, looking at the underlying pattern, the 3 months to April picture reports a slight decline as value decreased by 0.5% and volume contracted by 0.2%.
In April 2018, the indices of retail trade saw a monthly recession, with value falling by 0.7% and volume dropping by 0.9%.
While both large scale distribution and small scale distribution strongly decreased when compared to April 2017, the online sales increased year-on-year by 16.2%.
-
10:41
Seasonally adjusted GDP rose by 0.4% in both the euro area (EA19) and the EU28 during the first quarter
Seasonally adjusted GDP rose by 0.4% in both the euro area (EA19) and the EU28 during the first quarter of 2018, compared with the previous quarter, according to an estimate published by Eurostat, the statistical office of the European Union. In the fourth quarter of 2017, GDP had grown by 0.7% in both zones. Compared with the same quarter of the previous year, seasonally adjusted GDP rose by 2.5% in the euro area and by 2.4% in the EU28 in the first quarter of 2018, after +2.8% and +2.7% respectively in the previous quarter. During the first quarter of 2018, GDP in the United States increased by 0.5% compared with the previous quarter (after +0.7% in the fourth quarter of 2017). Compared with the same quarter of the previous year, GDP grew by 2.8% (after +2.6% in the previous quarter).
-
10:00
Eurozone: GDP (QoQ), Quarter I 0.4% (forecast 0.4%)
-
10:00
Eurozone: GDP (YoY), Quarter I 2.5% (forecast 2.5%)
-
08:38
UK house prices grew by 1.5% on a monthly basis, in contrast to a decline seen in April
-
House prices in the three months to May were 1.9% higher than the same period a year earlier; experiencing slower growth than the 2.2% annual growth in April and 0.2% higher than in the preceding three months (December-February 2018)
-
On a monthly basis, prices rose by 1.5% in May, partially reversing the 3.1% monthly decline in April.
-
The average house price is now £224,439
Russell Galley, Managing Director, Halifax, said: "House prices grew by 1.5% on a monthly basis, in contrast to a decline seen in April. The month on month figures are more volatile than the quarterly or annual measures. In the three months to May house prices were 0.2% higher than the previous quarter and on an annual basis they are 1.9% higher. Both of these measures have fallen since reaching a recent peak, in the final months of last year."
-
-
08:30
United Kingdom: Halifax house price index 3m Y/Y, May 1.9% (forecast 1.9%)
-
08:30
United Kingdom: Halifax house price index, May 1.5% (forecast 1%)
-
08:01
Switzerland: Foreign Currency Reserves, May 741
-
07:58
European bourses are set to join the overnight rally on Wall Street and in Asia with futures trading firmly higher ahead of the open
-
07:45
France: Trade Balance, bln, April -5 (forecast -5.3)
-
07:35
Options levels on thursday, June 7, 2018
EUR/USD
Resistance levels (open interest**, contracts)
$1.1952 (2554)
$1.1903 (2407)
$1.1858 (4374)
Price at time of writing this review: $1.1798
Support levels (open interest**, contracts):
$1.1730 (3959)
$1.1692 (4736)
$1.1646 (3000)
Comments:
- Overall open interest on the CALL options and PUT options with the expiration date June, 8 is 167347 contracts (according to data from June, 6) with the maximum number of contracts with strike price $1,1500 (6047);
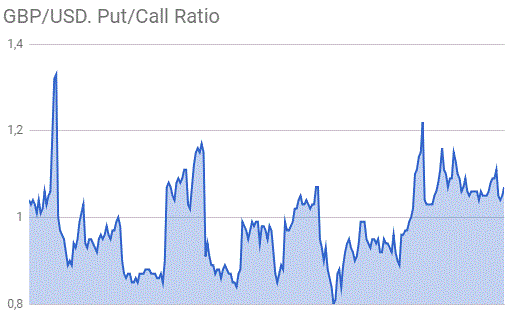
GBP/USD
Resistance levels (open interest**, contracts)
$1.3555 (1375)
$1.3510 (1492)
$1.3473 (1855)
Price at time of writing this review: $1.3429
Support levels (open interest**, contracts):
$1.3393 (1144)
$1.3371 (2547)
$1.3337 (2284)
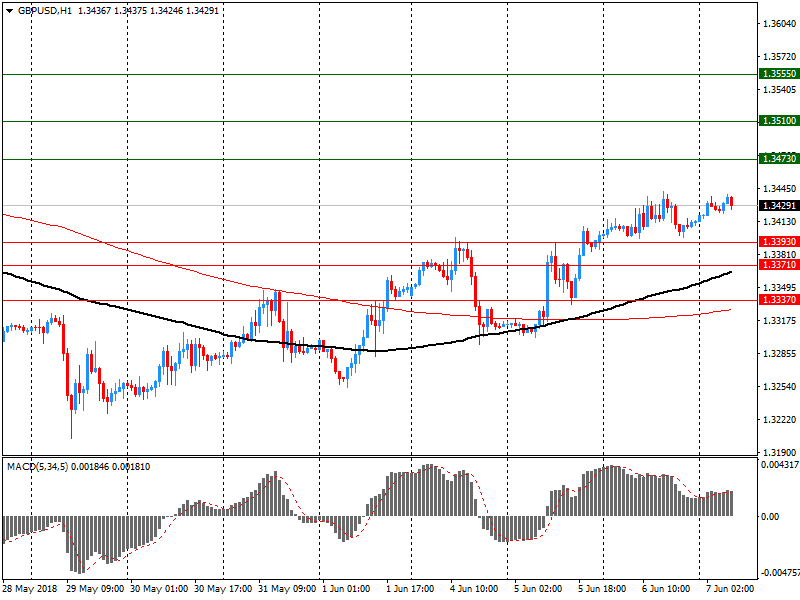
Comments:
- Overall open interest on the CALL options with the expiration date June, 8 is 41167 contracts, with the maximum number of contracts with strike price $1,3600 (2277);
- Overall open interest on the PUT options with the expiration date June, 8 is 43938 contracts, with the maximum number of contracts with strike price $1,3400 (2547);
- The ratio of PUT/CALL was 1.07 versus 1.05 from the previous trading day according to data from June, 6.
* - The Chicago Mercantile Exchange bulletin (CME) is used for the calculation.
** - Open interest takes into account the total number of option contracts that are open at the moment.
-
07:20
Futures: Eurostoxx +0,5% DAX +0,5% FTSE +0,3% CAC 40 +0,5%
-
07:14
Japan's leading index rose as expected m/m
Japan's leading index increased as expected in April, according to rttnews.
The leading index, which measures the future economic activity, climbed to 105.6 in April from 104.5 in March.
Similarly, the coincident index that reflects the current economic activity improved to 117.7 in April from 116.0 in the previous month. That was just below the expected score of 117.8.
The lagging index came in at 116.9 in April versus 118.2 in March.
-
07:07
German factory orders declined 2.5% in April
Based on provisional data, the Federal Statistical Office (Destatis) reports that price-adjusted new orders in manufacturing had decreased in April 2018 a seasonally and calendar adjusted 2.5% on the previous month. For March 2018, revision of the preliminary outcome resulted in a decrease of 1.1% compared with February 2018 (primary -0.9%). Price-adjusted new orders without major orders in manufacturing had decreased in April 2018 a seasonally and calendar adjusted 1.7% on the previous month.
Domestic orders decreased by 4.8% and foreign orders decreased by 0.8% in April 2018 on the previous month. New orders from the euro area were down 9.9%, new orders from other countries increased 5.4% compared to March 2018.
In April 2018 the manufacturers of intermediate goods saw new orders rise by 2.5% compared with March 2018. The manufacturers of capital goods showed decreases of 5.6% on the previous month. For consumer goods, a decrease in new orders of 2.2% was recorded.
-
07:00
Germany: Factory Orders s.a. (MoM), April -2.5% (forecast 0.8%)
-
06:55
Australian trade balance surplus lower than expected in April
In trend terms, the balance on goods and services was a surplus of $1,461m in April 2018, an increase of $300m on the surplus in March 2018.
In seasonally adjusted terms, the balance on goods and services was a surplus of $977m in April 2018, a decrease of $754m on the surplus in March 2018.
In seasonally adjusted terms, goods and services credits fell $763m (2%) to $34,188m. Non-rural goods fell $544m (2%), non-monetary gold fell $294m (16%) and rural goods fell $8m. Net exports of goods under merchanting rose $5m (83%). Services credits rose $78m (1%).
-
06:53
Siwss unemployment rate in line wtih expectations in May
According to the State Secretariat for Economic Affairs (SECO) surveys, at the end of May 2018, 109'392 unemployed people were enrolled in the Regional Employment Centers (RAV), 10'389 fewer than in the previous month. The unemployment rate fell from 2.7% in April 2018 to 2.4% in the month under review. Compared to the same month of the previous year, unemployment fell by 30,386 persons (-21.7%).
-
06:45
Switzerland: Unemployment Rate (non s.a.), May 2.4% (forecast 2.5%)
-
06:16
Japan: Coincident Index, April 117.7 (forecast 115.6)
-
06:16
Japan: Leading Economic Index , April 105.6 (forecast 104.8)
-
02:30
Australia: Trade Balance , April 0.977 (forecast 0.98)
-
00:05
Commodities. Daily history for June 06’2018:
Raw materials
Closing price
% change
Oil
65.06
-0.70%
Gold
1,301.20
-0.08%
-
00:03
Stocks. Daily history for June 06’2018:
Index
Closing price
Change items
% change
Nikkei
+86.19
22625.73
+0.38%
SHANGHAI
+1.48
3115.68
+0.05%
ASX 200
+30.20
6025.10
+0.50%
NZ50
+56.41
8813.45
+0.64%
Euro Stoxx 50
+4.03
3460,82
+0,12%
FTSE 100
+25,57
7712,37
+0,33%
DAX
+42,94
12830,07
+0,34%
CAC 40
-3,39
5457,56
-0,06%
DJIA
+346.41
25146.39
+1.40%
S&P 500
+23.55
2772.35
+0.86%
NASDAQ
+51.38
7689.24
+0.67%
-
00:02
Currencies. Daily history for June 06’2018:
Pare
Closed
% change
EUR/USD
$1,1776
+0,51%
GBP/USD
$1,3414
+0,11%
USD/CHF
Chf0,98593
+0,16%
USD/JPY
Y110,14
+0,28%
EUR/JPY
Y129,71
+0,80%
GBP/JPY
Y147,736
+1,07%
AUD/USD
$0,7669
+0,67%
NZD/USD
$0,7035
+0,13%
USD/CAD
C$1,29428
+41,14%
-