Notícias do Mercado
-
23:59
Commodities. Daily history for November 08’ 2018:
Raw materials
Closing price
% change
Oil
$60.76
-1.48%
Gold
$1,223.60
-0.42%
-
23:43
Stocks. Daily history for November 08’ 2018:
Index
Change items
Closing price
% change
Nikkei
+401.12
22486.92
+1.82%
SHANGHAI
-5.71
2635.63
-0.22%
ASX 200
+31.30
5928.20
+0.53%
FTSE 100
+23.40
7140.68
+0.33%
DAX
-51.78
11527.32
-0.45%
CAC 40
-6.49
5131.45
-0.13%
DJIA
+10.92
26191.22
+0.04%
S&P 500
-7.06
2806.83
-0.25%
NASDAQ
-39.87
7530.89
-0.53%
-
23:31
Currencies. Daily history for November 08’ 2018:
Pare
Closed
% change
EUR/USD
$1,1363
-0,54%
GBP/USD
$1,3060
-0,51%
USD/CHF
Chf1,00596
+0,34%
USD/JPY
Y114,04
+0,43%
EUR/JPY
Y129,59
-0,11%
GBP/JPY
Y148,944
-0,07%
AUD/USD
$0,7257
-0,25%
NZD/USD
$0,6754
-0,42%
USD/CAD
C$1,31528
+0,30%
-
22:30
Schedule for today, Friday, November 9, 2018
Time Country Event Period Previous value Forecast 00:30 Australia Home Loans September -2.1% -1% 00:30 Australia RBA Monetary Policy Statement 01:30 China PPI y/y October 3.6% 3.3% 01:30 China CPI y/y October 2.5% 2.5% 07:45 France Industrial Production, m/m September 0.3% -0.3% 09:30 United Kingdom Industrial Production (YoY) September 1.3% 0.4% 09:30 United Kingdom Industrial Production (MoM) September 0.2% -0.1% 09:30 United Kingdom Manufacturing Production (MoM) September -0.2% 0.1% 09:30 United Kingdom Manufacturing Production (YoY) September 1.3% 0.4% 09:30 United Kingdom Business Investment, y/y Quarter III -0.2% 09:30 United Kingdom Business Investment, q/q Quarter III -0.7% 0.2% 09:30 United Kingdom Total Trade Balance September -1.274 09:30 United Kingdom GDP m/m September 0% 0.1% 09:30 United Kingdom GDP, y/y Quarter III 1.2% 1.5% 09:30 United Kingdom GDP, q/q Quarter III 0.4% 0.6% 13:05 U.S. FOMC Member Quarles Speaks 13:30 U.S. PPI, y/y October 2.6% 2.5% 13:30 U.S. PPI, m/m October 0.2% 0.2% 13:30 U.S. PPI excluding food and energy, Y/Y October 2.5% 2.3% 13:30 U.S. PPI excluding food and energy, m/m October 0.2% 0.2% 14:00 United Kingdom NIESR GDP Estimate October 0.7% 15:00 U.S. Wholesale Inventories September 1% 0.3% 15:00 U.S. Reuters/Michigan Consumer Sentiment Index November 98.6 98.0 18:00 U.S. Baker Hughes Oil Rig Count November 874 -
21:37
Major US stock indexes finished trading mixed
On Thursday, the main US stock markets fell predominantly, with weak income reports, a collapse of the conglomerate sector, and the results of the Fed meeting.
As expected, the Fed left rates unchanged, in the range of 2% -2.25%, but it signaled about the likelihood of an increase in rates following the December meeting. The accompanying statement by the Fed noted that data from the September meeting points to a further strengthening of the labor market, as well as strong growth in economic activity. "At the same time, the Central Bank pointed to the recent weakening of capital investments of companies whose rates , have become more moderate compared to those observed earlier this year.
In addition, the focus was on US data. As it became known, the number of initial claims for unemployment benefits in the United States last week (October 28 - November 3) decreased seasonally by 1,000 applications (from 215,000 to 214,000), as expected, showed the data of the US Department of Labor. This indicates that the labor shortage in the labor market persists. The Ministry of Labor reported that the less volatile four-week moving average also dropped to 213,750, which is 250 units less than in the previous week (214,000). Meanwhile, the number of secondary requests for the week of October 21-27 decreased by 8,000, to 1,623,000, the lowest level since 1973.
Most of the components of DOW finished trading in positive territory (18 out of 30). The growth leader was 3M Company (MMM, + 1.38%). Caterpillar Inc. shares turned out to be an outsider. (CAT, -2.75%).
Almost all sectors of the S & P showed an increase. The largest decline was shown by the conglomerate sector (-2.5%). Only the financial sector grew (+ 0.1%).
At the time of closing:
Dow 26,191.22 +10.92 + 0.04%
S & P 500 2,806.83 -7.06 -0.25%
Nasdaq 100 7,530.89 -39.87 -0.53%
-
20:50
Schedule for tomorrow, Friday, November 9, 2018
Time Country Event Period Previous value Forecast 00:30 Australia Home Loans September -2.1% -1% 00:30 Australia RBA Monetary Policy Statement 01:30 China PPI y/y October 3.6% 3.3% 01:30 China CPI y/y October 2.5% 2.5% 07:45 France Industrial Production, m/m September 0.3% -0.3% 09:30 United Kingdom Industrial Production (YoY) September 1.3% 0.4% 09:30 United Kingdom Industrial Production (MoM) September 0.2% -0.1% 09:30 United Kingdom Manufacturing Production (MoM) September -0.2% 0.1% 09:30 United Kingdom Manufacturing Production (YoY) September 1.3% 0.4% 09:30 United Kingdom Business Investment, y/y Quarter III -0.2% 09:30 United Kingdom Business Investment, q/q Quarter III -0.7% 0.2% 09:30 United Kingdom Total Trade Balance September -1.274 09:30 United Kingdom GDP m/m September 0% 0.1% 09:30 United Kingdom GDP, y/y Quarter III 1.2% 1.5% 09:30 United Kingdom GDP, q/q Quarter III 0.4% 0.6% 13:05 U.S. FOMC Member Quarles Speaks 13:30 U.S. PPI, y/y October 2.6% 2.5% 13:30 U.S. PPI, m/m October 0.2% 0.2% 13:30 U.S. PPI excluding food and energy, Y/Y October 2.5% 2.3% 13:30 U.S. PPI excluding food and energy, m/m October 0.2% 0.2% 14:00 United Kingdom NIESR GDP Estimate October 0.7% 15:00 U.S. Wholesale Inventories September 1% 0.3% 15:00 U.S. Reuters/Michigan Consumer Sentiment Index November 98.6 98.0 18:00 U.S. Baker Hughes Oil Rig Count November 874 -
20:00
DJIA -0.15% 26,141.25 -39.05 Nasdaq -0.71% 7,517.21 -53.54 S&P -0.42% 2,802.19 -11.70
-
19:00
U.S.: Fed Interest Rate Decision , 2.25%
-
17:01
European stocks closed: FTSE 100 +23.40 7140.68 +0.33% DAX -51.78 11527.32 -0.45% CAC 40 -6.49 5131.45 -0.13%
-
15:08
Oil Prices Fall on Rising U.S. Inventories, Worries of Oversupply
20% Drop From Recent High Ends WTI's Longest Bull Market Since 2008
-
14:33
U.S. Stocks open: Dow -0.14%, Nasdaq -0.39%, S&P -0.27%
-
14:27
Before the bell: S&P futures -0.38%, NASDAQ futures -0.56%
U.S. stock-index futures fell on Thursday, as market participants took a breather after the previous day’s rally, which was triggered by the results of the U.S. midterm elections, while awaiting the outcomes of the Fed's meeting.
Global Stocks:
Index/commodity
Last
Today's Change, points
Today's Change, %
Nikkei
22,486.92
+401.12
+1.82%
Hang Seng
26,227.72
+80.03
+0.31%
Shanghai
2,635.63
-5.71
-0.22%
S&P/ASX
5,928.20
+31.30
+0.53%
FTSE
7,143.75
+26.47
+0.37%
CAC
5,131.34
-6.60
-0.13%
DAX
11,557.30
-21.80
-0.19%
Crude
$61.67
0.00%
Gold
$1,222.40
-0.51%
-
13:53
Wall Street. Stocks before the bell
(company / ticker / price / change ($/%) / volume)
ALCOA INC.
AA
36.63
0.44(1.22%)
185
ALTRIA GROUP INC.
MO
65.12
0.25(0.39%)
439
Amazon.com Inc., NASDAQ
AMZN
1,669.50
26.69(1.62%)
58444
AMERICAN INTERNATIONAL GROUP
AIG
45
0.10(0.22%)
2150
Apple Inc.
AAPL
205.9
2.13(1.05%)
483442
AT&T Inc
T
30.97
0.01(0.03%)
72305
Barrick Gold Corporation, NYSE
ABX
13.32
0.18(1.37%)
69147
Boeing Co
BA
368
1.53(0.42%)
28902
Caterpillar Inc
CAT
131.7
2.37(1.83%)
12818
Chevron Corp
CVX
120
1.10(0.93%)
1950
Cisco Systems Inc
CSCO
47.05
0.55(1.18%)
20602
Citigroup Inc., NYSE
C
67.25
0.57(0.85%)
47484
Deere & Company, NYSE
DE
145.82
0.35(0.24%)
2376
Exxon Mobil Corp
XOM
82.51
0.52(0.63%)
3784
Facebook, Inc.
FB
151.44
1.50(1.00%)
97633
Ford Motor Co.
F
9.58
0.04(0.42%)
33974
Freeport-McMoRan Copper & Gold Inc., NYSE
FCX
12.42
0.22(1.80%)
44391
General Electric Co
GE
9.51
0.09(0.96%)
259254
General Motors Company, NYSE
GM
36.68
0.22(0.60%)
6541
Goldman Sachs
GS
229.59
1.39(0.61%)
3262
Google Inc.
GOOG
1,066.41
10.60(1.00%)
7173
Hewlett-Packard Co.
HPQ
25
0.12(0.48%)
410
Home Depot Inc
HD
183.99
1.98(1.09%)
3794
HONEYWELL INTERNATIONAL INC.
HON
151
2.55(1.72%)
17730
Intel Corp
INTC
47.87
0.62(1.31%)
47160
International Business Machines Co...
IBM
124.05
0.93(0.76%)
25290
International Paper Company
IP
47.63
1.00(2.14%)
2450
Johnson & Johnson
JNJ
142.7
0.13(0.09%)
1963
JPMorgan Chase and Co
JPM
110.3
0.70(0.64%)
20901
McDonald's Corp
MCD
183.33
0.62(0.34%)
20450
Microsoft Corp
MSFT
108.99
1.27(1.18%)
107812
Nike
NKE
77.35
0.78(1.02%)
2489
Pfizer Inc
PFE
43.07
0.06(0.14%)
2352
Procter & Gamble Co
PG
91.58
0.07(0.08%)
1243
Starbucks Corporation, NASDAQ
SBUX
66.48
0.47(0.71%)
13124
Tesla Motors, Inc., NASDAQ
TSLA
343.8
2.74(0.80%)
35286
The Coca-Cola Co
KO
49.31
0.20(0.41%)
39246
Twitter, Inc., NYSE
TWTR
34.8
0.38(1.10%)
51468
Verizon Communications Inc
VZ
57.3
0.09(0.16%)
3244
Visa
V
142.44
1.65(1.17%)
11212
Wal-Mart Stores Inc
WMT
103.53
0.20(0.19%)
2278
Walt Disney Co
DIS
117.24
0.53(0.45%)
9987
Yandex N.V., NASDAQ
YNDX
30.36
0.21(0.70%)
1720
-
13:39
Canadian new house prices were unchanged nationally for a second consecutive month, despite increases in some pockets across the country
In September, new home buyers in 20 of the 27 census metropolitan areas (CMAs) surveyed saw flat or decreasing prices. Increased mortgage rates, along with tighter mortgage regulations, have coincided with slowing demand for new homes across Canada.
New home prices fell the most in St. John's and Hamilton (both down 0.4%), and Halifax and Saskatoon (both down 0.3%). Builders in all four CMAs reported unfavourable market conditions as the primary reason for the price decline.
The largest price increases in September were in London (+0.5%), and Vancouver and Sherbrooke (both up 0.4%). Builders in London reported that increased construction costs were pushing up prices. In Vancouver, builders returned to list prices after some discounting in previous months. In Sherbrooke, builders reported higher prices for new phases of development.
-
13:38
U.S initial jobless claims in line with expectations last week
In the week ending November 3, the advance figure for seasonally adjusted initial claims was 214,000, a decrease of 1,000 from the previous week's revised level. The previous week's level was revised up by 1,000 from 214,000 to 215,000. The 4-week moving average was 213,750, a decrease of 250 from the previous week's revised average. The previous week's average was revised up by 250 from 213,750 to 214,000.
-
13:30
Canada: New Housing Price Index, YoY, September 0.2%
-
13:30
U.S.: Initial Jobless Claims, November 214 (forecast 214)
-
13:30
U.S.: Continuing Jobless Claims, October 1623 (forecast 1635)
-
13:30
Canada: New Housing Price Index, MoM, September 0% (forecast 0.1%)
-
13:25
Canadian housing starts index rose more than expected in October
The trend in housing starts was 206,171 units in October 2018, compared to 207,809 units in September 2018, according to Canada Mortgage and Housing Corporation (CMHC).
"The national trend in housing starts declined for a fourth consecutive month in October, which leaves the trend at its lowest level since February 2017," said Bob Dugan, CMHC's chief economist. "However, despite declining for several months, the trend remains slightly above its long-run average because it follows historically elevated levels of activity in 2017."
-
13:17
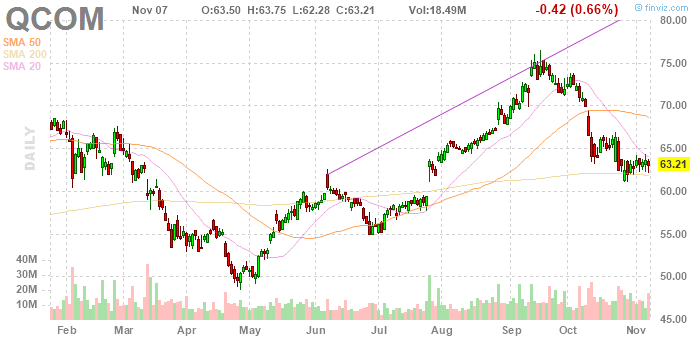
Company News: Qualcomm (QCOM) quarterly results beat analysts’ expectations
Qualcomm (QCOM) reported Q4 FY 2018 earnings of $0.90 per share (versus $0.92 in Q4 FY 2017), beating analysts’ consensus estimate of $0.84.
The company’s quarterly revenues amounted to $5.833 bln (-2.1% y/y), beating analysts’ consensus estimate of $5.541 bln.
The company also issued guidance for Q1 FY 2019, projecting EPS of $1.05-1.15 (versus analysts’ consensus estimate of $0.92) and revenues of $4.50-5.30 bln (versus analysts’ consensus estimate of $5.58 bln).
QCOM fell to $58.63 (-7.25%) in pre-market trading.
-
13:17
Canada: Housing Starts, October 205.9 (forecast 200)
-
12:13
Federal Reserve officials are expected to keep interest rates steady at their two-day policy meeting that concludes today - DJ
They will likely discuss the economy, financial markets and the future path of rates, among other topics.
This will be Fed Chairman Jerome Powell's last meeting without a press conference afterward.
The central bank issues a policy statement at 2 p.m. ET, and officials aren't releasing new economic projections.
Employers have added jobs at a steady pace, likely firming Fed officials' plans to raise rates in December. Their statement should again describe the labor market as strong.
On the other hand, the interest-rate sensitive housing sector is slowing amid rising mortgage rates. And business investment was surprisingly soft during the third quarter.
Officials' September statement stopped describing rates as "accommodative," or low enough to stimulate the economy. Mr. Powell said then that rates were still accommodative, but the language had grown stale because it no longer said anything meaningful about policy going forward.
The challenge ahead is to parse financial and economic developments to determine whether rates are edging closer to a neutral setting that neither spurs nor slows growth.
-
10:37
EU Sees Eurozone Inflation at 1.8% in 2018, Up From 1.7% Previously
Sees Eurozone Inflation Rate Easing to 1.6% in 2020
EU Gave Its Previous Growth, Inflation Forecasts in July
Holds Eurozone Unemployment Forecasts at 8.4% in 2018, 7.9% in 2019
Eurozone Budget Deficit at 0.6% in 2018, Down From 0.7% Previously
Cuts Italy 2018 GDP Growth Forecast to 1.1% From 1.3%
Sees Italy 2020 GDP Growth at 1.3%
Eurozone Economy to Cool in Coming Years as Risks Mount
-
10:36
European Comision Cuts Eurozone 2019 Economic Growth Forecast to 1.9% From 2.0%
Keeps Eurozone 2018 Economic Growth Forecast at 2.1%
Eurozone Economic Growth Slowing Further to 1.7% in 2020
Sees U.S. Overheating, Faster Fed Rate Rises as Fresh Risks
Also Cites Trade Tensions, Higher Energy Prices, Policy Uncertainty as Risks
Raises Italy 2019 Growth Forecast to 1.2% From 1.1%
Cuts Germany 2018 Growth Forecast to 1.7% From 1.9%
-
09:09
ECB Economic Bulletin: Eurozone economy still in broad-based expansion, even if growth is somewhat weaker than expected
Short-term indicators point to continued strength in the labour market
Private consumption expected to display resilient growth in the coming quarters
Risks to global growth are to the downside due to trade restrictions
*via forexlive
-
08:33
FTSE +15.15 7132.43 +0.21% DAX +48.10 11627.20 +0.42% CAC +9.22 5147.16 +0.18%
-
08:22
RBNZ Governor Orr says "we are not taking rate cuts off of the table"
I Have No View On The NZD's Level, Kiwi Dollar Has Been Well Behaved
Core Inflation Still Below Mid-Point Of Target
-
08:18
Reserve Bank of New Zealand holds interest rate unchanged at 1.75% - "We expect to keep the OCR at this level through 2019 and into 2020"
“The Official Cash Rate (OCR) remains at 1.75 percent. We expect to keep the OCR at this level through 2019 and into 2020.
There are both upside and downside risks to our growth and inflation projections. As always, the timing and direction of any future OCR move remains data dependent.
The pick-up in GDP growth in the June quarter was partly due to temporary factors, and business surveys continue to suggest growth will be soft in the near term. Employment is around its maximum sustainable level. However, core consumer price inflation remains below our 2 percent target mid-point, necessitating continued supportive monetary policy.
GDP growth is expected to pick up over 2019. Monetary stimulus and population growth underpin household spending and business investment. Government spending on infrastructure and housing also supports domestic demand. The level of the New Zealand dollar exchange rate will support export earnings.
As capacity pressures build, core consumer price inflation is expected to rise to around the mid-point of our target range at 2 percent.
Downside risks to the growth outlook remain. Weak business sentiment could weigh on growth for longer. Trade tensions remain in some major economies, raising the risk that trade barriers increase and undermine global growth”.
-
08:05
ECB’s Villeroy: Trump Policies Bring Growth In Short Term @LiveSquawk
-
07:53
Australia ForMin Payne: Australia Committed To Deepening China Relations Payne:
Had Valuable, Full And Candid Discussions With China
-
07:48
Options levels on thursday, November 8, 2018
EUR/USD
Resistance levels (open interest**, contracts)
$1.1561 (5397)
$1.1527 (2760)
$1.1496 (2125)
Price at time of writing this review: $1.1427
Support levels (open interest**, contracts):
$1.1394 (3856)
$1.1348 (5257)
$1.1299 (3119)
Comments:
- Overall open interest on the CALL options and PUT options with the expiration date November, 19 is 97514 contracts (according to data from November, 7) with the maximum number of contracts with strike price $1,1550 (5397);
GBP/USD
Resistance levels (open interest**, contracts)
$1.3234 (2481)
$1.3208 (1774)
$1.3175 (1177)
Price at time of writing this review: $1.3119
Support levels (open interest**, contracts):
$1.3079 (2384)
$1.3039 (2448)
$1.2995 (4383)
Comments:
- Overall open interest on the CALL options with the expiration date November, 19 is 28262 contracts, with the maximum number of contracts with strike price $1,3500 (3172);
- Overall open interest on the PUT options with the expiration date November, 19 is 35568 contracts, with the maximum number of contracts with strike price $1,3000 (4383);
- The ratio of PUT/CALL was 1.26 versus 1.22 from the previous trading day according to data from November, 7
* - The Chicago Mercantile Exchange bulletin (CME) is used for the calculation.
** - Open interest takes into account the total number of option contracts that are open at the moment.
-
07:45
France: Trade Balance, bln, September -5.7 (forecast -6.1)
-
07:35
China's exports and imports increased more-than-expected in October
China's exports and imports increased more-than-expected in October, according to rttnews.
Exports grew 15.6 percent annually, the General Administration of Customs reported. Economists had forecast an increase of 11.7 percent.
At the same time, imports surged 21.4 percent compared to the forecast of 14.7 percent.
As a result, the trade surplus came in at $34 billion in October versus the expected level of $35.1 billion.
In yuan terms, imports advanced 26.3 percent and exports climbed 20.1 percent from last year. The trade surplus totaled CNY 233.6 billion.
-
07:34
Futures: DAX +0,5% FTSE +0,5% CAC +0,2%
A positive start of trading in the stock markets of Europe is expected, following the positive tone on Wall Street and on Asian funds markets. The results of the midterm elections in the USA remain in the focus of the markets. Post-election euphoria is beginning to decline, but this will probably have more impact on US futures.
-
07:26
Swiss unemployment rate stable at 2.5% in October
According to the State Secretariat for Economic Affairs (SECO) surveys, at the end of October 2018 there were 107,315 unemployed registered at the regional employment agencies (RAV), 729 more than in the previous month. The unemployment rate remained at 2.4% in the month under review. Compared with the same month of the previous year, unemployment fell by 27,485 persons (-20.4%). Youth unemployment in October 2018 Youth unemployment (15-24 year-olds) decreased by 660 people (-4.8%) to 13'064.
-
07:22
German trade balance surplus rose less than expected in September
Germany exported goods to the value of 109.1 billion euros and imported goods to the value of 90.7 billion euros in September 2018. Based on provisional data, the Federal Statistical Office (Destatis) also reports that German exports declined by 1.2%, while imports increased by 5.3% in September 2018 year on year. After calendar and seasonal adjustment, exports were down 0.8% and imports declined 0.4% compared with August 2018.
The foreign trade balance showed a surplus of 18.4 billion euros in September 2018. In September 2017, the surplus amounted to 24.2 billion euros. In calendar and seasonally adjusted terms, the foreign trade balance recorded a surplus of 17.6 billion euros in September 2018.
According to provisional results of the Deutsche Bundesbank, the current account of the balance of payments showed a surplus of 21.1 billion euros in September 2018, which takes into account the balances of trade in goods including supplementary trade items (+19.7 billion euros), services (-1.8 billion euros), primary income (+6.8 billion euros) and secondary income (-3.6 billion euros). In September 2017, the German current account showed a surplus of 26.9 billion euros.
-
07:15
Germany: Trade Balance (non s.a.), bln, September 18.4
-
07:01
Germany: Current Account , September 21.1
-
06:45
Switzerland: Unemployment Rate (non s.a.), October 2.4% (forecast 2.4%)
-
05:16
Japan: Eco Watchers Survey: Outlook, October 50.6
-
05:02
Japan: Eco Watchers Survey: Current , October 49.5 (forecast 48.9)
-
03:00
China: Trade Balance, bln, October 34.01 (forecast 35)
-
00:43
Commodities. Daily history for November 07’ 2018:
Raw materials
Closing price
% change
Oil
$61.75
+0.13%
Gold
$1,226.10
-0.21%
-
00:25
Stocks. Daily history for November 07’ 2018:
Index
Change items
Closing price
% change
Nikkei
-61.95
22085.80
-0.28%
SHANGHAI
-18.01
2641.34
-0.68%
ASX 200
+21.70
5896.90
+0.37%
FTSE 100
+76.60
7117.28
+1.09%
DAX
+94.76
11579.10
+0.83%
CAC 40
+62.75
5137.94
+1.24%
DJIA
+545.29
26180.30
+2.13%
S&P 500
+58.44
2813.89
+2.12%
NASDAQ
+194.79
7570.75
+2.64%
-
00:03
Currencies. Daily history for November 07’ 2018:
Pare
Closed
% change
EUR/USD
$1,1425
-0,01%
GBP/USD
$1,3127
+0,17%
USD/CHF
Chf1,00253
+0,01%
USD/JPY
Y113,55
+0,10%
EUR/JPY
Y129,73
+0,08%
GBP/JPY
Y149,055
+0,25%
AUD/USD
$0,7274
+0,42%
NZD/USD
$0,6782
+0,70%
USD/CAD
C$1,31138
-0,08%
-