Notícias do Mercado
-
23:57
EURUSD Price Analysis: Bulls and bears about to go head to head
- EURUSD bears eye a deeper correction, but US CPI looms.
- EURUSD bulls look to guards 0.9950/75 that could hold as support.
The euro was hit hard on Wednesday and is trying to correct on Thursday, although is facing a robust US Dollar as traders braced for any upside surprise in the upcoming US Consumer Price Index report. US yields and the greenback rallied on a soft US Treasury auction which has left a bearish outlook on the charts for the rest of the week as the following illustrates from a bearish perspective.
EURUSD H1 chart
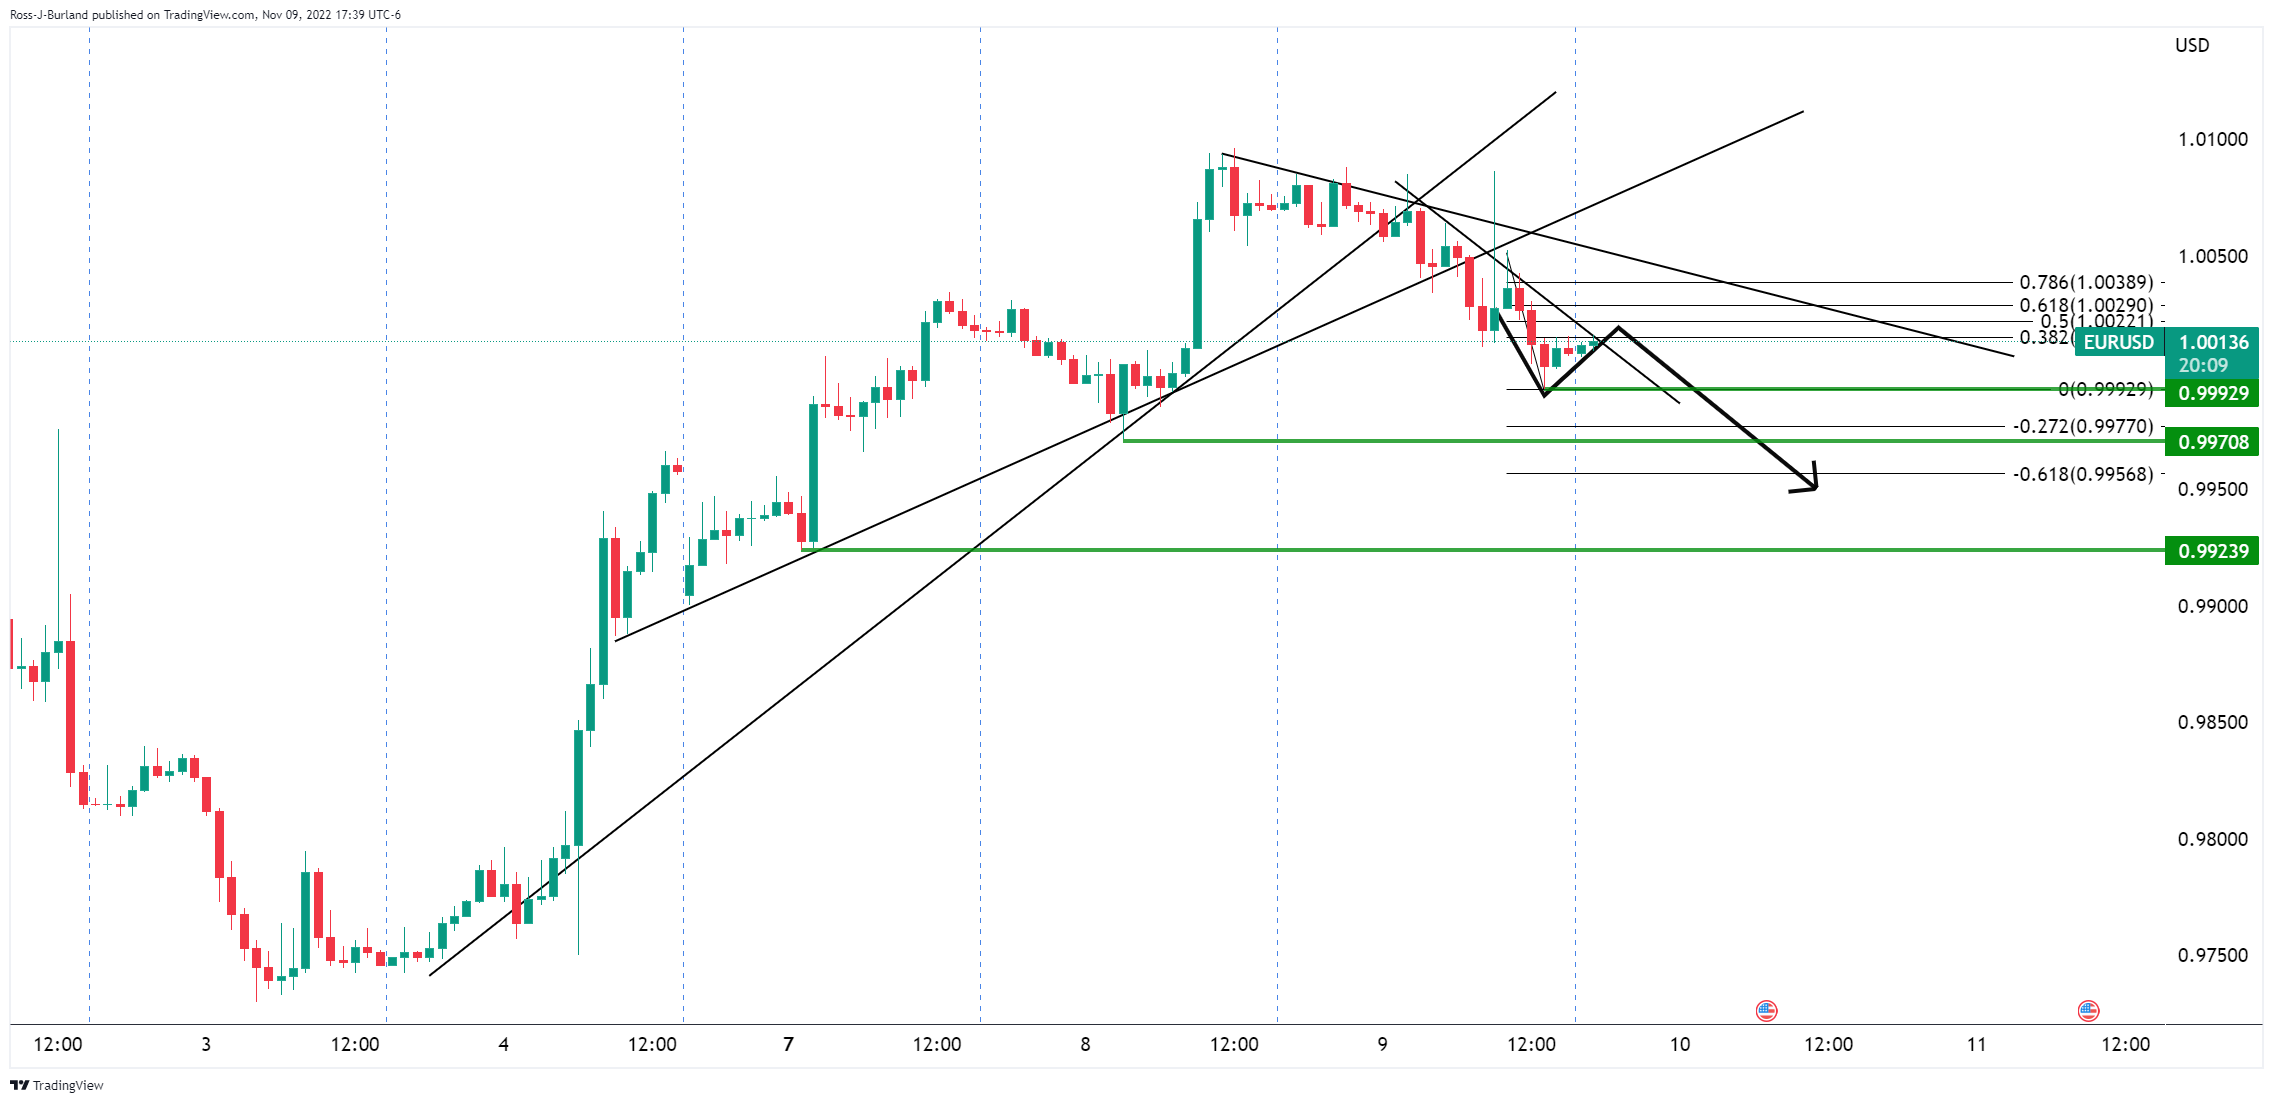
The bearish trend is dominant and the bears eye a break of the 0.9990s for a run to test below 0.9950 and the last quarter of the area. In doing so, this will be running into length built up over the course of the week, piggybacking on Friday's risk-on rally. On the other hand, a miss in the inflation data would likely play havoc on the greenback and see the Euro as a major beneficiary:
EURUSD daily chart
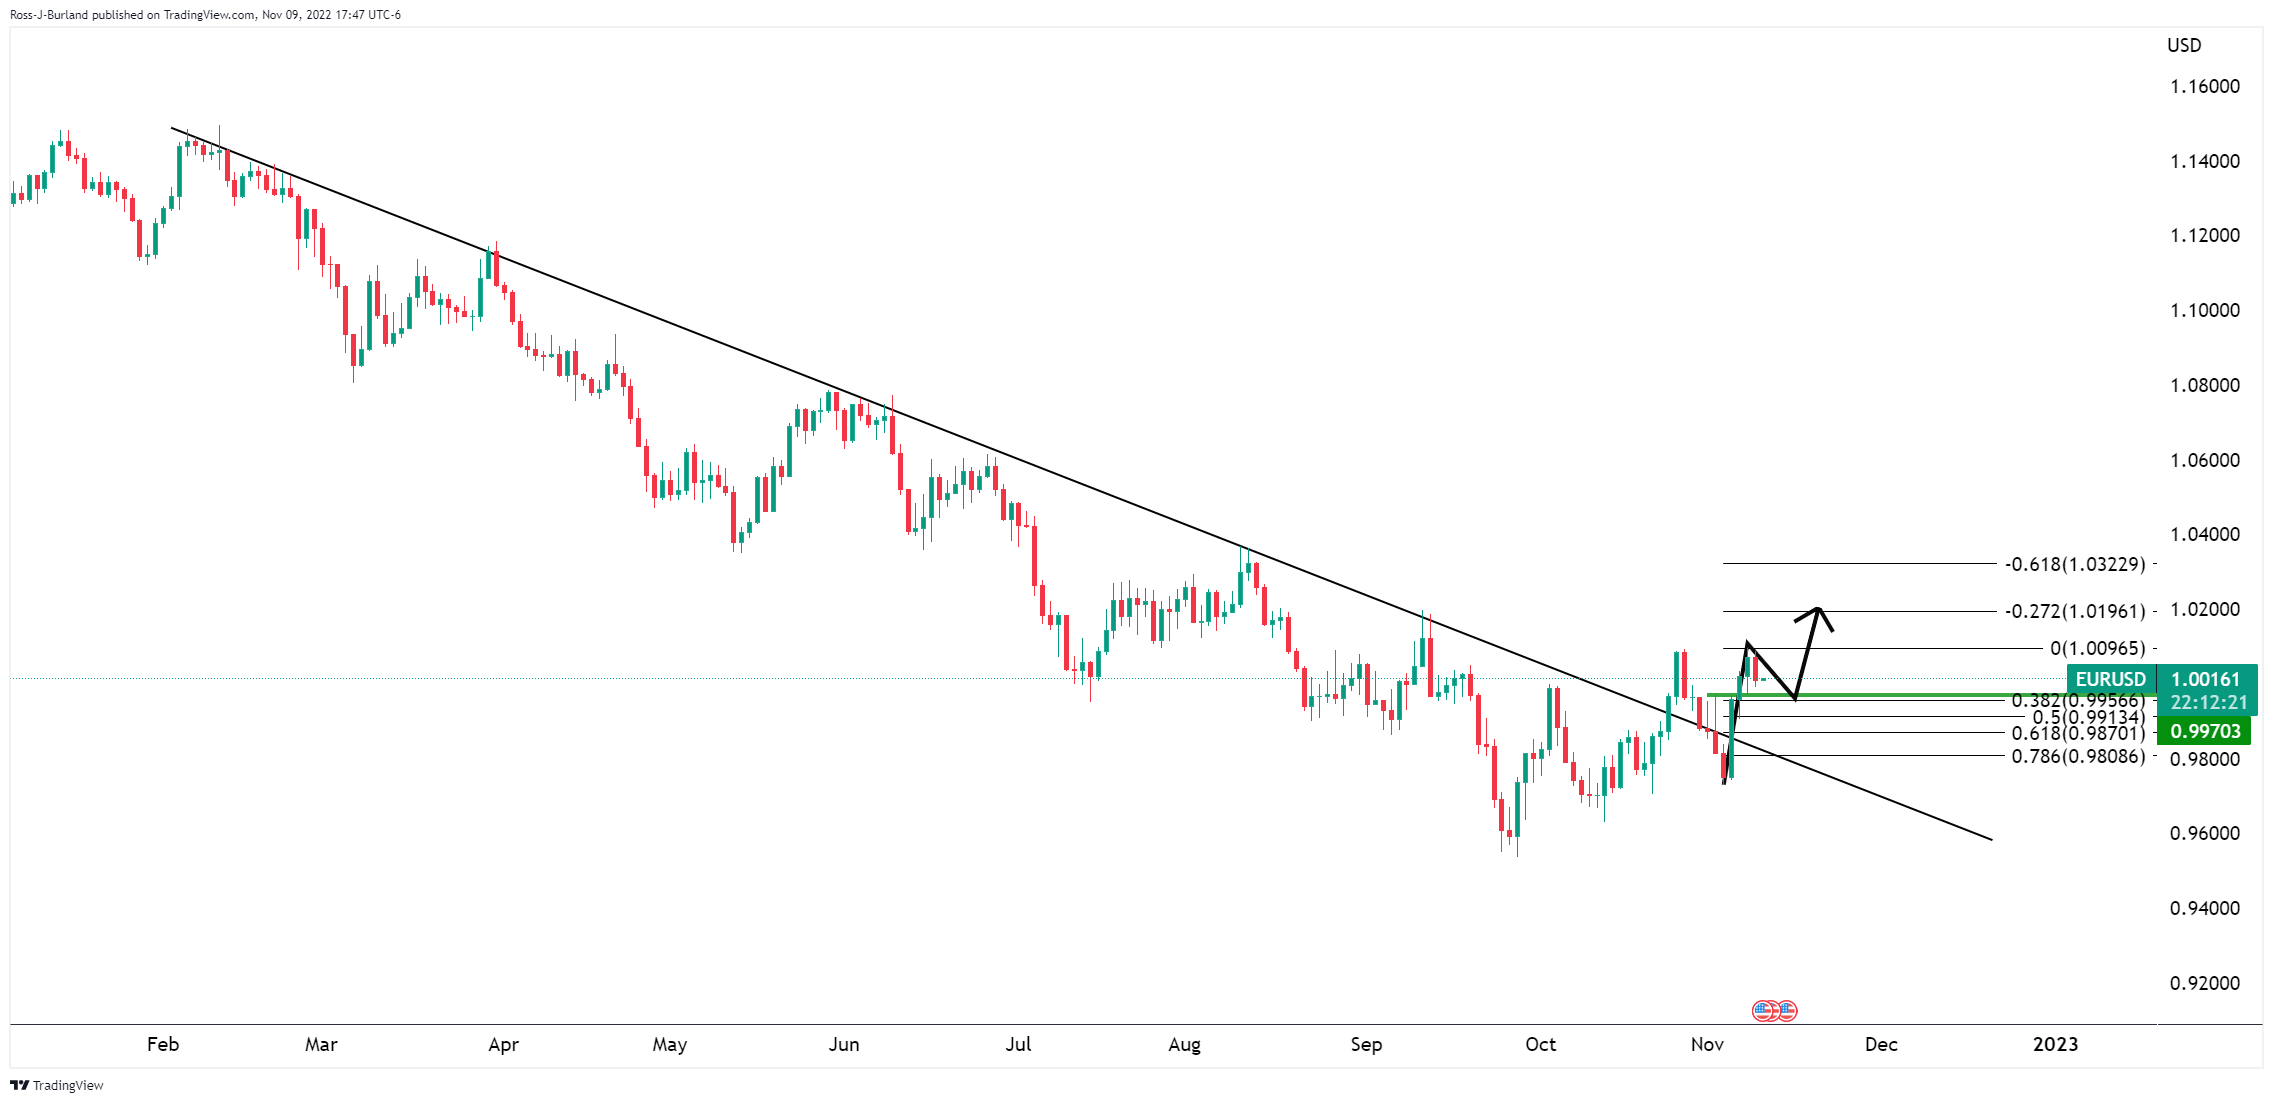
The price moved out of the trendline resistance and is therefore could be teeing up for a move higher. 0.9950/75 could hold as support.
-
23:50
Japan Foreign Investment in Japan Stocks increased to ¥340B in November 4 from previous ¥337B
-
23:50
Japan Foreign Bond Investment increased to ¥-581.8B in November 4 from previous ¥-1172.5B
-
23:49
WTI declines near a two-week low below $85.00 as US CPI hogs limelight
- Oil prices have dropped to near a two-week low at $84.75 amid multiple headwinds.
- Build-up of oil inventories, recovery in the DXY, and inflation risks to the US economy add volatility to oil prices.
- IEA head slammed OPEC+ for oil supply cuts as it may worsen the developing nations’ situation.
West Texas Intermediate (WTI), futures on NYMEX, have plunged more than 3% to near two-week low at around $84.75 amid a build-up of oil inventories last week, and rising odds for the higher peak of Federal Reserve (Fed)’s terminal rate. The oil prices nosedived after surrendering the psychological support of $90.00 as oil demand is facing multiple headwinds.
On Wednesday, US Energy Information Administration (EIA) reported a build-up of oil inventories by 3.925 million barrels for the week ending November 4. The addition of oil stockpiles weighed significant pressure on oil prices.
Apart from that, raising fears of an economic downturn in the US economy is also dampening the market mood. Richmond Federal Reserve (Fed) President Thomas Barkin on Wednesday cited that Fed’s fight against inflation may lead to a downturn in the US economy but that is a risk that the Fed will have to take, reported Reuters.
A sheer recovery in the US dollar index (DXY) also impacted the oil prices. The DXY recovered sharply as odds for higher Fed’s peak rate accelerated. Economists at ABN AMRO predicted that the Fed will shift its peak higher than the projected terminal rate to 5% (with a 25 bps rate hike in the first two monetary policies in CY2023 after a 50 bps rate hike in December). Going forward, a higher release of US inflation will strengthen the DXY and may escalate selling pressure for oil.
For OPEC+’s production cut decision, head of the International Energy Agency (IEA) Fatih Birol slammed the oil cartel’s decision to cut oil production as it might worsen the outlook for developing countries that are sliding towards recession, reported Bloomberg. He further added that the move is fueling inflation, especially in developing countries, and may require a “rethink,”
In China, a postponement in the reopening of the economy is also adding to the sell-side filters for the oil prices. Expectations of weak oil demand in the coming months due to a continuation of the no-tolerance Covid-19 approach are supporting oil bears.
-
23:40
Bond strategists: Fed terminal rate to reach just under 5% – Reuters poll
Sovereign bond yields are likely to remain elevated in the near term and be at higher levels in a year than predicted last month,” per the latest Reuters survey of fixed income strategists. “The bond strategists expected a terminal Federal Funds Rate just under 5%,” the poll adds.
Key findings
The median forecast from over 30 bond strategists who answered an additional question in the Nov. 4-9 poll put the terminal fed funds rate at 4.75%-5.00%, with one forecast as high as 5.50%-5.75%.
That median view was one quarter percentage point higher than what economists expected in a separate Reuters poll, but slightly lower than what interest rate futures were pricing in.
A strong 74% majority, 23 of 31, expected the terminal rate to be reached by end-Q1 2023. While six said Q2, two chose Q4 of next year. The bulk of responses were taken before any results from the US midterm elections were available.
Also read: Forex Today: Looking for safety ahead of US CPI
-
23:32
Silver Price Analysis: Rising wedge confirmation favors XAGUSD bears near $21.00
- Silver price holds lower ground after confirming a bearish chart pattern.
- MACD conditions, clear break below November’s top add strength to the bearish bias for XAGUSD.
- 200-SMA appears strong support to watch during further downside, bulls need validation from $21.30 to return.
Silver price (XAGUSD) justifies the rising wedge confirmation as sellers attack $21.00 during Thursday’s Asian session. In doing so, the bright metal defends the previous day’s bearish move, the biggest daily fall in a week.
Not only the rising wedge confirmation but bearish MACD signals and the metal’s sustained break of the previous monthly peak also keeps the sellers hopeful.
That said, the $21.00 and the $20.00 round figures gain the short-term seller’s attention before a horizontal area comprising multiple levels marked since late September, around $19.90, challenges the XAGUSD bears.
Also acting as the key support is the 200-SMA level surrounding $19.50, a break of which won’t hesitate to print the theoretical target near $18.00.
Meanwhile, XAGUSD buyers may have a tough time in returning to the table as the support line of the stated wedge joins October’s peak to highlight $21.30 as the crucial upside barrier.
Following that, a one-week-old ascending resistance line near $21.90 and the $22.00 threshold could lure the silver buyers before June’s peak near $22.50.
Silver price: Four-hour chart
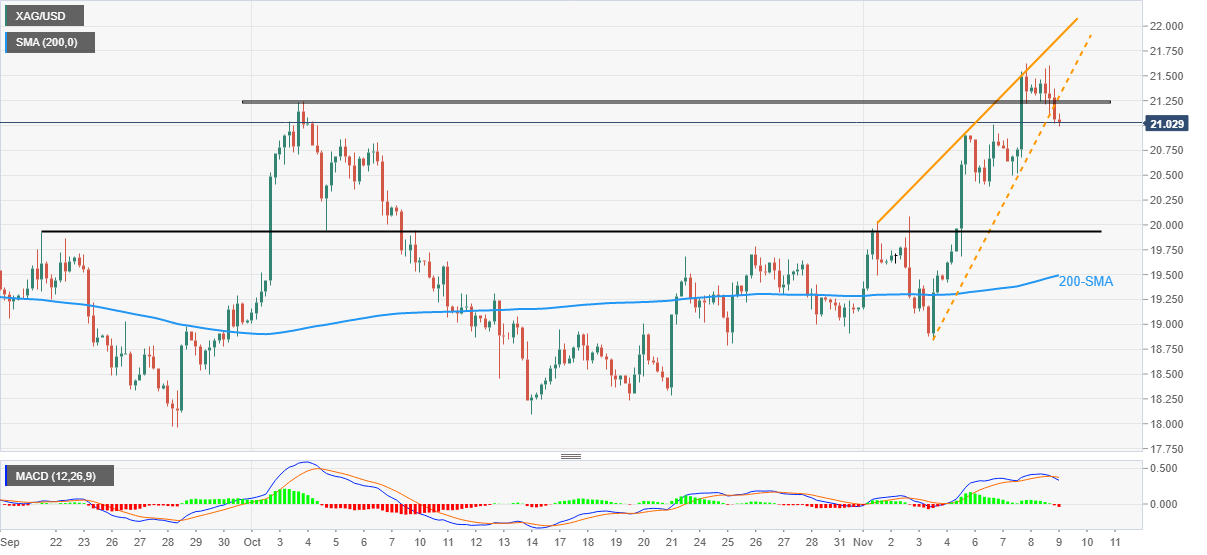
Trend: Further downside expected
-
23:12
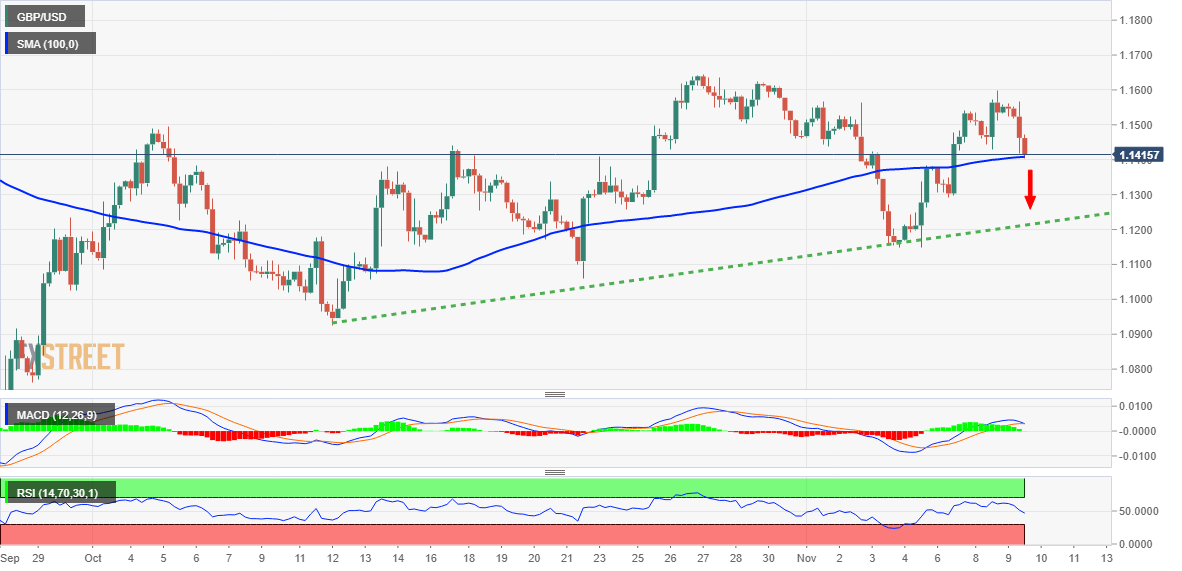
GBPUSD holds lower ground below 1.1400 amid market’s anxiety ahead of US inflation, UK GDP
- GBPUSD stays defensive around 50-DMA support, inactive after falling the most in a week.
- Sour sentiment underpins firmer US dollar, light calendar in the UK keeps bears hopeful.
- US CPI for October precedes UK Q3 GDP to direct short-term market moves.
GBPUSD remains mildly bid around 1.1350, following a 1.6% daily fall, as traders seek clear directions during early Thursday.
The Cable pair portrayed broad US dollar strength amid a risk-off mood to recall the bears. However, the cautious sentiment ahead of today’s US Consumer Price Index (CPI) data for October and the British Gross Domestic Product (GDP) for the third quarter (Q3), up for publishing on Friday, restrict the Cable pair’s immediate moves.
Hopes of more positive measures from the UK, in its upcoming fiscal plan, join the hopes of political optimism to challenge the GBPUSD bears of late.
As per Bloomberg News, the UK is to cut surcharge on bank profits to 3% to keep industry Competitive. Also positive for the Cable pair are the latest diplomatic moves by UK Prime Minister (PM) Rishi Sunak. “Rishi Sunak will become the first British prime minister in 15 years to attend the British-Irish Council summit on Thursday and meet with the leaders of the Scottish and Welsh devolved governments as he bids to rebuild relations,” said Reuters.
Fears emanating from China’s coronavirus conditions joined the hopes of the US government gridlock, due to the midterm elections, to weigh on the market sentiment the previous day. While portraying the mood, equities returned to the red after a three-day absence while the US Treasury yields also remained depressed. Even so, the US Dollar Index (DXY) bounced off a six-week low to print the first daily gain in three.
Alternatively, downbeat comments from the US Federal Reserve (Fed) policymakers and the mixed headlines from Russia tried to restrict the GBPUSD pair’s downside.
Moving on, the US CPI for October, expected 8.0% versus 8.2% prior, to direct immediate GBPUSD moves ahead of the first readings of the UK Q3 GDP. While a likely easing in the US CPI could weigh on the quote amid the latest downbeat Fedspeak, anticipated weakness in the British GDP data could keep the pair sellers on the table.
Technical analysis
Although the 50-DMA challenges GBPUSD bears around 1.1320, the pair’s retreat from the two-week-old resistance line, close to 1.1585 by the press time, keeps the bears hopeful of meeting the monthly support line near 1.1200.
-
23:07
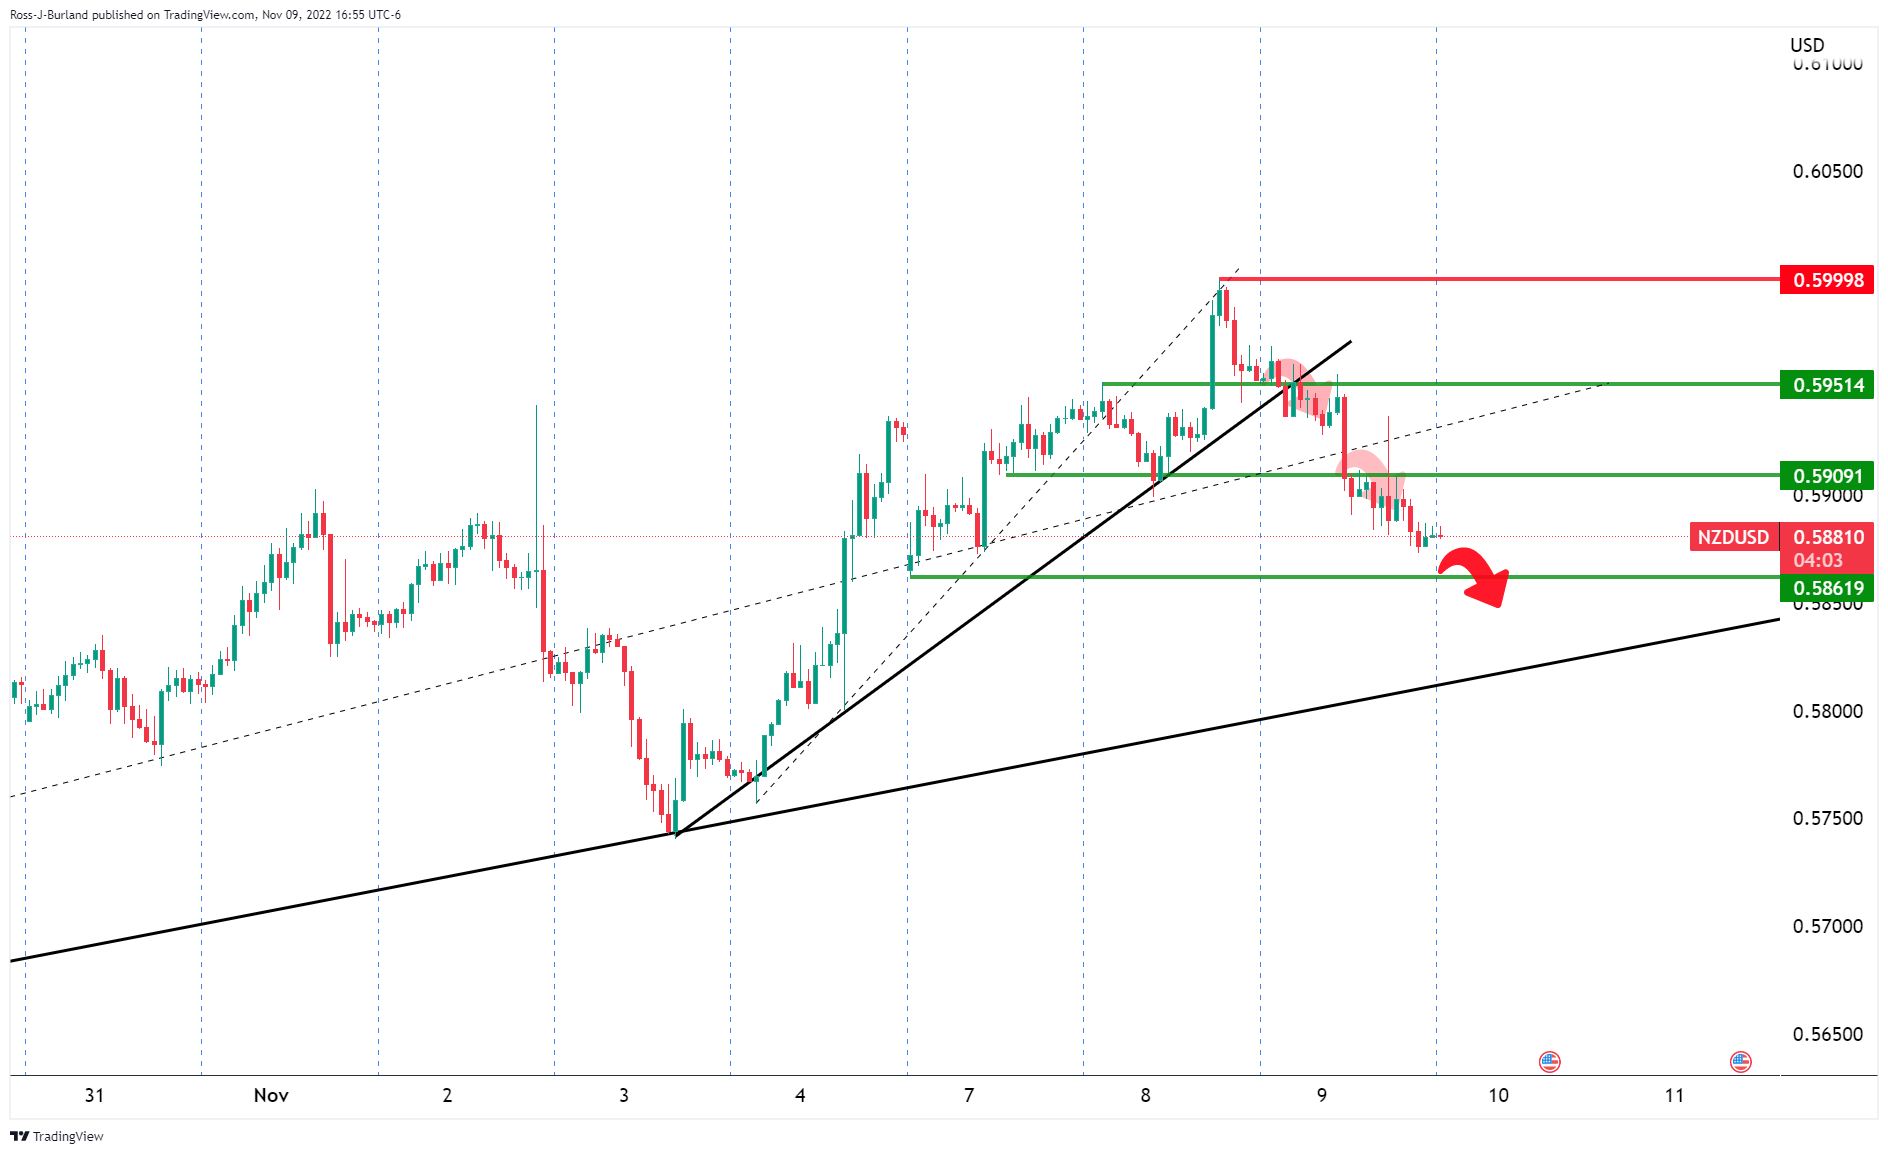
NZDUSD Price Analysis: Bears in control with eyes on daily trendline
- NZDUSD bulls are out of luck at this juncture.
- Bears look for a downside extension to the daily trendline.
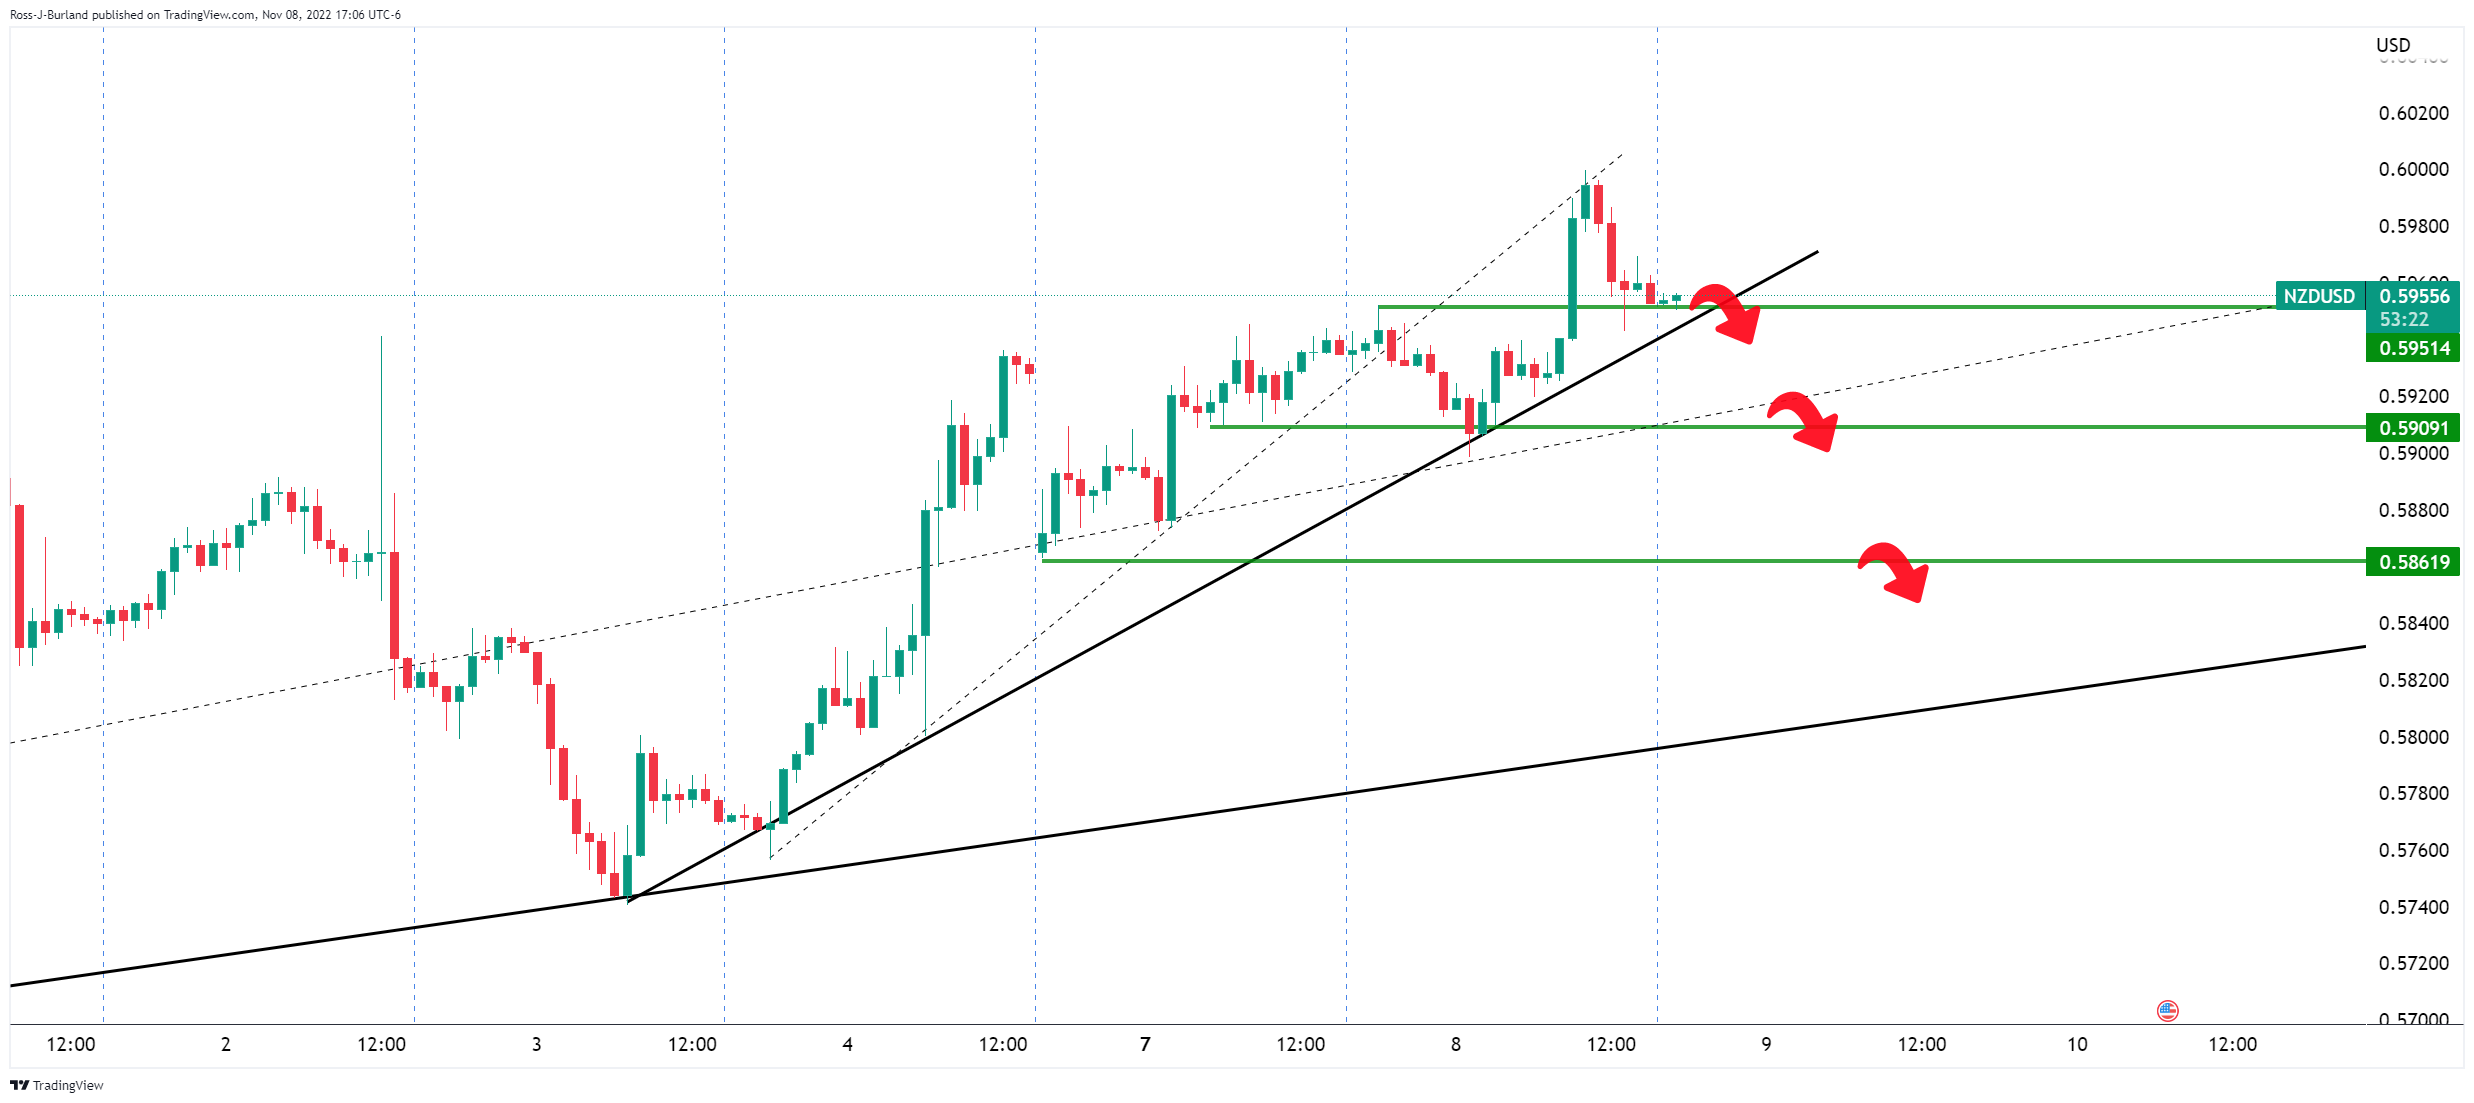
The Antepodians have stalled into Thursday, reversing track as the US Dollar hardens while traders braced for any upside surprise in the upcoming US inflation report while US yields rallied on a soft US Treasury auction. As per the prior analysis, NZDUSD Price Analysis: Bulls holding above key 0.5950 as bears try to take back control, where it was explained that the pair was testing the commitments of the bulls at the next micro trendline, 0.5950 is important in this regard, the following played out:
NZDUSD prior analysis
Update:
As for the daily chart, the price was bounded by resistance and it was stated that the doji could turn out to be pivotal for the pair and week:
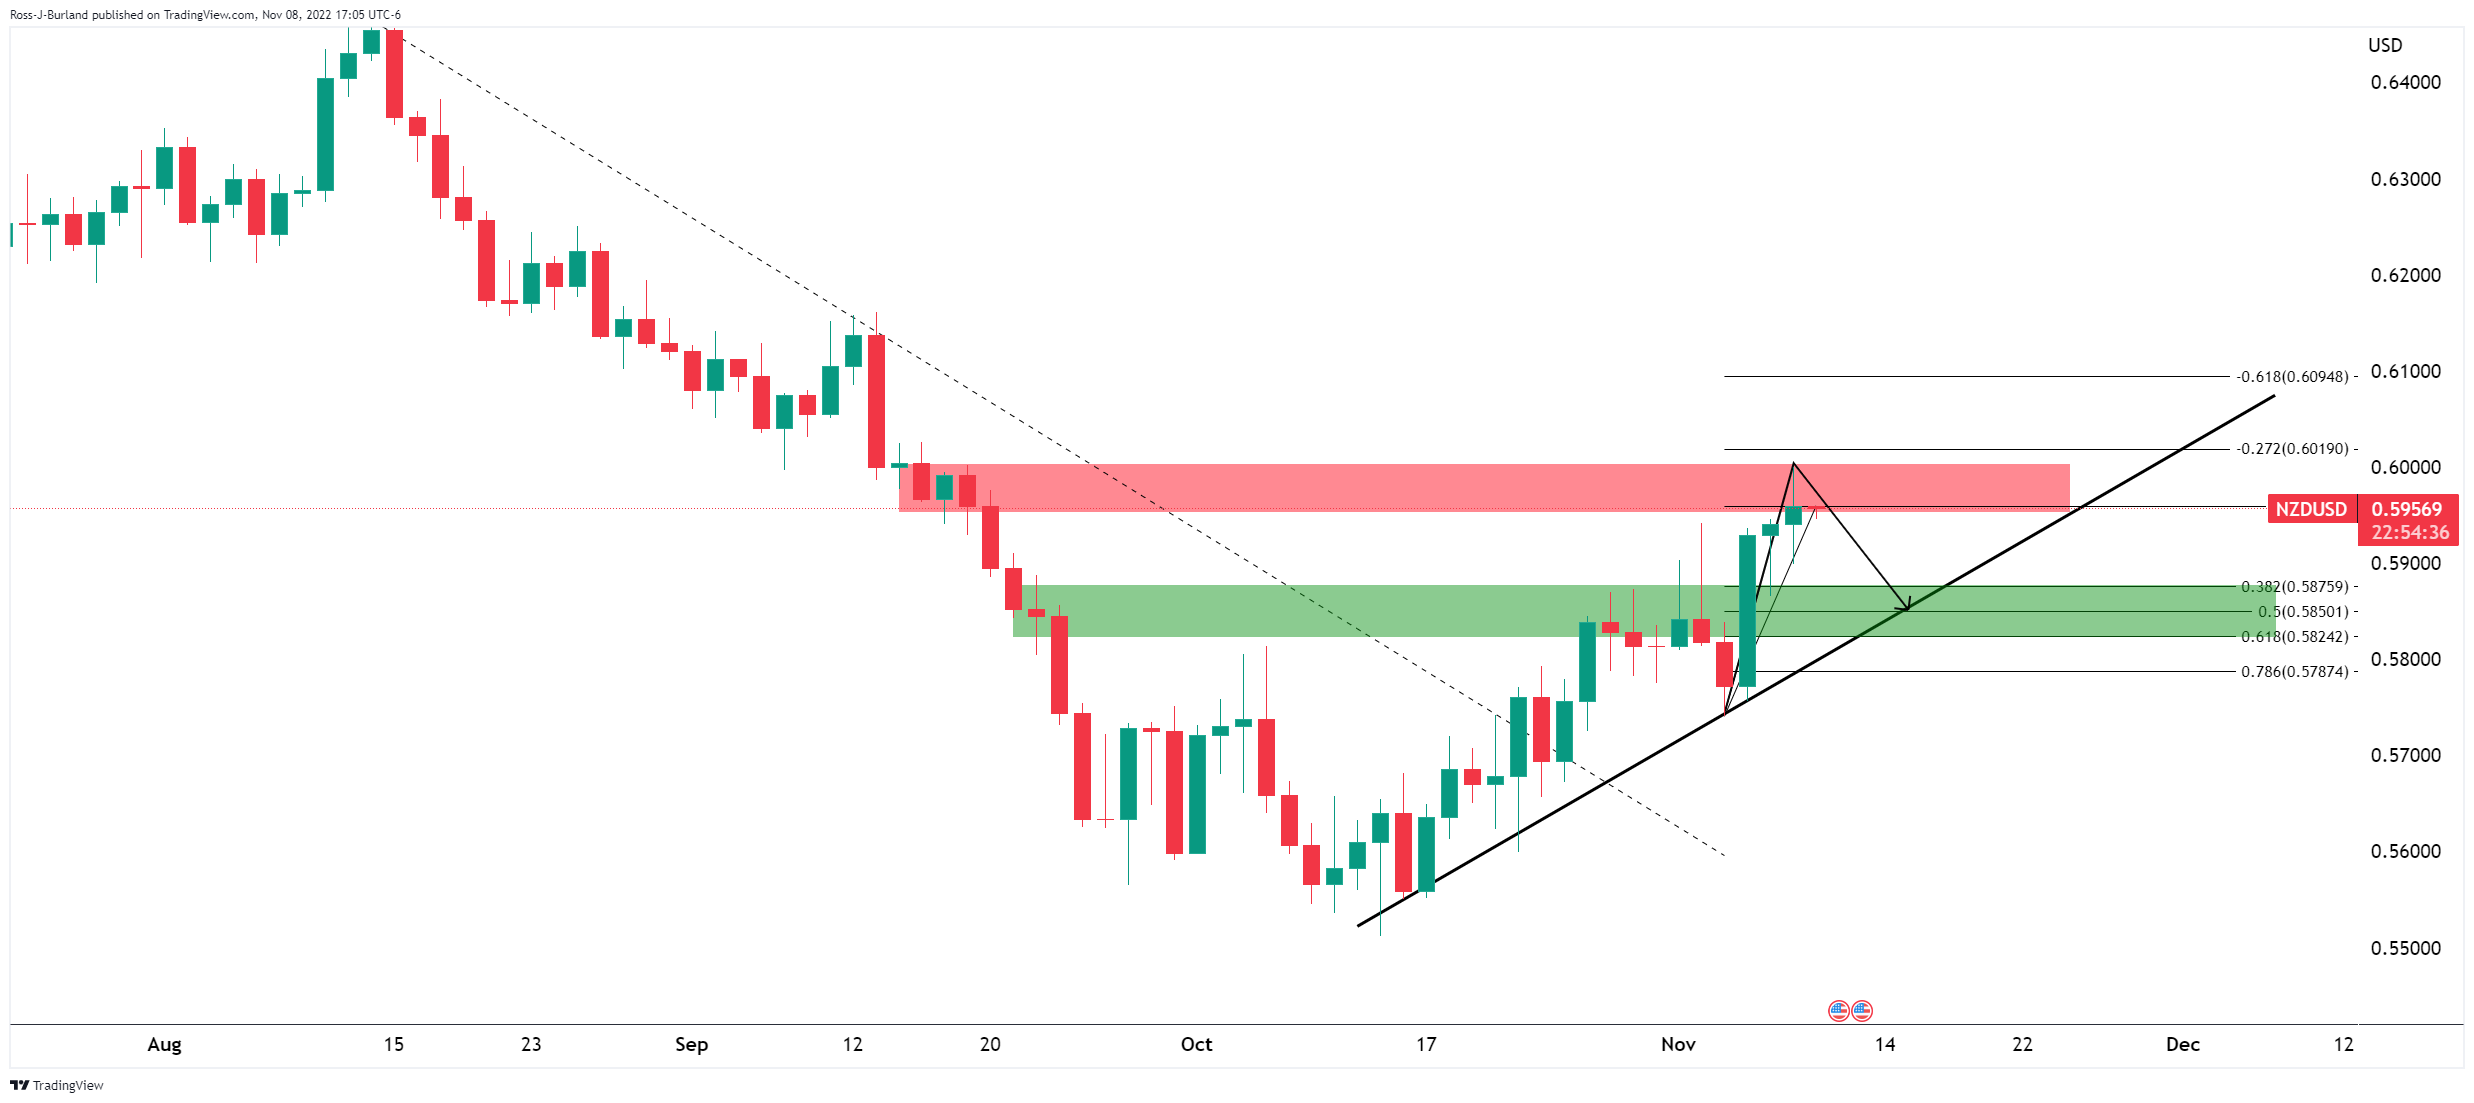
If the bears commit, then there will be prospects of a test of the broader trendline and a move into the key Fibonacci near 0.5850 in a 50% mean reversion:
Update...
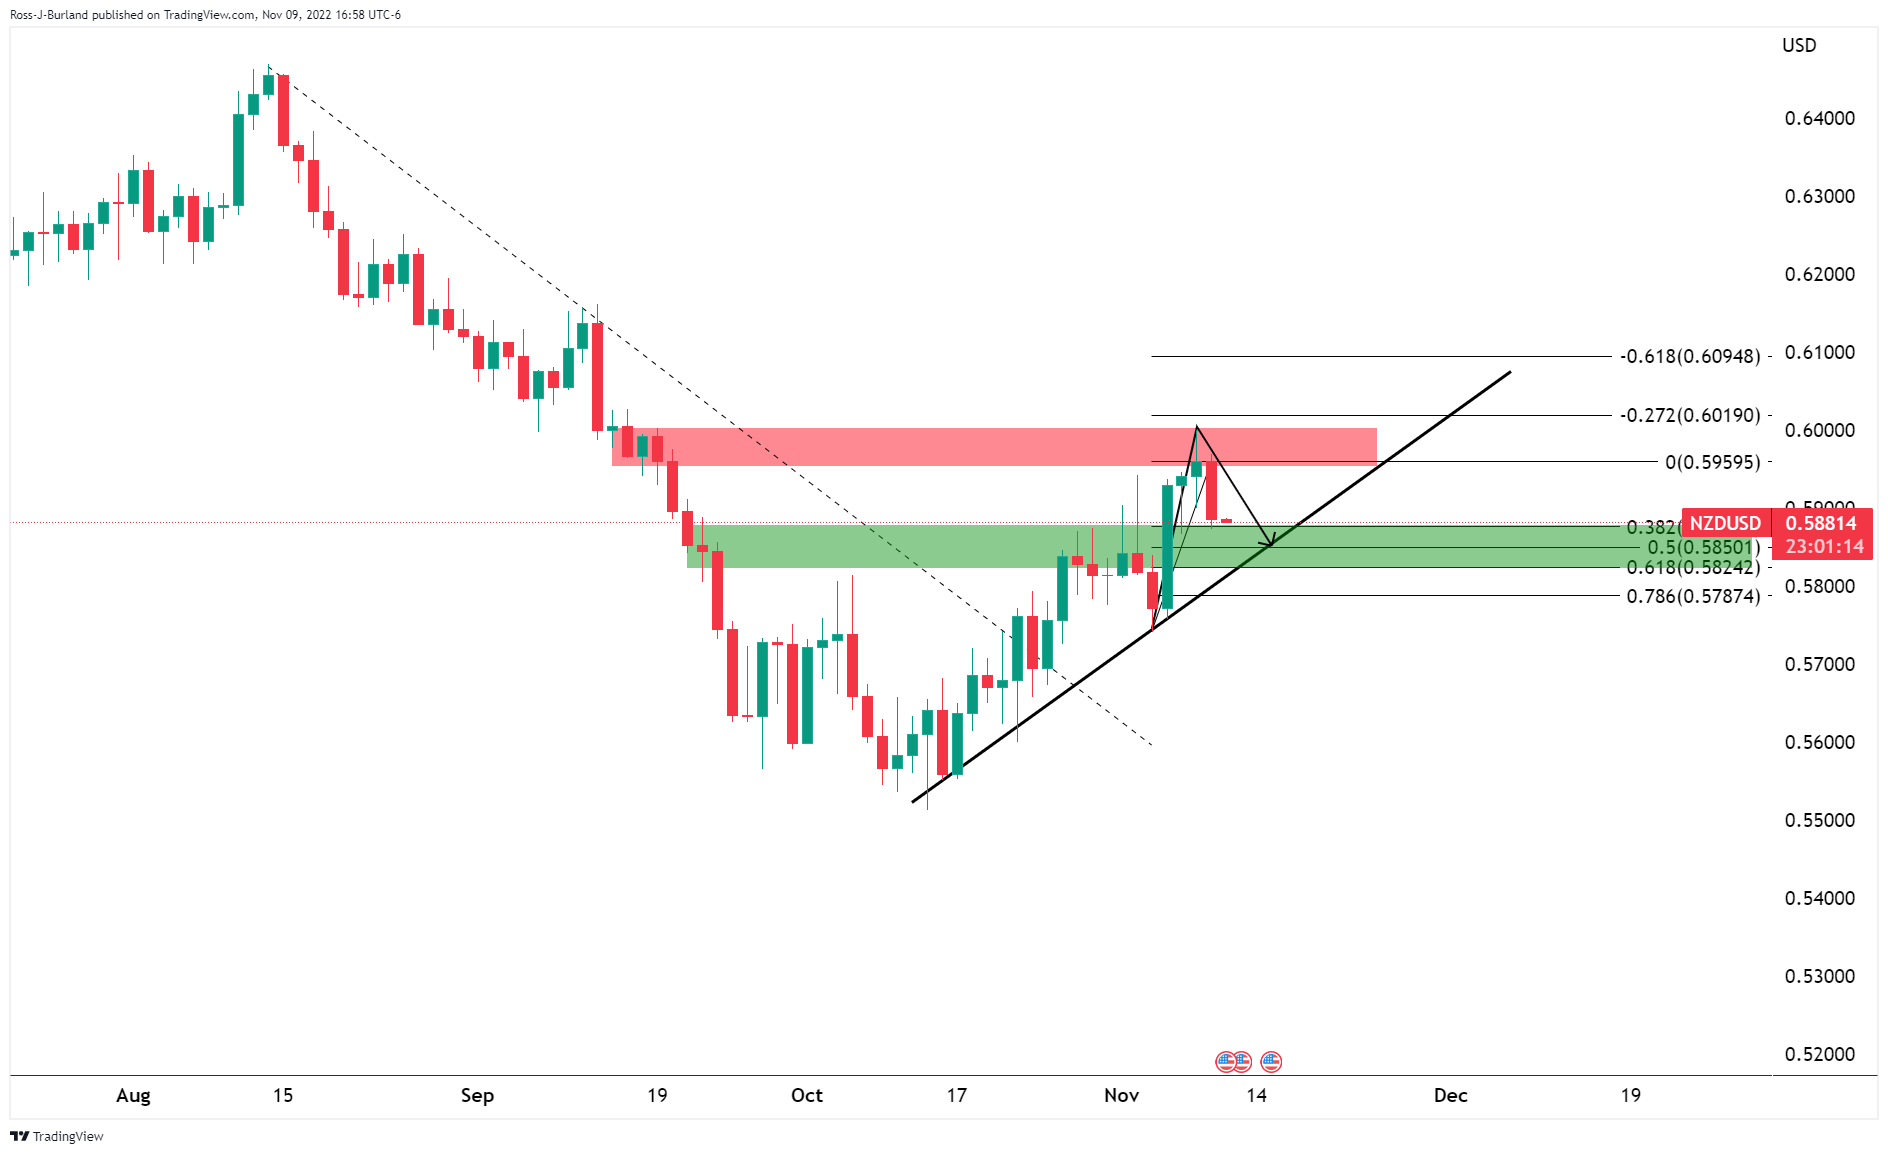
We are still some ways to go yet and the engulfment of the doji could be significant, propelling the pair lower depending on the outcome of the US inflation data perhaps.
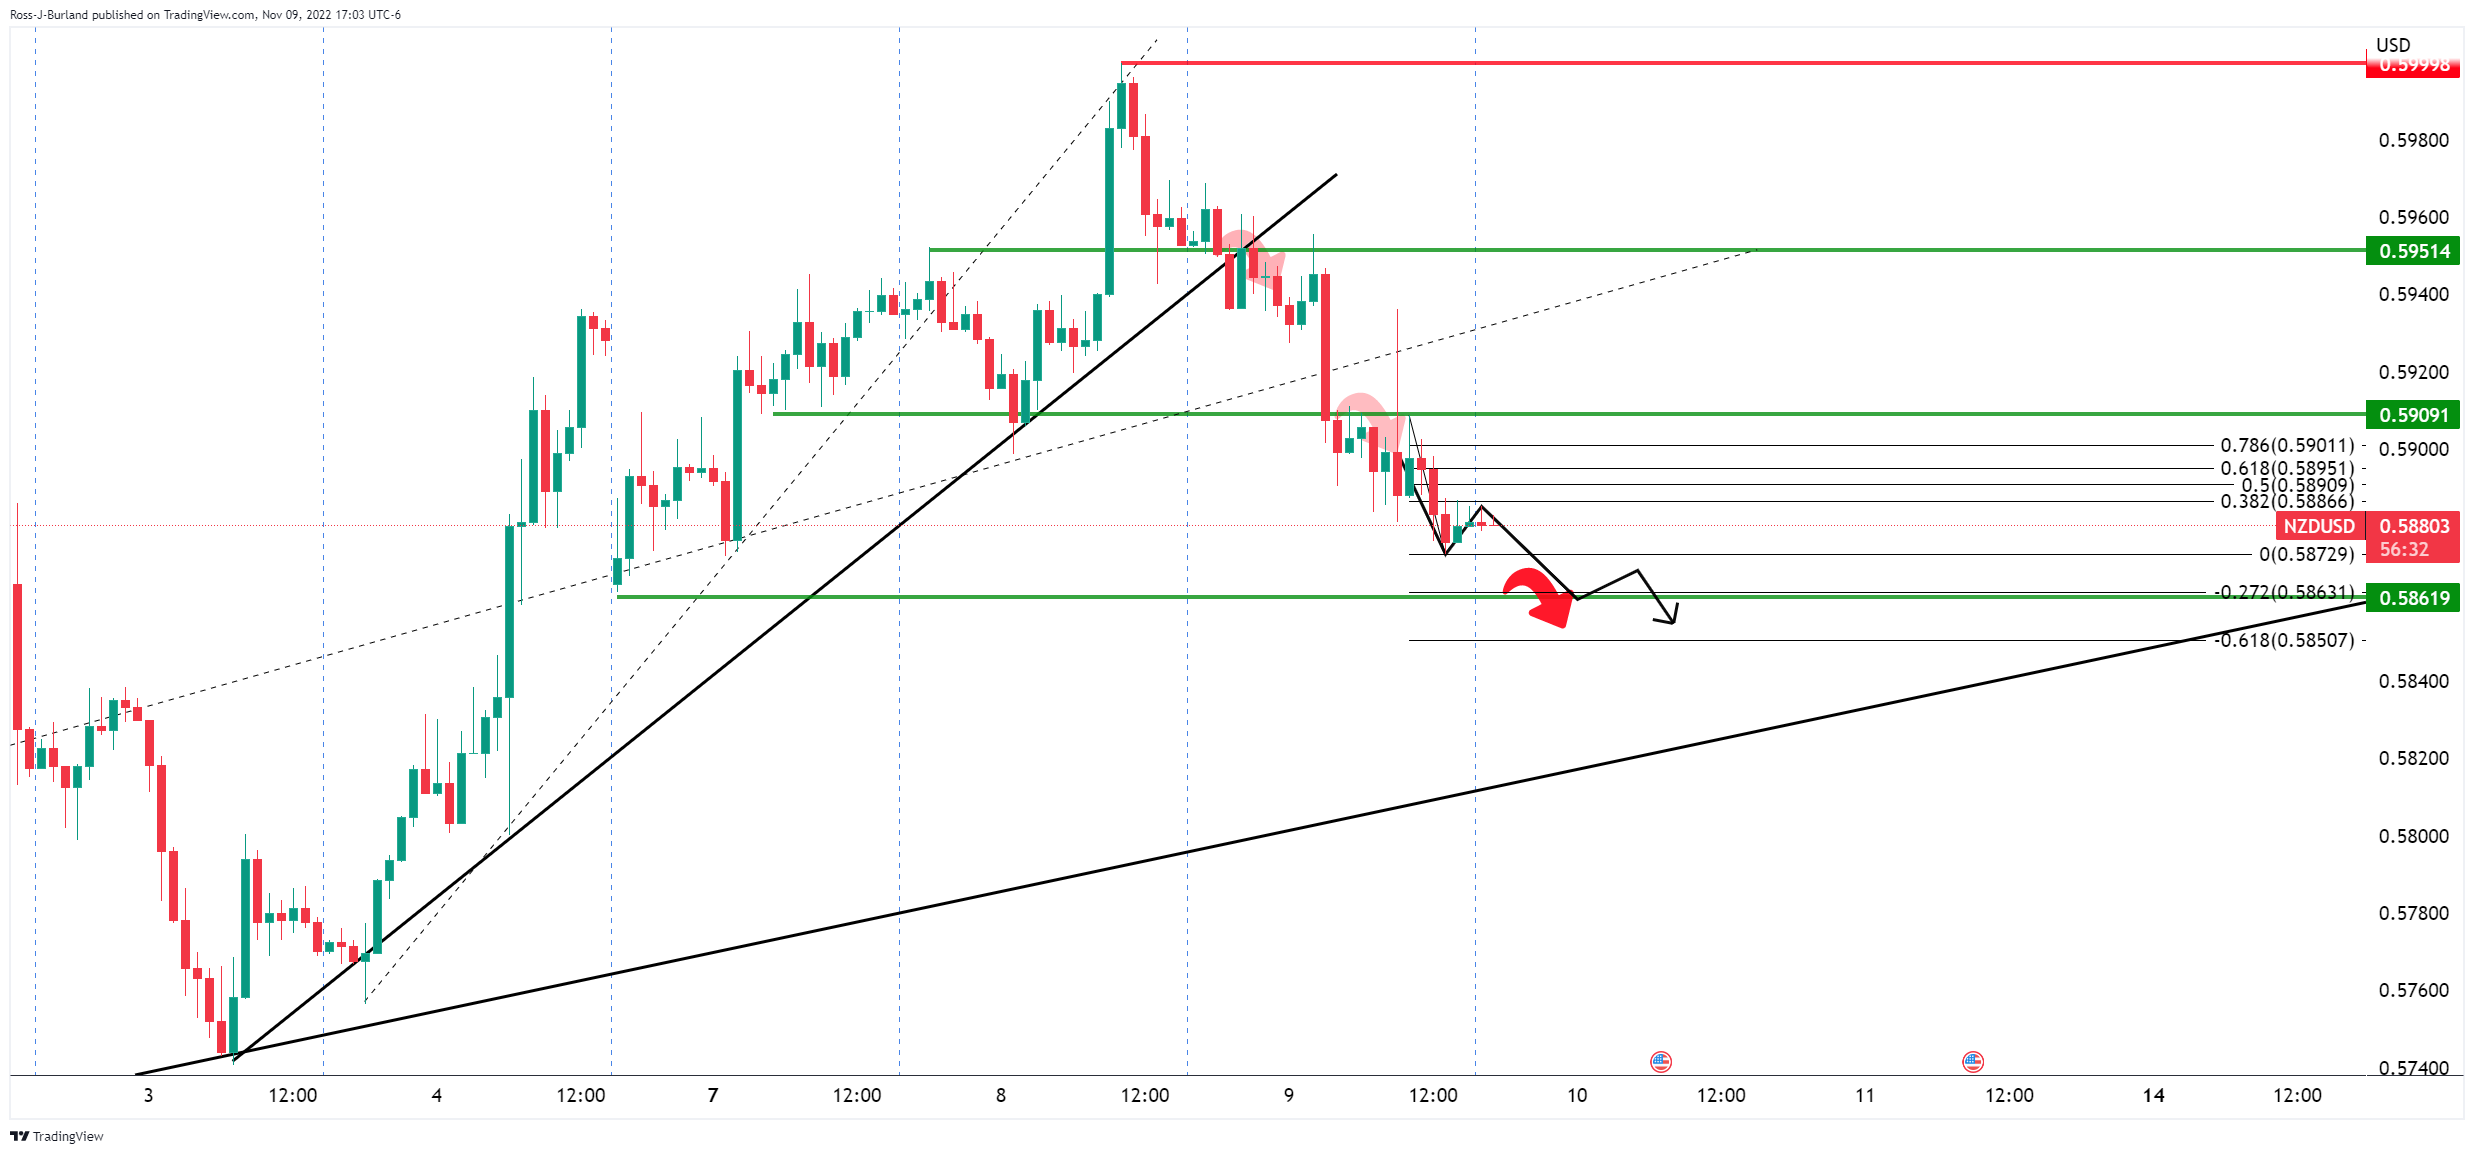
For the hourly template, this could mean a continuation is in order for the hours ahead:
-
23:05
GBPJPY attempts a rebound from 166.00 ahead of UK GDP data
- GBPJPY has witnessed a loss in the downside momentum of around 166.00 as the focus has shifted to UK GDP.
- The UK GDP data is seen lower at 2.1% vs. the prior release of 4.4% amid accelerating BOE rates.
- There is no third budget plan on the table for now by the Japanese administration.
The GBPJPY pair has sensed buying interest after a sheer decline to near 166.00 in the late New York session. The asset has displayed signs of exhaustion in the downside momentum, however, it would be early to call it a reversal amid the unavailability of any reversal trigger.
Meanwhile, the risk tone is extremely negative as S&P500 nosedived on Wednesday led by multiple headwinds. Lay-off by Meta to trim discretionary spending, anxiety ahead of the US Consumer Price Index (CPI) numbers, and firmer chances of Republicans’ win in US mid-term elections weighed significant pressure on the US equities.
For further guidance, investors are focusing on the UK Gross Domestic Product (GDP) data, which will release on Friday. The GDP data on an annual basis is seen lower at 2.1% vs. the prior release of 4.4%. And, the quarterly regime is expected to display negative growth by 0.5% against an expansion of 0.2%.
Accelerating interest rates by the Bank of England (BOE) to curtail the double-digit inflationary pressures have resulted in the postponement of the expansion plans by various firms to avoid hefty interest obligations. Therefore, the extent of the economic activities has declined sharply. The scale of economic activities may decline further as UK novel leadership is preparing a budget on spending cuts and tax hikes to contain the debt crisis.
On the Tokyo front, Japanese Economy Minister Shigeyuki Goto said on Wednesday, it is “desirable for FX to move stably reflecting fundamentals.” The Japanese official also clarified that there is no plan on the table for the third budget. This week the administration confirmed a second budget worth 29.1 trillion Japanese Yen after a budget of $198 Billion to spurt the aggregate demand.
-
22:55
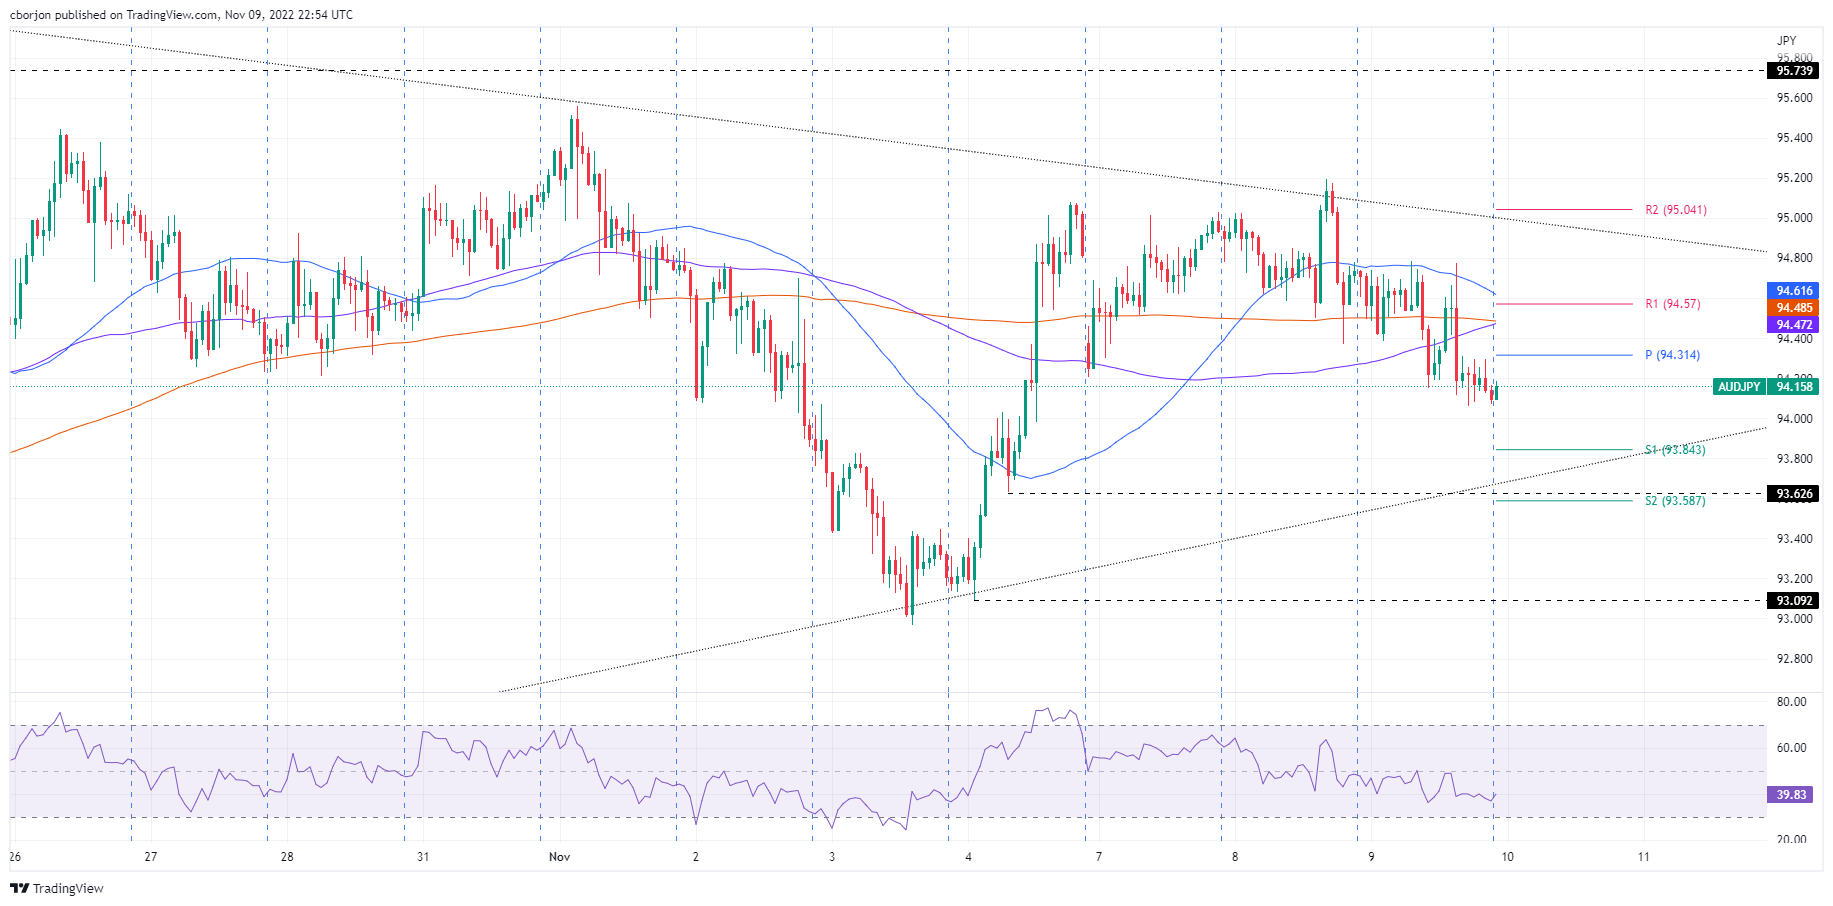
AUDJPY Price Analysis: An evening star formation in the daily chart exacerbates a fall towards 93.00
- The AUDJPY extended its losses to two-straight days courtesy of risk aversion.
- AUDJPY Price Analysis: Break below 94.00 could tumble the pair towards November’s low at 92.96.
The AUDJPY dropped below the 50 and the 100-day Exponential Moving Averages (EMAs) on Wednesday, amidst a risk-off impulse courtesy of the US Republican Party failing to sweep the midterm elections, as speculations mounted that a Republican majority would suggest few major policy changes in the next two years. At the time of writing, the AUDJPY is trading at 94.14, registering minuscule gains as the Asian session begins.
AUDJPY Price Analysis: Technical outlook
The AUDJPY is range-bound, trapped within the 94.00-95.60 range for the last four trading days, unable to break above/below the range, even though market sentiment fluctuates, and kept global equities volatile. Of note, the Relative Strength Index (RSI) at 49 turned bearish, suggesting that sellers are gathering momentum. However, unless Japanese Yen buyers break beneath the AUDJPY 94.00, that would open the door for further losses. Otherwise, the cross-currency pair will remain subdued within the previously mentioned area.
During the last couple of days, the AUDJPY shifted neutral-to-downward biased in the near term. The AUDJPY Wednesday’s price action depicts the pair dived below the 50, 100, and 200-EMAs, laying the ground for further downside. So the AUDJPU path of least resistance is downwards. Further cementing the bearish bias case is the RSI at bearish territory and not even close to the 50-midline.
Hence, the AUDJPY’s first support would be the 94.00 psychological level. Break below will expose the S1 daily pivot at 93.84, followed by the S2 daily pivot level at 93.58.
AUDJPY Key Technical Levels
-
22:48
USDCHF Price Analysis: Retreats towards 0.9800 amid failure to cross 50-DMA
- USDCHF remains on the bear’s radar despite bouncing off a five-week low.
- Corrective bounce failed to cross the 50-DMA hurdle, suggesting further downside room.
- Bearish MACD signals, sustained trading below the previous key support also favor sellers.
- Ascending support lines from early August lure bears, 0.9900 adds to the upside filters.
USDCHF fades the previous day’s bounce off a monthly low as it drops back to 0.9845 during the early hours of Thursday. In doing so, the Swiss currency pair remains below the 50-DMA hurdle despite the latest corrective bounce.
Also keeping the pair sellers hopeful are the bearish MACD signals and the quote’ sustained trading below the five-week-old ascending support line, near 0.9900 by the press time.
Even if the USDCHF pair manage to cross the 50-DMA hurdle of 0.9860, as well as the aforementioned support-turned-resistance line, around 0.9900, the sellers aren’t off the table as multiple resistances near 0.9920 and 1.0060 could challenge the pair’s upside moves.
Alternatively, a three-month-old ascending trend line, around 0.9790 by the press time, restricts immediate losses of the AUDUSD pair.
Following that, another support line from early August, near 0.9680, could entertain the bears.
It’s worth noting, however, that the AUDUSD pair’s sustained downside past 0.9680 won’t hesitate to challenge September’s low near 0.9480.
USDCHF: Daily chart
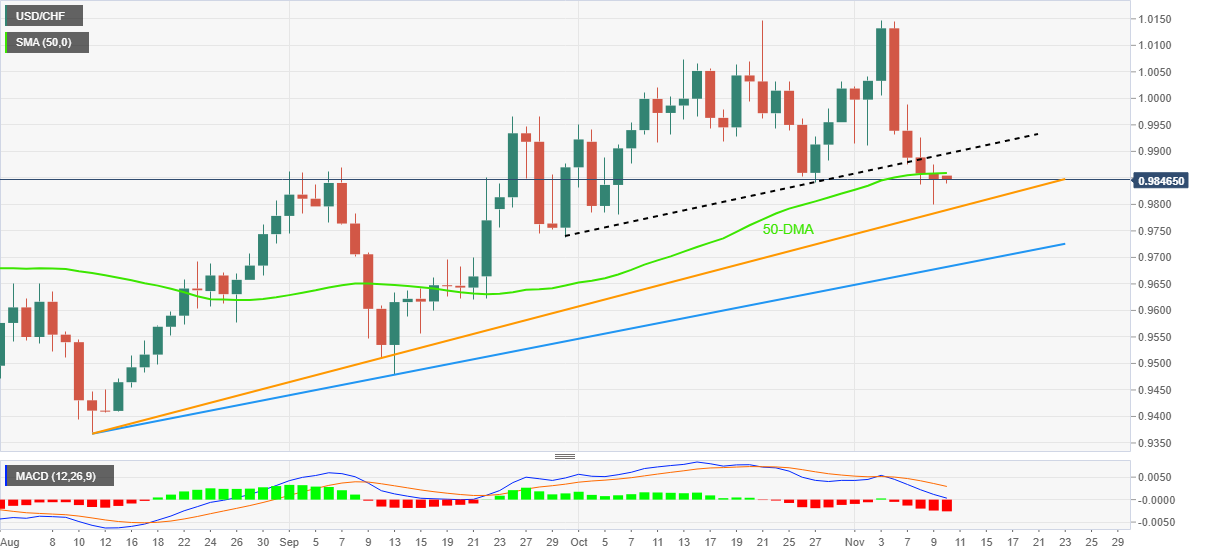
Trend: Further downside expected
-
22:47
USDCAD Price Analysis: Bulls eye 1.3650 as next key upside target
- USDCAD could be in for a correction with the 61.8% Fibonacci eyed.
- Support is eyed around 1.3480/00 while1.3650 comes as the next key upside target.
The Canadian dollar weakened against its US counterpart on Wednesday following some strong two-way price action in the New York session that eventuated in a bid in the US dollar as US yields surged on the back of a weak Treasury auction. The moves have seen USDCAD rally onto shorts and there could be more to come. Investors are now shifting focus to US inflation data on Thursday for clues on the path of future interest rate hikes by the Federal Reserve which could seal the fate for the bears on a better-than-expected outcome. Meanwhile, the following illustrates the potential trajectory from a bullish perspective:
USDCAD H1 chart

The price is up to the prior highs of the sideways channel formed on Monday and Tuesday. A correction could be in order at this point and a reversion to the 61.8% Fibonacci meets structure around 1.3480/00.1.3650 comes as the next key upside target.
-
22:33
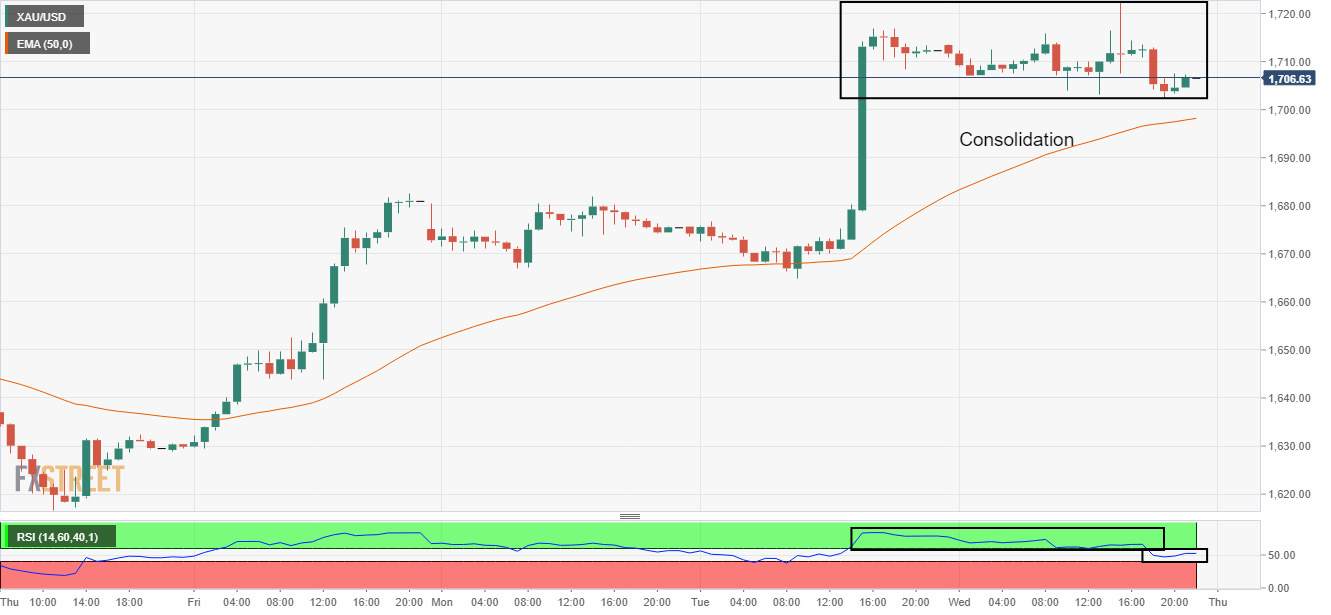
Gold Price Forecast: XAUUSD holds $1,700 support despite risk-off mood, US inflation eyed
- Gold price has sensed support around a $1,702.00 cushion despite negative market sentiment.
- The DXY recovered significantly to near 110.40 ahead of October’s inflation report.
- Core CPI figure will be of utmost importance as it has not displayed signs of exhaustion yet.
Gold price (XAUUSD) is continuously picking bids around the immediate hurdle of $1,702.00 from Wednesday. The precious metal surrendered its entire Wednesday’s gains after the risk profile turned soar as investors underpinned the US dollar index (DXY) ahead of the US inflation event.
The S&P500 index was the biggest victim as investors turned anxious ahead of the outcome of the mid-term elections in addition to October’s inflation report. A majority win of Republicans will trigger political instability as approval of bills and laws will have to take a tangled route. Meanwhile, the DXY recovered sharply after registering a fresh seven-week low at 109.35.
On Thursday, the US inflation figures will remain in the spotlight. As per the preliminary estimates, the headline US CPI will decline to 8.0% vs. the prior release of 8.2%. Thanks to the falling gasoline prices that are continuously weighing pressure on plain-vanilla Consumer Price Index (CPI) figures. Also, the core CPI is seen marginally lower at 6.5%. Investors will mainly focus on core CPI figures as the catalyst has not displayed signs of meaningful exhaustion yet.
Gold technical analysis
On an hourly scale, the gold price is oscillating in a range of $1,702.10-1,722.40 after a sheer upside move. The precious metal is still holding the 50-period Exponential Moving Average (EMA) at $1,698.40, which signals that the upside is intact.
The Relative Strength Index (RSI) (14) has shifted into the 40.00-60.00 after remaining in the bullish range, which indicates that the upside momentum has exhausted but that doesn’t warrant a bearish reversal.
Gold hourly chart
-
22:22
AUDUSD struggles to defend 0.6400, Australia Consumer Inflation Expectations, US CPI eyed
- AUDUSD holds lower ground after the biggest daily loss in a month.
- China’s covid woes, softer inflation data joined pre-US inflation anxiety to weigh on prices.
- Dovish comments from RBA’s Bullock strengthened bearish bias.
- Aussie Consumer Inflation Expectations can offer immediate directions but US CPI is the key.
AUDUSD bears pressure the quote to revisit 0.6400, despite the latest inaction around 0.6420, amid lackluster markets. In doing so, the Aussie pair extends the previous day’s losses, the biggest in one month, during the early hours of the key Thursday.
The China-linked risk aversion could be considered the key catalyst for the AUDUSD pair’s downside move the previous day. Fears from the dragon nation escalated after six-month high daily covid numbers and a fresh lockdown in one more district. Furthermore, downbeat China inflation data also weighed on the pair. That said, the headline Consumer Price Index (CPI) dropped to 2.1% versus 2.4% market forecasts and 2.8% prior. However, the Producer Price Index (PPI) improved to -1.3% compared to -1.5% expected and 0.9% previous readings.
Elsewhere, dovish comments from the Reserve Bank of Australia’s (RBA) Deputy Governor Michele Bullock also contributed to the AUDUSD pair’s weakness. There are “good reasons to think we are approaching the peak of inflation this cycle,” said RBA’s Bullock on Wednesday. The policymaker added, “We have already raised rates aggressively.”
It should be noted that the fears of a government gridlock in the US, due to the midterm elections, also exerted downside pressure on the risk-barometer pair.
On the other hand, New York Federal Reserve (Fed) President John Williams made some comments on inflation expectations in the text of a speech to be delivered to an audience in Zurich. “Relatively stable long-term inflation expectations are good news,” stated the policymaker.
Additionally, mixed headlines surrounding Russia also tried to tame the risk-off mood but failed to gain major attention. Russia appears to retreat from the only Ukrainian regional capital captured, namely Kherson, whereas President Vladimir Putin is less likely to attend the upcoming G-20 summit in Bali, starting from November 15.
Amid these plays, equities returned to the red after a three-day absence while the US Treasury yields also remained depressed. Even so, the US Dollar Index (DXY) bounced off a six-week low to print the first daily gain in three.
Moving on, Australia’s Consumer Inflation Expectations for November, expected 5.7% versus 5.4% prior, will precede the US Consumer Price Index (CPI) for October, expected 8.0% versus 8.2% prior, to direct immediate AUDUSD moves.
Given the recently dovish RBA comments and the risk-off mood, the AUDUSD is likely to stay on the bear’s radar unless the US inflation numbers disappoint the traders by a larger miss.
Technical analysis
A clear pullback from the 50-DMA, around 0.6500 by the press time, directs AUDUSD towards the 21-DMA nearby support, close to 0.6370 at the latest.
-
21:55
EURUSD rebound from parity, risk-off impulse still solid ahead of US CPI
- EURUSD has found an immediate cushion around 1.0000 ahead of the US CPI.
- US equities witnessed a massive sell-off amid anxiety ahead of US mid-term elections.
- Eurozone CPI is still seen at 3% in three years and 5.1% in the next 12 months.
The EURUSD pair has picked parity as immediate support in the early Tokyo session after a corrective move from around 1.0100. The asset sensed selling pressure as the market turned cautious ahead of the US Consumer Price Index (CPI) release.
S&P500 sensed an intense sell-off amid headwinds of the US mid-term elections outcome and upside risks from the inflationary pressures as they can move north despite projections for a decline. Meanwhile, the US dollar index (DXY) rebounded firmly to 110.50 amid an improvement in safe-haven’s appeal.
The 10-year US Treasury yields witnessed a steel fall below 4.10% as odds are favoring a rate hike of 50 basis points (bps) by the Federal Reserve (Fed) in its December monetary policy meeting, according to the CME FedWatch tool.
Economists at ABN AMRO are predicting that the Fed will shift its peak higher than the projected terminal rate to 5% (with a 25 bps rate hike in the first two monetary policies in CY2023 after a 50 bps rate hike in December). However, the Fed will also look for cuts from September and those cuts will be steeper once macro conditions in the US allow for this.
Going forward, the headline US CPI is seen lower at 8%, and the core inflation that excludes oil and food price growth would drop marginally to 6.5%.
On the Eurozone front, the inflation rate is in the double-digit figure and is hurting the households’ sentiment. A survey conducted by the European Central Bank (ECB) of consumer expectations for inflation dictates that consumers still see inflation at 3% in three years and 5.1% over the next 12 months.
-
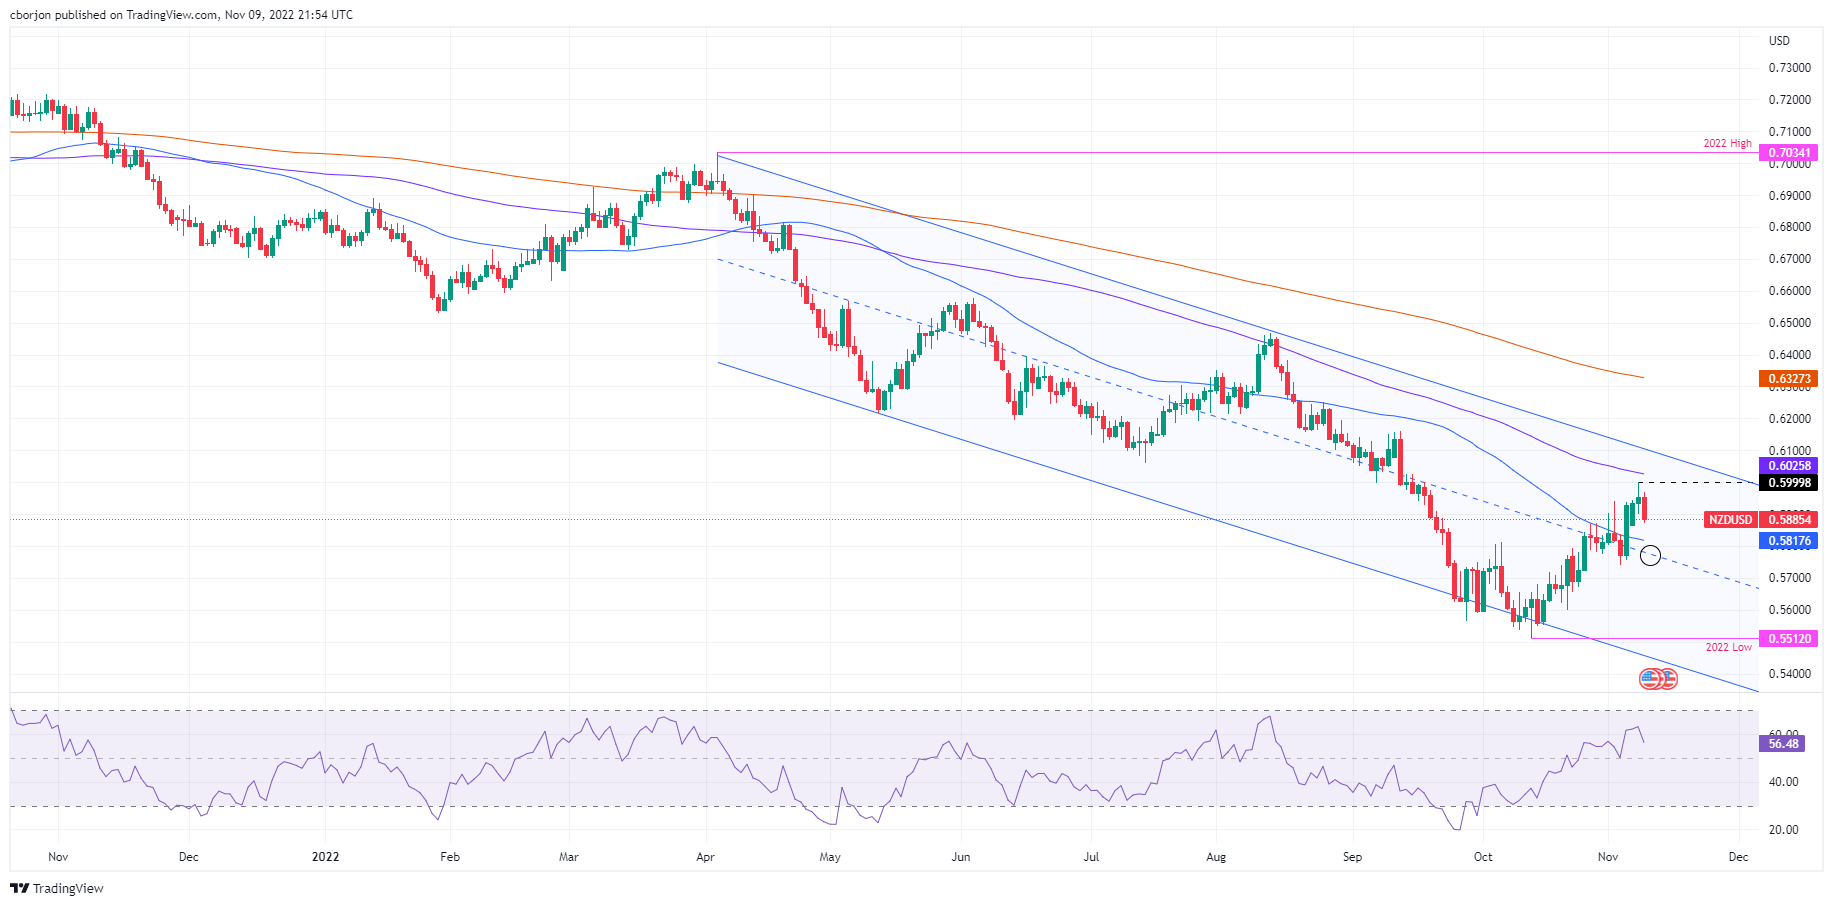
21:55
NZDUSD struggles at the 200-DMA and tumbles below 0.5900 on risk aversion amid US elections
- The NZD weakened against the American Dollar on risk aversion.
- The USD got bolstered by the United States midterm elections split between the Republicans and the Democrats.
- NZDUSD was unable to crack the 200-day EMA and tumbled below 0.5900, ahead of the October US inflation report.
The New Zealand Dollar retraces after the NZDUSD hit on Tuesday its weekly high at 0.5999 amid a session of broad American Dollar weakness, as speculators were assessing a possible sweep of the Republican Party in the United States midterm elections, but a close race and a possible split in the US Congress fretted investors. On Wednesday, the story is different, as risk aversion took over, and the safe-haven status of the US Dollar weighs against most G8 currencies, including the NZD. At the time of writing, the NZDUSD is trading at 0.5880, down by more than 1%.
The United States midterm elections results suggest a split US Congress
US equities finished in the red as most Wall Street analysts were speculating that Republicans would sweep both the US House and the Senate, which was perceived as risk appetite positive. However, data confirms that Congress would be split. Regarding the US House, reports said that the Republicans gained 206 seats vs. 177 of the Democrats, while the US Senate is at 48 for each party. Nevada, Arizona, and Georgia are pending to finish the vote count. Still, at the time of typing, two out of those three states are leaning toward the Democrats, suggesting they would have the majority in the Senate.
All that said, the New Zealand Dollar, which is perceived as a high-beta currency, weakened against the greenback as the market mood shifted sour, bolstering flows toward safe-haven assets ahead of the US inflation report. Therefore, the USD benefitted, as shown by the US Dollar Index, which tracks a measure of the American Dollar value against a basket of six currencies, which rose by 0.73% at 110.426.
Traders’ focus shifts to US Consumer Price Index (CPI) for October
Aside from this, the Bureau of Labor Statistics (BLS) will reveal the October Consumer Price Index (CPI), with expectations for headline CPI at 8% YoY, while core CPI, which excludes volatile items like food and energy, is estimated to jump by 6.5% YoY, below the previous month’s reading. If the CPI cools down, it should be expected that the NZD could resume its recovery and reclaim the 0.5900 figure. Otherwise, the NZDUSD would be downward pressured and could extend its losses beneath the 0.5800 mark.
Fed’s Barkin compromised to tame inflation, even though it could slow down the US economy
Aside from this, a light US economic docket left NZDUSD traders adrift to Fed speaking, led by the Richmond Fed President Thomas Barkin. He said that the Federal Reserve’s willingness to fight inflation would lead to an economic downturn, though he added that the United States is not currently in a recession. He added that the country is at the back end of inflation and that it will begin to decline.
NZDUSD Price Analysis: Technical outlook
From a daily chart perspective, the NZDUSD remains in a downtrend. Since the beginning of April 2022, price action has been trading within a descending channel, unable to crack the top of it. On Tuesday, the NZDUSD edged toward the 100-day Exponential Moving Average (EMA) at 0.6029 but was short, reaching a fresh two-month high at 0.5999, exposing the NZD to further selling pressure. That said, the NZDUSD tumbled below the 0.5900 figure, and the path of least resistance is to continue to trend lower.
That said, the NZDUSD key support levels lie at the 50-day EMA at 0.5817, ahead of the 0.5800 figure. Once cleared, the next support would be the mid-line of the eight-month-old descending channel at 0.5770.
-
20:48
GBPUSD Price Analysis: Bulls are lurking at key support, eyes on a correction
- GBPUSD bulls could be about to move in to pick low-hanging fruit.
- The sell-off has been sharp but the M-formation is a reversion pattern.
GBPUSD was offered as the US dollar and yields rallied due to the US treasury notes selling today at 4.140% compared to 4.106% in the moments before the auction in the WI market. Since the sale, gains have been wiped clean and Cable remains under pressure. The results so far for the US midterm elections showed little evidence of a "red wave", leaving investors to focus on upcoming inflation data. Technically, there could be a reversion in order, however, as the market calm ahead of the event as the following will illustrate:
GBPUSD H1 chart
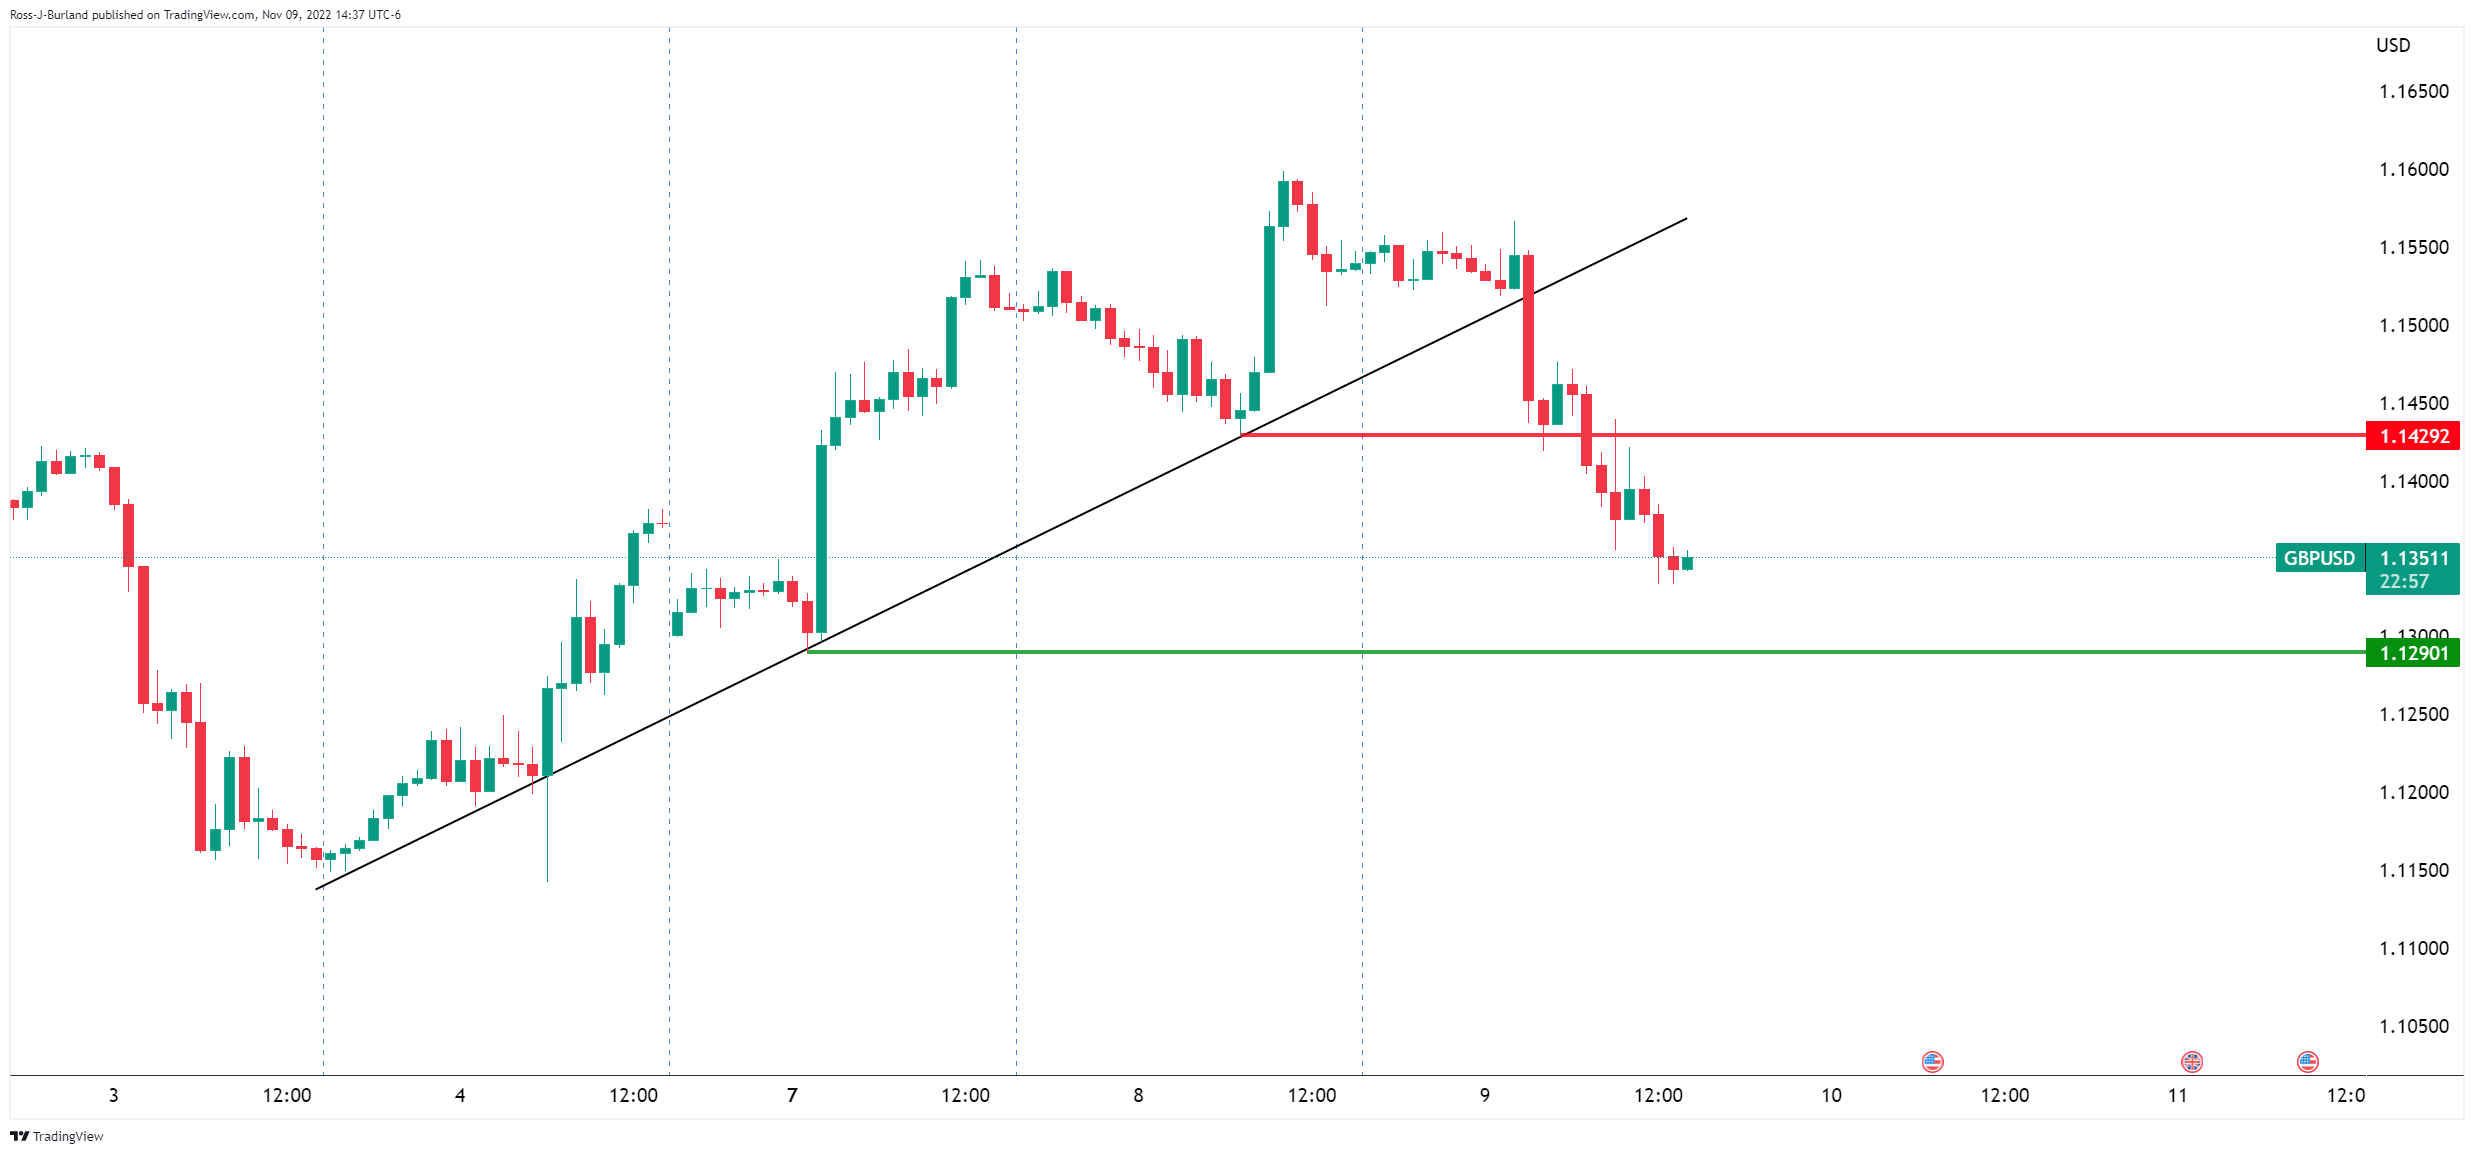
The bears have moved in and eye a break of the 1.1290 support line, Monday's lows. A correction in the meanwhile, however, could be in order.
GBPUSD H4 chart
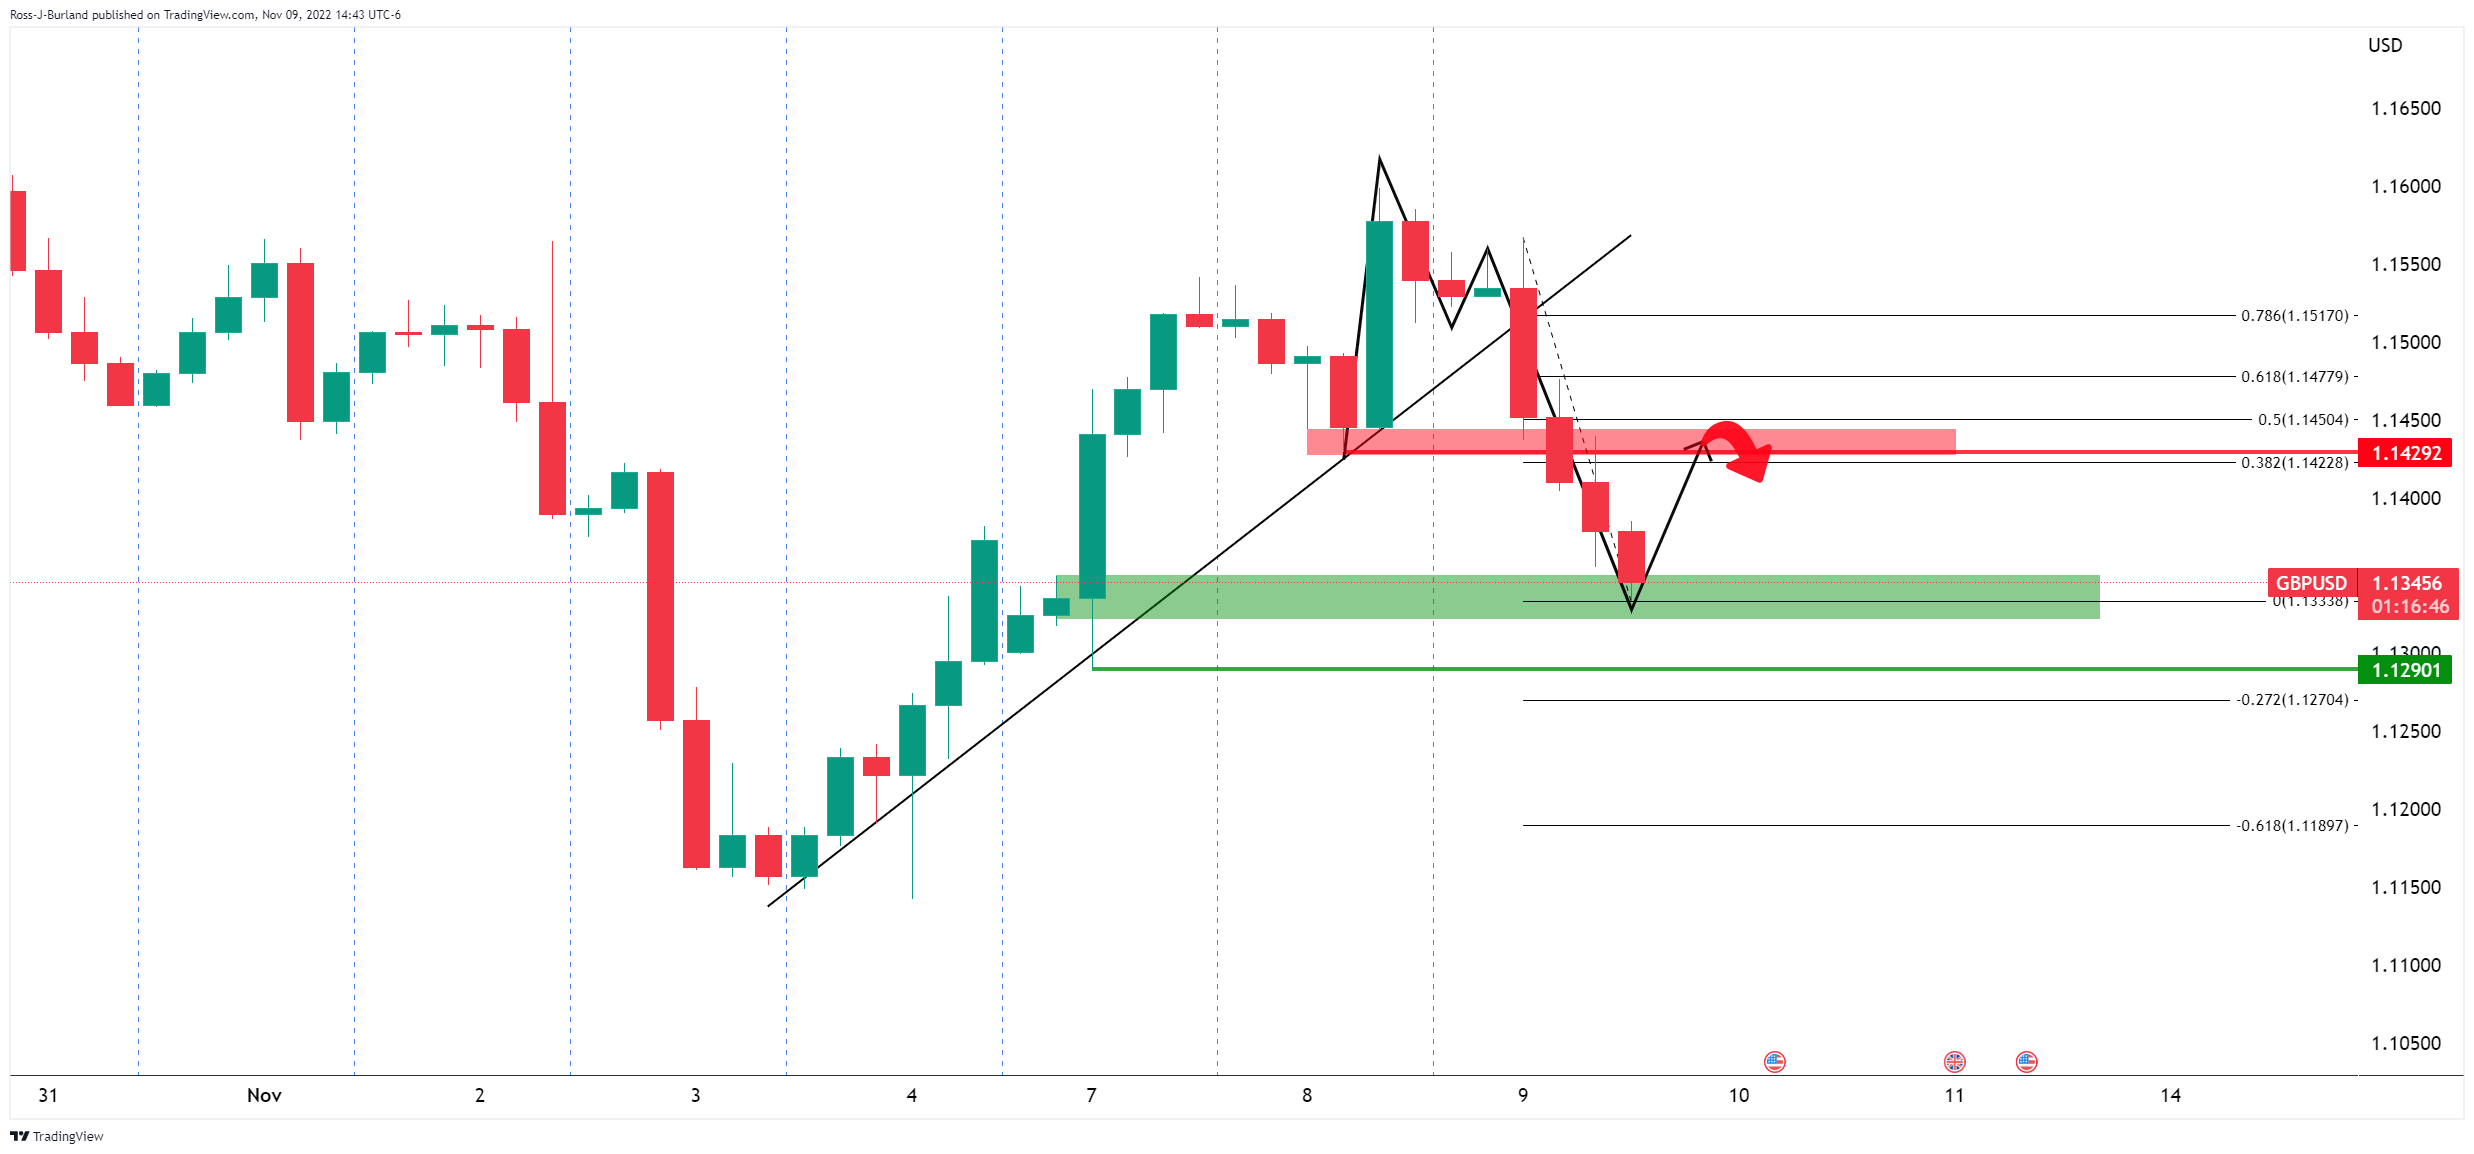
The M-formation is a reversion pattern and the price would be expected to retrace at least to the 38.2% Fibonacci of the bearish impulse.
-
20:06
AUDUSD dives further and approaches 0.6400 in a cautious market mood
- The Aussie extends its reversal from 0.6550 to 06420 so far.
- A more cautious market mood has favored the safe-haven USD.
- AUDUSD: Support at 0.6210 is key to defend the recent up move – SocGen.
The Aussie has gone through a significant pullback on Wednesday, with the pair extending its reversal from 0.6550 high on Tuesday to 0.6420 so far as investors’ appetite for risk waned.
Cautious markets awaiting the results of the US elections
The market mood soured on Wednesday, with the world stock indexes trading lower while the US Dollar and Treasury bonds picked up as the market awaits the results of the US mid-term elections. In this context, the risk-sensitive Australian Dollar has lost about 1.4% on the day after having rallied beyond 3% over the previous three days.
In the US, with votes still being counted, the Democrats have achieved better-than-expected results, although the race to control the Congress is tight, which leaves President Biden’s economic agenda in the air.
In the macroeconomic front, with a thin calendar today, the focus is on the release of US CPI figures due on Thursday. With the market hyper-sensitive to Fed monetary policy expectations, any surprise in the US inflation figures might trigger a significant increase in Dollar volatility.
Earlier today Richmond Fed President Barkin affirmed that the inflation fight ‘may lead to a downturn” as, he says, rate increases are challenged by artificial elements such as “high consumer savings, lack of labor supply." These comments have eased bullish pressure on the USD.
AUDUSD: Defense of 0.6210 support is crucial – SocGen
From a technical perspective, FX analysts at Société Générale point out to the 0.6210 level to maintain the recent up move: “A bounce is not ruled out; the upper band of the channel near 0.6680/0.6720 and 0.6900 could be near-term resistances (…) In case the pair fails to hold recent higher trough at 0.6270, one more leg of downtrend could materialize towards 0.6100 and projections of 0.5980.”
Technical levels to watch
-
19:40
Gold Price Forecast: XAUUSD plummets on soft US Treasury auction
- Gold is now back in the hands of the bears as traders get set of US CPI.
- US yields and the Dollar rising may have set the high of the week in Gold.
Gold is under pressure following, dropping at the turn of the past hour after a spike to the day's highs, trapping breakout traders long when the US treasury notes sold today at 4.140% compared to 4.106% in the moments before the auction in the WI market. Since the sale, Us yields have surged, supporting the US dollar and weighing heavily on gold.
Gold is currently trading at $1,702.46, down some 0.46% after falling from a high on the day of $1,722.34 and is taking on the London of $1,703.16. Meanwhile, the Gold price has given something to both the bulls and the bears on the day as the following analysis will illustrate.
Looking ahead, all eyes will be on the US inflation data in Thursday's US Consumer Price Index. Investors will be looking for clues in the data to see if it can spur the Federal Reserve to continue to increase interest rates well into next year. The data could be a good litmus test to gauge whether investors are about to turn their backs on the greenback once and for all despite the Fed's Chair, Jerome Powell, recent pushback against the pivot sentiment.
Gold technical analysis
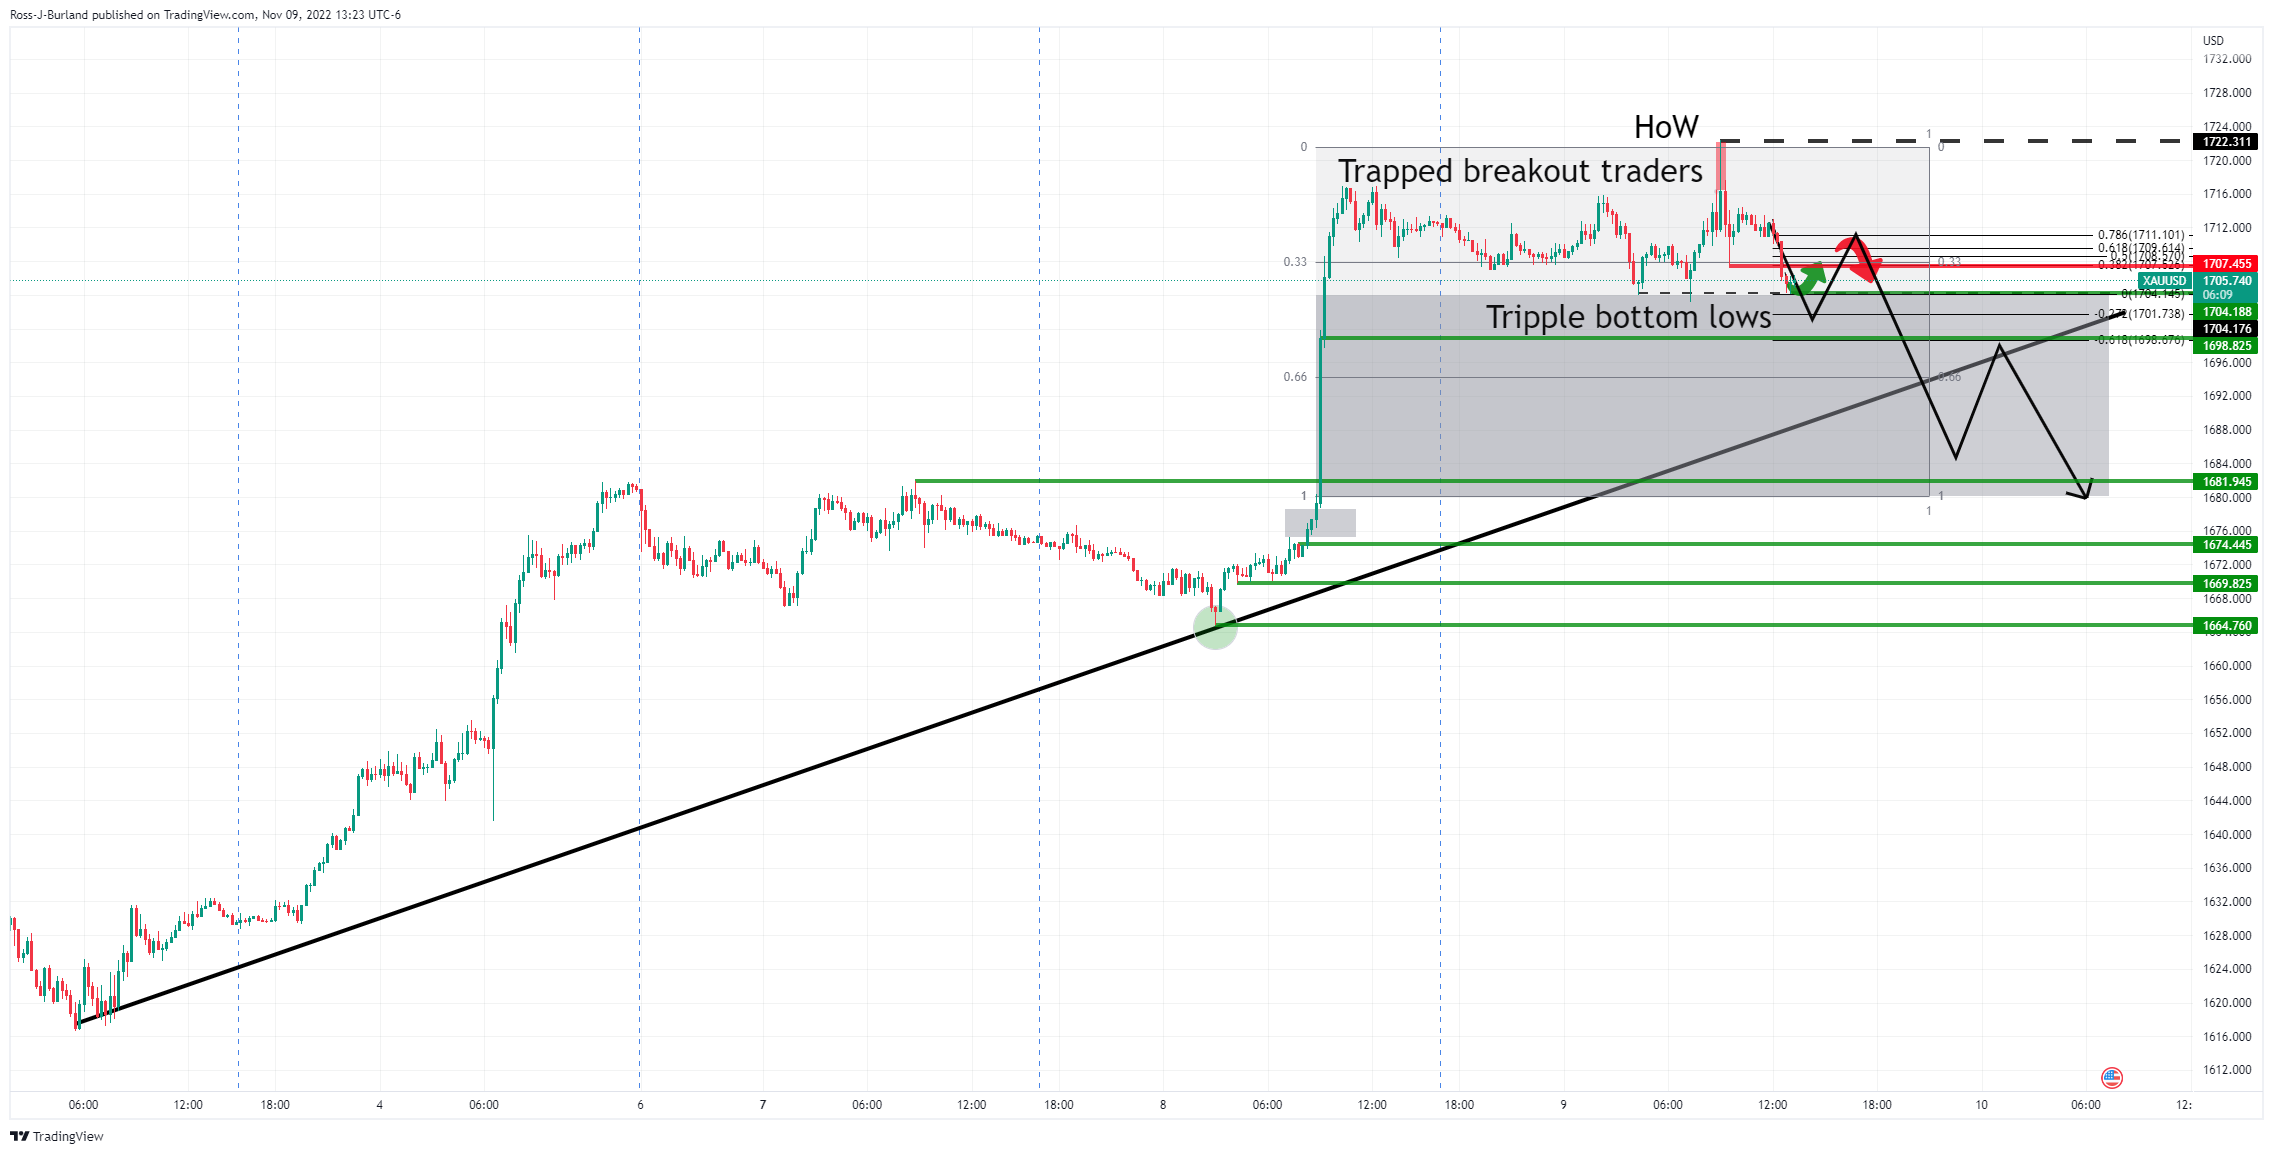
The price of gold remains on the front side of the bullish trendline. However, a low was put in by London and then in the opening of the New York session. The price subsequently rallied on the back of the double-bottom low and has potentially just locked in the high for the rest of the week which the following will show from a bearish perspective ahead of US CPI.
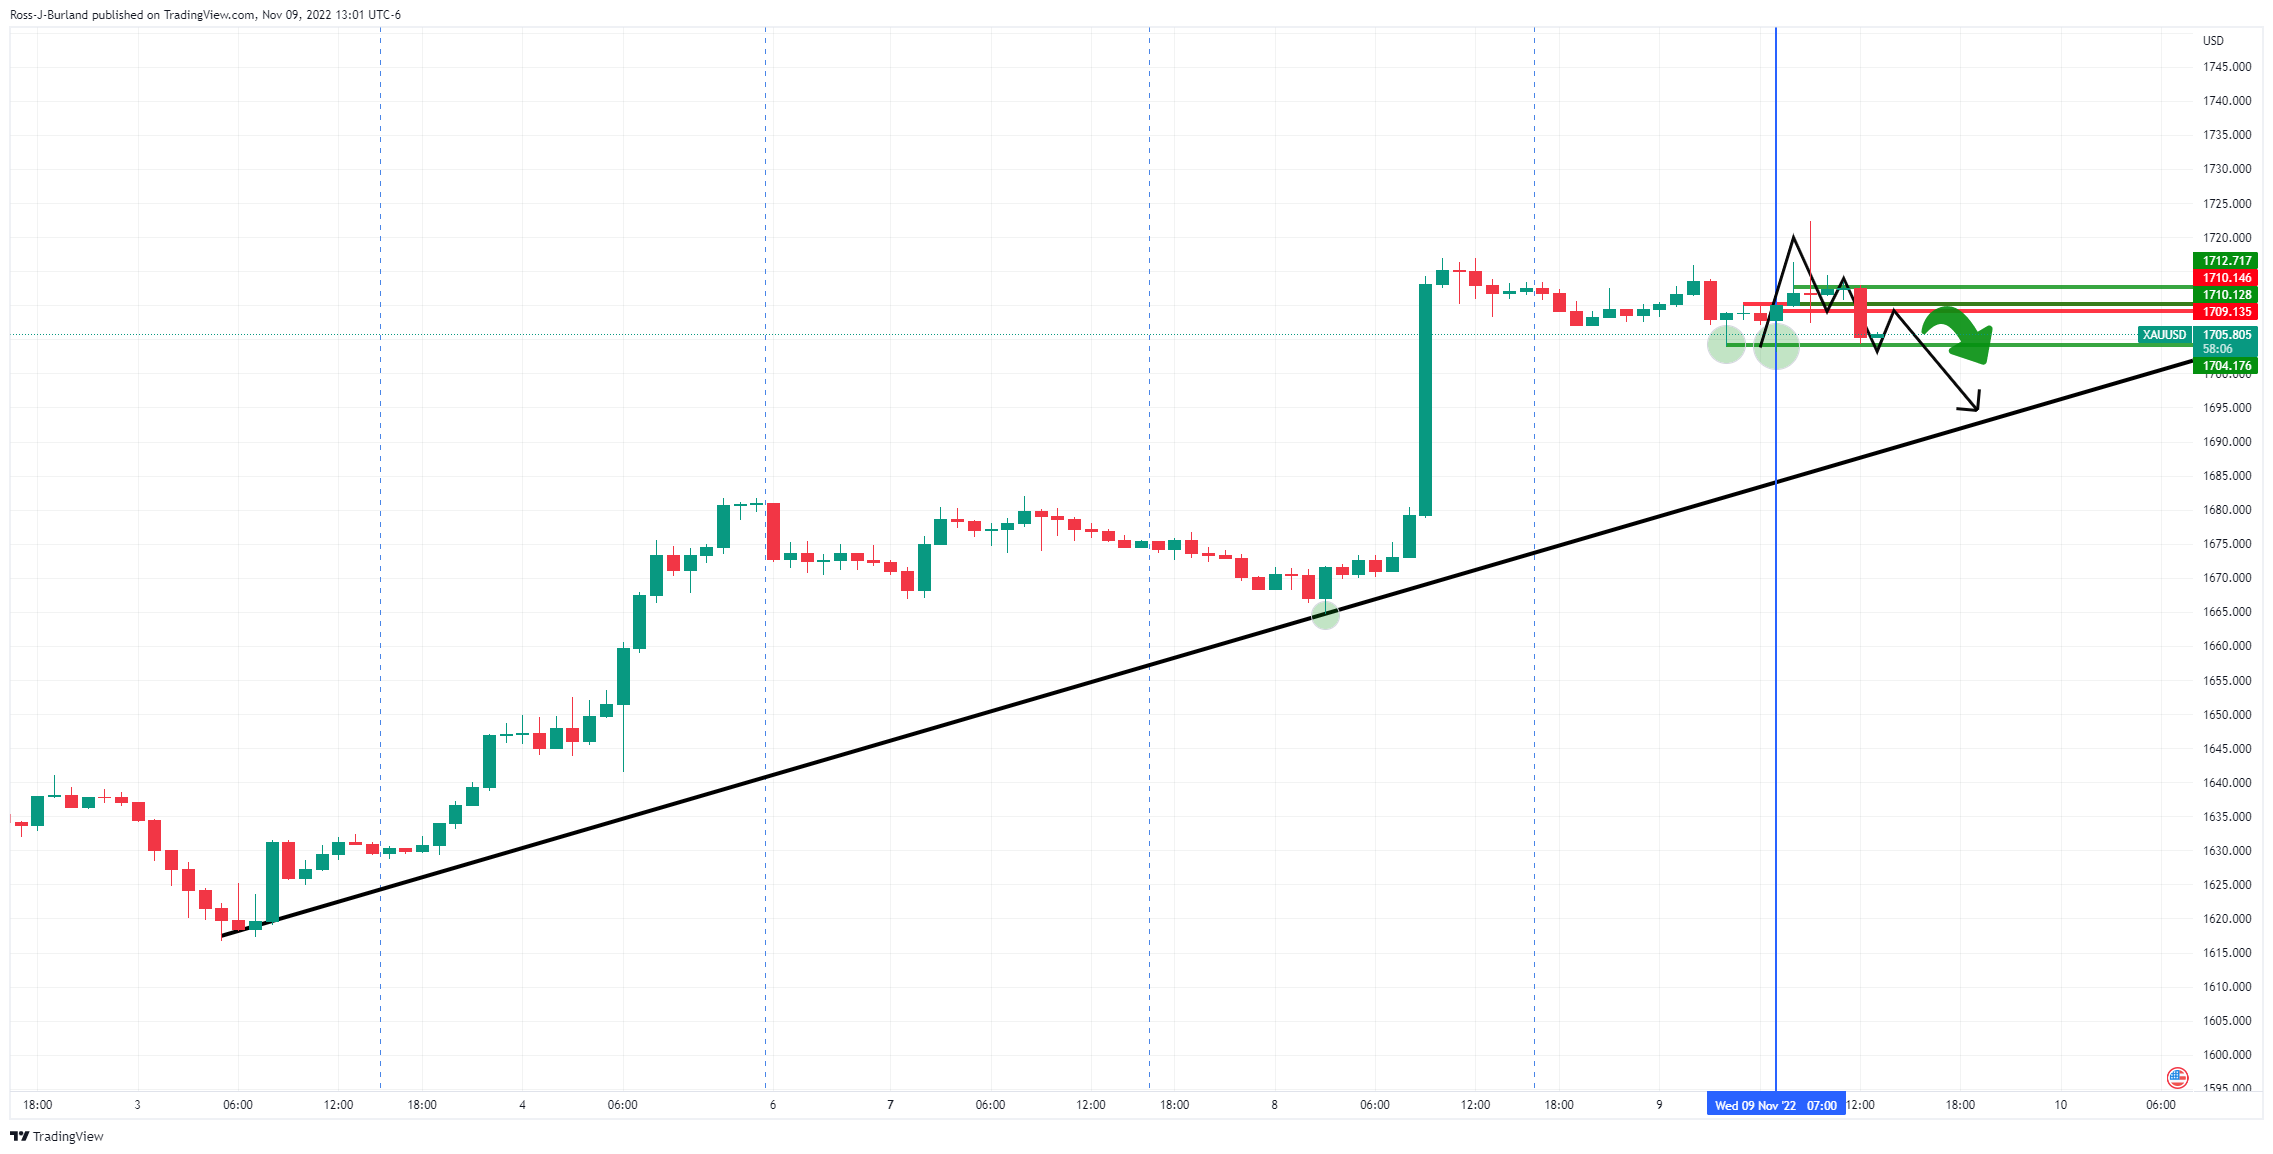
As we can see below, there is now an M-formation left on the chart which is a topping pattern. While the price could be expected to come in to retest the neckline, the bias is for a move to the bullish trendline for the sessions ahead:
Gold M1 chart
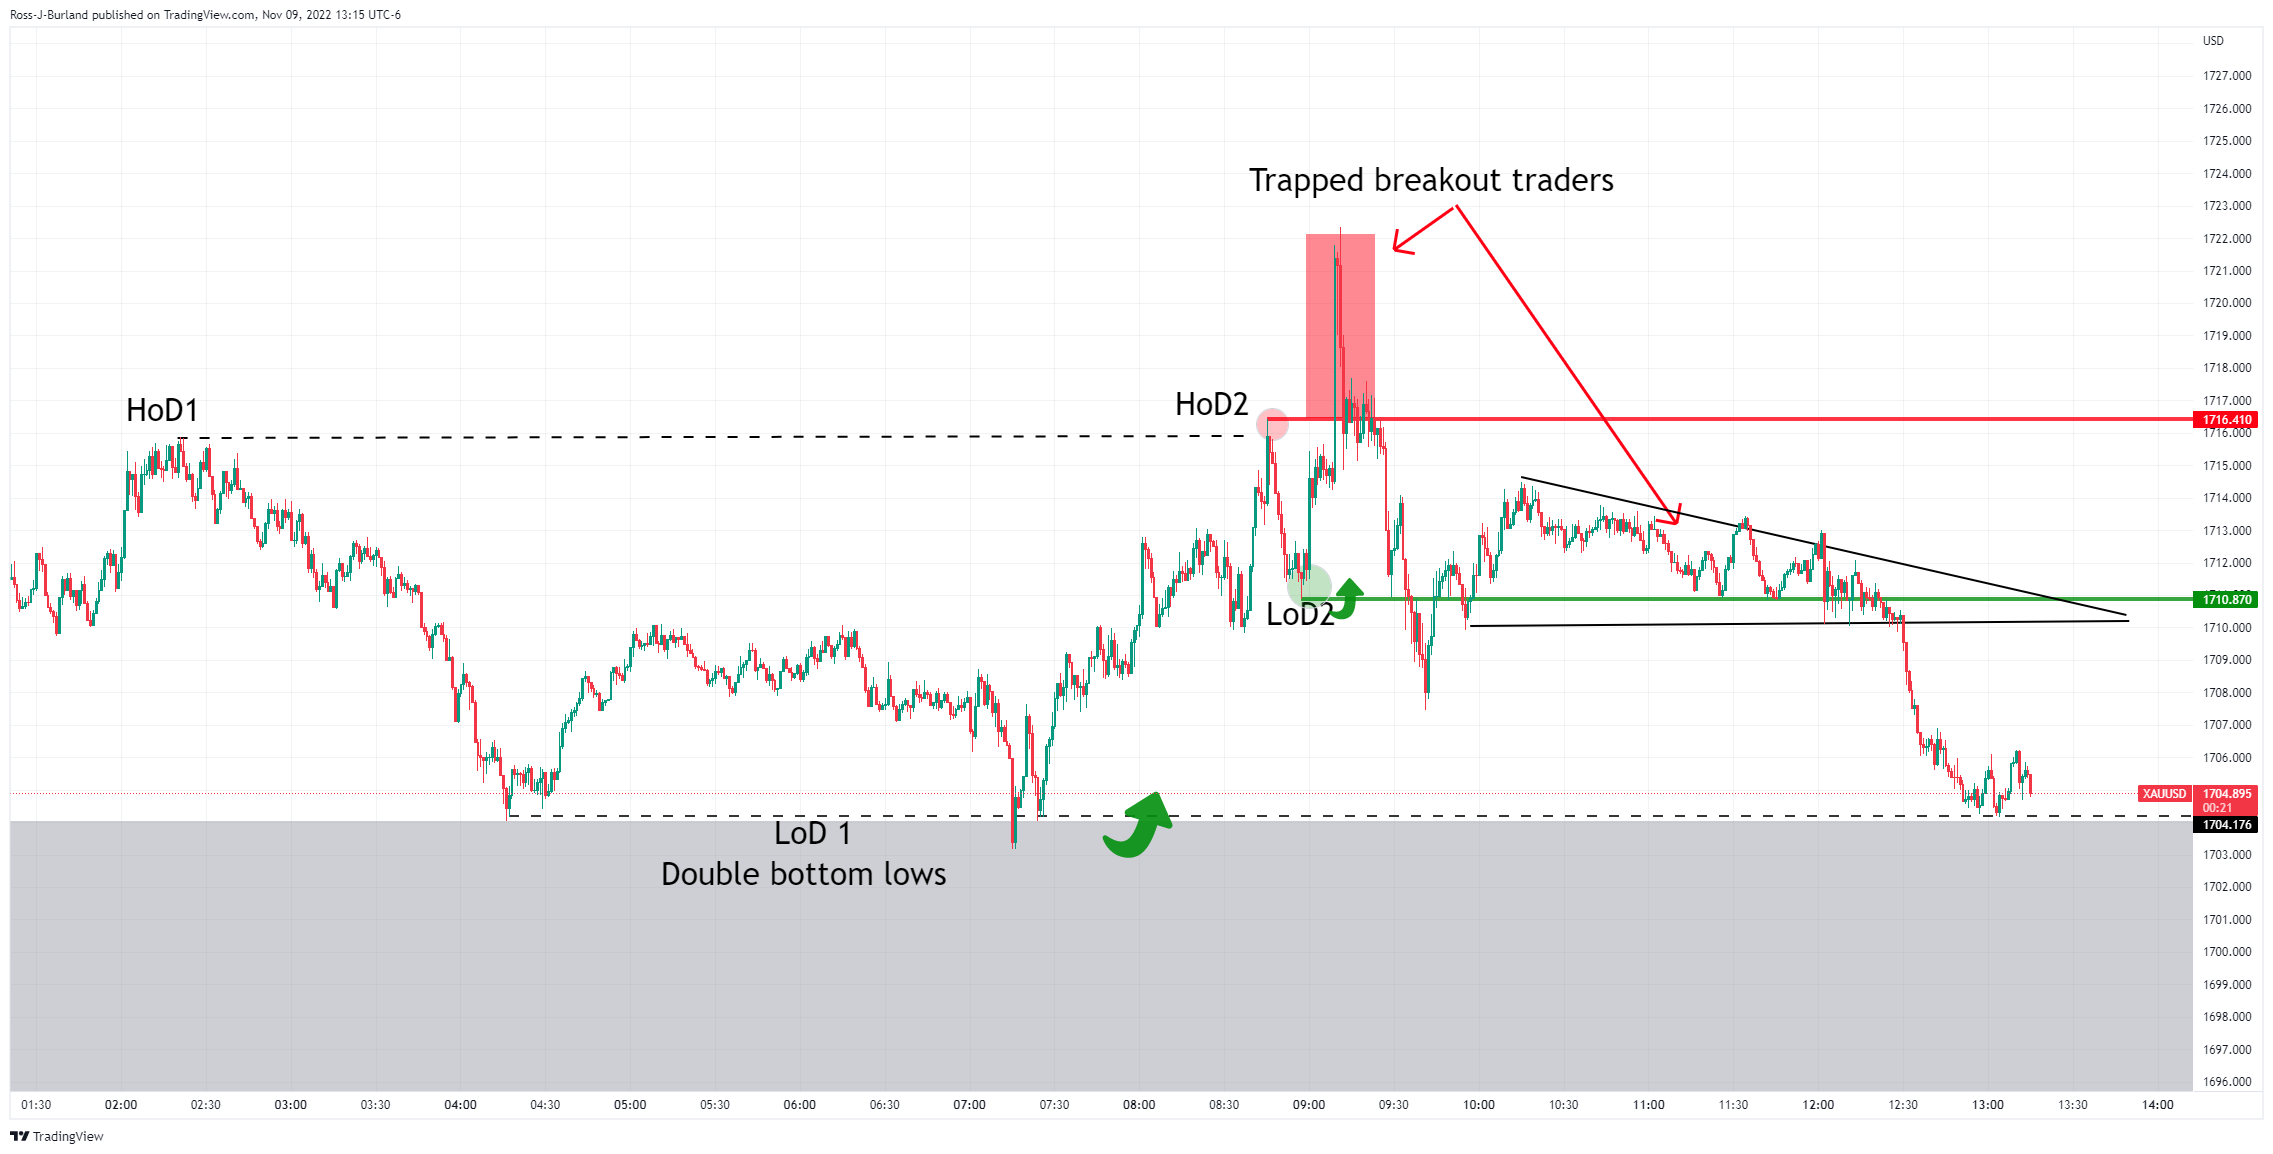
For some background on the price action that got is to hear and in order to help us arrive at the bearish scenario, the above chart illustrates the price flow since the London lows on the 1-minute chart. A fresh high was set at the start if New york day and a subsequent low was the bull's grounds for a buy into what could be the highs of the week. The strength of US yields and the US dollar have seen to that.
Gold bearish scenario
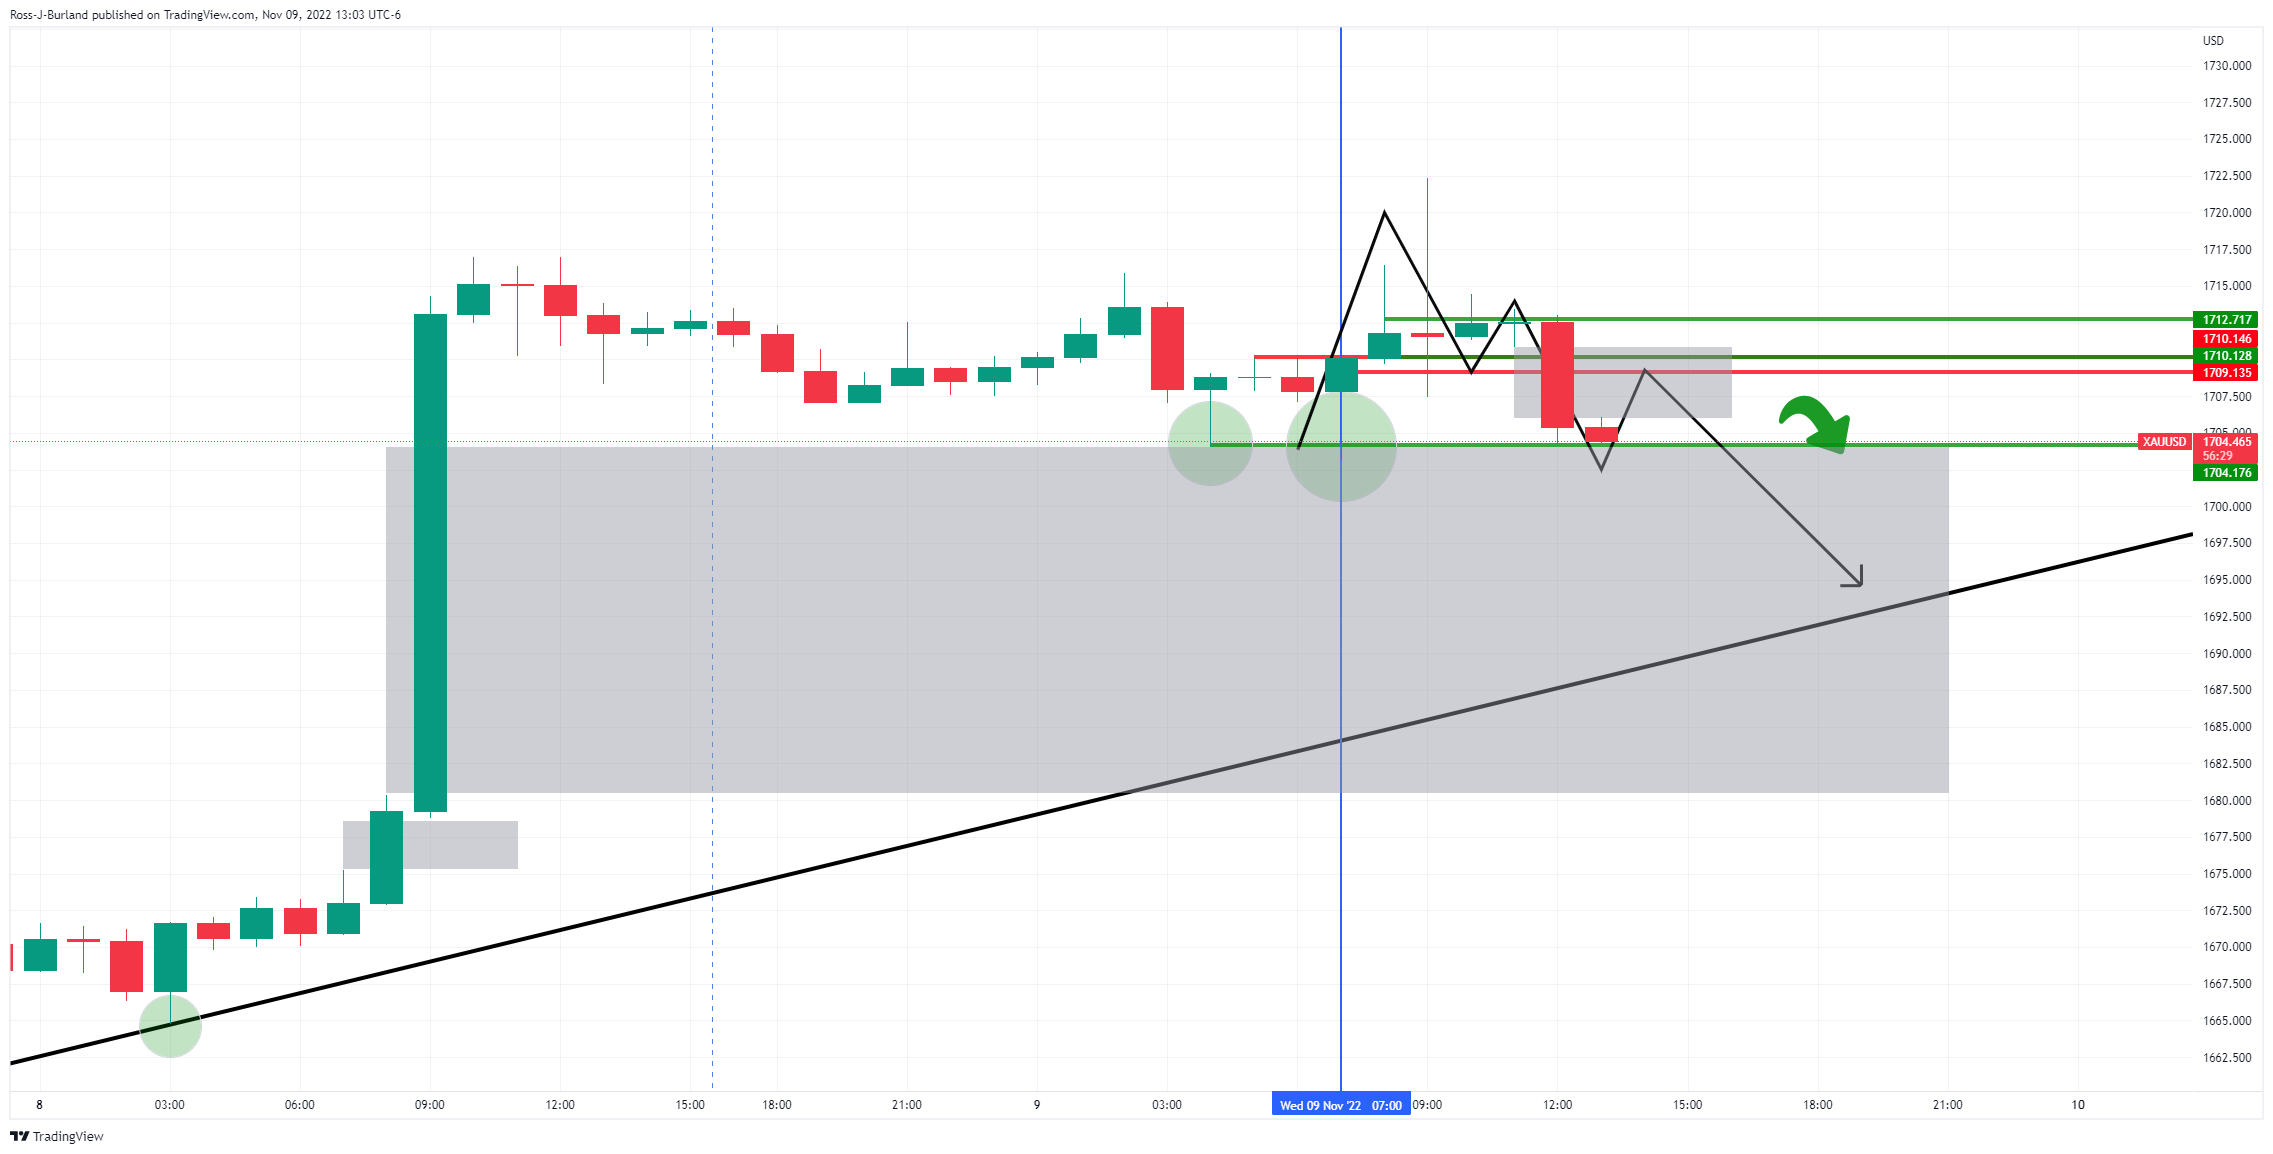
Zoomed in...
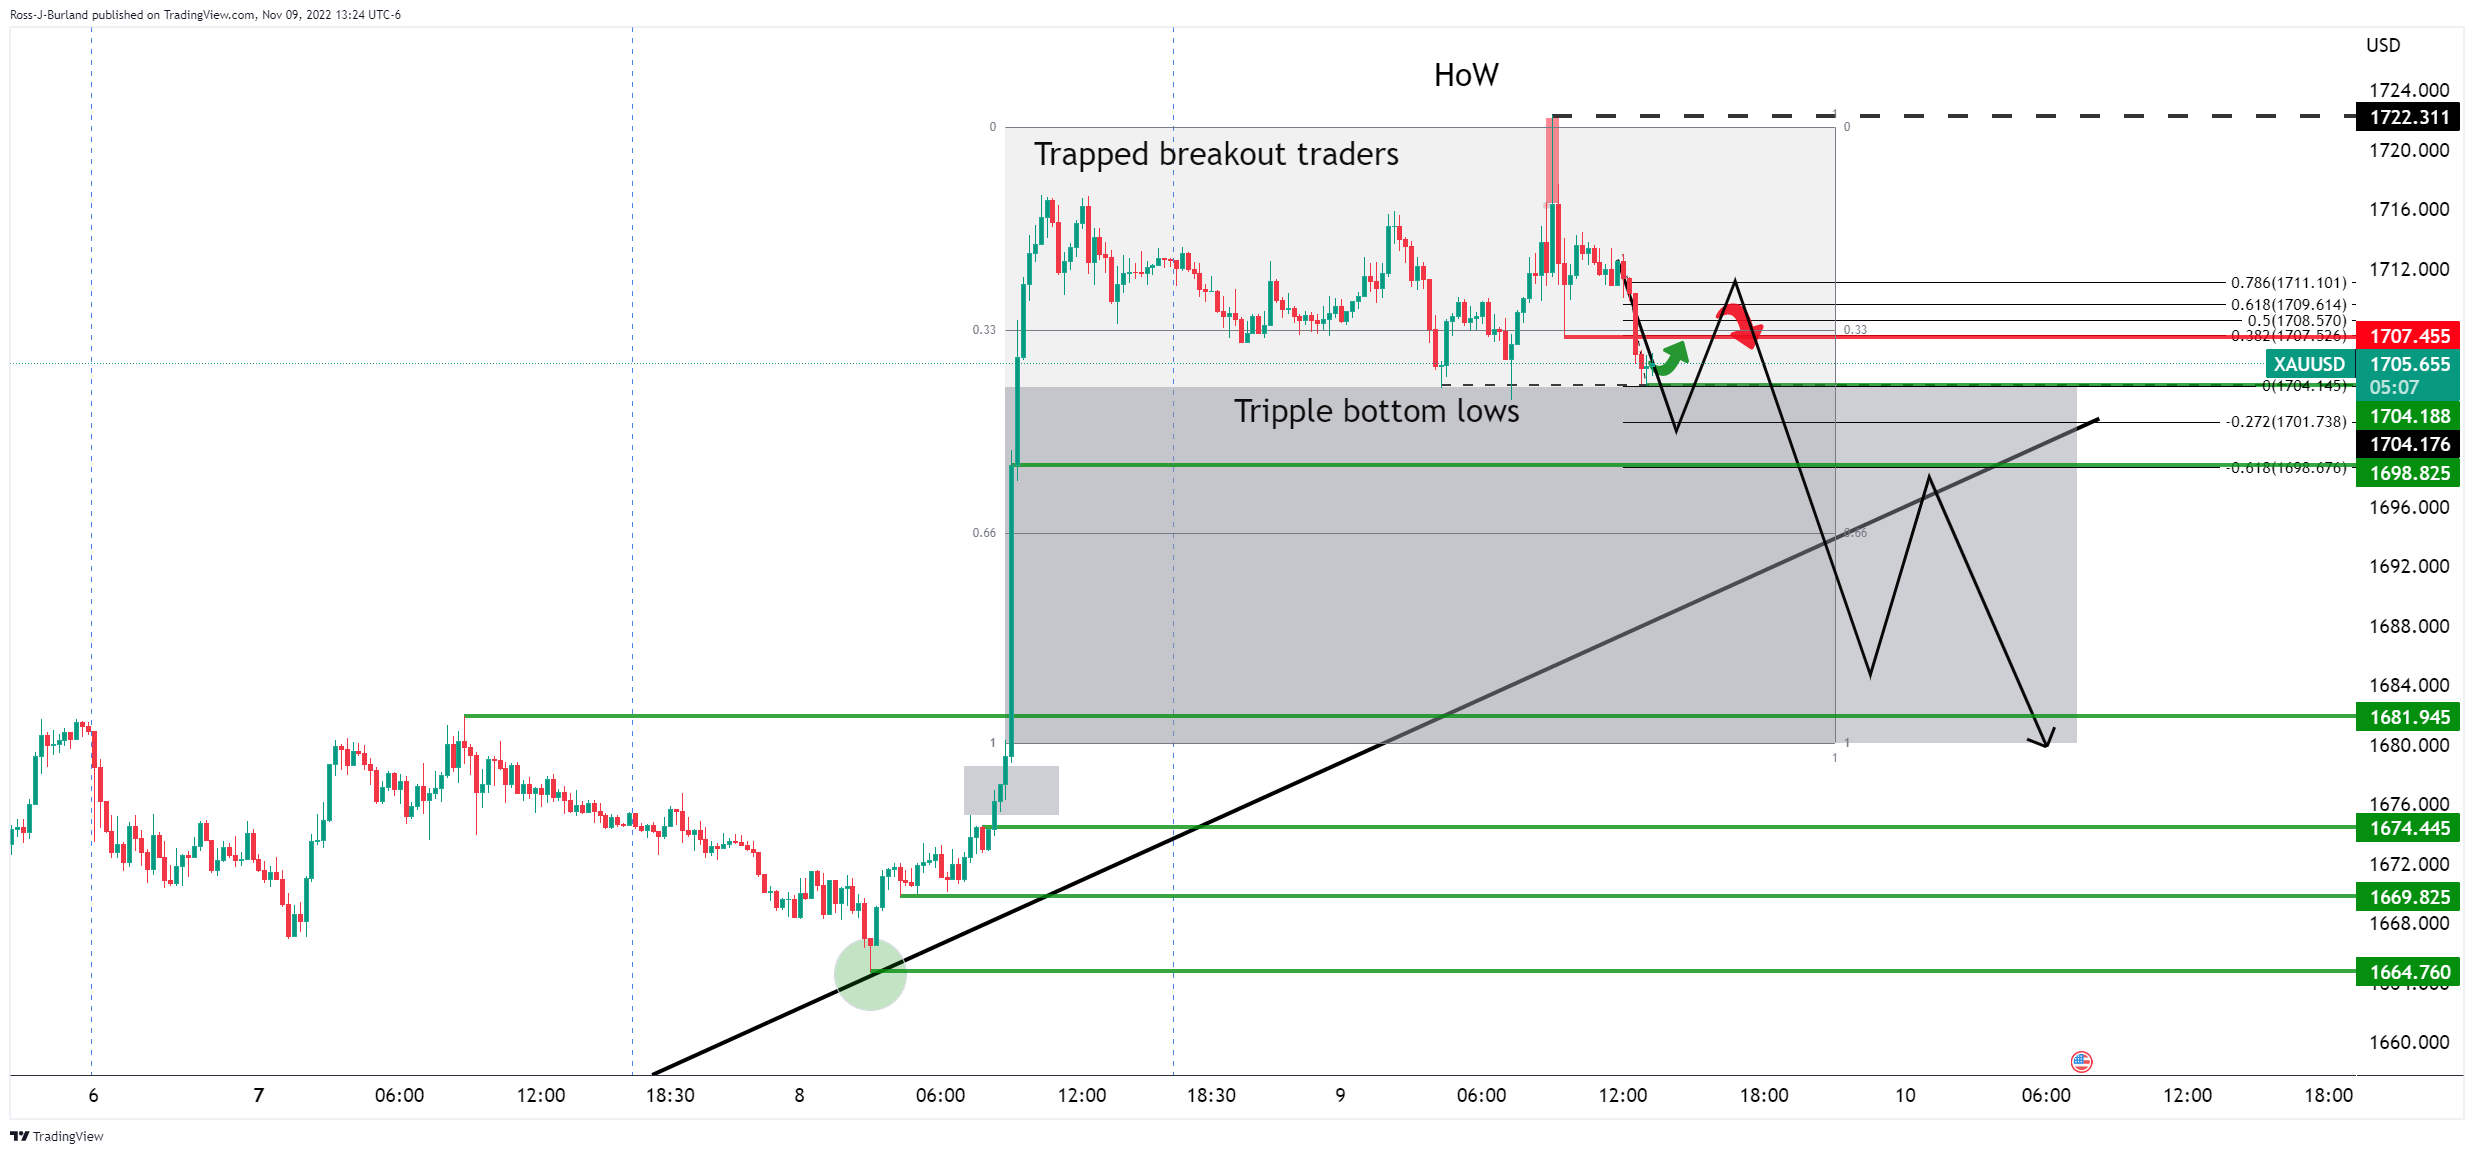
As illustrated, we could now have the high of the week locked in. There are traders trapped in long positions above and stops below. This is the ideal scenario for sellers. A move below the triple bottom lows of $1,703/04 opens the risk of a significant flush out of stale stop losses that have been trailing higher for the whole week and since last Friday's rally.
-
19:12
EURJPY Price analysis: Trapped within a tight range below 147.00
- The EURJPY is moving without a clear direction below 147.00.
- Markets remain calm awaiting the outcome of the US midterm elections.
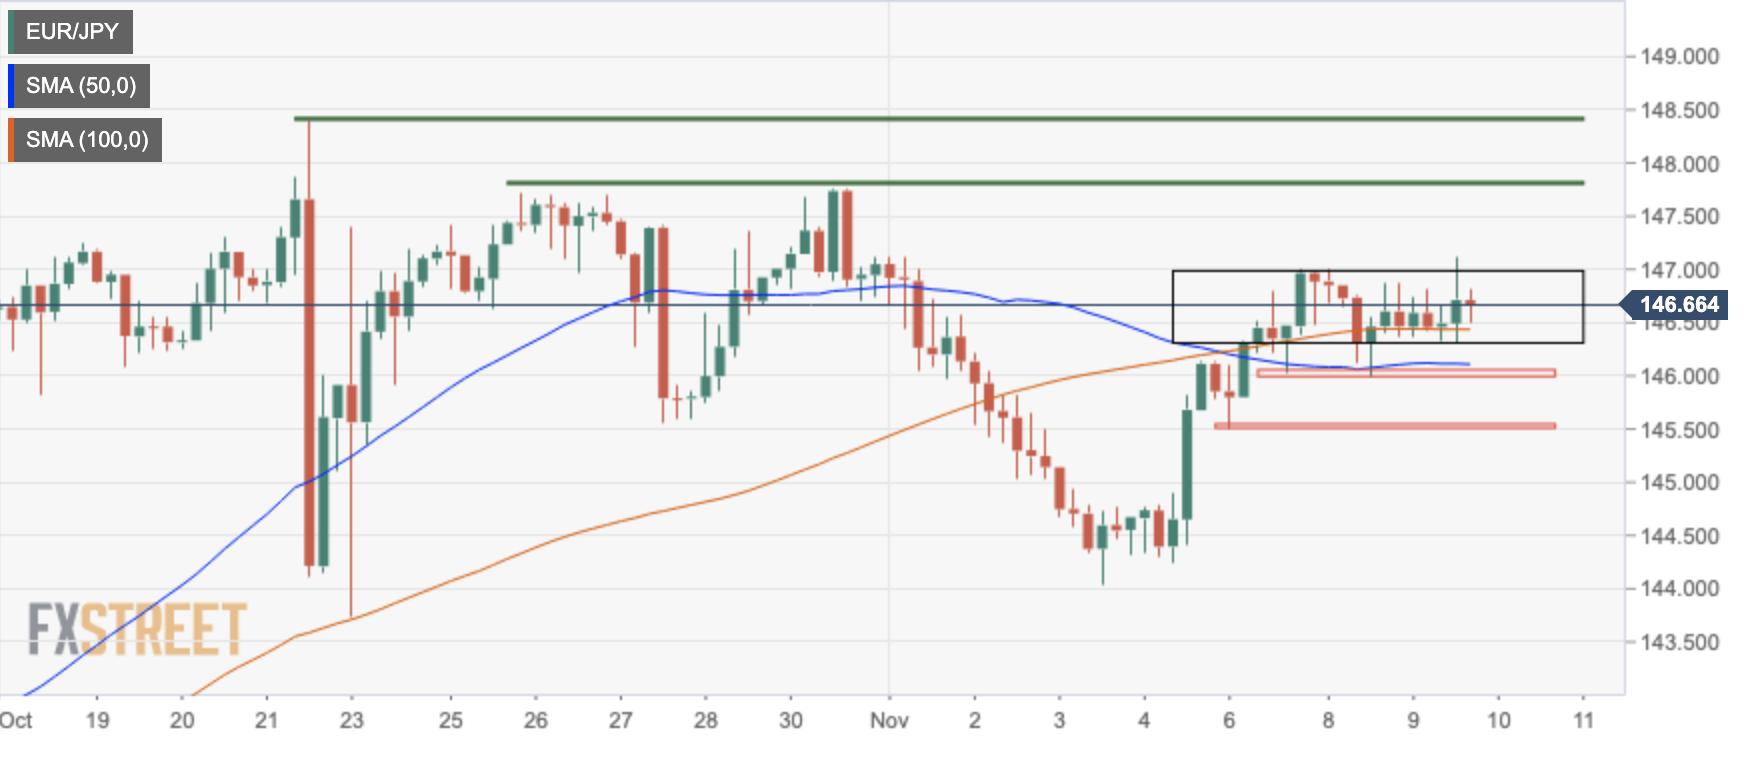
The Euro is trading practically flat against the Japanese Yen for the second consecutive day. Upside attempts remain capped below 147.00, while support at the 146.30 area is keeping bears at a bay.
The pair wavers with the market on a wait-and-see stance
The Euro has lost the bullish momentum observed at the end of last week and the beginning of this one. The pair’s recovery from the 144.00 area traded water at 147.00 as the investors turned more cautious on the back of the uncertainty about the US midterm elections and ahead of the US CPI figures.
Euro bulls should extend past the 147.00/10 level to regain positive traction and extend gains towards 147.75 (October 26 and 31 highs) ahead of the long-term high at 148.40.
On the downside, a successful breach of the 100-period SMA might increase negative pressure to target the 146.00 area where the 50-period SMA meets November 8 lows. Below here, the next target would be November 6 low at 145.50.
EURJPY 4-hour chart
Technical levels to watch
-
18:41
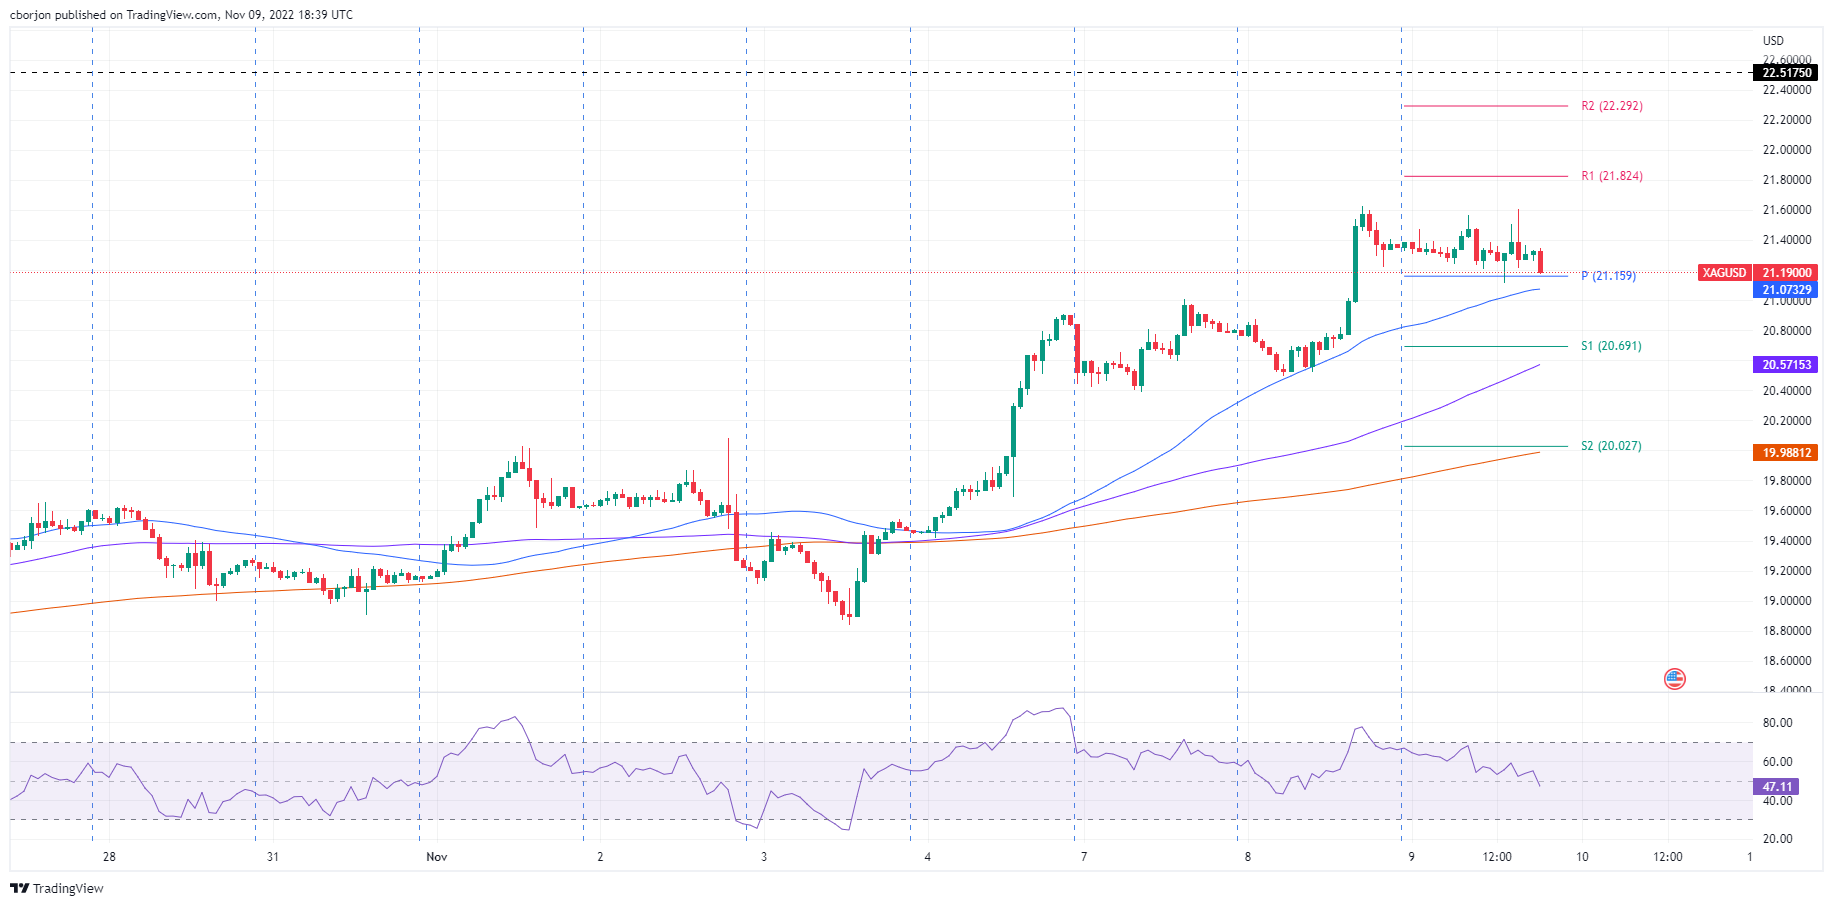
Silver Price Analysis: XAGUSD struggles around the 200-DMA and tumbles toward the $21.10s area
- Silver struggles to break the 200-day EMA at $21.48 after hitting a daily high of $21.61.
- Silver Price Analysis: A doji in the daily chart suggests Silver is consolidating.
Silver price remains unable to clear the 200-day Exponential Moving Average (EMA) at $21.48 decisively, retreats after hitting a daily high of $21.61, trading below its opening price by 0.15%. At the time of writing, the XAGUSD is trading at $21.19 a troy ounce.
Silver (XAGUSD) Price Analysis: Technical outlook
The Silver rally stalled at around the 200-day EMA at $21.48, in the last couple of days, with Wednesday’s price action set to form a doji, meaning that buyers could be refraining from testing higher prices, with the US Consumer Price Index (CPI) report for October, right around the corner. It should be noted that if XAGUSD tumbles below $21.00, a fall toward this week’s low at $20.38 is on the cards,
Short term, the XAGUSD appears to be forming a top at around $21.40-60. The Relative Strength Index (RSI), at bearish territory with a downslope, suggests some selling pressure piling, but a break below the confluence of Wednesday’s low and the daily pivot point at $21.16 would exacerbate a test of the psychological $21.00.
XAGUSD key resistance levels lie at $21.60, followed by the R1 daily pivot at $21.82 and the $22.00 mark.
Silver (XAGUSD) Key Technical Levels
-
18:30
USDJPY’s recovery finds resistance at 146.55; eases to 146.00
- The Dollar's rebound from 145.15 remains limited below 146.00.
- The market has turned cautious ahead of the results of US elections and CPI data.
- USDJPY is risking further decline to 142.00 – SocGen.
The US Dollar’s recovery from two-week lows at the 145.15 area lost momentum at 146.55 earlier on Wednesday, before pulling back to levels right above 146.00. The pair remains moderately bid on daily charts, trimming losses after a 1.85% decline over the previous three days.
Cautious markets on the back of US elections’ uncertainty
Investors have turned cautious on Wednesday, which has favored the safe-haven US Dollar amid the uncertainty about the results of the US mid-term elections. The Republican “red wave” has not been seen, and both parties are in a tight race to decide the control of Congress and the fate of Joe Biden’s agenda for 2023.
In the absence of key macroeconomic events, the highlights of the week will be the release of US consumer inflation data. These figures might offer some insight into the Federal Reserve’s next monetary policy decision which could generate significant Dollar volatility.
Earlier today, Richmond Fed President, Richard Barkin, warned that the inflation fight “might lead to a downturn” as the central bank’s rate hikes are challenged by artificial elements such as “high consumer savings and lack of labor supply”. These comments might have put a lid on USD bulls.
USD/JPY: Risk of a pullback to 142 – SocGen
FX analysts at Société Générale warn about the risk of a pullback to 142 or lower: “Projections near 142 and the lower band of the daily channel at 140.30/139.40 are important support levels near term. Defending this channel could highlight continuation in uptrend (...) Once the pair reclaims the peak of 152, one more leg of up move is not ruled out. In this scenario, 153.50 and 1990 levels near 160 could be the next potential resistances.”
Technical levels to watch
-
18:07
EUR/USD is back testing the lows of the day towards parity, US CPI will be crucial
- EURUSD bears step on the gas into strength and eye parity.
- Traders getting set for a very crucial US CPI report.
EURUSD has dropped on the day by over 0.4% in a volatile session in New York that has seen good two-way business in the forex market. The US dollar advanced on Wednesday, as results so far for the midterm elections showed little evidence of a "red wave" resounding Republican victory. However, it was a wild ride between NY session lows and highs of 109.727 and 110.373 which pushed and pulled the Euro.
In US politics, a stronger showing by Republicans was expected to have fanned the flames of speculation around prospects of less fiscal support and potentially a lower peak in the Fed's terminal rate. This initially drove an offer into the greenback and subsequently supported the Euro on Friday and at the start of the week within its trading range of 0.97-1.01 for the month so far. However, the prospect of a divided US Congress and the expected Republican Red sweep seems not to have materialized. Consequently, Wall Street opened offered and remains in the red in the latter part of the session, bearish for the Euro.
Analysts at Rabobank argued that there is more downside to come for the single currency. ''In our view, fundamentals are still biased towards further downside pressure for the currency pair in the coming months, meaning we would view rallies as an opportunity to sell,'' they said.
''In particular, we don’t see the EUR as being priced for the impact of winter 2023 and what a prolonged period of expensive energy may mean for the German business model, Europe’s trade and current account balances and the value of the EUR. We have revised lower our forecast for EUR/USD on a 12 mth view to 0.95 from 1.05. We expect EUR/USD to trade choppily around this level in the months ahead.''
As for positioning, the latest CFTC speculators’ positioning data have shown a sharp ramping up in the levels of net EUR longs over the past two weeks, to the highest levels since June last year. This leaves room for a correction should the US Dollar manage to catch a bid again that has retreated from multi-decade highs in recent weeks as investors take profits following a months-long rally.
US CPI will be key for USD
There has been growing speculation grows that the Fed may be inching closer to pulling the curtain on its dollar-supporting interest rate hikes and such a pivot would be highly supportive of equities and all things high beta, such as the Euro and the commodity complex. In this regard, investors are waiting to see whether Thursday's US Consumer Price Index data will spur the Federal Reserve to continue to increase interest rates well into next year. After all, the Fed Chair, Jerome Powell, pushed back against the recent pivot sentiment and market rally at the last presser when he said the terminal rate could be higher. In any case, Thursday's inflation report could be a good litmus test to gauge whether investors are about to turn their backs on the greenback once and for all.
EURUSD eyed at 0.9500 end of year
In their outlook for the Euro, analysts at Noredea said, ''EURUSD will likely continue to have a bumpy ride but we still hold our view for a lower EURUSD towards the end of this year (around 0.95).''
''What we are seeing now is that investors are becoming more divided when interpreting economic data and implications for monetary policy. Confirmation bias surrounding the incoming data makes some certain of a Fed pivot even if the data shows otherwise.''
''Several central banks slowing the pace of hikes has led to a belief that rate cuts are not far away either. Some are emphasizing the risks of overtightening, however, the Fed sees a risk of not tightening enough or pausing too early to bring inflation under control.''
-
18:03
United States 10-Year Note Auction increased to 4.14% from previous 3.93%
-
17:43
NZDUSD is limited below 0.5900 in a risk-off trading session
- The New Zealand Dollar remains capped below 0.5900.
- Investors are cautious ahead of the results of the US elections.
- NZDUSD's broader negative outlook remains intact – Credit Suisse.
The New Zealand Dollar remains unable to return above 0.5900 during Wednesday’s US trading session, after having depreciated more than 1% on the day as market sentiment tanked.
Investors, cautious awaiting the outcome of the US elections
In the absence of relevant macroeconomic data, the focus is on the outcome of the US elections, with the investors reluctant to place any significant bet. The latest news has shown better-than-expected results for the democrats, although both parties are still in a tight race to control Congress.
Beyond that, the release of October’s US CPI data, due on Thursday is expected to provide further insight into the Federal Reserve’s next monetary policy decisions, and therefore, it might trigger significant US Dollar volatility.
NZD/USD: Broader negative outlook remains intact – Credit Suisse
In the long run, analysts at Credit Suisse maintain their bearish view on the pair, and point out to 0.5600 and below: “The recent recovery in our eyes still looks, for now at least, like a corrective countermove within the broader downtrend. Hence, our broader negative outlook stays intact, though with a move back below 0.5854 and then below 0.5600/5597 needed to turn the market on the path towards the YTD low 0.5510 and then the 2020 low at 0.5468.”
Technical levels to watch
-
17:24
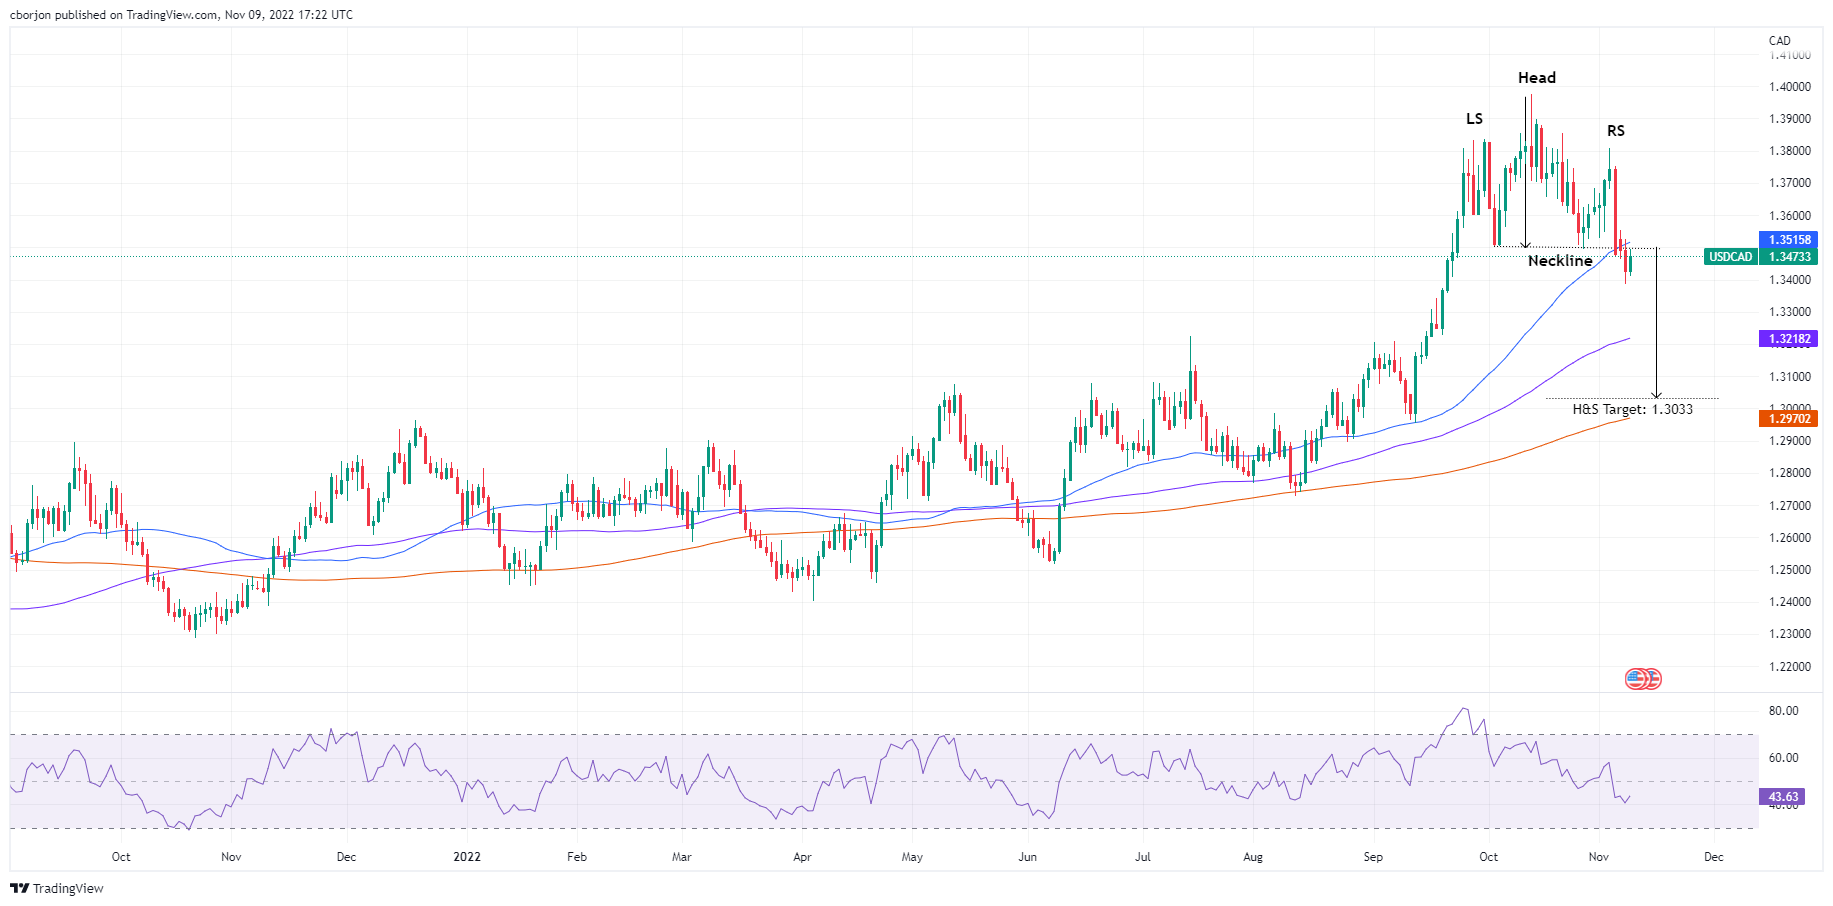
USDCAD climbs towards the head-and-shoulders neckline, though hovers around 1.3470
- USDCAD rose by 0.35% as buyers are eyeing to reclaim the 50-day EMA at 1.3515.
- Risk aversion kept CAD buyers from extending the USDCAD losses towards the head-and-shoulders chart pattern 1.3030 targets.
- Canadian and US jobs data suggests that the BoC and the Fed need some work to do.
The American Dollar is recovering some ground against the Loonie in the North American session after a head-and-shoulders chart pattern emerged in the daily chart, which targets a fall of USDCAD towards 1.3030. Factors like the US midterm elections showing that the Republicans and Democrats would split congress caused a risk-off impulse. US Treasury yields rose, and the greenback remains bid across the board. At the time of writing, the USDCAD is trading at 1.3470 after hitting a daily low of 1.3410.
USDCAD trims some of its three-day free fall from around 1.3700
Sentiment remains negative, as shown by US equities trading with losses. Data-wise, the US economic docket reported that wholesale stockpiles increased less than estimated in September. The US Commerce Department revealed that Wholesale Inventories rose by 0.6% MoM, below estimates and September’s reading of 0.8%. Additionally, uncertainty around the US midterm elections refrained traders from opening fresh bets on risk-perceived assets as flows toward safe-haven assets increased.
In the meantime, Fed officials crossed news wires led by the Richmond Fed President Thomas Barkin. Barkin said that the Fed’s willingness to fight inflation would lead to an economic downturn, though he added that the United States is not currently in a recession. He added that the country is at the back end of inflation and that it will begin to decline.
The lack of Canadian economic data leaves USDCAD traders leaning on the last week’s employment figures. Canada’s October Employment Change report smashed expectations of just 10K new jobs, adding more than 100K, suggesting that the Bank of Canada (BoC) still has work to do. On the US front, Nonfarm Payrolls exceeded estimates of 200K, printing 261K, but what caught investors’ eye was that the Unemployment Rate jumped from 3.5% in September to 3.7% in October. That said, speculations that the Fed could decelerate its pace of rate hikes.
Ahead in the week, the US docket will feature the Consumer Price Index (CPI) for October alongside Fed speakers. On the Canadian front, the Bank of Canada (BoC) Governor Tiff Macklem will cross newswires.
USDCAD Price Analysis: Technical outlook
The USDCAD daily chart suggests the head-and-shoulders chart pattern remains intact, even though the major hit a aily high of 1.3494 at the neckline. However, CAD buyers stepped in and dragged the USDCAD toward current exchange rates. For USD buyers to invalidate the pattern, they need to reclaim 1.3500 and clear the “right shoulder” at around 1.3808; otherwise, the resumption of the downtrend would likely send the USDCAD towards the head-and-shoulders target at 1.3030.
-
16:53
GBPUSD moves above 1.1400 with the US dollar losing ground
- The pound trims losses and returns above 1.1400.
- Investors, on a wait-and-see stance, awaiting for US elections and CPI results.
- Fed's Barkin warns that inflation fight may lead to a downturn.
The pound has bounced up from session lows at the mid-range of the 113.00s on Wednesday’s US trading session, returning above 114.00 amid a broad-based US dollar pullback. The pair, however, is still 1% lower on the daily chart, after having peaked right above 1.1600 on Tuesday.
The dollar picks up in a cautious market session
The greenback is picking up on Wednesday, with investors reluctant to place significant bets, awaiting the outcome of the US mid-term elections and the release of US consumer inflation figures on Thursday.
The latest news has shown better-than-expected results for the Democrats as the “red wave” announced by the media has not crystallized. The final results, however, might still take some time, and key issues like the control of Congress and Biden’s next year agenda are still uncertain.
Beyond that US CPI data, due on Thursday, might provide further insight into the size of the Federal Reserve’s next interest rate hike. Any surprise in these readings might boost dollar volatility.
In a thin macroeconomic calendar on Wednesday, US oil stockpiles have shown a larger-than-expected increment in the week of November 4. The US Energy Information Administration has reported a 3.92 billion barrel increase, well above the consensus of 1.36 million barrels.
Furthermore, Richmond Fed President, Richard Barkin has warned that the inflation fight “might lead to a downturn” as the central bank’s rate hikes are challenged by artificial elements such as “high consumer savings and lack of labor supply”.
Technical levels to watch
-
16:32
Fed likely to go higher, meaning steeper rate cuts later in 2023 – ABN AMRO
On Thursday, October US CPI data will be released and should have an impact on the market and also on expectations about the Federal Reserve’s monetary policy. Bill Diviney, Sr. Economist at ABN AMRO, points out they now expect the FOMC to aim for a higher peak in interest rates, but this is likely to mean even steeper rate cuts later in 2023, once conditions allow.
Key Quotes:
“Following the 50bp hike we already expected in December, we now expect two further 25bp hikes at the February and March meetings. This will take the upper bound of the fed funds rate to 5%. However, we still expect significant rate cuts in H2 23, and if anything, the higher peak in rates implies a steeper drop-off, once macro conditions in the US allow for this.”
“We expect cuts to start somewhat later, in September rather than our prior expectation of July, but we also expect 125bp total rate cuts, up from 100bp previously. This will take the form of one 25bp cut in September, followed by two 50bp cuts in November and December. Thereafter, we expect the Fed to downshift to 25bp cuts until rates fall back to the Fed’s neutral estimate of 2.5% by mid-2024. From there we expect the Fed to pause.”
“With the Fed now more likely to overshoot in its rate hikes, we think that falling inflation next year combined with a deteriorating labour market will convince the Committee that rates are too restrictive, and that it will want to recalibrate policy before high rates do more damage to the economy than is necessary to bring inflation back to target.”
-
16:18
Fed's Barkin: Inflation fight may lead to downturn
The Federal Reserve's (Fed) fight against inflation may lead to a downturn in the United States (US) economy but that is a risk that the Fed will have to take, Richmond Fed President Thomas Barkin said on Wednesday, as reported by Reuters.
Key takeaways
"Fed rate hikes challenged by artificial elements in the current economy including high consumer savings, lack of labor supply."
"Not waiting for those issues to settle on their own, doing what it takes to return inflation to 2% target."
"Given the experience of the 1970s, Fed can't let inflation fester and expectations rise."
"The US could continue to face labor constraints going forward."
"Supply chains improving but slowly and inconsistently."
Market reaction
The US Dollar showed no immediate reaction to these comments and the US Dollar Index was last seen rising 0.35% on the day at 110.00.
-
16:14
EURGBP: Still keeping the three-month forecast at 0.89 – Rabobank
According to analysts from Rabobank, Pound’s traders should be focused on the impact of the Autumn Statement and on UK PM Rishi Sunak's political abilities, over the coming days. They still see EURGBP moving toward 0.89.
Key Quotes:
“Some commentators have attributed yesterday afternoon’s modest rally in GBP vs. the EUR to reports that the EU was optimistic that a compromise could be struck on the protocol. However, during the Brexit process GBP tended not to react hugely to day-to-day N. Ireland related news. This may be a function of the complexity of the situation. Over the coming weeks we would expect GBP investors to be focused on the impact of the November 17 Autumn Statement, the ability of PM Sunak to hold the Tory party together, the outlook for UK growth/recession and BoE interest rates.”
“We would expect issues surrounding the protocol only to have a clear impact on GBP as any related deadlines approach. We are yet to be persuaded to alter our bearish view on the pound and maintain a 3-month forecast of EUR/GBP 0.89.”
-
16:13
USDCHF’s recovery from 0.9800 remains capped below 0.9870
- The dollar attempts to bounce up from 0.9800 have found resistance at 0.9780.
- The market has turned cautious awaiting the results of the US elections.
- USDCHF is under mounting downside pressure – Credit Suisse.
The US dollar is attempting to set a bottom at 0.9800, following a 2.7% sell-off on the previous three days, although the pair has been unable to extend past 0.9870 previous resistance area. On the daily chart, the USDCHF remains practically flat, trading at 0.9850 at the time of writing.
Investors are awaiting US CPI and mid-term elections
Market sentiment has turned cautious on Wednesday, as investors await the outcome of the US mid-term elections. Recent news has shown better than expected results for the Democrats, yet with the control of the US Congress and the Government’s agenda still in the air.
On the macroeconomic front, in the absence of key releases, the focus is on Thursday’s US Consumer Prices Index figures. The increasing speculation about a potential dovish pivot by the Federal Reserve has boosted the interest in these figures, and therefore, an unexpected reading might pose a significant increase in dollar volatility.
USD/CHF is under mounting downside pressure – Credit Suisse
From a wider perspective, FX analysts at Credit Suisse see the pair under increasing negative pressure: “We think that the downside pressure is mounting. Key support is seen at the 55-day average and the recent price low at 0.9840/38, a close below which would then be seen to trigger a bearish ‘double top’ and likely clear way to 0.9737 next and potentially towards the 200-day average at 0.9616.”
Technical levels to watch
-
16:11
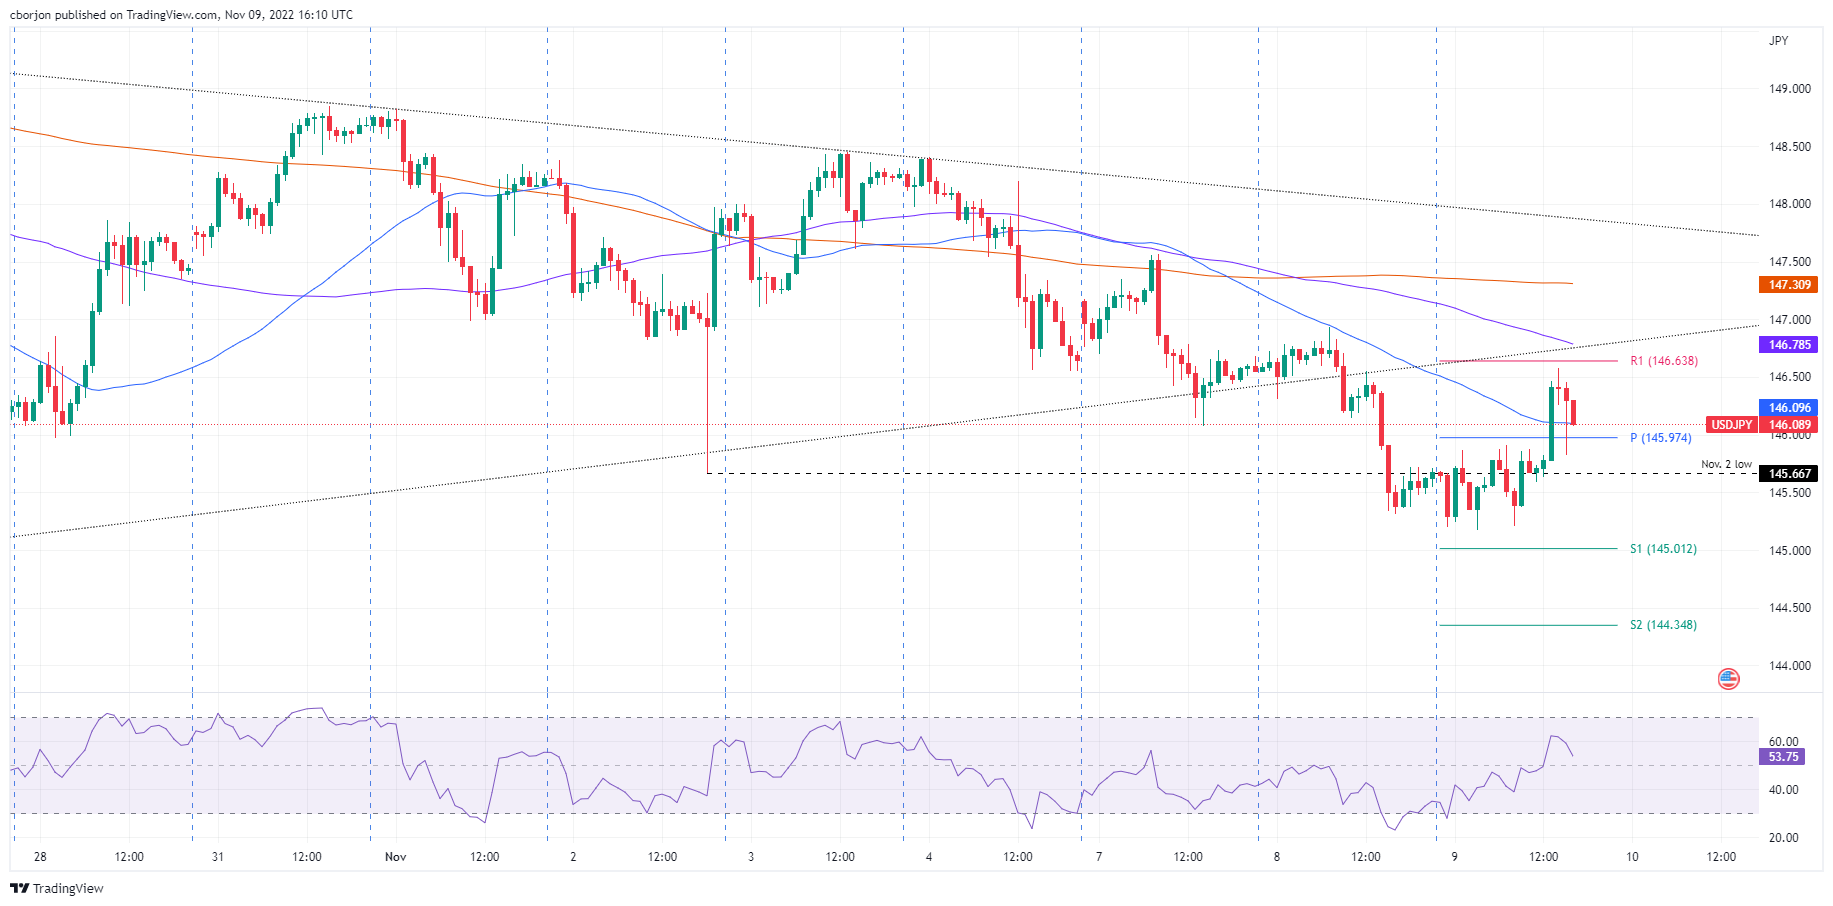
USDJPY Price Analysis: Bounces at the 50-day EMA, reclaims 146.00
- USDJPY snaps three days of losses tests the bottom of one-month-old upslope trendline.
- Sentiment remains downbeat as uncertainty around US midterm elections persists.
- USDJPY Price Analysis: Buyers reclaiming 146.70 will keep the upward bias intact; otherwise, a fall to the 100-day EMA is on the cards.
The USDJPY trims some of its Tuesday losses and bounces off the 50-day Exponential Moving Average (EMA) as buyers are trying to reclaim the 146.00 figure following three days of consecutive losses. Factors like the US midterm elections are likely to end with split control between Republicans and the Democrats in the US Congress, keeping risk appetite dented. At the time of writing, the USDJPY is trading at 146.10, above its opening price by 0.25%.
USDJPY Price Analysis: Technical outlook
After diving below a one-month-old upslope support trendline, the USDJPY is nearby to getting back above it, suggesting that buyers are gathering momentum. Of note, the Relative Strength Index (RSI) is in bearish territory but with an upslope, implying that the USDJPY would continue upwards once cleared.
In the near term, the USDJPY hourly chart appears to form a base around the 145.00 figure, and on its way towards reclaiming 146.00, buyers cleared the daily pivot point at 145.97 and tested the 146.63 R1 daily pivots. Nevertheless, USD buyers lacked the strength to clear the latter, and USDJPY prices retreated towards 146.20s.
The USDJPY key resistance levels lie at the R1 daily pivot at 146.63, which, once cleared would open the door for a test 100-hour EMA at 146.78, ahead of the psychological 147.00 mark. On the flip side, the USDJPY first support would be 146.00. A breach of the latter will expose the daily pivot point at 145.97, followed by the daily low at 145.17.
USDJPY Key Technical Levels
-
16:02
AUDUSD extends slide below 0.6450 as Wall Street turns negative
- Aussie under pressure amid risk aversion.
- US Dollar rises after a three-day negative streak, ahead of US CPI.
- AUDUSD drops more than a hundred pips from Tuesday’s high.
The AUDUSD pair printed a fresh two-day low during the American session as the US Dollar extended gains supported by risk aversion. It bottomed at 0.6431. The bearish pressure still persists.
Awaiting CPI numbers
The day before the release of the October US Consumer Price Index, the Greenback is gaining support and is rising after three days of consecutive losses. So far, the midterm elections showed no major surprises having a limited market impact. The focus is on the CPI due tomorrow which is expected to show inflation at 8%.
Earlier on Thursday, the Melbourne Institute will release the Survey of Consumer Inflationary and Wage Expectations. Inflation expectation were expected to rise from 5.4% in October to 5.7% in November.
Short-term outlook
The AUDUSD weakened as Wall Street and metals turned negative for the day. US yields are now lower, on a session without a clear direction. It the negative tone prevails in markets, more losses in the pair seem likely.
On Tuesday AUDUSD reached its highest level in seven weeks at 0.6550. The Aussie failed to consolidate above 0.6500 and is back under 0.6450 and also under the 20-Simple Moving Average in the 4-hour charts. The next support might be located at 0.6405/10.
A recovery above 0.6500 would remove the bearish pressure, exposing the recent high at 0.6550, with interim resistance at 0.6520.
Technical levels
-
16:00
Russia Consumer Price Index (MoM) climbed from previous 0.1% to 0.18% in October
-
15:54
Gold Price Forecast: Weekly close above $1,680 to ease pressure on XAUUSD – Credit Suisse
Gold has rebounded. Nonetheless, with a large “double top” in place, Credit Suisse’s core outlook stays bearish.
Gold to come under renewed pressure again
“Gold has rebounded over the past week but with a large ‘double top’ in place below $1,691/76 this is seen as a temporary rebound and we expect Gold to come under renewed pressure again in due course.”
“Support is seen at the $1,614 recent low, below which should reassert bearish pressure again with support then seen next at $1,560 and eventually our core objective at $1,451/40.”
“Only a convincing weekly close above the 55-day average at $1,680 would ease the pressure on the precious metal, with next resistance then seen at the even more important 200-day average, currently at $1,805, which we would expect to cap at the very latest.”
-
15:43
EURGBP breaks above 0.8800, hits four-week highs
- Pound under pressure, cable falls under 1.1400.
- EURGBP heads for highest daily close since October 11.
The EURGBP rose further during the American session and strengthened the rally after breaking above 0.8800. The cross peaked at 0.8820, reaching the highest level since October 11.
The pound is among the worst performers in the G10 space on Wednesday. The currency remains vulnerable after two months of political and economic tensions in the United Kingdom. The caution tone across financial markets is not helping the pound. The Dow Jones is falling by 0.87% and the Nasdaq drops by 1.25%.
The slide of GBPUSD below 1.1400 added to the broad-based slide of the pound. As of writing, Cable is trading at 1.1370, the lowest in two days, down more than 150 pips.
“Over the coming weeks, we would expect GBP investors to be focused on the impact of the November 17 Autumn Statement, the ability of PM Sunak to hold the Tory party together, the outlook for UK growth/recession and BoE interest rates. We would expect issues surrounding the (Northern Ireland) protocol only to have a clear impact on GBP as any related deadlines approach. We are yet to be persuaded to alter our bearish view on the pound and maintain a 3-month forecast of EUR/GBP 0.89”, said analysts at Rabobank.
Technical levels
-
15:38
WTI extends losses and nears $87 on concerns about Chinese demand
- Oil prices decline for the third consecutive day, to reach levels near $87.
- Fears about a decline on demand from China are weighing on prices.
- US crude stockpiles increased above expectations last week.
Front-month WTI crude futures are depreciating for the third consecutive day on Wednesday. Concerns about a potential decline in demand from China, as COVID-19 infections increase, are hurting oil prices.
The US benchmark WTI dives about 1.3% on the day, reaching levels at $87.20 at the moment of writing, a nearly 7% sell-off from Monday's peak, at $93.70.
US crude oil stockpiles increase beyond expectations
A Reuters report citing the American Petroleum Institute affirmed that US oil stocks increased by 5.6 million barrels in the week of November 4, well above the 1.4 million barrel rise expected by the market, which has added negative pressure on crude oil.
Investors remain wary about the possibility of new lockdowns in China after the country’s authorities reiterated their commitment to the Zero-COVID policy over the weekend. With coronavirus infections increasing with the winter flu season around the corner, a new set of restrictions is expected to curb global demand for oil over the coming months.
Beyond that, the US dollar steadied on Wednesday, after having depreciated sharply over the last three days, which has contributed further to the WTI decline. The Dollar Index, which measures the value of the dollar against a basket of the most traded currencies, has ticked up to the vicinity of 110.00 after bouncing off 109.30, its lowest level since mid-September.
Technical levels to watch
-
15:30
United States EIA Crude Oil Stocks Change above expectations (1.36M) in November 4: Actual (3.925M)
-
15:29
Brent Crude Oil to extend the rebound on a move above August peak at $104/105 – SocGen
Brent has staged a steady rebound after approaching downside projections and the multiyear descending trend line at $83.70/83.00. An extended bounce is expected on a break past $104/105, strategists at Société Générale report.
Monthly RSI has developed a positive reversal
“Daily MACD is above its trigger and has recently entered positive territory highlighting regain of upward momentum. August high of $104/105 is expected to be an important hurdle.”
“It is worth noting that monthly RSI has developed a positive reversal – a phenomenon where RSI records a lower trough, but price forms a higher low. This denotes upside potential.”
“If Brent overcomes the hurdle at $104/105, we can expect an extended rebound towards $113 and graphical levels of $123/125. Target for positive reversal is located at $139; this development gets negated in case Brent breaks below $87 (monthly close).”
-
15:01
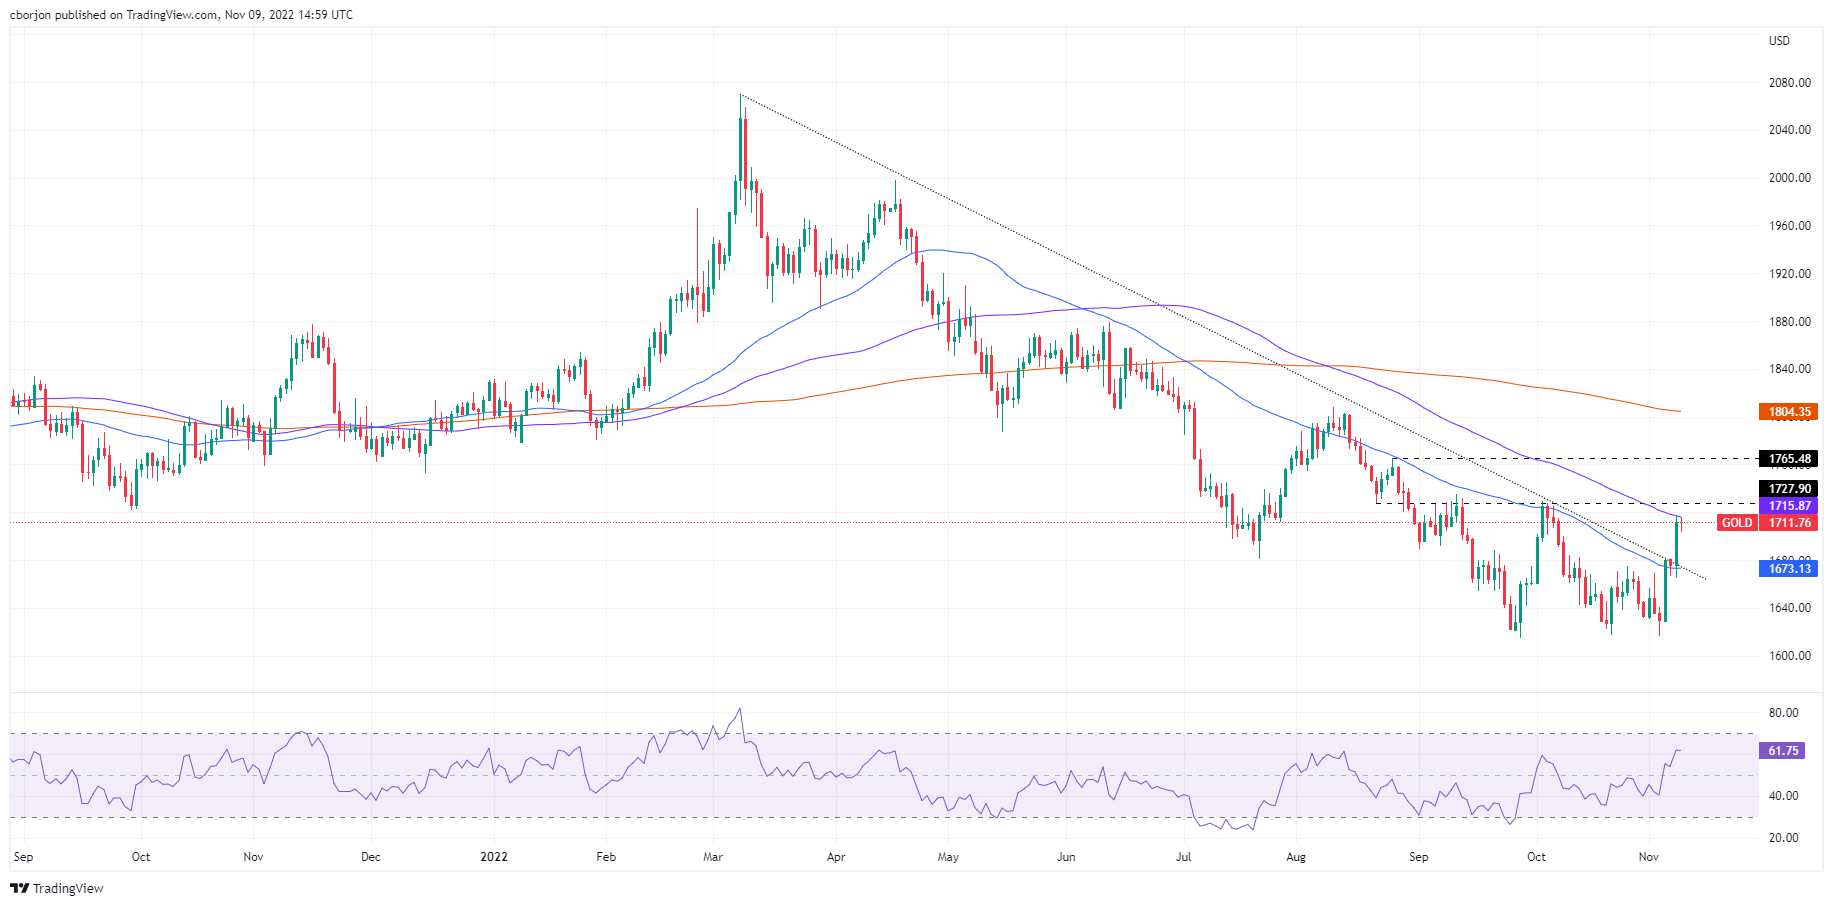
Gold Price Forecast: XAUUSD probes the 100-day EMA as buyers' eye $1735
- Gold fluctuates in the New York session amid the uncertainty of midterm elections in the United States.
- US Treasury yields are rising, underpinning the US Dollar, which is up more than 0.50% against most G8 peers.
- Gold Price Analysis: Testing the 100-day EMA, which, once broken, would shift the bias to neutral-upwards as buyers are in control.
Gold price is trading in the red, unable to crack the key resistance level at around $1716, while US Treasury yields edge higher, underpinning the American Dollar, which per the US Dollar Index, tumbled below 110.000 on Tuesday. Factors like the United States midterm elections grabbed the spotlight, with a tighter-than-expected race weighing on the market mood. At the time of typing, the XAUUSD is trading at $1711.50, fluctuating.
Gold remains trendless around $1710 awaiting US midterm elections results and CPI
US equities are set to open lower, as shown by the futures market. A close race between the Republicans and Democrats turned sentiment sour, as polls suggest that the former might regain control of the US House while the Democrats would keep control of the US Senate. That said, the US Treasury yields rallied, led by the 10-year rising two basis points, at 4.155%, a tailwind for the precious metals space.
Additionally, the US 10-year real yield, which is the yield of the 10-year bond minus inflation expectations for the same time horizon, sits at 1.70%, capping the Gold rally on Tuesday. Meanwhile, the US Dollar Index, a gauge of the bucks’ value vs. a basket of peers, is snapping three days of consecutive losses, up by 0.54% at 110.220.
In the last week, the World Gould Council reported that central banks bought 400 tonnes of Gold in the third quarter, which according to last year’s data, was an increase of 300%, and it was the largest quantity of Gold bought since 2000.
That said, expectations for Gold resuming the uptrend lie in the hands of the Federal Reserve. Ahead of the week, the United States inflation report for October would keep investors on their toes as they assess the Fed-s next move. A US inflation jump wouldn’t deter Fed policymakers from tightening aggressively.
So if inflation moderates, that could be a tailwind for XAUUSD, which could benefit from “parked” US Treasury yields.
Gold Price Analysis: Technical outlook
Following Tuesday’s rally, which broke an eight-month-old downslope resistance trendline, the XAUUSD faces solid resistance at the 100-day Exponential Moving Average (EMA) at $1715.91. It should be said that Gold made a base at around the year-to-date lows of around $1614-$1617, and that zone was tested three times, with USD buyers unable to crack the $1600 figure. Therefore, a test of the August 25 daily high at $1765.48 is likely to happen, but XAU buyers need to clear the 100-day EMA.
Once done, the XAUUSD next resistance would be the August 22 daily low-turned-resistance at $1727.90, followed by the psychological $1750.
-
15:01
EURUSD to have a bumpy ride, but year-end forecast stands at 0.95 – Nordea
In the last month, EURUSD has trended higher trading in the range of 0.97-1.01. Markets are interpreting any “softer” data in favor of a Fed pivot, sending EURUSD up. However, a high US Consumer Price Index (CPI) print tomorrow may send the pair down, economists at Nordea report.
Dollar volatility to continue
“Admittedly, the latest upward swing EURUSD is in contrast to our view for a stronger USD ahead, but we think recent price action is a reflection of tactical positioning rather than a change of fundamentals.”
“The Fed has said clearly that a pause of its rate hikes is off the table so long as inflation is high. The fight against inflation means higher rates and more pain for risk assets and the real economy. It seems that stock markets investors refuse to get the memo and are interpreting any ‘softer’ data in favor of a Fed pivot, leading to risk-on and a weaker USD. Eventually, the tide should turn and investors will again feel the pain and remember the old adage: ‘don’t fight the Fed’.”
“Tomorrow’s CPI inflation report is the next key figure in the short-term. Higher-than-expected inflation figures have been a trigger for a stronger USD (6 out of the last 10 CPI releases this year) and that could easily be the case this week as well, especially when the data shows that financial actors are net short USD.”
“Looking ahead, EURUSD will likely continue to have a bumpy ride but we still hold our view for a lower EURUSD towards the end of this year (around 0.95).”
-
15:00
United States Wholesale Inventories below expectations (0.8%) in September: Actual (0.6%)
-
14:32
AUDUSD: Defense of 0.6270 is crucial for sustained bounce – SocGen
AUDUSD has pared gains after hitting a one-month high. The Aussie needs to stay above 0.6270 to sustain its recent up move, economists at Société Générale report.
One more leg of downtrend could materialize on failure to hold 0.6270
“AUDUSD has achieved the lower limit of a descending channel since April at 0.6170. Formation of a Doji candlestick (similar open and close prices) in October and a higher trough as compared to this low so far denote the pair is evolving within a small base.”
“A bounce is not ruled out; upper band of the channel near 0.6680/0.6720 and 0.6900 could be near-term resistances.”
“In case the pair fails to hold recent higher trough at 0.6270, one more leg of downtrend could materialize towards 0.6100 and projections of 0.5980.”
-
14:31
EURUSD: Bears remain in control below 1.0100
- EURUSD keeps the bearish tone unchanged in the sub-1.0100 area.
- The dollar’s recovery comes amidst higher US yields.
- US inflation, midterm elections results stay in centre stage.
The selling bias continues to hurt the European currency and keeps EURUSD well under pressure below the 1.0100 zone on Wednesday.
EURUSD offered on USD-buying
EURUSD falters once again just ahead of the key 1.0100 region – where the October and November peaks coincide so far – and triggers a corrective decline amidst some profit taking mood following three sessions in a row with strong gains.
In addition, fresh buying around the greenback appears underpinned by uncertainty around the results from the US midterm elections and increasing cautiousness in light of the release of US inflation figures on Thursday.
The downtick in the pair comes in line with another negative session in the German 10-year bund yields, which recede to 3-day lows near 2.20%. Earlier in the session, a 10-year bund auction came at 2.25%.
In the US docket, MBA Mortgage Applications contracted 0.1% in the week to November 4 and Wholesale Inventories figures are due later.
What to look for around EUR
EURUSD faces some selling pressure near the 1.0100 region amidst another bullish attempt in the greenback.
In the meantime, price action around the European currency is expected to closely follow dollar dynamics, geopolitical concerns and the Fed-ECB divergence. The recent decision by the Fed to hike rates and the likelihood of a tighter-for-longer stance now emerges as the main headwind for a sustainable recovery in the pair.
Furthermore, the increasing speculation of a potential recession in the region - which looks propped up by dwindling sentiment gauges as well as an incipient slowdown in some fundamentals – adds to the fragile sentiment around the euro in the longer run.
Key events in the euro area this week: Italy Industrial Production (Thursday) – Germany Final Inflation Rate (Friday).
Eminent issues on the back boiler: Continuation of the ECB hiking cycle vs. increasing recession risks. Impact of the war in Ukraine and the persistent energy crunch on the region’s growth prospects and inflation outlook.
EURUSD levels to watch
So far, the pair is retreating 0.48% at 1.0022 and a breach of 0.9888 (55-day SMA) would target 0.9730 (monthly low November 3) en route to 0.9704 (weekly low October 21). On the other hand, initial resistance comes at 1.0096 (monthly high November 8) seconded by 1.0197 (monthly high September 12) and finally 1.0368 (monthly high August 12).
-
14:11
USDCAD could decline to 1.30 in the next few weeks – Scotiabank
USDCAD consolidates after key technical break through 1.3495. Economists at Scotiabank believe that the pair could slump to the 1.30 mark in the new few weeks.
Resistance aligns at 1.3490/00
“Price signals suggest the USD is consolidating recent losses rather than reversing them.”
“Narrow gains leave USDCAD building a potential bear flag pattern (losses resume below 1.3420 intraday). Resistance is 1.3490/00.”
“Broader price signals remain USD-bearish, with the noted Head and Shoulders reversal on the daily chart targeting a measured move decline to 1.30 in the next few weeks.”
-
14:02
GBPUSD Price Analysis: Bears look to seize back control, break below 1.1400 awaited
- GBPUSD erodes a major part of its weekly gains amid resurgent USD demand.
- A sustained break below the 1.1400 mark will pave the way for further losses.
- Attempted recovery could be seen as a selling opportunity and remain capped.
The GBPUSD pair comes under heavy selling pressure on Wednesday and stalls a three-day-old bullish trend to over a one-week high touched the previous day. The intraday downfall picks up pace during the early North American session and drags spot prices to a fresh daily low, with bearish now awaiting a sustained weakness below the 1.1400 mark.
A fresh leg up in the US Treasury bond yields, along with a generally weaker tone around the equity markets, assists the US Dollar to stage a goodish recovery from a multi-week low. The British pound, on the other hand, is weighed down by the Bank of England's gloomy outlook for the UK economy. The combination of the aforementioned factors attracts fresh sellers around the GBPUSD pair and supports prospects for additional losses.
The overnight failure near the 1.1600 round-figure mark adds credence to the negative outlook. That said, technical indicators on the daily chart are yet to confirm a bearish bias and warrant some caution. This makes it prudent to wait for some follow-through selling before confirming that the post-NFP recovery move from levels just below mid-1.1100s has run out of steam and positioning for a further depreciating move for the GBPUSD pair.
Spot prices might then accelerate the fall to the 1.1355-1.1350 intermediate support before eventually dropping to the 1.1300 round figure. The downward trajectory could further get extended and expose the 1.1200 mark, below which the GBPUSD pair could aim to retest last week's swing low, around mid-1.1100s.
On the flip side, the 1.1445-1.1450 region now seems to act as an immediate strong resistance ahead of the 1.1500 psychological mark. Any further recovery might continue to attract fresh supply near the 1.1575-1.1580 region and remain capped. That said, some follow-through buying beyond the 1.1600 mark will negate the negative bias and lift the GBPUSD pair towards the October monthly swing high, around the 1.1645 region.
GBPUSD 4-hour chart
Key levels to watch
-
13:29
USDJPY rallies back closer to to mid-146.00s amid a strong pickup in USD demand
- USDJPY rebounds from a nearly two-week low touched earlier this Wednesday.
- Elevated US bond yields help revive the USD demand and remain supportive.
- The Fed-BoJ divergence also acts as a tailwind ahead of the US CPI on Thursday.
The USDJPY pair attracts some buying near the 145.15 region and stages a goodish recovery from a nearly two-week low touched earlier this Wednesday. The intraday uptick picks up pace during the early North American session and lifts spot prices to a fresh daily high, closer to mid-146.00s amid resurgent US Dollar demand.
Despite diminishing odds for a more aggressive policy tightening by the Federal Reserve, the markets are still betting on at least a 50 bps rate hike in December. This remains supportive of elevated US Treasury bond yields and assists the USD Index, which measures the greenback's performance against a basket of currencies, away from a multi-week low set on Tuesday.
The Japanese yen, on the other hand, continues to be weighed down by that the fact that the Bank of Japan, so far, has shown no intentions to raise interest rates. Moreover, the BoJ remains committed to guiding the 10-year bond yield at 0%, widening the US-Japan rate differential. This, in turn, supports prospects for a further appreciating move for the USDJPY pair.
That said, speculations that Japanese authorities might intervene again to soften any steep fall in the domestic currency might keep a lid on any meaningful upside for spot prices. Apart from this, a softer risk tone could offer additional support to the safe-haven JPY and contribute to capping gains for the USDJPY pair, at least for the time being.
Traders also seem reluctant and might prefer to wait for a fresh catalyst from the latest US consumer inflation figures, due for release on Thursday. The crucial US CPI report will play a key role in determining the Fed's rate-hiking cycles, which, in turn, should determine the near-term trajectory for the greenback and the USDJPY pair.
In the meantime, traders on Wednesday will take cues from speeches by influential FOMC members amid the absent relevant market-moving economic releases. Apart from this, the US bond yields and the broader market risk sentiment should allow traders to grab short-term opportunities around the USDJPY pair.
Technical levels to watch
-
13:11
USD Index: Defense of key 109/108.70 support can trigger rebound – SocGen
The US Dollar Index recently faced stiff resistance at 114.80. This test has stalled the uptrend resulting in a sideways consolidation. DXY could test 113.90 if manages to hold the 109/108.70 support, economists at Société Générale report.
Risk of short-term downtrend on a break under 109/108.70
“The ascending trend line since February at 109/108.70 which is also the 23.6% retracement from 2021 is expected to be first important support. Defending this can lead to a rebound towards recent lower high at 113.90. Overcoming it would mean next leg of uptrend towards 117 and 2001 high near 121/122.”
“If DXY breaks and establishes below the support near 109/108.70, there is a risk of a short-term downtrend. In such a scenario, next potential objectives could be at 107.60 and May high of 105.”
-
12:55
GBPUSD: Failure to hold the low 1.14 zone will point to renewed losses toward 1.12/1.13 – Scotiabank
Sterling is one of the weaker-performing majors on the session. Economists at Scotiabank expect the low 1.14 zone to cushion the GBPUSD downside.
UK political backdrop remains somewhat unsettled
“The UK political backdrop remains somewhat unsettled, with a minister from new PM Sunak’s cabinet forced to resign today. More turnover of government ministers would not surprise but the key issue for the GBP as far as Westminster goes in next week’s update on government finances.”
“Intraday support is developing at 1.1430 which may provide some lift for the GBP to retest the mid-1.15s but failure to hold the low 1.14 zone will point to renewed losses towards 1.12/1.13.”
-
12:40
NZDUSD remains depressed near daily low amid modest USD strength, softer risk tone
- NZDUSD meets with heavy supply on Wednesday amid a modest USD recovery.
- Elevated US bond yields and a softer risk tone revive demand for the greenback.
- Traders now look to Fedspeaks for some impetus ahead of the US CPI on Thursday.
The NZDUSD pair comes under fresh selling pressure on Wednesday and extends the previous day's rejection slide from the 0.6000 psychological mark, or the highest level since September 19. The pair maintains the heavily offered tone through the mid-European session and is currently placed near the lower end of its daily range, just above the 0.5900 round figure.
A combination of factors assists the US Dollar stage a modest recovery from a multi-week low touched on Tuesday, which, in turn, is seen as a key factor exerting downward pressure on the NZDUSD pair. Despite expectations for a less aggressive policy tightening by the Fed, bets for another 50-bps rate hike in December remain supportive of elevated US Treasury bond yields. This, along with a generally weaker tone around the equity markets, offers support to the safe-haven buck and contributes to driving flows away from the risk-sensitive Kiwi.
Against the backdrop of growing worries about a deeper economic downturn, the uncertainty over the results from the US mid-term elections tempers investors' appetite for riskier assets. In fact, the opposition Republicans remain favourites to win a majority In the House of Representatives. This could allow them to prevent any additional tax increases and limit government spending. Moreover, the race for the Senate remains too close to call. The pivotal battles in Arizona, Georgia, and Nevada could determine which party controls the chambers.
With the latest leg down, the NZDUSD pair, for now, seems to have stalled the post-NFP rally and remains at the mercy of the USD price dynamics in the absence of any relevant economic data. Traders, however, will take cues from speeches by New York Fed President John Williams and Richmond Fed President Thomas Barkin. This, along with the US bond yields and the broader risk sentiment, will drive the USD demand and provide some impetus to the NZDUSD pair. The focus, however, remains glued to the US consumer inflation figures, due on Thursday.
Technical levels to watch
-
12:38
USDJPY: At risk of pullback if 150/152 remains unchallenged – SocGen
USDJPY has recently struggled to overcome the upper end of a channel in daily time frame chart near 150/152. The pair could stage a short-term breather while below this area, economists at Société Générale report.
142 and 140.30/139.40 are important support levels near term
“Interestingly, monthly MACD histogram has registered multi-year highs and the same indicator in daily time frame has been posting negative divergence. These developments denote the move is stretched and a short-term breather is expected.”
“Projections near 142 and the lower band of the daily channel at 140.30/139.40 are important support levels near term. Defending this channel could highlight continuation in uptrend.” “Once the pair reclaims the peak of 152, one more leg of up move is not ruled out. In this scenario, 153.50 and 1990 levels near 160 could be next potential resistances.”
-
12:23
EURUSD Price Analysis: Solid resistance emerges around 1.0100
- EURUSD comes under pressure near 1.0100 on Wednesday.
- The surpass of this area could allow for extra gains near term.
EURUSD’s strong recovery appears to have met a tough hurdle at the 1.0100 zone so far this week.
If the pair manages to surpass this zone in a sustainable fashion, it could then challenge the September top at 1.0197 (September 12) prior to the August high at 1.0368 (August 10).
While above the 9-month resistance line, today near 0.9840, extra gains look likely.
In the longer run, the pair’s bearish view should remain unaltered while below the 200-day SMA at 1.0450.
EURUSD daily chart
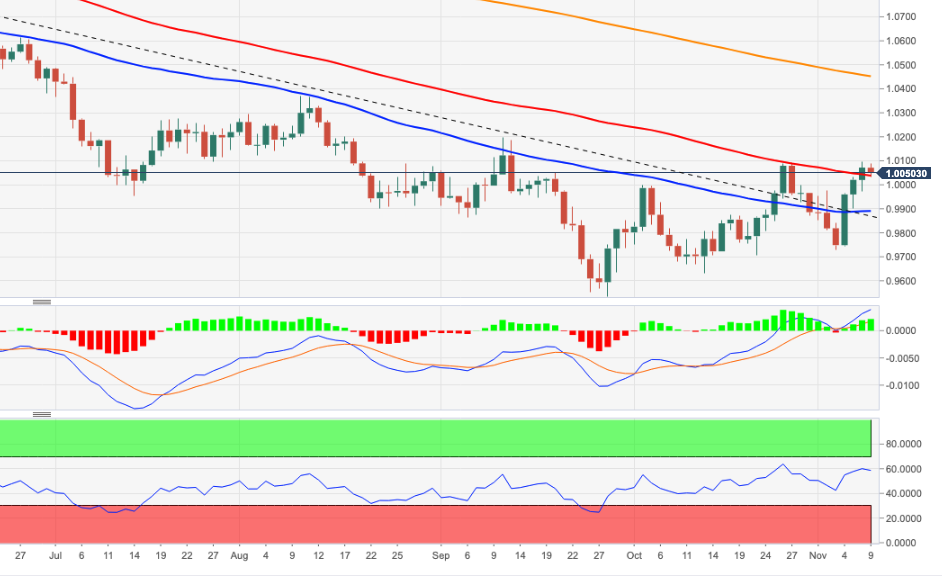
-
12:16
USD Index Price Analysis: Losses expected to accelerate below 109.00
- DXY regains some poised following three daily pullbacks.
- The 9-month support line appears around 109.00.
DXY picks up some buying interest and briefly tests the area just beyond 110.00 the figure on Wednesday.
Further weakness in the dollar should not be ruled out despite the current bullish attempt. That said, the loss of the 9-month support near 109.00 carries the potential to magnify the decline and open the taps to extra retracement in the near term.
In the longer run, DXY is expected to maintain its constructive stance while above the 200-day SMA at 104.66.
DXY daily chart
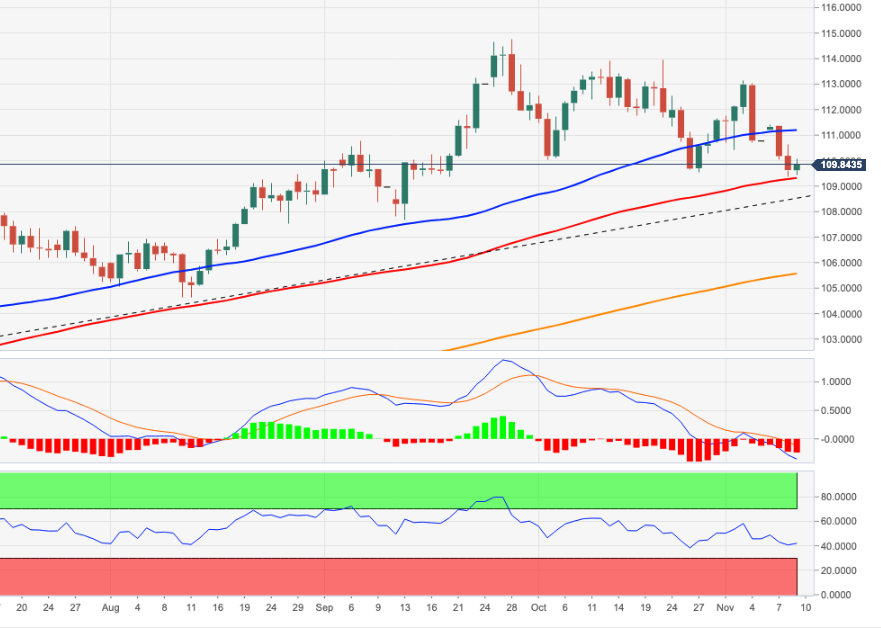
-
12:04
EURUSD points to renewed gains on moves through 1.0080/90 – Scotiabank
EURUSD is going into a consolidation phase below 1.0100. Economists at Scotiabank expect the pair to enjoy mild gains on moves through 1.0080/90.
Intraday pattern implies a bull flag in development
“EURUSD gains holding above par keep the short-term trend here supportive for the EUR.”
“For EURUSD, the intraday pattern implies a bull flag in development, which points to renewed EUR gains on spot moves through 1.0080/90.”
“Support is 1.0020/30 intraday.”
See – EURUSD: September peak of 1.0190 likely to cap short-term upside – SocGen
-
12:02
EURJPY Price Analysis: Further consolidation appears likely below 147.00
- EURJPY adds to Tuesday’s decline, always below the 147.00 region.
- Extra range bound should not be ruled out in the near term.
EURJPY loses further momentum following the rejection from the 147.00 neighbourhood earlier in the week.
The cross seems to have embarked on a consolidative phase, with the upper end of the range limited by the 147.00 area. A breakout of the latter should open the door to extra gains to, initially, the 2022 top at 148.40 (October 21) ahead of the round level at 150.00.
In the short term the upside momentum is expected to persist while above the October lows near 141.00.
In the longer run, while above the key 200-day SMA at 137.96, the constructive outlook is expected to remain unchanged.
EURJPY daily chart
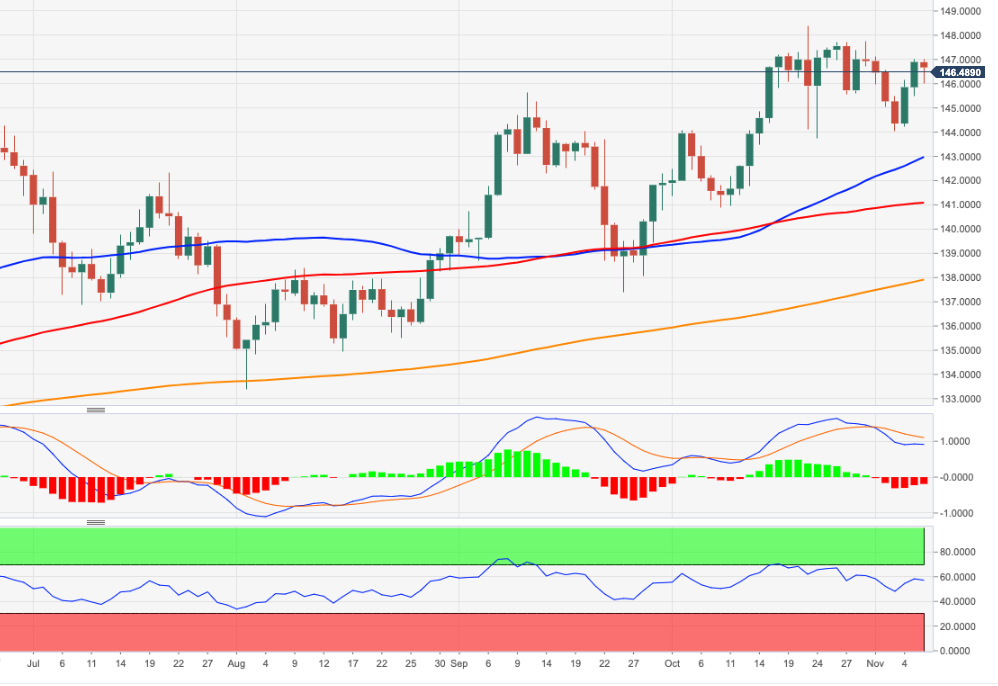
-
12:01
Mexico 12-Month Inflation came in at 8.41% below forecasts (8.46%) in October
-
12:00
Brazil Retail Sales (MoM) came in at 1.1%, above expectations (0.2%) in September
-
12:00
Mexico Core Inflation came in at 0.63% below forecasts (0.65%) in October
-
12:00
Mexico Headline Inflation registered at 0.57%, below expectations (0.61%) in October
-
12:00
USD Index at a potential turning point for the year – DBS Bank
The US Dollar Index (DXY) depreciated a third session by 0.5% to 109.62, closing below 110 for the first time since 26 October. As economists at DBS Bank note, DXY has a potential head-and-shoulders formation.
This week could well be critical for the USD’s uptrend
“Investors are betting that the US mid-term elections will hurt the USD and bolster equities if the Republicans wrest control of one or two houses of Congress from the Democrats.”
“To extend its downside, the DXY needs to break below 109.50, the neckline of a potential head-and-shoulders formation.”
“USD bears will be encouraged if the support at 108.90, its 100-Day Mmoving Average (MA), is taken out.”
“This week could well be critical for the USD’s uptrend.”
-
12:00
United States MBA Mortgage Applications rose from previous -0.5% to -0.1% in November 4
-
11:44
USDKRW to extend its slide toward cluster of supports at 1,293/1,319 – Credit Suisse
USDKRW has triggered a top, exposing 1,359. Notwithstanding,analyst at Credit Suisse look for a better floor at 1,293/1,319.
A deeper setback is likely to unfold
“USDKRW has extended its decline and the market is now seen below the 55-day average and a recent price low at 1,403/1,397. This break lower in our eyes has triggered a bearish top and with weekly MACD also rolling over, we think that a deeper setback is likely to unfold.”
“Support is seen at the 23.6% retracement of the 2021/22 rise at 1,359 initially, though below here would likely find a significantly stronger floor at a cluster of supports at 1,293/1,319, which includes the broken channel support, the 38.2% retracement, the 2020 high and the 200-day average.”
-
11:13
USDINR: 80.30/80.00 is crucial support zone – SocGen
USDINR has experienced an extended uptrend after breakout above the key graphical levels of 77. Economists at Société Générale expect the pair to retrace to test the 80.30/80.00 support zone.
Break above 83.30 essential to affirm next leg of uptrend
“USDINR has completed a streak of ten consecutive higher monthly closes in 2022 denoting a slightly stretched move. This is not a reversal signal, however, a short-term pause is not ruled out.”
“The pair has evolved within a pattern resembling Head and Shoulders in daily timeframe chart. This projects targets near 80.90. Multi month ascending trend line and upper limit of the triangle during July / August at 80.30/80.00 is expected to be an important support zone.”
“A break above 83.30 would be essential to affirm next leg of uptrend. If this crossover materializes, the pair could inch higher towards further projections of 84.20 and 85.90/86.30.”
-
11:02
Portugal Global Trade Balance declined to €-8.305B in September from previous €-8.197B
-
11:00
Portugal Unemployment Rate increased to 5.8% in 3Q from previous 5.7%
-
10:59
USDCAD sticks to gains above mid-1.3400s amid softer oil prices, modest USD strength
- USDCAD catches some bids on Wednesday and is supported by a combination of factors.
- Retreating oil prices undermines the Loonie and acts as a tailwind amid fresh USD buying.
- The recent breakdown below the 50-day SMA warrants some caution for bullish traders.
The USDCAD pair attracts some buying on Wednesday and builds on the previous day's late rebound from its lowest level since September 21. The pair sticks to its gains above mid-1.3400s through the first half of the European session and is supported by a combination of factors.
Crude oil prices add to the overnight heavy losses and edge lower for the second straight day, which, in turn, is seen undermining the commodity-linked Loonie. Investors remain concerned that China's zero-COVID policy could dent fuel demand in the world's top crude importer. Furthermore, the American Petroleum Institute reported on Tuesday that US inventories grew by 5.6 million barrels in the week to November 4, which continues to weigh on the black liquid. This, along with the emergence of some buying around the US Dollar, acts as a tailwind for the USDCAD pair.
Despite diminishing odds for a more aggressive policy tightening by the Fed, the markets are pricing in at least a 50 bps rate hike in December. This remains supportive of elevated US Treasury bond yields and offers some support to the greenback. Apart from this, a generally weaker tone around the equity markets assists the safe-haven buck to stall its recent downfall to a multi-week low. The upside potential for the USDCAD pair, however, seems limited amid the post-NFP breakdown below the 50-day SMA key pivotal support near the 1.3500 psychological mark.
Market participants might also refrain from placing aggressive bets and prefer to move to the sidelines ahead of the release of the US consumer inflation figures on Thursday. Hence, it will be prudent to wait for strong follow-through buying before confirming a near-term bottom and positioning for any further gains. In the absence of any major market-moving economic releases from the US, speeches by New York Fed President John Williams and Richmond Fed President Thomas Barkin might provide some impetus to the USDCAD pair later during the early North American session.
Technical levels to watch
-
10:48
NZDUSD: Recent recovery still looks like a corrective countermove within the broader downtrend – Credit Suisse
NZDUSD has rallied higher. Nevertheless, this stays seen as a correction within the choppy downtrend for now, analysts at Credit Suisse report.
Broader negative outlook stays intact
“The recent recovery in our eyes still looks, for now at least, like a corrective countermove within the broader downtrend. Hence, our broader negative outlook stays intact, though with a move back below 0.5854 and then below 0.5600/5597 needed to turn the market on the path towards the YTD low 0.5510 and then the 2020 low at 0.5468.”
“Were we to see the broader USD top out below key levels, we would turn more cautious on NZDUSD also, with a move above 0.6059 needed to pave way to what we see as a tougher resistance at the downtrend from April at 0.6091.”
-
10:37
Germany 10-y Bond Auction increased to 2.25% from previous 2.07%
-
10:29
AUDUSD retreats further from multi-week high amid pickup in USD demand
- A combination of factors prompts some selling around AUDUSD on Wednesday.
- Elevated US bond yields and a softer risk tone help revive demand for the USD.
- Not-so-hawkish remarks by RBA Deputy Governor Bullock weigh on the Aussie.
The AUDUSD pair comes under some selling pressure on Wednesday and extends the overnight late pullback from mid-0.6500s or its highest level since September 23. The pair drops to the 0.6470 area during the first half of the European session and for now, seems to have snapped a three-day winning streak amid a modest US Dollar uptick.
In fact, the USD Index stages a goodish bounce from a seven-week low touched the previous day and is supported by a combination of factors. Despite reduced bets for a more aggressive policy tightening by the Fed, the markets are still pricing in at least a 50 bps rate hike in December. This remains supportive of elevated US Treasury bond yields and helps revive the USD demand. This, along with a fresh leg down in the equity markets, offers additional support to the safe-haven buck and contributes to driving flows away from the risk-sensitive Aussie.
Adding to this, the not-so-hawkish remarks by the Reserve Bank of Australia (RBA) Deputy Governor Michele Bullock weighs on the domestic currency. Speaking about the economic outlook, Bullock noted that there are good reasons to think we are approaching the peak of inflation this cycle. This suggests that the RBA could further slow the pace of its rate-hiking cycle and exerts some pressure on the Australian Dollar. The combination of the aforementioned fundamental factors supports prospects for a further intraday depreciating move for the AUDUSD pair.
In the absence of any major market-moving economic releases from the US, traders on Wednesday will take cues from speeches by New York Fed President John Williams and Richmond Fed President Thomas Barkin. This, along with the US bond yields and the broader market risk sentiment, might influence the USD price dynamics and provide some impetus to the AUDUSD pair. The focus, however, will remain glued to the latest US consumer inflation figures, due on Thursday.
Technical levels to watch
-
10:24
EURUSD: September peak of 1.0190 likely to cap short-term upside – SocGen
EURUSD is gradually heading towards 1.0190. Failure to cross can lead to downside, economists at Société Générale report.
Daily RSI points towards short-term upside momentum
“Interestingly, daily RSI has registered a multi month peak recently pointing towards short-term upside momentum. In case of a break beyond this channel, a revisit of the peak of September near 1.0190 is not ruled out. Graphical levels of 1.0360/1.0450 consisting of lows of 2015/2016 would be a key resistance zone.”
“Failure to cross 1.0190 can lead the pair gradually lower towards recent higher trough at 0.9730 and 0.9535. Below this support, next potential objectives are expected to be at projections of 0.9200/0.9150.”
-
09:55
USDCHF: Downside pressure is mounting – Credit Suisse
USDCHF has rejected key resistance at 1.0071. Analysts at Credit Suisse see signs that downside pressure is mounting.
Clear top threatening
“We think that the downside pressure is mounting. Key support is seen at the 55-day average and the recent price low at 0.9840/38, a close below which would then be seen to trigger a bearish ‘double top’ and likely clear way to 0.9737 next and potentially towards the 200-day average at 0.9616.”
“A sustained move above 1.0071/1.0148 though would negate thoughts of a shift lower within the range and instead suggest a stronger recovery towards 1.0235.”
-
09:54
GBPUSD drops to fresh daily low, eyes mid-1.1400s amid modest USD uptick
- GBPUSD comes under some selling pressure on Wednesday and snaps a three-day winning streak.
- Elevated US bond yields, a softer risk tone revives the USD demand and exerts downward pressure.
- The BoE’s gloomy outlook for the UK economy weighs on the Sterling and contributes to the slide.
The GBPUSD pair edges lower on Wednesday and moves further away from over a one-week high, around the 1.1600 round figure touched the previous day. The selling bias picks up pace during the first half of the European session and drags spot prices to a fresh daily low, around the 1.1470-1.1465 region in the last hour.
A combination of factors assists the US Dollar to stall its recent downfall to the lowest level since September 20, which, in turn, is seen acting as a headwind for the GBPUSD pair. Despite reduced bets for a more aggressive policy tightening by the Fed, the markets are still pricing in at least a 50 bps rate hike in December. This remains supportive of elevated US Treasury bond yields, which, along with the prevalent cautious market mood, offers some support to the safe-haven greenback.
The British Pound, on the other hand, continues to be undermined by the Bank of England's bleak outlook for the UK economy. In fact, the UK central bank expects a recession to last for all of 2023 and the first half of 2024. The BoE last week also indicated a lower terminal peak than was priced into the markets. Apart from this, some cross-driven weakness stemming from an intraday pickup in the EURGBP pair weighs on the Sterling and contributes to the GBPUSD pair's mildly offered tone.
Meanwhile, the latest leg down over the past hour or so could be attributed to some technical selling below the 1.1500 psychological mark. The GBPUSD pair, for now, seems to have stalled its recent bounce from levels just below mid-1.1100s and remains at the mercy of the USD price dynamics. In the absence of any relevant economic data, either from the UK or the US, traders on Wednesday will take cues from speeches by New York Fed President John Williams and Richmond Fed President Thomas Barkin.
Apart from this, the US bond yields, along with the broader risk sentiment will drive the USD demand and provide some impetus to the GBPUSD pair. The focus, however, will remain on the latest US consumer inflation figures on Thursday ahead of the Preliminary UK Q3 GDP report on Friday. The important macro releases will play role in determining the next leg of a directional move for the major.
Technical levels to watch
-
09:52
RBA’s Bullock: We have already raised rates aggressively
Reserve Bank of Australia (RBA) Deputy Governor Michele Bullock said on Wednesday, “we have already raised rates aggressively.”
Additional quotes
Could crunch economy hard to bring inflation down but would have costs.
Believe can bring inflation down over time and keep gains made on employment.
On wages there seems to be an acceptance that inflation spike will be temporary.
Could have "scorched earth" rate policy to get inflation down but not the best outcome.
We would raise rates faster if we thought inflation was not coming down as expected.
-
09:41
EURUSD meets some resistance ahead of 1.0100
- EURUSD comes under pressure just below the 1.0100 region.
- Markets’ attention remains on the results from the US midterm elections.
- US inflation figures will take centre stage later in the week.
Sellers appear to remain clustered around the 1.0100 region and prompt EURUSD to struggle to retest/surpass that key resistance zone so far on Wednesday.
EURUSD: Upside limited around 1.0100
EURUSD gives away some gains after three consecutive daily advances and in response to another failed attempt to revisit/trespass the 1.0100 zone, always on the back of a lacklustre rebound in the dollar.
The recent change of heart around the greenback – particularly triggered following October’s Payrolls – has been sustaining the sharp upside bias in the pair and the rest of the risk-associated universe. The move in the money markets, however, has been fairly noticed, with yields on both sides of the ocean treading water in the upper end of the recent range.
Nothing worth mentioning data wise in the Euroland, with only a 10-year Bund auction due later in the session. In the US, MBA Mortgage Applications are due in the first turn seconded by Wholesale Inventories and speeches by FOMC’s J.Williams and T.Barkin.
What to look for around EUR
EURUSD faces some selling pressure near the 1.0100 region amidst another bullish attempt in the greenback.
In the meantime, price action around the European currency is expected to closely follow dollar dynamics, geopolitical concerns and the Fed-ECB divergence. The recent decision by the Fed to hike rates and the likelihood of a tighter-for-longer stance now emerges as the main headwind for a sustainable recovery in the pair.
Furthermore, the increasing speculation of a potential recession in the region - which looks propped up by dwindling sentiment gauges as well as an incipient slowdown in some fundamentals – adds to the fragile sentiment around the euro in the longer run.
Key events in the euro area this week: Italy Industrial Production (Thursday) – Germany Final Inflation Rate (Friday).
Eminent issues on the back boiler: Continuation of the ECB hiking cycle vs. increasing recession risks. Impact of the war in Ukraine and the persistent energy crunch on the region’s growth prospects and inflation outlook.
EURUSD levels to watch
So far, the pair is retreating 0.09% at 1.0061 and a breach of 0.9730 (monthly low November 3) would target 0.9704 (weekly low October 21) en route to 0.9631 (monthly low October 13). On the other hand, initial resistance comes at 1.0096 (monthly high November 8) seconded by 1.0197 (monthly high September 12) and finally 1.0368 (monthly high August 12).
-
09:40
USD Index: Weekly close below 110.05 to suggest a more concerted phase of corrective weakness – Credit Suisse
The US Dollar Index continues to lose significant momentum. Economists at Credit Suisse are highly alert to the formation of a top, which would be confirmed on a weekly close below 110.05.
USD is seen highly at risk of completing a top
“DXY has broken support from its 55-day average and with weekly MACD having crossed lower we remain of the view a top may be close to completing. A weekly close below the 110.05 October low should confirm to suggest the USD is set for a more concerted phase of corrective weakness for a fall to support at the 23.6% retracement of the 2021/2022 uptrend at 108.74. Whilst we would look for this to hold at first, below in due course can see support next at 107.68 and eventually the 38.2% retracement and 200-day average at 105.01/104.57.”
“Above 113.15/35 is now needed to ease thoughts of a top for a retest of the 114.78 high. Beyond this latter level can reassert the core uptrend with the ‘5-year measured triangle objective’ seen at 118.37.”
-
09:18
ECB Survey: Consumer see inflation at 5.1% over next 12 months
The European Central Bank (ECB) conducted a survey of consumer expectations for inflation, with the key findings noted below.
After HICP inflation rose above 2% in July 2021, consumers’ inflation perceptions and expectations started to move upwards too.
Consumers still see inflation at 3% in 3 years.
Consumer see inflation at 5.1% over next 12 months.
Market reaction
The above survey findings have little to no impact on the Euro, as EUR/USD keeps its range around 1.0060, down 0.09% on a daily basis.
-
09:12
RBA’s Bullock: Good reasons to think we are approaching peak of inflation
Reserve Bank of Australia (RBA) Deputy Governor Michele Bullock said on Wednesday, there are “good reasons to think we are approaching the peak of inflation this cycle.”
Additional comments
Reiterates further increases in interest rates will be required.
Size and timing of rate hikes will depend on the data.
Inflation is too high, increasingly broad based.
But watching inflationary impact of rising electricity prices, rents.
Electricity to add 1 ppt to CPI in year to Q3 2023, 0.5 ppt over 2024.
Rent inflation to rise over coming quarters with vacancies low.
Wages growth is a bit stronger than we had thought three months ago.
Aggregate wages growth moderate so far, consistent with inflation target.
Many uncertainties about the behaviour of households, businesses.
Global economic risks still to downside, particularly for China.
Market reaction
The Australian Dollar came under renewed selling pressure on the above comments, knocking down AUDUSD nearly 20 pips to 0.6500 levels, at the time of writing. The pair is down 0.05% on the day.
-
09:06
USDJPY Price Analysis: Struggles near two-week low, bears await break below 145.00 mark
- USDJPY remains depressed near a two-week low amid the prevalent selling around the USD.
- The overnight break below the 200-period SMA on the 4-hour chart favours bearish traders.
- It still seems prudent to wait for weakness below 145.00 before positioning for further losses.
The USDJPY pair struggles to capitalize on its modest intraday uptick and attracts fresh selling in the vicinity of the 146.00 mark during the early European session on Wednesday. The pair is hovering around a nearly two-week low, just below the mid-145.00s and remains at the mercy of the US Dollar price dynamics.
In fact, the USD Index languishes near its lowest level since September 20 touched on Tuesday amid speculations that the Federal Reserve will slow the pace of its rate-hiking cycle. This, along with uncertainty over the results of the US mid-term elections, offers support to the safe-haven Japanese yen and exerts some pressure on the USDJPY pair.
The Fed, however, is still expected to hike interest rates by at least 50 bps in December, which remains supportive of elevated US Treasury bond yields. The Bank of Japan, on the other hand, so far, remains committed to guiding the 10-year bond yield at 0%. The resultant widening of the US-Japan rate differential could limit losses for the USDJPY pair.
From a technical perspective, the overnight slide below the 200-period SMA on the 4-hour chart could be seen as a fresh trigger for bearish traders. Moreover, acceptance below the 146.00 mark might have already set the stage for a further depreciating move. That said, the emergence of some buying ahead of the 145.00 psychological mark warrants caution.
The broader set-up, however, suggests that the path of least resistance for the USDJPY pair is to the downside. The negative outlook is reinforced by the fact that technical indicators on the daily chart are holding deep in the bearish territory and are still far from being in the oversold zone.
Hence, any attempted recovery back towards the 146.00 round-figure mark could be seen as a selling opportunity and runs the risk of fizzling out rather quickly. This, in turn, should cap the USDJPY pair near the 200-period SMA support breakpoint, around the 146.60-146.65 area. That said, a sustained move beyond could negate the near-term bearish bias.
On the flip side, a convincing break through the 145.00 mark should pave the way for an extension of the recent retracement slide from a 32-year high touched in October. The USDJPY pair might then accelerate the fall towards testing the next relevant support near the 144.45 horizontal zone before eventually dropping to the 144.00 round-figure mark.
USDJPY 4-hour chart
-638035815046944556.png)
Key levels to watch
-
09:01
USDVND to reach 25,000 by year-end as Dong is set to weaken further – ANZ
Given the broad Dollar strength, the Dong has weakened by roughly 8.2% year-to-date against the USD. Economists at ANZ Bank expect the Dong to weaken further.
VND will likely weaken further
“We expect USDVND to reach 25,000 by year-end and remain elevated for longer.”
“Financial market developments such as Dollar strength will likely be the key reason behind further VND weakness, but a deteriorating export outlook also doesn’t bode well.”
“The State Bank of Vietnam (SBV) is also exhibiting greater tolerance for a weaker currency. Alongside fixing the reference rate weaker, it has also adjusted Dong’s trading band to 5% from3% earlier. In fact, from a peer-perspective, VND also looks over-valued among Asian currencies and further adjustments may be warranted, especially in an environment of slowing global trade to prevent loss of competitiveness.”
-
08:56
USD Index remains on the defensive near 109.50, focus on data, elections
- The index extends the bearish move and hovers around 109.50.
- Republicans lead the race to the Senate by a marginal gap.
- Weekly Mortgage Applications, Wholesale Inventories, Fedspeak next on tap.
The USD Index (DXY), which gauges the greenback vs. a bundle of its main rivals, extends the decline and revisits the 109.50/40 band on Wednesday.
USD Index appears cautious ahead of US CPI
The index loses ground for the 4th consecutive session and navigates an area las seen back in mid-September around 109.50, always against the backdrop of rising prudence ahead of the publication of US inflation figures (Thursday) and persistent appetite for the risk complex.
In addition, investors remain cautious and following the results from the US midterm elections, where the Republican party continues to lead the vote in both the Senate and the House of Representatives.
The downtick in the dollar, in addition, comes in tandem with the lack of traction in US yields across the curve.
In the calendar, the weekly Mortgage Applications gauged by MBA are due along with Wholesale Inventories and speeches by NY Fed J.Williams (permanent voter, centrist) and Richmond Fed T.Barkin (2024 voter, centrist).
What to look for around USD
The dollar remains under heavy pressure amidst persistent risk-on mood and the continuation of the repricing of a Fed’s pivot in the relatively short term.
In the meantime, the firmer conviction of the Federal Reserve to keep hiking rates until inflation looks well under control regardless of a likely slowdown in the economic activity and some loss of momentum in the labour market continues be the main source of strength for the dollar so far.
Looking at the more macro scenario, the greenback also appears bolstered by the Fed’s divergence vs. most of its G10 peers in combination with bouts of geopolitical effervescence and occasional re-emergence of risk aversion.
Key events in the US this week: MBA Mortgage Applications, Wholesale Inventories (Wednesday) – Inflation Rate, Initial Jobless Claims, Monthly Budget Statement (Thursday) – Preliminary Michigan Consumer Sentiment (Friday).
Eminent issues on the back boiler: US midterm elections. Hard/soft/softish? landing of the US economy. Prospects for further rate hikes by the Federal Reserve vs. speculation of a recession in the next months. Fed’s pivot. Geopolitical effervescence vs. Russia and China. US-China persistent trade conflict.
USD Index relevant levels
Now, the index is losing 0.05% at 109.56 and the breakdown of 109.35 (weekly low September 20) would open the door to 107.68 (monthly low September 13) and finally 104.66 (200-day SMA). On the upside, the initial resistance emerges at 113.14 (monthly high November 3) followed by 113.88 (monthly high October 13) and then 114.76 (2022 high September 28).
-
08:49
Phase of stronger equities linked to the midterms could hurt the USD – Credit Suisse
US politics becomes a live issue again due to yesterday’s midterm elections. Republicans are on track to achieve a majority in the House of Representatives while Democrats could lose the Senate too. In that case, equities could rise, hurting the US Dollar, economists at Credit Suisse report.
US Midterm Elections: lots of headlines and a possible weak USD impact
“While final results may not be known for some days, the odds are high that Democrats lose control of the House and possibly the Senate too. This would bring about yet another phase of ‘divided government’. Market analysts covering the equity market tend to lean towards stronger equities as a likely outcome of such a result.”
“Because higher stocks also tend to go hand in hand with a weaker USD, it’s logical to expect that a phase of stronger equities linked to the midterms could hurt the USD, which is why we advocate tight stops on USD longs near term.”
“Another factor to consider is the possibility of yet another showdown over the US debt limit. If this comes into play, we suspect that it would not be until the middle of 2023 before a critical phase is reached where a real risk premium is priced into US debt and assets. This period should notionally be bad for the USD, especially if the rest of the world is in a recovery phase from recession at that point in time. But if the market is in the throes of ‘risk off’ forces at that point, there could be non-linear outcomes as we can imagine the focus then shifting to USD shortages and global risk aversion, thereby boosting the greenback. But this debt limit element has many months to play out yet and is not an immediate issue.”
-
08:36
Natural Gas Futures: Further decline not favoured
Considering advanced prints from CME Group for natural gas futures markets, open interest reversed two daily builds in a row and shrank by around 6.8K contracts on Tuesday. Volume followed suit and dropped by around 56.5K contracts after two consecutive daily gains.
Natural Gas keeps targeting the $7.20 region
Tuesday’s strong retracement in prices of natural gas was amidst shrinking open interest and volume, leaving the prospects for further pullbacks somewhat diminished for the time being. Against that, the next hurdle of note remains at the area of recent highs around the $7.20 mark per MMBtu.
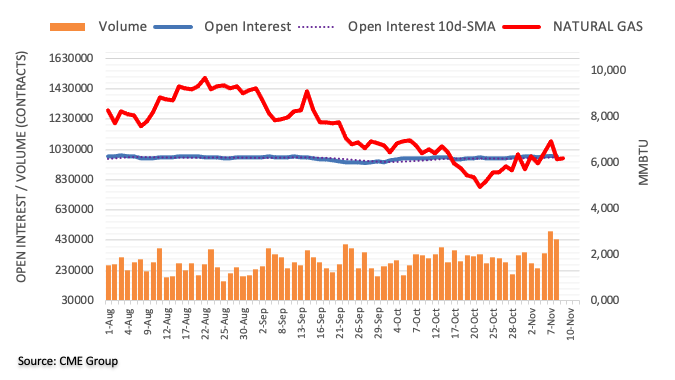
-
08:34
USDKRW set to reach the 1,450 mark by end-2022 – ANZ
Economists at ANZ bank see the recent rebound in the KRW as temporary and expect it to weaken towards 1,450 against the Dollar by end-2022.
A widening yield differential in favour of the US will keep the KRW weak
“Although the KRW managed to rebound in the past week on the back of a pullback in the DXY and as concerns over credit stress domestically ease, we see this as a temporary recovery and expect the Won to weaken towards 1,450 by end-2022.”
“Aside from a challenging current account outlook, a sharp tightening in financial conditions to levels last seen during the Global Financial Crisis signal the potential for a sharp growth slowdown in the coming quarters. These downside growth risks suggest the BoK will end their monetary policy tightening cycle with a much lower policy rate compared to the US Fed (3.50% vs 5.00% by Q1 2023). A widening yield differential in favour of the US will keep the KRW weak, at least in the near term.”
“Further out, however, there are reasons to believe that 2022 will mark the worst of South Korea’s BoP pressure. While we expect the current account surplus to shrink further in 2023, there is scope for a sharper improvement in the financial account.”
-
08:24
Silver Price Analysis: XAGUSD flirts with key 200-day SMA barrier, around mid-$21.00s
- Silver regains some positive traction following the overnight pullback from a multi-month peak.
- RSI (14) on the daily chart warrants caution for bulls and before positioning for additional gains.
- Any meaningful corrective pullback could be seen as a buying opportunity and remain limited.
Silver attracts some dip-buying near the $21.25 area on Wednesday and climbs back to the very important 200-day SMA during the early European session. The white metal, however, remains below the highest level since June 22 touched the previous day and is currently placed around the mid-$21.00s.
Looking at the broader picture, the overnight sustained breakout through the $21.00 mark was seen as a fresh trigger for bullish traders. That said, RSI (14) on the daily chart has moved on the verge of breaking into the overbought territory. This makes it prudent to wait for a sustained strength beyond a technically significant moving average before positioning for any further near-term appreciating move.
The XAGUSD might then accelerate the momentum and aim to reclaim the $22.00 round-figure mark. The next relevant hurdle is pegged near the $22.30-$22.35 region, which is closely followed by the June swing high, around mid-$22.00s. The latter should act as a key pivotal point and a tough nut to crack for bulls. That said, some follow-through buying will set the stage for an extension of the bullish trajectory.
On the flip side, any meaningful pullback now seems to find decent support around the $21.00 mark. Any subsequent fall could be seen as a buying opportunity and remain limited near the mid-$20.00s, or the overnight swing low. Failure to defend the said support levels might negate the near-term positive bias and make the XAGUSD vulnerable to dropping back to test levels below the $20.00 psychological mark.
Silver daily chart
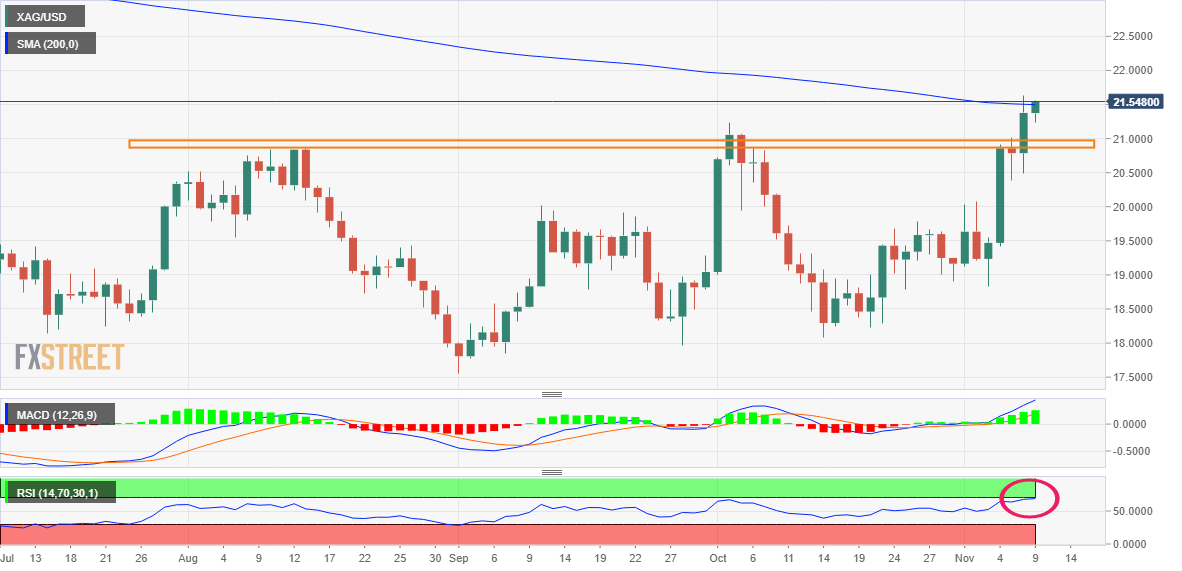
Key levels to watch
-
08:17
US: Upside Core CPI surprise to lead the USD higher again – Credit Suisse
The main focus is still on tomorrow’s US Consumer Price Index (CPI) report. If Core inflation beats expectations, the US Dollar could edge higher again, economists at Credit Suisse report.
Core goods inflation to be close to flat
“We are looking for core goods inflation to be close to flat as it was last month while expecting core inflation to rise 0.4% m/m and headline inflation to rise 0.5% MoM, modestly below consensus. Improved supply chains and weaker demand likely play a role on this front. We also expect recent hot points like transportation services and health insurance to ease substantially.”
“The problem from our strategy perspective remains that it does not appear quite so clear to us that headline inflation will decline materially given high food and energy prices, while we are also unconvinced that shelter inflation is slowing quickly.”
“The worst-case outcome for markets would be core inflation that beats expectations not due to shelter (which can easily be written off as lagging), but instead a broad set of fast-rising prices across different categories. Given that expectations for a 75 bps Fed hike next month are already largely priced out, there is a risk that such a surprise would prompt the market to price at least a 50% chance of that outcome again, which would both upset asset prices and lead the USD higher again.”
-
08:09
USDJPY: Close below 144.60/50 to clear the way for a fall to 140.35/30 – Credit Suisse
Economists at Credit Suisse maintain their view we have already seen an important top in USDJPY at the core target of 147.62/153.01. Thus, the pair could suffer a substantial drop to 140.35/30.
Sustained closing break above 153.01 to curtail thoughts of looking for a top
“USDJPY extends its consolidation after achieving and rejecting the upper end of our long-term objective at 147.62/153.01 – the 32.8% retracement of the fall from 1982 and the price high of 1998. We maintain our base case of looking for a potentially important top here. We thus look for a fall back to 145.12, then the 55-day average at 144.60/50.”
“A close below 144.60/50 can further reinforce thoughts of a top and a fall to 140.35/30 next, the 23.6% retracement of the 2021/2022 uptrend and late September low.”
“A direct and sustained closing break above 153.01 though would curtail immediate thoughts of looking for a top with resistance then seen next at the 160.33 high of 1990.”
-
08:04
Fed’s Williams: Relatively stable long-term inflation expectations are good news
New York Federal Reserve (Fed) President John Williams made some comments on inflation expectations in the text of a speech to be delivered to an audience in Zurich.
Additional quotes
“Relatively stable long-term inflation expectations are good news.”
“Surprising how much of the public expects deflation.”
Market reaction
The above comments failed to move the needle around the US Dollar when compared with six major currencies. The US Dollar Index is trading almost unchanged on the day at 109.65, at the time of writing.
-
07:59
US Midterms Elections: Are FX markets awaiting USD volatility or ignoring the subject? – Commerzbank
Markets turn cautious while awaiting US Midterm Elections results. On one hand, volatility could rise once results become clearer. On the other hand, one could argue that the subject is not important to the FX market, economists at Commerzbank report.
What really matters and what does not
“The results of the US midterm elections are beginning to come in one by one and the USD exchange rates are not moving. One might argue that this was the ‘calm before the storm’ and come to the conclusion that the realised USD volatility will be increasing once it becomes clear who will hold the majority in Congress.”
“However, one could also come to the conclusion that the subject is of little interest to the FX market and that it was only discussed so intensively in an FX context because writers had to fill the gap until the next really important event for the USD exchange rates came along (the US inflation data on Thursday).”
-
07:57
GBPUSD to see a deeper but still corrective recovery – Credit Suisse
GBPUSD needs to remove 1.1565 to see its downtrend from February break to clear the way for a deeper but still corrective recovery back to 1.1739, analysts at Credit Suisse report.
Potential to reach the 38.2% retracement of the 2021/2022 fall at 1.1838
“GBPUSD remains capped below its downtrend from February, currently seen at 1.1565, but with weekly MACD momentum having turned higher, our bias remains for a break above here and then the 1.1647 recent high for a deeper recovery to the 1.1739 September high, potentially the 38.2% retracement of the 2021/2022 fall at 1.1838, but with this 1.1739/1.1838 zone expected to prove a tough barrier.”
“Below 1.0933/16 stays seen needed to see the risk turn directly lower again for a move back to the 1.0347 low.”
-
07:43
USDJPY: Dollar easing might continue, a case of incredibly good luck for the MOF – Commerzbank
USDJPY has eased significantly. Of course, that is not thanks to the Japanese currency policy. The Yen was unable to gain much against the Dollar; USDJPY eased in line with the entire USD index. Thus, the MOF has been incredibly lucky, economists at Commerzbank report.
A case of incredible luck for the Japanese Ministry of Finance
“USDJPY eased because of USD weakness not because of JPY strength. This trend might well continue. So far, I had only expected to see USD weakness from Q1/2023. At present, it looks more as if it was going to take hold now. In that case, the MOF would have been incredibly lucky.”
“Anyone who does not share my USD view and expects a new period of USD strength on the other hand is likely to consider USDJPY to constitute the ideal target for USD longs.”
-
07:35
EURUSD: Scope for a recovery to 1.0350/90 – Credit Suisse
EURUSD has extended its recovery and with weekly MACD momentum having already also turned higher, economists at Credit Suisse see scope for a deeper recovery, potentially back to 1.0350/90.
Weekly MACD momentum has crossed higher
“With weekly MACD momentum turning higher and with resistance from the 55-day average and downtrend from February broken we see scope for a deeper recovery to 1.0198/1.0201, potentially the key price pivot at 1.0350/90. With the falling 200-day average not far above at 1.0460, we would expect this to prove a major barrier.”
“Below 0.9704 stays needed to reassert the core downtrend for a fall back to support at 0.9592/37, with support then seen next at 0.9331/03.”
-
07:31
China will not catch up with the United States – Natixis
One stated aim of China’s economic policy is to become the world’s leading economic power, in theory by 2049. But this will not happen. In actual fact, China will lose ground to the United States, according to analysts at Natixis.
China will grow less than the United States
“China will grow less than the United States due to: Population ageing (which will lead China’s labour force to decline by 33% relative to the United States by 2050); Declining labour productivity, due to labour force ageing and the preference accorded to state-owned enterprises; Structural excess savings, due in particular to real estate wealth loss.”
“One could think that US GDP will grow at least 30% more than China’s out to 2050, in constant dollars.”
-
07:25
EURGBP consolidates in a range above 0.8700 mark, bias seems tilted in favour of bulls
- EURGBP lacks any firm intraday direction and remains confined in a narrow trading band.
- Talks for aggressive policy tightening by the ECB underpin the Euro and offers support.
- The BoE’s gloomy outlook could weigh on the British Pound and favour bullish traders.
The EURGBP cross struggles to capitalize on the previous day's modest gains and oscillates in a narrow trading band, just above the 0.8700 mark through the early European session on Wednesday.
Talks of a more aggressive policy tightening by the European Central Bank (ECB) continue to benefit the shared currency and offer support to the EURGBP cross. In fact, several ECB policymakers said that higher rates are needed for longer to bring down double-digit inflation in the Eurozone back to its 2% target. This, in turn, pushes the rate-sensitive two-year German bond yield to its highest since December 2008 and is seen acting as a tailwind for the Euro.
The British Pound, on the other hand, draws support from the recent slump in the US Dollar and keeps a lid on the EURGBP cross. That said, the Bank of England's gloomy outlook for the UK economy should undermine the Sterling and supports prospects for some upside for the cross. It is worth recalling that the UK central bank forecasts a recession to last for all of 2023 and the first half of 2024 while indicating a lower terminal peak than is priced into markets.
The fundamental backdrop suggests that the path of least resistance for the EURGBP cross is to the upside and any slide below the 0.8700 round figure could be seen as a buying opportunity. Bulls, however, might wait for a sustained strength beyond the 0.8775-0.8780 resistance zone before placing fresh bets amid absent relevant market-moving economic releases. The market focus now shifts to the release of the Preliminary UK Q3 GDP report on Friday.
Technical levels to watch
-
07:16
Forex Today: Markets turn cautious while awaiting US Midterm Elections results
Here is what you need to know on Wednesday, November 9:
As investors keep a close eye on the outcome of the US Midterm Elections, the market mood turns cautious in the early trading hours of the European session on Wednesday. The US Dollar Index recovers modestly while holding below 110.00 following Tuesday's sharp decline and US stock index futures trade in negative territory. September Wholesale Inventories will be the only data featured in the US economic docket and it's not expected to trigger a noticeable reaction ahead of Thursday's key inflation report. The impact of the US Midterm Elections could impact the risk sentiment and drive the currencies' action in the second half of the day.
According to The Associated Press, Republicans currently have 47 seats and Democrats have 46 seats in the Senate. The party with 51 seats, in the end, will have control of the Senate. On the other hand, Democrats have lost 3 House seats and currently have 159, against 190 seats by Republicans. 218 seats are needed to gain the majority in the House.
US Midterm Election Update: Republicans leading in tight contests.
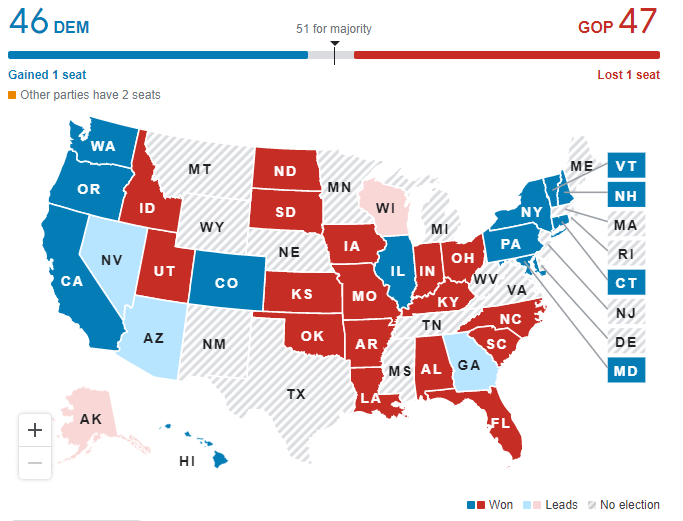
Source: The Associated Press
Wall Street's main indexes registered strong gains on Tuesday and the US Dollar continued to weaken against its rivals with the US Dollar Index falling to its weakest level since late September below 109.50. Meanwhile, the benchmark 10-year US Treasury bond yield holds steady above 4.1% despite having lost more than 2% on Tuesday.
EURUSD preserved its bullish momentum and closed the third straight trading day in positive territory on Tuesday before going into a consolidation phase below 1.0100. European Central Bank (ECB) policymaker Joachim Nagel said on Tuesday that large rate hikes are still necessary for the eurozone and ECB Vice Vice President Luis de Guindos noted that quantitative tightening will start "sooner or later," helping the Euro hold its ground against the US Dollar.
GBPUSD took advantage of the broad-based selling pressure surrounding the US Dollar and climbed above 1.1600 for the first time in 10 days on Tuesday. The pair, however, lost its traction and retreated below 1.1550 early Wednesday.
Fueled by the sharp decline witnessed in the US T-bond yields, Gold price gained more than 2% and reached a fresh multi-week high above $1,710 on Tuesday. XAUUSD consolidates its weekly gains but holds comfortably above $1,700.
USDJPY extended its weekly slide and broke below 146.00 on Tuesday. The pair stays relatively quiet early Wednesday and fluctuates above 145.50.
Bitcoin lost nearly 10% and slumped to its weakest level since mid-June at $17,500 on Tuesday. Although BTCUSD managed to erase a portion of its losses later in the day, it failed to stage a convincing rebound and was last seen losing 1% on the day at around $18,300. Ethereum fell 15% on Tuesday and is already down 3% early Wednesday, trading slightly below $1,300.
Binance acquires FTX to bring an end to FTT-induced FUD.
-
07:06
USDJPY aims to regain 146.00 amid firmer yields, US midterm election jitters
- USDJPY rebounds from a two-week low to print the first positive day in four.
- Treasury yields reverse the previous day’s losses as fears of US government gridlock join recession woes, China covid concerns.
- Japan’s current account surplus slumps in the H1 fiscal year but improved in September.
- US inflation, updates from mid-term elections will be crucial for near-term directions.
USDJPY prints a mild recovery from a two-week low around 145.70-80 during early Wednesday morning in Asia. In doing so, the Yen pair snaps a three-day downtrend amid the market’s cautious mood.
That said, sentiment fades the previous optimism as the latest updates from the US mid-term elections suggest the US government gridlock. With this, the fears of higher rates also gain attention amid the Republican push for increasing the debt ceiling.
Elsewhere, the worsening coronavirus conditions in China also contribute to the latest risk-aversion, as well as to the USDJPY prices at a distance. China reports the highest levels of new COVID cases in six months, with the latest addition of 8,335 for November 08, while marking a fresh virus-led lockdown in Guangzhou’s second district.
It should be noted that Japan reported a notable monthly Current Account surplus for September but failed to ignore the heaviest decline in the surprise when considered for the first half (H1) of the current fiscal year (FY) since 2008. Additionally, talks of Bank of Japan’s (BOJ) meddling and the recently softer US data joined mixed concerns at the Fed to escalate the US Treasury yields and the USDJPY prices of late.
Amid these plays, the US 10-year Treasury yields regain upside momentum past 4.14% while the two-year counterpart also print mild gains near 4.66% level. It should be noted that the US stock future print mild losses while the Asia-Pacific equities closed in the red despite Wall Street’s three-day uptrend.
Moving on, political and covid updates may entertain USDJPY traders ahead of Thursday’s US Consumer Price Index (CPI) for October.
Technical analysis
The 50-DMA defends USDJPY buyers around 145.50 but the recovery needs validation from a three-week-old resistance line near 147.45.
-
07:01
Sweden Industrial Production Value (MoM) up to 1.3% in September from previous -6.4%
-
07:01
Denmark Trade Balance fell from previous 35B to 32.1B in September
-
07:01
Sweden New Orders Manufacturing (YoY) increased to 4.8% in September from previous -0.6%
-
07:00
Sweden Industrial Production Value (YoY): 4.1% (September) vs 2.1%
-
07:00
Denmark Current Account fell from previous 41.7B to 38.3B in September
-
07:00
Gold Price Forecast: XAUUSD to regain bullish traction a a daily close above 100DMA at $1,717
Gold price is turning lower in early Wednesday’s trading. Will the yellow metal reclaim the critical 100-Daily Moving Average resistance at $1,717? FXStreet’s Dhwani Mehta analyzes XAUUSD’s chart.
The $1,700 mark could offer strong support
“The 14-day Relative Strength Index (RSI) still holds above the midline, suggesting that the pullback is likely to be temporary and could offer a good buying opportunity to traders who might have missed out on the recent rally.”
“Daily closing above the critical 100DMA is needed to unleash further upside toward the October high at $1,730. The immediate resistances, however, are seen at the $1,710 round figure and the multi-week highs at $1,717.”
“On the downside, the $1,700 mark could offer strong support, below which a sharp drop toward the 50DMA at $1,674 cannot be ruled out. Ahead of that, the previous week’s high at $1,683 could come to the rescue of bulls.”
-
06:55
Gold Price Forecast: XAUUSD trades with modest losses, downside seems cushioned
- Gold retreats from over a one-month high touched on Tuesday amid a modest USD uptick.
- Reviving safe-haven demand offers support to the XAUUSD and helps limit the downside.
- Bets for less aggressive Fed rate hikes support prospects for the emergence of dip-buying.
Gold edges lower on Wednesday and reverses a part of the previous day's breakout rally to a more than one-month high. The XAUUSD remains on the defensive through the early European session, albeit manages to hold its neck above the $1,700 round-figure mark.
The US Dollar attracts some buying and moves away from its lowest level since September 20 touched the previous day, which, in turn, is seen as a key factor weighing on the dollar-denominated gold. Despite rising bets for a less aggressive policy tightening by the Fed, the markets are still pricing in the possibility of at least a 50 bps rate hike in December. This remains supportive of elevated US Treasury bond yields and offers some support to the greenback.
That said, the cautious market mood extends some support to the safe-haven gold and might limit further losses, at least for the time being. Investors turn cautious amid growing worries about a deeper global economic downturn and uncertainty over the results of the US mid-term elections. Traders might also prefer to move to the sidelines ahead of the crucial US consumer inflation figures, due for release on Thursday. This, in turn, warrants some caution for bearish traders.
From a technical perspective, the overnight sustained breakout through a multi-month descending trend-line hurdle, around the $1,680-$1,682 supply zone, marked a fresh bullish breakout. This, in turn, supports prospects for the emergence of some dip-buying around gold. In the absence of any relevant market-moving economic data from the US, traders on Wednesday will take cues from speeches by New York Fed President John Williams and Richmond Fed President Thomas Barkin. Apart from this, the US bond yields will influence the USD and provide some impetus to the XAUUSD.
Technical levels to watch
-
06:43
USDCHF Price Analysis: Recovery remains elusive below 0.9945 resistance confluence
- USDCHF picks up bids to print the first daily gains in four.
- Easing bearish bias of the MACD, clear bounce off fortnight-old support keeps buyers hopeful.
- Weekly resistance line challenge intraday buyers ahead of the key hurdle comprising 200-SMA, 50% Fibonacci retracement level.
USDCHF extends the previous day’s rebound from a fortnight-old support area to 0.9870 during early Wednesday morning in Europe. In doing so, the Swiss currency (CHF) pair jostles with a downward-sloping resistance line from the last Friday.
Given the quote’s successful rebound from the short-term key support area surrounding 0.9840, coupled with the recently easing bearish bias of the MACD, the USDCHF prices are likely to remain firmer.
As a result, the quote may overcome the immediate trend line hurdle near 0.9875, which in turn could allow buyers to aim for the 61.8% Fibonacci retracement level of the pair’s late September-October upside, close to 0.9900.
It should, however, be noted that a convergence of the 200-SMA and the 50% Fibonacci retracement level, near 0.9945, appears a tough nut to crack for the USDCHF bulls and trigger the pullback afterward.
If the quote remains firmer past 0.9945, the odds of witnessing a run-up toward the parity level can’t be ruled out.
Alternatively, the aforementioned horizontal support near 0.9840 restricts short-term USDCHF declines, a break of which could direct the bears towards the previous monthly low near 0.9780 and then to the 0.9740 level comprising the late September swing low.
USDCHF: Four-hour chart
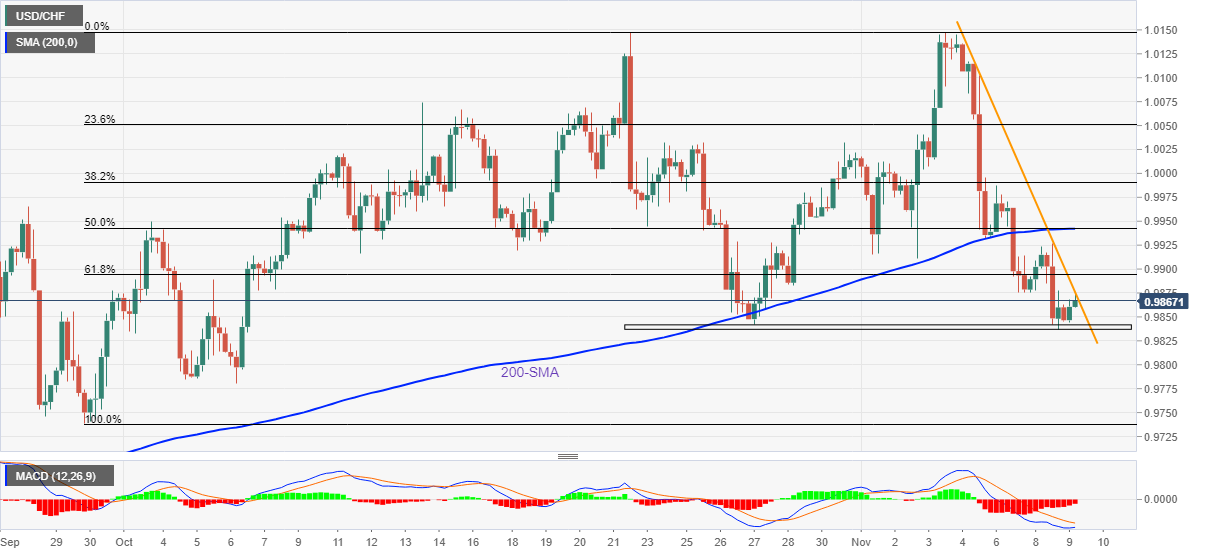
Trend: Limited recovery expected
-
06:42
Crude Oil Futures: A near-term bounce not ruled out
Open interest in crude oil futures markets shrank for the second straight session on Tuesday, now by nearly 7K contracts according to preliminary readings from CME Group. On the other hand, volume remained choppy and went up by around 77.4K contracts.
WTI: Upside remains capped by $93.00 and above
Tuesday’s moderate downtick in prices of the WTI was amidst declining open interest, which removes strength from a potential deeper decline. Against that, there are chances of a rebound in the very near term and with the immediate up barrier at recent peaks past the $93.00 mark per barrel.
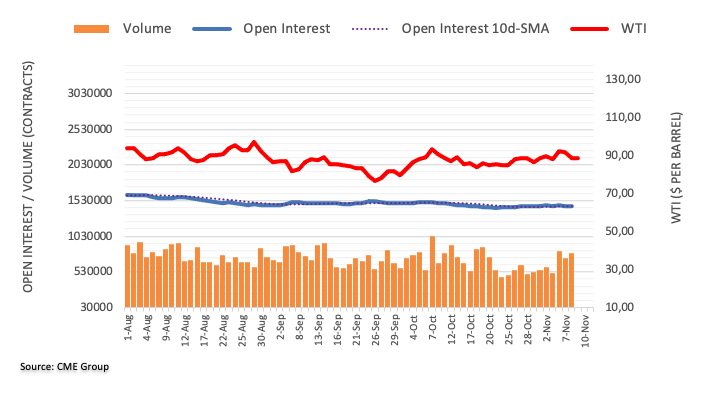
-
06:40
FX option expiries for Nov 9 NY cut
FX option expiries for Nov 9 NY cut at 10:00 Eastern Time, via DTCC, can be found below.
- EUR/USD: EUR amounts
- 1.0000 302m
- GBP/USD: GBP amounts
- 1.1575 362m
- USD/JPY: USD amounts
- 147.00 543m
- USD/CAD: USD amounts
- 1.3520 830m
-
06:30
Gold Futures: Scope for extra gains
CME Group’s flash data for gold futures markets noted open interest increased for the second session in a row on Tuesday, this time by nearly 11K contracts. Volume followed suit and resumed the uptrend, rising by almost 126K contracts, the largest single-day build since July 12.
Gold now targets $1,730
Prices of the ounce troy of gold surpassed (and closed above) the $1,700 mark on Tuesday. The daily advance was on the back of rising open interest and volume and leaves the door open to the continuation of the recovery in the very near term. That said, the next hurdle of note now comes at the October peak around $1,730 (October 4).
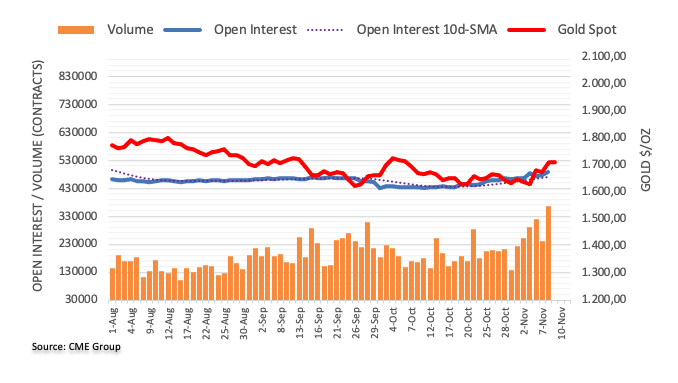
-
06:19
AUDUSD portrays market’s anxiety near 0.6510 key hurdle, US politics, inflation in focus
- AUDUSD prints mild losses around six-week high, snaps three-day uptrend.
- Fears of US government gridlock, pessimism surrounding China’s covid conditions and softer inflation data weigh on prices.
- Risk appetite remains sluggish ahead of the key data/events, bears are likely to retake control.
AUDUSD aptly justifies its risk-barometer status as it prints the first daily loss, so far, in four days amid political and/or covid updates. That said, the Aussie pair remains depressed around 0.6490, mildly offered heading into Wednesday’s European session.
A tug-of-war between the Republicans and Democrats has so far failed to provide any meaningful signals for the mid-term elections. Even so, fears of a government gridlock keep the sentiment sour of late.
Also weighing on the market’s risk appetite are the fresh virus-led lockdowns in China and the multi-month high covid numbers. Recently, China reports the highest levels of new COVID cases in six months, with the latest addition of 8,335 for November 08, while marking a fresh virus-led lockdown in Guangzhou’s second district.
Elsewhere, fresh pick-up of the US Treasury yields and the latest fall in the S&P 500 Futures, after hearing the fresh victory of John Fetterman, a Democrat, of the race for Senate in Pennsylvania.
It should be noted that the downbeat China inflation figures for October teased bears earlier in Asia.
To sum up, the risk-off mood and a light calendar ahead of Thursday’s Consumer Price Index (CPI) keep AUDUSD bears hopeful.
Technical analysis
AUDUSD retreats from a convergence of the 50-DMA and a five-week-old resistance line, around 0.6510, which in turn joins the recently bearish MACD signal to tease bears targeting the 21-DMA support near 0.6370.
-
06:07
WTI declines below $88.00 amid headwinds of US recession and China’s Covid worries soar
- A significant rise in the US oil and gasoline stockpiles has impacted oil prices.
- Goldman Sachs noted that the chances for the US shifting into recession stand at 35%.
- A decline in China’s inflation rate may push the PBOC to policy easing ahead.
West Texas Intermediate (WTI), futures on NYMEX, have displayed a vertical fall after failing to sustain above the psychological support of $90.00. The oil prices have slipped sharply below $88.00 as oil stockpiles reported by the US American Petroleum Institute (API) have accelerated last week. Also, growing US recession worries and a strong resurgence of Covid-19 in China have raised concerns over oil demand prospects.
Meanwhile, the US dollar index (DXY) has displayed a less-confident pullback after printing a fresh seven-week low at 109.35. The DXY is expected to remain on the tenterhooks as investors have shifted their focus toward the inflation figures and the outcome of the mid-term elections.
On Tuesday, the US API agency reported a build-up of oil stockpiles by 5.6 million barrels for the week ending November 4. Also, gasoline inventories rose by about 2.6 million barrels. Subdued demand in the US economy for oil has weighed significant pressure on oil prices.
Meanwhile, analysts at Goldman Sachs noted that the chances of the US economy entering into a recession in the next year stand at 35%. The reasoning behind escalating recession fears is the extreme deviation in desired inflation target and current inflation rate, aggressive Fed policy tightening, and exceptionally uncertain conditions in terms of domestic US politics and geopolitics.
In China, the administration’s failure in containing the resurgence of Covid-19 cases has trimmed oil demand projections. Odds for China’s reopening have shifted to the back foot as the government is carry-forwarding its no-tolerance approach and the extent of cases is not displaying a similar correlation.
In Tokyo, China’s inflation rate for October significantly dropped to 2.1%. This might result in monetary easing by the People’s Bank of China (PBOC), which might support the oil prices.
-
05:49
GBPUSD Price Analysis: Treads water inside weekly bullish trend channel above 1.1500
- GBPUSD struggles to defend the four-day uptrend inside a bullish formation.
- Sustained break of fortnight-old resistance line keeps buyers hopeful.
- Steady RSI also underpins bullish bias, 200-HMA adds to the downside filters.
GBPUSD seesaws around mid-1.1500s, taking offers to 1.1535 during the early Wednesday morning in Europe. In doing so, the Cable pair struggles inside a four-day-old bullish channel.
However, the quote’s sustained break of the previous resistance line from October 26, as well as beyond the 200-HMA, keeps the buyers hopeful. Also favoring the upside bias is the firmer RSI (14), not overbought.
That said, the quote’s latest weakness may aim for the resistance-turned-support line of 1.1520 before challenging the bullish channel’s trough surrounding 1.1500.
Following that, the 200-HMA level near 1.1450 could act as the last defense of the GBPUSD buyers before giving control to the bears targeting the monthly low of 1.1147.
It should be noted that the GBPUSD weakness past 1.1147 won’t hesitate to challenge the previous monthly low of 1.0923.
On the flip side, October’s peak near 1.1645 guards the quote’s immediate recovery moves before the upper line of the stated channel, close to 1.1655 at the latest.
In a case where the GBPUSD price rallies beyond 1.1655, the buyers can challenge September’s peak near 1.1740.
GBPUSD: Hourly chart
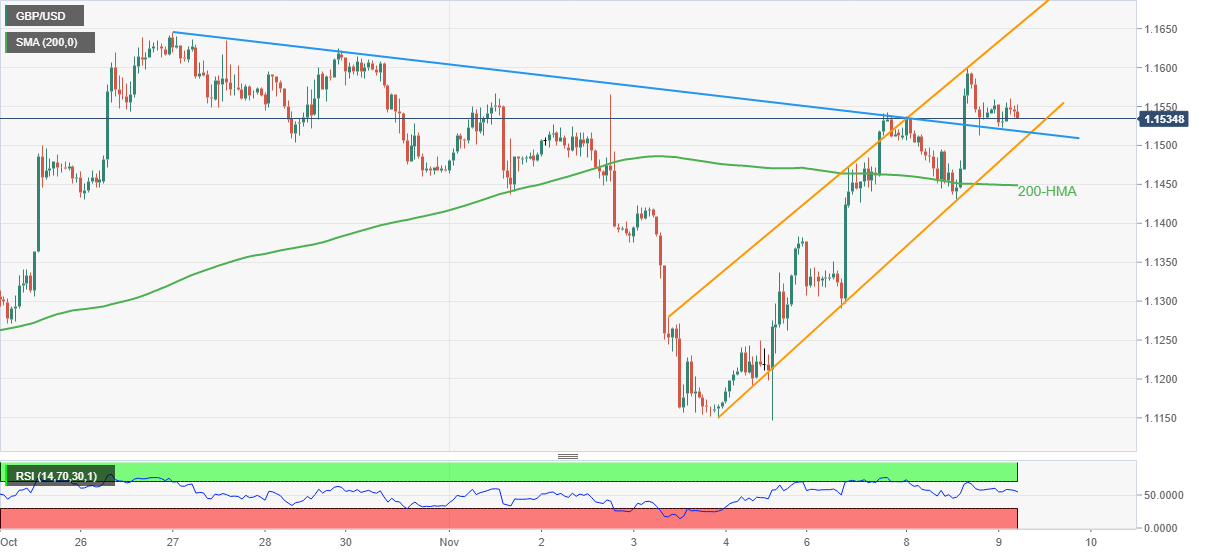
Trend: Further upside expected
-
05:43
EURUSD Price Analysis: Inventory adjustment around 1.0100 signals more upside ahead
- An inventory adjustment process around the critical resistance of 1.0100 bolsters the odds of a breakout.
- Market mood has turned quiet ahead of US Inflation/Mid-term elections outcome.
- Advancing 20-and 50-EMAs add to the upside filters.
The EURUSD pair is displaying back-and-forth moves in a narrow range below the critical hurdle of 1.0100. The asset has turned sideways as investors are awaiting the release of the US inflation data for informed decisions ahead.
Quiet market mood has also sidelined the US dollar index (DXY). The DXY is oscillating in a 109.47-109.79 range and is expected to continue its lackluster performance till the outcome of the US mid-term elections and inflation numbers.
On an hourly scale, the asset has shifted into a rangebound structure, which indicates an inventory adjustment phase for a vertical move. Odds are favoring a rally after an inventory adjustment break as the prior trend has remained north-side.
Advancing 20-and 50-Exponential Moving Averages (EMAs) at 1.0056 and 1.0014 respectively add to the upside filters.
Meanwhile, a corrective move in the asset has dragged the Relative Strength Index (RSI) (14) near 60.00, however, the upside bias is still intact.
Breakouts are not a cakewalk, therefore mild corrections are considered healthy after testing the potential resistance. An optimal buying opportunity should be around the 20-EMA at 1.0056, which would drive the asset towards the round-level resistance at 1.0100, followed by September 23 high around 1.0200.
On the flip side, the Euro bulls could lose momentum if the asset drops below Tuesday’s low at 0.9971. An occurrence of the same will unleash the Greenback bulls for a downside move towards Monday’s low at 0.9900 and November 1 low at 0.9853.
EURUSD hourly chart
-638035693774320793.png)
-
05:31
Japan’s Goto: Desirable for FX to move stably reflecting fundamentals
Japanese Economy Minister Shigeyuki Goto said on Wednesday, it is “desirable for FX to move stably reflecting fundamentals.”
He further said that there is “no plan to compile the third extra budget.”
His comments come after Japan’s Ministry of Finance (MOF) announced on Tuesday that the country’s cabinet approved a second supplementary budget for this fiscal year to fund an economic stimulus package, backed by extra new debt.
Market reaction
USDJPY is trading listlessly at around 145.65, at the time of writing.
-
05:25
USDCAD struggles above 1.3400 despite softer oil prices, US midterm election updates in focus
- USDCAD seesaws around multi-day low, picks up bids of late.
- Challenges to sentiment from the US election results, China’s covid conditions test USDCAD bears.
- DXY rebound, higher inventories weigh on oil prices.
- Risk catalysts eyed for directions ahead of US CPI, speech from BOC’s Macklem.
USDCAD grinds near 1.3450 heading into Wednesday’s European session amid dicey markets. The anxiety over US government gridlock joins covid fears from China and a cautious mood ahead of the key data/events to restrict the Loonie pair’s latest moves.
That said, softer prices of Canada’s key export item, namely the WTI Crude Oil, tease the USDCAD bulls. The energy benchmark drops for the third consecutive day down 0.85% intraday near $87.75 by the press time.
Also read: WTI bears attack $88.00 as concerns over China’s demand, US midterm elections join API inventory build
Elsewhere, the US Dollar Index (DXY) prints mild gains around 109.70 amid the escalating fears of the US government gridlock due to the latest updates from the mid-term elections. Also fueling the market’s fears and the USDCAD prices could be the headlines suggesting a six-month high covid number from China and further virus-led lockdowns.
While portraying the market’s mood, the S&P 500 Futures struggle to track Wall Street’s gains while the US 10-year Treasury yields probe bears after snapping a four-day downtrend the previous day.
It should be noted, however, that the anxiety ahead of Thursday’s US Consumer Price Index (CPI) for October and a speech from the Bank of Canada (BOC) Governor Tiff Macklem challenge the pair buyers. The reason could be linked to the recently mixed US data and Fedspeak, as well as the BOC’s easing in the rate hikes.
Also read: US Inflation Preview: Markets set to seize on falling Core CPI to revive pivot play, three scenarios
Technical analysis
A one-week-old descending trend line portrays the USDCAD pair’s recent weakness. Also keeping the sellers hopeful are the bearish MACD signal and the clear break of the previous support line from early October. Additionally, the pair’s sustained trading below the 200-SMA also adds strength to the downside bias.
-
05:17
NZDUSD Price Analysis: Seeks mean reversion to 20-EMA, 0.6000 a critical hurdle
- Anxiety ahead of the US inflation data has dragged the asset from the psychological resistance of 0.6000.
- Overall optimism in the market may provide support to the asset around the 20-EMA.
- The RSI (14) is still oscillating in the bullish range, which indicates that the upside momentum is still intact.
The NZDUSD pair has turned sideways after failing to cross the immediate hurdle of 0.5960 in the Tokyo session. The risk profile has turned quiet as investors have shifted to the sidelines ahead of the US inflation data.
The US dollar index (DXY) is displaying topsy-turvy moves around 109.70 and is expected to remain on the tenterhooks. Going forward, the outcome of the US mid-term elections and the release of the US inflation will provide a decisive action in the currency market.
On a four-hour scale, the asset is auctioning in a Rising Channel pattern that indicates an upside structure. The upper portion of the chart pattern is placed from October 12 high at 0.5716 while the lower portion is plotted from October 13 low at 0.5512.
The asset has witnessed selling pressure after attempting a break above the psychological resistance of 0.6000. And, the decline move is basically a mean-reversion move and is expected to find support around the 20-period Exponential Moving Average (EMA) at 0.5918. The 50-EMA at 0.5868 is still advancing, which adds to the upside filters.
Meanwhile, the Relative Strength Index (RSI) (14) is oscillating in a bullish range of 60.00-80.00, which indicates that the upside momentum is active.
A corrective move to near the 20-EMA at 0.5918 will present an entry opportunity for the smart money, which will drive the asset towards the psychological resistance of 0.6000, followed by August 29 low at 0.6100.
On the contrary, a downside move below Monday’s low at 0.5863 will put the Greenback bulls in the driving seat and will drag the asset towards the round-level support of 0.5800. A slippage below the latter will open room for more downside towards Thursday’s low at 0.5741.
NZDUSD hourly chart
-638035677909193392.png)
-
05:13
Japan Eco Watchers Survey: Outlook registered at 46.4, below expectations (49.4) in October
-
05:00
Japan Eco Watchers Survey: Current registered at 49.9 above expectations (47.1) in October
-
04:56
GBPJPY Price Analysis: Recovery needs acceptance beyond 168.70
- GBPJPY picks up bids to reverse the previous day’s pullback form weekly top.
- Short-term resistance line, convergence of the key SMAs challenge buyers.
- MACD conditions suggest further hardships for buyers, 165.00 appears a tough nut to crack for the bears.
GBPJPY teases buyers around 168.00 heading into Wednesday’s London open, after snapping a two-day uptrend the previous day.
The cross-currency pair reversed from the convergence of the 50-SMA and 100-SMA on Tuesday before portraying the latest bounce off the 38.2% Fibonacci retracement of the pair’s October 11-31 upside.
It’s worth noting, however, that the receding bullish bias of the MACD challenges the upside bias.
That said, a one-week-old descending trend line, around 168.40 restricts the GBPJPY pair’s immediate upside ahead of the aforementioned SMA confluence near 168.70.
Should the quote manage to remain firmer past 168.70, the odds of witnessing a rally toward September’s high of 172.13 can’t be ruled out.
Alternatively, pullback moves may aim for the 38.2% and 50% Fibonacci retracement levels, respectively near 167.40 and 165.90.
However, the 200-SMA and multiple lows marked since October 14 highlight the 165.15-164.95 region as the key support for the bears to consider breaking before taking control.
Overall, GBPJPY is likely to witness a pullback but stays on the buyer’s radar unless breaking the 164.95 level.
GBPJPY: Four-hour chart
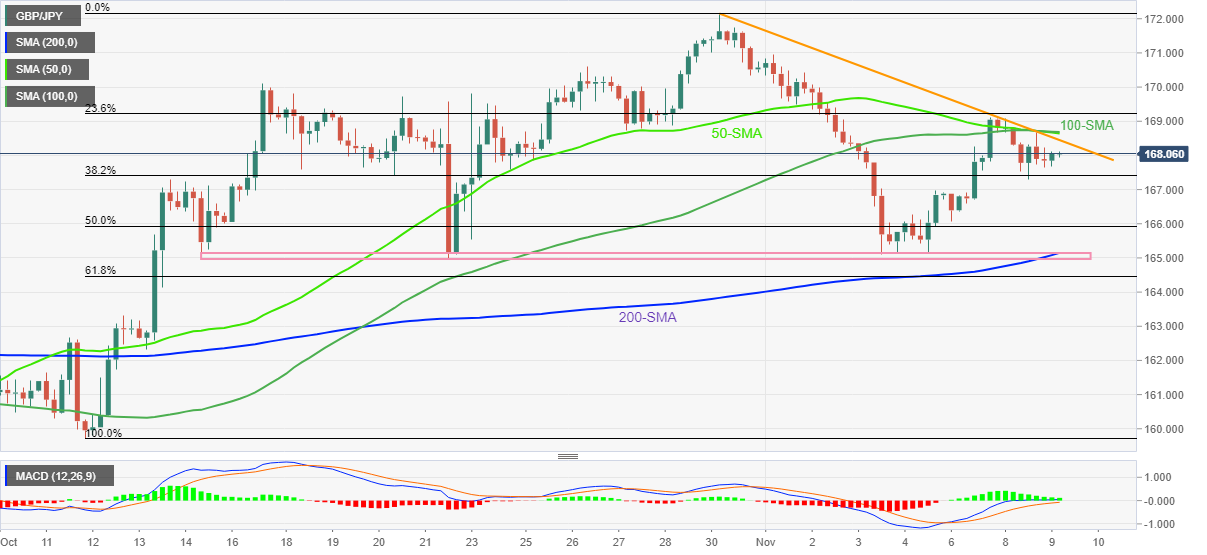
Trend: Pullback expected
-
04:42
USDINR Price News: Finds fresh demand around 81.20 ahead of US Inflation/Mid-term elections outcome
- USDINR has extended its gains to near 81.60 ahead of US mid-elections outcome.
- Lower consumer spending and Fed’s bigger rate hike have trimmed consensus for the US CPI.
- The RBI may opt for a 35 bps rate hike in its December monetary policy meeting.
The USDINR pair is witnessing a significant responsive buying action after dropping to near 81.20 in the Tokyo session. The asset has extended its gains above 81.43 and has printed a day’s high of around 81.60. Escalating uncertainty ahead of the US mid-term elections outcome and the release of the US Consumer Price Index (CPI) data has kept the risk-perceived currencies on the tenterhooks.
The US dollar index (DXY) has recovered after printing a day low at 109.47. For the time being, the DXY has defended its weekly low around 109.35. The risk profile is displaying mixed responses as S&P500 futures are trading with marginal losses after a bullish Tuesday.
Meanwhile, obscurity over the extent of the rate hike by the Federal Reserve (Fed) in its December monetary policy meeting and anxiety ahead of the US inflation data has capped the alpha generated by the US government bonds. The 10-year US Treasury yields are displaying a subdued performance at around 4.14%.
Consensus is favoring a marginal decline in US inflation data as the Fed is continuously hiking interest rates and consumer spending has been dented amid subdued average hourly earnings.
On the Indian rupee front, the consecutive release of retail inflation above the targeted range has forced think tanks to lift consensus for the extent of the rate hike by the Reserve Bank of India (RBI). Economists at Goldman Sachs now expect RBI to raise interest rates by 50 bps, instead of 35 bps, at its MPC meeting next month. Also, RBI Governor Shaktikanta Das may elevate interest rates further by 35 bps in February 2023 vs. the prior projections of 25 bps.
-
04:28
Gold Price Forecast: Bull flag reaffirms XAUUSD strength above $1,680, US midterm results eyed
- Gold price retreats from one-month high but defends a bullish chart pattern.
- Fears of US government gridlock, China covid woes weigh on XAUUSD prices of late.
- US inflation, risk catalysts will be important for fresh impulse.
Gold price (XAUUSD) pares recent gains around a one-month high, pressured near $1,708 during early Wednesday morning in Europe. In doing so,
The bright metal portrays the market’s anxiety amid the early results of the US mid-term elections. However, an immediate bull flag chart pattern keeps the buyers hopeful ahead of the key US Consumer Price Index (CPI) data, up for publishing on Thursday.
Given the escalating fears of the US government gridlock due to the latest updates from the mid-term elections, the US dollar pares losses near the seven-week low while snapping a two-day downtrend. That said, the US Dollar Index (DXY) prints mild gains around 109.70 by the press time.
Additionally weighing the XAUUSD price could be the fresh covid woes from China. That said, China reports the highest levels of new COVID cases in six months, with the latest addition of 8,335 for November 08, while marking a fresh virus-led lockdown in Guangzhou’s second district.
It’s worth noting, however, that the previously downbeat comments from the Fed policymakers and softer US data, as well as the bull flag on the hourly chart, keep the gold buyers hopeful. That said, the S&P 500 Futures struggle to track Wall Street’s gains while the US 10-year Treasury yields probe bears after snapping a four-day downtrend the previous day.
Moving on, gold traders may closely observe political and covid updates for fresh directions ahead of Thursday’s US inflation data. Should the Republicans gain victory in at least one of the two houses, the metal may witness further downside. However, a likely easing in the US CPI could defend buyers afterward.
Technical analysis
Although MACD teases a bear cross as the gold prices step back from the monthly peak, the yellow metal defends the bull flag chart pattern and keeps the buyers hopeful unless the quote stays beyond $1,705 support.
Even if the bullion breaks the $1,705 support, the $1,700 threshold and a one-week-old ascending trend line, near $1,678, could challenge the XAUUSD downside.
Alternatively, an upside clearance of the $1,715 hurdle will trigger a fresh leg toward the north and highlight the theoretical target of $1,765. However, October’s peak of $1,730 and September’s high near $1,735 could test the bulls on their way.
Overall, gold price remains firmer unless breaking the $1,680 support.
Gold: Hourly chart
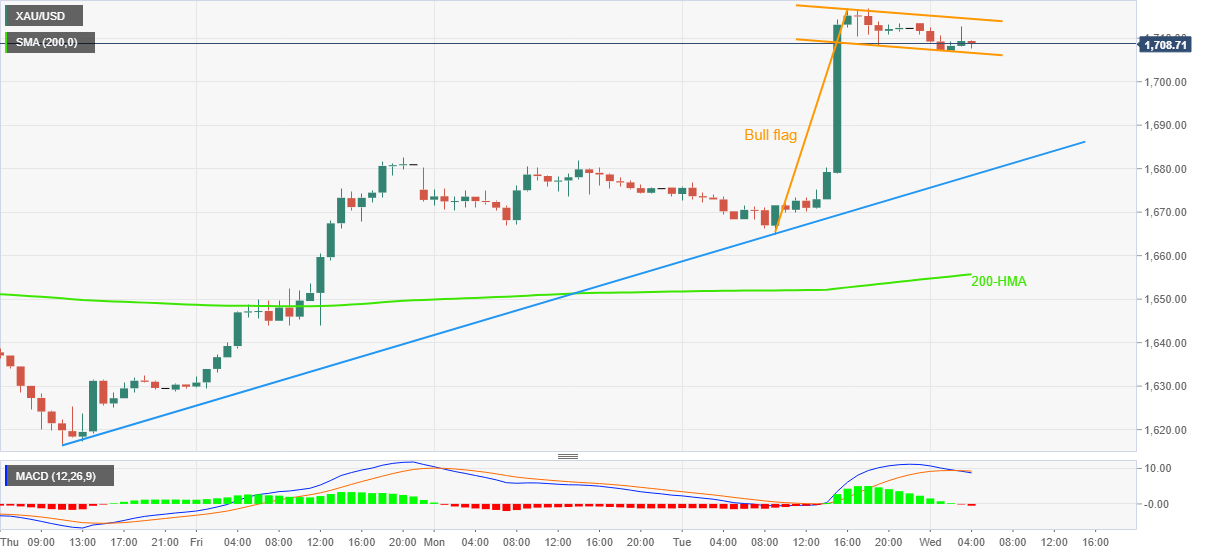
Trend: Further upside expected
-
04:14
US Midterm Election Update: Republicans leading in tight contests
Republicans need a net gain of just one seat in the 2022 midterm election in the United States to win the Senate, as the Bellwether States see a very close call.
In the race for a US Senate seat in Iowa, Republican incumbent Grassley defeated Democratic challenger Franken.
In Missouri, Republican Eric Schmitt defeats Democrat Trudy Busch Valentine for the Republican-held Senate seat.
According to Edison Research Projection, Republicans have gained a net five US House seats previously held by Democrats, with 191 of 435 races still undecided.
Republican Governor Kemp wins re-election in Georgia, per NBC News.
Market reaction
Despite increasing odds of a Republican hold in Congress, the US Dollar Index is catching a fresh bid while rebounding from daily lows. The gauge is trading at 109.70, up 0.06% on the day. Meanwhile, risk sentiment seems to have taken a hit, reflective of the 0.20% drop in the US S&P 500 futures.
-
04:04
USDJPY attempts a rebound near 145.50 amid mix market mood, US CPI buzz
- USDJPY has picked bids around 145.20 as uncertainty soars amid US mid-elections counting.
- A decline in Q3 consumer spending has trimmed short-term inflation expectations.
- Japan officials are discussing an additional budget for economic stimulus and higher taxes for ultra-wealthy individuals.
The USDJPY pair has observed immediate support around 145.20 in the Tokyo session. The downside in the asset below the aforementioned support banks upon anxiety ahead of the US Consumer Price Index (CPI) data, which will release on Thursday.
Meanwhile, the risk impulse is displaying mixed responses as S&P500 futures have turned negative again. Also, the US dollar index (DXY) is defending its seven-week low around 109.35. Similar bets on the 50 basis points (bps) and 75 bps rate expectations in December monetary policy, as per the CME FedWatch tool, have turned the 10-year US Treasury yields sideways around 4.14%.
According to the preliminary estimates, the headline US Consumer Price Index (CPI) is seen lower at 8.0% vs. the prior release of 8.2%. While the core CPI that excludes oil and food prices is expected to decline to 6.5%. It seems that a decline in consumer spending to 1.4% in the second quarter is responsible for inflation-easing projections.
The extent of the rate hike announcement by the Fed chair Jerome Powell will bank upon the size of the change in the price growth levels.
Apart from that, investors are focusing on headlines from US mid-term elections counting. The market’s favorite is Republicans, which could bring political instability in the US economy.
On the Tokyo front, approval of additional economic stimulus by the Japanese administration is still in focus. As reported by Bloomberg, Japan’s Prime Minister Fumio Kishida is set to approve USD198 billion in the additional budget for the economic stimulus plan. The government also “may opt to hike taxes on ultra-wealthy individuals with annual incomes of more than JPY1 billion ($6.8 million).”
-
03:22
AUDUSD Price Analysis: Bulls capitalize a corrective move to the 20-EMA around 0.6500
- Aussie bulls have sensed a decent buying interest around the 20-EMA at 0.6500.
- A recovery in the cheerful market mood has trimmed the DXY’s appeal.
- Declining price growth in China has also supported the antipodean.
The AUDUSD pair has refreshed its day’s high at 0.6518 led by tailwinds of a decline in the US dollar index (DXY) and China’s inflation data. The mighty DXY is declining toward Tuesday’s low at 109.35 as the positive risk profile has strengthened again.
The 10-year US Treasury yields remain steady around 4.14% amid equal odds for the 50 and 75 basis points (bps) rate hike by the Federal Reserve (Fed) in its December monetary policy, as per the CME FedWatch tool.
China’s inflation rate has remained lower at 2.1% than the estimates of 2.4% and the prior release of 2.8%. This has triggered expectations of monetary policy easing by the People’s Bank of China (PBOC). Being a leading trading partner of China, the antipodean will get strengthened.
On an hourly scale, the asset has rebounded after testing the demand zone placed in the 0.6500 area. The 20-period Exponential Moving Average (EMA) at 0.6505 has acted as major support for the counter. Also, the 50-EMA at 0.6473 is continuously advancing, which adds to the upside filters.
Meanwhile, the Relative Strength Index (RSI) (14) is attempting to cross the 60.00 hurdle. An occurrence of the same will trigger an upside momentum.
Should the asset break above Tuesday’s high at 0.6551, Aussie bulls will drive the asset towards the round-level resistance at 0.6600, followed by September 21 high at around 0.6700.
On the flip side, the Greenback bulls will regain control if the asset drops below Monday’s low at 0.6406, which will drag the asset towards October 31 low at 0.6368. A slippage below the latter will exploit the asset to display more downside to near November 3 low at 0.6272.
AUDUSD hourly chart
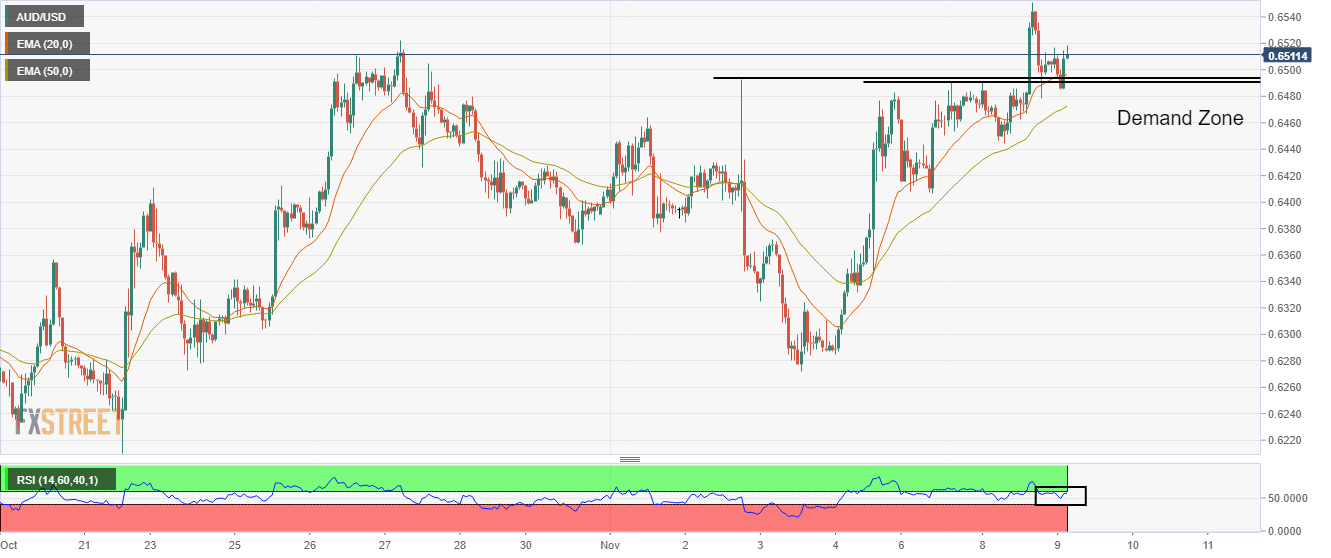
-
03:07
GBPUSD bulls take a breather around 1.1550 with eyes on UK fiscal plan, US mid-term elections
- GBPUSD prints mild gains in a struggle to extend the recent upside near one-week high.
- Chatters surrounding US elections updates, China’s covid woes probe buyers.
- UK PM Sunak’s likely plan to raise top tax rate, recession fears also challenge upside moves.
- US/UK political updates, China’s coronavirus news may entertain traders ahead of Thursday’s US CPI, Friday’s UK Q3 GDP.
GBPUSD seesaws around the mid-1.1500s during the four-day uptrend as bulls and bears jostle amid early Wednesday. While the Cable pair’s previous gains could be linked to the broad US dollar weakness, the recent anxiety in the market appeared to have probed the bulls of late.
Among the key catalysts that challenged the previous risk-on mood are the updates from the US mid-term elections. On the same line are speculations surrounding the UK’s fresh fiscal plan, up for publishing in the next week, as well as China’s covid woes.
Reuters quotes The Telegraph as it said, “British Prime Minister Rishi Sunak is considering expanding the top rate of income tax next week after the Treasury warned that more money was needed to protect pensions and benefits.” The news also mentioned that raising the 45% top rate, or lowering the 150,000 pounds($173,160.00) annual income threshold at which it kicks in are options now being discussed, the newspaper reported, adding the Treasury is looking at increasing the National Insurance rate paid by employers by 1.25 percentage points. While such an action is an open challenge to the Tory manifesto, the UK’s economic conditions are dire and hence taking such steps may not hurt the GBPUSD in total, despite challenging the Cable bulls of late.
It should be noted that Bank of England (BoE) Chief Economist Huw Pill cited recession fears during a panel discussion at the UBS European Conference titled "Global monetary policy challenges," in London. The policymaker also added, “BoE will do what is needed to get inflation back to 2% on a sustainable basis,”
Elsewhere, China reports the highest levels of new COVID cases in six months, with the latest addition of 8,335 for November 08, while marking a fresh virus-led lockdown in Guangzhou’s second district.
Furthermore, the latest polls cited by Reuters suggest that Republicans are favored to win control of the House of Representatives and possibly the Senate, which in turn raises concerns over increasing the US debt ceiling next year. The Republicans are also likely to temper potential Democratic spending and regulations.
Against this backdrop, S&P 500 Futures struggle to track Wall Street’s gains while the US 10-year Treasury yields probe bears after snapping a four-day downtrend the previous day.
Looking forward, risk catalysts are more important for clear directions ahead of Thursday’s key US Consumer Price Index (CPI) for October and the British Gross Domestic Product (GDP) for the third quarter (Q3), up for publishing on Friday.
Technical analysis
GBPUSD takes a U-turn from a downward-sloping resistance line from early September, around 1.1600 by the press time. However, the bullish MACD signals and steady RSI (14) join the pair’s successful trading above the 50-DMA, around 1.1330 at the latest, to keep the buyers hopeful.
-
02:42
USDCAD Price Analysis: Further downside towards 1.3350 seems plausible
- USDCAD remains pressured at the lowest levels in seven weeks.
- Weekly resistance line, bearish MACD signals keep sellers hopeful.
- A convergence of 61.8% Fibonacci retracement, mid-September swing high lures bears.
- Previous support line from early October, 200-SMA also challenge buyers.
USDCAD seesaws around the intraday low as bears take a breather near the seven-week bottom marked the previous day. That said, the Loonie pair makes rounds to 1.3430 during early Wednesday.
A one-week-old descending trend line portrays the quote’s recent weakness. Also keeping the sellers hopeful are the bearish MACD signal and the clear break of the previous support line from early October. Additionally, the pair’s sustained trading below the 200-SMA also adds strength to the downside bias.
Hence, the USDCAD is all set to refresh the multi-day low marked the previous day around 1.3385.
In doing so, a convergence of the 61.8% Fibonacci retracement level of the pair’s September-October upside and the September 19 swing high, close to 1.3350-45, gains the bear’s attention.
Following that, the early September peak around 1.3200 should return to the charts.
Alternatively, recovery moves need to cross a joint of the weekly resistance line and the 50% Fibonacci retracement level, surrounding 1.3350, to recall the USDCAD buyers.
Even so, the support-turned-resistance around 1.3550 and the 200-SMA near 1.3680 could challenge the pair’s further upside.
USDCAD: Four-hour chart
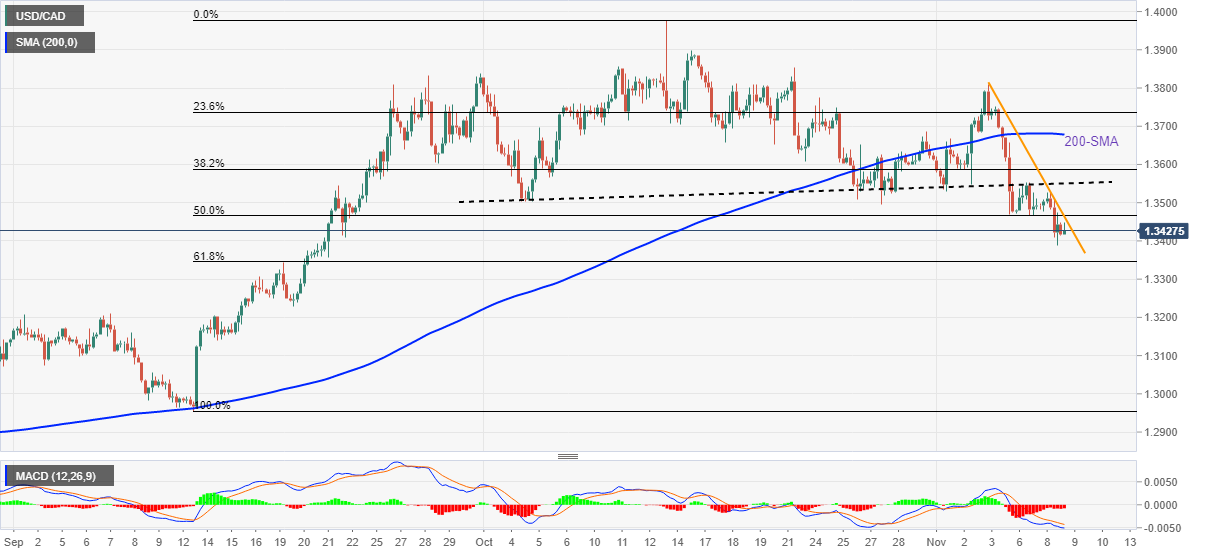
Trend: Further downside expected
-
02:30
Commodities. Daily history for Tuesday, November 8, 2022
Raw materials Closed Change, % Silver 21.351 2.82 Gold 1712.45 2.27 Palladium 1920.13 1.42 -
02:20
EURUSD dribbles above 1.0040 support as sentiment sours, focus on US mid-term elections, inflation
- EURUSD retreats from two-month high, snaps three-day uptrend with mild losses.
- Covid woes, election jitters probe the previous risk-on mood.
- Hawkish ECBSpeak, downbeat US data keeps buyers hopeful.
- Fedspeak, political and covid updates will be crucial for intraday directions as bears seek entry.
EURUSD remains sidelined around 1.0060 while pausing a three-day winning streak near a two-month during early Wednesday. The major currency pair cheered broad US dollar weakness to refresh the multi-day high before the latest challenges to the optimism probed the bulls.
Fresh covid woes from China and early polls of the US mid-term elections probe the market’s risk appetite of late. That said, China reports the highest levels of new COVID cases in six months, with the latest addition of 8,335 for November 08, while marking a fresh virus-led lockdown in Guangzhou’s second district.
On the other hand, the latest polls cited by Reuters suggest that Republicans are favored to win control of the House of Representatives and possibly the Senate, which in turn raises concerns over increasing the US debt ceiling next year. The Republicans are also likely to temper potential Democratic spending and regulations.
Amid these plays, Wall Street closed positive for the third consecutive day while the US 10-year Treasury yields snapped a four-day uptrend. Further, the S&P 500 Futures print mild gains but the market’s optimism seems to fade of late.
It’s worth noting that the hawkish comments from European Central Bank (ECB) officials and downbeat US data joined the risk-on mood to favor EURUSD bulls the previous day.
“We will continue raising rates to a level that ensures inflation will come back into line with the ECB's definition of price stability,” said ECB Vice President Luis de Guindos on Tuesday as reported by Reuters. Further, ECB policymaker and Germany’s central bank head Joachim Nagel mentioned, “Large rate hikes are necessary.” Elsewhere, Eurozone Retail Sales improved to -0.6% YoY in September versus -1.3% expected and upwardly revised -1.4% prior. Alternatively, the US NFIB Small Business Optimism Index for October, 91.3 versus 92.1 prior.
Moving on, comments from various Federal Reserve (Fed) officials may entertain EURUSD traders but major attention will be given to the risk catalysts mentioned above.
Also read: US Inflation Preview: Markets set to seize on falling Core CPI to revive pivot play, three scenarios
Technical analysis
A daily closing beyond the convergence of the 100-DMA and a downward-sloping trend line from early August, around 1.0050-40, becomes necessary for the EURUSD bears to retake control. Even so, the 1.0000 parity level and a joint of the 50-DMA and 21-DMA, close to 0.9880, could challenge the pair’s further downside.
Meanwhile, the resistance line of a six-week-old bullish channel, around 1.0150 by the press time, could restrict short-term advances of the pair.
-
01:50
AUDJPY Price Analysis: Bears attack 200-HMA on downbeat China CPI
- AUDJPY extends the previous day’s pullback from one-week high on softer China inflation data.
- China CPI dropped below forecasts, prior readings but PPI improved in October.
- Weekly support line teases the bears before directing them to 93.00 support.
- Buyers have a bumpy road on the north to track.
AUDJPY takes offers to refresh intraday low near 94.50 after witnessing China’s downbeat inflation data on early Wednesday. In doing so, the cross-currency pair drops for the second consecutive day while stretching the previous day’s pullback from a one-week high.
That said, China’s headline Consumer Price Index (CPI) dropped to 2.1% versus 2.4% market forecasts and 2.8% prior. However, the Producer Price Index (PPI) improved to -1.3% compared to -1.5% expected and 0.9% previous readings.
It should be noted that the downbeat China CPI and the quote’s latest weakness allow bears to poke the 200-HMA. Also acting as a downside filter is the upward-sloping support line from Monday, near 94.40.
It’s worth noting, however, that a clear downside break of 94.40 will make the AUDJPY vulnerable to testing the 93.00 horizontal support.
Alternatively, recovery moves need to cross a descending resistance line from November 01, around 95.20 by the press time, to recall the buyers.
Even so, the monthly high and October’s peak, respectively around 95.55 and 95.75 in that order, could test the upside momentum.
AUD/JPY: Hourly chart
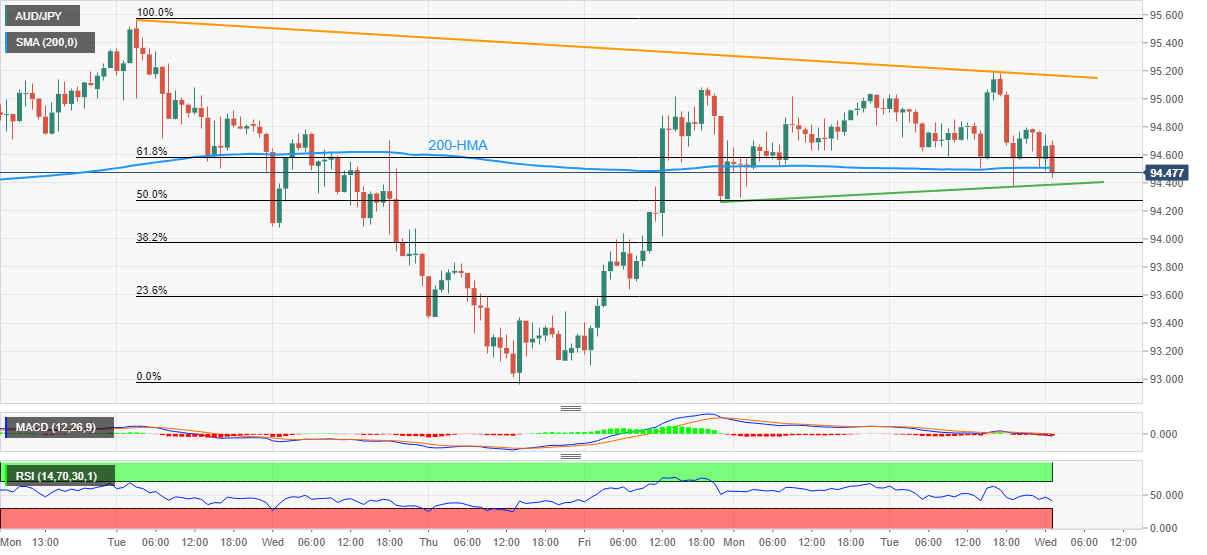
Trend: Further downside expected
-
01:45
USDCNH surpasses 7.2500 as China’s CPI drops to 2.1%
- USDCNH has overstepped the critical hurdle of 7.2500 as China inflation has plunged to 2.1%.
- China's CPI has remained lower than the estimates of 2.4% and the prior release of 2.8%.
- The risk impulse is turning cautious as investors await US mid-term elections outcome.
The USDCNH pair rebounded from 7.2350 and has now crossed the 7.2500 hurdle as the National Bureau of Statistics of China has reported the Consumer Price Index (CPI) at 2.1% . The inflation rate has remained lower than the estimates of 2.4% and the prior release of 2.8%.
A decline in the inflationary pressures is expected to compel the People’s Bank of China (PBOC) to announce a dovish policy ahead. This will be supportive of the economic prospects that are facing the headwinds of no tolerance for Coivd-19 policy. Also, vulnerable real estate demand will find fresh demand from individuals.
Meanwhile, the risk profile has dented marginally as investors have shifted their focus towards the announcement of the US mid-term elections outcome. The contest for 435 seats of the House of Representatives and 35 seats of the house of Senate has triggered anxiety among the market participants. A majority win of Democrats will keep maintaining political stability in the US while the odds are favoring Republicans to have some power in clearing bills and passing laws.
The US dollar index (DXY) is displaying a subdued performance as the upside is being capped on expectations of easing inflationary pressures in the October Consumer Price Index (CPI) report. A sheer decline in consumer spending is responsible for lower short-term inflation projections. This is going to impact the projections for the extent of the rate hike in the December monetary policy.
-
01:38
China Producer Price Index (YoY) above forecasts (-1.5%) in October: Actual (-1.3%)
-
01:37
NZDUSD extends pullback from seven-week high towards 0.5900 on softer China inflation
- NZDUSD takes offers to refresh intraday low on downbeat China inflation.
- China CPI eases to 2.1% YoY, PPI improved to -1.3% for October.
- Challenges to the previous risk-on mood also weigh on prices.
- US election updates, anxiety ahead of US CPI could tease the bears.
NZDUSD snaps a three-day winning streak while refreshing the intraday low near 0.5940 after China’s inflation data was released early Wednesday. In doing so, the Kiwi pair also extends the day-start pullback from the highest levels in seven weeks, marked the previous day.
China’s headline Consumer Price Index (CPI) dropped to 2.1% versus 2.4% market forecasts and 2.8% prior. However, the Producer Price Index (PPI) improved to -1.3% compared to -1.5% expected and 0.9% previous readings.
It should be noted that the fresh covid woes from the dragon nation also exert downside pressure on the Kiwi pair. That said, China reports the highest levels of new COVID cases in six months, with the latest addition of 8,335 for November 08, while marking a fresh virus-led lockdown in Guangzhou’s second district.
Furthermore, the early updates from the US mid-term elections suggest a too-close call between the Republicans and Democrats and highlight the chance of Republicans winning in at least one house. The same exert downside pressure on the previous optimism and the NZDUSD prices.
Earlier in the day, New Zealand’s Electronic Card Retail Sales eased to 1.0% MoM growth in October versus 1.3% prior and 0.2% expected. Further, the yearly figures suggest 16.6% increase in the data compared to 28.6% previous readings and 11.4% market forecasts.
While portraying the mood, Wall Street closed positive for the third consecutive day while the US 10-year Treasury yields snapped a four-day uptrend. Further, the S&P 500 Futures print mild gains at the latest. However, the market’s optimism seems to fade and the same could weigh on the NZDUSD prices ahead of the key US inflation numbers and US election results.
Technical analysis
A one-month-old ascending trend line restricts short-term NZDUSD upside near 0.5980 while the 50-DMA level near 0.5820 and an upward sloping support line from October 13, close to 0.5800, challenge the pair bears.
-
01:37
China CPI: +2.1 pct from a year ago (Reuters poll +2.4 pct), AUDUSD wobbles
The Consumer Price Index, released by the National Bureau of Statistics of China, has been released as follows:
- China October PPI -1.3 pct from a year ago (Reuters poll -1.5 pct).
- China October CPI +2.1 pct from a year ago (Reuters poll +2.4 pct).
- China October PPI +0.2 pct from the previous month.
- China October CPI +0.1 pct from the previous month (Reuters poll +0.3 pct).
- China says October food CPI +7.0 pct from a year ago; non-food CPI +1.1 pct.
AUDUSD update
Meanwhile, AUDUSD is testing key hourly support as the US Dollar attempts to firm from daily support. The prior day's lows are located at 0.6443 as an immediate target on a break of the trendline and horizontal resistance:
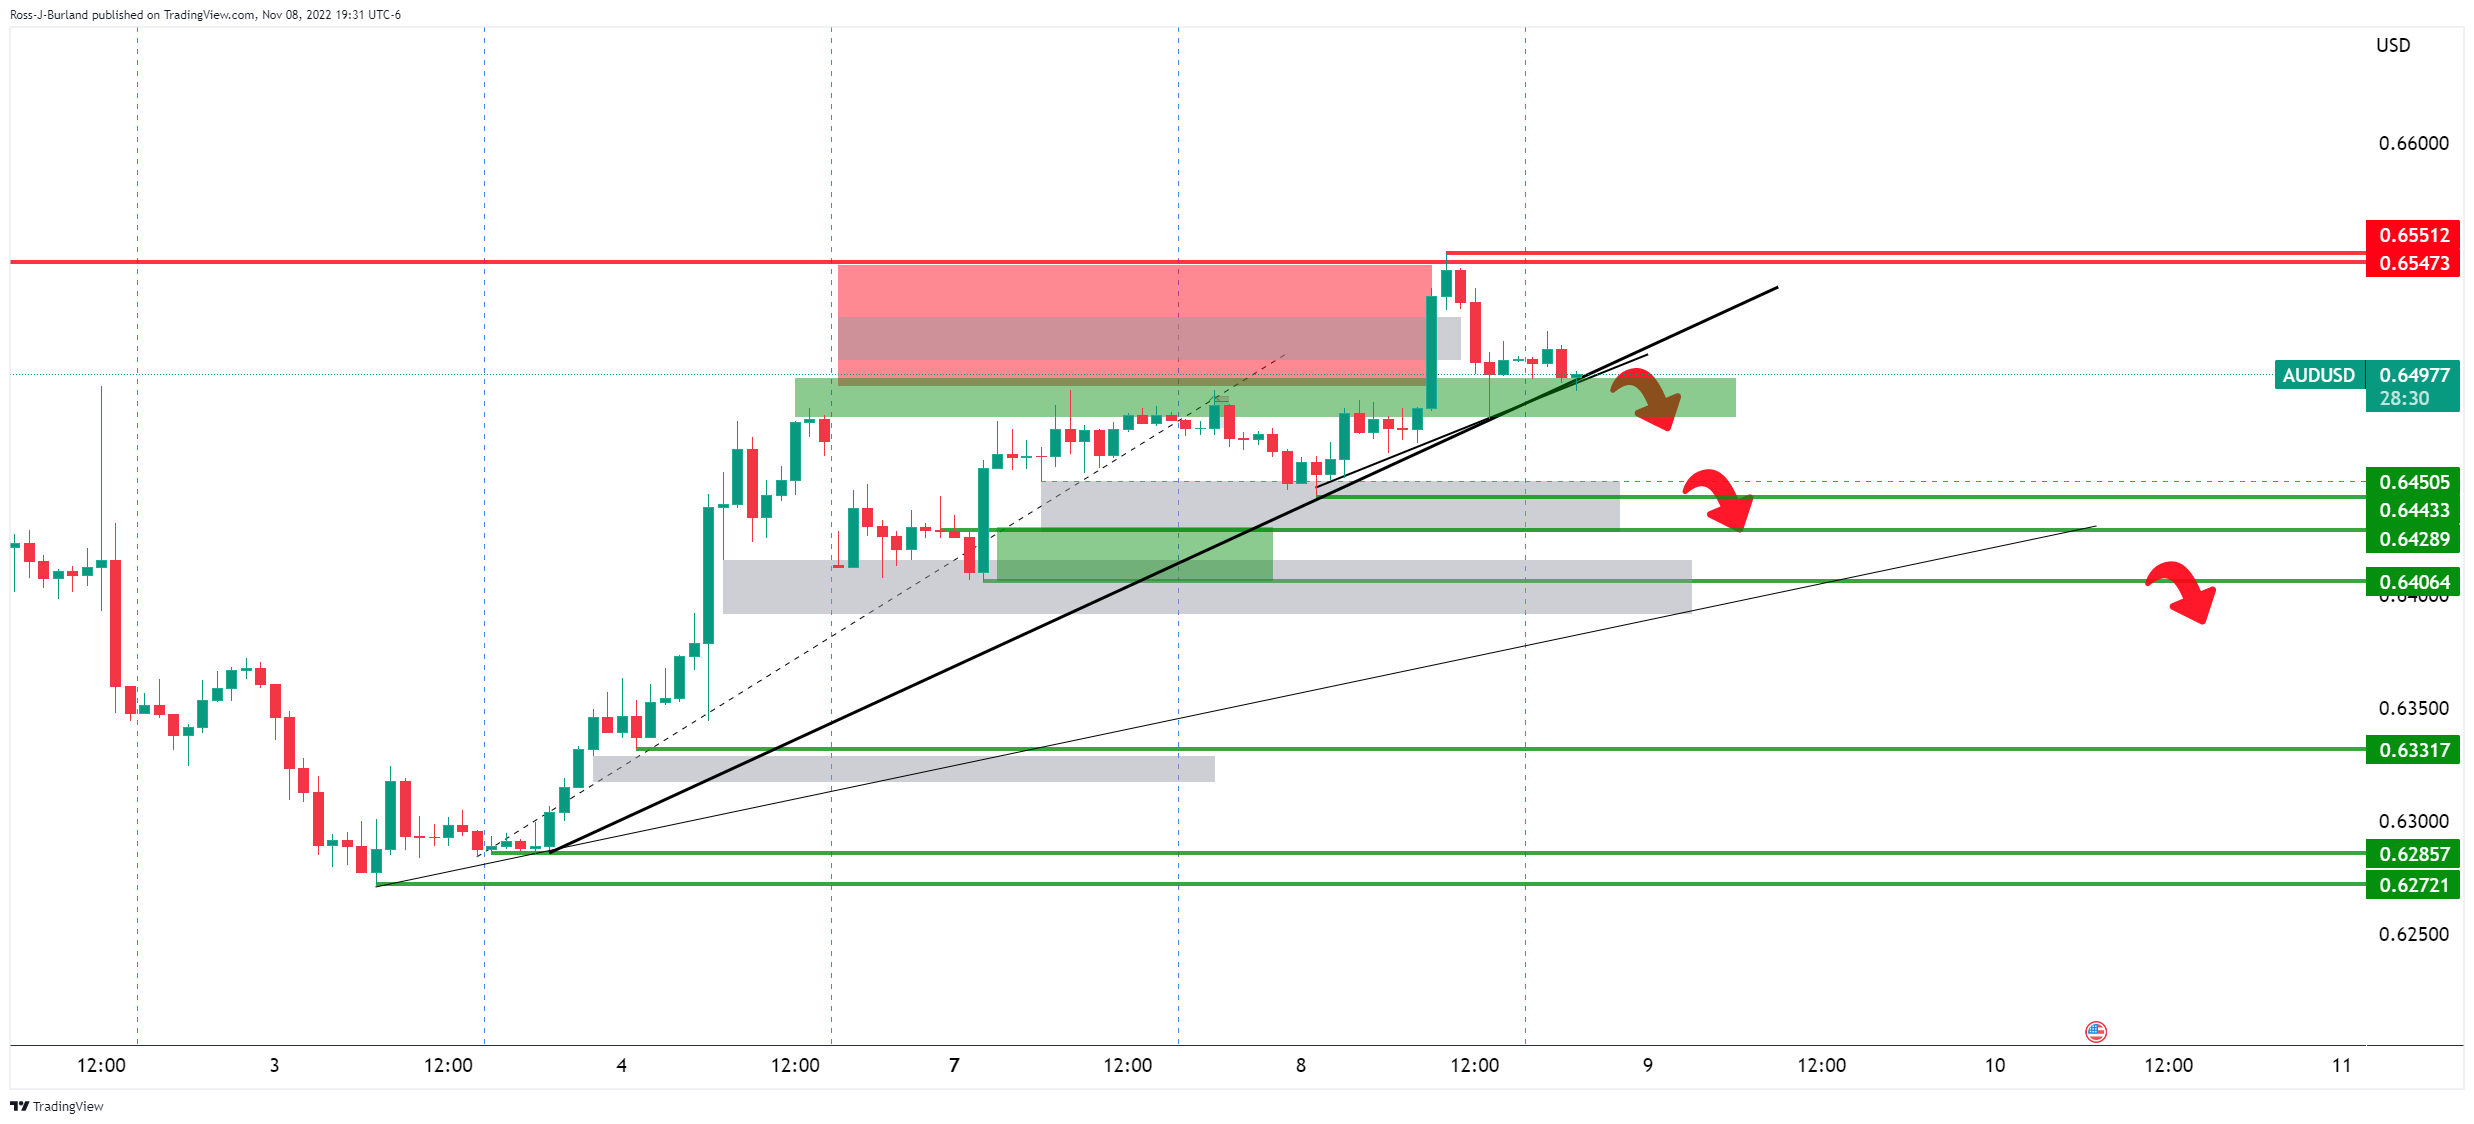
US Dollar bulls lurking
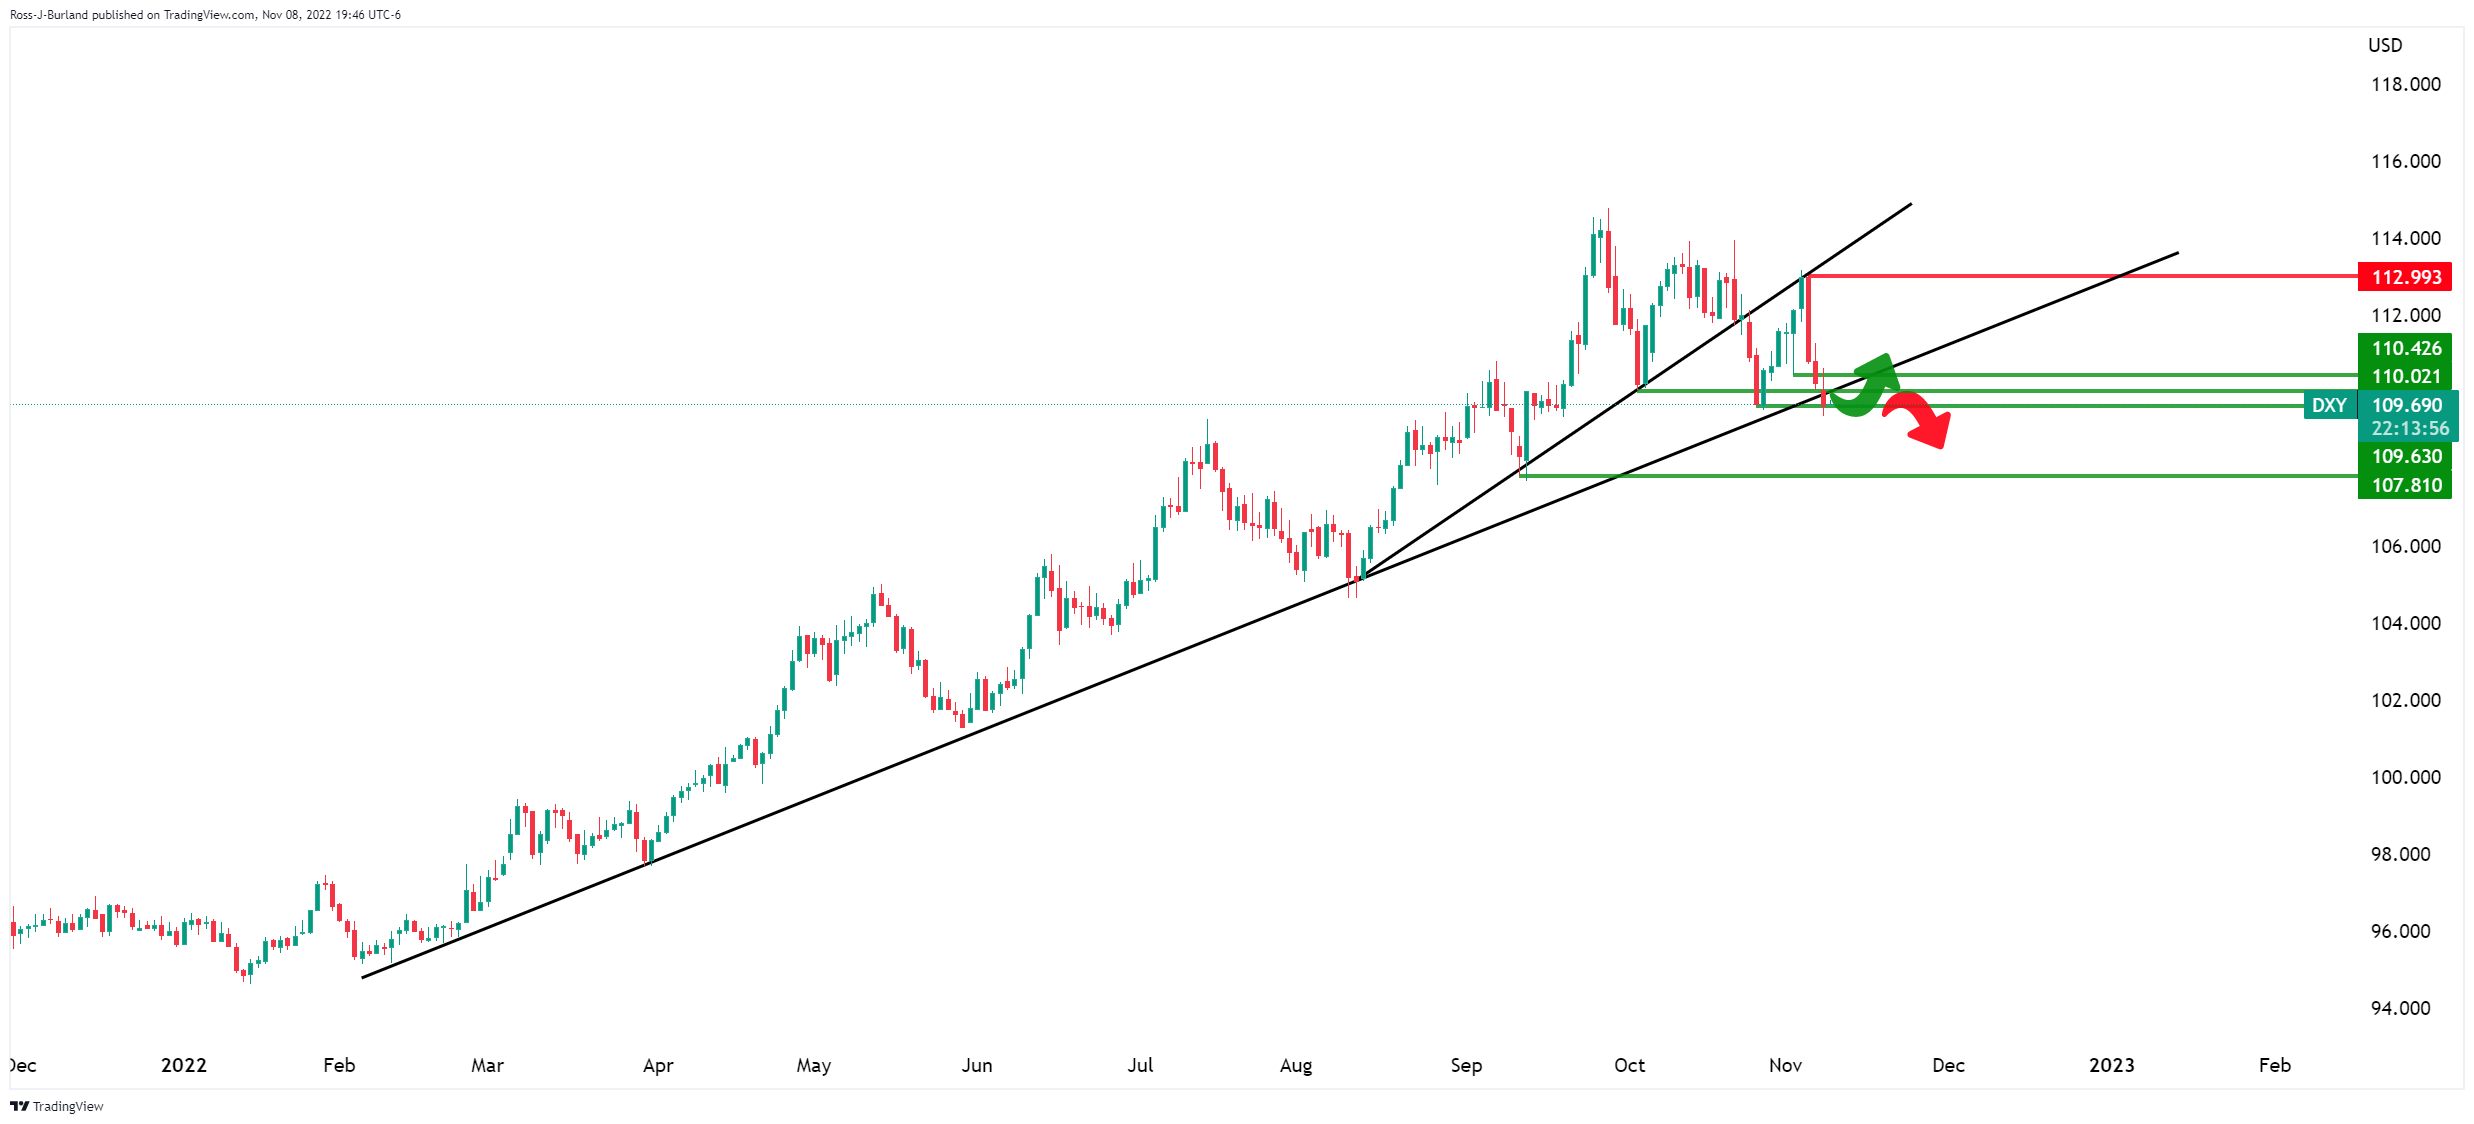
The price of the DXY has met a critical daily support area. A break here could be strongly beneficial for the commodity complex and the Aussie would be expected to rally. On the other hand, the bears will be noting the weekly template and a mid-weel opportunity to bite into the in-the-money long positions that have been building over several days.
About the China CPI
The Consumer Price Index is released by the National Bureau of Statistics of China. It is a measure of retail price variations within a representative basket of goods and services. The result is a comprehensive summary of the results extracted from the urban consumer price index and rural consumer price index. The purchase power of the CNY is dragged down by inflation. The CPI is a key indicator to measure inflation and changes in purchasing trends. A substantial consumer price index increase would indicate that inflation has become a destabilizing factor in the economy, potentially prompting The People’s Bank of China to tighten monetary policy and fiscal policy risk. Generally speaking, a high reading is seen as positive (or bullish) for the CNY, while a low reading is seen as negative (or Bearish) for the CNY.
-
01:36
China Consumer Price Index (MoM) below forecasts (0.3%) in October: Actual (0.1%)
-
01:36
China Consumer Price Index (YoY) came in at 2.1%, below expectations (2.4%) in October
-
01:21
USD/CNY fix: 7.2189 vs. estimated 7.2015 and previous 7.2150
In recent trade today, the People’s Bank of China (PBOC) set the yuan (CNY) at 7.2189 vs. the estimated 7.2015 and the previous 7.2150.
About the fix
China maintains strict control of the yuan’s rate on the mainland.
The onshore yuan (CNY) differs from the offshore one (CNH) in trading restrictions, this last one is not as tightly controlled.
Each morning, the People’s Bank of China (PBOC) sets a so-called daily midpoint fix, based on the yuan’s previous day's closing level and quotations taken from the inter-bank dealer.
-
01:19
Asian shares on a positive footing, awaiting US election results and US CPI
- Asian stocks better bid on positive risk sentiment.
- Nikkei and ASX taking cues from Wall Street ahead of US CPI, US election results.
Japan's benchmark Nikkei average opened up 0.04% at 27,884.55 on Wednesday but is now back to flat as investors weigh the prospects of the forthcoming US Consumer Price Index and risks to the risk-on theme that has emanated from a turn of the sentiment of late. investors will also be looking at the midterm elections in the United States with republicans on the verge of a shake-up in the House.
In Australia, shares advanced for a fourth straight session on Wednesday, led by mining stocks as iron ore prices surged on hopes of China easing its COVID curbs, while the National Australia Bank slumped on a dire lending outlook. The S&P/ASX 200 index added 0.5% to 6,996.4 by 2343 GMT. The benchmark ended 0.4% higher on Tuesday.
In the US, the three US benchmark indices moved higher Tuesday, led by the Dow Jones Industrial Average, as investors awaited the results of the midterm elections. The Dow added more than 1% to 33,160.83. The S&P 500 rose 0.6% to 3,828.11, while the Nasdaq Composite put on 0.5% to 10,616.20. Materials, technology, and industrials led the gainers among sectors, while consumer discretionary posted the only loss.
US CPI and outlook for the Fed
The US Consumer Price Index will be critical. It will be scrutinized and analysts at TD Securities suggested that Core prices likely slowed modestly in October but to a still strong 0.4% MoM pace.'' All told, our MoM forecasts imply 7.9%/6.5% YoY for total/core prices.
'A below consensus print is likely to help push the pricing for the terminal funds rate modestly lower, likely bull steepening the curve in the process,'' analysts at TD Securities argued. ''The risk of a lower reading is why we took profit on our 2s10s curve steepener last week and went long 10y Treasuries, which we viewed as attractive,'' they said. Ultimately, this would be encouraging for stocks.
-
01:16
Gold Price Forecast: XAUUSD juggles above $1,700 ahead of US Mid-term elections outcome
- Gold price is oscillating above $1,700.00 while the risk-off impulse has attempted a rebound.
- Long-term US Yields are holding 4.14% support as investors are divided over the extent of Fed’s rate hike.
- A decline in consumer spending is expected to weigh on October’s inflation report.
Gold price (XAUUSD) has shifted into a rangebound profile as investors are awaiting the outcome of the US mid-term elections. The precious metal is displaying back-and-forth moves above the psychological support of $1,700.00.
Meanwhile, the risk profile has turned cautious as the market is expecting a win of Republicans in the House of Representatives and is divided on the outcome for the House of Senate, reported Reuters. The US dollar index (DXY) has inched higher to 109.73 while S&P500 futures have trimmed their Tuesday’s gains marginally.
Also, the 10-year US treasury yields have sensed a cushion of around 4.14% as the CME FedWatch tool indicates that investors are divided over the expectations for 50 basis points (bps) or 75 bps rate hikes in December monetary policy.
Going forward, October’s Consumer Price Index (CPI) report will play a pivotal role. Projections are pointing to easing inflationary pressures as consumer spending remained lower in the last quarter at 1.4% vs. the prior release of 2.0%. A slowdown in the inflation rate would extend a rally for gold prices.
Gold technical analysis
On a four-hour scale, the gold price is marching towards the critical resistance of $1,730.00 placed from the October 4 high. The precious metal witnessed a juggernaut rally after surpassing the critical hurdle of $1,679.00 placed from the October 13 high.
Advancing 20-and 50-period Exponential Moving Averages (EMAs) at $1,680.00 and $1,664.70 respectively, add to the upside filters.
Meanwhile, the Relative Strength Index (RSI) (14) has shifted into the bullish range of 60.00-80.00, which indicates more upside ahead.
Gold four-hour chart
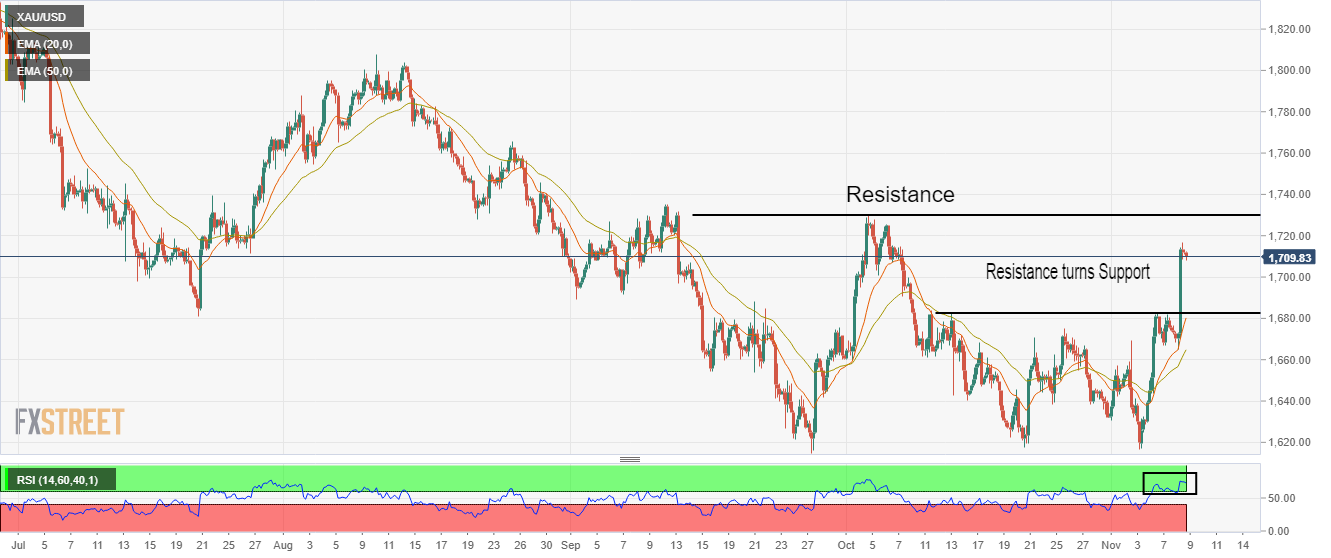
-
01:15
EURJPY Price Analysis: Bulls approach 147.00 hurdle with eyes on yearly high
- EURJPY rebounds from 100-SMA inside a 13-day-old symmetrical triangle.
- MACD teases bears but firmer RSI, sustained trading beyond 200-SMA favor buyers.
- 2014’s yearly peak could lure the bulls past October’s high.
- 200-SMA, 144.00 could challenge short-term bears ahead of giving them control.
EURJPY picks up bids to reverse the previous day’s pullback from sub-147.00 resistance during Wednesday’s Asian session. In doing so, the cross-currency pair bounces off the 100-SMA while poking the resistance line of a two-week-old symmetrical triangle, around 146.70 by the press time.
Although the MACD signals are less bullish, the firmer RSI (14) and the quote’s sustained trading beyond the 200-SMA keep the EURJPY bulls hopeful to overcome the 147.00 resistance level.
The same could allow the pair buyers to refresh the yearly high, currently around 148.40.
In that case, the year 2014 high near 149.80 and the 150.00 round figure will gain major attention.
Alternatively, pullback moves need a downside break of the 100-SMA level surrounding 146.45 to tease the pair sellers.
Even so, support line of the aforementioned triangle, near 144.50, could challenge the EURJPY downside.
It’s worth noting that the 200-SMA and early October’s high, respectively near 144.20 and 144.00, could act as additional downside filters for the pair traders to watch before welcoming the bears.
Overall, EURJPY remains on the bull’s radar and aims to refresh the yearly high.
EURJPY: Four-hour chart
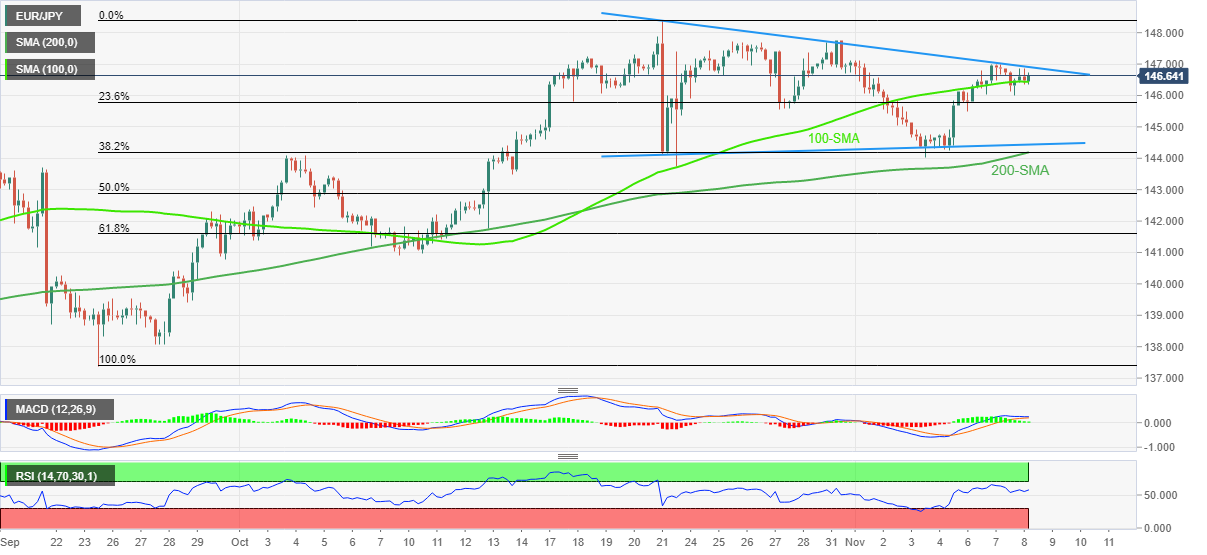
Trend: Further upside expected
-
00:49
AUDUSD snaps three-day uptrend near 0.6500 amid covid, political woes, eyes on China/US inflation
- AUDUSD retreats from a six-week high, renews intraday low of late.
- Guangzhou locked down second district amid firmer covid counts.
- Close call in key states amplifies anxiety ahead of the US mid-term election results.
- China inflation numbers, US CPI will be crucial for clear directions, bears are likely to retake control.
AUDUSD bulls take a breather around 0.6500, snapping a three-day uptrend near the highest levels in 1.5-months. In doing so, the Aussie pair justifies its risk barometer status amid fears emanating from China’s covid conditions and the uncertainty surrounding the US mid-term elections.
With China’s Guangzhou announcing a lockdown in the second district, the coronavirus woes from Australia’s largest customer, namely China, escalate amid a lack of fresh positives. Also likely to portray the covid woes are the highest levels of virus numbers in six months, printed the previous day.
Elsewhere, the early updates from the US mid-term elections suggest a too-close call between the Republicans and Democrats and highlight the chance of Republicans winning in at least one house. The same exerts downside pressure on the previous optimism and the AUDUSD prices.
Furthermore, the uncertainty surrounding the Democratic Party’s control in both houses failed to tame the equities, as well as the bonds the previous day, which in turn favored the AUDUSD bulls the previous day. The reason could be linked to the market’s hopes of easy spending and less strong inflation due to the Republican Party’s likely victory in at least one house of decision-making.
It should be noted that the Aussie Prime Minister (PM) Anthony Albanese’s readiness to have a meeting with China President Xi Jinping joins the previous hopes of easy inflation to challenge the AUDUSD bulls of late.
Against this backdrop, Wall Street closed positive for the third consecutive day while the US 10-year Treasury yields snapped a four-day uptrend. It should be noted that the S&P 500 Futures print mild gains at the latest. However, the market’s optimism seems to fade ahead of the key China Consumer Price Index (CPI) and the Producer Price Index (PPI) for October.
Technical analysis
A convergence of the 50-DMA and a five-week-old resistance line highlights the 0.6510 as a short-term key hurdle for the AUDUSD bulls to keep the reins.
-
00:34
EURGBP sees a volatility squeeze despite hawkish ECB bets soar, UK GDP eyed
- EURGBP is expected to display volatility contraction ahead of UK GDP data.
- The German inflation for 2023 is projected at 7% or more.
- BOE’s Pill cited that the UK recession is driven by other factors while the BOE will be held responsible.
The EURGBP pair displayed a rebound move of around 0.8720 in the early Asian session. The asset is expected to remain sideways further as anxiety ahead of the UK Gross Domestic Product (GDP) data could keep investors on the sidelines.
On Tuesday, the cross displayed wild gyrations after hawkish commentary from European Central Bank (ECB) policymaker and Germany’s central bank head Joachim Nagel. Speaking at the Bundesbank Symposium "Dialogue with Banking Supervision," in Frankfurt, ECB policymaker cited that large rate hikes are necessary to bring down inflationary pressures.
He further added that Balance sheet reduction is part of ECB normalization and German 2023 inflation is likely to average at 7% or more.
Apart from that, better-than-projected Retail Sales data also added fuel to Euro’s volatility. The Retail Sales data landed lower at -0.6% against a projection of -1.3% and the prior release of -1.6%. This indicates that the retail demand is recovering, however, the increment could be the outcome of higher inflationary pressures as the economic catalyst is contaminated with the same.
On the UK front, Bank of England (BoE) Chief Economist Huw Pill at the UBS European Conference cited that the central bank will be blamed for the UK recession but it is driven by other factors. The BOE will do whatever is needed to bring the inflation rate to 2%.
Going forward, the UK Gross Domestic Product (GDP) data will be of utmost importance. The UK GDP for the third quarter is expected to drop to 2.1% vs. the prior release of 4.4%.
-
00:32
US election results: Too close to call in key states
From the Fox News Decision Desk:
Georgia, GA, Senate race too close to call. GA is a historically slow-counting state.
GOP senators who are projected to win re-election: Scott of SC, Paul of KY & Young of IN. Dem VT Rep Peter Welch succeeds Pat Leahy as Senator. Leahy has served since '75.
Polls just closed in Ohio, OH, & North Carolina, NC.
The Fox News Decision Desk says GOPer JD Vance has a slight lead over Dem OH Rep Tim Ryan. But, again, the race is too close to call.
CNN reports that Republican Gov. Mike DeWine will win reelection in Ohio and defeat Democrat Nan Whaley.
Also too close to call NC senate race between GOP NC Rep Budd & Dem Cheri Beasley
The sentiment for the outcomes is US dollar bearish. A Republican win would cut down on fiscal spending that could exacerbate already-high inflation and lead the Fed to raise interest rates even higher than expected, analysts at Morgan Stanley wrote earlier this week. This potentially would be buoying the stock market's most recent rebound while supporting Treasury prices and helping curb the burgeoning US Dollar.
US Dollar daily chart
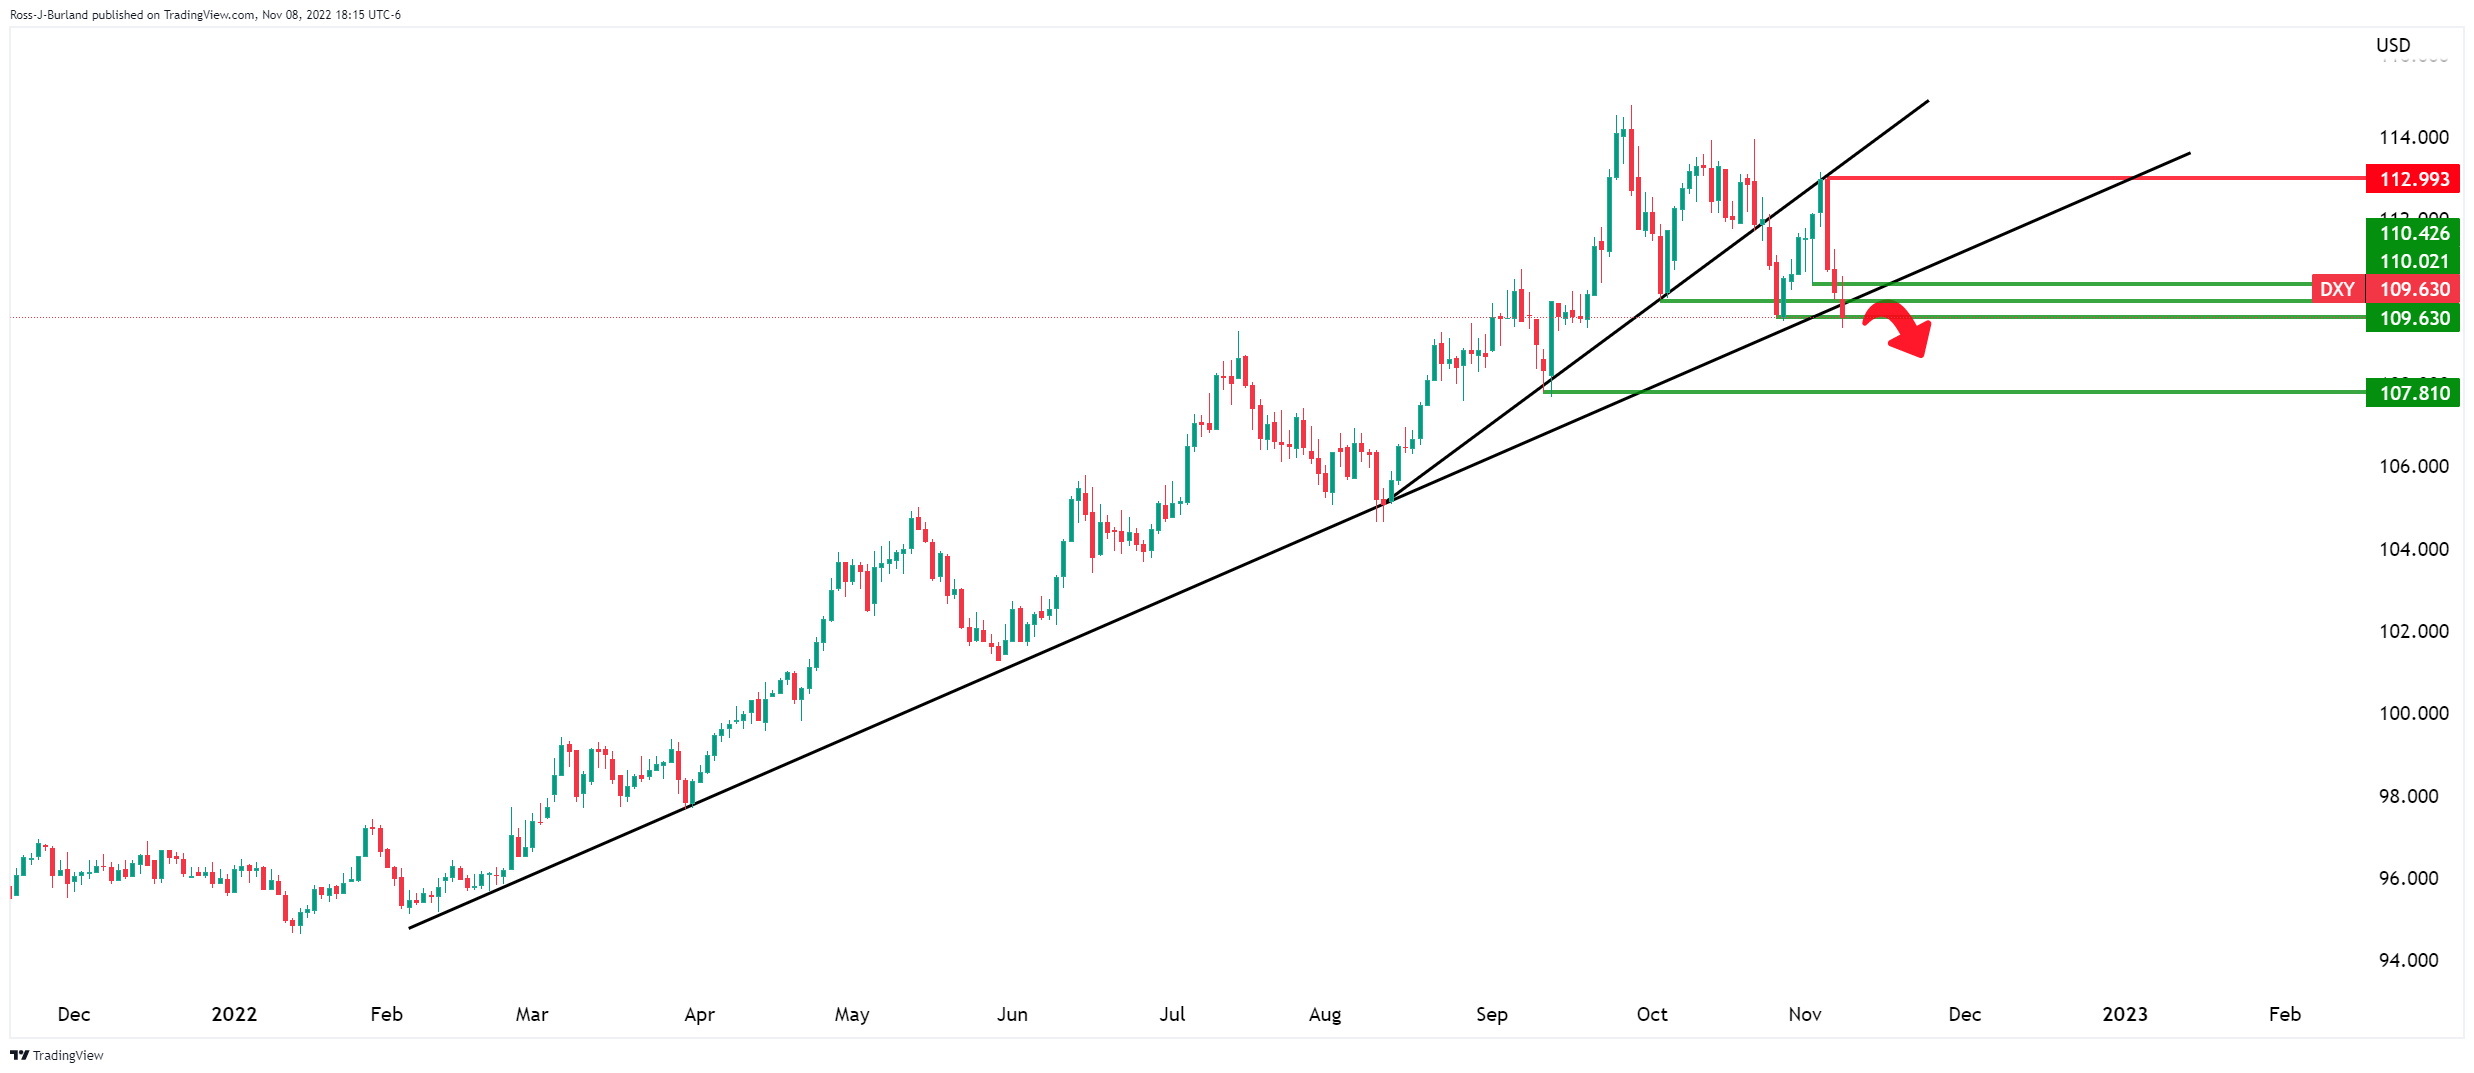
The US Dollar is testing a key trendline support structure as the chart above illustrates.
-
00:30
Stocks. Daily history for Tuesday, November 8, 2022
Index Change, points Closed Change, % NIKKEI 225 344.47 27872.11 1.25 Hang Seng -38.6 16557.31 -0.23 KOSPI 27.25 2399.04 1.15 ASX 200 25.2 6958.9 0.36 FTSE 100 6.14 7306.14 0.08 DAX 155.23 13688.75 1.15 CAC 40 24.89 6441.5 0.39 Dow Jones 333.83 33160.83 1.02 S&P 500 21.31 3828.11 0.56 NASDAQ Composite 51.68 10616.2 0.49 -
00:24
USDJPY Price Analysis: Bears testing prior day's lows., bulls holding the fort
USDJPY is trying to hold on to the lows of the day from Tuesday following the US Dollar that sold off, extending the losses that started to take shape on Friday. The yen has picked up a bid in line with a general risk-on mood in the past few sessions as the greenback falls below a key support line on the daily charts.
Tuesday was the third day of longs for the yen in the market since last week and the bears are making fresh lows in Asia, which are so far being rejected by the bulls, however. Bulls could be on the lookout for a move to counter the trend into in-the-money-longs as the following will illustrate.
DXY daily chart

The price of the US Dollar, as per the DXY index, is taking on critical trendline support and structure with little signs of a let-up, so far. However, if the price drops below the mark, then the yen will stand to benefit as follows:

The price is embarking on a breakout and 145.30 is key for a daily close below.
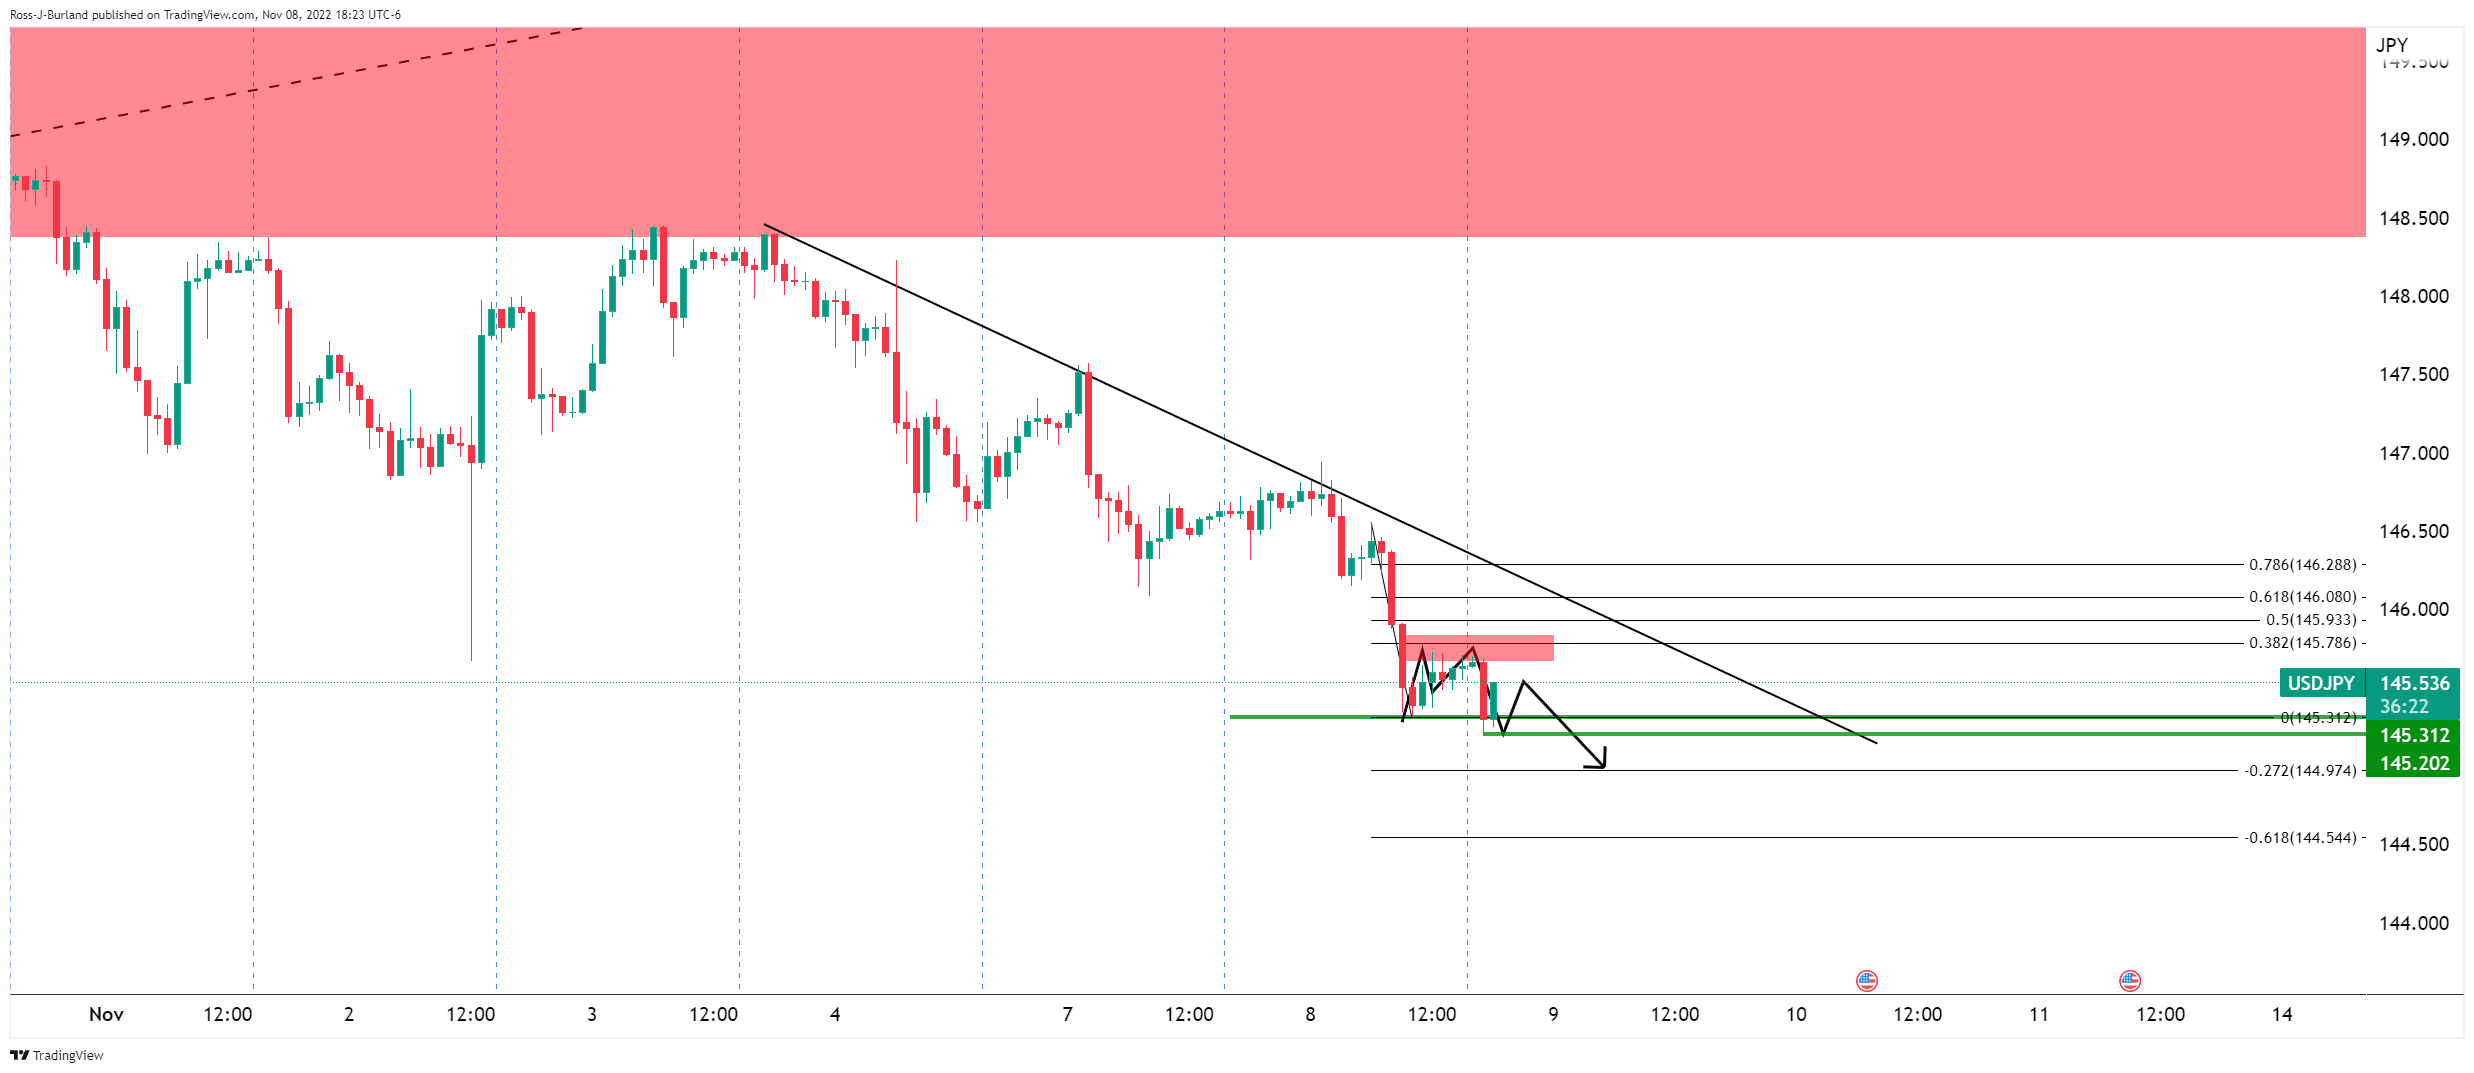
-
00:23
GBPUSD Price Analysis: Retreats from two-month-old resistance towards 1.1500
- GBPUSD takes offers to refresh intraday low, snaps three-day uptrend around a one-week high.
- 50-DMA, monthly support line challenge bears amid upbeat oscillators.
- Buyers need validation from 100-DMA to keep the reins.
GBPUSD bears return to the table, after a three-day absence, as the Cable pair renews its intraday low near 1.1530 during Wednesday’s Asian session.
In doing so, the quote takes a U-turn from a downward-sloping resistance line from early September.
However, the bullish MACD signals and steady RSI (14) join the pair’s successful trading above the 50-DMA, around 1.1330 at the latest, to keep the buyers hopeful.
Even if the quote breaks the 1.1330 support, a one-month-old ascending trend line, near 1.1190 by the press time, could challenge the GBPUSD bears.
Following that, a slump toward the monthly low near 1.1150 and then to October’s trough surrounding 1.0925 can’t be ruled out.
Meanwhile, an upside clearance of the aforementioned immediate resistance line near 1.1600 isn’t an open invitation to the GBPUSD bulls as the 100-DMA level of 1.1672 acts as the last defense of the bears.
Should the quote stays firmer past 1.1672, September’s high around 1.1740 and tops marked during late August, surrounding 1.1900, will gain the market’s attention.
Overall, GBPUSD is likely to witness a pullback but the bears are far from taking control.
GBPUSD: Daily chart
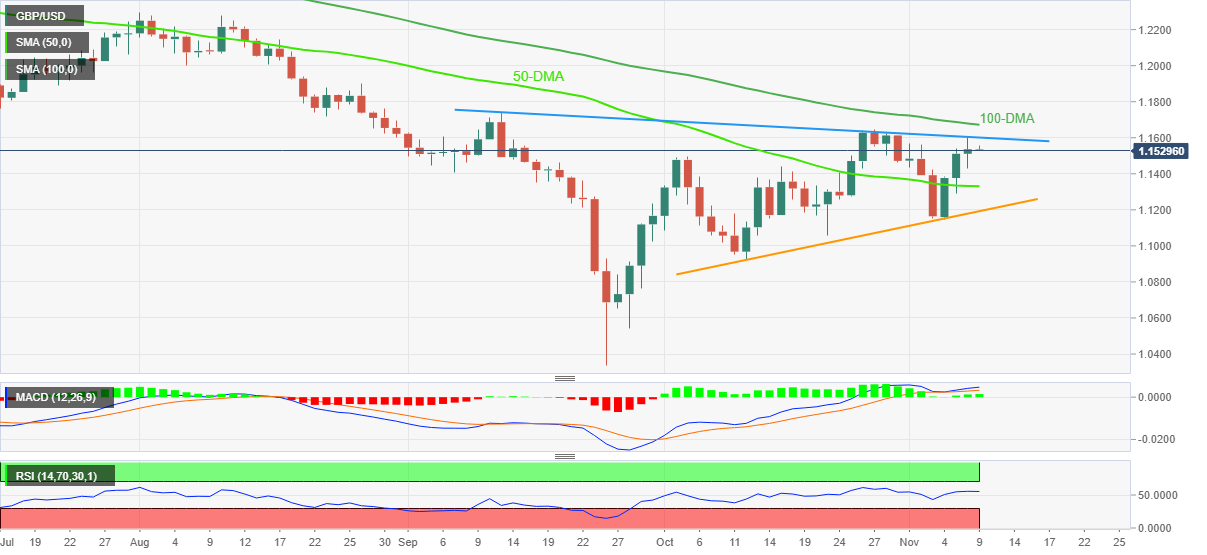
Trend: Limited downside expected
-
00:15
Currencies. Daily history for Tuesday, November 8, 2022
Pare Closed Change, % AUDUSD 0.65038 0.42 EURJPY 146.751 -0.06 EURUSD 1.00726 0.56 GBPJPY 168.207 -0.33 GBPUSD 1.15457 0.29 NZDUSD 0.5959 0.34 USDCAD 1.34271 -0.49 USDCHF 0.98572 -0.19 USDJPY 145.695 -0.63 -
00:08
GBPJPY drops below 168.00 as focus shifts to UK GDP data
- GBPJPY has surrendered the immediate support of 168.00 ahead of UK GDP numbers.
- Rising interest rates and inflation are expected to weigh on UK growth rates.
- The Japanese government is planning to release more stimulus and hike taxes for ultra-rich individuals.
The GBPJPY pair has failed to sustain above the immediate hurdle of 168.00 in the Tokyo session. The asset has witnessed selling pressure despite the headwinds of liquidity easing by the Japanese government to support the economic prospects.
The cross is expected to remain sideways as investors are shifting their focus toward the UK Gross Domestic Product (GDP) data, which will release on Friday. Meanwhile, the risk profile is positive as equities are continuously witnessing a liquidity injection from the market participants.
As per the market estimates, the UK economy will display a significant drop in the GDP numbers. On an annual basis, US GDP for the third quarter will drop to 2.1% vs. the prior release of 4.4%. And, on a quarterly basis, the GDP may contract by 0.5% against an expansion of 0.2%.
Accelerating interest rates by the Bank of England (BOE) has resulted in the postponement of the expansion plans by corporate. Also, firms are not operating at full capacity due to a sheer decline in retail demand led by rising inflationary pressures. Households are facing difficulties in fulfilling their recurring demand due to higher payouts for inflated goods. Apart from that, sky-rocketing energy prices have also impacted their pockets.
On the Tokyo front, the Japanese yen has strengthened despite the chatters of more stimulus by the administration. Japan’s Prime Minister Fumio Kishida is set to approve USD198 billion in the additional budget for the economic stimulus plan, as reported by Bloomberg. The government also “may opt to hike taxes on ultra-wealthy individuals with annual incomes of more than JPY1 billion ($6.8 million).”
-
00:04
US Dollar Index stays depressed around 109.50 with eyes on US mid-term elections, inflation
- US Dollar Index dribbles around the lowest levels in seven weeks.
- Surprise optimism amid challenges to Democrats in the US mid-term elections drowned DXY of late.
- Equities, bonds ignored covid fears from China to print gains.
- Risk catalysts, China inflation data could entertain traders ahead of Thursday’s US CPI.
US Dollar Index (DXY) holds onto the bearish move around a nearly two-month low during early Wednesday. That said, the greenback’s gauge versus the six major currencies dropped to the lowest levels since September 20 the previous day before recently taking rounds to 109.50.
The uncertainty surrounding the Democratic Party’s control in both houses failed to tame the equities, as well as the bonds the previous day. The reason could be linked to the market’s hopes of easy spending and less strong inflation due to the Republican Party’s likely victory in at least one house of decision-making.
Also weighing on the DXY could be the recently softer data and comments from the US Federal Reserve (Fed) policymakers who suggested challenges for further rate hikes. That said, the US NFIB Small Business Optimism Index for October dropped to 91.3 versus 92.1 prior.
Alternatively, a six-month high of the fresh covid numbers from China bolstered the market’s fears of multiple lockdowns and challenged the US Dollar Index sellers of late. Also likely to have tested DXY bears could be the anxiety ahead of the key inflation data from China and the US.
Amid these plays, Wall Street closed positive for the third consecutive day while the US 10-year Treasury yields snapped a four-day uptrend. It should be noted that the S&P 500 Futures print mild gains at the latest.
Moving on, a light calendar in the US may restrict the DXY moves even if the likely easing in China’s inflation and covid woes appear to weigh on the greenback’s gauge.
Technical analysis
A one-month-old descending support line joins 100-DMA to challenge the US Dollar Index bears around 109.30.
-