Notícias do Mercado
-
23:51
Japan JP Foreign Reserves: $1227.6B (December) vs $1226.3B
-
23:38
NZD/USD Price Analysis: Dribbles inside weekly triangle below 0.6400
- NZD/USD remains sidelined inside a short-term symmetrical triangle formation.
- Sustained trading beyond the key HMAs, steady RSI favor buyers.
- Sellers need to break 0.6190 to dominate further.
NZD/USD makes rounds to 0.6370-75 during early Wednesday, after snapping a two-day uptrend near a monthly top the previous day. In doing so, the Kiwi pair remains inside a symmetrical triangle formation connecting multiple levels marked since Monday.
Not only the immediate triangle but the steady RSI (14) also portrays the Kiwi pair’s latest inaction.
However, the quote’s successful trading above the 100 and 200 Hourly Moving Averages (HMAs) join the above 50 level of RSI to keep the NZD/USD buyers hopeful.
That said, a clear upside break of the stated triangle’s top line, close to 0.6385 by the press time, appears necessary for the bulls to take control.
Even so, the 0.6400 round figure and the recent high surrounding 0.6410 could act as additional upside filters to challenge the buyers before directing them to the previous monthly high near 0.6515. During the run-up, the 0.6500 threshold may act as a buffer.
On the flip side, a downside break of the triangle’s support line, around 0.6345 at the latest, won’t flash a strong bearish signal for the NZD/USD traders as a convergence of the 100 and 200 HMA could restrict the pair’s further downside near 0.6320-15.
Even if the pair drops below 0.6315, the monthly low near 0.6190 may act as the last defense of the NZD/USD buyers.
NZD/USD: Hourly chart

Trend: Further upside expected
-
23:38
EUR/JPY sees upside above 142.00 despite BOJ looks to exit loose policy ahead
- EUR/JPY is aiming to surpass 142.00 as Eurozone wage inflation may call for further policy tightening
- ECB Centeno expects the current process of interest rate increases is approaching its end.
- Japan may look for an exit from the ultra-loose monetary policy after the appointment of the new BOJ Governor.
The EUR/JPY pair is struggling to extend its upside journey above the immediate resistance of 142.00 in the early Asian session. The cross is demonstrating a sideways profile but is likely to remain in the bullish trajectory amid an upbeat market mood.
The Euro drove the cross to neat 142.00 firmly after European Economic Affairs Commissioner Paolo Gentiloni trimmed the contraction forecast for Eurozone Gross Domestic Product (GDP). In an interview with the Italian newspaper Il Sole 24 Ore, Gentiloni stated that he expects Eurozone GDP contraction around the start of this year may be less deep than was expected in November.
He further added that “The 0.3% forecast still seemed quite solid but various factors suggested the contraction expected in the fourth quarter of 2022 and the first quarter of this year would not be so sharp as had been expected,”
On the interest rate front, Reuters reported that the European Central Bank (ECB)'s governing council member Mario Centeno said on Tuesday the current process of interest rate increases is approaching its end. Centeno expects that the stubborn price index will face resistance in January and February but will start falling in March.
Contrary to the viewpoint of ECB Centeno, Economic Bulletin published by the ECB clears that wage growth is going to be extremely solid ahead led by robust labor markets that so far have not been substantially affected by an economic slowdown, increases in national minimum wages, and some catch-up between wages and high rates of inflation. Wage inflation is becoming a barrier for central banks in achieving price stability and it might force ECB President Christine Lagarde to continue to keep policy restrictive ahead.
On the Tokyo front, Japanese Prime Minister Fumio Kishida said that his government and the central bank must discuss their relationship in guiding economic policy after he names a new Bank of Japan (BOJ) governor in April. He further added that the administration is looking to revise its long-decade blueprint of beating deflation and may look for an exit from ultra-loose monetary policy.
-
23:21
Gold Price Forecast: XAU/USD eyes further upside ahead of China, United States inflation
- Gold price remains inactive but defends the bull pennant chart formation.
- Federal Reserve Chairman Jerome Powell’s failure to provide monetary policy signals underpin XAU/USD upside.
- Bullish chart pattern, World Bank economic forecasts add strength to the Gold price even if US Dollar probes buyers.
- Strong inflation from China, United States could challenge XAU/USD buyers.
Gold price (XAU/USD) portrays the typical pre-data anxiety as it makes rounds to $1,875 during early Wednesday, probing a three-day uptrend around the highest levels since May 2022. In doing so, the yellow metal portrays the market’s confidence in the traditional safe-haven even if the US Dollar rebounds from a multi-day low. The reason could be linked to the uncertainty surrounding the next moves of the US Federal Reserve (Fed) and downbeat economic forecasts from the World Bank (WB), not to forget cautious optimism surrounding China.
Federal Reserve Chairman Jerome Powell favored Gold buyers
Federal Reserve (Fed) Chair Jerome Powell's comments at Riksbank's International Symposium on Central Bank Independence couldn’t offer further clarity on the US central bank’s monetary policy outlook and propelled the rush towards the Gold amid uncertainty. The policymaker highlighted the Fed’s autonomous nature and no obligation towards climate control while praising the US central bank’s latest moves in his latest public appearances. It’s worth noting that Federal Reserve Governor Michelle Bowman appeared hawkish while stating that more rate rises are needed to combat high inflation, which in turn should have probed the XAU/USD bulls afterward.
It’s worth mentioning that the recently easing hawkish bets on the Fed’s next moves, as well as softer US data, seem to keep the Gold buyers hopeful even if the Federal Reserve policymakers try to defend the restrictive monetary policy. On Tuesday, the US NFIB Business Optimism Index for December dropped to the lowest levels since 2013 if ignoring multiple jitters during the global Covid wave. Further, US Wholesale Inventories also remained unchanged with 1.0% growth for November.
Alternatively, a rebound in the US Dollar Index (DXY) from the seven-month low seems to challenge the Gold price, due to the inverse relationship between the XAU/USD and the greenback’s gauge versus the six major currencies. It should be noted that the DXY snapped a two-day downtrend on Tuesday while bouncing off the multiday low to close around 103.30. In doing so, the US Dollar Index traced the firmer US Treasury bond yields which rose 10 basis points (bps) to 3.61%.
World Bank economic forecasts propel rush towards XAU/USD
On Tuesday, the World Bank (WB) came out with its revised economic forecasts and propelled the rush towards the traditional safe haven Gold. The quest for the yellow metal became more intense amid uncertainty surrounding the next moves of the major central banks considering the recently easy data and looming inflation woes.
That said, the WB stated that it expects the global economy to grow by 1.7% in 2023, down sharply from 3% in June's forecast, as reported by Reuters. The Washington-based institute also raised fears of global recession by citing the scale of recent slowdowns.
Inflation is the key for Gold traders
To overcome the latest inaction, Gold traders should pay attention to the inflation data from China and the US. Although the US Consumer Price Index (CPI) becomes more important, Beijing’s status as one of the key Gold consumers, as well as the recent reopening of the dragon nation, highlights China's CPI as the key for the XAU/USD traders.
That said, firmer prints of these inflation numbers should challenge the Gold buyers while backing hopes of higher rates. However, the People’s Bank of China’s (PBOC) favor for easy money policies could let the XAU/USD remain firmer even if China's CPI rises a bit.
Gold price technical analysis
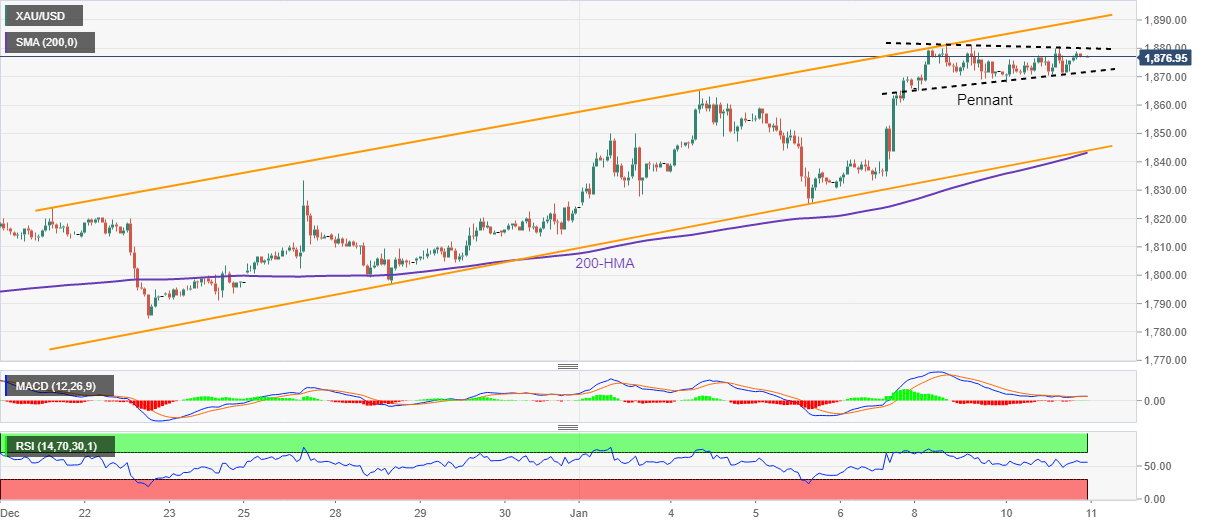
Gold price portrays a bull pennant price formation on the hourly chart, which in turn can suggest the metal’s further rise towards the theoretical target price of $1,930.
The above 50 level of the Relative Strength Index (RSI) line, placed at 14, as well as the looming bull cross on the Moving Average Convergence and Divergence (MACD) indicator, also tease XAU/USD buyers despite recent inaction.
It’s worth noting, however, that the upper line of a three-week-old ascending trend channel, close to $1,890 by the press time, will precede the $1,900 threshold to challenge the Gold buyers before directing them toward the $1,930 theoretical target.
Alternatively, the previous weekly top surrounding $1,865 appears to be the immediate support to watch during the XAU/USD declines.
However, the bearish bias remains off the table unless the Gold price stays inside the aforementioned channel, currently between $1,842 and $1,865. Also adding strength to the $1,842 support is the 200-Hour Moving Average (HMA).
Overall, Gold price appears lucrative for the buyers due to the bull pennant confirmation and upward-sloping trend channel pattern.
Gold price: Hourly chart
Trend: Further upside expected
-
23:15
AUD/JPY Price Analysis: Double bottom at risk as the spot tumbles to 91.10s
- AUD/JPY formed a doji in the daily chart, suggesting buyers lost momentum.
- The confluence of the 200-DMA and the 100-DMA, around 91.55/65, stalled the AUD/JPY uptrend.
- AUD/JPY double bottom is still in play, at risk of invalidation if the cross drops below 91.00.
After printing a doji on Tuesday, the AUD/JPY registers minuscule gains of 0.03% as Wednesday’s Asian session begins, though it remains around Tuesday’s close of 91.10. At the time of writing, the AUD/JPY is trading at 91.13.
AUD/JPY Price Analysis: Technical outlook
The AUD/JPY failed to crack the 200-day Exponential Moving Average (EMA) at 91.65 for two consecutive days and, after printing a weekly high of 91.82 on Monday, slid toward the 91.10s area. Tuesday’s price action formed a doji, usually a bearish signal, which could open the door for a test of the 20-day EMA in the near term.
AUD/JPY traders should know that the double bottom remains in play. However, a fall below the December 28 daily high of 91.05 could invalidate the chart pattern.
AUD/JPY support rests at 91.05. A break / close below the latter will expose the 20-day EMA at 90.54, followed by last Friday’s swing low of 90.01.
As an alternate scenario, the Relative Strength Index (RSI) and the Rate of Change (RoC) suggest some buying pressure is building. Therefore, the AUD/JPY resistance levels lie at the 200-day EMA at 91.65, followed by the 92.00 figure and the December 13 daily high of 93.35.

AUD/JPY Key Technical Levels
-
23:05
USD/CHF juggles above 0.9200 as investors await US inflation for fresh impetus
- USD/CHF is hovering around 0.9220 as investors await US inflation for making informed decisions.
- Less-hawkish commentary from Fed Daly kept reins in the US equities.
- Only a stronger-than-expected US CPI would avoid a slide to fresh lows for the USD Index.
The USD/CHF pair is demonstrating a balanced profile around 0.9220 in the early Asian session. The Swiss franc asset has turned sideways as the market participants are awaiting the release of the United States inflation data for fresh cues.
Meanwhile, the risk profile is displaying mixed signals as S&P500 futures remained in the bullish trajectory on Tuesday but risk-perceived currencies showed a subdued performance. US equities picked strength after San Francisco Federal Reserve (Fed) President Mary Daly told the Wall Street Journal (WSJ) she would pay close attention to the Consumer Price Index (CPI) data and that both options of 25- and 50-basis point hikes are open for February monetary policy meeting.
The US Dollar Index (DXY) remained topsy-turvy below the immediate resistance of 103.00 ahead of the US Consumer Price Index (CPI) data. Meanwhile, the demand for US government bonds trimmed as the Fed is still subjected to combat inflation firmly despite a drop in wage growth. The 10-year US Treasury yields have escalated to 3.61%.
Meanwhile, the absence of economic events in the Swiss franc calendar is going to keep investors focused on events in the United States for further action in the Swiss Franc asset.
As per the consensus, the headline CPI will drop to 6.5% while the core inflation that doesn’t inculcate food and energy prices may scale lower to 5.7%. The US Dollar Index is oscillating around its seven-month lows and further downside seems favored. According to the economists at MUFG Bank, only a stronger-than-expected US Consumer Price Index (CPI) on Thursday would avoid a slide to fresh lows for the USD Index.
-
23:01
South Korea Unemployment Rate registered at 3.3% above expectations (2.8%) in December
-
22:50
Japan’s Saito: Interest rates remain low but current situation won't last indefinitely
Early Wednesday morning in Asia, Japan’s Ministry of Finance (MOF) Financial Bureau Chief Michio Saito crossed wires, via Reuters, as he teased higher rates.
More to come...
-
22:42
USD/CAD Price Analysis: 100-day EMA probes bounces off six-week low
- USD/CAD retreats from 100-day EMA after marking a corrective pullback from multi-day low.
- Clear downside break of a four-month-old ascending trend line, bearish MACD signals also favor sellers to aim for 1.3250.
- Buyers need validation from 1.3500 to retake control.
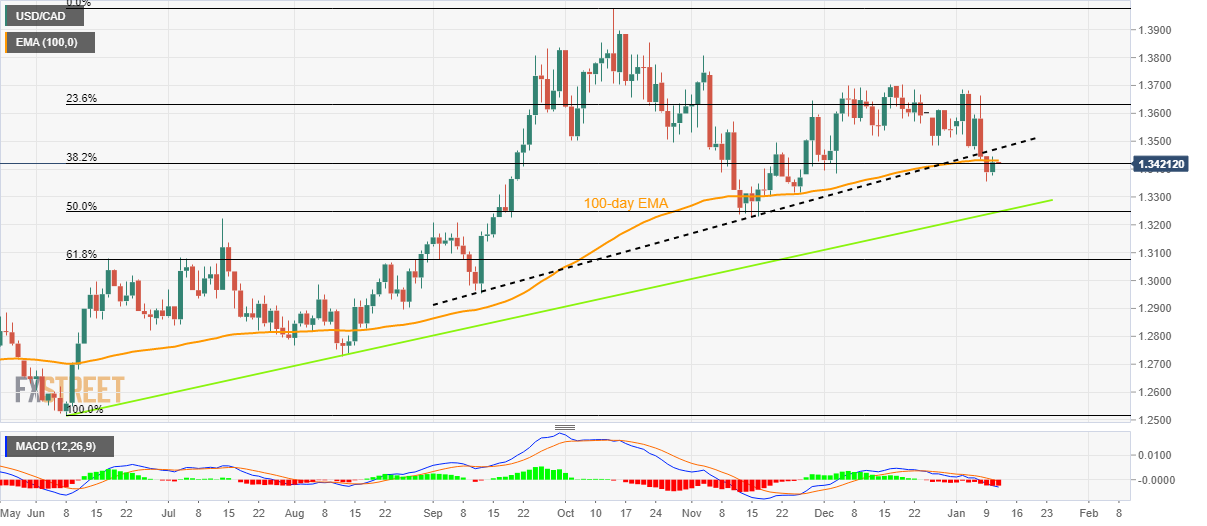
USD/CAD fades bounce off multi-day low, marked the previous day, as the 100-day Exponential Moving Average (EMA) challenges buyers during early Wednesday. That said, the quote currently retreats to 1.3420, after bouncing off the lowest levels since November 25 the previous day.
Not only the inability to cross the 100-day EMA but the Loonie pair’s sustained trading towards the south after breaking an ascending trend line from early September 2022, as well as the bearish MACD signals, also underpin the downside bias for the USD/CAD pair.
As a result, the USD/CAD is likely to decline towards the 1.3250 support confluence, including an upward-sloping support line from June and the 50% Fibonacci retracement level of the pair’s June-October 2022 upside.
Following that, July 2022 peak surrounding 1.3220 could act as the last defense of the pair buyers.
Alternatively, an upside clearance of the 100-day EMA, around 1.3430 by the press time, won’t offer a warm welcome to the USD/CAD buyers as the previous support line, close to 1.3470, acts as an extra filter towards the north.
Even if the quote rises past 1.3470, multiple lows marked since October 2022 around 1.3500 could offer additional challenges for the USD/CAD bulls.
USD/CAD: Daily chart
Trend: Further downside expected
-
22:38
GBP/USD oscillates around 1.2150 as focus shifts to US CPI
- GBP/USD is displaying a rangebound action around 1.2150 as investors await US inflation for fresh cues.
- The downward revision of CY2023 global growth projections by the World Bank failed to impact the S&P500 rally.
- The BOE blamed Prudential Regulation Authority for its faulty risk-management systems.
The GBP/USD pair is displaying back-and-forth moves around 1.2150 in the early Tokyo session. Trading activity in the FX domain has turned quiet as investors are looking to make informed decisions post the release of the United States inflation data. The Cable is likely to dance to the tunes of the US Dollar as anxiety among investors ahead of the US Consumer Price Index (CPI) is expected to soar.
Rally in S&P500 futures continued on Tuesday despite the World Bank slashing the CY2023 global growth forecast dramatically to 1.7% from 3% in June's forecast, as reported by Reuters. World Bank forecasts US 2023 Gross Domestic Product (GDP) growth at 0.5% vs. 2.2% in the June forecast, citing it as the weakest non-recession performance since 1970.
The US Dollar Index (DXY) continues its sideways auction below 103.00 as investors have adopted a ‘wait and watch’ approach ahead of the US price index data. Meanwhile, the 10-year US Treasury yields jumped above 3.6% supported by hawkish commentary from Federal Reserve (Fed) Governor Michelle Bowman.
Reuters reported that Bowman said she expects the rate-setting Federal Open Market Committee (FOMC) will continue raising interest rates to tighten monetary policy, as we stated after our December meeting while noting the pace of future actions will be driven by how the economy performs.
On the United Kingdom front, after a year of sheer volatility in the Pound Sterling region that exposed loopholes in lenders’ risk-management system, the Bank of England (BOE) has criticized UK banks’ defenses to dodge volatility.
In a series of letters from the BOE to the Prudential Regulation Authority, BOE stated that “During 2022, the market reaction to Russia’s invasion of Ukraine, and volatility in the nickel and long-dated gilt markets, reinforced the importance of a robust risk culture and sound risk management practices at firms,” However, events like the collapse of Archegos Capital demonstrated firms large and concentrated exposure to single counterparties.
-
22:23
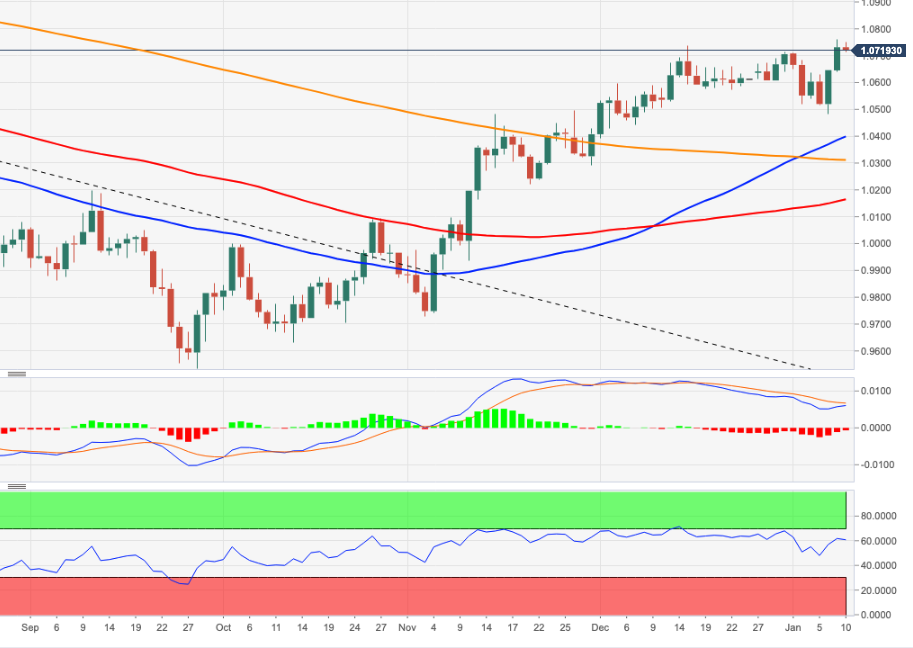
EUR/USD: Bulls and bears jostle around mid-1.0700s with eyes on US Inflation
- EUR/USD lacks momentum after rising to eight-month high.
- US Dollar rebounds despite softer US data on Fed Chair Powell’s hesitance to provide monetary policy clues.
- ECB policymaker appears hawkish but World Bank’s signal for recession probes them.
- China inflation decorates calendar, highlighting risk catalysts as the key.
EUR/USD treads waters around 1.0740 during the early hours of Wednesday’s Asian trading, after portraying a sluggish performance on Tuesday, as traders await the key catalysts for clear directions. Among them, the US Consumer Price Index (CPI) for December gains major attention.
The quote’s latest inaction could be linked to the US Dollar’s ability to hold the ground despite softer prints of the second-tier data. That said, the US NFIB Business Optimism Index for December dropped to the lowest levels since 2013 if ignoring multiple jitters during the global Covid wave. Further, US Wholesale Inventories also remained unchanged with 1.0% growth for November.
The reason for the US Dollar's strength could also be linked to Federal Reserve Chair Jerome Powell's hesitance at Riksbank's International Symposium on Central Bank Independence in offering further clarity on the US central bank’s monetary policy outlook. However, Federal Reserve Governor Michelle Bowman appeared hawkish while stating that more rate rises are needed to combat high inflation.
On the other hand, European Central Bank's (ECB) governing council member Mario Centeno said on Tuesday the current process of interest rate increases is approaching its end. However, another ECB Governing Council member Isabel Schnabel highlighted the need for a restrictive monetary policy stance.
It’s worth noting that the World Bank’s grim economic forecasts and expectations of upcoming recession also seemed to have probed the EUR/USD traders. That said, the World Bank stated that it expects the global economy to grow by 1.7% in 2023, down sharply from 3% in June's forecast, as reported by Reuters.
Amid these plays, the US 10-year Treasury yields rose 10 basis points (bps) to 3.61% and put a floor under the US Dollar even if Wall Street managed to close on the positive side.
Moving on, EUR/USD traders will pay attention to the risk catalysts amid a dearth of major data/events on the calendar ahead of Thursday’s US Consumer Price Index (CPI) data. However, today’s China inflation numbers may entertain intraday traders.
Technical analysis
EUR/USD portrays a Doji candlestick at the multi-month high, which in turn joins nearly overbought RSI levels to tease sellers unless the quote stays below 1.0760.
-
22:08
GBP/JPY Price Analysis: Doji emerges, threatening to send prices tumbling below 161.00
- The GBP/JPY three-day rally stalled around the 20-DMA and the 161.00 mark.
- Oscillators suggest the GBP/JPY might continue its downtrend, but a decisive break above 161.00 could set the pair to challenge the 200-DMA.
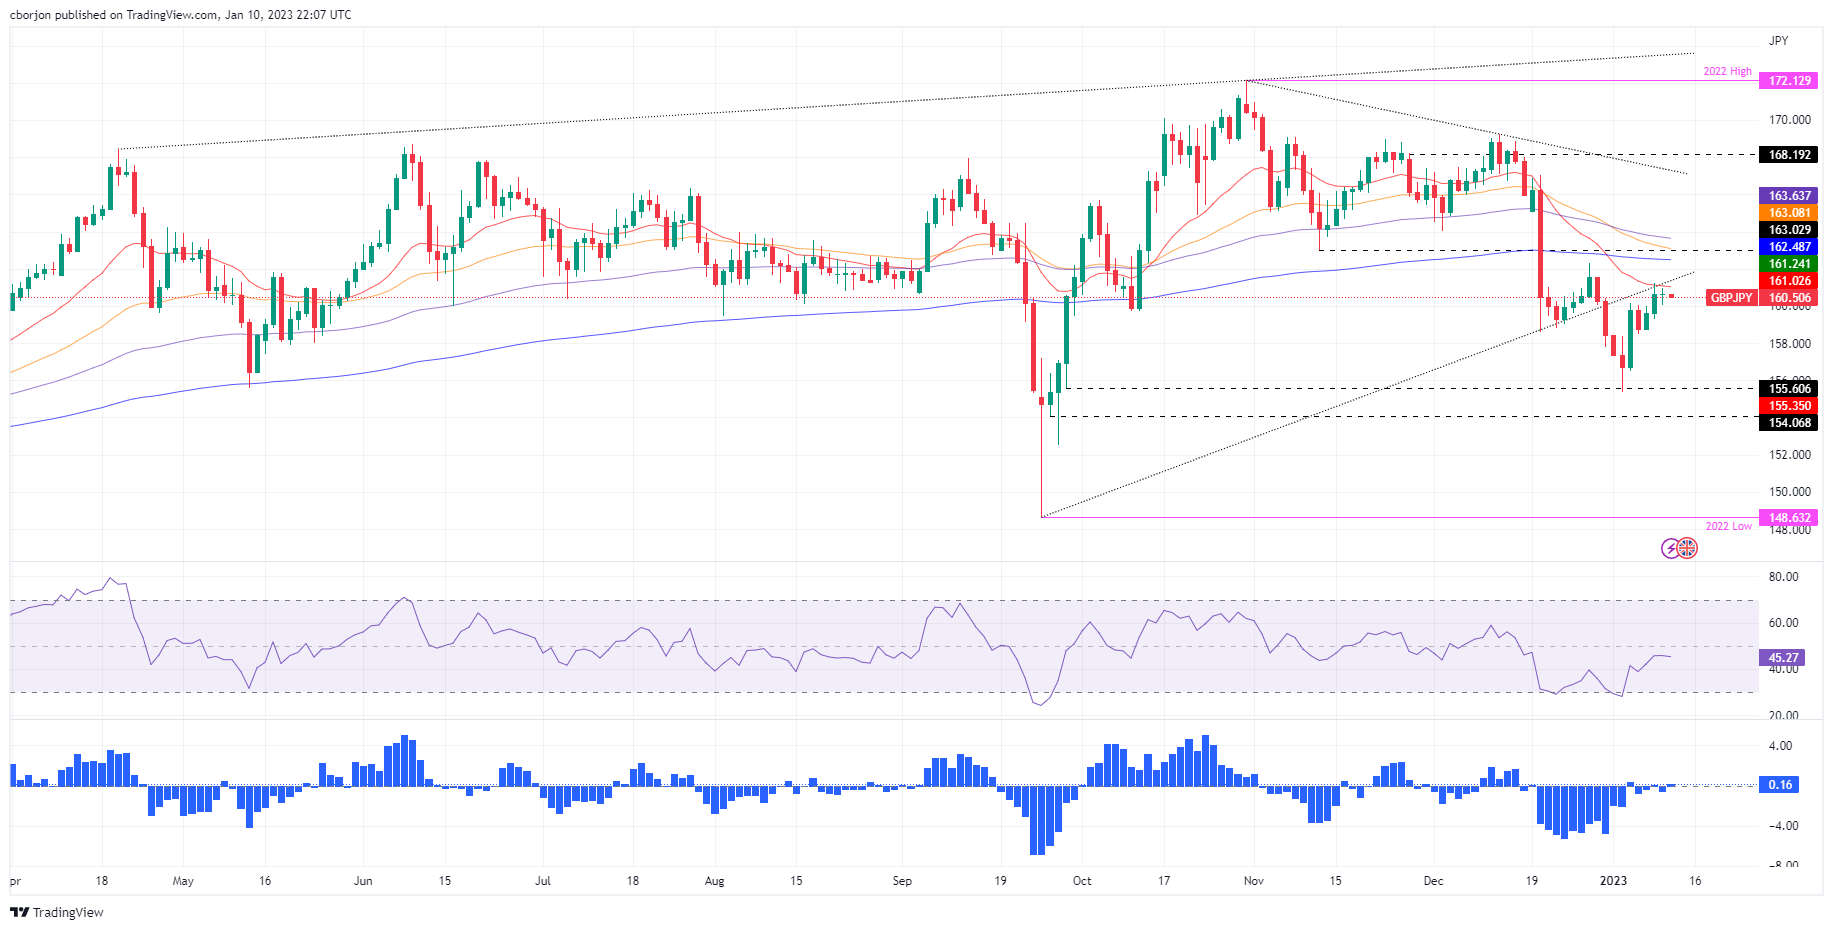
On Tuesday, the GBP/JPY registered solid gains, but the rally stalled around the 20-day Exponential Moving Average (EMA) at 161.08, as sellers leaning into it stepped in, dragging the GBP/JPY lower. Nevertheless, as Wednesday’s Asian session begins, the GBP/JPY is almost unchanged at around 161.02.
GBP/JPY Price Analysis: Technical outlook
From a daily chart perspective, the GBP/JPY is neutral-to-downward biased. In the last two days, the GBP/JPY has been unable to crack the confluence of two technical indicators: the 20-day EMA and a five-month-old upslope support trendline, which turned resistance around the 161.00 mark. If the GBP/JPY pierces that latter, that would be the first step for higher prices, but its next hurdle would be the January 9 daily high of 161.24. A breach of the latter will clear the space towards the 200-day EMA at 162.50, followed by the 163.00 mark.
If that scenario is to play out, oscillators like the Relative Strength Index (RSI) would need to shift bullish, as it remains in bearish territory, while the Rate of Change (RoC) needs to show that selling pressure is waning. Otherwise, the GBP/JPY downtrend would resume.
Hence, the GBP/JPY first support would be the January 10 swing low of 160.04, followed by essential support levels like this week’s low of 159.30, ahead of 159.00.
GBP/JPY Key Technical Levels
-
22:06
AUD/USD needs to reclaim 0.6900 to avoid further downside ahead of US Inflation
- AUD/USD is looking to claim 0.6900 ahead of the Australian CPI and Retail Sales data.
- Market sentiment seems confusing as S&P500 remains solid while risk-perceived currencies witness correction.
- A decent increment in US Treasury yields has weighed down risk-sensitive currencies.
The AUD/USD pair is struggling to recapture the immediate resistance of 0.6900 in the early Asian session after a gradual decline from 0.6950. The Aussie asset is expected to hog the limelight on Wednesday as the Australian Bureau of Statistics will report the monthly Consumer Price Index (CPI) data and monthly Retail Sales.
S&P500 continued its upside momentum on Tuesday, portraying that the risk profile is highly positive. The US Dollar Index (DXY) has continued to hover below 103.00, which indicates that investors are awaiting the release of the United States inflation data for fresh impetus. It seems that risk-perceived currencies have been impacted by a sheer gain in return derived from US Treasury bonds. The 10-year US Treasury yields climbed to near 3.61%.
As per the consensus, the monthly Australian CPI (Nov) is seen higher at 7.3% vs. the former release of 6.9%. Also, Retail Sales are seen higher at 0.6% against a contraction of 0.2% released earlier. Both catalysts are expected to compel the Reserve Bank of Australia (RBA) to continue hiking interest rates further to tame soaring inflation.
On the United States front, Thursday’s inflation data will remain in the spotlight. The headline CPI (Dec) is expected to continue its declining spree and may drop to 6.5% from the former figure of 7.1%. While the core CPI that excludes oil and food prices might slip to 5.7% from 6.0% reported earlier. A similar kind of outcome is going to delight the Federal Reserve (Fed) ahead.
Meanwhile, hawkish commentary from Fed Governor Michelle Bowman failed to infuse strength into the US Dollar. Reuters reported that Bowman said she expects the rate-setting Federal Open Market Committee "will continue raising interest rates to tighten monetary policy, as we stated after our December meeting," while noting the pace of future actions will be driven by how the economy performs.
-
22:02
WTI Price Analysis: Bears eye a run towards $7bbls
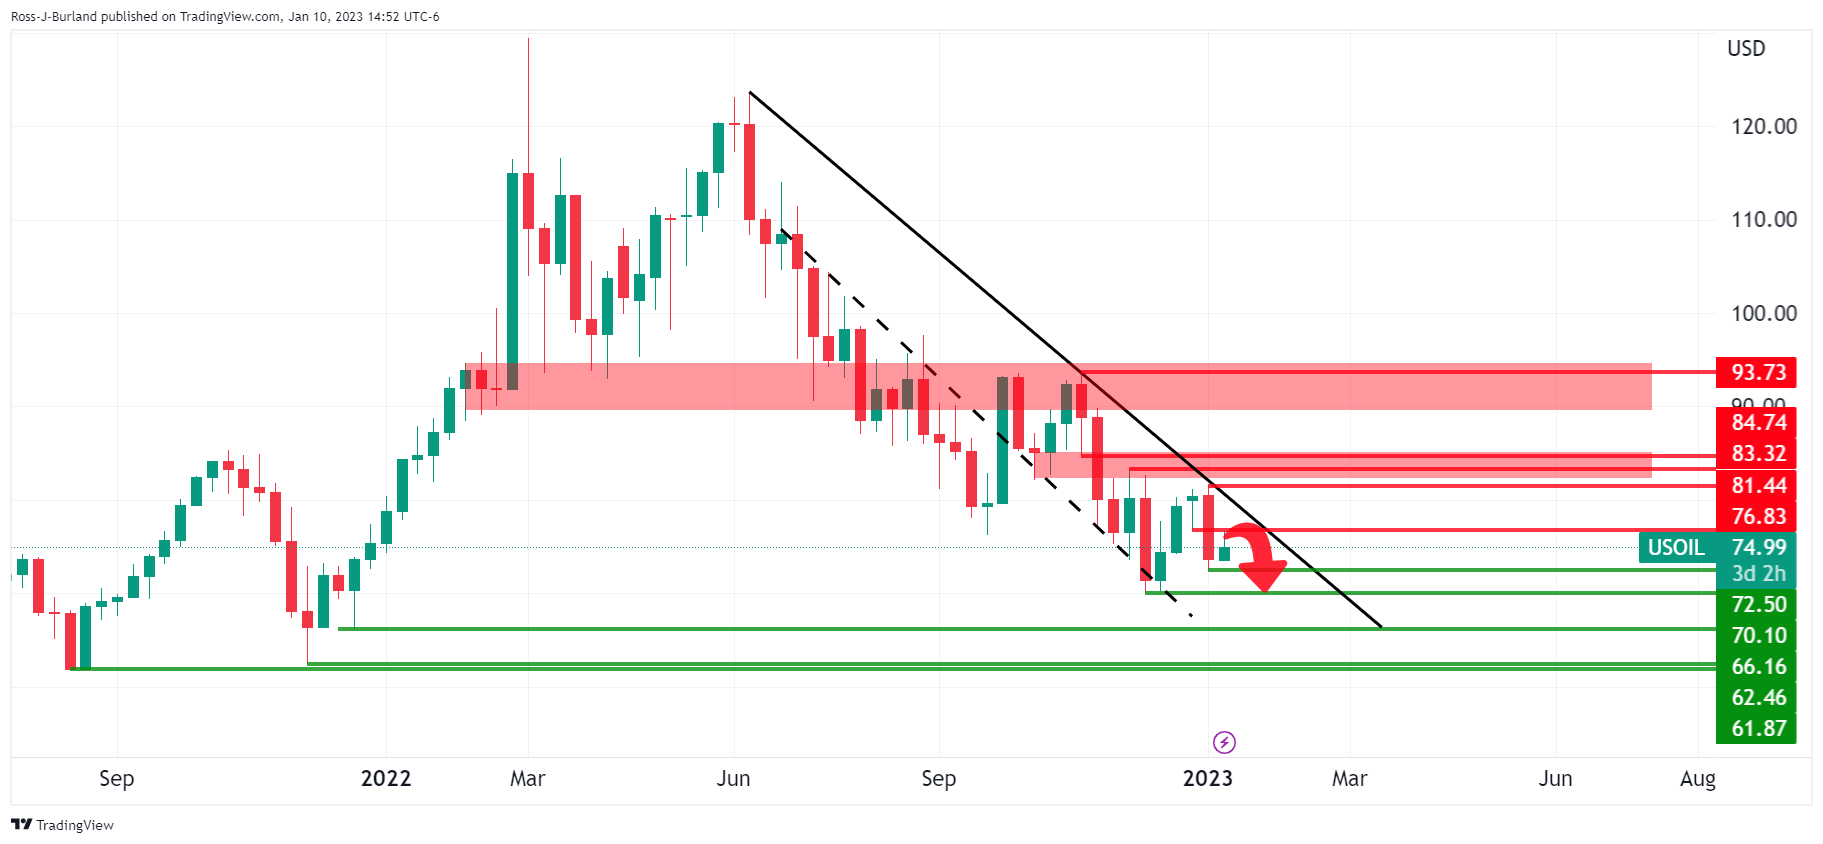
- The 4-hour chart offers a head and shoulders scenario for WTI.
- We have already seen a break of structure, BoS, then this gives kudos to the downside bias with $70.00 eyed.
West Texas Intermediate, WTI, crude oil rose for a fourth-straight session Tuesday on optimism due to the reopening of China's borders. There is also speculation that the Federal Reserve is on the way to pivoting and this pouts this week's red calendar event, Consumer Price Index, in focus.
The US is expected to report inflation slowed again in December, easing pressure on the Federal Reserve to further slow the economy and therefore create a cheaper US Dollar environment for overseas investors of oil that could come in more demand.
Nevertheless, the technical outlook could be painting a conflicting scenario. Tuesday's price action could be deemed as a liquidity hunt before the next major move to the downside as the following will illustrate:
WTI weekly chart
There is a bearish bias while being on the front side of the weekly trend and the build-up of horizontal resistances.
WTI daily charts

The daily M-formation is compelling as the neckline is resisting bullish advances towards a 50% mean reversion.
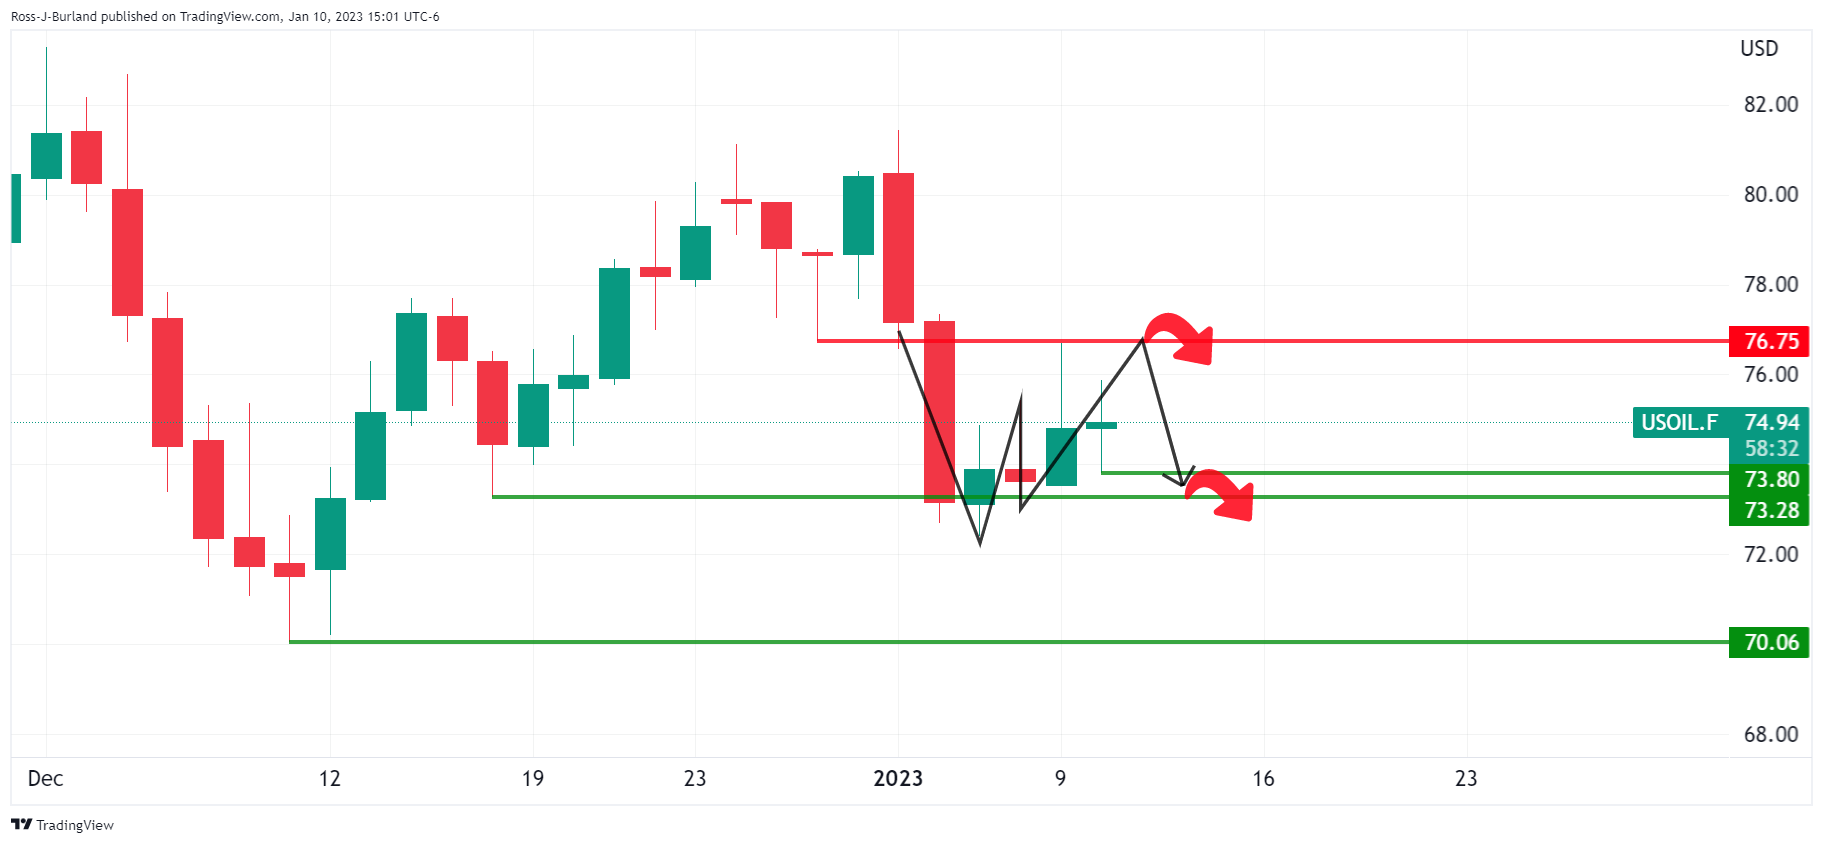
Futures charts show the Ww-formation taking shape, so a pull on the price would be expected, at least while below the $76.70s.
WTI H4 chart

The 4-hour chart offers a head and shoulders scenario and given we have already seen a break of structure, BoS, then this gives kudos to the downside bias fore the foreseeable future with $70.00 eyed.

-
21:54
United States API Weekly Crude Oil Stock increased to 14.865M in January 6 from previous 3.298M
-
21:30
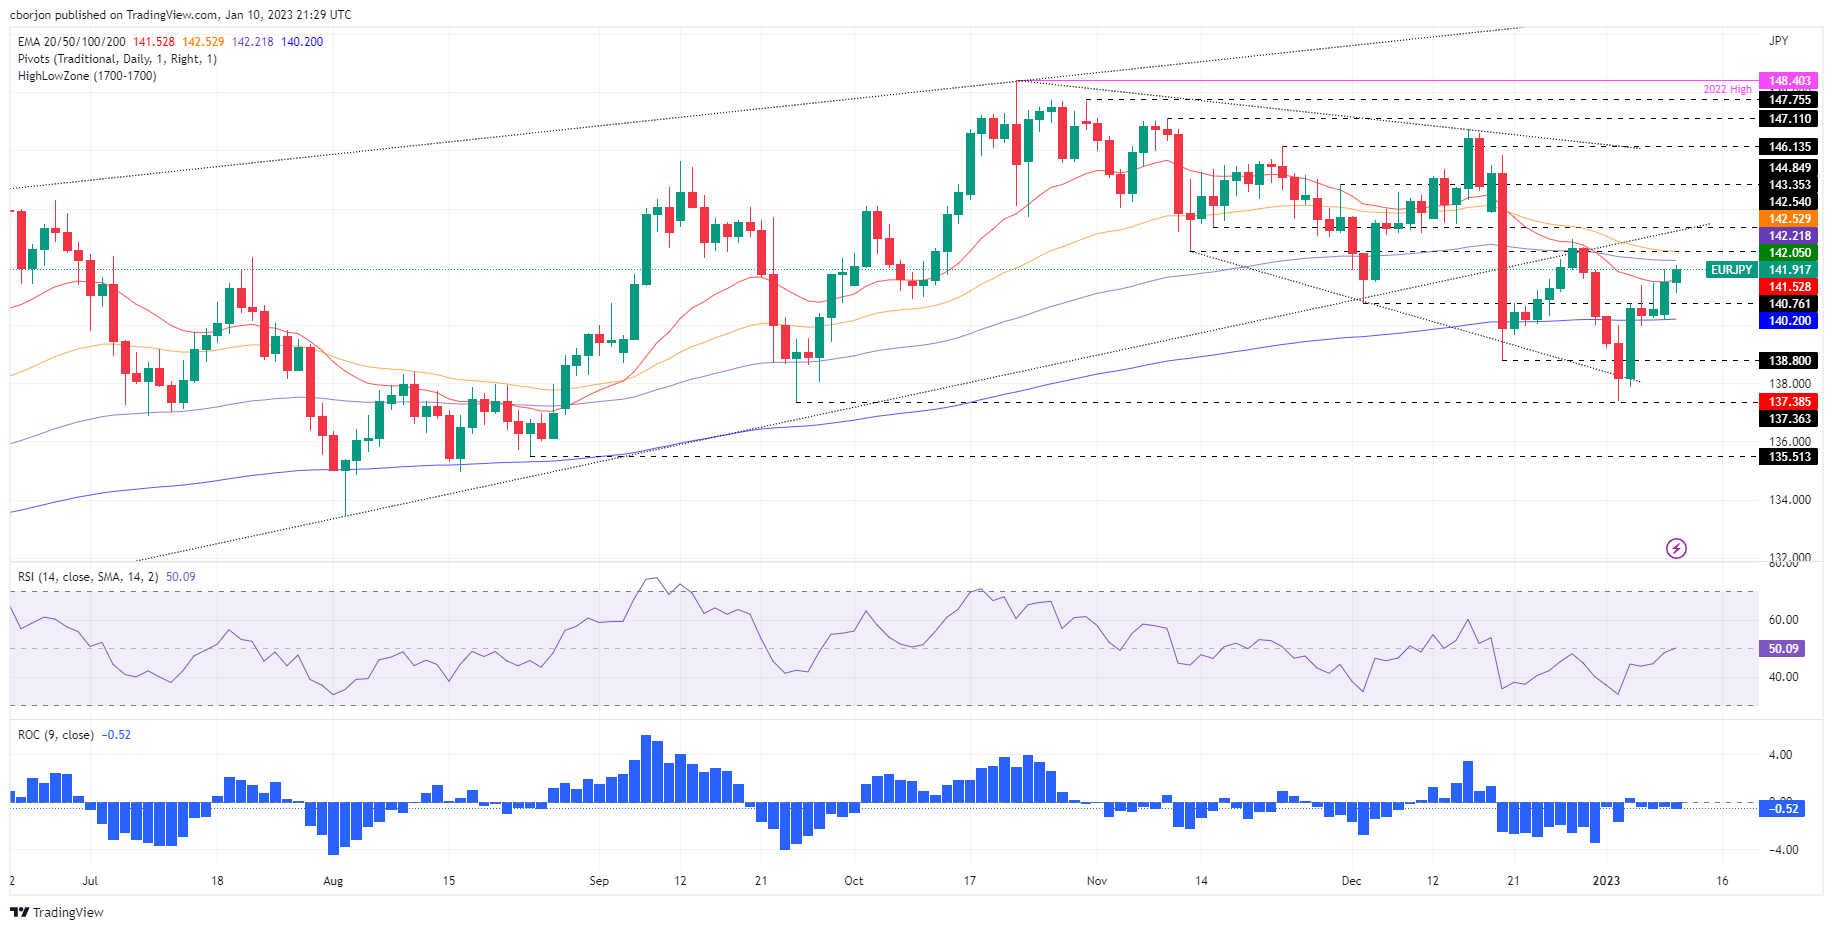
EUR/JPY Price Analysis: Creeps above the 20-DMA but stalls around 142.00
- EUR/JPY climbs but stalls around 142.00, the confluence of the figure and the 100-DMA
- The EUR/JPY would be bullish above 142.00; otherwise, it could plunge towards 141.00.
EUR/JPY extends its gains to three consecutive trading days, up by 0.38%, as Wall Street finished Tuesday’s session with solid gains. On its way toward two-week new highs, the EUR/JPY cleared the 20-day Exponential Moving Average (EMA) at 141.53 and is poised to test the 100-day EMA at 142.22. At press time, the EUR/JPY is trading at 141.97.
EUR/JPY Price Analysis: Technical outlook
The cross-currency pair daily chart suggests that buyers remain in charge after clearing the 200-day EMA on January 4, at around 140.16. To continue its uptrend, the EUR/JPY needs to reclaim the 142.00 figure, even though it would face solid resistance around the 100-day EMA. If the EUR/JPY breaks the latter, that will clear the way toward the 50-day EMA at 142.50, followed by the 143.00 mark.
However, if the EUR/JPY’s rally stalls at 142.00, tha can set the pair towards testing the 20-day EMA on the downside around 141.53. Once cleared, the EUR/JPY will slide towards 141.00, followed by a challenge of the 200-day EMA at 140.20.
EUR/JPY Key Technical Levels
-
20:26
NZD/USD bulls are tiring ahead of US CPI as the main event
- NZD/USD bulls eye a test of resistance before Thursday's CPI event that leaves the 0.6470s exposed.
- NZD/USD traders will be looking to the lower timeframes for signs of deceleration from the bulls that could lead to a break of 0.6200.
NZD/USD is heading into the end of the North American session flat on the day so far, giving kudos to the prior technical analysis, NZD/USD Price Analysis: Bears are lurking in critical resistance area.
In forex markets that are treading water in search of catalysts, at the time of writing, NZD/USD is trading at 0.6367, about where it opened on Tuesday but it ranged between a low of 0.6342 and 0.6389 on the day.
US CPI data in focus
In a note at the start of the Asian day on Wednesday, analysts at ANZ Bank said the fact that ''FX markets are treading water ahead of key US CPI data tomorrow night is no real surprise given the amount of emphasis bond markets is putting on that data (as the last major piece of the puzzle before the February Federal Reserve meeting).''
The analysts added that ''markets remain USD centric; and while US CPI has the scope to weaken the USD if the data is weak/softer, one of the Fed’s key messages remains that wherever its policy rate peaks, cuts will be a long way off. That may yet dampen USD headwinds.''
As for the expectations of the CPI data, analysts at TD Securities said that they are looking for core prices to have edged higher on a month-on-month basis (MoM) in December, closing out the year on a relatively stronger footing.
''Indeed, we forecast a firm 0.3% MoM increase, as services inflation likely gained momentum. In terms of the headline, we expect Consumer Price Index (CPI) inflation to register a slight decline on an unrounded basis in December but rounded up to flat MoM, as energy prices offered large relief again. Our m/m projections imply that headline and core CPI inflation likely lost speed on a year-over-year basis in December,'' the analysts added.
For the US Dollar, the analysts said ''unless the core measure significantly surprises to the upside, USD rallies should be sold into. We think the bar is high to compel a reversal of fortune despite the USD tactically stretched.''
NZD/USD technical analysis
Nevertheless, as per the prior technical analysis, NZD/USD is on the backside of the prior bullish trend and could be lining up for a bearish breakout:
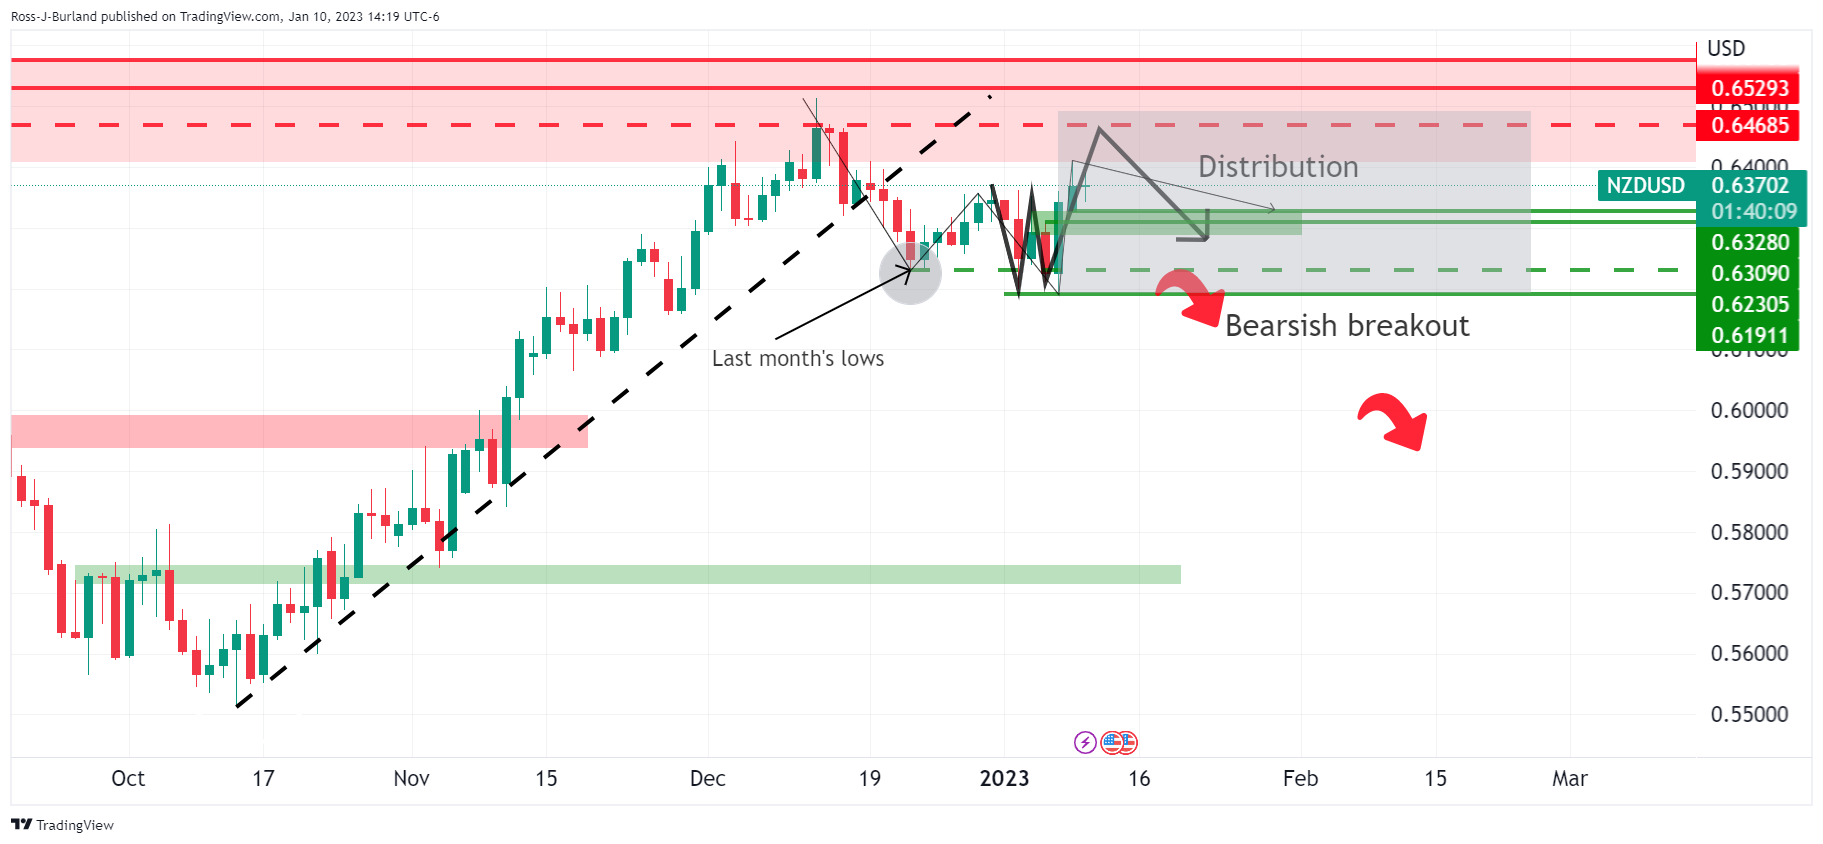
That is not to say, however, that a test of resistance cannot happen before Thursday's CPI event. This leaves the 0.6470s exposed. In any case, traders will be looking to the lower timeframes for signs of deceleration from the bulls that could lead to a break of 0.6200 and the 0.6191 recent lows in time to come.
-
20:01
Forex Today: Wait-and-see continues ahead of US inflation figures
What you need to take care of on Wednesday, January 11:
The FX board saw little action on Tuesday amid a scarce macroeconomic calendar and as investors await some central banks’ clarity. US Federal Reserve Chief Jerome Powell and his counterparts from Canada and Japan were on the wires, although as part of a symposium on central bank independence, giving no fresh clues on monetary policies.
The US Dollar advanced throughout the first half of the day but ended it mixed as Wall Street managed to revert pre-opening losses and posted a modest advance. At the same time, US government bond yields advanced. Investors are unwilling to risk much ahead of the release of US inflation data next Thursday.
The EUR/USD pair hovers around 1.0740, while GBP/USD stands at 1.2160, down on the day. Commodity-linked currencies also eased against the greenback, with AUD/USD trading around 0.6890 and USD/CAD in the 1.3420 price zone. Finally, the USD/JPY pair trades marginally higher at around 132.20.
Gold consolidates at around $1,876 a troy ounce, while crude oil ticked higher in the American afternoon. WTI settled at $75.20 a barrel.
The upcoming Asian session will be interesting regarding macroeconomic data, as Australia will publish the November Monthly Consumer Price Index, which is foreseen at 7.3% YoY, up from the previous 6.9%. Also, Australia will unveil November Retail Sales, expected to have increased by 0.6% after falling 0.2% in the previous month. Finally, it is worth adding that China will publish the December Consumer Price Index (CPI) and the Producer Price Index (PPI) for the same month.
Solana price uptrend holding steady as bulls rally 60% on the month
Like this article? Help us with some feedback by answering this survey:
Rate this content -
19:54
Gold Price Forecast: XAU/USD bulls taking on critical equal highs ahead of US CPI
- Gold Price is moving up but bears are lurking with the United States Consumer Price Index eyed.
- The US Dollar is establishing after meeting seven-month lows and a rebound could be sparked on a higher Consumer Price Index.
- Gold Price test of equal highs and break thereto could be leading the bulls into a trap.
Gold price is trading higher by some 0.3% at the time of writing, after climbing from $1,867.92 to a high of $1,880.79 on the day so far. Gold price bulls have been in charge for several days as the US Dollar met a seven-month low of 102.9 in the prior sessions.
However, traders in Gold price will be mindful of red news on the calendar on Thursday in the United States Consumer Price Index (CPI) that marries up with a potentially technically bearish schematic on the charts as the following analysis, below illustrates. In essence. the bulls could be running into a trap. As analysts at Brown Brothers Harriman explained, who continue to believe markets are underestimating the Federal Reserve; ''it's hard to reconcile a risk rally with deep US yield curve inversion.''
China has been moving Gold price higher
Additionally, analysts at TD Securities argued that ''the strength in gold prices is inconsistent with the bearish macro backdrop, as highlighted by its diverging relationship with real rates.''
The analysts explained that ''under the hood, relentless buying from China has fueled a squeeze on CTA trend follower positioning over the past months, and has yet to show signs of abating.'' The analysts said ''mysterious large-scale Chinese purchases of gold have single-handedly catalyzed a $150/oz rally.''
''Our tracking of positioning for the top ten traders in China highlights a continued accumulation of gold, with this cohort adding another 2.4 tonnes of notional gold to their net length overnight,'' the analysts at TD Securities added.
''CTA trend followers could still exacerbate upside flows with a break north of the $1900/oz mark likely to spark a sizeable buying program equivalent to nearly +8% of algos' maximum historical position size,'' the analysts note explained further in conclusion.
US Dollar bulls emerge on hawkish Federal Reserve officials
Meanwhile, the US Dollar came under modest selling pressure following the Chair of the Federal Reserve (Fed), Jerome Powell, who made unrelated comments at the start of the US session: ''We are not and will not be a climate policymaker''.
However, the DXY index is trading back around 103.25 and is now flat on the day in the middle of the 103.03/49 range. The US Dollar has been recovering from a seven-month low of 102.9 in the prior session as hawkish remarks from Fed policymakers this week so far have sparked a fresh wave of demand for the US Dollar.
On Monday, San Francisco Fed president Mary Daly noted that she expects interest rates to rise beyond 5% in 2023. On the same day, Raphael Bostic argued policymakers should hike above 5% by early in the second quarter and hold rates there for a long time.
US Consumer Price Index could be a catalyst for Gold price
US Treasury bond yields rose ahead of US December inflation data coming Thursday. The report is expected to say inflation rose at an annualized rate of 6.5% last month, down from 7.1% in November. Analysts at TD Securities explained the following:
''We are looking for core prices to have edged higher on a month-on-month basis (MoM) in December, closing out the year on a relatively stronger footing. Indeed, we forecast a firm 0.3% MoM increase, as services inflation likely gained momentum. In terms of the headline, we expect Consumer Price Index (CPI) inflation to register a slight decline on an unrounded basis in December, but rounded up to flat m/m, as energy prices offered large relief again. Our m/m projections imply that headline and core CPI inflation likely lost speed on a year-over-year basis in December.''
For the US Dollar, the analysts said ''unless the core measure significantly surprises to the upside, USD rallies should be sold into. We think the bar is high to compel a reversal of fortune despite the USD tactically stretched.''
Gold price technical analysis
However, Gold price has been moving sideways over the course of several sessions within a three-day bullish impulse. With that being said, on the lower time frames the Gold price is coiled, leading to the assumption that a breakout is imminent, one way or the other and the CPI data could be the trigger to spark a wave of either demand or supply.
Nevertheless, the following technical analysis of the Gold price arrives at a bearish conclusion, at least for the near term.
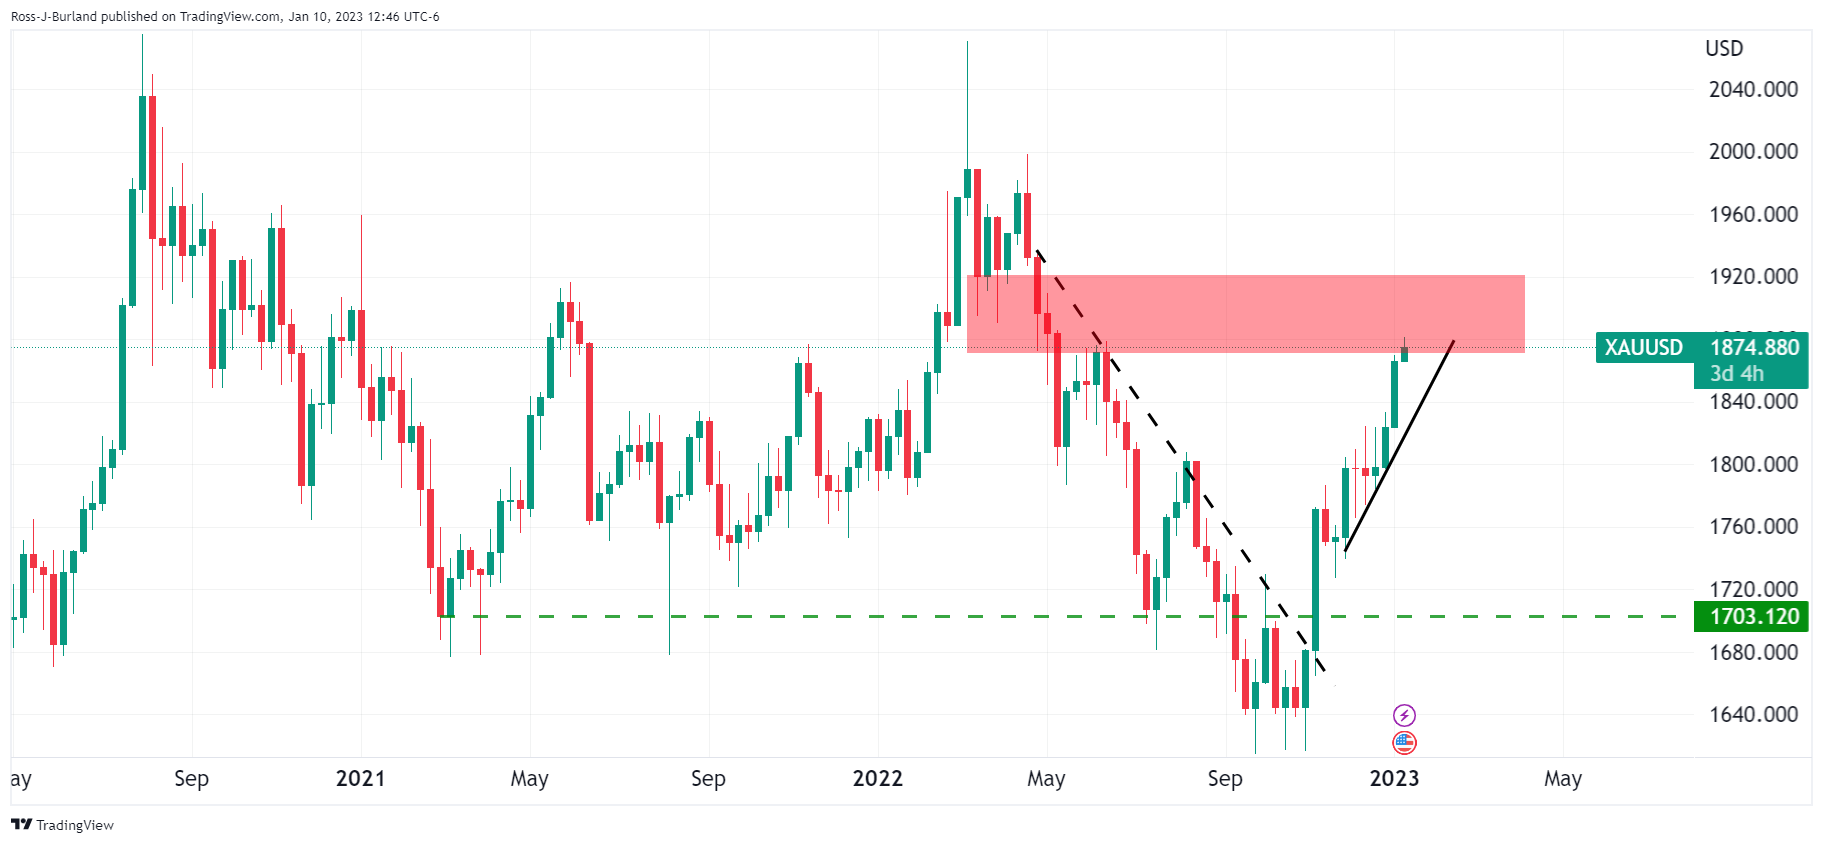
Gold price weekly chart, above, shows Gold running towards $1,880. It is yet to be shown as to whether the market can end this week for a fourth consecutive bullish close. If we move down to the daily Gold price chart, we can see prior equal highs finally being tested and ''swept'' as follows:
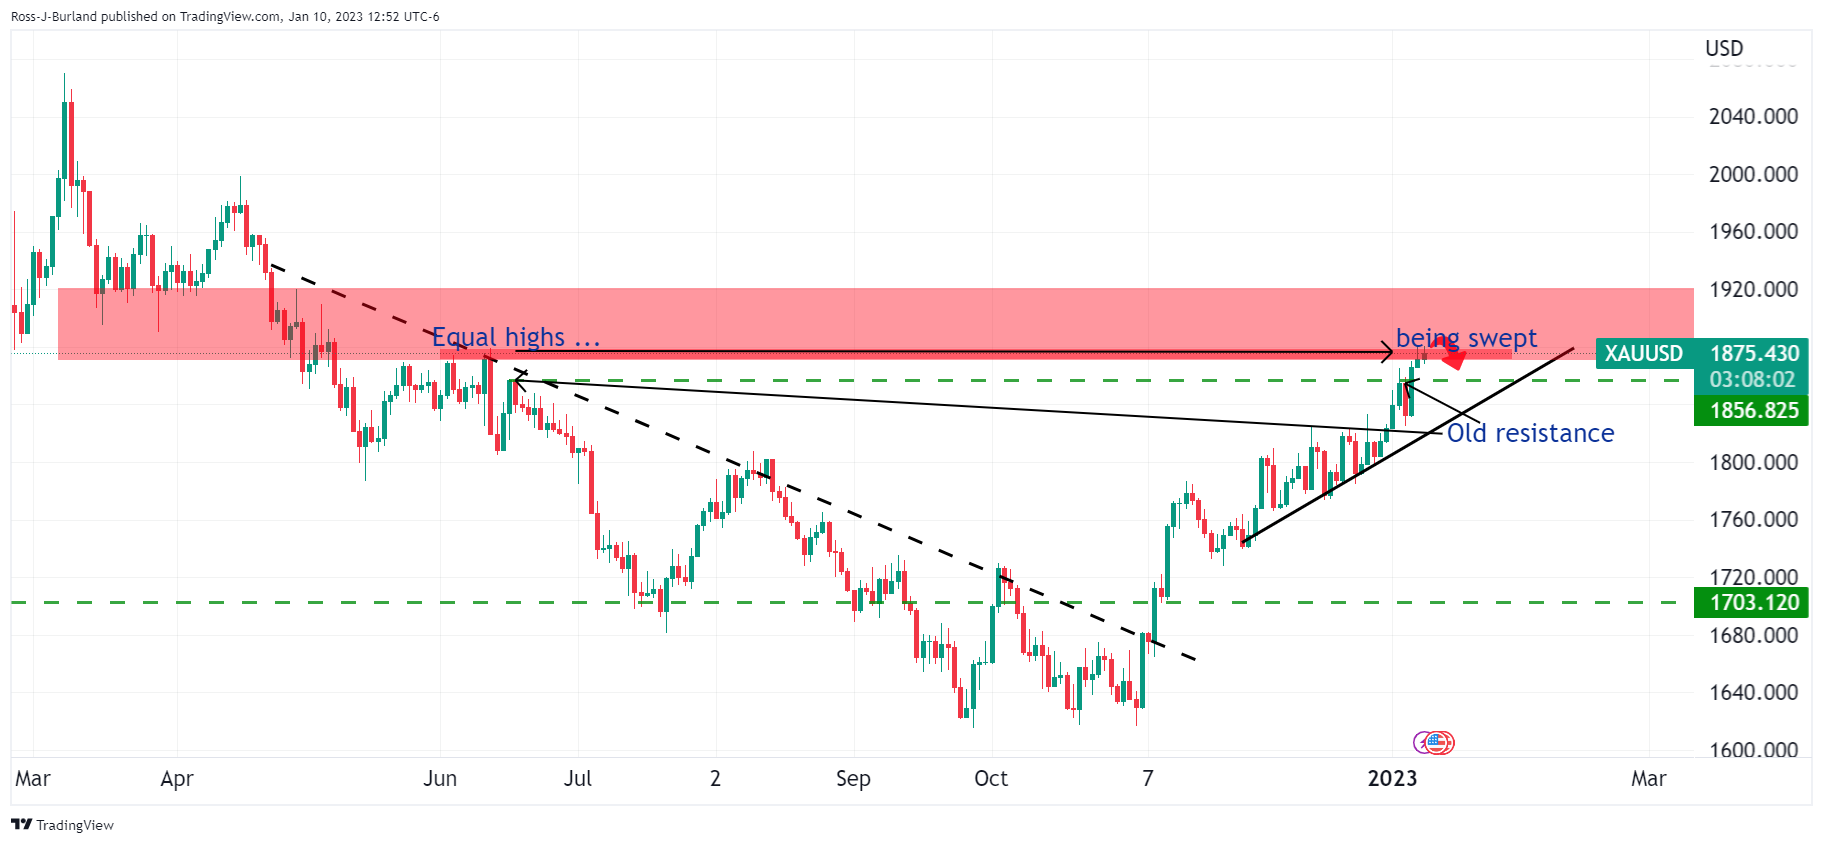
This phenomenon occurs on a fractal basis whereby the equal levels are ''swept'' only to fuel a reversal in price. After all, most breakouts fail. So, the following will assume a near-term bearish scenario for the Gold price:

(Gold price daily chart zoomed in, above and below)

As it stands, the current Fibonacci scale drawn on the recent bullish Gold price rally puts the 38.2% ratio in line with prior resistance that would be assumed to act as support for a reversal in the Gold price.

Moving down to the Gold price 4-hour chart, the bears will need to break whatever bullish structure there are that ultimately guards the target area some $23/oz below towards $1,850.
-
18:55
USD/CHF Price Analysis: Rises back above 0.9200 as bullish harami emerges
- USD/CHF rebounds around 0.9170s as buyers stepped in, lifting the pair nearby 0.9200.
- For the USD/CHF to extend its losses, it needs a daily close below 0.9200.
- Otherwise, a bullish harami candlestick pattern could exacerbate a USD/CHF rally toward 0.9300.
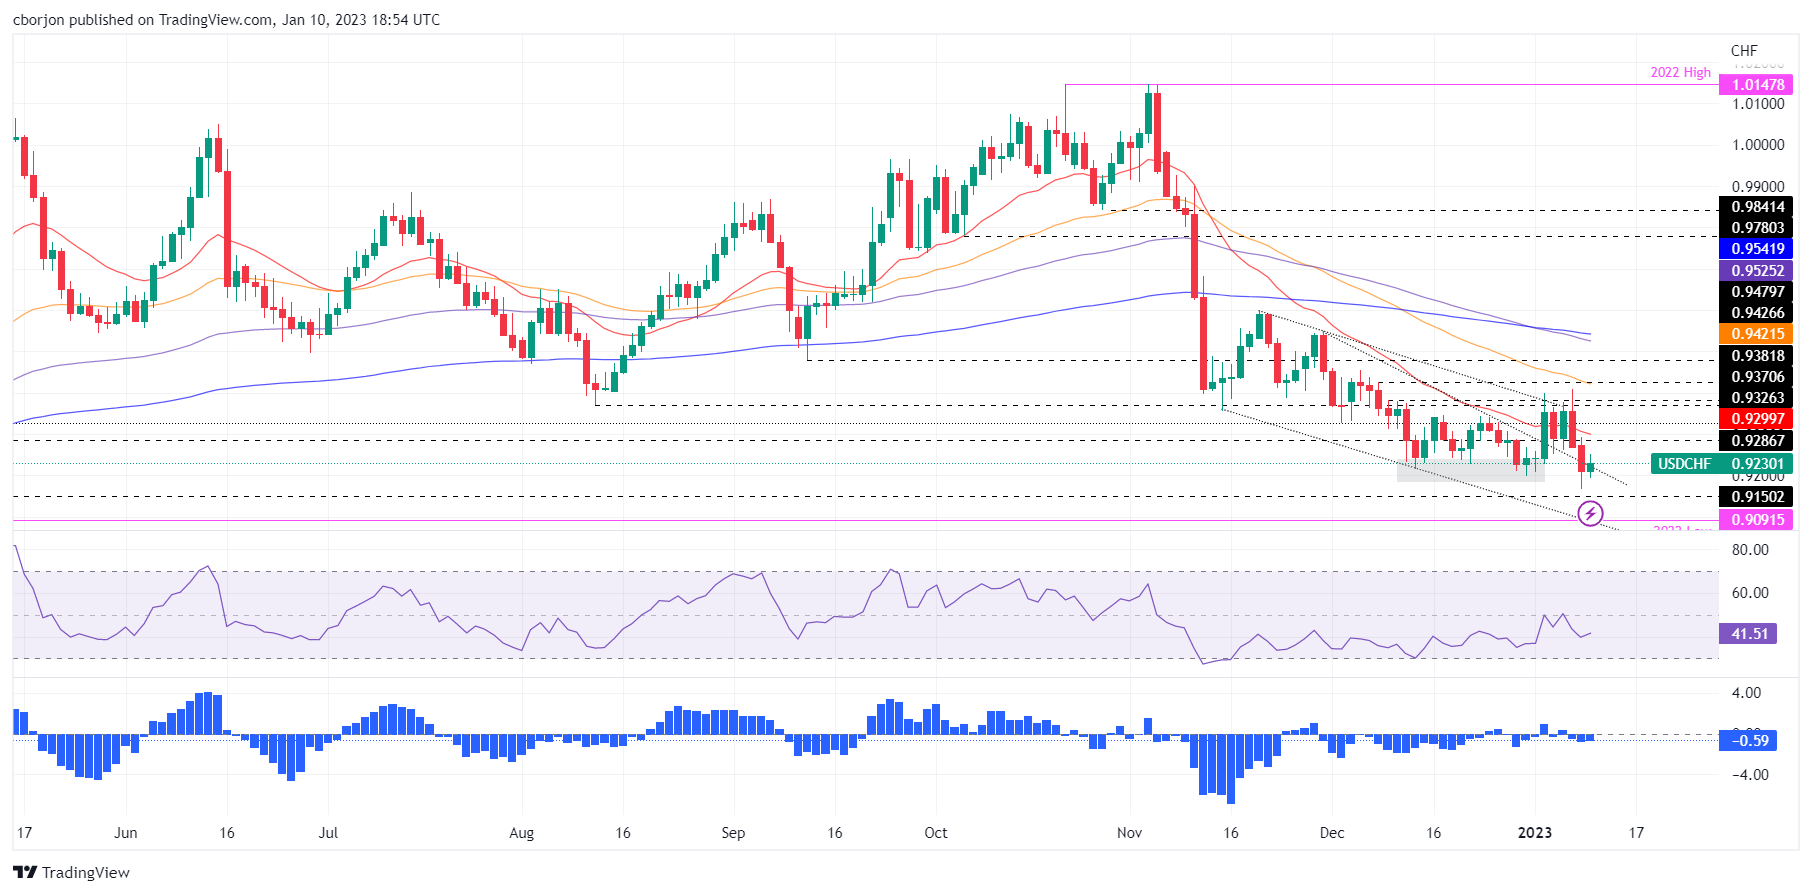
USD/CHF is trimming Monday’s losses and bounces from daily lows, as sellers failed to gain traction beneath the 0.9200 figure, achieving a daily low of 0.9194 before giving way to buyers. Therefore, the USD/CHF is forming a bullish harami candlestick pattern, pending confirmation. Therefore, the USD/CHF is trading at 0.9234, gaining 0.25%.
USD/CHF Price Analysis: Technical outlook
After failing to extend its losses below 0.9167, the USD/CHF stages a comeback. Formation of a bullish harami could open the door for further upside, though it needs to be confirmed once the USD/CHF reclaims 0.9292. If that scenario is achieved, then the USD/CHF next resistance would be the 20-day Exponential Moving Average (EMA), which tracks bullish/bearishness price action in the pair, at 0.9299. followed by the last week’s high of 0.9409.
However, the Relative Strength Index (RSI) remains at bearish territory, though aiming up, keeping buyer hopeful of higher prices.
As an alternate scenario, the USD/CHF key support levels would be the 0.9200 figure, followed by the January 9 daily low of 0.9167, ahead of the 0.9100 mark.
USD/CHF Key Technical Levels
-
18:14
United States 3-Year Note Auction fell from previous 4.093% to 3.977%
-
18:08
ECB's Centeno tilts hat towards an end of the interest rate rise process
Reuters reported that the European Central Bank's governing council member Mario Centeno said on Tuesday the current process of interest rate increases is approaching its end.
''The central banker, who was answering Portuguese legislators during a committee hearing in Lisbon, added even though inflation may have some resistance in January and February it will resume falling in March.''
Key notes
We are approaching the end of the interest rate rise process.
Inflation may have some resistance in January and February but will fall again in March.EUR/USD update
EUR/USD Price Analysis: Bulls could be running into a trap
EUR/USD is extending the bullish rally on Tuesday and has been trying to print a fresh high for this week's initial balance, taking the US Dollar down to 1.0759 vs. the Single Currency on the bull's quest for a test towards 1.0800. However, as the analysis above hints, a bull trap could be in the making but Thursday's US Consumer Price Index data will be waited for as a potential catalyst as the following daily chart analysis illustrates:
-
17:59
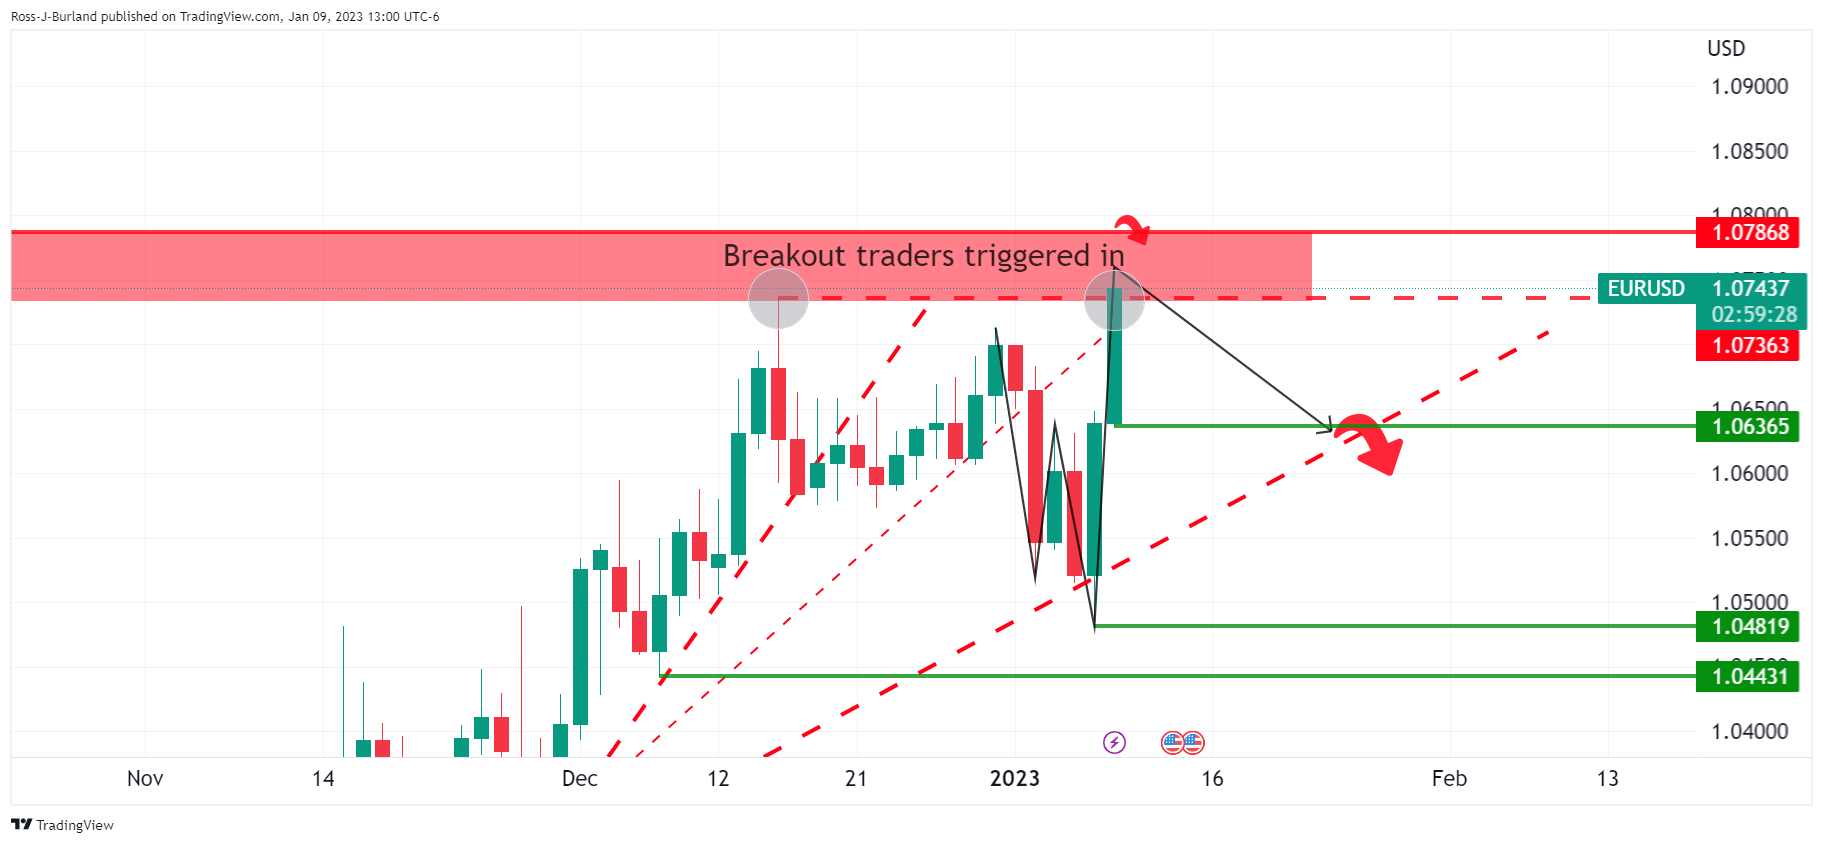
EUR/USD Price Analysis: Bulls could be running into a trap
- EUR/USD bearish W-formation remains is in focus in the build-up to US CPI.
- Bulls could find themselves trapped in trying to break out through recent highs.
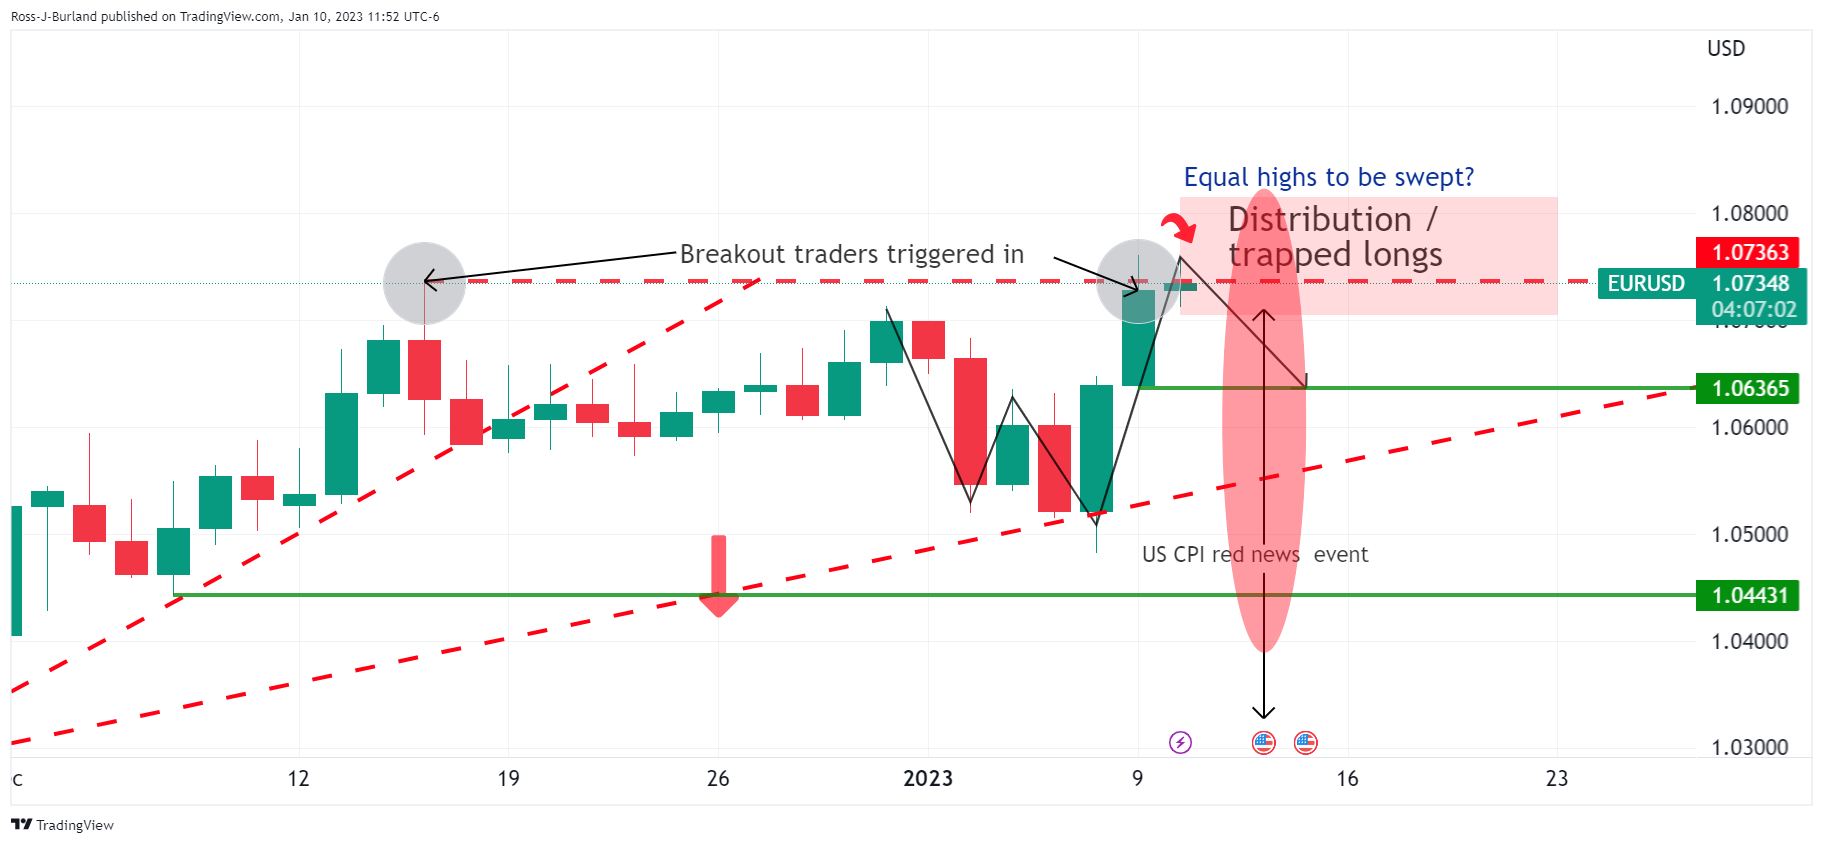
EUR/USD is extending the bullish rally on Tuesday and has printed a fresh high for this week's initial balance, taking the US Dollar down to 1.0759 vs. the Single Currency on the bull's quest for a test towards 1.0800. However, as illustrated at the start of the week's technical analysis, EUR/USD Price Analysis: Breakout traders triggered long, bears looking to pounce, we have red news on the calendar on Thursday that marries up with a technically bearish fo5rmation on the charts as the following will illustrate. Bull could be running into a trap and as analysts at Brown Brothers Harriman explained, who continue to believe markets are underestimating the Fed; ''it's hard to reconcile a risk rally with deep US yield curve inversion.''
EUR/USD technical analysis
In the prior analysis, it was explained that EUR/USD rallied towards a key resistance area but has started to slow in its ascent which leaves the focus on signs of distribution for the days ahead.
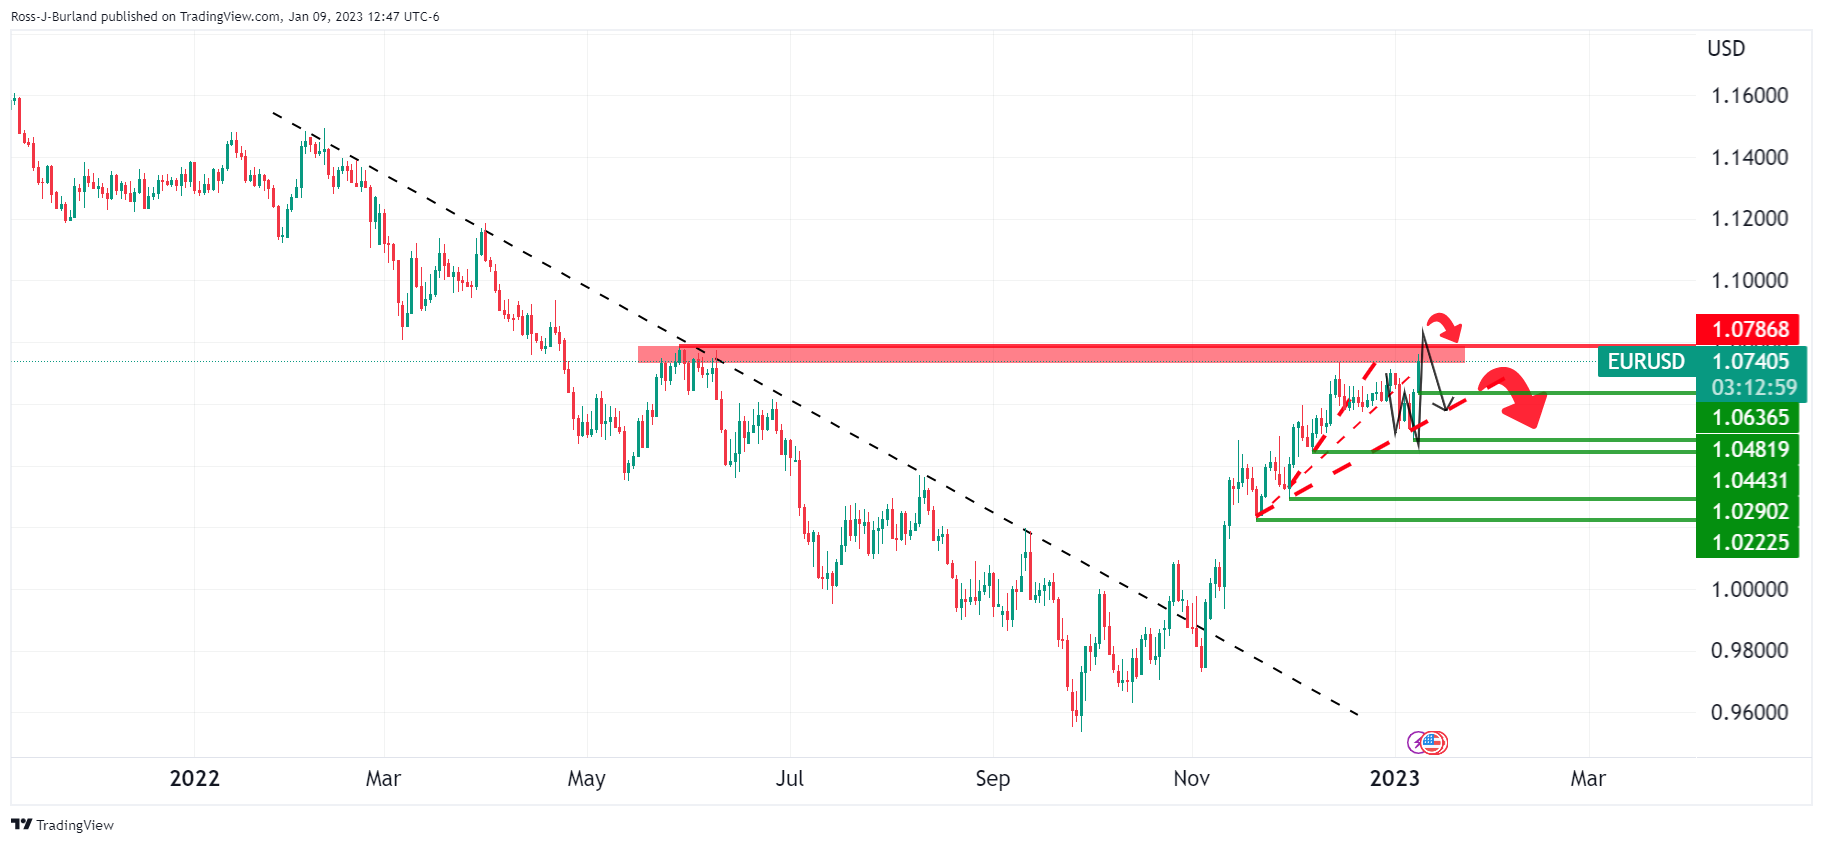
EUR/USD had reached up to test prior highs of 1.0736 and has moved into a critical resistance area as a potential last stop before the bears move back in. We have seen a bullish open for Tuesday but are yet to see a fresh high. Nevertheless, there is still time until Thursday's red news in the United States Consumer Price Index which leaves scope for a push towards 1.0800, although lacking a significant catalyst, this could be a tall order.
Zoomed in...
(Monday above, Tuesday, so far, below)
If the bears emerge below 1.0790, then the focus will be on signs of distribution again that will ultimately trap the breakout long positions.
The W-formation is supportive of such a thesis given that it is a reversion pattern. EUR/USD would be expected to revert towards the neckline and day's lows of near 1.0637. This could put the trendline support back under pressure and open the risk of a move below 1.0500 and on to test 1.0480, 0.0440 and then 1.0300 that guards 1.0290 and 1.0225 lower down.
In the meantime, bears will be on the lookout for the phenomenon of a sweep of the relatively equal highs towards, say, 1.0800, failures and a break of structure to the downside to change the character from bullish to bearish in the schematic. The lower time frames can be monitored for signs of buying exhaustion over the coming sessions. A long squeeze below 1.0750/36 could then be in order with US Consumer Price Index eyed as a potential catalyst on Thursday for this three-day set-up and bearish opportunity.
-
17:44
USD/CAD hovers around the 20-day EMA around 1.3420s
- USD/CAD struggles for direction as the US Dollar rises, while oil prices capped the upside.
- US Treasury bond yields spurred the uptick in the US Dollar, keeping the USD/CAD above its 20-DMA.
- Thursday’s US Consumer Price Index (CPI) and Jobless Claims would provide fresh impetus to USD/CAD traders.
The USD/CAD registers minuscule losses in the mid-North American session after hitting a daily low of 1.3357. Market sentiment remains fragile, fluctuating, while a late bid in the US Dollar (USD) spurred a jump in the USD/CAD pair. At the time of writing, the USD/CAD is trading at 1.3424, slightly down by 0.14%.
USD/CAD is directionless, influenced by a strong US Dollar, high oil prices
US equities are seesawing amidst a mixed mood. The greenback is pairing some of its losses, according to the US Dollar Index (DXY), which measures the buck’s performance against a basket of peers, up 0.11%, at 103.281, underpinned by high US bond yields. The US 10-year benchmark note rate is climbing nine bps, to 3.630%, after US Federal Reserve (Fed) Chief Jerome Powell’s speech did not acknowledge the monetary policy.
Of late, Federal Reserve Governor Michell Bowman said that continued rate hikes are needed to curb inflation. She added that she’s looking for “convincing evidence” that inflation has peaked and that incoming data will influence her view on the size of interest rate hikes.
On the Canadian side, a staggering labor market report last Friday increased the likelihood of a 25 bps rate hike, according to TD Securities analysts. “Today’s report leaves the Bank of Canada in an uncomfortable position.” They added that deceleration in wages would not satisfy Bank of Canada’s (BoC) policymakers and stated, “we now look for the Bank to hike another 25bps to 4.50% in January. We expect that 4.50% will be the BoC’s terminal rate for this cycle.”
In the meantime, a jump in crude oil prices is putting a lid on the USD/CAD recovery as WTI climbs 0.86%, exchanging hands around $75.44 per barrel.
Ahead of the week, the US economic docket will feature the release of the Consumer Price Index (CPI) for December, alongside unemployment claims, on Thursday. An absent Canadian economic calendar would leave USD/CAD traders adrift to US Dollar dynamics.
USD/CAD Key Technical Levels
-
17:35
Fed's Bowman's hawkish comments: More rate rises needed to combat high inflation
Federal Reserve Governor Michelle Bowman said on Tuesday the US central bank will have to raise interest rates further to combat high inflation. Her comments follow a slew of hawkish remarks from prior Fed speakers this week.
"Inflation is much too high," she said.
"We have a lot more work to do" she added in prepared remarks for a speech to a banking group in Florida.
Reuters reported that Bowman said she expects the rate-setting Federal Open Market Committee "will continue raising interest rates to tighten monetary policy, as we stated after our December meeting," while noting the pace of future actions will be driven by how the economy performs.
Key remarks
"Once we achieve a sufficiently restrictive federal funds rate, it will need to remain at that level for some time in order to restore price stability, which will in turn help to create conditions that support a sustainably strong labor market," Bowman said.
"I take this as a hopeful sign that we can succeed in lowering inflation without a significant economic downturn."
She added that "while the effects of monetary policy tightening on the job market have generally been limited so far, slowing the economy will likely mean that job creation also slows."
Bowman said that for her to know inflation has eased enough for the Fed to stop hiking rates, she will "be looking for compelling signs that inflation has peaked and for more consistent indications that inflation is on a downward path."
US Dollar update
The US Dollar came under modest selling pressure following the Chair of the Federal Reserve, Jerome Powell, who made unrelated comments at the start of the US session: ''We are not and will not be a climate policymaker''.
Meanwhile, the DXY index is trading around 103.25 and flat on the day in the middle of the 103.03/49 range. However, it has been recovering from a seven-month low of 102.9 in the prior session as hawkish remarks from Fed policymakers this week so far have sparked a fresh wave of demand for the US Dollar.
San Francisco Fed president Mary Daly noted yesterday that she expects interest rates to rise beyond 5% in 2023. On the same day, Raphael Bostic argued policymakers should hike above 5% by early in the second quarter and hold rates there for a long time.
-
16:12
USD/MXN Price Analysis: Mexican peso hits its highest level in a month, looking at 19.00
- US Dollar remains weak against Emerging Markets currencies.
- USD/MXN testing 2022 lows near 19.10, closer to 19.00.
- Bearish pressure to alleviate above 19.50
The USD/MXN is falling again on Tuesday as it continues to move with a bearish bias, approaching the 19.00 psychological area. Earlier today it bottomed at 19.08, the lowest level in a month and slightly above the 2022 low it hit in November.
The bias is bearish in USD/MXN but it is facing a strong resistance area between 19.10 and 19.00. Technical indicators are near oversold readings which could suggest some consolidation ahead before a break lower. A candidate for the range is the 19.00-19.30 band or a wider one between 19.00 and 19.50.
The strength of the Mexican Peso is likely to remain intact while USD/MXN trades under 19.50. The initial resistance level is seen at 19.30. Then comes the 20-day Simple Moving Average, currently at 19.47 and then the 19.50 area. A break above 19.60 would point to more gains for the US Dollar, targeting 19.80.
USD/MXN daily chart
-638089631429859377.png)
-
16:07
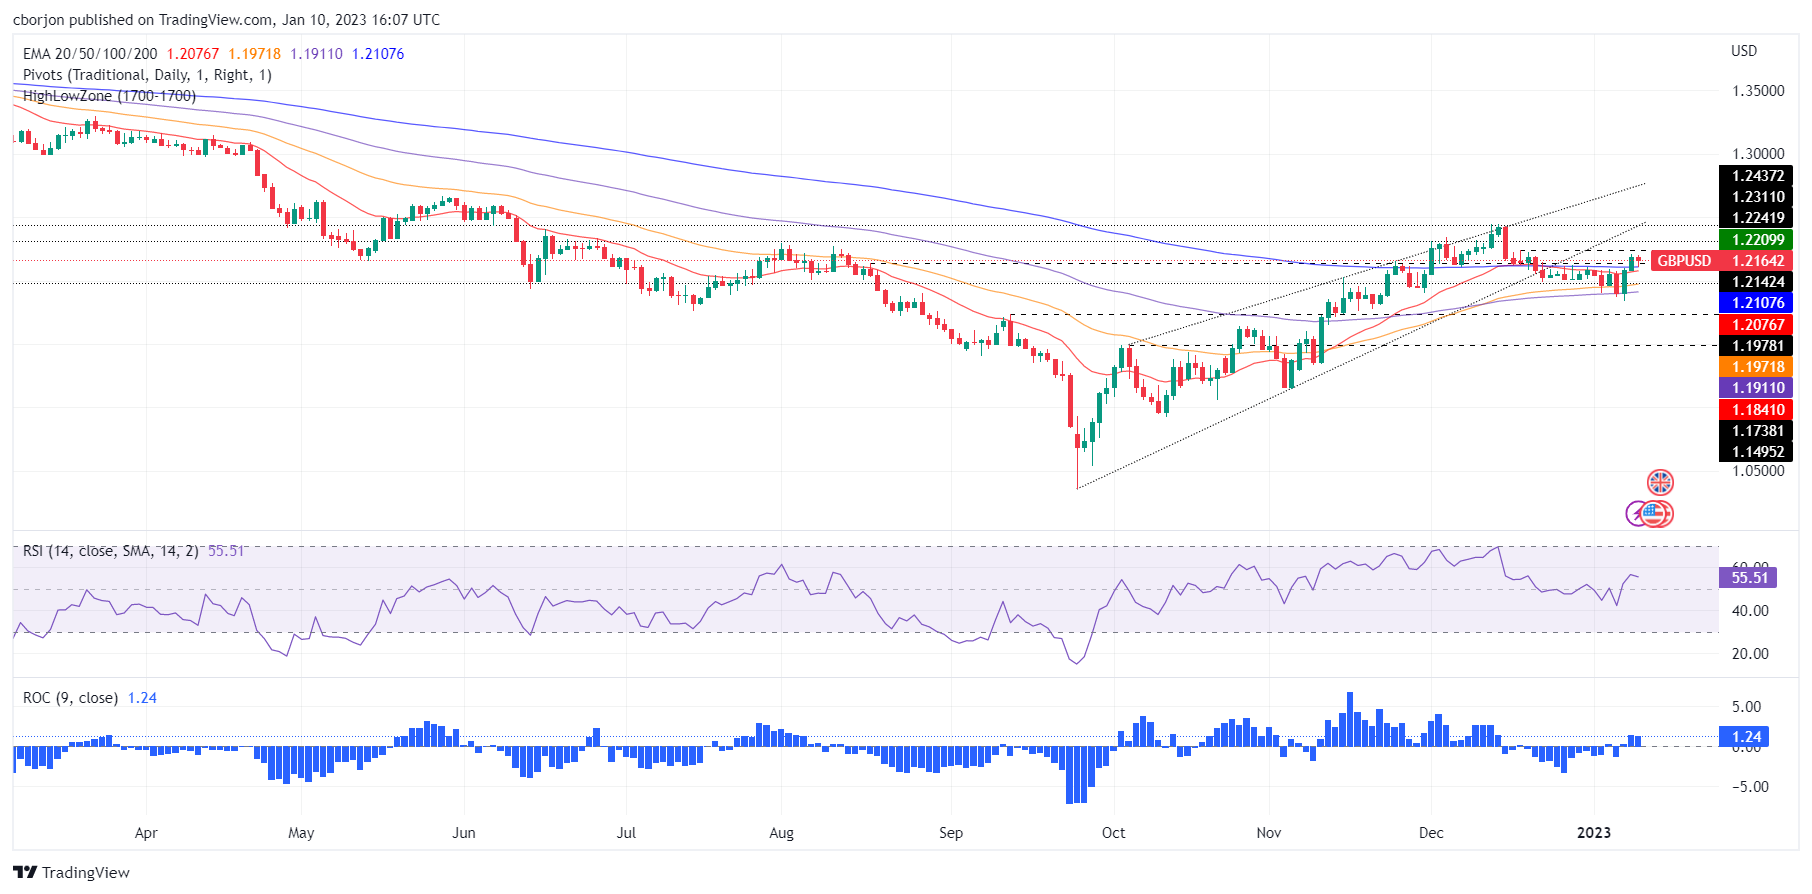
GBP/USD Price Analysis: Stalls around 1.2200, aims toward 1.2150s
- GBP/USD registers some decent losses after failing to climb above 1.2200.
- For the GBP/USD to extend its gains, it needs to reclaim 1.2200, to pose a challenge of 1.2300.
The Pound Sterling (GBP) trims some of its Monday gains vs. the US Dollar (USD), drops below 1.2200, and aims toward the 1.2150 area after hitting a daily high at around 1.2197. Hence, the GBP/USD falls 0.17% and is trading at 1.2161.
GBP/USD Price Analysis: Technical outlook
On Tuesday, the GBP/USD is edging toward the 200-day Exponential Moving Average (EMA) at 1.2107 after failing to decisively crack the 1.2200 figure. Oscillators like the Relative Strength Index (RSI) and the Rate of Change (RoC) suggest that buying pressure is easing. So, chances of the GBP/USD’s testing the 200-day EMA, albeit slim, remain.
For that scenario to play out, the GBP/USD needs further to extend its losses and clear the 200-day EMA. Once done, the next hurdle would be 1.2100, followed by the 20-day EMA at 1.2074, and then the 1.2000 mark.
Otherwise, if the GBP/USD turns positive, the first resistance would be the 1.2200 mark. A breach of the latter will expose the December 19 daily high of 1.2242, followed by the 1.2300 mark.
GBP/USD Key Technical Levels
-
16:04
Gold Price Forecast: XAU/USD could skyrocket to $2,300 on a move beyond highs at $2,070/2,075 – Credit Suisse
Gold has started 2023 strongly. Strategists at Credit Suisse do not rule out a strong surge to the $2,300 mark.
Break below $1,729 to turn the risk back lower
“We look for further tactical gains to test the 61.8% retracement of the 2022 fall and June 2022 high at $1,876/96, which ideally caps for now. Should strength directly extend though we see resistance next at the 78.6% retracement and April 2022 high at $1,973/1,998.”
“Whilst on a big picture basis this strength is seen as a rally within a broader long-term sideways range, should the rally ever extend above the record highs from 2020 and 2022 at $2,070/2,075, this would be seen to mark a significant and long-term break higher, opening up we think $2,300 and likely beyond.”
“Support is seen initially at $1,824.50, then the 200DMA at $1,780. Below $1,729 though is needed to warn the broader risk may be turning lower again.”
-
15:49
EUR/GBP to inch higher towards 0.90 over coming months – Rabobank
EUR/GBP has paid little heed to the news related to Northern Ireland this week. Economists at Rabobank retain a six-nine month forecast of EUR/GBP 0.90.
UK backdrop remains sour
“Even though, this week’s news provides a glimmer of hope for the outlook regarding the Northern protocol and thus for an improvement in investor sentiment, as things stand that UK backdrop remains sour.”
“Insofar as UK fundamental remains characterised by recession, high inflation, low investment growth and weak productivity we continue to expect EUR/GBP to edge towards 0.90 on a six to nine-month view. That said, we will be continuing to watch developments surrounding the protocol closely.”
-
15:38
EUR/GBP rebounds from two-week lows toward 0.8850
- ECB officials continue to speak about higher interest rates.
- Euro is supported by higher EZ bond yields.
- EUR/GBP approaching again critical resistance area of 0.8850.
The EUR/GBP is rising for the second day in a row, after hitting on Monday the lowest level in two weeks. The cross climbed from 0.8769 and peaked on Tuesday at 0.8846, supported by a stronger Euro across the board.
Euro supported by yields
The Euro is up versus the Pound and the Swiss Franc on Tuesday. Higher Eurozone bond yields are helping the common currency. The German 10-year bond yield stands at 2.29% the highest in two days up 2.75% for the day.
European Central Bank officials continue to speak with a hawkish tone while in the UK, concerns about the health of the economy remain intact. UK fundamentals are on debate at the Bank of England’s Monetary Policy Committee.
“As UK fundamental remains characterised by recession, high inflation, low investment growth and weak productivity we continue to expect EUR/GBP to edge towards 0.90 on a 6 to 9 month view. That said, we will be continuing to watch developments surrounding the protocol closely”, explained analysts at Rabobank.
The chart show risks titled to the upside in EUR/GBP after the cross was able to hold above the 20-day Simple Moving Average (today at 0.8785). The upside remains limited by the critical resistance area of 0.8850. A daily close well above 0.8850 should open the doors to more gains in the short-term.
Technical levels
-
15:31
USD/BRL can hover around 5.30 despite insurrection in Brasilia – Wells Fargo
Over the weekend, supporters of former President Jair Bolsonaro stormed Brazil's capital. But insurrection in Brasilia does not change Wells Fargo’s outlook.
Riots unlikely to disrupt Brazil
“While political risk is typically elevated in Brazil and could weigh on local asset prices, we believe Brazil's ‘January 6 moment’ will not have a long-lasting impact on local financial markets nor the economy.”
“Despite more elevated political risk, we maintain our view that the USD/BRL exchange rate can hover around 5.30 by the end of Q1-2023 and that the Real can strengthen by the end of this year toward 5.00.”
“We also believe this past weekend's events will not alter the course of Brazilian Central Bank (BCB) monetary policy, and we continue to believe policymakers will begin an easing cycle in Q3 of this year. In addition, our base case scenario for a mild and modest economic recession by the middle of this year is still intact.”
-
15:17
USD/JPY fluctuates ahead of 132.00 on an upbeat mood, soft USD
- The USD/JPY seesaws nearby the 132.00 figure though it remains unable to reclaim it.
- Traders’ mood improved as US equities turned green, while the US Dollar continued to edge lower.
- USD/JPY Price Analysis: To remain sideways around 132.00 ahead of Thursday’s US CPI report.
The USD/JPY clings to gains following the release of the US Federal Reserve (Fed) Chair Jerome Powell’s Speech at Sweeden Riksbank, which did not acknowledge monetary policy, but rather focused on central bank independence. Therefore, risk appetite continues to improve as Wall Street futures shed some losses. At the time of writing, the USD/JPY is trading at 132.06, registering modest gains of 0.07%.
USD/JPY seesaws around 131.90s on mixed sentiment
Investors’ mood was negative ahead of the Fed’s Chair Powell speech. According to newswires, equities pullback was attributed to Fed’s Bostic and Daly comments on Monday, seen as hawkish. Nevertheless, the financial market did not respond to a “reprice” of a less hawkish Fed, meaning that US Treasury bond yields continued to fall, ignoring Fed officials’ comments.
Data-wise, an absent US economic docket keeps the USD/JPY trading unchanged. However, comments by Fed policymakers emphasizing the central bank’s resolution to curb inflation slightly weighed on investors’ mood. Fed’s Daly and Bostic added that rates would need to be above the 5% range and would need to be held higher for longer, at least until 2024.
As mentioned above, the odds for a 25 bps rate hike by the Federal Reserve remain at 77.2%, while for 50 bps stand at 22.8%.
Earlier in the Asian session, a hot Tokyo CPI print on an annual basis, around 4%, failed to underpin the Japanese Yen (JPY). So, in the short term, further USD/JPY upside could be expected.
The US Dollar Index (DXY), which tracks the buck’s value against a basket of six currencies, including the Japanese Yen (JPY), drops 0.06%, at 103.244. in the meantime, the US 10-year Treasury bond yield, which positively correlates with the USD/JPY, is gaining almost four bps, up at 3.573%, underpinning the USD/JPY.
USD/JPY Price Analysis: Technical outlook
Therefore, the USD/JPY bias remains neutral-to-downwards, though, in the near term, it could remain sideways ahead of Thursday’s US inflation report. For the USD/JPY to shift bullish, it would need a daily close above the 20-day Exponential Moving Average (EMA) above 133.38, which could underpin the major to test the 200-day EMA at 134.74. Otherwise, a fall beneath January’s 9 daily low of 131.30 could open the door for a test of the YTD low of 129.50.
-
15:09
USD/CAD: Break below 1.3380 to trigger more losses to the mid-1.33 zone – Scotiabank
The USD/CAD pair is trading unchanged in the session. Economists at Scotiabank believe that the cross could sustain losses on a dip under the 1.3380 mark.
Key support is located at 1.3220
“We spot intraday resistance at 1.3420 and support at 1.3380; weakness below 1.3380 should trigger more USD losses to the mid-1.33 zone.”
“Key support remains at 1.3220.”
“Resistance is located at 1.3510/15.”
See – USD/CAD: Support area at 1.3225/03 to serve as a firm floor to avoid further weakness – Credit Suisse
-
15:03
United States IBD/TIPP Economic Optimism (MoM) declined to 42.3 in January from previous 42.9
-
15:00
United States Wholesale Inventories unchanged at 1% in November
-
14:53
EUR/USD: Further upside appears limited around 1.0760
- EUR/USD navigates a narrow range amidst vacillating markets.
- The dollar also trades in an erratic fashion despite higher yields.
- Markets’ attention gyrates to Thursday’s US CPI release.
EUR/USD manages well to keep the trade in the area of multi-month peaks around 1.0740 so far on Tuesday.
EUR/USD remains supported above 1.0700
The generalized absence of volatility in the global markets motivates EUR/USD to alternate gains with losses above 1.0700 the figure, while bulls see their aspirations somewhat limited around 1.0760 for the time being.
The modest uptick in the pair comes in line with the equally humble advance in the German 10-year Bund yields, which add to Monday’s gains near 2.30%.
Earlier in the session, Industrial Production in France expanded 0.2% MoM in November, whereas the NFIB Business Optimism Index dropped to 89.8 in December.
Later in the US docket comes the IBD/TIPP Economic Optimism Index followed by Wholesale Inventories.
What to look for around EUR
EUR/USD has embarked on a strong recovery and has already retaken the key barrier at 1.0700 the figure and beyond.
In the meantime, the European currency is expected to closely follow dollar dynamics, the impact of the energy crisis on the region and the Fed-ECB divergence.
Back to the euro area, the increasing speculation of a potential recession in the bloc emerges as an important domestic headwind facing the euro in the short-term horizon.
Key events in the euro area this week: France Industrial Production (Tuesday) – France final Inflation Rate, Germany Full Year GDP Growth, MEU Balance of Trade/Industrial Production (Friday).
Eminent issues on the back boiler: Continuation of the ECB hiking cycle vs. increasing recession risks. Impact of the war in Ukraine and the protracted energy crisis on the region’s growth prospects and inflation outlook. Risks of inflation becoming entrenched.
EUR/USD levels to watch
So far, the pair is gaining 0.05% at 1.0733 and faces the next resistance level at 1.0760 (monthly high January 9) followed by 1.0773 (monthly high June 27) and finally 1.0786 (monthly high May 30 2022). On the downside, the breach of 1.0496 (monthly low January 6) would target 1.0443 (weekly low December 7) en route to 1.0398 (55-day SMA).
-
14:49
World Bank lowers 2023 global growth forecast to 1.7% from 3% in June
The World Bank announced on Tuesday that it expects the global economy to grow by 1.7% in 2023, down sharply from 3% in June's forecast, as reported by Reuters.
Key takeaways
"World Bank forecasts US 2023 GDP growth at 0.5% vs 2.2% in June forecast; weakest non-recession performance since 1970."
"Growth outlook dimmed by effects of monetary tightening, slowdowns in US, Eurozone, China and Ukraine war spillovers."
"World Bank sees Eurozone GDP flat in 2023 vs 1.9% growth in June forecast due to soaring energy costs, rising borrowing costs."
"Investment in emerging market and developing economies projected to grow at 3.5% pace through 2024, half the pace of previous two decades."
"China's 2022 growth slowed to 2.7% due to COVID lockdowns but will recover to 4.3% for 2023."
Market reaction
This headline doesn't seem to be having a noticeable impact on risk sentiment. As of writing, the S&P 500 Index was virtually unchanged on the day at 3,890.
-
14:38
USD/MXN: Scope to extend the gradual decline to the 2017 low at 17.4395 – Credit Suisse
USD/MXN is seeing a gradual grind lower, which analysts at Credit Suisse think is likely to extend to 18.5155/17.4395.
Key resistance aligns at 19.9131/9482
“With the USD having peaked, we think the broader risk is likely to stay mildly lower during Q1 of 2023 and we thus see scope to extend the gradual decline to the 2020 low at 18.5155, where we think a potentially tougher support is likely to be found. Should this also break, next key support is identified at 17.4395 the 2017 low.”
“Initial key resistance is located at the recent high and 200DMA at 19.9131/9482, though only above the downtrend from late 2021 at 20.2145 would instead indicate that a more rangebound phase is emerging.”
-
14:27
USD Index treads water above 103.00 amidst a cautious tone
- The index lacks conviction to move on either direction on Tuesday.
- US yields regain some composure and bounce off recent lows.
- No comments on monetary policy from Powell in Sweden.
The greenback, in terms of the USD Index (DXY) keeps the inconclusive performance well in place following the opening bell in Wall St. on Tuesday.
USD Index remains prudent ahead of key releases
The index attempts to leave behind part of the recent steep pullback, although the absence of catalysts coupled with rising prudence in light of the release of US inflation figures later in the week keeps the price action subdued for the time being.
In the meantime, DXY navigates a tight range amidst a decent rebound in US yields across the curve, which manage to halt a multi-session negative streak at the same time.
In the calendar, the NFIB Business Optimism Index eased to 89.8 in December (from 91.9). Later in the NA session, Wholesale Inventories and the IBD/TIPP index area also due.
What to look for around USD
So far, the greenback remains under pressure in the low-103.00s against the backdrop of alternating risk appetite trend and pre-CPI cautiousness.
The mixed results from the US Nonfarm Payrolls for the month of December (Friday) seem to have reignited the idea of a probable pivot in the Fed’s policy in the next months, which comes in contrast to the message from the latest FOMC Minutes, where the Committee advocated the need to remain within a restrictive stance for longer, at the time when it ruled out any interest rate reduction for the current year.
Furthermore, the tight labour market, still elevated inflation and the resilient economy are also seen supportive of the firm message from the Federal Reserve and its hiking cycle.
Key events in the US this week: Wholesale Inventories, Fed’s Powell (Tuesday) – MBA Mortgage Applications (Wednesday) – Inflation Rate, Initial Jobless Claims, Monthly Budget Statement (Thursday) – Flash Michigan Consumer Sentiment (Friday).
Eminent issues on the back boiler: Hard/soft/softish? landing of the US economy. Prospects for further rate hikes by the Federal Reserve vs. speculation of a recession in the next months. Fed’s pivot. Geopolitical effervescence vs. Russia and China. US-China trade conflict.
USD Index relevant levels
Now, the index is losing 0.02% at 103.15 and the breach of 102.94 (monthly low January 9) would open the door to 101.29 (monthly low May 30) and finally 100.00 (psychological level). On the upside, the next hurdle comes at 105.63 (monthly high January 6) followed by 106.35 (200-day SMA) and then 107.19 (weekly high November 30).
-
14:26
EUR/USD to target 1.1000/50 on a consistent break above 1.0750 – Scotiabank
EUR/USD holds near mid-1.07s. A break above here would clear the way towards the 1.10 area, economists at Scotiabank report.
Intraday support aligns 1.0690/00
“The mild winter and China’s re-opening efforts are trimming economic pessimism and prompting an improvement in expectations for the economic outlook for the Eurozone this year which will encourage the hawks and provide some solid background support for the EUR.”
“Short-term trend oscillators are leaning bullish, suggesting ongoing upside pressure on spot.”
“A clear and consistent break above 1.0750 targets additional EUR gains to 1.1000/50.”
“Intraday support is 1.0690/00.”
-
14:18
Powell speech: We are not and will not be a climate policymaker
While speaking at Riksbank's International Symposium on Central Bank Independence, FOMC Chairman Jerome Powell said the Federal Reserve's independence from political influence is central to its ability to battle inflation, as reported by Reuters. Powell further noted that this independence requires the Fed to stay out of issues like climate change that are beyond its congressionally-established mandate.
"We are not, and will not be, a climate policymaker," Powell reiterated.
Additional takeaways
"Fed must resist the temptation to broaden its scope to address other important social issues."
"Taking on such goals would undermine our independence."
"Fed has narrow responsibilities regarding climate-related financial risks."
"Without congressional laws, inappropriate for us to use our monetary or supervisory tools to promote a greener economy."
"Also inappropriate for us to use our tools to achieve other climate-based goals."
Market reaction
The US Dollar came under modest selling pressure following these comments. As of writing, the US Dollar Index was virtually unchanged on the day at 103.15.
-
14:12
USD/CAD: Support area at 1.3225/03 to serve as a firm floor to avoid further weakness – Credit Suisse
USD/CAD looks weak in the near-term, but analysts at Credit Suisse look for a floor at 1.3225/03.
Rise above the 1.3661/3705 to put the pair back into more neutral territory
“Whilst we see scope for near-term losses towards the key support area at 1.3225/03, we look for this level to serve as a firm floor to avoid further weakness. Should this take place though, next key support would be located at the 200DMA at 1.3150 and further below at the uptrend from 2021 at 1.2762.”
“Resistance is seen at 1.3467/82 initially, though a rise above the 1.3661/3705 is needed to put the market back into more neutral territory.”
-
13:55
United States Redbook Index (YoY) down to 5.3% in January 6 from previous 10.2%
-
13:52
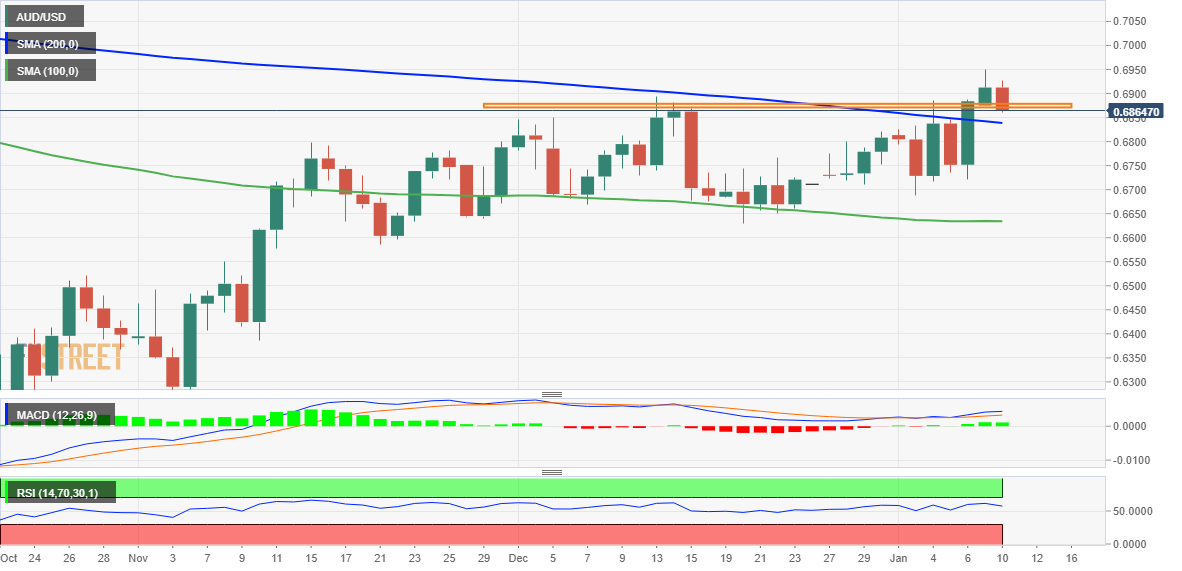
AUD/USD Price Analysis: Corrects from multi-month peak, bullish potential intact
- AUD/USD meets with a fresh supply and snaps a two-day winning streak to a multi-month top.
- A goodish USD recovery and a softer risk tone turn out to be key factors weighing on the Aussie.
- The technical setup favours bulls and supports prospects for the emergence of some dip-buying.
The AUD/USD pair comes under some selling pressure on Tuesday and moves further away from its highest level since late August, around the 0.6945 area touched the previous day. Spot prices drop to a fresh daily low, around the 0.6860 region during the early North American session and for now, seem to have snapped a two-day winning streak.
A combination of factors assists the US Dollar to stage a goodish rebound from a seven-month low set on Monday, which, in turn, is seen weighing on the AUD/USD pair. A goodish pickup in the US Treasury bond yields, amid some repositioning trade ahead of Fed Chair Jerome Powell's speech, acts as a tailwind for the buck. Apart from this, a generally weaker tone around the equity markets further benefits the greenback's relative safe-haven status and contributes to driving flows away from the risk-sensitive Aussie.
From a technical perspective, the overnight positive move validated the post-NFP breakout through the 0.6890-0.6900 supply zone and the very important 200-day SMA. Adding to this, positive oscillators on the daily chart support prospects for the emergence of some dip-buying around the AUD/USD pair. Hence, any subsequent pullback is more likely to find decent support near the 0.6840 region (200 DMA). That said, a convincing break below might prompt some technical selling and set the stage for deeper losses.
The AUD/USD pair could then accelerate the accelerate the fall towards the 0.6800 mark. The latter should act as a strong base for the major, which if broken decisively will negate the near-term positive outlook and shift the bias in favour of bearish traders. The subsequent fall has the potential to drag spot prices towards the next relevant support near the 0.6725-0.6720 area en route to the 0.6700 round figure.
On the flip side, the 0.6900-0.6910 area should now act as an immediate strong hurdle ahead of the overnight swing high, around the 0.6945 region. Some follow-through buying should allow the AUD/USD pair to aim back to reclaim the 0.7000 psychological mark. The positive momentum could get extended further towards an intermediate resistance near the 0.7045-0.7050 zone en route to the 0.7100 round-figure mark.
AUD/USD daily chart
Key levels to watch
-
13:26
EUR/USD Price Analysis: Further upside targets the 1.0773/86 band
- EUR/USD seems to have met some resistance near 1.0760.
- Further upside could see the June 2022 high retested.
EUR/USD falters just ahead of Monday’s monthly peaks around 1.0760 on Tuesday.
In case bulls remain in control, the pair should surpass the January high at 1.0760 (January 9) and then attempt a move to the June 2022 high at 1.0773 (June 27) followed by the May 2022 top at 1.0786 (May 30).
In the meantime, further gains remain in store for the pair while above the 200-day SMA at 1.0309.
EUR/USD daily chart
-
13:12
Gold Price Forecast: XAU/USD to extend its rally on slowing inflation – Commerzbank
Gold price climbed to $1,880 at the start of the week, thereby posting an eight-month high. The US inflation data for December will be released on Thursday and could lend further tailwind to the yellow metal, economists at Commerzbank report.
Inflation rate to have fallen from 7.1% to 6.5%
“US inflation data could lend further tailwind to the Gold price given that the slowing of inflation that has been observed since the summer is likely to have continued last month.”
“The market expects the inflation rate to have fallen from 7.1% to 6.5% – our economists even envisage a drop to 6.4%. The last time it was any lower was more than a year ago. That said, there is already a substantial discrepancy between the expectation of market participants regarding the Fed’s monetary policy this year and what the Fed is continuing to communicate.”
-
13:03
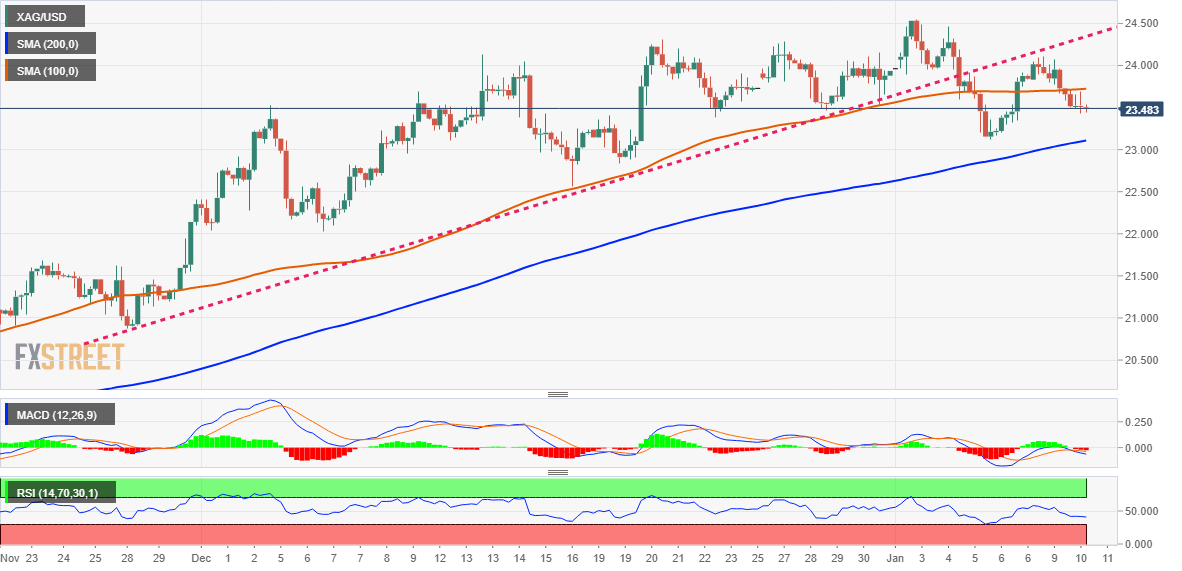
Silver Price Analysis: XAG/USD seems vulnerable to retest $23.10 support zone
- Silver remains under some selling pressure for the second successive day on Tuesday.
- The intraday technical setup supports prospects for a slide back to the $23.00 mark.
- A sustained strength beyond the $24.00 mark will set the stage for additional gains.
Silver extends the previous day's pullback from a three-day high and continues losing ground for the second successive day on Tuesday. The white metal remains depressed heading into the North American session and is currently placed just below the mid-$23.00s.
Looking at the technical picture, the recent bounce from the vicinity of the $23.00 mark falters near a two-month-old ascending trend line support breakpoint, now turned resistance. A subsequent slide back below the 100-period SMA on the 4-hour chart favours intraday bearish traders. Furthermore, oscillators on hourly charts have again started gaining negative traction and support prospects for further losses.
Hence, some follow-through weakness back towards testing last week's swing low, around the $23.10 area, looks like a distinct possibility. This is closely followed by the $23.00 round figure, below which the XAG/USD could slide towards the $22.60-$22.55 region. The next relevant support is pegged near the $22.10-$22.00 horizontal zone, which if broken decisively will be seen as a fresh trigger for bears.
On the flip side, the daily peak, around the $23.70 region, now seems to act as an immediate hurdle ahead of the $24.00-$24.10 ascending trend-line support-turned-resistance. A sustained strength beyond might shift the bias in favour of bullish traders. The XAG/USD might then surpass an intermediate hurdle near the $24.25 zone and test the multi-month high, around the $24.50-$24.55 region set last week.
Some follow-through buying should pave the wave for a further near-term appreciating move towards reclaiming the $25.00 psychological mark for the first time since April 2022.
Silver 4-hour chart
Key levels to watch
-
12:54
S&P 500 Index to remain in a bear trend whilst below 4101 – Credit Suisse
S&P 500 has failed to surpass the 4000 area. Economists at Credit Suissse expect the index to remain under bearish pressure.
Sustained move below 3698/3674 can reinvigorate the bear market
“S&P 500 has been capped as looked for at its 200DMA and downtrend from the beginning of 2022, currently seen at 3995 and 4075 respectively, with further key resistance seen at the 4101 December ‘reversal week’ high. Whilst we suspect we can see some further range-trading beneath here the overall trend will still stay seen bearish whilst below 4101.”
“A close above 4101 would be seen to turn the trend neutral and open the door to strength back to 4300/4325.”
“Key price and 200-week average support is seen at 3698/3674, a sustained move below which can reinvigorate the bear market to clear the way for a fall back to 3505/3492 and eventually we think 3234/3195 later in the year.”
-
12:41
German Government Adviser: Inflation in Germany has probably peaked
German government economic adviser Monika Schnitzer said on Tuesday that inflation in Germany has probably peaked amid falling global energy prices, as reported by Reuters.
Commenting on the European Central Bank's (ECB) policy outlook, "if nothing happens, there is no need for the ECB to raise the interest rate by more than 50 basis points in the next meeting," Schnitzer noted.
Market reaction
These comments don't seem to be having a noticeable impact on EUR/USD. As of writing, the pair was trading virtually unchanged on the day at 1.0728.
-
12:30
EUR/GBP to enjoy a deeper recovery in the long-term sideways range – Credit Suisse
EUR/GBP is expected to steadily strengthen within its long-term sideways range, in the view of economists at Credit Suisse.
Resistance is located at 0.8904/08
“The completion of a near-term base above 0.8823/29 is expected to provide the platform for a deeper recovery in the long-term sideways range.”
“Resistance is seen at 0.8904/08 initially, above which can see strength back to 0.9100/14 and potentially 0.9269/92.”
“Below 0.8690 is needed to see the base neutralized.”
-
12:26
USD Index Price Analysis: Extra decline could see the 101.30 zone retested
- Price action around the index looks unconvincing on Tuesday
- Persistent weakness should open the door to a drop to 101.30.
DXY trades in an inconclusive tone in the low-103.00s on Tuesday.
A drop below the so far January low at 102.94 (January 9) could prompt the May 2022 low around 101.30 (May 30) to re-emerge on the horizon ahead of the psychological 100.00 level.
In the meantime, while below the 200-day SMA at 106.35 the outlook for the index should remain tilted to the negative side.
DXY daily chart
-
12:21
US Dollar vulnerable to further weakness in the near-term – MUFG
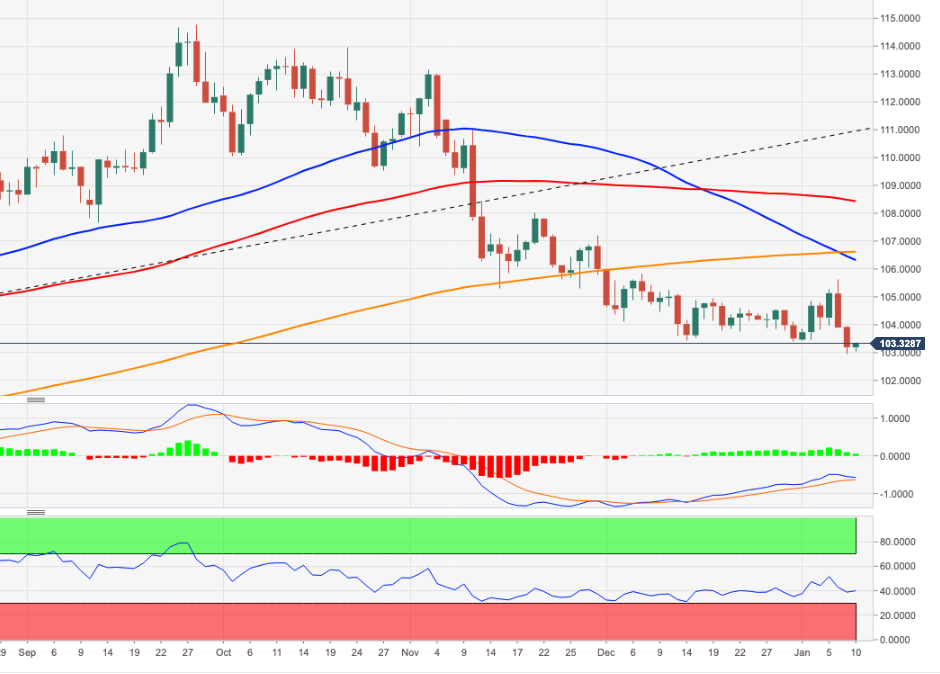
The US Dollar Index hit an intra-day low yesterday of 102.94. In the view of economists at MUFG Bank, the greenback is prone to suffer further losses barring strong US inflation data.
Fed policy outlook in focus
“Fed officials are still sticking to their updated guidance that rates are likely to rise above 5.00% this year in order to fully get on top upside inflation risks. That was still the message yesterday both from Atlanta Fed President Bostic and San Francisco Fed President Daly.”
“The US rate market though it still pricing in a terminal rate below 5.00% encouraged by recent softer US inflation, wage data and leading indicators for activity that market participants anticipate will eventually prompt the Fed to dial back their rate hike plans in the coming months.”
“Unless market expectations are challenged by the stronger incoming data, it leaves the US Dollar vulnerable to further weakness in the near-term.”
-
12:15
USD/CAD edges higher amid modest USD strength, lacks follow-through beyond 1.3400
- USD/CAD gains some positive traction on Tuesday and moves away from a multi-week low.
- Rebounding US bond yields, a softer risk tone revives the USD demand and lends some support.
- Traders look to Fed Chair Powell’s speech for some impetus ahead of the US CPI on Thursday.
The USD/CAD pair edges higher on Tuesday and for now, seems to have snapped a two-day losing streak to its lowest level since November 25. Spot prices stick to a mildly positive tone heading into the North American session and look to build on the momentum beyond the 1.3400 round-figure mark.
The US Dollar gains some positive traction and stalls its recent decline to a seven-month low, which, in turn, is seen as a key factor lending support to the USD/CAD pair. A modest uptick in the US Treasury bond yields, along with the prevalent cautious market mood, help revive demand for the safe-haven greenback. The USD uptick could also be attributed to some repositioning trade ahead of Fed Chair Jerome Powell's speech.
Investors will look for clues about the pace of Fed rate hikes at upcoming meetings, which will play a key role in driving the USD demand. The mixed US jobs report and the disappointing release of the US ISM PMI on Friday lifted bets for a less aggressive policy tightening by the Fed. Traders will also scan the US consumer inflation figures, due on Thursday to determine the next leg of a directional move for the USD/CAD pair.
In the meantime, subdued action around crude oil prices, amid mixed economic signals, fails to provide any impetus to the commodity-linked Loonie or the USD/CAD pair. The latest optimism over China’s biggest pivot away from its strict zero-COVID policy lends some support to the black liquid. That said, worries that a deeper global economic downturn will hurt fuel demand keeps a lid on any meaningful upside for oil prices.
In the absence of any relevant market-moving economic releases, either from the US or Canada, the fundamental backdrop warrants some caution before placing directional bets. The recent breakdown below a technically significant 100-day SMA, meanwhile, favours bearish traders and supports prospects for deeper losses. Hence, any subsequent move up might still be seen as a selling opportunity and runs the risk of fizzling out rather quickly.
Technical levels to watch
-
12:00
Brazil IPCA Inflation registered at 0.62% above expectations (0.44%) in December
-
12:00
South Africa Total New Vehicle Sales declined to 41783 in December from previous 49413
-
11:51
Silver Price Analysis: XAG/USD’s strength may have run its course for now – Credit Suisse
Silver has extended its rally to the downtrend from the 2021 high, now at 24.78. Economists at Credit Suisse expect the metal to move back lower.
Move above 24.78 would mark an important break higher
“Heading into Q1 we look for the downtrend and high at 24.55/78 to continue to cap and for a retracement lower to emerge for a test of support at 21.79 initially, then 21.12/20.58, where we look for a floor.”
“Above 24.78 would mark an important break higher to clear the way for further strength to test the 26.94 high of 2022.”
-
11:38
US to see a below-trend growth rather than an outright contraction – TDS
The eye-popping and unexpected decline to below 50 in the ISM Services index on Friday brought again to the fore discussions about the state of the US economy and corresponding mounting recession risks. But strategists at TD Securities believe that the current state of the economy offers no reason to be overly concerned.
A US recession? Don't count on it yet
“A plunge in the ISM services index in December set off alarms regarding recession risks for the US economy. We think the survey provided more noise than signal this time around.”
“The large decline in the services-activity indicator likely reflected a catch-up lower after overshooting in recent months, rather than signaling a sudden retrenchment in activity. We expect the ISM Services index to rebound in January.”
“Despite worsening signals from soft data, solid labor market conditions and firm consumer spending suggest services activity remains perky. This should offer the Fed room to continue tightening its monetary policy stance over the next few meetings.”
-
11:35
EUR/JPY Price Analysis: Recovery has further legs to go
- EUR/JPY keeps the bid bias unaltered and approaches 142.00.
- The next target of note comes near 143.00 (December 28).
EUR/JPY advances for the third consecutive session and flirts with the 142.00 neighbourhood on Tuesday.
In light of the ongoing price action, further upside should not be ruled out in the short term. That said, the immediate up barrier appears at the weekly high at 142.93 (December 28), which appears reinforced by the proximity of the 100-day SMA, today at 142.99.
The outlook for EUR/JPY is expected to shift to constructive while above the 200-day SMA at 140.58.
EUR/JPY daily chart
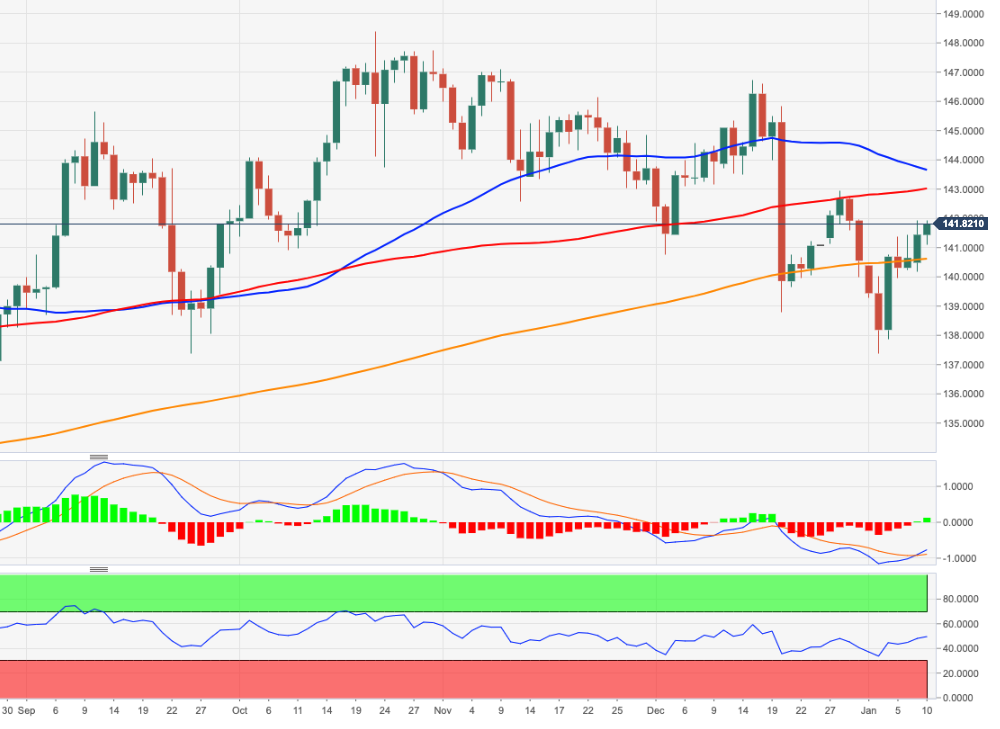
-
11:19
Brent will return to over $100 a barrel by the middle of 2023 – Morgan Stanley
Looking back, 2022 was an eventful year for the oil market. Martijn Rats, Morgan Stanley's Global Commodity Strategist, discusses some of the key uncertainties that the global oil market will likely face in 2023.
Oil market to return to balance in the second quarter
“Counting barrels of supply and demand suggests that the first quarter will still be modestly oversupplied. Also, declining GDP expectations, falling PMIs and central bank tightening are still weighing heavily on the oil market today. Eventually, however, we see a more constructive outlook emerging, say from the spring onwards.”
“We expect the oil market to return to balance in the second quarter, and be undersupplied in the second half of this year. With a limited supply buffer only, we think Brent will return to over $100 a barrel by the middle of the year.”
-
11:10
EUR/USD: Rate trends are likely to underpin the Euro all year – SocGen
EUR/USD made a new cycle high and ran out of energy, after three months of strong gains. In the opinion of Kit Juckes, Chief Global FX Strategist at Société Générale, Euro is a buy on dips barring new geopolitical developments.
It may be a dull day
“Were it not for the war in Ukraine on Europe’s inflation/growth trade-off, public finances and terms of trade; EUR/USD should now be a clear uptrend and ‘ought’ to be nearer 1.20.”
“Both the direct economic impact of the war and the negative effects on confidence of exposing European energy dependency matter, of course. But, if the impact of the war doesn’t increase (or go away completely), our rates forecasts justify another four figures or so of gains for EUR/USD this year (consistent with our EUR/USD 1.12 end-year forecast).”
“It may be a dull day, but the Euro is a buy on dips and the Dollar a sell on rallies, barring new geopolitical; developments.”
-
11:00
South Africa Manufacturing Production Index (YoY) came in at -1.1%, below expectations (2.3%) in November
-
11:00
United States NFIB Business Optimism Index down to 89.8 in December from previous 91.9
-
10:40
USD Index set to tick down toward 102 – ING
FX markets continue to trade with cautious optimism. Economists at ING expect the US Dollar Index to edge lower towards the 102 level.
Look out for comments from Fed Chair Powell and the NFIB
“Assuming that neither Powell's comments nor the NFIB breaks the building narrative of a more relaxed Fed (and Thursday's US CPI will also be key for this story), we would expect momentum to remain against the Dollar and continue to favour activity/commodity currencies.”
“DXY looks biased towards the 102.00 as investors put money to work on non-USD assets.”
-
10:29
United Kingdom 10-y Bond Auction: 3.697% vs 3.333%
-
10:18
Gold Price Forecast: XAU/USD sits near multi-month top ahead of Powell’s speech
- Gold price holds steady near an eight-month high touched on Monday, lacks follow-through.
- Rebounding US Treasury bond yields revives the US Dollar demand and acts as a headwind.
- A softer risk tone lends some support as traders now keenly await Fed Chair Powell’s speech.
Gold price extends its consolidative price move for the second successive day on Tuesday and holds steady near an eight-month high touched the previous day. The XAU/USD is currently placed just below the $1,880 level as traders keenly await Federal Reserve (Fed) Chair Jerome Powell’s speech for a fresh impetus.
Focus on Powell’s speech and inflation data from United States
Powell is scheduled to speak at the Riksbank’s International Symposium on Central Bank Independence later during the early North American session. His remarks will be closely scrutinized for clues about the Fed's rate-hike path. The focus, however, remains on the latest consumer inflation figures from the United States (US), due for release on Thursday. The crucial US CPI report will be looked upon for fresh insight into the Fed's policy stance, which will play a key role in determining the near-term trajectory for the non-yielding Gold price.
Rebounding Treasury bond yields, US Dollar could cap Gold price
Heading into the key event/data risk, the US Dollar (USD) stages a modest recovery from a seven-month low touched on Monday amid a goodish intraday pickup in the US Treasury bond yields. This, in turn, might cap any meaningful upside for the US Dollar-denominated Gold price. That said, the prospects for relatively smaller Fed rate hikes should act as a headwind for the US Treasury bond yields and the USD. In fact, the markets have been pricing in a 25 bps lift-off in February amid indications that inflationary pressures could be weakening.
Softer risk tone lends support to safe-haven Gold price
Apart from this, the prevalent cautious mood could lend some support to the safe-haven Gold price and favours bullish traders. Despite China's pivot away from its strict zero-COVID policy, worries that the massive flow of Chinese travellers may cause another surge in infections weigh on the risk sentiment. Furthermore, the protracted Russia-Ukraine war has been fueling concerns about a deeper global economic downturn and tempers investors' appetite for riskier assets. This is evident from a softer tone around the equity markets and lends support to the XAU/USD.
The aforementioned fundamental backdrop suggests that the path of least resistance for the Gold price is to the upside and supports prospects for an extension of the recent appreciating move. That said, it will still be prudent to wait for a sustained move beyond the overnight swing high, around the $1,881 zone, before placing fresh bullish bets.
Gold price technical outlook
From a technical perspective, any corrective pullback now seems to find decent support near the $1,865-$1,860 resistance breakpoint. A sustained break below might prompt some technical selling around the Gold price, though could be bought into near the $1,835-$1,833 horizontal support. On the flip side, bulls are likely to aim to reclaim the $1,900 round figure for the first time since May 2022. Some follow-through buying will mark a fresh breakout and pave the way for additional near-term gains.
Key levels to watch
-
10:17
ECB's Schnabel: Inflation will not subside by itself
European Central Bank (ECB) Governing Council member Isabel Schnabel said on Tuesday that restrictive monetary policy stance will benefit society over the medium to long run by restoring price stability.
Key takeaways
"Inflation will not subside by itself."
"It would be misleading to use higher interest rates as a scapegoat for a further delay in the green transition."
"Financing conditions will need to become restrictive."
"Green targeted lending operations, for example, could be an instrument but they are not an option for the immediate future."
"Systematic greening of the ECB's collateral framework is therefore an important tool."
Market reaction
EUR/USD showed no immediate reaction to these comments and was last seen posting small daily gains at 1.0745.
-
10:14
US NFP: Wage growth loses traction amidst solid jobs creation – UOB
Senior Economist at UOB Group Alvin Liew reviews the latest US Nonfarm Payrolls published on January 6.
Key Takeaways
“The US ended 2022 exceeding expectations with 223,000 jobs added in Dec while the jobless rate receded to 3.5%, matching the 50-year low level, as the unemployed numbers fell by 228,000 to 5.77 million. Wage growth continued but the pace was below expectations at 0.3% m/m, 4.6% y/y (below Bloomberg estimates and Nov prints).”
“Jobs creation at a reduced pace (compared to 1H 2023) and wage growth back below 5% may give the Federal Reserve (Fed) some comfort the risk of wage price spiral is not imminent but is unlikely to dissuade them from further hikes in 1Q 2023. We and the markets still assign a high probability the Fed will hike rates by another 50-bps to 4.75-5.00% in 31 Jan/01 Feb 2023 FOMC.”
-
10:09
EUR/USD could press last May's high at 1.0785 – ING
EUR/USD managed to nudge up to a new high yesterday. Economists at ING believe that the pair could test last May's high at 1.0785.
High natural gas prices could well come back and bite the Euro later in the year
“For the time being, we would prefer to back further EUR/USD strength – should today's US event risks allow. This could see EUR/USD pressing last May's high at 1.0785.”
“This week there is an outside risk of 1.0950 should Thursday's US December CPI show another soft reading.”
“Before we dust off the call to 1.15, we should note that a re-opened China will compete for global LNG supplies. This means that the issue of high natural gas prices could well come back and bite the eurozone and the Euro later in the year.”
-
10:00
Greece Unemployment Rate (MoM): 11.4% (November) vs previous 11.6%
-
10:00
Greece Industrial Production (YoY): -0.9% (November) vs -2.5%
-
09:51
Gold Price Forecast: XAU/USD vulnerable to a steep consolidation lower – TDS
Barring a grandiose geopolitical regime change, it is likely that Chinese demand will subside towards normal levels. This would leave Gold prices vulnerable to a steep consolidation lower, in the view of strategists at TD Securities.
Massive Chinese buying is unsustainable
“Chinese demand appears unrelenting for the time being, but barring a grandiose geopolitical regime change, we find that it would likely subside towards normal levels in coming months. This would leave Gold prices vulnerable to a steep consolidation lower, given Gold's lack of alternative buyers and its current mispricing relative to its recent historical relationship with real rates.”
“We turn to our tracking of positioning for the top ten Gold traders in China to scour for nascent signs of peaking Chinese demand, which could present a tactical signal for a noteworthy repricing lower.”
-
09:48
Spain 6-Month Letras Auction up to 2.584% from previous 2.041%
-
09:48
Spain 12-Month Letras Auction rose from previous 2.449% to 2.983%
-
09:36
Italy Public Deficit/GDP up to 4.7% in 3Q from previous 3.1%
-
09:21
GBP/USD remains depressed near mid-1.2100s amid modest USD strength, ahead of Fed’s Powell
- GBP/USD struggles to capitalize on its gains recorded over the past two-trading sessions.
- A combination of factors helps revive the USD demand and exerts pressure on the major.
- Traders now look to Fed Chair Jerome Powell’s speech for some meaningful opportunities.
The GBP/USD pair edges lower on Tuesday and snaps a two-day winning streak to a nearly three-week high touched the previous day. The pair remains on the defensive through the first half of the European session and is currently flirting with the daily low, around mid-1.2100s.
A combination of factors assists the US Dollar to stage a modest recovery from a seven-month low set on Monday, which, in turn, is seen exerting some downward pressure on the GBP/USD pair. A goodish pickup in the US Treasury bond yields, along with a softer risk tone, help revive demand for the safe-haven greenback.
Worries that the massive flow of Chinese travellers may cause another surge in infections overshadow the optimism led by China's pivot away from its strict zero-COVID policy. Furthermore, the protracted Russia-Ukraine war has been fueling concerns about a deeper global economic downturn and weighing on investors' sentiment.
Apart the USD uptick could also be attributed to some repositioning trade ahead of Fed Chair Jerome Powell's speech, due later during the early North American session. Investors will look for more clarity on the Fed's rate hike path, which will play a key role in influencing the USD and provide a fresh impetus to the GBP/USD pair.
The British Pound, on the other hand, is undermined by a bleak outlook for the UK economy, which has been fueling expectations that the Bank of England (BoE) is nearing the end of the current rate-hiking cycle. This, in turn, supports prospects for a further intraday fall for the GBP/USD pair amid absent relevant macro releases.
Technical levels to watch
-
09:20
China New Loans came in at 1400B, above forecasts (1100B) in December
-
09:20
China M2 Money Supply (YoY) came in at 11.8%, below expectations (12.2%) in December
-
09:10
FX option expiries for Jan 10 NY cut
FX option expiries for Jan 10 NY cut at 10:00 Eastern Time, via DTCC, can be found below.
- EUR/USD: EUR amounts
- 1.0825 462m
- GBP/USD: GBP amounts
- 1.2000 300m
- USD/CHF: USD amounts
- 0.9085 348m
- AUD/USD: AUD amounts
- 0.6800 301m
- USD/CAD: USD amounts
- 1.3500 736m
-
08:54
EUR/USD remains bid and near the 1.0750 region
- EUR/USD looks to consolidate further the breakout of 1.0700.
- The dollar trades in an inconclusive fashion so far on Tuesday.
- Investors’ focus gyrates to Chief Powell’s speech later in the session.
The optimism around the European currency remains well and sound for yet another session and helps EUR/USD revisit the 1.0750 region on turnaround Tuesday.
EUR/USD: Next target emerges at 1.0800
EUR/USD advances for the third session in a row and keeps the bid bias unchanged in the first half of the week so far. Indeed, the pair has already gained more than 2 cents since last Friday’s lows in the sub-1.0500 region.
In the meantime, spot continues to derive further upside traction from the persistent lack of buying interest around the dollar, which remains under pressure amidst investors’ repricing of a potential pivot in the Fed’s monetary stance sooner than previously estimated.
In the domestic calendar, Industrial Production in France expanded at a monthly 0.2% in November in what was the sole release on this side of the Atlantic. Across the pond, the NFIB Business Optimism Index is due in the first turn seconded by the IBD/TIPP Economic Optimism Index and monthly figures of Wholesale Inventories.
In addition, Fed’s Powell will speak at an event on “Central Bank Independence” organized by the Riksbank in Sweden.
What to look for around EUR
EUR/USD has embarked on a strong recovery and has already retaken the key barrier at 1.0700 the figure and beyond.
In the meantime, the European currency is expected to closely follow dollar dynamics, the impact of the energy crisis on the region and the Fed-ECB divergence.
Back to the euro area, the increasing speculation of a potential recession in the bloc emerges as an important domestic headwind facing the euro in the short-term horizon.
Key events in the euro area this week: France Industrial Production (Tuesday) – France final Inflation Rate, Germany Full Year GDP Growth, MEU Balance of Trade/Industrial Production (Friday).
Eminent issues on the back boiler: Continuation of the ECB hiking cycle vs. increasing recession risks. Impact of the war in Ukraine and the protracted energy crisis on the region’s growth prospects and inflation outlook. Risks of inflation becoming entrenched.
EUR/USD levels to watch
So far, the pair is gaining 0.07% at 1.0734 and faces the next resistance level at 1.0760 (monthly high January 9) followed by 1.0773 (monthly high June 27) and finally 1.0786 (monthly high May 30 2022). On the downside, the breach of 1.0496 (monthly low January 6) would target 1.0443 (weekly low December 7) en route to 1.0398 (55-day SMA).
-
08:41
AUD/USD remains confined in a range around 0.6900 mark, Powell’s speech awaited
- AUD/USD is seen oscillating in a narrow trading band around the 0.6900 round figure.
- An uptick in the US bond yields helps revive the USD demand and acts as a headwind.
- Bets for less aggressive Fed rate hikes cap the buck and lend some support to the pair.
The AUD/USD pair lacks any directional bias on Tuesday and consolidates its recent gains to the highest level since late August, around mid-0.6900s touched the previous day. Spot prices seesaw between tepid gains/minor losses through the first half of the European session and now seem to have stabilized near the 0.6900 mark.
A combination of factors assists the US Dollar to stall its recent downfall and regain some positive traction, which, in turn, is seen acting as a headwind for the AUD/USD pair. A modest uptick in the US Treasury bond yields helps revive the USD demand. Apart from this, the prevalent cautious market mood further underpins the safe-haven greenback and caps the upside for the risk-sensitive Aussie.
Despite China's pivot away from its strict zero-COVID policy, investors remain worried that the massive flow of Chinese travellers may cause another surge in infections. Furthermore, the protracted Russia-Ukraine war has been fueling concerns about a deeper global economic downturn. This, in turn, takes its toll on the risk sentiment, which is evident from a softer tone around the equity markets.
That said, rising bets for relatively smaller rate hikes by the Federal Reserve could limit any further upside for the US bond yields and the greenback. The USD bulls also seem reluctant to place aggressive bets ahead of Fed Chair Jerome Powell's speech, which will be looked upon for clues about the pace of rate hikes at the upcoming meetings. This will play a key role in driving the USD demand.
The focus, however, remains on the latest US consumer inflation figures, due for release on Thursday, which will help determine the next leg of a directional move for the AUD/USD pair. Nevertheless, the fundamental backdrop suggests that the path of least resistance for the USD is to the downside. This, in turn, supports prospects for an extension of the recent appreciating move for the major.
Technical levels to watch
-
08:40
USD/CNH risks a deeper decline near term – UOB
Further downside could drag USD/CNH back to the 6.7000 region in the next few weeks, comment UOB Group’s Economist Lee Sue Ann and Markets Strategist Quek Ser Leang.
Key Quotes
24-hour view: “Our view for USD yesterday was that it ‘could break 6.8000 but it might not be able to maintain a foothold below this level’. We indicated, ‘the next support is at 6.7700’. USD weakened more than we expected as it dropped to a low of 6.7665. While oversold, the decline in USD could test the major support at 6.7500 before the risk of a more sustained rebound increases. In other words, a sustained decline below 6.7500 is unlikely. Resistance is at 6.8000, followed by 6.8150.”
Next 1-3 weeks: “Yesterday (09 Jan, spot at 6.8200), we indicated that USD is likely to weaken, albeit at a slower pace. We noted that support levels are at 6.7700 and 6.7500. USD subsequently dropped to a low of 6.7665. We continue to expect USD to weaken and if USD breaks below 6.7500, the focus will shift to 6.7000. Overall, only a break of 6.8500 (‘strong resistance’ level was at 6.8800 yesterday) would indicate that USD is not weakening further.”
-
08:09
Austria Industrial Production (YoY) remains unchanged at 3.9% in November
-
08:08
Spain Industrial Output Cal Adjusted (YoY) down to 2.2% in November from previous 2.5%
-
08:05
Sterling helped by the constructive risk environment at the start of 2023 – ING
Sterling has been performing slightly better. Without any doubt, the better risk environment is helping the GBP, economists at ING report.
Better risk environment provides some insulation
“The UK has quite a large country weight in global equity and debt benchmarks, meaning that flows into these products can provide some support.”
“Market pricing of a further 100 bps BoE hike to the 4.50% area this summer looks resolute.”
“0.8770-0.8870 may well contain EUR/GBP for the rest of this week, though GBP/USD could have some more upside should US data allow.”
-
08:00
Slovakia Industrial Output (YoY): -10.8% (November) vs previous -2.6%
-
07:49
EUR/USD: Recent gains unlikely to continue – Crédit Agricole
EUR/USD climbed to its strongest level since early June above 1.0760 on Monday. Nonetheless, economists at Crédit Agricole CIB Research believe that the pair is unlikely to enjoy further gains.
EUR/USD is trading at a premium relative to its short-term fair value of 1.05
“We are sceptical that the recent EUR/USD gains can continue. In particular, we worry that investors risk becoming complacent about the negative impact from the European energy crisis and the ECB tightening on the Eurozone growth outlook. They may also be too confident in the growth-positive impact from the post-Covid reopening of the Chinese economy.”
“We think that investors are underestimating the Fed’s hawkish resolve in the face of a looming US recession. In turn, a more hawkish-than-expected FOMC can be detrimental for risk sentiment in a boost for the USD vs the EUR.”
“We note that the EUR is the biggest market long in G10 FX at present while EUR/USD is trading at a premium relative to its short-term fair value of 1.05.”
-
07:45
France Industrial Output (MoM) above forecasts (0.8%) in November: Actual (2%)
-
07:45
EUR/GBP clings to intraday gains near two-day high, remains below mid-0.8800s
- EUR/GBP attracts fresh buying on Tuesday and recovers further from over a two-week low.
- Dovish BoE expectations weigh on the British Pound and remain supportive of the move.
- The recent hawkish ECB rhetoric underpins the Euro and supports prospects for further gains.
The EUR/GBP cross regains positive traction following an early dip to sub-0.8800 levels and moves away from over a two-week low touched the previous day. The cross sticks to its modest intraday gains through the early European session and is currently placed near the top end of its daily range, around the 0.8825-0.8835 region.
The British Pound's relative underperformance comes amid a bleak outlook for the UK economy, which has been fueling expectations that the Bank of England (BoE) is nearing the end of the current rate-hiking cycle. Apart from this, a modest pickup in the US Dollar demand is seen weighing on the Sterling and lending some support to the EUR/GBP cross.
The shared currency, on the other hand, benefits from hawkish European Central Bank (ECB) rhetoric. In fact, ECB Governing Council member Francois Villeroy de Galhau said last Thursday that it would be desirable to reach the right terminal rate by next summer. Furthermore, ECB expects wage growth to be very strong over the next few quarters.
In the absence of any major market-moving economic releases, either from the UK or the Eurozone, the aforementioned bullish fundamental backdrop supports prospects for additional gains. That said, any subsequent move up might continue to confront stiff resistance and is more likely to remain capped near the 0.8865-0.8875 heavy supply zone.
Technical levels to watch
-
07:44
Natural Gas Futures: Still room for some recovery
Open interest in natural gas futures markets increased further at the beginning of the week, now by around 1.2K contracts according to advanced prints from CME Group. Volume, in the same line, gained around 121.4K contracts and set aside the previous daily drop.
Natural Gas: Another test of $3.50 remains on the cards
Monday’s decent gains in prices of the natural gas was in tandem with increasing open interest and volume, suggesting that extra gains could be in store for the commodity in subsequent sessions. However, the inability to gather convincing upside traction in the very near term could expose another potential visit to the contention area near the $3.50 mark per MMBtu.
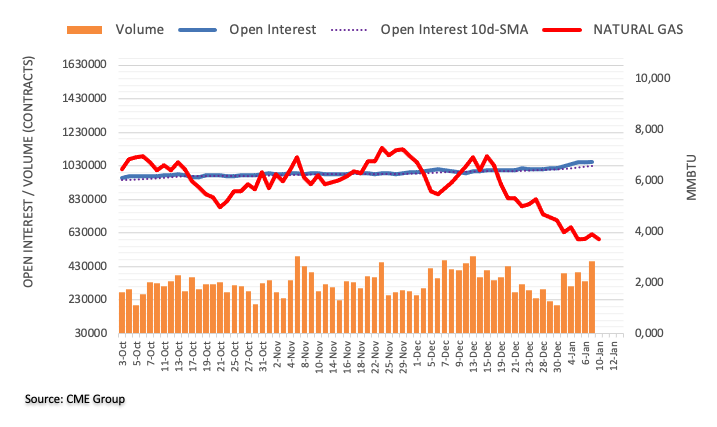
-
07:40
EUR/USD set to revert lower over the coming weeks – Danske Bank
Economists at Danske Bank look for the EUR/USD pair to revert lower over the coming weeks.
Scope for a top-and-turn in EUR/USD over the coming weeks
“Uncertainty about the size of Fed's next rate move makes for quite a wide outcome space for short-term USD rates and EUR/USD over the next 1-2 weeks.”
“We still favour Fed to hike 50 bps in February with the main arguments being a still tight labour market, a likely rebound in Core CPI looks to around 0.3-0.5% MoM and hawkish Fed comments recently. Hence, we see potential for EUR/USD to revert lower over the coming weeks.”
-
07:37
USD/JPY still faces some range bound trade – UOB
USD/JPY is still expected to remain within the 130.50-134.50 consolidative range for the time being, suggest UOB Group’s Economist Lee Sue Ann and Markets Strategist Quek Ser Leang.
Key Quotes
24-hour view: “We highlighted yesterday that the ‘oversold weakness in USD could extend to 131.50 first before stabilization is likely’. We added, ‘the next support at 131.00 is unlikely to come into view’. Our view was not wrong as USD dropped to 131.29 before rebounding. While downward pressure has eased, USD could drift lower today. However, the support 131.00 is still unlikely to come into view. Resistance is at 132.50, followed by 133.00.”
Next 1-3 weeks: “There is not much to add to our update from yesterday (09 Jan, spot at 132.10). As highlighted, after the sharp drop last Friday, USD is likely to trade within a broad range of 130.50 and 134.50 instead of rebounding further.”
-
07:37
EUR/USD to see an eventual challenge of 1.0900/44 in Q1 – Credit Suisse
Economists at Credit Suisse expect the EUR/USD pair to test their 1.0900/44 target where they are then biased to look for a top.
Move below 1.0198 needed to see more significant decline
“Our broader outlook stays constructive for strength back to and above 1.0788 in due course for a test of trend resistance from early 2017 and the 50% retracement of the 20211/2022 fall at 1.0900/44, with a better cap expected here to define the top of a broader range. Should strength directly instead extend, we see next resistance at 1.1185.”
“Support is seen at 1.0483 initially, with 1.0290 ideally holding. Below support at 1.0198 is needed to warn of a potentially more significant decline with support then seen next at parity/0.9935. Below here can re-expose the 2022 low at 0.9537.”
-
07:34
Crude Oil Futures: Further rebound in the pipeline
CME Group’s flash data for crude oil futures markets noted open interest extended the uptrend on Monday, this time increasing by nearly 20K contracts. In the same line, volume reversed two daily pullbacks in a row and went up by nearly 210K contracts.
WTI: Next hurdle aligns at the YTD high at $81.44
Prices of the WTI started the week in a positive mood amidst rising open interest and volume. That said, further upside should not be ruled out with the immediate target at the so far January peak at $81.44 per barrel (January 3).
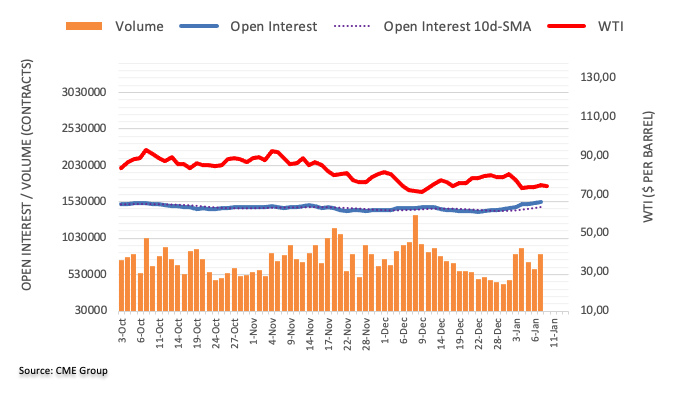
-
07:32
USD/CAD: Adjustment of rate expectations to the upside could support the Loonie – Commerzbank
Board members of the Bank of Canada (BoC) might have to adjust its rate hikes expectations. The Loonie could receive some support with higher peak and less rapid rate cuts, economists at Commerzbank report.
Will the market have to adjust its expectations?
“BoC will have to consider whether its rate hikes last year will be sufficient to control inflation pressure. The question that increasingly arises for the market is whether it will have to adjust its expectations for the meeting at the end of January and afterwards as it has so far seen little likelihood of significantly higher key rates and expects cuts again over the course of the year.”
“The publication of the December inflation data next week will be important. If no improvement is seen here, it might adjust its rate expectations to the upside (higher peak and less rapid rate cuts), which could support CAD at least a little.”
-
07:28
USD Index to see further short-term weakness – Credit Suisse
The US Dollar Index touched its lowest level in seven months at 102.94. Economists at Credit Suisse expect DXY to find a floor at what looks to be better support at 102.99/101.99.
USD to see further mild weakness in Q1
“We continue to look for further weakness in Q1 to a cluster of supports in the broad 102.99/101.99 support zone – the March 2020 high, 50% retracement of the 2021/2022 uptrend and back of the five-year ‘triangle’ pattern. We continue to look for an important low here.”
“Should weakness directly extend below 101.99 and then 101.30 we would see scope for the sell-off to extend to the 50% retracement at 98.98.”
“Resistance for the current rebound is seen at 105.63 initially, then 106.20/25 with 108.00 ideally capping.”
-
07:27
NZD/USD: Extra gains comes on a close above 0.6410 – UOB
In the opinion of UOB Group’s Economist Lee Sue Ann and Markets Strategist Quek Ser Leang, further upside is expected once NZD/USD leaves behind the 0.6410 level.
Key Quotes
24-hour view: “While we expected ‘the rally in NZD to extend’ yesterday, we held the view that ‘the major resistance at 0.6410 is unlikely to come under threat’. However, NZD edged one pip above 0.6410 (high of 0.6411) before pulling back. Upward momentum is slowing and this coupled with still overbought conditions suggests NZD is likely to trade sideways. The expected range for today is 0.6330/0.6405.”
Next 1-3 weeks: “We highlighted yesterday (09 Jan, spot at 0.6350) that the risk for NZD has shifted to the upside but it must clear 0.6410 before further gains are likely. NZD subsequently rose to a high of 0.6411. Our view remains unchanged, as there is no clear break of 0.6410. On the downside, a breach of 0.6285 (‘strong support’ level was at 0.6250 yesterday) would indicate that the upside risk has subsided.”
-
07:23
USD Index turns positive above 103.00, focuses on Powell, data
- The index alternates gains with losses and retakes the 103.00 barrier.
- US yields trade in a mixed fashion across the curve on Tuesday.
- Chief Powell speaks later at an event in Sweden.
The USD Index (DXY), which tracks the greenback vs. a basket of its main rival currencies, regains the smile and looks to extend the advance past the 103.00 barrier on turnaround Tuesday.
USD Index looks at Powell, risk trends
Following two strong daily pullbacks, the index attempts to regain some upside traction and reclaim the area above 103.00 the figure in a more convincing fashion.
The so far small bullish attempt in the greenback is accompanied by marginal price action in US yields across the curve amidst some prudence ahead of the participation of Fed’s J.Powell at an event in Sweden on “Central Bank Independence”.
In the US data space, the NFIB Business Optimism Index, the IBD/TIPP Economic Optimism Index and monthly figure of Wholesale Inventories are all due later during the NA trading hours.
What to look for around USD
Despite the ongoing little recovery, the dollar remains under pressure in the 103.00 region amidst investors’ broad-based preference for the risk-associated galaxy.
The mixed results from the US Nonfarm Payrolls for the month of December (Friday) seem to have reignited the idea of a probable pivot in the Fed’s policy in the next months, which comes in contrast to the message from the latest FOMC Minutes, where the Committee advocated the need to remain within a restrictive stance for longer, at the time when it ruled out any interest rate reduction for the current year.
Furthermore, the tight labour market, still elevated inflation and the resilient economy are also seen supportive of the firm message from the Federal Reserve and its hiking cycle.
Key events in the US this week: Wholesale Inventories, Fed’s Powell (Tuesday) – MBA Mortgage Applications (Wednesday) – Inflation Rate, Initial Jobless Claims, Monthly Budget Statement (Thursday) – Flash Michigan Consumer Sentiment (Friday).
Eminent issues on the back boiler: Hard/soft/softish? landing of the US economy. Prospects for further rate hikes by the Federal Reserve vs. speculation of a recession in the next months. Fed’s pivot. Geopolitical effervescence vs. Russia and China. US-China trade conflict.
USD Index relevant levels
Now, the index is gaining 0.12% at 103.29 and the next up barrier comes at 105.63 (monthly high January 6) followed by 106.35 (200-day SMA) and then 107.19 (weekly high November 30). On the flip side, the breach of 102.94 (monthly low January 9) would open the door to 101.29 (monthly low May 30) and finally 100.00 (psychological level).
-
07:22
USD/JPY could quickly fall below 130 – Commerzbank
A glance at the Yen over the next few days might be interesting. Antje Praefcke, FX Analyst at Commerzbank, expects the USD/JPY pair to dive below the 130 level.
How far does the BoJ go?
“Next week's BoJ meeting will be exciting. After the surprise widening of the yield target in December, the big question is how far the BoJ will go. Perhaps next Wednesday we will get a first hint. Although it is likely to get really exciting starting in April, when the new Governor will take over, whose nomination is still pending.”
“If there are already signs next week that the BoJ really is moving further away from its ultra-expansionary stance, I would expect USD/JPY to quickly fall below 130.”
-
07:13
Forex Today: US Dollar consolidates losses, eyes on central bank speakers
Here is what you need to know on Tuesday, January 10:
Pressured by the improving market mood and dovish Fed bets, the US Dollar continued to weaken against its major rivals at the beginning of the week. The US Dollar Index touched its lowest level in seven months at 102.94 but managed to stage a modest rebound early Tuesday. Bank of Japan (BoJ) Governor Haruhiko Kuroda, Bank of Canada (BoC) Governor Tiff Macklem and FOMC Chairman Jerome Powell will be speaking at the International Symposium on Central Bank Independence organized by Riksbank. The US economic docket will also feature the NFIB Business Optimism Index for December and the IBD/TIPP Economic Optimism Index for January.
According to the CME Group FedWatch Tool, markets are currently pricing in a nearly 80% probability of a 25 basis points Fed rate hike in February. Although some policymakers pushed back against this market positioning, the US Dollar struggled to stay resilient against its rivals on Monday. Atlanta Fed President Raphael Bostic reiterated that the Fed was willing to keep rates higher well into 2024 and San Francisco Fed President Mary Daly told the Wall Street Journal that a case could be made for either a 50 or a 25 bps rate hike at the next meeting.
Nevertheless, markets seem to have turned cautious with US stock index futures losing between 0.2% and 0.25% in the early European morning. Meanwhile, the benchmark 10-year US Treasury bond yield stays relatively calm, slightly above 3.5% following Monday's slide.
EUR/USD climbed to its strongest level since early June above 1.0760 on Monday before going into a consolidation phase below 1.0750 early Tuesday.
GBP/USD managed to build on Friday's gains and rose nearly 100 pips before closing slightly below 1.2200 on Monday. The pair was last seen trading modestly lower on the day at around 1.2170.
USD/JPY failed to make a decisive move in either direction on Monday and closed the day virtually unchanged. As of writing, the pair was moving sideways slightly below 132.00.
Gold price advanced above $1,880 for the first time since early May on Monday but erased a large portion of its daily gains to close modestly higher. In the early European morning, XAU/USD is moving up and down in a narrow channel at around $1,870.
Bitcoin registered small gains on Monday and was last seen moving sideways near $17,200. Ethereum gained more than 2% on Monday and touched its highest level in nearly four weeks near $1,350 before retreating toward $1,300 on Tuesday.
-
07:12
US inflation data to further weaken the Dollar – Commerzbank
Market attention now probably focuses on US inflation data on Thursday. Antje Praefcke, FX Analyst at Commerzbank, assumes that this is unlikely to be positive for the US Dollar.
The next milestone will be the US price data the day after tomorrow
“I fear inflation would have had to remain almost constant in December (it is expected that it fell from 7.1% to 6.5%) for the market to consider the Fed’s projections to be more credible once again, and for the USD to gain support. Anything else is likely to further weaken the Dollar in the current environment.”
“Perhaps some might listen to Fed Chair Jerome Powell until then, who will be speaking on the independence of central banks at a Riksbank symposium. But let’s be honest, he is unlikely to provide any real news on Fed monetary policy at this stage. As a result, I consider listening to Powell’s speech to be a way of killing time until the next major event.”
-
07:06
GBP/USD faces a potential test of the 1.2330 level – UOB
If GBP/USD breaks above 1.2270, it could then attempt to revisit the 1.2330 zone, note UOB Group’s Economist Lee Sue Ann and Markets Strategist Quek Ser Leang.
Key Quotes
24-hour view: “Yesterday, we held the view that GBP ‘could continue to rise even though 1.2200 is likely out of reach’. The anticipated GBP strength exceeded our expectations as GBP rose to a high of 1.2209. While overbought, there is room for one more push higher in GBP before the risk of a pullback increases. That said, a break of the major resistance at 1.2270 is unlikely today (there is another resistance at 1.2240). On the downside, the support at 1.2095 is unlikely to come under threat (minor support is at 1.2150).”
Next 1-3 weeks: “We highlighted yesterday (09 Jan, spot at 1.2105) that GBP could rise further but it remains to be seen if it can build enough momentum to reach 1.2270. While there is no change in our view, after the strong advance yesterday, the odds for a break of 1.2270 have increased. The next resistance level above 1.2270 is at 1.2330. The GBP strength is intact as long as it does not break the ‘strong support’ at 1.2030 (level was at 1.1950 yesterday).”
-
07:04
USD/JPY struggles for a firm direction, consolidates in a range around 132.00 mark
- USD/JPY remains confined in a narrow trading band through the early European session.
- Rebounding US bond yields revives the USD demand and extends support to the major.
- Bets for less aggressive Fed rate hikes could cap the buck and limit any meaningful gains.
The USD/JPY pair continues with its struggle to gain any meaningful traction and oscillates in a narrow trading range for the second successive day on Tuesday. The pair is currently placed around the 132.00 round-figure mark, nearly unchanged for the day, and is influenced by a combination of factors.
The US Dollar stalls its recent downfall and regains some positive traction, which, in turn, is seen as a key factor lending support to the USD/JPY pair. A modest uptick in the US Treasury bond yields is seen acting as a tailwind for the USD amid some repositioning trade ahead of Fed Chair Jerome Powell's speech later during the early North American session. Investors will look for clues about the pace of Fed rate hikes at the upcoming meetings. This will influence the USD demand and provide some meaningful impetus to the major.
In the meantime, rising bets for relatively smaller rate hikes by the US central bank should keep a lid on any further upside for the US bond yields and the greenback. Apart from this, a softer risk tone could underpin the safe-haven Japanese Yen and contribute to capping the USD/JPY pair. Despite China's pivot away from its strict zero-COVID policy, looming recession fears weigh on investors' sentiment. This, along with speculations that the Bank of Japan will eventually phase out its ultra-lose policy settings warrant caution for bulls.
Moving ahead, there isn't any major market-moving economic data due for release from the US on Tuesday. Hence, the focus will remain glued to Powell's speech, which, along with the US bond yields, could drive the greenback and provide some impetus to the USD/JPY pair. Apart from this, the broader market risk sentiment will be looked upon to grab short-term trading opportunities around the major. The fundamental backdrop, meanwhile, favours bearish traders and supports prospects for an extension of the recent slide from over a three-decade high.
Technical levels to watch
-
07:03
Norway Producer Price Index (YoY) above expectations (7.7%) in December: Actual (18.7%)
-
07:03
Norway Core Inflation (MoM) came in at 0.4%, below expectations (0.7%) in December
-
07:03
Gold Price Forecast: XAU/USD to hit $1,900 as Impending Golden Cross reinforces bullish interests
Gold price is gathering strength. XAU/USD looks to recapture $1,900 amid a potential Golden Cross, FXStreet’s Dhwani Mehta reports.
Uptrend remains well in place
“Gold price is awaiting a fresh catalyst to earn acceptance above the multi-month peak of $1,880. The next stop for Gold bulls is seen at the $1,900 threshold, above which doors will open toward May 2022 high at $1,910.”
“The upward-sloping 50-Daily Moving Average (DMA) has pierced through the flattish 200DMA for the upside. If the 50DMA closes Tuesday above the 200DMA, it would confirm a Golden Cross and strengthen the near-term bullish bias for Gold price.”
“Gold sellers could fight back control on rejection at the $1,880 level, prompting a corrective pullback toward the previous day’s low at $1,865. Further declines will challenge the $1,850 psychological level, below which a sell-off toward the bullish 21DMA at $1,819 cannot be ruled out.”
-
07:02
Norway Consumer Price Index (YoY) came in at 5.9% below forecasts (8%) in December
-
07:02
Sweden New Orders Manufacturing (YoY) came in at -6.8%, below expectations (5.2%) in November
-
07:01
Denmark Inflation (HICP) (YoY) dipped from previous 9.7% to 9.6% in December
-
07:01
Gold Futures: Extra gains likely near term
Open interest in gold futures markets rose for the second session in a row on Monday, this time by around 13.7K contracts according to preliminary readings from CME Group. Volume followed suit and added to the previous daily build, rising by around 30.8K contracts.
Gold: Next target comes at the $2000 region
Monday’s continuation of the uptrend in prices of gold was amidst increasing open interest and volume, leaving the door open to further upside in the very near term. Against that, the next hurdle of relevance is now expected at the $2000 neighbourhood, an area last visited back in April 2022.
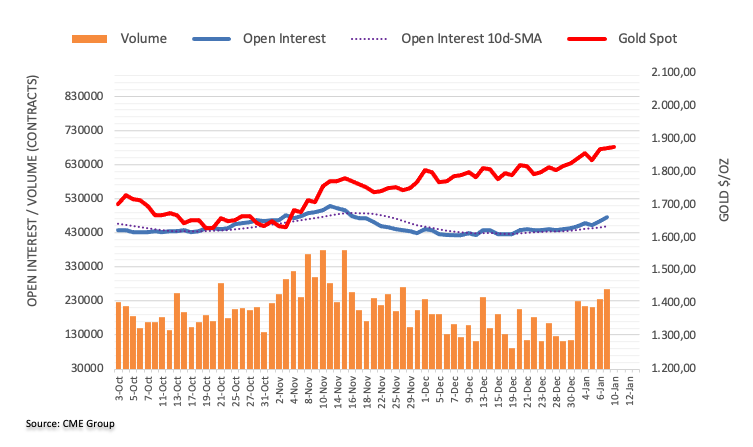
-
07:01
Norway Consumer Price Index (MoM) came in at 0.1%, below expectations (0.7%) in December
-
07:00
Sweden Industrial Production Value (MoM): -2.3% (November) vs previous 0.1%
-
07:00
Sweden Industrial Production Value (YoY) down to -0.5% in November from previous 3.1%
-
07:00
Denmark Consumer Price Index (YoY) declined to 8.7% in December from previous 8.9%
-
06:56
EU's Gentiloni: Eurozone GDP fall at start of 2023 to be less deep than feared
European Economic Affairs Commissioner Paolo Gentiloni said in an interview with the Italian newspaper Il Sole 24 Ore on Tuesday, he expects Eurozone GDP contraction around the start of this year may be less deep than was expected in November.
“The 0.3% forecast still seemed quite solid but various factors suggested the contraction expected in the fourth quarter of 2022 and the first quarter of this year would not be so sharp as had been expected,” Gentiloni noted.
Market reaction
At the time of writing, EUR/USD is trading at 1.0730, modestly flat on the day.
-
06:53
NZD/USD: Upbeat options market signals probe bears below 0.6400
NZD/USD pares intraday gains around 0.6375 during early Tuesday as options market signals put a floor under the Kiwi prices even if the US Dollar strength probe the pair buyers.
That said, one-month risk reversal (RR) of the NZD/USD pair, a ratio of call options versus put options, prints a +0.105 figure at the latest. With this, the Daily RR prints a three-day winning streak while posting the highest levels since December 30, 2022.
It should be noted that the NZD/USD pair’s weekly RR jumped the most in one month by the end of Friday, with a +0.120 figure, and snapped the two-week downtrend before printing the consecutive second weekly positive figure of +0.105 RR number.
On the other hand, the recent swing in the Federal Reserve (Fed) policymakers’ comments, favoring aggressive rate hikes of late, seem to join the easing optimism surrounding China to weigh on the NZD/USD prices. However, a comparatively more hawkish bias for the Reserve Bank of New Zealand (RBNZ) keeps the pair buyers hopeful.
Also read: NZD/USD retreats towards 0.6350 with eyes on Fed Chair Powell
-
06:33
EUR/USD could now challenge the 1.0785 level – UOB
UOB Group’s Economist Lee Sue Ann and Markets Strategist Quek Ser Leang suggest EUR/USD could revisit the 1.0785 region in the near term.
Key Quotes
24-hour view: “We highlighted yesterday that ‘There is room for the advance in EUR to edge above 1.0685 first before easing’. We added, ‘The next resistance at 1.0715 is not expected to come into view’. However, EUR cracked 1.0715 and rose to 1.0760 before pulling back. In view of the strong momentum, EUR is likely to strengthen further but it might not be able to maintain a foothold above 1.0785. Support is at 1.0700, followed by 1.0665. “
Next 1-3 weeks: “While we indicated yesterday (09 Jan, spot at 1.0645) that EUR is likely to trade with an upward bias, we held the view that the odds for a sustained rise above 1.0735 are not high. In other words, we did not expect the strong surge that sent EUR to a high of 1.0760 and the strong closing at 1.0728 (+0.79%). The ease with which EUR took out 1.0735 suggests it is likely to take a crack at another strong resistance level at 1.0785. Overall, EUR is likely to trade higher as long as it stays above 1.0635 (‘strong support’ level was at 1.0535 yesterday). Looking ahead, a breach of 1.0785 will shift our focus to 1.0900.”
-
06:32
USD/CHF Price Analysis: Recovery remains elusive below 0.9290
- USD/CHF picks up bids to pare recent losses around the lowest levels since March 2022.
- Bearish MACD signals, failure to cross the support-turned-resistance signal further downside.
- 61.8% Fibonacci retracement level guards immediate upside, bears can aim for previous yearly bottom.
USD/CHF traders lick their wounds around the 10-month low, picking up bids to 0.9210 amid early Tuesday morning in Europe.
In doing so, the Swiss currency (CHF) pair might have taken clues from the downbeat RSI (14) to pare recent losses. However, the bearish MACD signals keep the sellers hopeful.
Additionally favoring the bearish bias could be the quote’s previous failure to jump back beyond the support-turned-resistance line from January 2021, close to 0.9420 by the press time.
It’s worth noting that the 61.8% Fibonacci retracement level of the pair’s upside from January 2021 to October 2022, around 0.9290, restricts immediate recovery moves of the USD/CHF pair ahead of the previous support line near 0.9420.
Also acting as an upside filter is the August 2022 low of 0.9370 and 50% Fibonacci retracement near 0.9450.
Should the USD/CHF bulls keep the reins past 0.9450, the odds of witnessing a reversal to the late 2022 downtrend can’t be ruled out.
Meanwhile, the year 2022 low of 0.9090 appears immediate important support to watch during the USD/CHF pair’s further downside.
Following that, the 78.6% Fibonacci retracement level of 0.9055 could lure the bears ahead of highlighting the 0.9000 psychological magnet.
In a case where the USD/CHF pair remains weak past 0.9000, the mid-2021 low of 0.8926 and the year 2021 bottom surrounding 0.8755 will be in the spotlight.
USD/CHF: Weekly chart
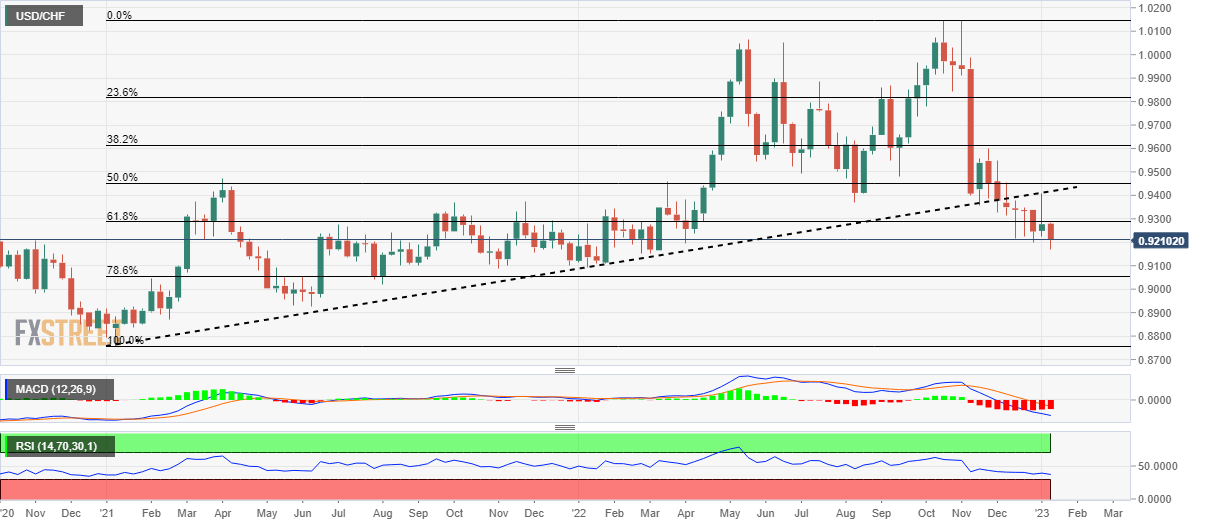
Trend: Further downside expected
-
06:10
Silver Price Analysis: XAG/USD picks strength around $23.50 as US Dollar Index drops
- A decline in the US Dollar Index has shifted traction in favor of Silver price.
- Investors’ risk appetite has improved amid a rebound in S&P500 futures.
- The 200-period EMA is overlapping with the white metal prices, which indicates a lackluster performance ahead.
Silver price (XAG/USD) has rebounded firmly after dropping to near $23.50 in the Asian session. The white metal has extended its recovery above the immediate resistance of $23.60 as the US Dollar Index (DXY) is facing heat amid failing to recapture the critical hurdle of 103.00.
It seems that the risk appetite of the market participants is improving again as S&P500 futures have trimmed the majority of their morning losses. Also, the 10-year US Treasury yields have dropped to 3.53%.
On an hourly scale, the Silver price has sensed buying interest after correcting to near the horizontal support plotted from December 29 low at $23.46. Broadly, the 200-period Exponential Moving Average (EMA) at $23.75 is overlapping with the white metal prices, which is indicating a lackluster performance ahead.
Meanwhile, the Relative Strength Index (RSI) (14) is aiming to shift into the 40.00-60.00 range from the bearish range of 20.00-40.00, which indicates an attempt for a bullish reversal.
For an upside move, the Silver price needs to break above Monday’s high at $24.10, which will drive the asset towards January 3 high at $24.55 followed by the psychological resistance at $25.00.
On the contrary, a declining move below January 5 low at $23.12 will drag the Silver price toward December 19 low and December 16 low at $22.84 and $22.56 respectively.
Silver hourly chart
-638089277926702721.png)
-
06:02
GBP/USD grinds lower past 1.2200 as inflation fears loom over UK, BoE’s Bailey, Fed’s Powell eyed
- GBP/USD portrays cautious markets ahead of key central bank leaders’ speeches.
- Upbeat prints of second-tier UK data fail to overcome inflation woes, tight labor market adds strength to the price pressure.
- Hawkish Fed talks, easing optimism surrounding China also probe Cable buyers.
- Panel discussion at Riksbank will be crucial as BoE Governor Bailey, Fed Chair Powell will speak there.
GBP/USD stays defensive around 1.2175 despite the latest rebound from the intraday low heading into Tuesday’s London open. In doing so, the Cable pair probes the previous two-day uptrend ahead of the key public appearances of Bank of England (BoE) Governor Andrew Bailey and the Federal Reserve (Fed) Chairman Jerome Powell.
The quote’s inability to rise further could also be linked to a pause in the US Treasury yields’ downside, as well as fading optimism over China. Additionally, fears that the UK inflation woes are strong enough to derail recently upbeat statistics seem to also weigh on Cable prices.
Reuters came out with the Barclays’ survey report while stating that British consumer spending in December lagged inflation, representing a sizeable fall in real-term expenditure, despite contributions from Christmas shopping and the men's soccer World Cup. On the same line, The Times quotes comments from the BoE Chief Economist Huw Pill as he signaled that higher natural gas prices, a tight labor market and global supply issues had created “the potential for inflation to prove more persistent”.
Elsewhere, comments from Atlanta Federal Reserve bank President Raphael Bostic could be held responsible for the rebound in the US Treasury yields as he said on Monday that it is ''fair to say that the Fed is willing to overshoot.'' On the same line, San Francisco Federal Reserve Bank President Mary Daly stated that they are determined, united, resolute to bring inflation down. Additionally, recently improving inflation expectations in the US, per the early forecasts from the Federal Reserve Bank of New York and St. Louis Federal Reserve, also weigh on the GBP/USD prices.
Furthermore, easing optimism surrounding China, mainly due to the Covid fears for the rural parts of the dragon nation, also seemed to have probed the GBP/USD buyers. Bloomberg cites the dearth of facilities and drugs, as well as experts’ fears of a spike in Covid cases in January, to challenge the previously positive sentiment.
While portraying the mood, the S&P 500 Futures remain lackluster around 3,915, down 0.20% intraday, whereas the US 10-year Treasury yields seesaw around a three-week low marked the previous day, close to 3.52% by the press time.
Looking forward, GBP/USD traders should pay attention to the central bankers’ comments from the Riksbank panel discussion and look for signs of aggressive rate hikes from the Fed to aim for further weakness.
Technical analysis
Despite the latest pullback, the 200-day Exponential Moving Average (EMA) puts the floor under the GBP/USD prices around 1.2110, a break of which could convince short-term bears to take control.
-
05:45
Yuan rally to provide FX stability in 2023 – China Press
Citing comments from Guan Tao, a former official at China’s State Administration of Foreign Exchange (SAFE), Yicai.com reported that the Yuan's new year rally has set the foundation for maintaining a stable exchange rate in 2023.
Additional quotes
But smoothing out Covid-19 disruptions and boosting market confidence are needed keep momentum going.
The recent strengthening of the yuan was due to the optimisation of pandemic controls, which had raised growth prospects and led to increased domestic and foreign appetite for yuan assets, with northbound capital flows increasing.
A record foreign trade surplus and strong domestic tourism data also added to the yuan's strength.
Related reads
- China's GDP growth forecast for 2023 raised to 5.7% – Morgan Stanley
- USD/CNY to slip towards 6.70 by end-2023 – TDS
-
05:43
USD/CAD continues oscillation below 1.3400 ahead of Powell/Macklem’s speech, oil drops further
- USD/CAD is displaying back-and-forth moves, following the footprints of the US Dollar Index.
- Federal Reserve Powell’s speech has become critical after a decline in US economic activities and wage inflation.
- Bank of Canada Macklem’s speech could be hawkish after upbeat December employment data.
- USD/CAD may remain in the grip of bears on a broader note amid declining 20-and 50-EMAs.
USD/CAD is struggling to extend its recovery move from 1.3350 above the immediate resistance of 1.3400 in the early European session. The Loonie asset is displaying a sideways auction as investors are awaiting speeches from Federal Reserve (Fed) chair Jerome Powell and Bank of Canada (BoC) Governor Tiff Macklem for fresh cues.
The market mood has turned risk-averse amid selling interest in risk-perceived assets like S&P500 futures. The 500-stock basket futures have continued their late Monday sell-off mood in the Asian session. Also, a rebound in the 10-year U Treasury yields to near 3.54% has weighed on investors’ risk appetite. The US Dollar Index (DXY) is displaying a lackluster performance below the critical resistance of 103.00 as investors have preferred to remain quiet ahead of the speeches.
Federal Reserve Powell’s speech hogs limelight
The speech from Federal Reserve Powell, which is scheduled for Tuesday, carries significant traction. Investors expect that soaring recession fears led by a slowdown in Services and Manufacturing PMI in the United States and a constructive decline in December’s Average Hourly Earnings might impact the methodology yet designed by Fed Powell and his teammates to combat stubborn inflation.
However, other Fed policymakers are still solid on their prior views. On Monday, San Francisco Fed Bank President Mary Daly dictated that December wage data was one month of data, which can't be declared as a victory. It's too soon to declare victory and stop further interest rate hikes. To tame stubborn inflation, it is reasonable for interest rates to be at 5%-5.25%. Also, Atlanta Fed bank president Raphael Bostic sees interest rate peak in at 5%-5.25%. He further added that the Federal Reserve will continue keeping higher interest rates active into CY2024.
United States Inflation- a key trigger ahead
This week, the show-stopper event will be the United States Consumer Price Index (CPI) data, which will release on Thursday. Considering a firmer drop in wage inflation and a decline in the extent of economic activities, the inflation rate is expected to continue its declining spree. According to Bloomberg, the Labour Department’s CPI is expected to show core inflation at 5.7% from the former release of 6.0%. In the opinion of Ulrich Leuchtmann, Head of FX and Commodity Research at Commerzbank, the US Dollar could stay resilient even with a soft reading.
“The majority of analysts polled by Bloomberg expect that consumer prices will not have risen in December. If that turns out to be correct, we could bet on everything being priced in, with the Dollar not coming under pressure. However, I am not so sure.”
Bank of Canada Macklem’s speech to provide further assistance
The Canadian Dollar is likely to remain on tenterhooks as Bank of Canada Governor Tiff Macklem will deliver a speech on Tuesday. After the release of stronger-than-expected Employment Change and a decline in the Unemployment Rate to 5.0% from the consensus of 5.2% last week, market participants believe that this might escalate wage discussions among firms and job seekers. Bank of Canada’s Macklem could deliver hawkish projections for interest rates as higher employment bills for firms will heat up inflation further.
USD/CAD technical outlook
-638089261360046894.png)
After a breakdown of stretched consolidation formed in a range of 1.3482-1.3702 on a four-hour, USD/CAD has dropped dramatically to near 1.3350. The range expansion on the south side is expected to continue further as the overall market sentiment is still positive.
Declining 20-and 50-period Exponential Moving Averages (EMAs) at 1.3450 and 1.3510 respectively, add to the downside filters.
Also, the Relative Strength Index (RSI) (14) has shifted into the bearish range of the 20.00-40.00 range, which indicates that a bearish momentum has been activated.
On the oil front, the oil price has extended its downside to near $74.50 despite analysts at Morgan Stanley having raised their forecast for China’s GDP to above 5.0%. A note from Morgan Stanley states that the removal of barriers to the housing/property sectors and recovery from COVID zero will strengthen China's economic recovery, which will solidify prospects starting from the second quarter of CY2023.
It is worth noting that Canada is a leading exporter of oil to the United States and lower oil prices impact the Canadian Dollar.
-
05:31
Netherlands, The Consumer Price Index n.s.a (YoY) dipped from previous 9.9% to 9.6% in December
-
05:27
AUD/USD Price Analysis: Stays defensive around 0.6900 inside bullish channel
- AUD/USD remains sidelined around four-month high, snaps two-day uptrend.
- Eight-week-long ascending trend channel, sustained breakout of 200-DMA favor bulls.
- Multiple Fibonacci retracement levels add to the downside filters.
AUD/USD struggles to defend the 0.6900 round figure as bulls retreat after poking the highest levels since late May the previous day.
Even so, the Aussie pair keeps Friday’s upside break of the 200-DMA inside a two-month-old bullish chart formation, namely ascending trend channel. Also keeping the AUD/USD buyers hopeful are the bullish MACD signals.
That said, the quote’s latest pullback could aim for the 61.8% Fibonacci retracement level of its June-October 2022 downside, near 0.6860, before challenging the 200-DMA support of 0.6838.
Should the AUD/USD prices drop back below the key moving average, a convergence of the 50% Fibonacci retracement level and lower line of the stated bullish channel could challenge the bears around 0.6730-25 before giving them control.
Following that, a slump toward the 38.2% Fibonacci retracement near 0.6600 can’t be ruled out.
Alternatively, the recent high near 0.6950 and the stated channel’s upper line, close to 0.6990 could challenge short-term AUD/USD buyers. It’s worth noting that the 0.7000 psychological magnet and late August 2022 swing high near 0.7010 act as additional resistances to test the pair’s upside momentum.
In a case where the AUD/USD price remains firmer past the 0.7010 threshold, the August 2022 peak of 0.7136 should return to the charts.
AUD/USD: Daily chart
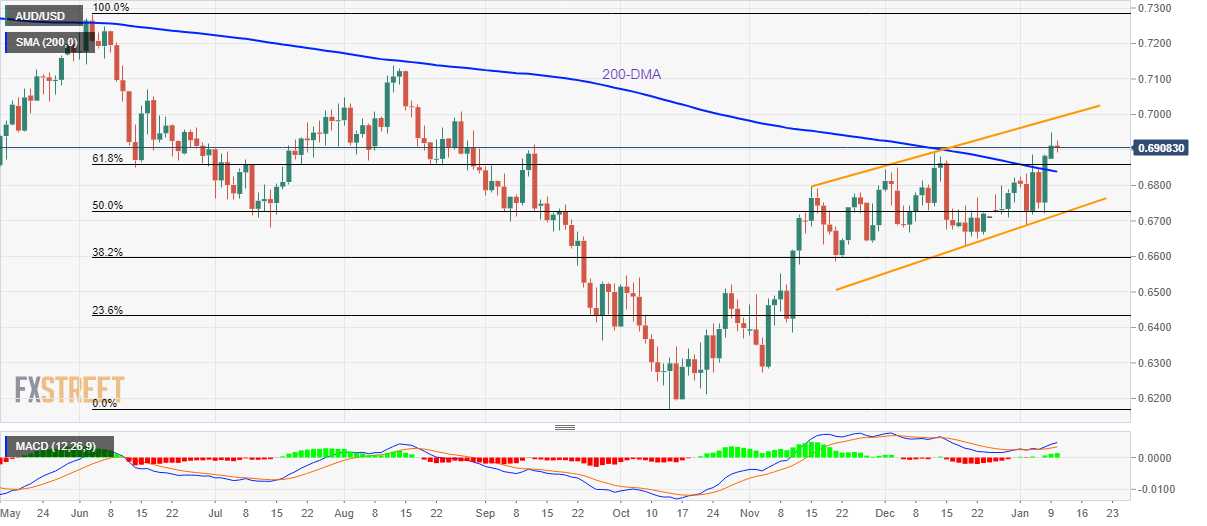
Trend: Bullish
-
05:00
EUR/USD treads water above 1.0700 with eyes on ECB, Fed talks
- EUR/USD seesaws around seven-month high, steadies off late.
- Cautious mood ahead of this week’s key catalysts probe EUR/USD traders.
- Upbeat EU data jostle with hawkish Fedspeak to confuse pair traders.
- Speeches from Fed Chair Powell, ECB’s Schnabel and US inflation will be crucial for fresh impulse.
EUR/USD dribbles between 1.0720 and 1.0745 so far during early Tuesday as traders await more clues to extend the latest north-run. In doing so, the major currency pair seesaws around the highest levels since June 2022 as bulls run out of steam as the US Dollar rebounds on doubts over the previous risk-on mood, as well as due to a rebound in the US Treasury yields.
US Dollar Index (DXY) picks up bids to 103.25 as it bounces off an upward-sloping support line from May 2021. That said, the US 10-year Treasury yields seesaw around a three-week low marked the previous day, close to 3.53% by the press time, as it snaps a two-day downtrend.
The rebound in the US Treasury yields and the DXY could be linked to the comments from Atlanta Federal Reserve bank President Raphael Bostic as he said on Monday that it is ''fair to say that the Fed is willing to overshoot.'' On the same line, San Francisco Federal Reserve Bank President Mary Daly stated that they are determined, united, resolute to bring inflation down.
Furthermore, the Federal Reserve Bank of New York's monthly Survey of Consumer Expectations showed on Monday that the US consumers' one-year inflation expectations declined to 5% in December from 5.2% prior. However, the three-year ahead expected inflation remained unchanged at 3% and the five-year ahead expected inflation edged higher to 2.4% from 2.3%, which in turn renewed inflation woes and probed EUR/USD bulls.
On the other hand, German Industrial Production rose 0.2% MoM in November versus 0.1% expected and -0.1% previous readings. However, the yearly figures marked -0.4% YoY outcome compared to 0.0% prior and 1.3% market forecasts. Additionally, the Eurozone Sentix Investor Confidence index rose to –17.5 in January from -21.0 in December vs. -11.1 expected. On the contrary, the European Central Bank (ECB) noted in its Economic Bulletin article published on Monday that the wage growth in the next few quarters to be "very strong" but real wages will fall further in the coming months.
Receding optimism surrounding China, mainly due to the Covid fears for the rural parts of the dragon nation, also seemed to have probed the EUR/USD buyers. Bloomberg cites the dearth of facilities and drugs, as well as experts’ fears of a spike in Covid cases in January, to challenge the previously positive sentiment.
As a result, the S&P 500 Futures dropped 0.30% intraday by the press time even as Wall Street closed mixed.
Moving on, a speech by ECB’s Isabel Schnabel will precede Fed Chair Powell’s panel discussion at the Riksbank’s International Symposium on Central Bank Independence to determine immediate EUR/USD moves. Should Fed’s Powell favor aggressive rate hikes, the major currency pair may witness further declines.
Technical analysis
A downward-sloping resistance line from late May 2022, around 1.0730, joins the looming bull cross on the MACD indicators to keep the EUR/USD buyers hopeful.
On the contrary, pullback moves may initially aim for a seven-week-long support line, close to 1.0540 to convince the EUR/USD bears.
-
04:36
Asian Stock Market: Displays mix signals as S&P futures correct ahead of Fed Powell, oil below $75.00
- Asian stocks are displaying mixed signals led by respective developments.
- Chinese equities have failed to capitalize on the upside revision of GDP projections.
- This time, Fed Powell’s speech holds decent weightage as wage inflation has dropped.
Markets in the Asian domain are displaying mixed signals after a corrective move in S&P500 futures ahead of the speech from Federal Reserve (Fed) chair Jerome Powell, scheduled for Tuesday. The risk profile seems favoring safe-haven assets amid soaring anxiety among investors as Fed Powell’s speech may provide cues about likely monetary policy action for the February meeting.
This time, the Fed Powell’s speech holds decent weightage as the United States economy is facing a slowdown and wage inflation has been trimmed, which was acting as a major barrier for Fed policymakers in their vision towards price stability.
At the press time, Japan’s Nikkei225 jumped 0.70%, ChinaA50 eases 0.20%, Hang Seng dropped 0.24%, and Nifty50 slipped 0.52%.
Chinese stocks are displaying a subdued performance despite rising Gross Domestic Product (GDP) projections. Analysts at Morgan Stanley have raised their forecast for China’s GDP this year to above 5.0%. A note from Morgan Stanley states that the removal of barriers to the housing/property sectors and recovery from COVID zero will strengthen China's economic recovery, which will solidify starting from the second quarter of CY2023. It is worth noting that the Chinese administration is easing property and tech sector regulations.
Meanwhile, Japanese stocks have gained strength despite a lower-than-projected jump in Tokyo’s Consumer Price Index (CPI). The headline annual CPI has landed at 4.0% lower than the consensus of 4.5% but higher than the prior release of 3.8%. While the core CPI has remained in line with expectations at 2.7%. For further assistance, investors will keep an eye on the speech from Bank of Japan (BOJ) Governor Haruhiko Kuroda.
On the oil front, the oil price has extended its downside to near $74.50 as the Fed is not expected to trim the current pace of policy tightening despite a slowdown in economic activities in the United States. This may escalate recession fears ahead.
-
04:29
Gold Price Forecast: XAU/USD bulls need validation from $1,877 and Fed Chair Powell – Confluence Detector
- Gold price seesaws around the highest levels since June 2022 as multiple technical indicators probe bulls.
- Recent shift in Fed talks, US inflation expectations also probe the XAU/USD bulls.
- Fed’s Powell needs to defend aggressive rate hikes to tease Gold bears.
Gold price (XAU/USD) retreats from the eight-month high as bulls struggle to keep the reins ahead of this week’s key catalysts. The metal’s pullback could also be linked to the fresh doubts on the China-linked optimism in the markets as a news piece from Bloomberg flagged Covid fears for the world’s second largest economy, as well as one of the biggest Gold consumers. Additionally probing the XAU/USD buyers could be the latest shift in the Federal Reserve (Fed) talks as Atlanta Fed President Raphael Bostic and San Francisco Federal Reserve Bank President Mary Daly defends rate hike trajectory ahead of Fed Chair Jerome Powell’s speech. It should be noted that the cautious mood ahead of Wednesday’s China Consumer Price Index (CPI) and the US CPI data, up for publishing on Thursday, also challenge the Gold buyers.
Also read: Gold Price Forecast: Optimistic buyers maintain the upward pressure
Gold Price: Key levels to watch
The Technical Confluence Detector shows that the Gold price retreats from the key resistance level surrounding $1,877, comprising Fibonacci 38.2% one-day and Pivot Point one-month R2.
Even if the metal manages to cross the $1,877 hurdle, the Pivot Point one-week R1, around $1,885, will precede the Pivot Point one-day R2 near $1,890 to challenge the Gold buyers before offering them the $1,900 threshold.
Meanwhile, a convergence of the previous weekly high and lower band of the Bollinger on the hourly chart, close to $1,868, limits immediate downside of the XAU/USD.
Following that, a slump towards the $1,860 support comprising Fibonacci 23.6% on one-week can’t be ruled out.
However, multiple hurdles stand tall to challenge the Gold bears between $1,860 and $1,851 while Pivot Point one-month R1 appears a tough nut to crack for the XAU/USD sellers around $1,850.
Here is how it looks on the tool
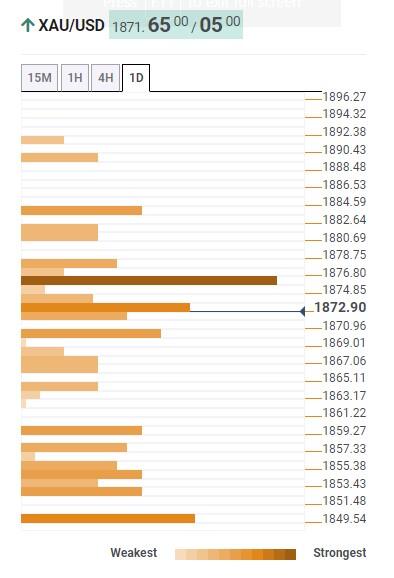
About Technical Confluences Detector
The TCD (Technical Confluences Detector) is a tool to locate and point out those price levels where there is a congestion of indicators, moving averages, Fibonacci levels, Pivot Points, etc. If you are a short-term trader, you will find entry points for counter-trend strategies and hunt a few points at a time. If you are a medium-to-long-term trader, this tool will allow you to know in advance the price levels where a medium-to-long-term trend may stop and rest, where to unwind positions, or where to increase your position
-
04:10
USD/INR Price News: Indian Rupee snaps four-day winning streak as market optimism fades, focus on Fed’s Powell
- USD/INR seesaws near one-month low, bears take a breather after four-day downtrend.
- Market sentiment dwindles on mixed updates from China, hawkish Fed talks.
- Easy prices of oil, technical breakdown keeps Indian Rupee buyers hopeful.
- Fed Chair Powell’s speech, US inflation data will be crucial for clear directions.
USD/INR stays defensive around 82.15-20 as it probes bears for the first time in five days during early Tuesday. In doing so, the Indian Rupee (INR) pair takes clues from the US Dollar’s rebound amid the mixed sentiment and anxiety ahead of the key catalysts. However, softer prices of oil and a downside break of 82.40 keeps the pair sellers hopeful.
US Dollar Index (DXY) makes rounds to 103.15-20 as sellers pause after a two-day downtrend around the lowest level since June 2022. That said, the greenback’s gauge versus the six major currencies takes clues from a rebound in the US Treasury yields, as well as the hawkish statements from the Federal Reserve (Fed) officials.
Atlanta Federal Reserve bank president Raphael Bostic said on Monday that it is ''fair to say that the Fed is willing to overshoot.'' On the same line, San Francisco Federal Reserve Bank President Mary Daly stated that they are determined, united, resolute to bring inflation down.
Additionally, the Federal Reserve Bank of New York's monthly Survey of Consumer Expectations showed on Monday that the US consumers' one-year inflation expectations declined to 5% in December from 5.2% prior. However, the three-year ahead expected inflation remained unchanged at 3% and the five-year ahead expected inflation edged higher to 2.4% from 2.3%.
Elsewhere, headlines from Bloomberg suggesting fears of high COVID-19 figures from rural China, as the holiday season in the Asian major looms, also tease the USD/INR bulls. The news cites the death of facilities and drugs, as well as experts’ fears of a spike in Covid cases in January, to challenge the optimism surrounding China.
It should be observed that the WTI crude oil prices fade the previous day’s rebound, down 0.61% intraday near $74.55 by the press time, as risk-aversion weighs on the energy benchmark.
Against this backdrop, the S&P 500 Futures remain lackluster around 3,915, down 0.05% intraday, whereas the US 10-year Treasury yields seesaw around a three-week low marked the previous day, close to 3.52% by the press time.
Given the latest rebound in the USD/INR prices, the pair traders will pay higher attention to Fed Chair Jerome Powell’s panel discussion for possible clues on the hawkish moves of the US central bank.
Technical analysis
A clear downside break of the 82.40 support keeps USD/INR bears hopeful of revisiting the 82.00 threshold.
-
04:08
USD/IDR turns volatile after weak Indonesian Retail Sales, Fed Powell in focus
- USD/IDR has displayed a wild gyration after the release of downbeat Indonesian Retail Sales data.
- The annual Indonesian Retail Sales have dropped to 1.3% vs. the former release of 3.7%.
- Fed policymakers have not trimmed their terminal rate projections despite a slowdown in economic activities.
The USD/IDR pair is displaying volatile moves in the Asian session after the release of the annual Indonesian Retail Sales (Nov) data. The economic data has landed at 1.3%, lower than the prior release of 3.7%.
A decline in Retail sales is going to delight the Bank Indonesia (BO), which is focusing on taming inflation. Currently, the Indonesian Consumer Price Index (CPI) stands at 5.51%. A drop in retail demand is a critical factor that signifies a decline in the price pressures ahead.
Meanwhile, the risk profile is turning averse as S&P500 futures are facing immense heat from the market participants. A follow-up selling in the 500-stock basket futures after a late sell-off on Monday is indicating that investors are getting anxious ahead of the speech from Federal Reserve (Fed) chair Jerome Powell. The alpha generated by 10-year US Treasury yields has accelerated above 3.54%, portraying caution in the market mood.
The US Dollar Index (DXY) has found an intermediate cushion above 102.50 as Fed policymakers have not trimmed their terminal rate projections despite a slowdown in the extent of economic activities in the United States economy and a significant drop in employment bills generated by firms.
San Francisco Fed Bank President Mary Daly cited that it is reasonable for interest rates to be at 5%-5.25%, as reported by Reuters. Also, Atlanta Federal Reserve bank president Raphael Bostic sees the interest rate peak in a 5%-5.25% range and the continuation of higher interest rates beyond CY2023.
-
03:31
GBP/USD Price Analysis: Struggle continues for shifting auction above 1.2200
- GBP/USD is facing stubborn barricades around 1.2200 as anxiety soars ahead of Fed Powell’s speech.
- The US Dollar Index (DXY) is aiming to extend its recovery to near the round-level resistance of 103.00.
- A bull cross, represented by the 20-and 50-period EMAs at 1.2040, adds to the upside filters.
The GBP/USD pair is continuously facing heat in attempts of breaking above the immediate resistance of 1.2200 in the Asian session. The market mood has turned sour as risk-sensitive assets like S&P500 futures have extended their losses in Tokyo. Also, the 10-year US Treasury yields have escalated to near 3.54%.
The US Dollar Index (DXY) is aiming to extend its recovery to near the round-level resistance of 103.00 as anxiety among investors is soaring ahead of the speech from Federal Reserve (Fed) chair Jerome Powell’s speech.
On a four-hour scale, the Cable has corrected marginally after delivering a break above the horizontal resistance plotted from November 24 high at 1.2153. Correction in cable seems healthy amid the absence of wider ticks, which might result in a resumption of an upside journey going ahead.
A bull cross, represented by the 20-and 50-period Exponential Moving Averages (EMAs) at 1.2040, adds to the upside filters.
Meanwhile, the Relative Strength Index (RSI) (14) is oscillating in the bullish range of 60.00-80.00, which indicates that the upside momentum is still solid.
Should the asset break above Thursday’s high at 1.2210, Pound Sterling bulls will drive Cable towards December 5 high at 1.2344 followed by December 14 high at 1.2446.
Alternatively, a slippage below Thursday’s at 1.1873 will drag the major toward November 21 low around 1.1778. A breakdown of the latter will expose Cable for more downside towards the round-level support at 1.1700.
GBP/USD four-hour chart
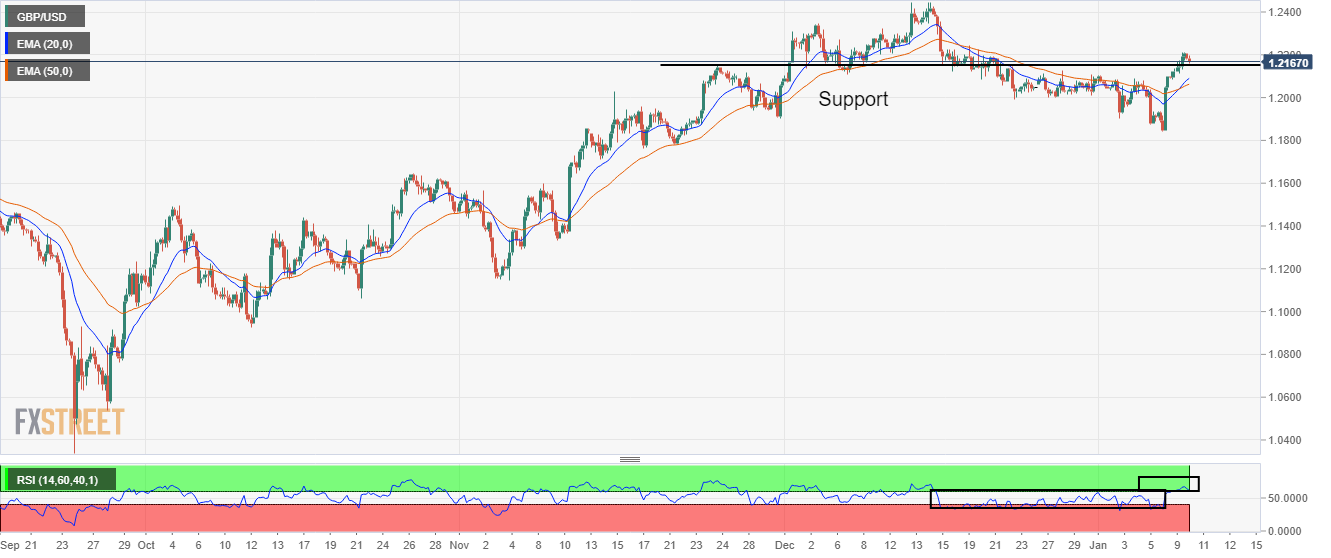
-
02:55
AUD/USD fails to cheer China-linked positives as US Dollar rebounds ahead of Fed Powell’s speech
- AUD/USD takes offers to snap two-day uptrend, extends pullback from four-month high.
- Improvement in Aussie-China ties, upbeat employment conditions in Beijing fail to inspire AUD/USD bulls.
- Hawkish Fedspeak, Covid conditions in rural China challenge pair buyers.
- Fed Chair Powell’s speech precedes inflation numbers from China, US to direct short-term market moves.
AUD/USD renews its intraday low around 0.6900 as the Aussie bulls step back from a five-month high while snapping a two-day uptrend during early Tuesday. In doing so, the major currency pair takes clues from the latest recovery in the US Dollar and the US Treasury bond yields. That said, optimism surrounding the Aussie-China trade ties fail to impress the traders of late, mainly due to the cautious mood ahead of this week’s key catalysts, as well as mixed concerns.
Market’s chatters that China's reopening will add 1.0% to Australia's GDP and a turnaround in the Aussie-Sino relations during 2022 previously underpinned the AUD/USD run-up. Further, headlines from China State Media Xinhua signaled that the dragon nation achieved its annual urban job target despite Covid woes in 2022 also seemed to have put a floor under the Aussie prices. “China created 12.06 million new urban jobs in 2022, achieving the government's annual target despite the COVID hit to economic growth, state media Xinhua reported late Monday, citing the minister of human resources,” reported Reuters.
However, fresh fears surrounding the hawkish Fed speak and fresh Covid woes in rural China seemed to have probed the risk-barometer pair.
That said, Atlanta Federal Reserve bank president Raphael Bostic said on Monday that it is ''fair to say that the Fed is willing to overshoot.'' On the same line, San Francisco Federal Reserve Bank President Mary Daly stated that they are determined, united, resolute to bring inflation down. Additionally, the Federal Reserve Bank of New York's monthly Survey of Consumer Expectations showed on Monday that the US consumers' one-year inflation expectation declined to 5% in December from 5.2% prior. Alternatively, the three-year ahead expected inflation remained unchanged at 3% and the five-year ahead expected inflation edged higher to 2.4% from 2.3%.
Elsewhere, the recent headlines from Bloomberg suggesting fears of high COVID-19 figures from rural China, as the holiday season in the Asian major looms, also probe AUD/USD bulls. The news cites the death of facilities and drugs, as well as experts’ fears of a spike in Covid cases in January, to challenge the optimism surrounding China.
Amid these plays, the S&P 500 Futures remain lackluster around 3,915, down 0.05% intraday, whereas the US 10-year Treasury yields seesaw around a three-week low marked the previous day, close to 3.52% by the press time.
Looking forward, Fed Chairman Jerome Powell’s speech will precede Wednesday’s China inflation data and Thursday’s US Consumer Price Index (CPI) to direct short-term AUD/USD moves.
Technical analysis
Despite the latest pullback, AUD/USD sellers will need a clear downside break of the 200-DMA, around 0.6840 by the press time, to retake control.
-
02:47
China's GDP growth forecast for 2023 raised to 5.7% – Morgan Stanley
Analysts at Morgan Stanley raised their forecast for China’s Gross Domestic Product (GDP) this year to above 5.0%.
Key quotes
"If policy can remove barriers to the housing/property sectors and recovery from COVID zero then China's economic recovery should solidify starting in 2Q2 of this year."
"Project growth in GDP of 5.7% YoY in 2023."
"Fiscal and monetary policy is supportive."
"Property, tech sector regulations have been eased."
-
02:30
S&P 500 Futures retreat as Treasury bond yields pause two-day downtrend, Fed Chair Powell eyed
- Market sentiment remains sluggish as recently hawkish Fedspeak, US inflation expectations probe Fed doves.
- Covid fears from China outweigh optimism concerning border reopening.
- Fed Chair Powell’s panel discussion will be eyed for predicting rate hike trajectory, risk moves ahead of US inflation.
The week-start risk-on mood fades during early Tuesday as market players weigh recently hawkish Fed talks amid a sluggish session. Also likely to have probed the optimists are the easing optimism surrounding China, as well as the cautious mood ahead of a speech from Fed Chairman Jerome Powell.
While portraying the mood, the S&P 500 Futures remain lackluster around 3,915, down 0.05% intraday, whereas the US 10-year Treasury yields seesaw around a three-week low marked the previous day, close to 3.52% by the press time.
It’s worth noting that the Atlanta Federal Reserve bank president Raphael Bostic said on Monday that it is ''fair to say that the Fed is willing to overshoot.'' On the same line, San Francisco Federal Reserve Bank President Mary Daly stated that they are determined, united, resolute to bring inflation down. Additionally, the Federal Reserve Bank of New York's monthly Survey of Consumer Expectations showed on Monday that the US consumers' one-year inflation expectation declined to 5% in December from 5.2% prior. Alternatively, the three-year ahead expected inflation remained unchanged at 3% and the five-year ahead expected inflation edged higher to 2.4% from 2.3%.
Also likely to have probed the risk takers could be the recent headlines from Bloomberg suggesting fears of high COVID-19 figures from rural China as the holiday season in the Asian major looms. The news cites death of facilities and drugs, as well as experts’ fears of a spike in Covid cases in January, to challenge the optimism surrounding China.
Previously, China’s reopening of the international borders after a three-year halt joined Beijing’s readiness for stimulus and early signals of a shopping spree ahead of the Chinese New Year holiday season to underpin the firmer sentiment. On the same, Friday’s US economics, mainly concerning the wage growth and ISM Services PMI for December, raised speculations that the Federal Reserve (Fed) finally has an upper hand in taming inflation, suggesting a pause to aggressive rate hikes, which in turn favored the risk-on mood.
Looking ahead, Fed Chairman Jerome Powell’s speech, as well as Thursday’s US Consumer Price Index (CPI) will be crucial for near-term market directions.
Also read: Forex Today: Optimism hits the US Dollar
-
02:30
Commodities. Daily history for Monday, January 9, 2023
Raw materials Closed Change, % Silver 23.636 -1.01 Gold 1871.6 0.28 Palladium 1775.97 -1.83 -
02:19
China's reopening to add around 1% to Australian GDP – JP Morgan
Economists at JP Morgan are of the view that China’s reopening from the Covid restrictions will likely boost Australian economic growth by around 1.0%.
Additional takeaways
"China’s shift toward an earlier reopening raises the question of potential implications for the Australian economy."
"The largest potential upside from reopening itself sits within the services sector given China is the largest consumer of Australian tourism and education exports."
"And that a full recovery in Australia’s tourism will add 0.5% to GDP."
"The return of international students from China will add another 0.4%."
-
02:07
USD/JPY Price Analysis: Further downside hinges on 131.30 break
- USD/JPY remains pressured for third consecutive day as sellers poke one-week-old support line.
- Bearish MACD signals, downbeat RSI signal further south-run.
- Any recovery remains elusive below 135.00 resistance confluence.
USD/JPY holds lower ground near the intraday bottom surrounding 131.30 as bears flirt with the short-term key support during early Tuesday. In doing so, the Yen pair prints a three-day downtrend while justifying the bearish MACD signals and the absence of an oversold RSI (14).
With this, the USD/JPY price is likely to remain weak and could break the one-week-old support line, near 131.30 by the press time, in the near term.
Following that, the 131.00 round figure and 130.00 psychological magnet may entertain the Yen pair sellers before directing them to the recent trough surrounding 129.50.
It’s worth noting that the RSI (14) could turn oversold when the USD/JPY hit 129.50, which in turn may trigger a corrective bounce, if not then the 61.8% Fibonacci Expansion (FE) of the pair’s moves between November 30, 2022, and January 03, 2023, close to 128.30, will be in focus.
On the contrary, recovery moves may initially aim for the previous day’s peak of 132.65 before heading towards the late December 2022 swing high surrounding 134.50.
However, the 200-SMA and a downward-sloping resistance line from November 30, 2022, close to 135.00 by the press time, will be a tough nut to crack for the USD/JPY bulls to retake control.
USD/JPY: Four-hour chart
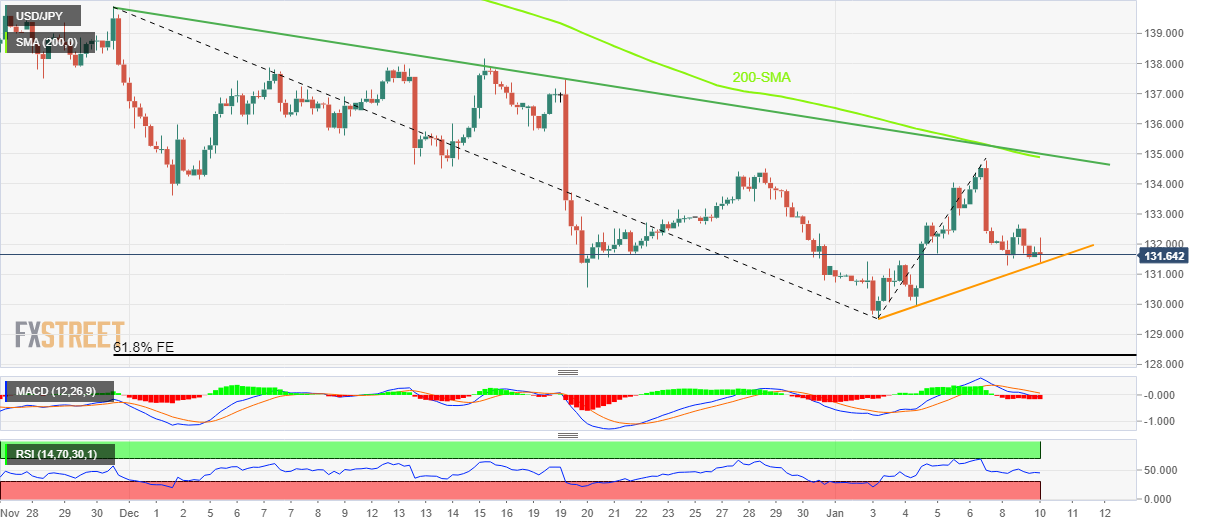
Trend: Further downside expected
-
02:04
WTI remains in bullish territory despite a correction in Asia
- WTI bulls pullback in Asia, but themes are upbeat as China reopens borders.
- China issued a fresh batch of import quotas, a signal that the world’s largest importer is ramping up to meet higher demand.
West Texas Intermediate, WTI, is down on the Asian session, losing some 0.4% at the time of writing despite hopes demand from China will improve as the country issued new import quotas. Nevertheless, overnight and at the start of the week, the news offered economic support for its flagging economy, while the US Dollar weakened, enabling investors a cheaper entry into the black gold rally.
Elsewhere, China continued to dismantle much of its strict zero-COVID rules around movement as it reopened its borders to international visitors for the first time since it imposed travel restrictions in March 2020. The BBC reported that ''incoming travellers will no longer need to quarantine, marking a significant change in the country's Covid policy as it battles a surge in cases. They will still require proof of a negative PCR test taken within 48 hours of travelling.''
As a consequence, oil prices surged early on Monday as hopes demand from China will improve as the country issued new import quotas and offered economic support for its flagging economy. Spot West Texas Intermediate crude was last seen at o $ 74.57 bbls.
Analysts at ANZ Bank explained that ''China issued a fresh batch of import quotas, a signal that the world’s largest importer is ramping up to meet higher demand.''
''Easing COVID-19 restrictions have already boosted travel. Some 34.7m trips within the country were made on the first official day of the Spring Festival travel rush, according to the Ministry of Transport. That’s more than 40% above comparable days in 2022. Roughly 2.1bn trips are expected over the 40-day period. This comes amid tightening supplies,'' the analysts said.
-
01:58
China's Envoy to Australia Xiao: Aussie-Sino relationship witnessed a turnaround in 2022
Chinese Ambassador to Australia Xiao Qian talks up the relationship between Australia and China.
Key quotes
In 2022, the Australia-Sino relationship experienced a turnaround.
The relationship has been constructive so far.
Market reaction
AUD/USD is holding higher ground on the upbeat comments, trading at 0.6925, up 0.20% on the day.
-
01:44
NZD/USD Price Analysis: Kiwi drops from 0.6400 amid ease in risk-on mood
- Investors are awaiting the speech from Fed Powell for fresh impetus.
- A Double Bottom formation signifies a responsive buying action after a weak selling interest around the previous cushion.
- A bull cross, represented by the 20-and 50-period EMAs at 0.6300, adds to the upside filters.
The NZD/USD pair has corrected to near 0.6370 after sensing selling pressure near the round-level resistance of 0.6400 in the Asian session. The Kiwi asset is likely to remain on the tenterhooks as investors are awaiting the speech from Federal Reserve (Fed) chair Jerome Powell for fresh impetus.
Meanwhile, the risk impulse is quite confusing as S&P500 futures are recovering after dropping sharply in the early Asian session. Also, the alpha generated by 10-year Treasury yields has accelerated to near 3.55%.
A formation of a Double Bottom chart pattern around 0.6200 on a four-hour scale resulted in a firmer rally in NZD/USD. Usually, the chart pattern signifies a responsive buying action after a weak selling interest on previous support levels by the market participants.
A bull cross, represented by the 20-and 50-period Exponential Moving Averages (EMAs) at 0.6300, adds to the upside filters. Also, the 200-EMA at 0.6277 has acted as a cushion for the New Zealand Dollar.
The Relative Strength Index (RSI) (14) is trying hard to keep oscillation in the bullish range of 60.00-80.00 as it will maintain strength in the US Dollar.
After a firmer rally, it is highly likely that the Kiwi asset will test the critical support placed from January 4 high around 0.6350, which will trigger a bargain buy opportunity and will drive the major towards Monday’s high at 0.6412 followed by the psychological resistance at 0.6500.
On the contrary, a break below December 22 low at 0.6230 will expose the Kiwi asset for more downside toward November 28 low at 0.6155. A slippage below the latter will drag the asset further to near November 21 low at 0.6087.
NZD/USD four-hour chart
-638089117966318040.png)
-
01:42
EUR/USD Price Analysis: Struggles around 1.0730 resistance amid looming bull cross on MACD
- EUR/USD seesaws around seven-month high as the key resistance line challenges bulls.
- Successful trading beyond seven-week-old ascending trend line, impending bulls cross on MACD keep buyers hopeful.
- Sellers need validation from 50-day EMA to retake control.
EUR/USD bulls appear running out of steam as they jostle with an important resistance around 1.0730 during early Tuesday. In doing so, the major currency pair makes rounds to the seven-month high while probing a two-day uptrend.
That said, a downward-sloping resistance line from late May 2022, around 1.0730, joins the looming bull cross on the MACD indicators to keep the EUR/USD buyers hopeful.
However, the mid-2022 peak surrounding 1.0790 and the 1.0800 threshold act as extra filters towards the north before directing the EUR/USD prices to April 2022 peak near 1.0936.
In a case where the EUR/USD pair remains firmer past 1.0936, the 1.1000 psychological magnet will be in focus.
Alternatively, pullback moves may initially aim for a seven-week-long support line, close to 1.0540 to convince the EUR/USD bears.
Even so, the 50-day Exponential Moving Average (EMA) level surrounding 1.0460 could act as an extra downside buffer to probe the sellers.
It should be noted that the tops marked during August 2022 and lows of November 2022, close to 1.0370 and 1.0220 in that order, could act as the last defense of the EUR/USD buyers.
EUR/USD: Daily chart

Trend: Further upside expected
-
01:21
USD/CNY fix: 6.7611 vs. the last close of 6.7730
In recent trade today, the People’s Bank of China (PBOC) set the yuan (CNY) at 6.7611 vs. the last close of 6.7730.
About the fix
China maintains strict control of the yuan’s rate on the mainland.
The onshore yuan (CNY) differs from the offshore one (CNH) in trading restrictions, this last one is not as tightly controlled.
Each morning, the People’s Bank of China (PBOC) sets a so-called daily midpoint fix, based on the yuan’s previous day's closing level and quotations taken from the inter-bank dealer.
-
01:19
USD/CAD traders await key US CPI, testing 1.3400 with bulls in play
- USD/CAD bulls are in play and testing 1.3400.
- US CPI could now be the key driver for the week.
USD/CAD is flat in Asia, testing 1.3400 having travelled between a tight range of 1.3381 and 1.3406 so far. The US Dollar is making a slight recovery although the domestic jobs data is keeping a lid on the pair as the prospects for higher local rates continue to support the Loonie.
While there is good news being priced into the markets as China reopens, supporting a bid in the oil price on the week so far, investors are looking ahead to this week's United States inflation data following a slew of market-impacting economic data last week from the US economy to start the year off.
In the meanwhile, however, the stronger jobs number from Canada that came in data on Friday has put the Bank of Canada back in the hot seat. Analysts at TD Securities explained that ''another hike this month is not likely to resonate much with the CAD given where markets are priced. Instead, there is the chance that this hike - if realized - is perceived as its last given the pressures emerging on household imbalances and housing in general.''
As for USDCAD, the analysts at TD Securities ''think 1.35 acts as a broad anchor for now, but we expect a more definitive make-or-break moment for the pair and the CAD, in general, co the BoC decision;'
Technically, the analysts said, they note that ''USD/CAD is coiling into a flag formation established from the Oct highs/Aug 2022 lows.'' Strategically, they are biased for CAD to underperform in the first half of this year. ''Tactically, the CAD is likely to remain steady to slightly firmer on crosses following the Nonfarm Payrolls number.''
Markets are still digesting Friday’s Nonfarm Payrolls giving credence to a pivot from the Federal Reserve. This is what makes this week's inflation data so important. ''The jobs report was strong overall as Unemployment dropped back to the cycle low of 3.5%, supporting the view that the labour market remains red hot,'' analysts at Brown Brothers Harriman explained.
''However, markets focused on the bigger than expected drop in average hourly earnings to 4.6% year over year.'' However, the analysts argued that ''if the labour market remains as tight as it seems, wages are unlikely to fall much further in the coming months.''
-
01:13
Gold Price Forecast: XAU/USD skids below $1870 as yields rebound ahead of Fed Powell’s speech
- Gold price has slipped beneath $1,870.00, weighed down by a recovery in US Treasury yields.
- A rangebound action is expected from the US Dollar Index (DXY) ahead of Fed Powell’s speech.
- Fed policymakers see the terminal rate at 5.00-5.25% to tame stubborn inflation.
Gold price (XAU/USD) has slipped below the immediate resistance of $1,870.00 in the Tokyo session. The precious metal has delivered a breakdown of the consolidation formed in a range of $1,870.00-1,881.50 as the demand for US government bonds is derailing ahead of the speech from Federal Reserve (Fed) chair Jerome Powell, which is scheduled for Tuesday.
The 10-year US Treasury yields have rebounded above 3.54%, weighing on risk-on impulse. Meanwhile, S&P500 futures have turned volatile after witnessing a sell-off in the late Monday session, portraying a caution in building positions in risk-sensitive assets. The US Dollar Index (DXY) is expected to attempt a break into the auction range above the immediate resistance of 103.00.
Investors are awaiting the speech from Fed Powell for fresh cues as it will provide a head-start for the entire CY2023. Well, other Fed policymakers are still favoring the terminal rate projection at 5.00-5.25% despite a significant drop in December wage inflation.
San Francisco Fed Bank President Mary Daly cited that it is reasonable for interest rates to be at 5%-5.25%. Also, Atlanta Federal Reserve bank president Raphael Bostic sees the interest rate peak in a 5%-5.25% range and the continuation of higher interest rates beyond CY2023.
Gold technical analysis
Gold price is displaying signs of exhaustion as selling pressure is visible above $1,880.00. The precious metal has formed a Double Top chart pattern, which indicates a bearish reversal but needs more filters for activation. The yellow metal has slipped below the 20-period Exponential Moving Average (EMA) at $1,871.80, which indicates a correction in the north-side trend.
Also, the Relative Strength Index (RSI) (14) has shifted into the 40.00-60.00 range from the bullish range of 60.00-80.00, which indicates that the bullish momentum has faded.
Gold hourly chart
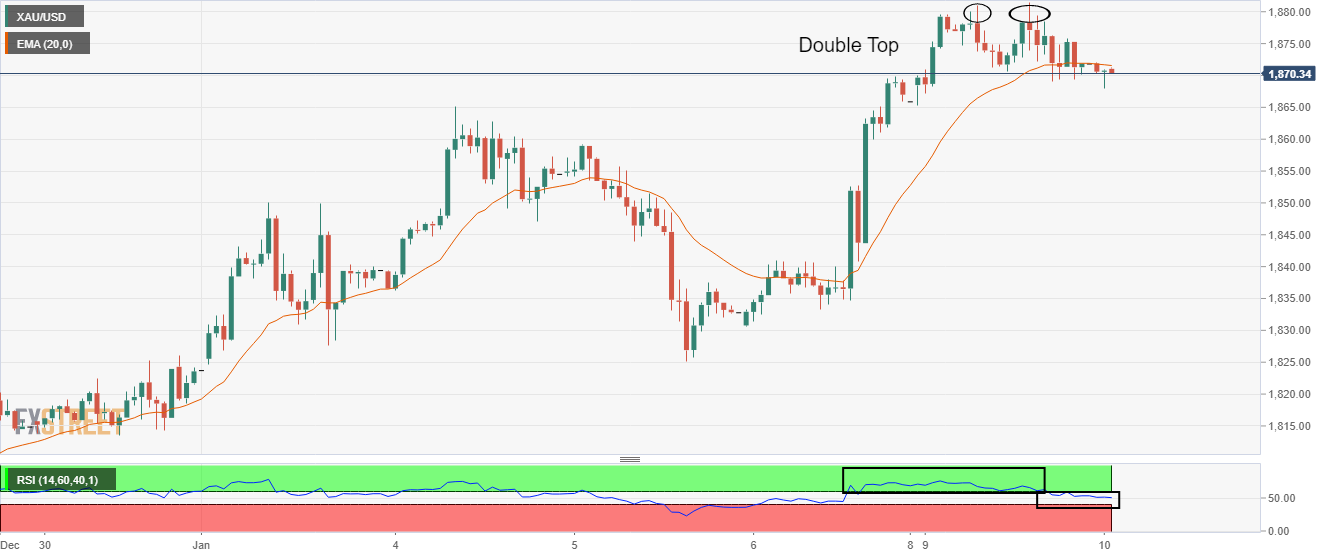
-
01:05
Risk assets only partially reflect the better recent news on US inflation – Goldman Sachs
Goldman Sachs (GS) recently came out with its take on the recently easing inflation signals from the United States.
The investment bank initially said, “Price inflation is slowing sharply,” before stating that over the past two months, sequential core PCE (Personal Consumption Expenditure) inflation has averaged 2.6% at an annual rate – half the pace of the prior year.
“If wage growth and core inflation continue to come down, Fed officials will become gradually more tolerant of easier conditions,” adds GS.
Goldman Sachs also mentioned that core PCE inflation should drop under 3% this year while also adding, “Falling shelter inflation will help.”
Also read:
-
00:59
US 5-year, 10-year inflation expectations probe Fed policy doves
US inflation expectations as per the 10-year and 5-year breakeven inflation rates per the St. Louis Federal Reserve (FRED) data appear to challenge the hopes of easy Fed rate hikes, which in turn justify the US Dollar’s latest rebound.
That said, the US Dollar Index (DXY) bounces off a seven-month low to 103.30 as it snaps a two-day downtrend amid recently hawkish Fed talks.
It’s worth noting that the latest prints of the 5-year and 10-year inflation expectations portray a stead print of 2.18% and a recovery to 2.22% respectively.
On Monday, the Federal Reserve Bank of New York's monthly Survey of Consumer Expectations showed that the US consumers' one-year inflation expectation declined to 5% in December from 5.2% in October.
Also read: US Dollar Index bounces off seven-month low ahead of Fed Chair Powell’s speech
-
00:45
GBP/JPY Price Analysis: Uphill battle for bulls as 161.30 acts as immediate resistance
- GBP/JPY prints three-day uptrend as buyers keep the reins around one-week top.
- Convergence of 21-day EMA, fortnight-old descending trend line challenges short-term bulls.
- 200-day EMA appears crucial for determining further upside, MACD flashes strongest bullish signals in two months.
GBP/JPY picks up bids to renew intraday high near 160.90 during early Tuesday. In doing so, the cross-currency pair rises for the third consecutive day while reversing the previous day’s pullback from a one-week high.
The quote’s latest run-up could be linked to the strongest bullish MACD signals in nearly two months, as well as a successful rebound from horizontal support comprising multiple lows marked since late September.
Given the GBP/JPY pair’s ability to cross the 50% Fibonacci retracement level of September-October upside, the buyers are well set to battle with the 161.30 resistance confluence encompassing a two-week-old descending trend line and the 21-day Exponential Moving Average (EMA).
However, the pair’s further upside hinges on its ability to cross the 200-day EMA level of 162.55.
Also acting as an upside filter is the November 2022 low near 163.00, a break of which could direct GBP/JPY buyers toward the previous monthly high surrounding 169.30.
Alternatively, 50% and 61.8% Fibonacci retracement levels, respectively near 160.45 and 157.70, restrict short-term GBP/JPY downside.
Following that, the aforementioned horizontal support near 155.50 will be crucial for the bears to watch.
GBP/JPY: Daily chart
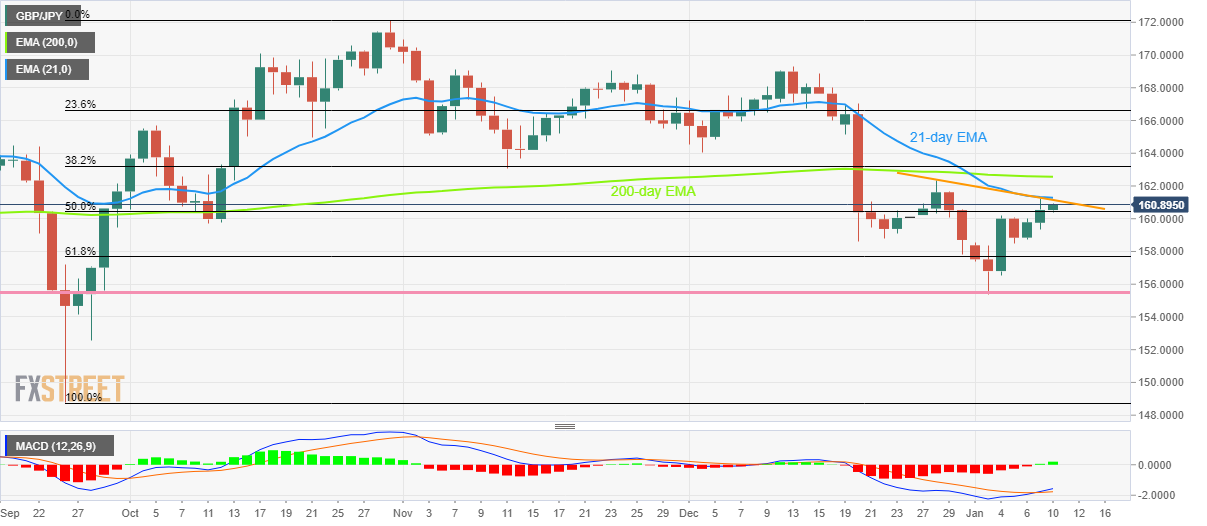
Trend: Further upside expected
-
00:41
GBP/USD faces resistance around 1.2200 despite solid UK Retail Sales
- GBP/USD has sensed selling pressure while attempting to surpass 1.2200 as investors’ risk appetite has trimmed.
- The USD Index is likely to remain sideways ahead of Fed Powell’s speech.
- UK’s annual Like-for-Like Retail; Sales have jumped by 6.5% vs. the former release of 4.1%.
The GBP/USD pair is sensing pressure while bridging the marginal gap in surpassing the round-level resistance of 1.2200 in the early Asian session. The Cable is struggling to extend its rally further as a decline in the demand for US government bonds is weighing on positive market sentiment. Considering the selling pressure on the Pound Sterling, it is highly likely that the Cable will correct further.
Meanwhile, S&P500 futures have extended their losses following the late sell-off on Monday, portraying that the market sentiment is getting risk-averse. It seems that the risk appetite of the market participants has been trimmed ahead of the speech from Federal Reserve (Fed) chair Jerome Powell. The US Dollar Index (DXY) is likely to remain on tenterhooks as the speech from Fed Powell will provide cues about the likely monetary policy for the February meeting.
In a few trading sessions, the US Dollar Index has faced immense volatility after a severe contraction in Manufacturing and Services PMI in the United States economy along with a meaningful drop in wage inflation. However, Fed policymakers are seeing no change in terminal rate projections.
San Francisco Fed Bank President Mary Daly dictated that December wage data was one month of data, which can't be declared as a victory. It's too soon to declare victory and stop rate hikes. To tame stubborn inflation, it is reasonable for interest rates to be at 5%-5.25%. Also, Atlanta Federal Reserve bank president Raphael Bostic sees interest rate peak in a 5%-5.25% range and the central bank will continue keeping higher interest rates active beyond CY2023.
On the United Kingdom front, Bank of England (BoE) Chief Economist Huw Pill cited that supply-chain disruptions appear to have eased in recent months, as reported by Reuters. He warned that imported gas prices have remained significantly higher than in the past, then the threat of a second round may well remain.
Meanwhile, the release of an upbeat Like-for-Like Retail Sales (Dec), reported by the British Retail Consortium (BRC) has failed to provide support to the Pound Sterling. The economic data has climbed to 6.5% vs. the former release of 4.1% on an annual basis.
-
00:34
AUD/USD Price Analysis: Bears move in on key 0.6905 support structure
- While below 0.6950, the bias is to the downside for AUD/USD in the near term.
- A break of 0.6905 on an hourly closing basis could be significant in this regard.
AUD/USD is under pressure in Asia and is taking on a key structure as shown by the technical analysts below. First, taking a quick glance at the AUD/USD 4-hour chart, there are now breakout traders in the market and their stops are within range as the following analysis will illustrate.
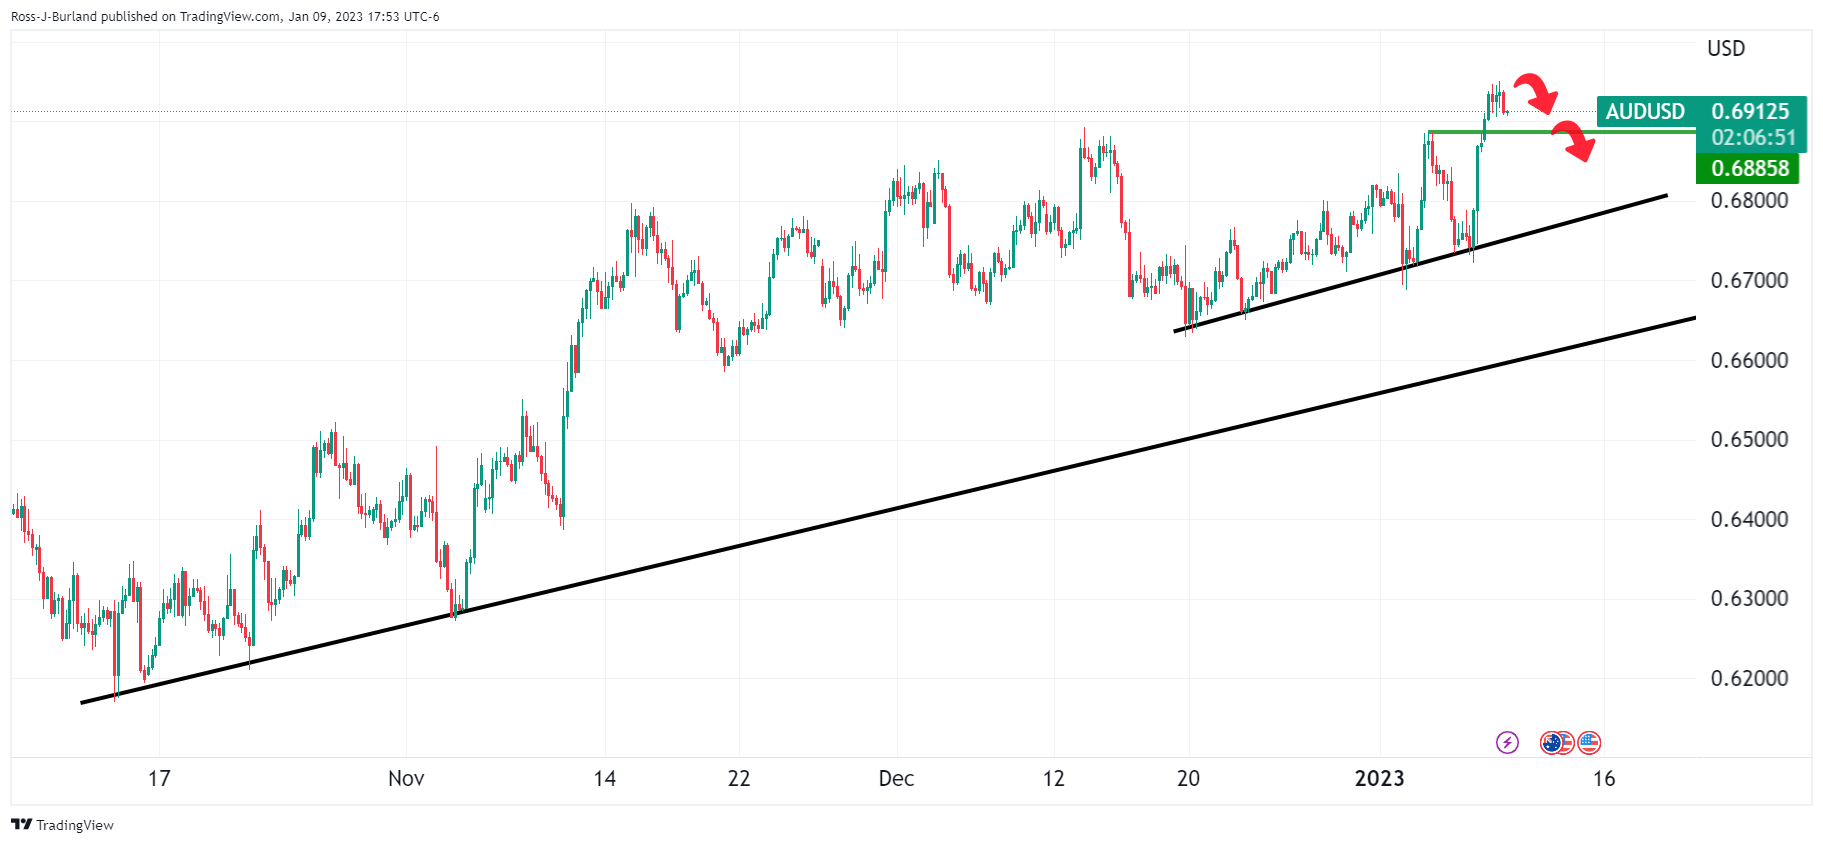
The bullish impulse has left a void of orders that have created a price imbalance on the downside. Combining the phenomenon of mitigation of such an imbalance with the prospects of there being stop-loss orders in the same vicinity makes for a compelling case for the downside for the sessions ahead. Bears will have their eyes on 0.6885 prior resistance and will be keen to get below here to trap bulls and potentially initiate a fast slide to test the trendline support.
AUD/USD weekly chart
Meanwhile, taking a look at the bigger picture, the following shows that there is indeed a downside bias given the area of resistance that is being tapped currently.
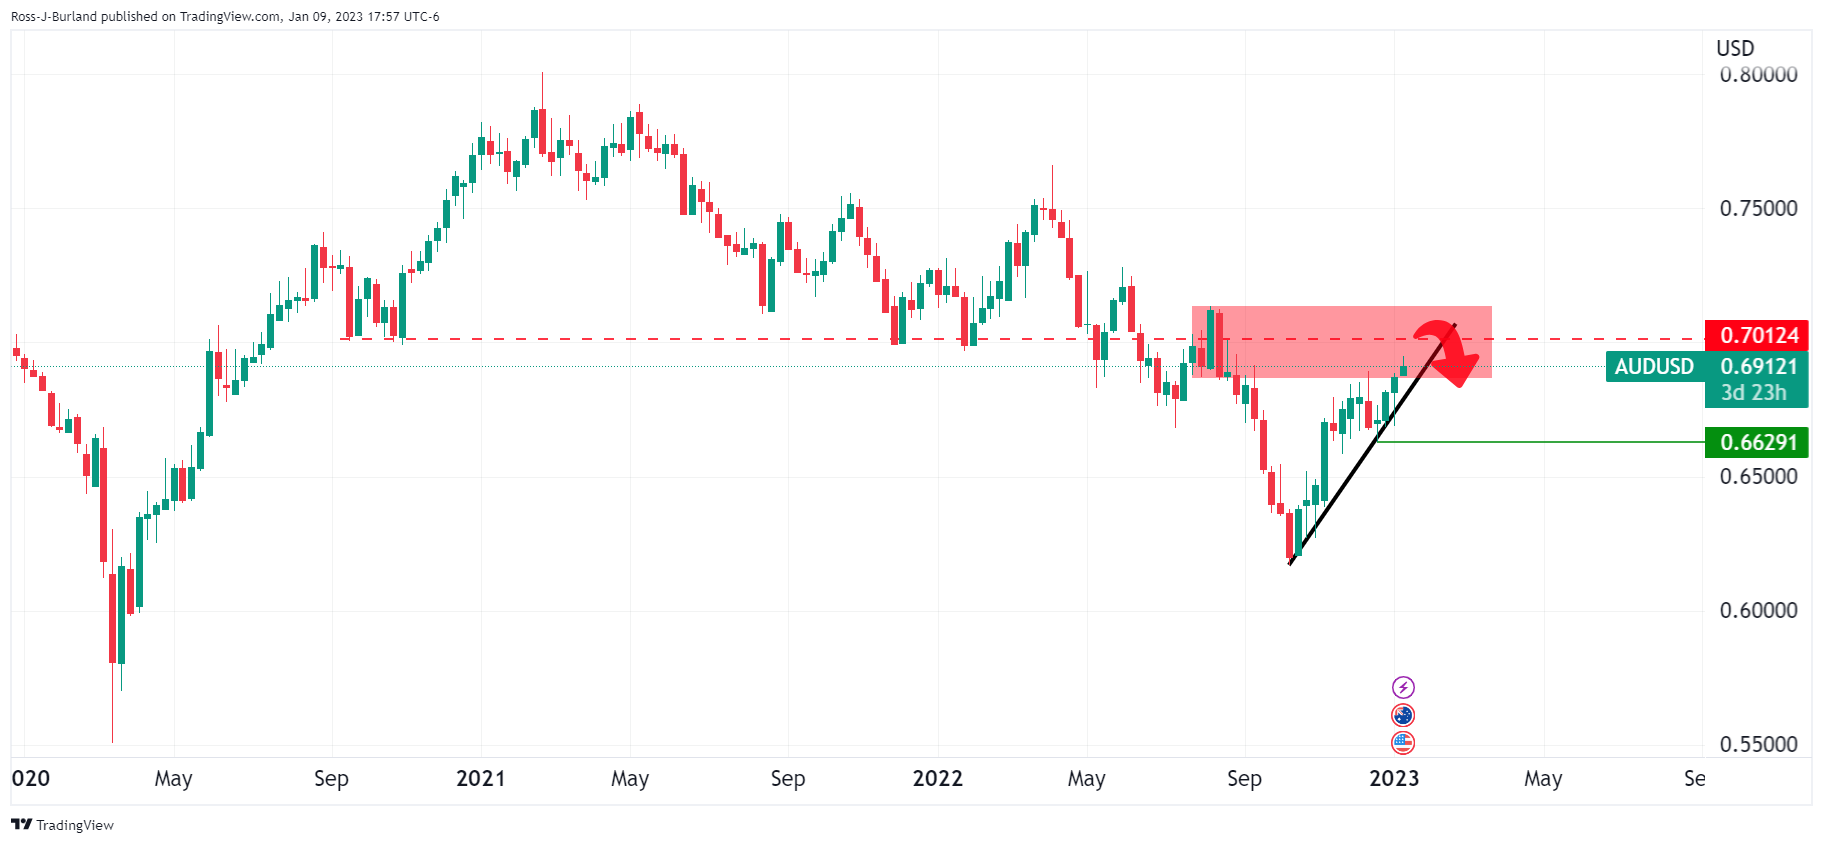
AUD/USD daily chart
That is not to say that the bullish phase is over and that the bulls are about to throw in the towel. There are still prospects of a move to test 0.7000 while the price remains on the front side of the bullish daily trendline as follows?
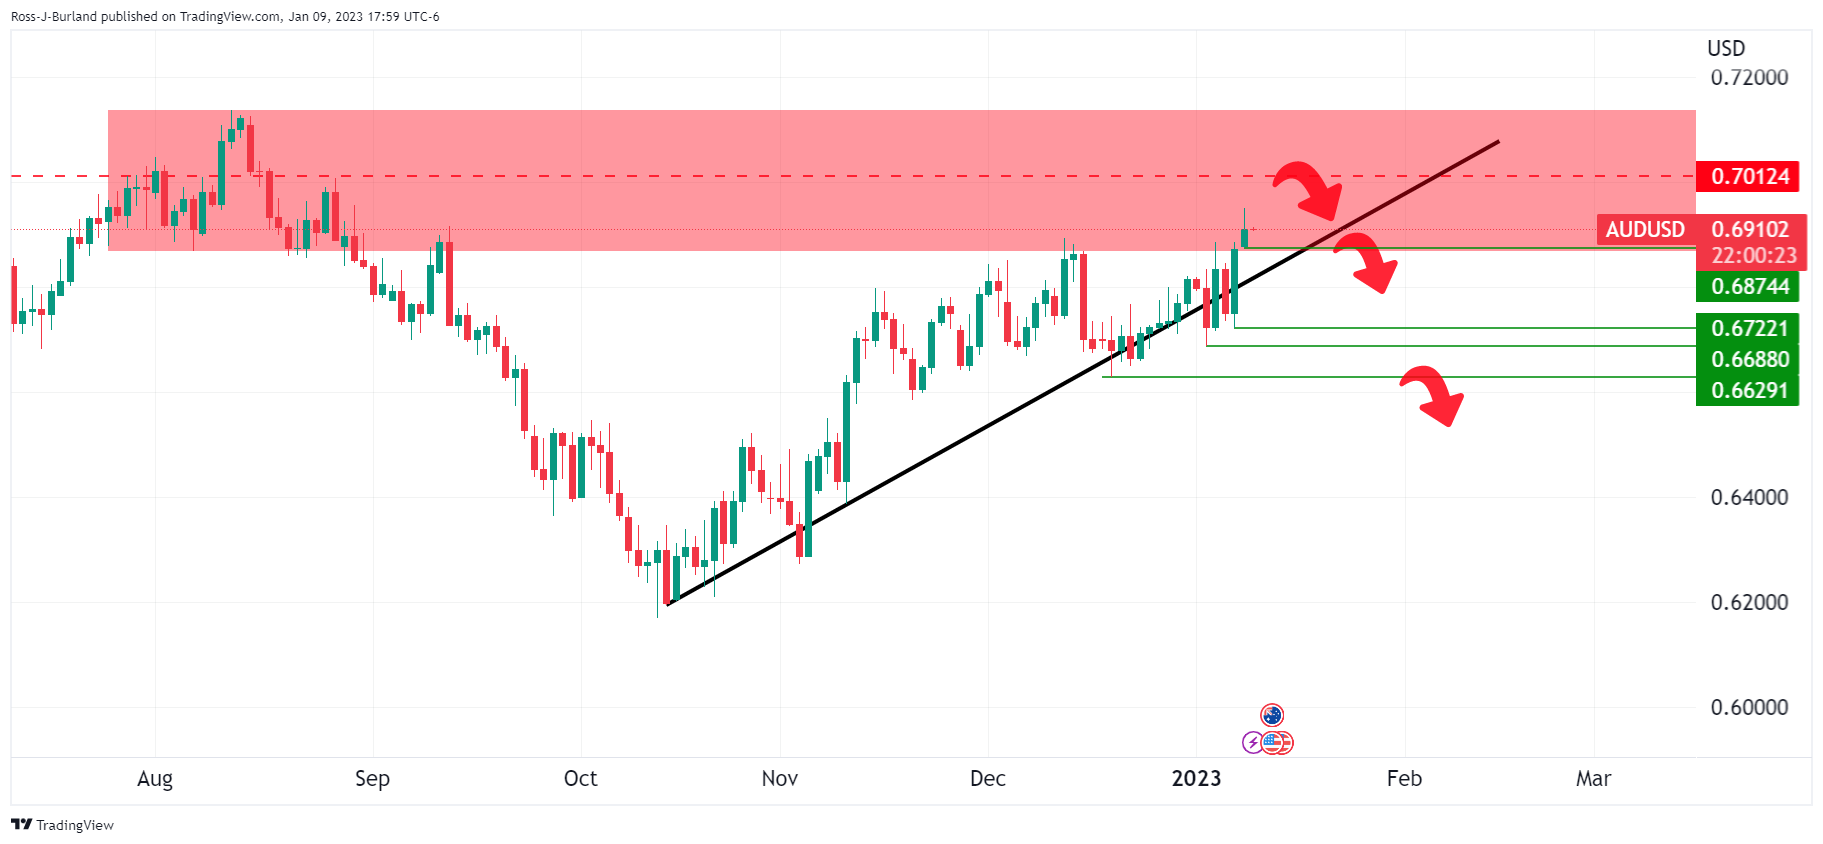
AUD/USD H4 chart
On the other hand, the M-formation is a topping pattern and should the bears commit at this juncture, a break of 0.6870 could spark off that fast capitulation of longs to test 0.6800 and the trendline support on the 4-hour chart:
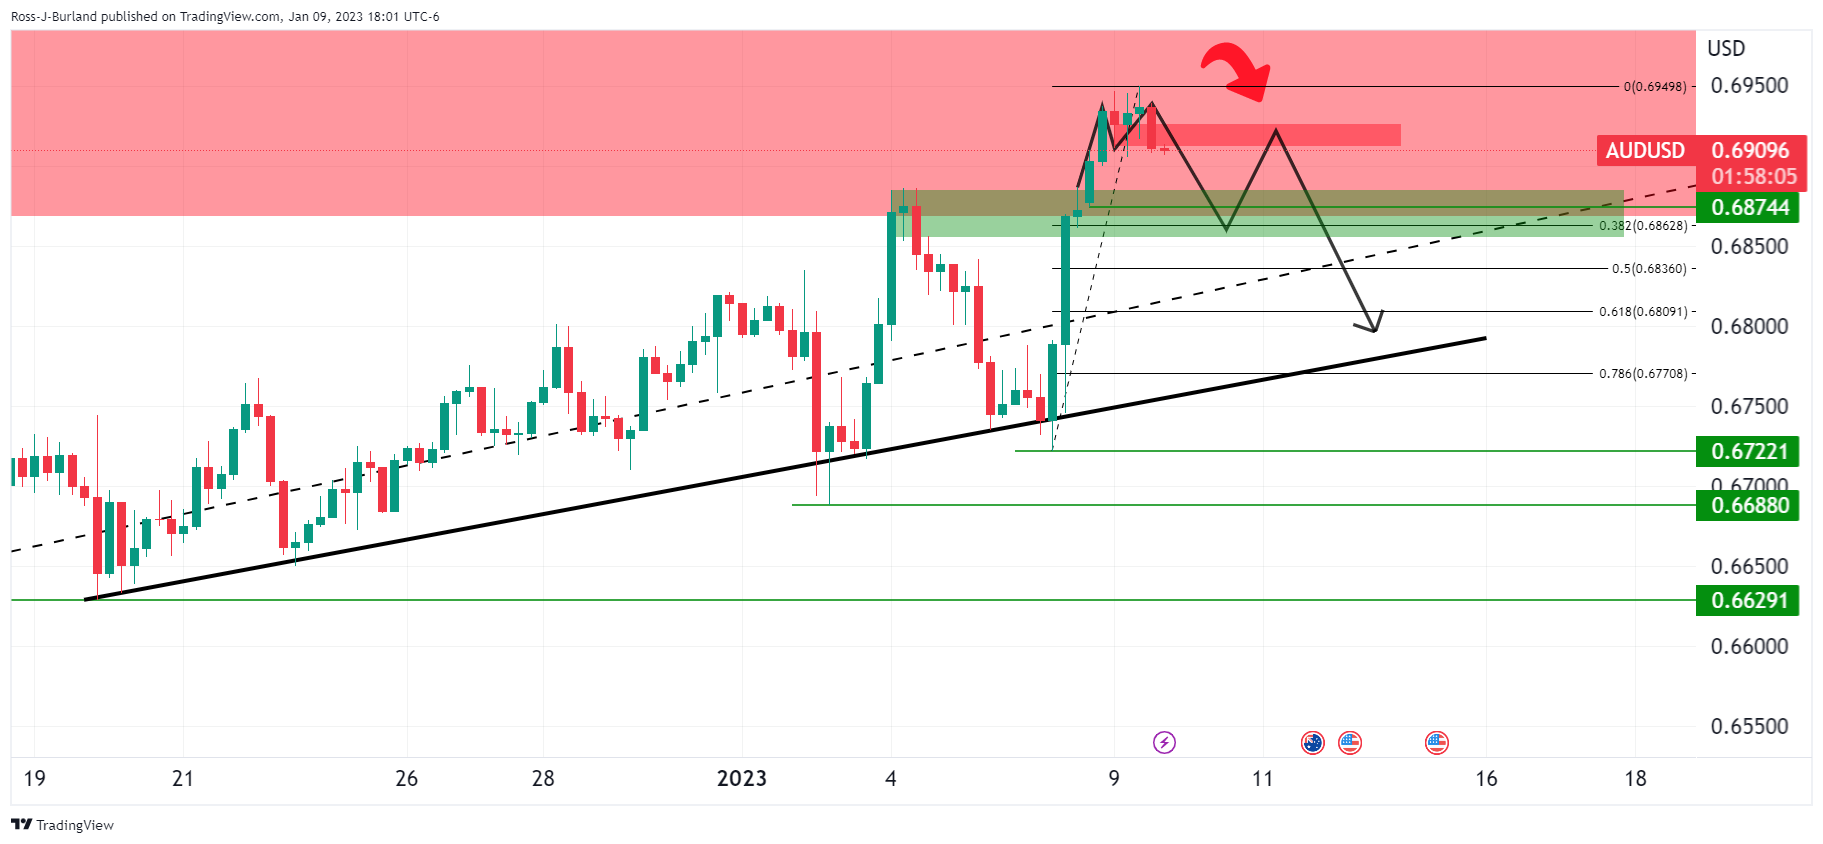
AUD/USD H1 chart
At this juncture, traders can monitor for bearish structure on the lower time frames, such as the hourly chart as follows:
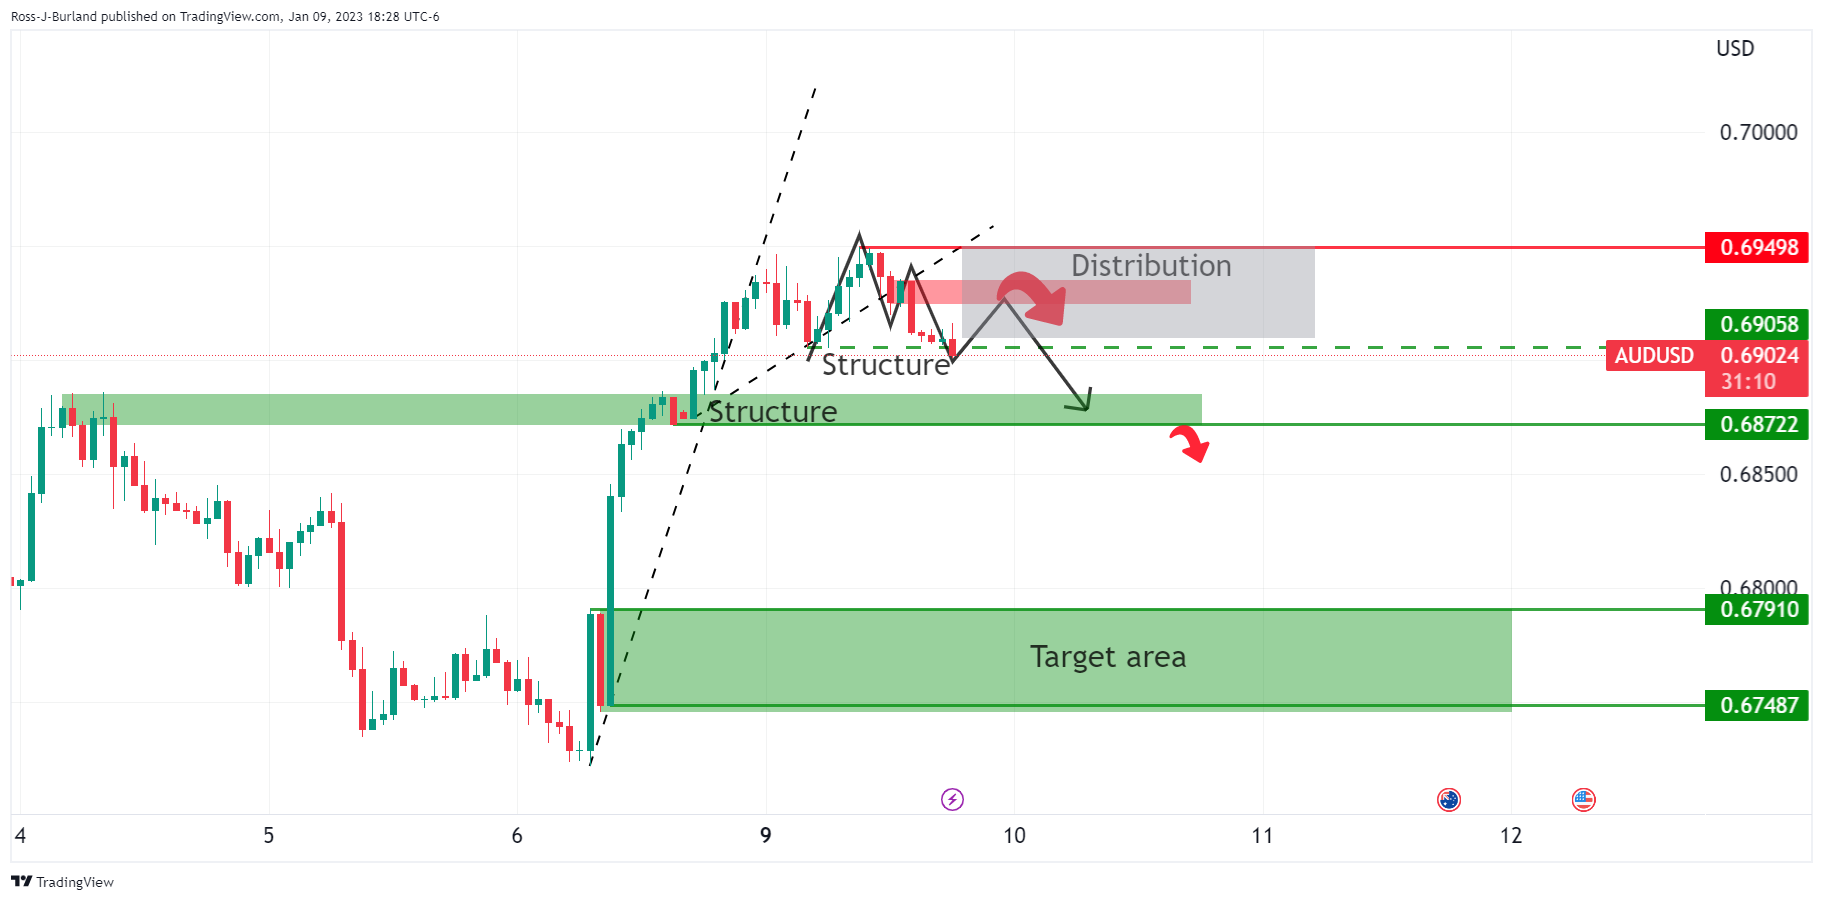
While below 0.6950, the bias is to the downside for the near term and a break of 0.6905 on an hourly closing basis could be significant in this regard. That is not to say that the price will automatically fall but this will make way for prospects of a move to test the bullish commitments above 0.6870 for the sessions ahead. A break there will open the risk of a move into the 0.6800 figure and the targetted area between 0.6791 and 0.6748.
-
00:30
Stocks. Daily history for Monday, January 9, 2023
Index Change, points Closed Change, % Hang Seng 396.7 21388.34 1.89 KOSPI 60.22 2350.19 2.63 ASX 200 41.7 7151.3 0.59 FTSE 100 25.44 7724.94 0.33 DAX 182.81 14792.83 1.25 CAC 40 46.41 6907.36 0.68 Dow Jones -112.96 33517.65 -0.34 S&P 500 -2.99 3892.09 -0.08 NASDAQ Composite 66.36 10635.65 0.63 -
00:20
US Dollar Index bounces off seven-month low ahead of Fed Chair Powell’s speech
- US Dollar Index steadies after refreshing multi-day low.
- Hawkish Fedspeak, US inflation expectations probed DXY bears amid light calendar.
- US data, China-linked optimism and downbeat Treasury bond yields previously weighed on US Dollar Index.
- Fed Chair Powell needs to defend policy hawks to recall DXY buyers ahead of US inflation.
US Dollar Index (DXY) makes rounds to 103.15-20 as sellers pause after a two-day downtrend around the lowest level since June 2022. That said, the greenback’s gauge versus the six major currencies refreshed a multi-day low the previous day as the market’s risk-on mood joined hopes of easy Fed rate hikes. However, the recently hawkish comments from the US Federal Reserve (Fed) officials and cautious mood ahead of the key data/events seemed to have triggered the quote’s latest stoppage in further declines.
That said, China’s reopening of the international borders after a three-year halt joined Beijing’s readiness for stimulus and early signals of a shopping spree ahead of the Chinese New Year holiday season to underpin the firmer sentiment on Monday.
On the other hand, Friday’s US economics, mainly concerning the wage growth and ISM Services PMI for December, raised speculations that the Federal Reserve (Fed) finally has an upper hand in taming inflation, suggesting a pause to aggressive rate hikes. The same weighed on the US Treasury bond yields and the US Dollar even as the latest comments from the Fed officials restrict the Greenback’s latest downside.
It should be noted that Atlanta Federal Reserve bank president Raphael Bostic said on Monday that it is ''fair to say that the Fed is willing to overshoot.'' On the same line, San Francisco Federal Reserve Bank President Mary Daly stated that they are determined, united, resolute to bring inflation down. Additionally, the Federal Reserve Bank of New York's monthly Survey of Consumer Expectations showed on Monday that the US consumers' one-year inflation expectation declined to 5% in December from 5.2% prior. Alternatively, the three-year ahead expected inflation remained unchanged at 3% and the five-year ahead expected inflation edged higher to 2.4% from 2.3%.
Against this backdrop, Wall Street closed mixed and probed the S&P 500 Futures while the US 10-year Treasury yields dropped five basis points to 3.51% before snapping the three-day downtrend around 3.53% by the press time.
Moving ahead, the DXY traders should wait for Fed Chairman Jerome Powell’s speech considering the recently hawkish comments from other Fed policymakers and Thursday’s looming US Consumer Price Index (CPI).
Technical analysis
An ascending support line from May 2021, around 102.90 by the press time, restricts short-term US Dollar Index downside.
-
00:15
Currencies. Daily history for Monday, January 9, 2023
Pare Closed Change, % AUDUSD 0.69121 0.5 EURJPY 141.543 0.9 EURUSD 1.0733 0.87 GBPJPY 160.682 0.89 GBPUSD 1.21844 0.89 NZDUSD 0.63703 0.64 USDCAD 1.33894 -0.34 USDCHF 0.92132 -0.61 USDJPY 131.876 -0.01 -
00:01
United Kingdom BRC Like-For-Like Retail Sales (YoY): 6.5% (December) vs 4.1%
-