Notícias do Mercado
-
23:56
BoK Governor Rhee: Not worried about specific USD/KRW rate
“I’m not worried about the dollar/won exchange rate rising or falling to any specific level,” said Bank of Korea (BoK) Governor Rhee Chang-yong to Bloomberg TV early on late Thursday.
The policymaker also added that the bank's board members wanted to give a warning against betting on an early policy change due to uncertain inflation prospects.
It’s worth noting that the BoK left monetary policy unchanged with the benchmark rate at 3.5% earlier in the week.
USD/KRW licks its wounds
USD/KRW seesaws around the lowest levels in a week, making rounds to 1,300 by the press time, after falling the most in one month the previous day.
Also read: South Korea: BoK paused its tightening cycle in April – UOB
-
23:50
GBP/USD Price Analysis: Gets set to refresh 10-month high around 1.2600
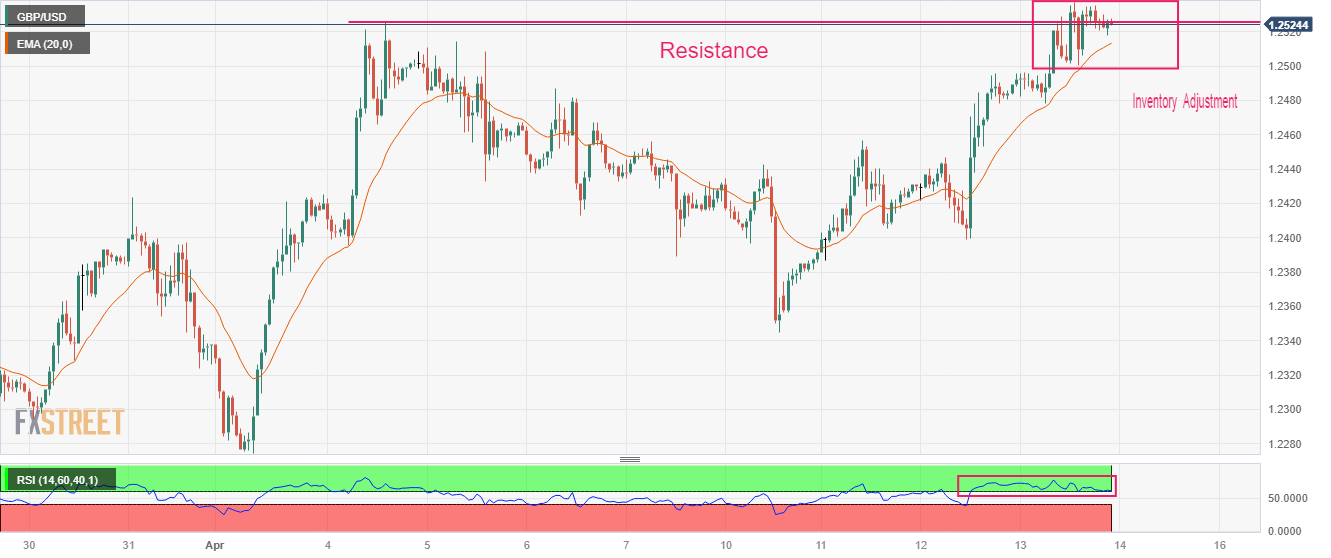
- GBP/USD has shifted into an inventory adjustment phase after printing a fresh 10-month high at 1.2537.
- UK’s monthly GDP remained stagnant while the street was anticipating an expansion of 0.1%.
- US labor market conditions have loosened further as jobless claims remained higher than anticipated.
The GBP/USD pair is demonstrating a lackluster performance after printing a fresh 10-month high at 1.2537 in the early Tokyo session. The upside move in the Cable remained mostly capped in comparison with other risk-perceived currencies. The reason could be the weak United Kingdom’s monthly Gross Domestic Product (GDP) (Feb) data released on Thursday.
UK’s monthly GDP remained stagnant while the street was anticipating an expansion of 0.1%. Annual Industrial Production contracted by 3.1% against the consensus of 3.7% contraction. The Manufacturing Production data was contracted by 2.4%. The scale of contraction in Manufacturing Production was lower than the estimate of 4.7%.
The US Dollar Index (DXY) is juggling above the immediate support of 101.00. The downside bias for the USD Index looks solid as the United States Producer Price Index (PPI) softened dramatically on Thursday. Also, labor market conditions have loosened further as jobless claims remained higher than anticipated.
GBP/USD is showing a sheer contraction in volatility after testing the horizontal resistance plotted from April 04 high at 1.2525 on an hourly scale. The Cable is displaying an inventory adjustment move between institutional investors and retail participants. The odds are in favor of an upside break of the inventory adjustment move as the overall trend has remained bullish.
The 20-period Exponential Moving Average (EMA) at 1.2513 is providing cushion to the Pound Sterling bulls.
Meanwhile, the Relative Strength Index (RSI) (14) is oscillating in the bullish range of 60.00-80.00, indicating that the upside momentum is still active.
For further upside, the Cable needs to surpass April 13 high at 1.2537, which will drive the asset towards a fresh 10-month high at 1.2597, which is 08 June 2022 high. A breach of the latter will expose the asset to May 27 high at 1.2667.
On the flip side, a break below the round-level support of 1.2400 will expose the asset to April 10 low at 1.2344 and March 30 low at 1.2294.
GBP/USD hourly chart
-
23:45
Silver Price Analysis: Multiple hurdles to prod XAG/USD bulls at 2023 peak near $26.00
- Silver price remains sidelined after rising to the highest levels in one year.
- Overbought RSI, multiple immediate resistances challenge XAG/USD buyers.
- Silver sellers stay off the table beyond $24.50.
Silver price (XAG/USD) remains firmer at $25.80, despite recent inaction at the highest levels in one year during early Friday in Asia. In doing so, the bright metal justifies the overbought RSI conditions, as well as fears of bulls amid a bumpy road towards the north. However, multiple supports and bullish MACD signals keep the XAG/USD buyers hopeful.
That said, the XAG/USD pullback needs validation from a 10-month-old previous resistance line, around $25.50.
Even so, the convergence of the 61.8% Fibonacci retracement level of the metals moves between May 2021 to September 2022 and a 23-month-old downward-sloping trend line, near $24.50, appears a tough nut to crack for the Silver sellers.
In a case where the Silver price remains bearish past $24.50, the odds of witnessing a gradual decline toward the 50% Fibonacci retracement level surrounding $23.20 can’t be ruled out.
On the flip side, the $26.00 round figure prods the XAG/USD bulls ahead of the 78.6% Fibonacci retracement, around $26.35.
Following that, a broad area comprising tops marked since July 2021, around $26.95-75, quickly followed by the $27.00 round figure, will be in focus.
Overall, the Silver price is likely to remain firmer even if the short-term pullback appears imminent.
Silver price: Daily chart
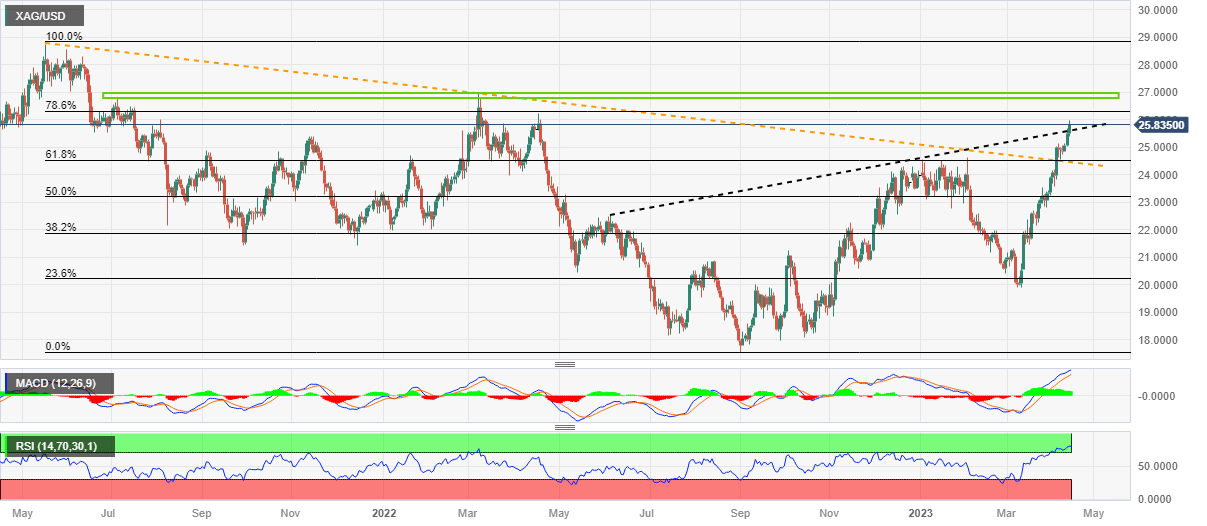
Trend: Pullback expected
-
23:45
New Zealand Visitor Arrivals (YoY) came in at 4998%, above forecasts (2.1%) in February
-
23:30
New Zealand Business NZ PMI came in at 48.1 below forecasts (51) in March
-
23:24
AUD/USD bulls attack 0.6800 as downbeat inflation, Fed concerns weigh on US Dollar
- AUD/USD bulls prod six-week-old resistance near 0.6800 after rising the most in two weeks the previous day.
- Strong Aussie employment figures contrast with downbeat US inflation signals to propel the pair.
- Dovish RBA concerns fail to weigh on Aussie pair, Fed policy pivot chatters gain less attention.
- Bulls are likely to keep the reins, more clues of US inflation eyed.
AUD/USD grinds higher around the seven-week top, making rounds to 0.6780 after poking the 0.6800 round figure early Friday in Asia. In doing so, the Aussie pair cheers upbeat Australian inflation data, as well as downbeat US inflation figures and Federal Reserve (Fed) concerns.
That said, Australia’s Employment Change jumps by 53K versus 20K expected and 64.6K prior while the Unemployment Rate remained unchanged versus the expectation of marking the 3.6% figure. Further, the Participation Rate also improved to 66.7% versus market forecasts of reprinting the 66.6% mark. Additionally, Australia’s Consumer Inflation Expectations for April eased to 4.6% YoY versus 5.3% expected and 5.0% prior.
It’s worth noting that mixed data from China failed to weigh on the AUD/USD price amid broad risk-on mood amid receding hopes of the Fed’s further rate hikes, except for May’s 0.25% rate lift. Talking about China data, the headline Trade Balance improved to $88.10B in March versus the $39.2B expected and $116.8B prior whereas Exports grew much faster than Imports during the stated month.
On the other hand, US Producer Price Index (PPI) for March dropped to a four-month low of -0.5% MoM versus 0.0% expected and prior whereas the PPI YoY also declined to 2.7% from 4.9% previous readouts, versus market forecasts of 3.0%. Further, US Initial Jobless Claims rose to 239K versus 232K expected and 228K prior.
Against this backdrop, Wall Street remained firmer and the yields also improved but the US Dollar Index (DXY) dropped to the lowest levels since February. Additionally, the CME’s FedWatch Tool signals a 68% chance of a 0.25% rate hike in March versus 71% marked the previous day.
Given the light calendar ahead of the North American trading session, AUD/USD may remain lackluster at the multi-day high. However, the underlying bullish trend is likely to remain intact considering the market’s optimism and broad US Dollar weakness.
Moving on, US Retail Sales for March, expected to repeat -0.4% MoM figure, precedes the preliminary readings of the US Michigan Consumer Sentiment Index (CSI), likely staying unchanged at 62, to entertain AUD/USD traders. Also important to watch will be the University of Michigan’s (UoM) 5-year Consumer Inflation Expectations, prior 2.9%.
Technical analysis
A six-week-old ascending resistance line near 0.6800 precedes the 100-DMA hurdle of around 0.6805 to challenge the AUD/USD bulls. However, the bears are off the table unless the quote offers a daily closing below the 50-DMA support of around 0.6745.
-
23:09
Gold Price Forecast: XAU/USD juggles above $2,040 ahead of US Retail Sales for further guidance
- Gold price is oscillating above $2,040.00 as investors await US Retail Sales.
- S&P500 settled Thursday’s session on a super-bullish note as fears of abrupt rate hikes cool down after softening of US PPI.
- The retail demand is likely to continue the pace of contraction as shown in February.
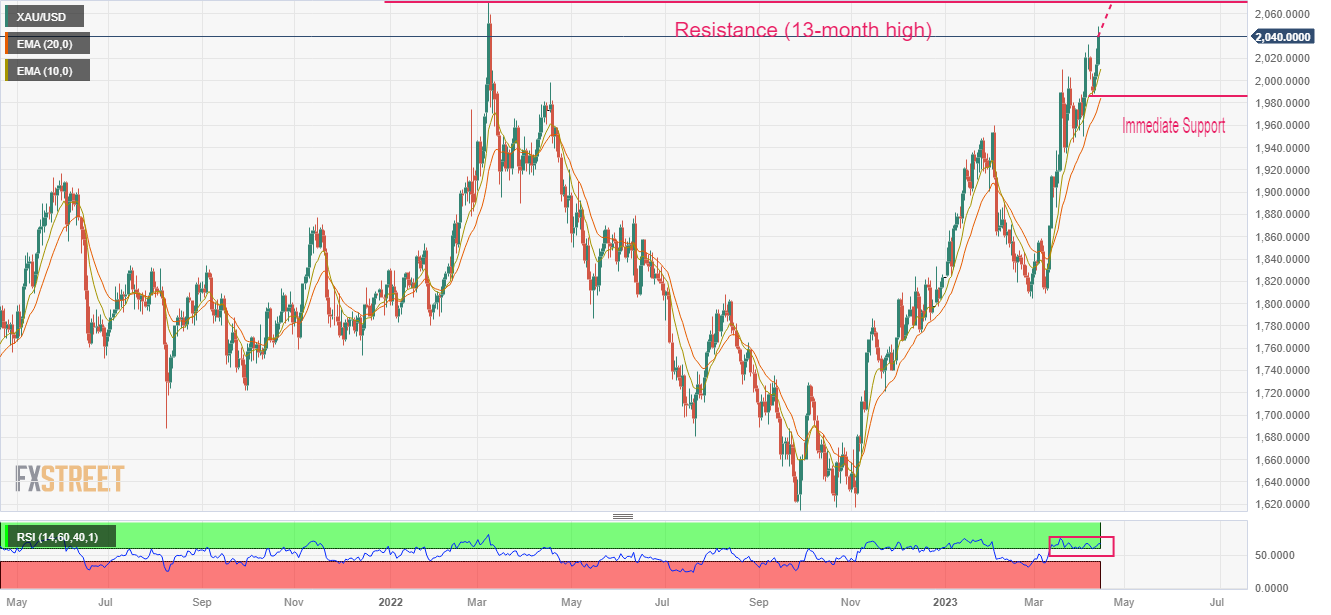
Gold price (XAU/USD) is consolidating in a narrow range above $2,040.00 in the early Asian session. The precious metal turned sideways in the New York session after printing a fresh annual high at $2,048.77 in hopes that the Federal Reserve (Fed) is required to take a pause call on the policy-tightening process as early as possible.
S&P500 settled Thursday’s session on a super-bullish note as fears of abrupt rate hikes cool down after softening of United States Producer Price Index (PPI) data, portraying a decent jump in the risk appetite of the market participants.
The US Dollar Index (DXY) refreshed its two-month low at 100.85 as the softened US Consumer Price Index (CPI) joined the heavily decelerated PPI and trimmed consumer inflation expectations dramatically. The USD Index has turned rangebound after a plunge ahead of US Retail Sales data. Contrary to that, demand for US government bonds remained weak despite easing inflation concerns. The yields offered on 10-year Treasury bonds jumped to near 3.45%.
The street is shifting its focus toward the monthly US Retail Sales (March) data. According to the consensus, the economic data will contract by 0.4%. The retail demand is likely to continue the pace of contraction as shown in February as US labor market conditions are cooling down. Also, the banking fiasco has impacted the confidence of households.
Gold technical analysis
Gold price is marching north to test a 13-month high at $2,070.54, which is 08 March 2022 high, plotted on the daily scale. Upward-sloping 10-and 20 period Exponential Moving Averages (EMAs) at $2,010.84 and $1,987.00 respectively, indicating a sheer strength in Gold bulls.
The Relative Strength Index (RSI) (14) is oscillating in the bullish range of 60.00-80.00, showing no signs of divergence and any sign of an oversold situation, cementing more upside ahead.
Gold daily chart
-
23:04
EUR/USD grinds near one-year high near 1.1050, US Retail Sales, Michigan CSI eyed
- EUR/USD bulls take a breather after rising to the highest levels in one year.
- Downbeat US PPI bolstered hopes of Fed’s policy pivot and drowned US Dollar.
- Upbeat Eurozone Industrial Production also helps the Euro pair.
- Bulls are likely to keep the reins even if US consumer-centric data offers positive surprise.
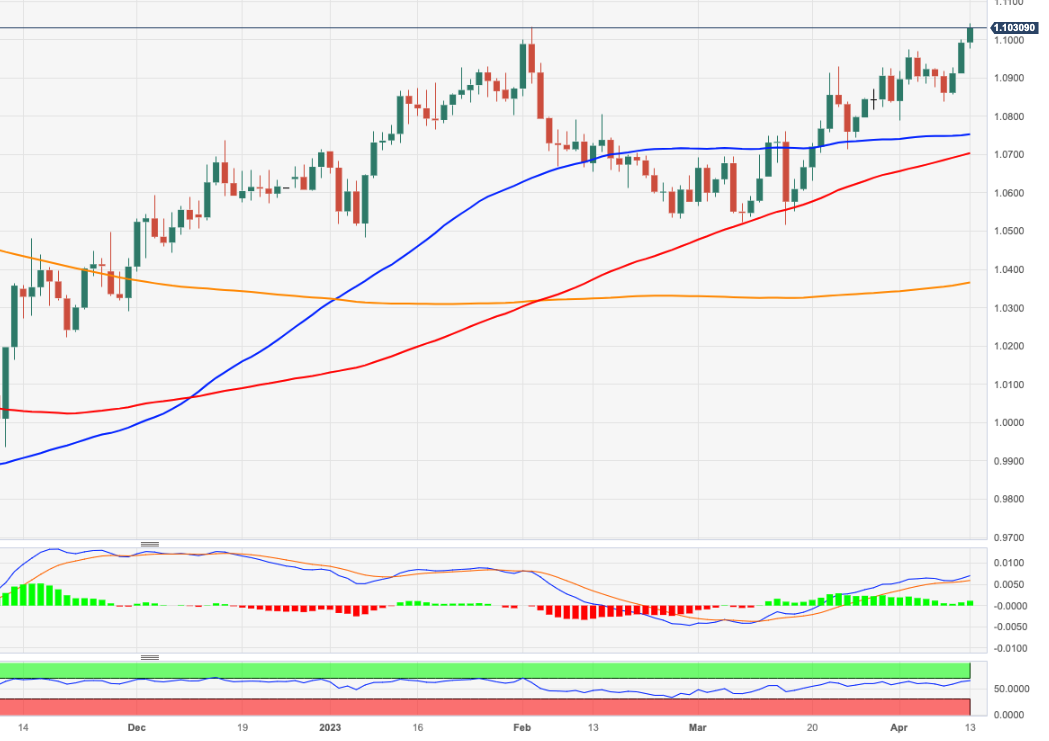
EUR/USD rose to the highest level since March 2022 during a three-day winning streak to 1.1067, before bulls caught a breather around 1.1050, making rounds to the same amid early Friday morning in Asia. The Euro pair rallied heavily as the downbeat US inflation clues joined a technical breakout of the February month high.
That said, US Producer Price Index (PPI) for March dropped to a four-month low of -0.5% MoM versus 0.0% expected and prior whereas the PPI YoY also declined to 2.7% from 4.9% previous readouts, versus market forecasts of 3.0%. Further, US Initial Jobless Claims rose to 239K versus 232K expected and 228K prior.
On the other hand, Reuters cited five sources with direct knowledge of the discussion on Thursday to say that the European Central Bank (ECB) policymakers are converging on a 25 basis points (bps) interest rate hike in May. “Though the debate is not over, with one small group still making case for a 50 bps hike in May; another small group advocating no change,” added the news and cited indecision among the policymakers.
While confirming the same, indirectly, ECB Council member Bostjan Vasle said that they are considering 25 and 50 basis points (bps) rate hike options for the May policy meeting, per Reuters.
On the other hand, the odds of the Federal Reserve’s (Fed) policy pivot gained momentum as a consecutive easing in the inflation clues and unimpressive Fed Minutes allowed the hawks to retreat. Even so, the CME’s FedWatch Tool signals a 68% chance of a 0.25% rate hike in March versus 71% marked the previous day.
Amid these plays, Wall Street remained firmer and the yields also improved but the US Dollar Index (DXY) dropped to the lowest levels since February.
Moving on, a light calendar ahead of the North American trading session may restrict the EUR/USD moves at the multi-day high. However, the underlying bullish trend is likely to remain intact considering the divergence between the ECB and the Fed, as well as softer US inflation data.
That said, US Retail Sales for March, expected to repeat -0.4% MoM figure, precedes the preliminary readings of the US Michigan Consumer Sentiment Index (CSI), likely staying unchanged at 62, to entertain EUR/USD traders. Also important to watch will be the University of Michigan’s (UoM) 5-year Consumer Inflation Expectations, prior 2.9%.
Technical analysis
A daily closing beyond the February 2023 high of around 1.1035 enables EUR/USD bulls to aim for March 2022 peak surrounding 1.1185.
-
23:02
EUR/GBP Price Analysis: Bulls seek a break of key daily trendline resistance
- EUR/GBP bulls lurking near a 61.8% ratio.
- Bulls eye a break of resistance with 0.8925 prior highs in focus.
EUR/GBP has been pressured on the backside of trendline resistance but supported by the next layer of trendline support and the horizontal support in the 0.8720s.
EUR/GBP daily charts

Nevertheless, as the following illustrates, we have a W-formation that would be expected to pull in the price to the neckline as follows:
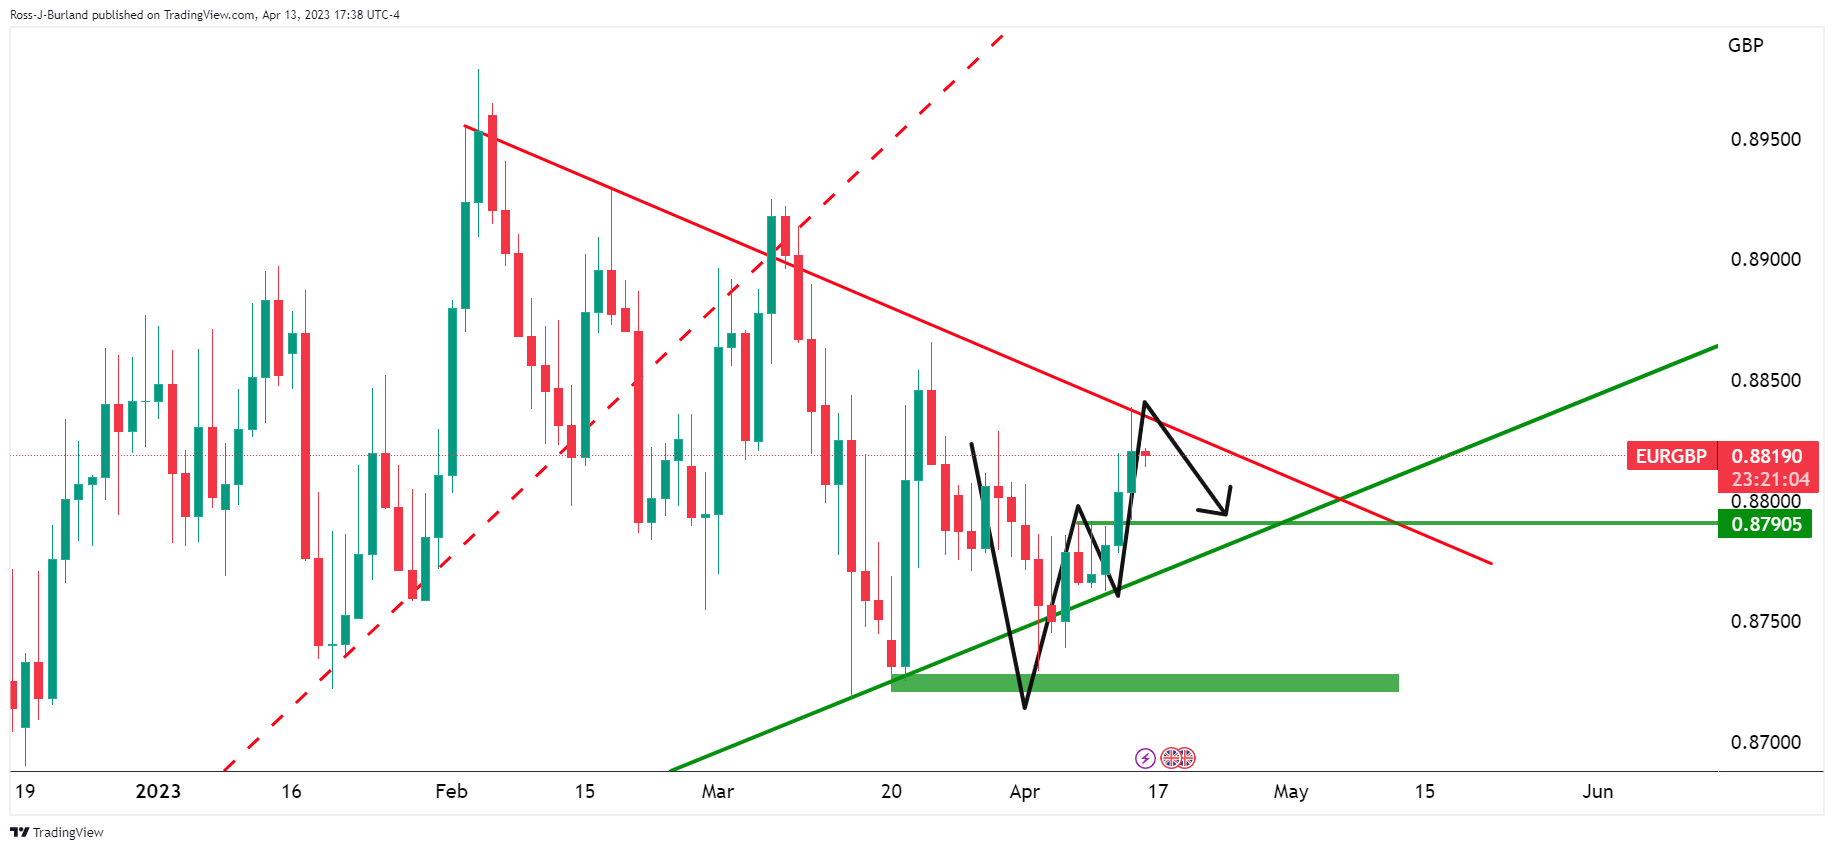
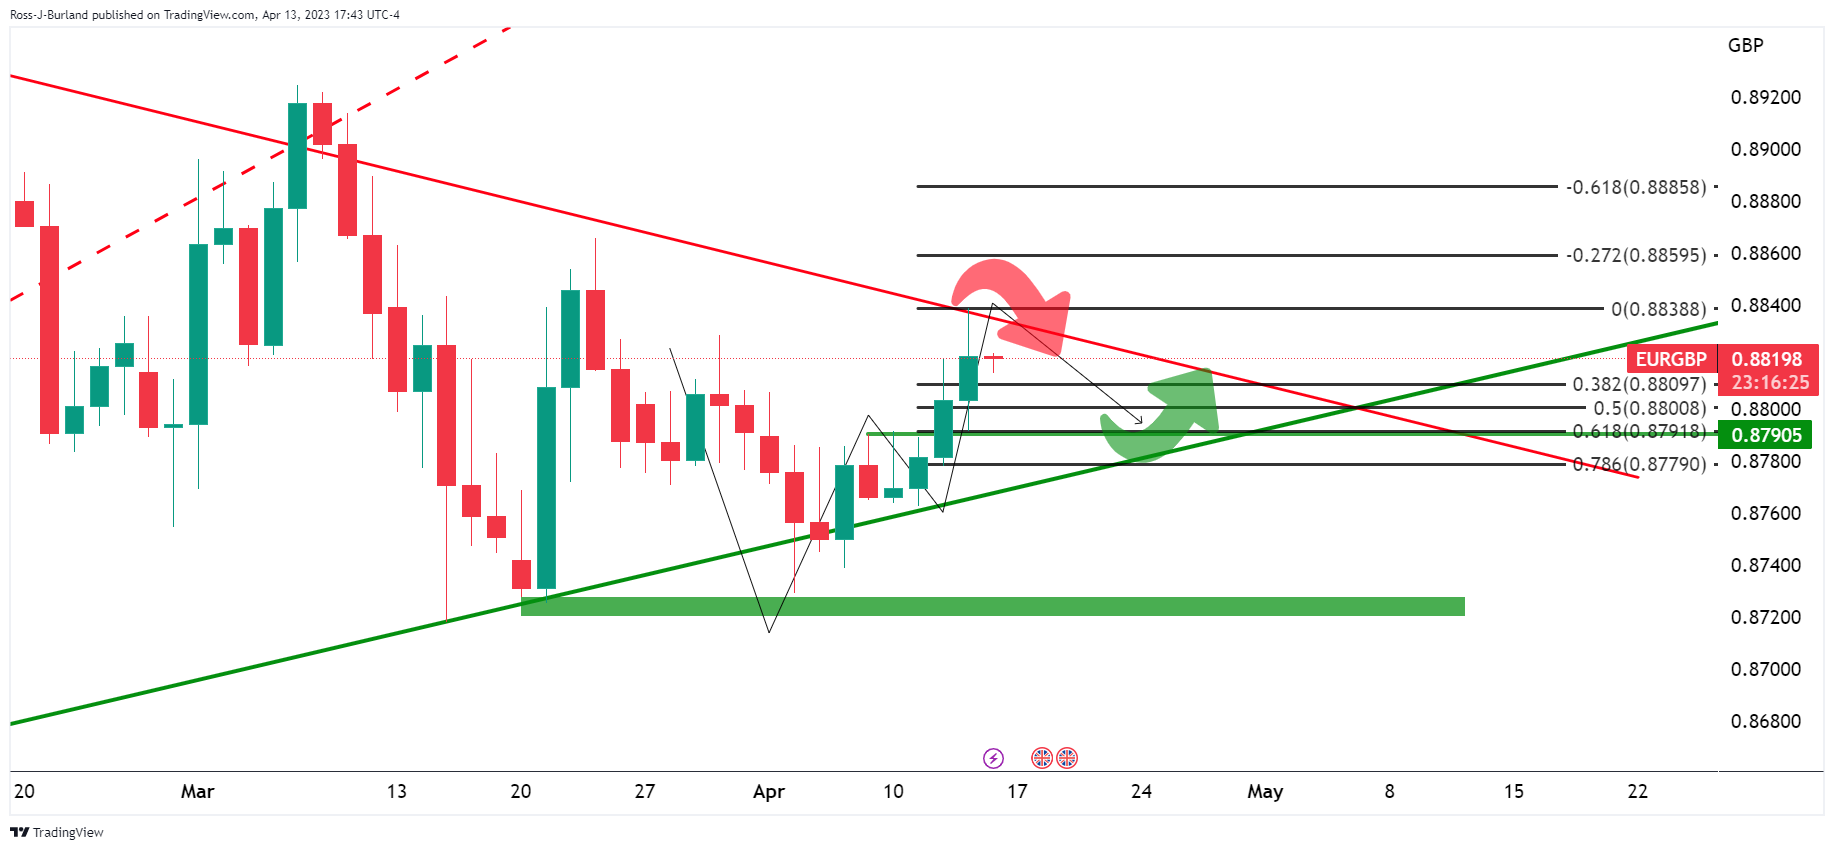
However, so long as the bulls commit to trendline support, near a 61.8% ratio, then there will be prospects of a breakout of trendline resistance with eyes on 0.8925 prior highs.
-
23:01
USD/MXN shifts during the trading session, printing a new weekly low below 18.0000
- Initial Jobless Claims hit 239K, exceeding estimates of 234K.
- US inflation on the producer side edged lower, cementing the case for a Fed pivot.
- USD/MXN Price Analysis: To extend its losses past the 18.0000 support.
The Mexican Peso (MXN) extended its weekly gains below the 18.0000 barrier, as the USD/MXN hit a new weekly low at 17.9749. But a late bounce propelled the USD/MXN back above the 18.0000 mark, trimming some of its earlier losses. At the time of writing, the USD/MXN is trading at 18.0158, down by 0.30%.
Economic data from the United States weighed on the US Dollar, boosted the Mexican Peso
On Thursday, the sentiment remained positive after the release of softer-than-estimated US jobs data, followed by inflation at the factory gate. Initial Jobless Claims for the week ending on April 8 exceeded estimates of 234K and hit 239K while Continuing Claims dipped. The March Producer Price Index (PPI) edged lower on annual and monthly readings, while the core PPI was mixed. Core PPI was -0.1% MoM, below estimates of 0%, while annually based dropped to 3.4% from 4.8%.
Even though traders’ bets are pricing in a 25 bps rate hike by the US Federal Reserve at the upcoming meeting, a pivot is widely expected. In addition, investors are pricing three 25 bps rate cuts by the year’s end, which spurred the US Dollar (USD) weakness across the board.
Consequently, the US Dollar Index (DXY) tracks the buck’s value vs. a basket of six currencies, drops 0.51%, and exchanges hands at 101.012, weighed by falling US bond yields. The US 2-year bond yield finished Thursday’s session flat at 3.972%, though it began Friday’s Asian session down at 3.968%.
The latest meeting minutes from the Bank of Mexico (Banxico) were released. One official commented that policy must remain restrictive for at least a couple of years, while another member mentioned that core inflation had shown “greater persistence.” That member commented that the effects of the restrictive policy would be felt “clearly” in the second half of 2024.
Lastly, the minutes showed that the board would continue to consider the inflation outlook when deciding to continue its hiking campaign.
USD/MXN Technical Analysis
The USD/MXN is testing support at the 18.0000 figure, which, once cleared, it could pave the way for further downside. Therefore, the USD/MXN pair’s next support would be the weekly low of 17.9749, followed by the April 3 swing low at 17.9644. Break below, and the USD/MXN will test the YTD Low at 17.8968. On the flip side, the USD/MXN first resistance would be 18.1219, followed by the 20-day EMA at 18.2085, before reclaiming the April 5 high at 18.4010.
-
22:24
USD/ZAR forecast to move lower over the next months – CIBC
Analysts at CIBC, forecast the USD/ZAR pair at 17.85 by the end of the second quarter and at 17.45 by the end of the third quarter.
Key quotes:
“The recent episode of bank-related equity woes provided additional justification for investors to abandon high ZAR nominal yields in return for the safety and liquidity of the USD. Additional evidence of recent capital flight comes via the realization that speculative investors have extended ZAR shorts to alltime extremes in the wake of a record weekly ZAR position reduction in the middle of March.”
“The scale of the speculative investor capitulation allied to the substantive unwinding of bond holdings does suggest that should risk sentiment materially improve, we do not view recent financial sector effects as systemic this could suggest the near 7% year to date ZAR depreciation could materially snap back, prompting USD/ZAR to rebound back towards the 200Day MAV at 17.51.”
“The central bank (SARB) has lowered its 2023 growth assumption to 0.3%, due to substantive load shedding and or ongoing rail freight headwinds. Additionally, inflation remains a SARB concern. Inflation has remained outside of the 3-6% target range since May 2022. Policy tightening now
risks extending towards 8.00-8.25%, previously a terminal rate of 7.75% was assumed prior to the unexpected 50bps hike on 30 March.”
-
22:18
AUD/USD: Aussie to gain a tailwind ahead – CIBC
Analysts at CIBC point out the Australian Dollar should receive a lift from broad US Dollar weakness in 2023, and demand for exports supported by China's re-opening.
Key quotes:
“We are maintaining our view of a stronger AUD going forward. This is largely predicated on our forecast for a weaker US dollar, alongside the benefits from the ongoing reopening of China’s economy. Earlier this month, the RBA announced that they would hold the policy rate at 3.60%, while softening language around the need for more rate hikes. However, we expect one more 25bps hike for the RBA in early May, given our expectations of a firm upcoming CPI print, and still hawkish rhetoric from Governor Lowe.”
“Overall, a broadbased decline in the USD, alongside Chinese demand for Australian exports should continue to lift the AUD over the medium-term.”
-
21:58
Forex Today: Dollar consolidates after heavy losses, remains vulnerable
A quiet Asian session is ahead regarding economic data that could help the US Dollar stabilize after posting heavy losses on Thursday on the back of inflation and employment US data. On Friday, the key report will be the US March Retail Sales.
Here is what you need to know on Friday, April 14:
The US Dollar tumbled again, breaking technical and psychological support levels. At the same time, US stocks soared. The Dow Jones ended with a gain of 380 points or 1.15%, while the Nasdaq jumped by 1.99%. The VIX posted the lowest close since February. Big US banks will announce Q1 earnings on Friday.
On Wednesday, the US Consumer Price Index report showed that annual inflation eased to 5% in March, the lowest in two years, but the core rate remained elevated. On Thursday, data showed that wholesale inflation fell more than expected. The annualized Producer Price Index (PPI) inflation dropped from 4.9% to 2.7%, below the 3% expected, the smallest since January 2021. The latest round of data showed that inflation continues to slow down.
US Initial Jobless Claims rose to 239K, above the 232K expected, the highest level since January 2022. The report added signs of a softer labor market. More data is due on Friday with Retail Sales, Industrial Production and Consumer Confidence figures. Upbeat economic reports could help the US Dollar, but the trend is still down. Unless, good news triggers risk appetite and weighs further on the Greenback.
US Retail Sales Preview: Dollar set to jump above low barrier of expectations, three scenarios
EUR/USD posted the first daily close above 1.1000 in a year, helped by a firmer Euro and the sharp slide of the US Dollar. EUR/GBP gained for the third consecutive day, rising to the highest level in weeks above 0.8800.
USD/JPY fell for the second day in a row, although it trimmed losses during the American session, rebounding above 132.50. The improvement in market sentiment weighed on the Japanese yen.
GBP/USD rose for the third consecutive day and posted the highest daily close since June, above 1.2500. Data from the UK showed GDP was unchanged in February, against expectations of a 0.1% expansion. Bank of England’s (BoE) Silvana Tenreyro will participate in a panel on Friday at the International Monetary Fund Spring Meetings about how to fight inflation. At the last BoE meeting she voted to keep rates unchanged.
AUD/USD jumped toward 0.6800 and NZD/USD hit levels above 0.6300 amid a weaker US Dollar. The Kiwi outperformed. Early on Friday, the March Business NZ PMI is due. USD/CAD tumbled to 1.3340, a 2-month low.
USD/CHF confirmed the breakout of long-term support levels and extended the decline to 0.8854, the weakest level since January 2021. Switzerland will release wholesale inflation on Friday.
Gold continued its run toward record highs, rising above $2,040, while Silver approached $26.00. Bitcoin also benefited from the better mood across financial markets and retook $30,000.
Like this article? Help us with some feedback by answering this survey:
Rate this content -
21:57
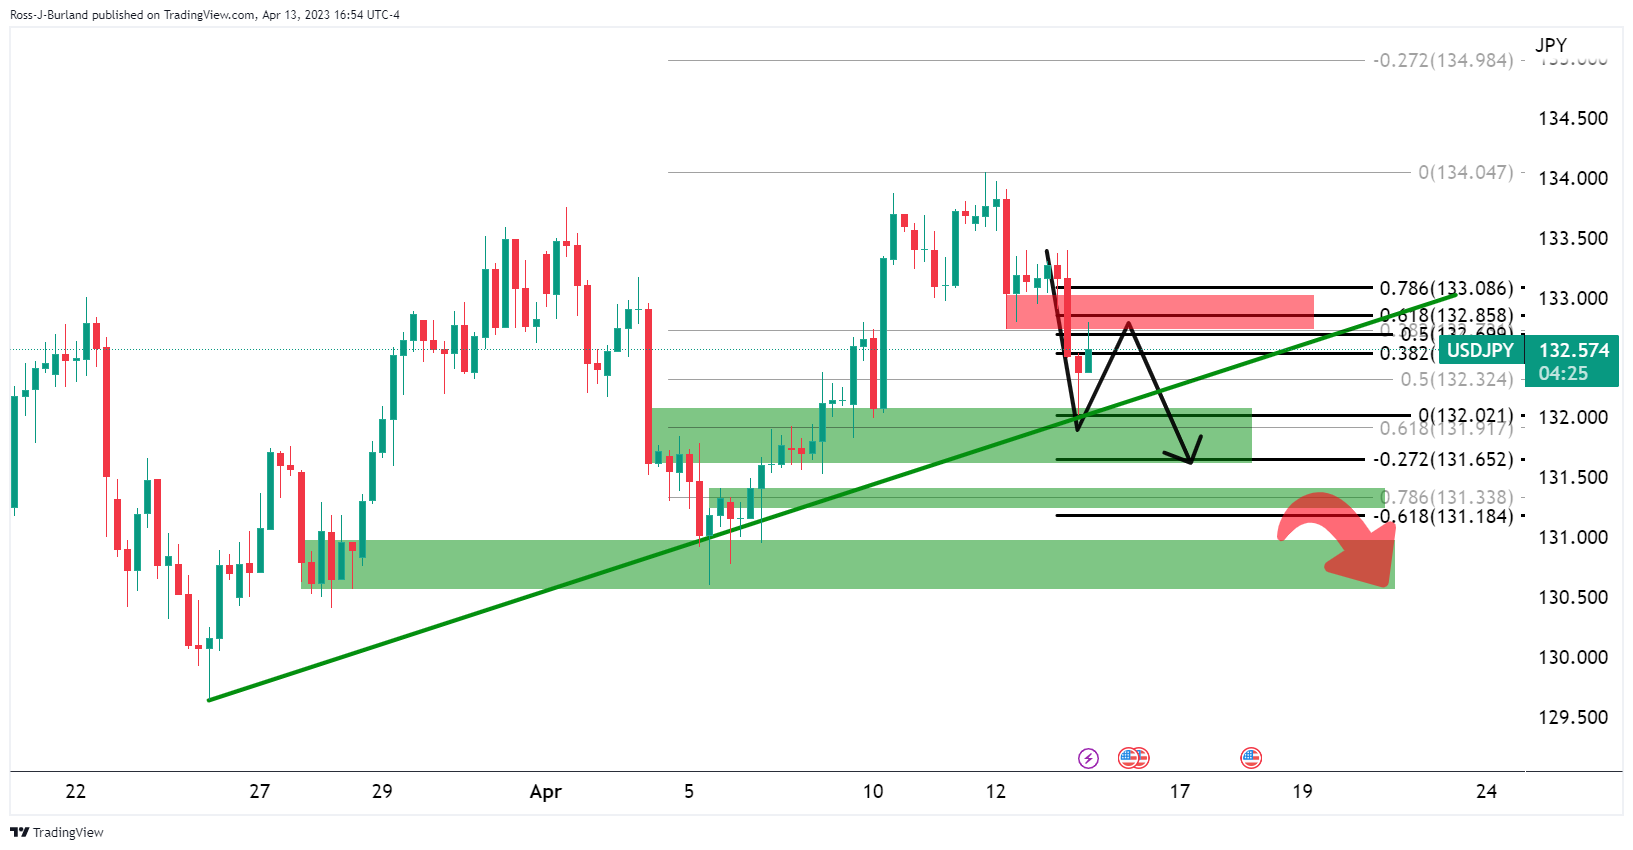
USD/JPY Price Analysis: Bulls depend on a lifeline at daily trendline support
- USD/JPY bulls are still in play with prospects of a daily close above 132.50.
- USD/JPYs trendline support is key at this juncture.
In the prior analysis, 132.50 was cited as a key level that needed to stay intact for the bullish thesis to remain in place. However, this was on a closing basis and we are yet to see a daily close below there, yet. Therefore, the money longs have been given a lifeline despite a heavy drop in the US Dollar this week.
USD/JPY prior analysis, daily chart
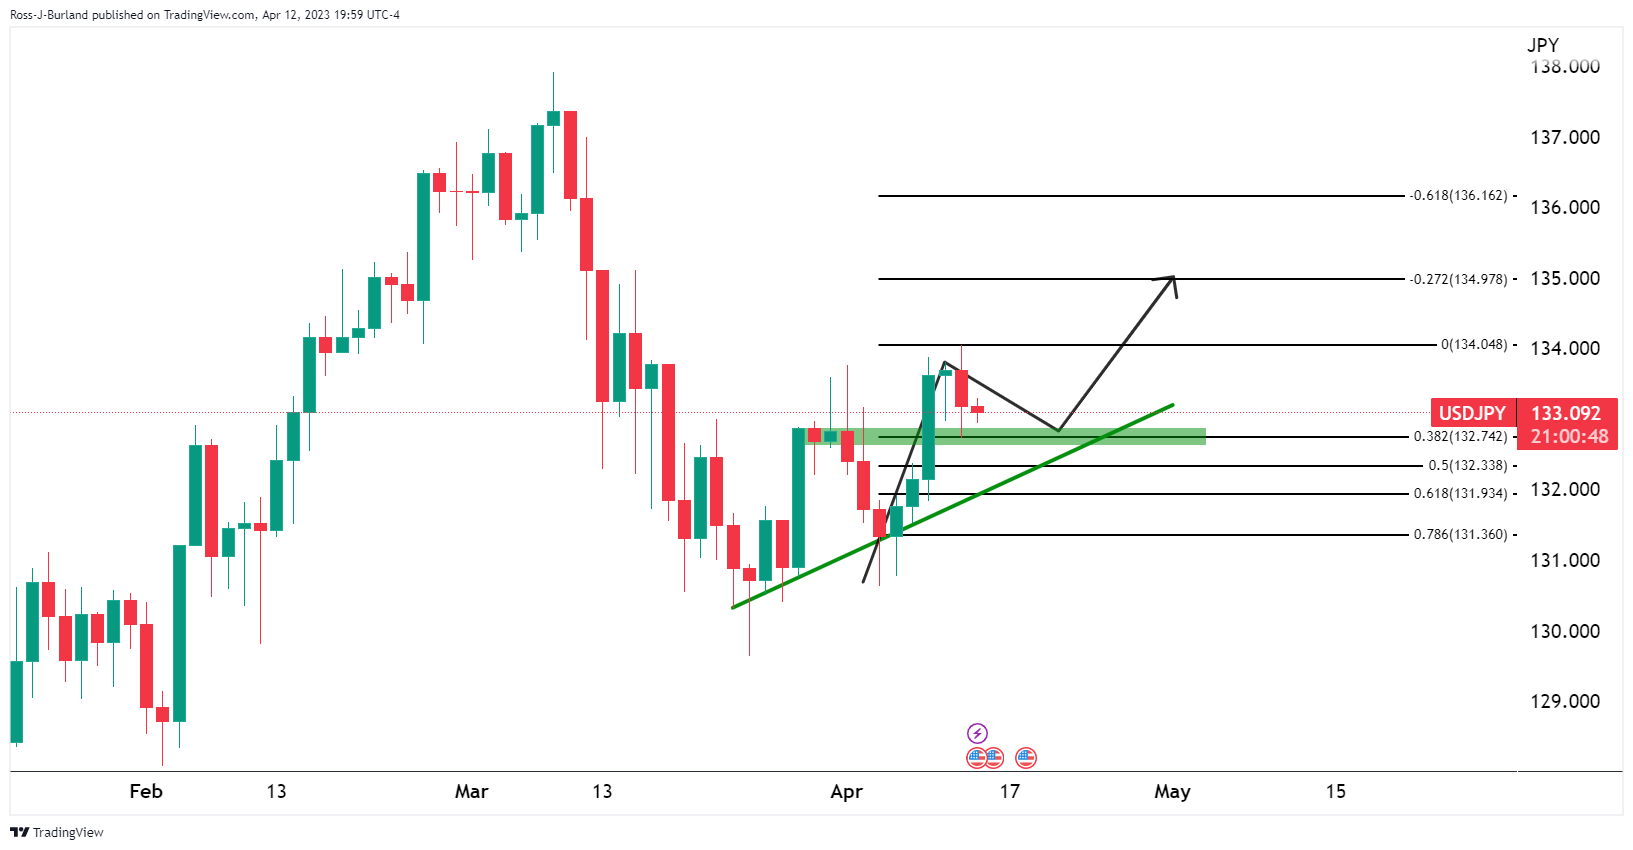
It was stated that ´´the bulls will need to commit, however, to the trendline support and preferably to above 132.50/70 for prospects of a breakout above 134.00.´´
USD/JPY updates
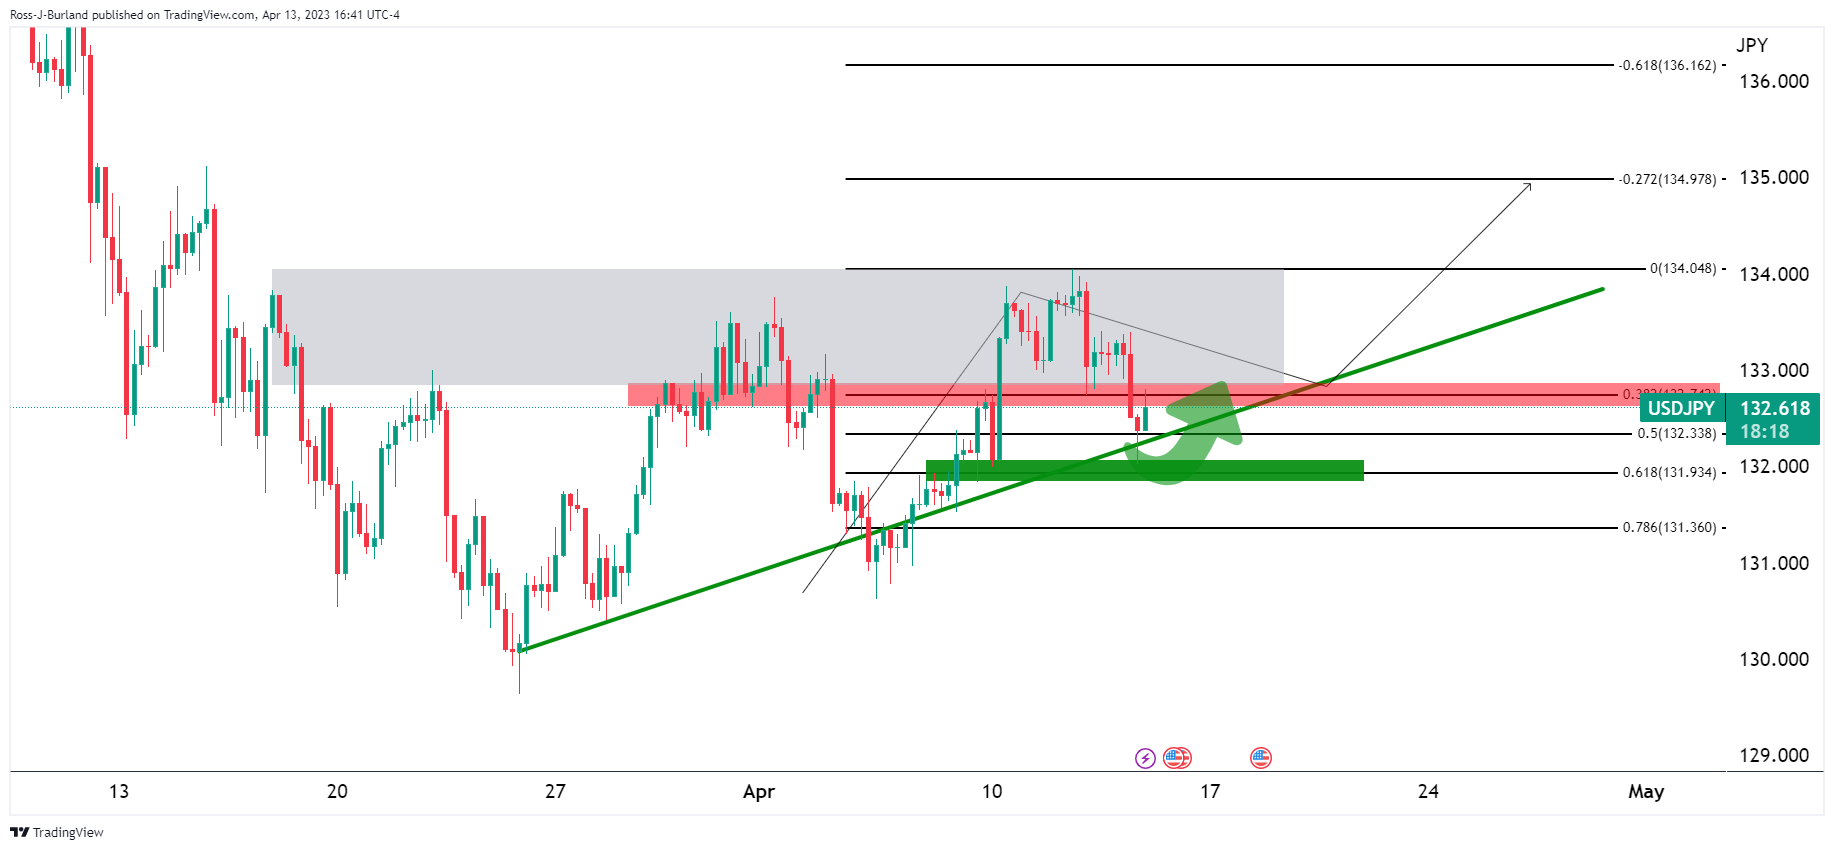
Meanwhile, we have since seen a move into test bullish commitments near 132.00 support, but the bulls are holding the fort where the trendline meets a 61.8% ratio of the daily bullish impulse. This leaves the bullish thesis intact but the bulls now need to get above the right shoulder of the head and shoulders on the 4-hour chart.
USD/JPY H4 head and shoulders
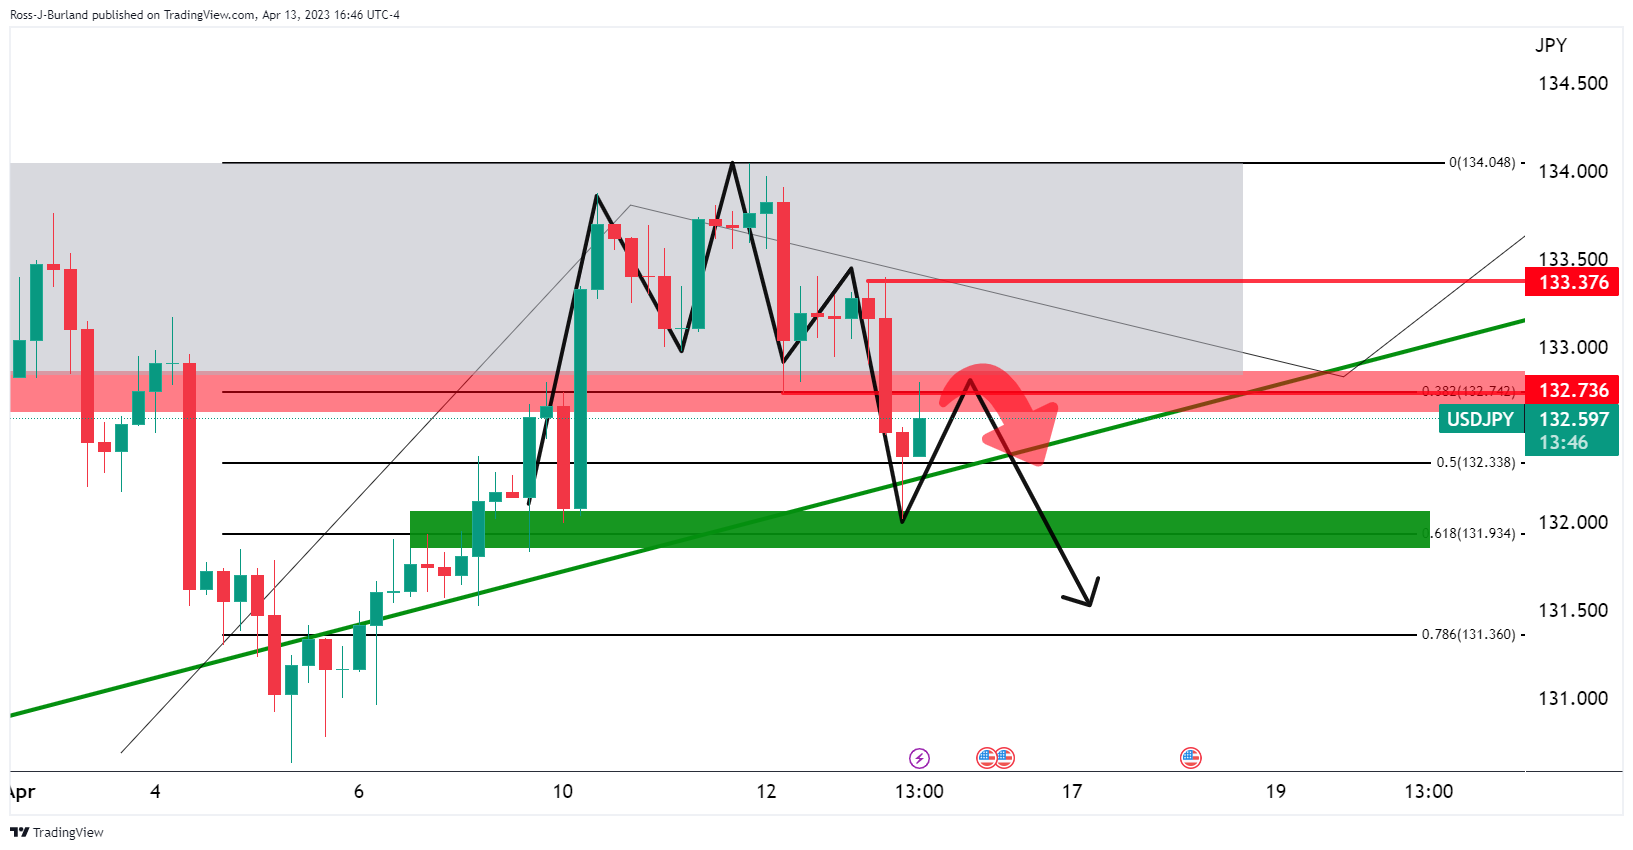
While a move to below support is troublesome for the bulls, so long as the 78.6% ratio holds, then it might not be game over for the bulls, but a break of the trendline will be problematic.
-
20:57
EUR/USD is perched at fresh 2023 highs
- EUR/USD bulls take out 2023 highs as US Dollar falls to fresh lows.
- Markets are suring up their bets of a peak Fed rate this summer.
EUR/USD has breached the early February highs and has gone on to hit its highest level since April 2022, as investors dumped the US Dollar on yet further data pointing to a pivot from the Federal Reserve later this year. At the time of writing, EUR/USD is trading at 1.1048 and has traveled between a low of 1.0976 and a high of 1.1067, currently up 0.52% on the day.
Data this week has led markets to believe that their thesis is correct, that the Federal Reserve will pause in its tightening policy campaign after one last rate hike in May. Firstly, the Consumer Price Index (CPI) inflation data on Wednesday came in at 5% year-on-year in March, down from 6% in February.
Then, on Thursday the easing inflationary pressures continues in data with the Producer Price Index (PPI) for final demand dropping 0.5% last month. In the 12 months through March, the PPI increased 2.7% which was the smallest year-on-year rise since January 2021 and followed a 4.9% advance in February. Additionally, the number of Americans filing new claims for unemployment benefits increased more than expected last week. Consequently, Fed funds futures traders are now pricing for the Fed's benchmark rate to peak at 5.002% in June, from 4.830% now, before falling back to 4.278% in December.
Meanwhile, over in Europe, central bankers have been a touch more hawkish than their US counterparts. For instance, European Central Bank's Robert Holzmann backed another 50 bps move. However, the general consensus is that the ECB is set to deliver a 25 bps rate increase on May 4 and another 25 bps hike by mid-year to combat inflation.
-
20:26
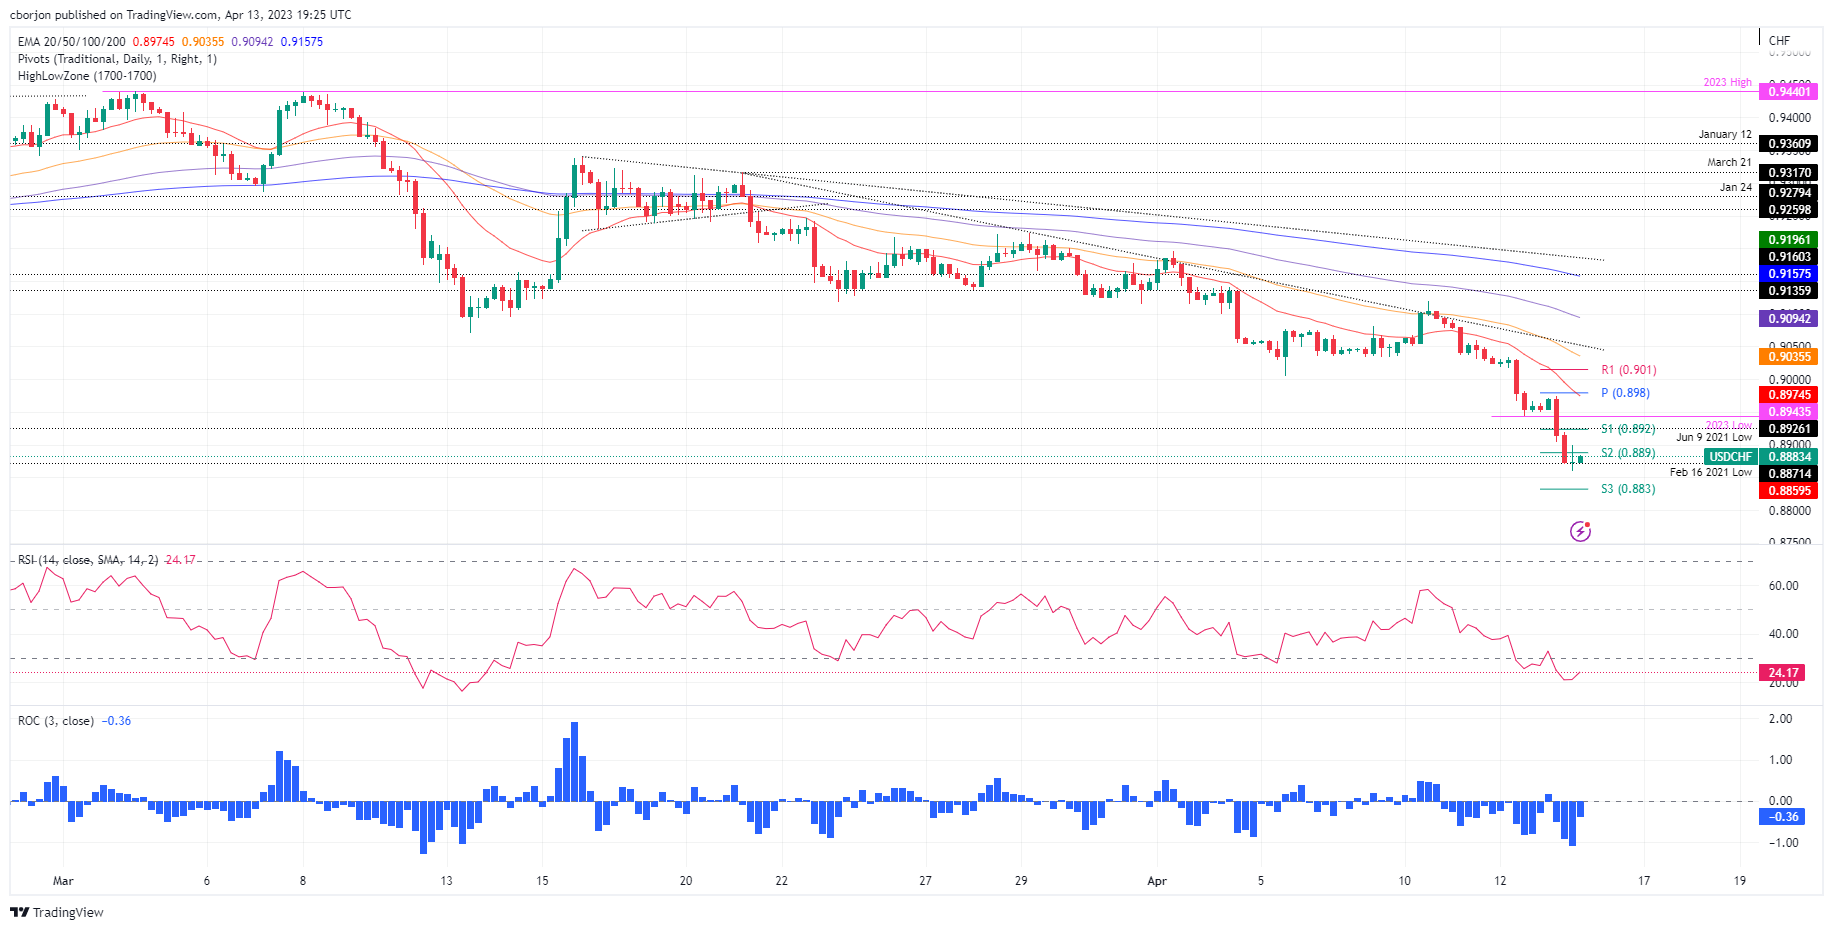
USD/CHF Price Analysis: Hits new YTD lows for the second consecutive day at around 0.8850s
- USD/CHF is poised for further decline on the daily chart.
- USD/CHF 4-Hour chart suggests consolidation, but a bearish continuation could happen below 0.8859.
- Bearish oscillators with oversold RSI may lead to an upward correction.
USD/CHF extended to new year-to-date (YTD) lows for the second straight day at 0.8859, though it rebounded slightly but remained below the psychological resistance at 0.8900. Fundamentals pointing the US economy toward a strong deceleration and a possible US Federal Reserve (Fed) pivot are the main reasons pressuring the American Dollar (USD). Therefore, the USD/CHF is trading at 0.8882 after hitting a high of 0.8974.
USD/CHF Price Action
From a daily chart perspective, the USD/CHF might continue to fall further, though buyers stepped in at around 0.8871, the February 16 cycle low. Although the USD/CHF fell beyond the latter, it bounced strongly, as USD/CHF bulls look forward to reclaiming the 0.8900 figure.
Short term, the USD/CHF 4-Hour chart suggests the pair is consolidating once it formed a doji, just below the S2 daily pivot point around 0.8888. For a bearish continuation, the USD/CHF needs to dive below 0.8859 to extend its losses toward the S3 pivot point at 0.8832, ahead of falling to 0.8800.
Although oscillators like the Relative Strength Index (RSI) and the Rate of Change (RoC) maintain a bearish bias, the RSI is in oversold territory. Hence, an upward correction is likely, though buyers must reclaim the 0.8900 figure.
Once achieved, the USD/CHF next resistance would bet the S1 pivot point at 0.8925, followed by the confluence of the daily pivot point and the 20-day EMA at 0.8975/80 before testing 0.9000.
USD/CHF 4-Hour chart
USD/CHF Technical Levels
-
20:19
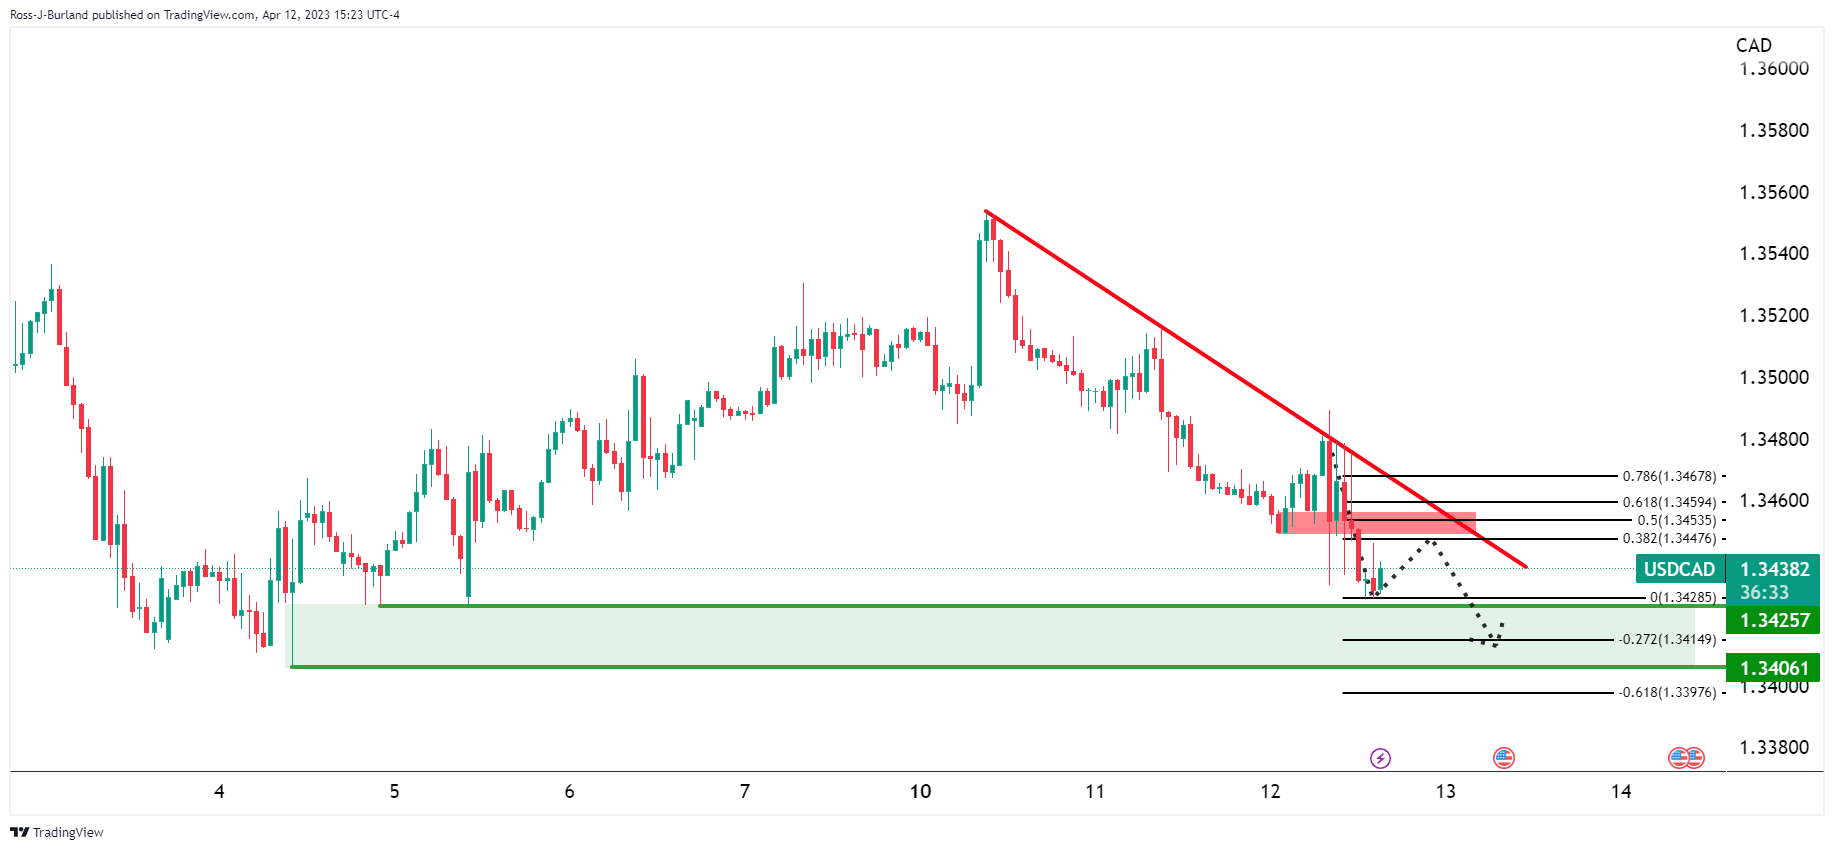
USD/CAD Price Analysis: Bears in control and eye lower to 1.3320
- US Dollar under pressure, commodities up.
- USD/CAD bears eye 1.3320 for the coming sessions and lower for the upcoming days.
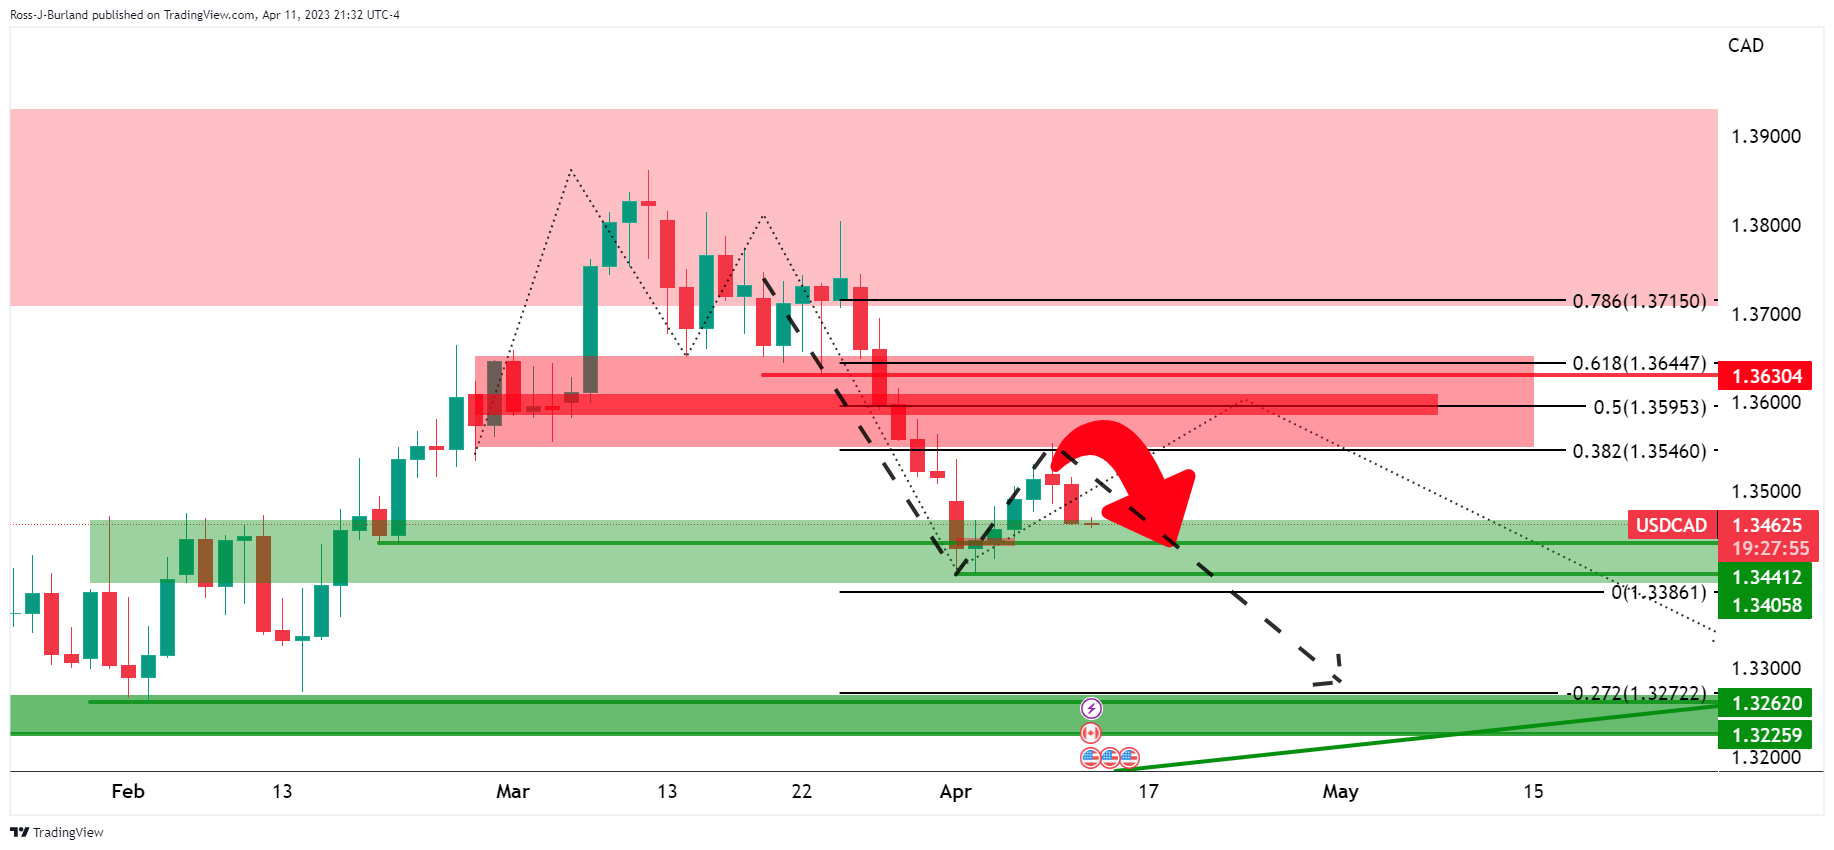
In the prior analysis, USD/CAD Price Analysis: Bears are in the market and eye test of 1.3400, which arrived at a bearish bias, it stated that on the hourly chart, ´´we can see that the price is being rejected at old support again. A 38.2% Fibonacci retracement aligns with prior support that would be expected to act as resistance on a restest while the bears commit to the front side of the bearish trend. This in turn could lead to an additional push lower and into the target area of the 1.3400s.´´
USD/CAD prior analysis
USD/CAD H1 chart
USD/CAD, live updates
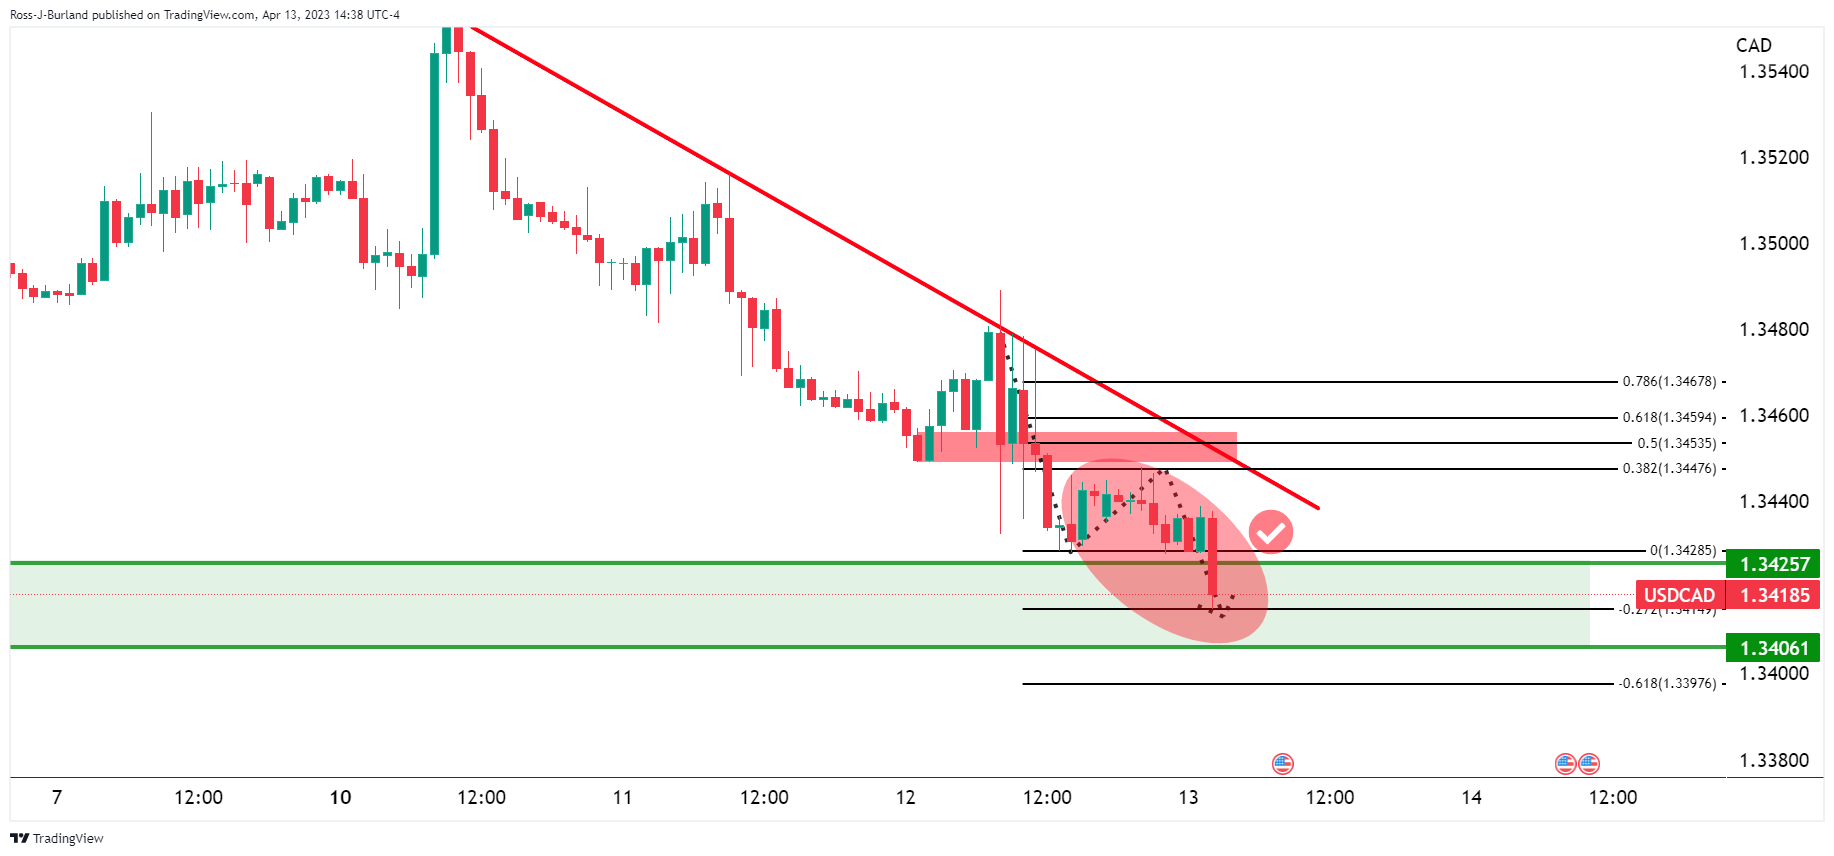
As illustrated, the price dropped into the target on the test of the 38.2% Fibonacci retracement in a textbook outcome.
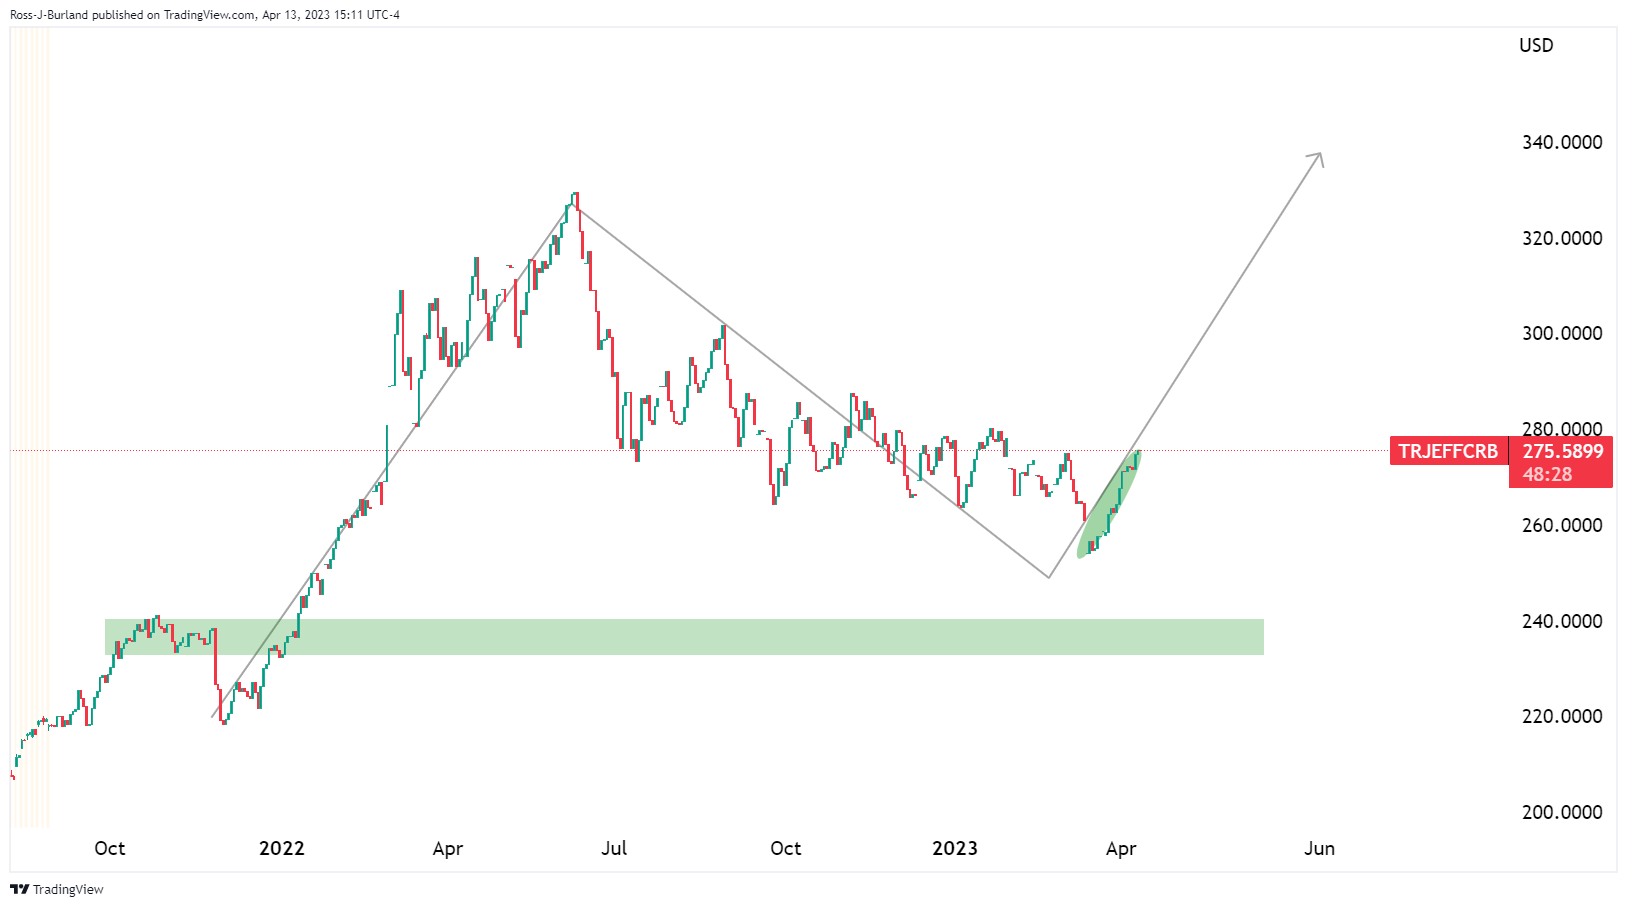
Meanwhile, the US Dollar came under further pressure on Thursday and markets have jumped at the opportunity to long commodities as per the following CRB chart:
As such, the Canadian Dollar has found support, sending USD/CAD down like a stone and in line with the prior analysis:
Before:
After:
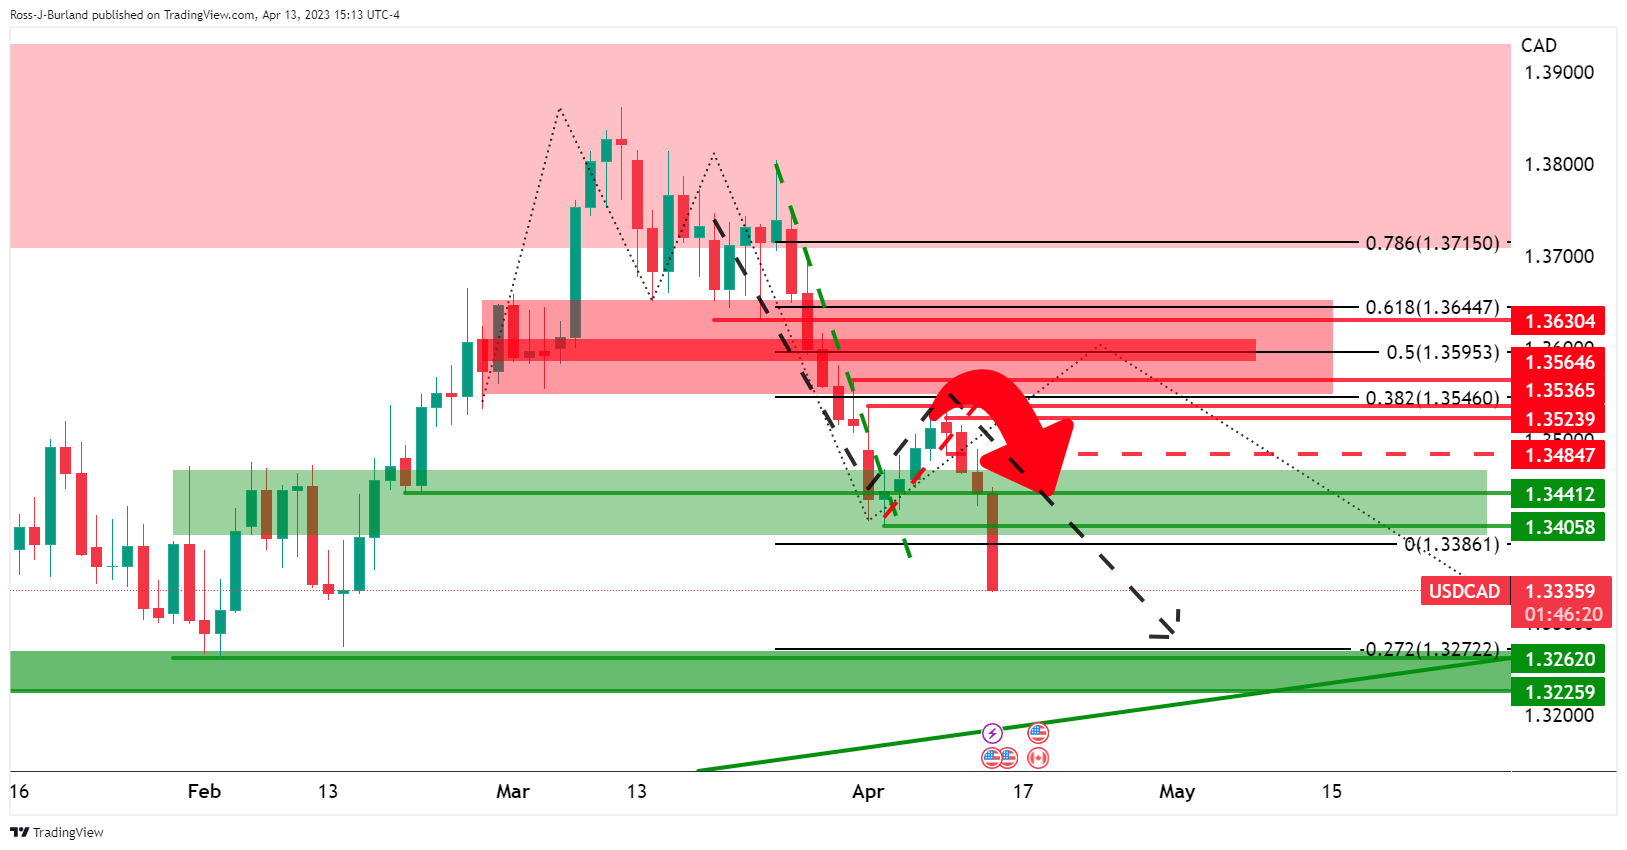
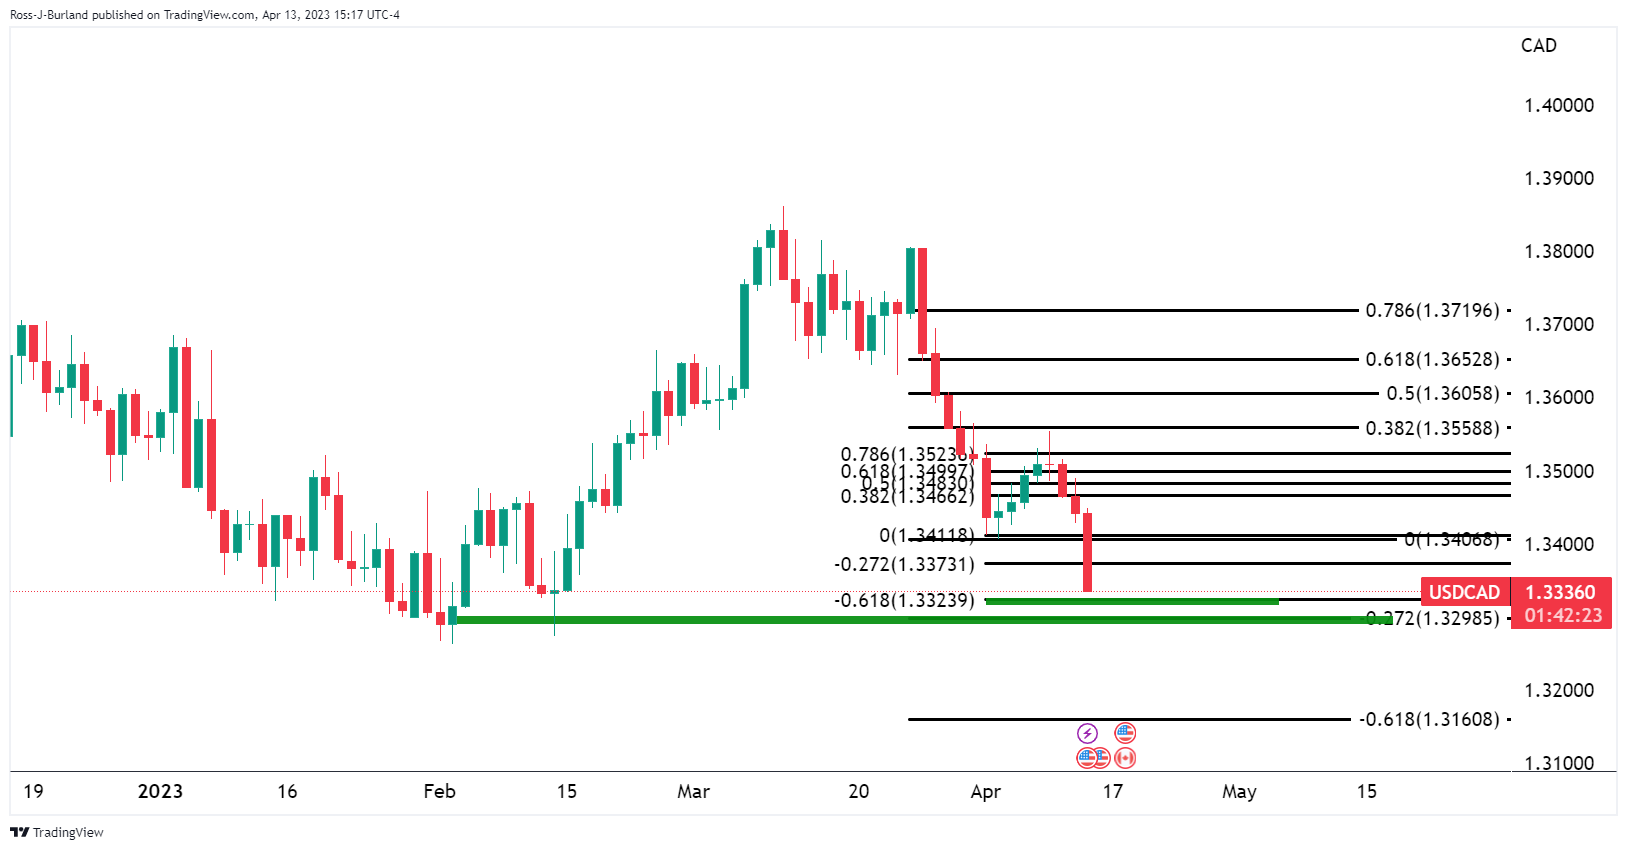
The forecast is into the 1.3270s for the coming days on a break of 1.3320:
-
18:59
GBP/USD bulls printing fresh bull cycle highs
- GBP/USD bulls taking the reigns as US Dollar swoops into key daily support territory.
- Markets anticipate the Federal Reserve is near the end of its rate hiking cycle.
GBP/USD is a touch higher on Thursday as the US Dollar slides deeper into what might be regarded as a meanwhile critical supporting area on the DXY´s daily chart. The price has traveled between a low of 1.2477 and a high of 1.2537 on the day so far and at the time of writing, the price is perched near the highs of the day at 1.2530, up 0.37%.
The British pound has been touching its strongest level since June 2022, as traders access the landscape across the pond with both US and UK data sending signals to markets as to how the two central banks are likely to respond.
For the US, there has been a series of data that is pointing to a pivot from the Federal Reserve and a mild recession later this year. There are signs of easing inflationary pressures and a slowdown in the country's labor market, both of which have started to reinforce the chances the Federal Reserve will be delivering a final rate hike in May before pausing its tightening cycle. This has seen the DXY index fall to as low as 100.84 and 200 points lower than the highs of the week.
The drop comes after the Consumer Price Index (CPI) inflation data on Wednesday came in at 5% year-on-year in March, down from 6% in February. The Greenback has been offered despite hotter Core inflation, which strips out volatile food and energy prices. The Core picked up to 5.6%, from 5.5% the previous month. Nevertheless, the data on Thursday confirmed the easing inflationary pressures with the Producer Price Index (PPI) for final demand dropping 0.5% last month. In the 12 months through March, the PPI increased 2.7% which was the smallest year-on-year rise since January 2021 and followed a 4.9% advance in February.
Furthermore, other data on Thursday showed that the number of Americans filing new claims for unemployment benefits increased more than expected last week, another sign that what has otherwise been considered a tight labor market is easing, up as higher borrowing costs, for which the Federal Reserve has triggered in its monetary policy path to date, has dampened demand in the economy.
As such, the data is boosting expectations that the Federal Reserve is near the end of its rate hiking cycle. Fed funds futures traders are now pricing for the Fed's benchmark rate to peak at 5.002% in June, from 4.830% now, before falling back to 4.278% in December.
BoE / Fed divergence coming in?
On the other side of the pound, a ONS report showed Britain's GDP stagnated in February due to strikes by public workers but January's growth was revised higher, suggesting the economy might avoid a recession in early 2023. On the policy front, the divergence between the Federal Reserve and the Bank of England that had been keeping a lid on GBP/USD is coming in. The BoE is expected to continue to raise interest rates further to combat inflation. For instance, Chief Economist Huw Pill said last week the central bank still could not be sure that it has raised interest rates enough to tame inflation.
-
18:49
Gold Price Forecast: XAU/USD reaches YTD high around $2,048 amidst US economic slowdown
- Factory gate inflation in the US continued its downtrend, except for core.
- Unemployment claims for the last week jumped for the second consecutive week.
- Gold Price Analysis: Set to test the ATH around $2,075; otherwise, it could drop below $2,000.
Gold price advances though it remains off the highs of the year, reached earlier at around $2,048.79 after US data continued to show the economy is decelerating. Therefore, the US Dollar (USD) weakened as US Treasury bond yields continued their downward trajectory, while Gold rallied on safe-haven flows. The XAU/USD is trading at $2039.10 after reaching a low of $2,013.90.
US prices paid by producers plunge as inflation cools
The US Bureau of Labor Statistics (BLS) revealed that the March Producer Price Index (PPI) plunged 0.5% MoM, below estimates of 0%. The so-called core PPI, which excludes volatile items, dropped 0.1% MoM, beneath the 0.3% foresaw by the consensus. When compared year-over-year, the PPI was 2.7%, lower than the 3% of the street’s projections, while the core PPI was unchanged at 3.4%. That weighed on the American Dollar (USD), which is seen losing 0.61%, per the US Dollar Index, at 101.913.
Initial Jobless Claims in the US climbed for the second straight week
At the same time, Initial Jobless Claims for the week ending on April 8, reported by the Bureau, exceeded expectations, at 239K, vs. 232K estimates. That, alongside inflation in the United States (US) decelerating steadily, weighed on the US Dollar and bolstered the safe-haven Gold price, which remains at around the $2,040 area.
Will the latest US data trigger a Fed pivot?
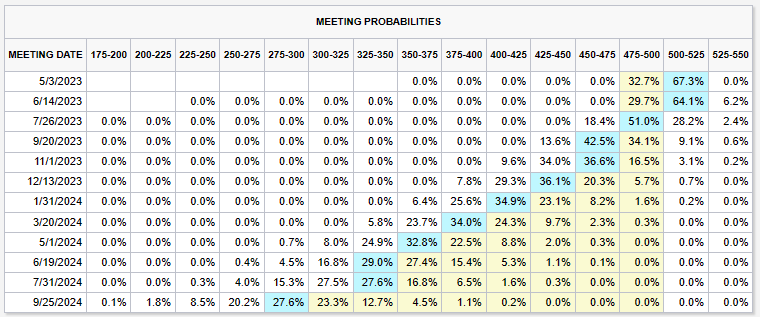
Given the above backdrop, the US Dollar remained offered across the FX board and against US Dollar denominated commodities. Expectations that the US Federal Reserve (Fed) is about to finish its tightening cycle inundated the financial markets, with the Federal Funds Rate (FFR) forecasted to peak at 5.00% - 5.25%. According to CME Fed WatchTool, chances for a 25 bps hike in May lie at 67.3%, but market participants have begun to price in rate cuts. Investors estimate the FFR would finish 2023 in the 4.25% - 4.50% range. That means 75 bps of rate cuts are expected following May’s hike.
Federal Reserve officials remained committed to taming inflation
Meanwhile, Federal Reserve policymakers led by San Francisco’s Fed Mary Daly said that “policy may have to tighten more to bring inflation down,” though acknowledged that there are good reasons that the economy “may continue to slow, even without additional policy adjustments.” Earlier, Richmond’s Fed President Thomas Barkin said that inflation has peaked but warned there are still ways to go.
XAU/USD Technical Analysis
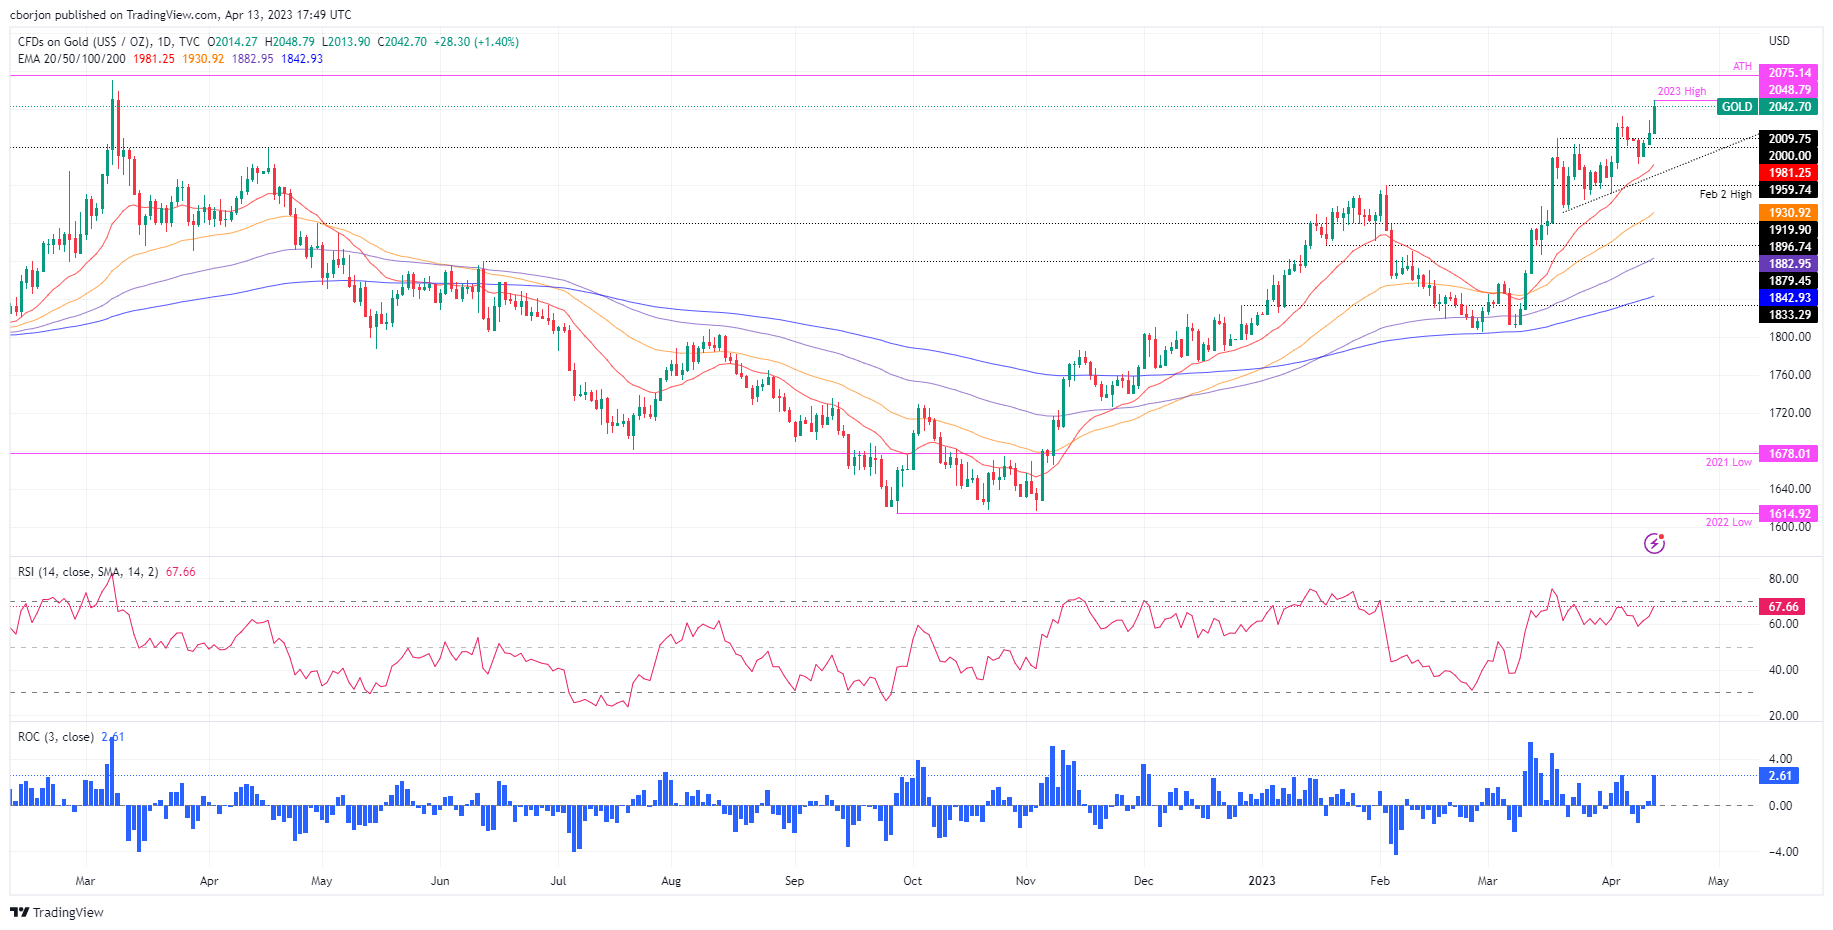
After cracking the previous YTD high at $2,032.13, the XAU/USD dipped before posing another challenge to reach a new YTD high. That happened six days after, with the Gold price hitting a new YTD high, shy of the $2,050 psychological level. For a bullish resumption, the XAU/USD needs to crack $2,050, so it can challenge the all-time high (ATH) at $2,075.14 before aiming toward $2,100. On the other hand, if XAU/USD drops back toward $2,000, that would pave the way for a break below the latter. Once that happens, the XAU/USD next support would be the April 10 swing low at $1,981.78, followed by the 20-day EMA at $1,981.25.
-
18:03
United States 30-Year Bond Auction fell from previous 3.877% to 3.661%
-
17:36
Silver Price Analysis: XAG/USD rallies to new YTD highs, nearby $26.00
- Silver price is poised for upward momentum, above $26.00.
- The rate of Change (RoC) remains bullish, but the RSI portrays XAG as overbought.
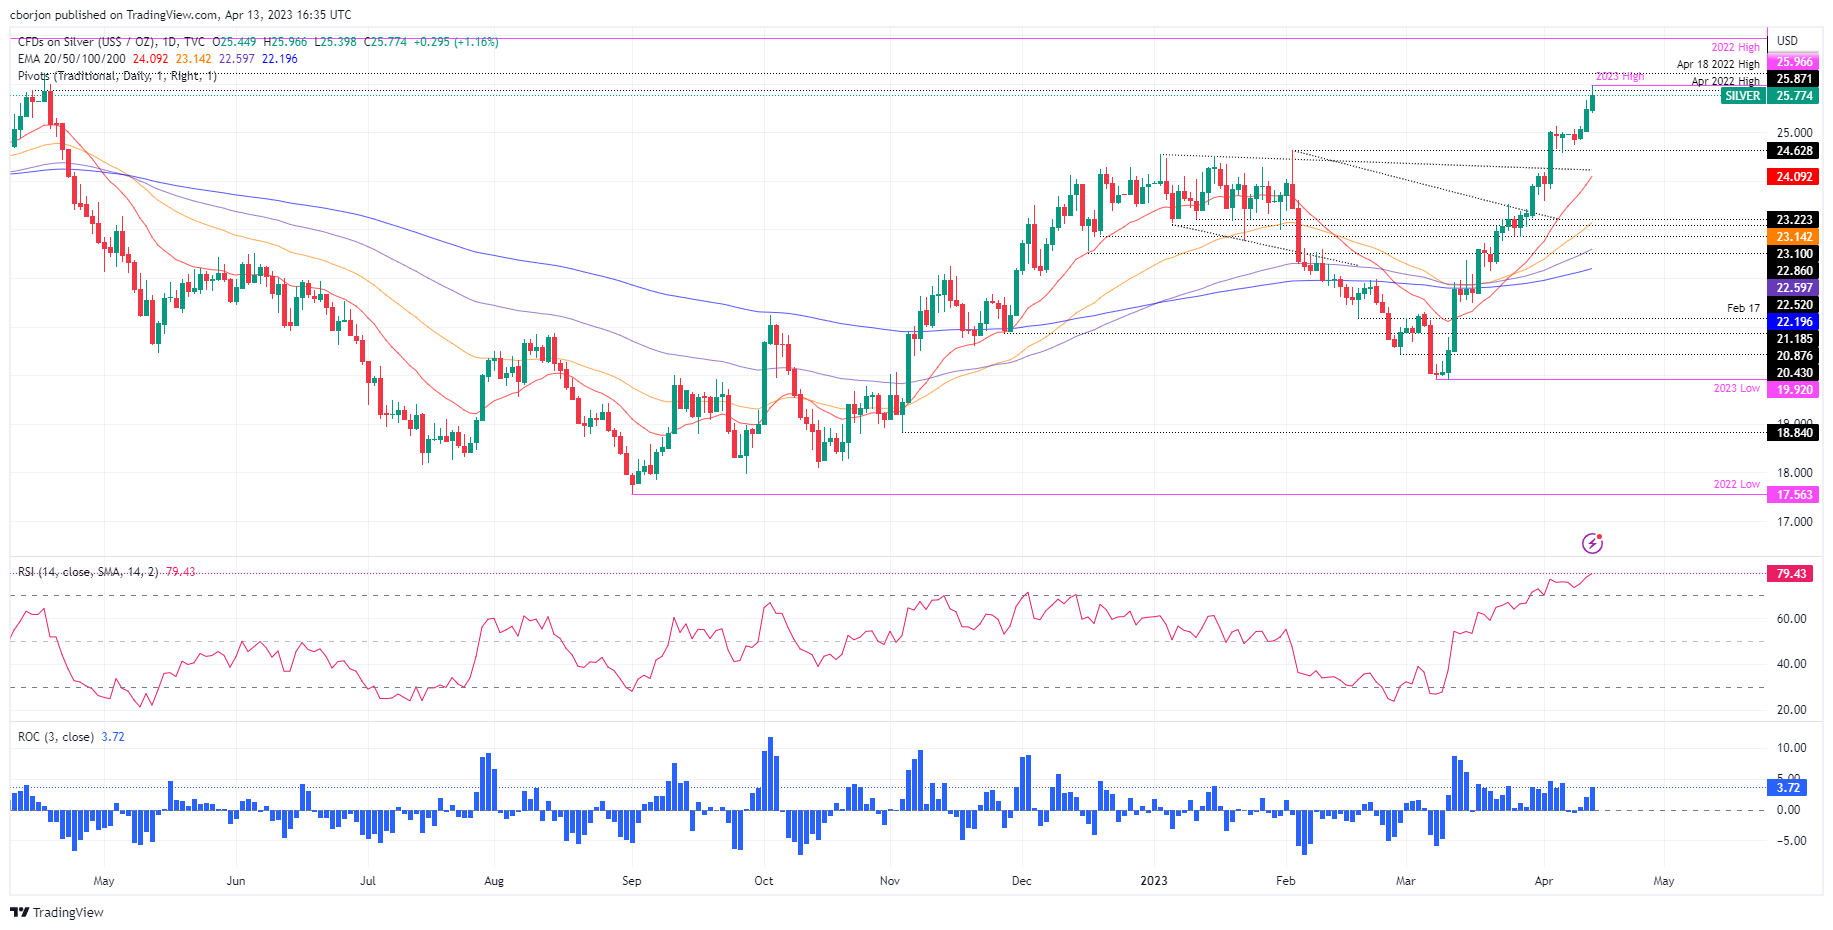
Silver price advanced to a new YTD high at $25.96, though it fell short of cracking the $26.00 figure, which would have opened the door towards testing, last year's peak, nearly $27.00. At the time of typing, the XAG/USD is trading at $25.76 after hitting a low of $25.39.
XAG/USD Price Action
After registering a YTD high on Wednesday at around $25.66, the XAG/USD has extended its rally toward $25.96. Although it failed to break above the $26.00 figure, the XAG/USD remains controlled by buyers and might brace to April 16, 2022, swing high at $25.87 before re-challenging the $26.00 mark.
If XAG/USD breaks above $26.00, it will exacerbate a rally toward April 18, 2022, high at $26.21 before testing the 2022 yearly high at $26.94. Conversely, if the XAG/USD extends its losses past $25.50, the white metal might pull back toward the April 5 high at $25.13 before sliding toward $25.00.
Oscillators suggest that Silver is overbought, as shown by the Relative Strength Index (RSI). But due to the strength of the uptrend, a jump above 80 suggests the asset might consolidate as the RSI exits overbought conditions. The Rate of Change (RoC) is still bullish, although it flashed that buying pressure is fading.
XAG/USD Daily Chart
XAG/USD Technical Levels
-
16:50
AUD/USD extends gains to weekly highs, approaches 0.6800
- US Dollar Index tumbles after US economic data.
- US stocks rise on Thursday, the Nasdaq leads with a 1.40% gain.
- AUD/USD up by almost a hundred pips, approaches 0.6800.
The AUD/USD gained momentum after the release of US Data and continued to move higher during the American session amid risk appetite. The pair is hovering around 0.6778, at the highest level since April 4.
Earlier on Thursday, the Australia Employment report surprised with a 53K job gain in March above the 20K of market consensus. Analysts at ANZ, don’t think this will be enough for the Reserve Bank of Australia “to return to hiking the cash rate in May, given its reasoning for pausing in April: to assess the impacts of the cumulative 350bp of hikes delivered so far, given the long lags of monetary policy.”
The Aussie rose modestly after the jobs report, with AUD/USD climbing back above 0.6700. The rally took place after the release of US economic data, with wholesale inflation falling more than expected in March and Jobless Claims pointing to a softer labor market. Those number triggered a dollar sell-off and boosted risk appetite.
The context on Thursday favors commodity currencies. AUD/USD is up by almost a hundred pips and NZD/USD has broken above 0.6300.
Looking at 0.6800
The AUD/USD is trading at 0.6776, the highest level in a week and is testing the 55-day Simple Moving Average. A break above would turn the attention to the 0.6800 area.
The technical outlook looks constructive for the Aussie in the short-term. A slide under 0.6600 would strengthen the US Dollar.
Technical outlook
-
16:32
United States 4-Week Bill Auction fell from previous 4.44% to 4.03%
-
16:29
NZD/USD surges as US inflation and jobs data softens
- NZD/USD bulls hover at around 0.6290, eyeing a test of 0.6300 and beyond.
- US core PPI was unchanged at 3.4%, portraying stickier-than-expected inflation.
- The US labor market cools down on back-to-back weeks with unemployment claims rising above the consensus.
NZD/USD climbs to a new five-day high after forming a bullish engulfing candlestick pattern that exacerbated a jump of 80-plus pips on Thursday. The downtrend in inflation in the United States (US), alongside a cooling labor market, are the main reasons for today’s US Dollar (USD) weakness. The NZD/USD is trading at around 0.6290 after hitting a low of 0.6203.
NZD/USD underpinned by soft US economic data
US equities portray an upbeat sentiment. The case for a Fed pivot is gaining strength, as inflation on the producer side softened, and unemployment claims for the April 8 week exceeded estimates. The Producer Price Index (PPI) for March was -0.5% MoM, below forecasts of 0%, while the core PPI dropped 0.1% MoM, beneath estimates of a 0.3% expansion. Annually based, the PPI was 2.7%, below estimates, and the core PPI came at 3.4%, as foresaw by the consensus.
At the same time, the US Department of Labor (DoL) revealed that Initial Jobless Claims for the last week edged higher, at 239K above forecasts of 232K. Continuing claims fell to 1.81 million in the prior’s week to April 8.
The NZD/USD jumped from around 0.6240 toward its daily high of 0.6299, shy of cracking 0.6300 on a soft US Dollar. The greenback tested YTD lows, as shown by the US Dollar Index, at around 100.846, before reclaiming the 101.022 mark, losing 0.50%.
US Treasury bond yields continued their downward trajectory, namely the 2-year, losses two basis points at 3.945%, as traders estimate one more rate hike of the US Federal Reserve (Fed) before pausing. The CME Fed WatchTool shows odds for a 25 bps hike by the Fed are at 66.5%, below April 12 70.4% chances.
NZD/USD Technical Analysis
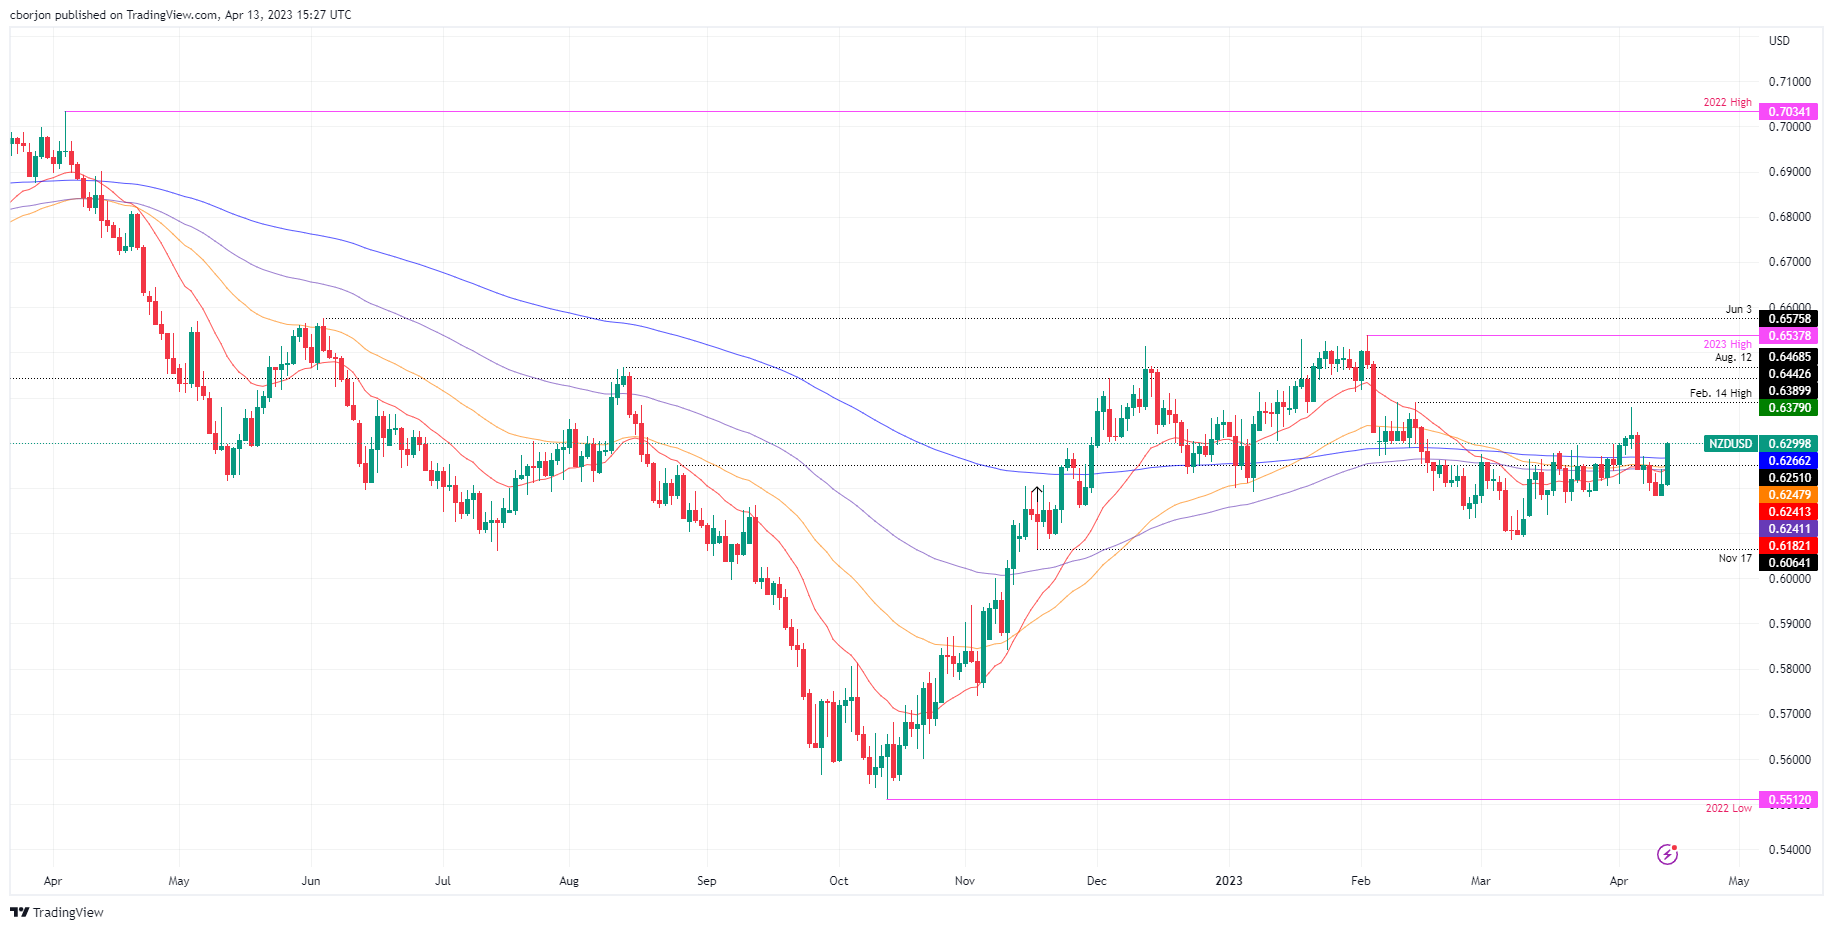
After breaking above the 200-day Exponential Moving Average (EMA) at 0.6266, the NZD/USD is poised to crack 0.6300. Once cleared, the NZD/USD pair could rally towards April 6 high at 0.6324, followed by the prior’s day cycle high at 0.6379. A breach of the latter will expose 0.6400. Conversely, with a daily close below 0.6300, buyers would be at risk of losing support at the 200-day EMA. Break below 0.6266, and the pair might dip towards the confluence of the 100 and 50-day EMAs at around 0.6240-48.
-
15:53
IMF’s Georgieva: Inflation coming down but not fast enough
In an interview with CNBC on Thursday, International Monetary Fund’s (IMF) Managing Director Kristalina Georgieva said that she doesn't think there is a banking crisis in the US but acknowledged that there are vulnerabilities, per Reuters.
Gerogieva noted that the slowdown in the US economy will lead to Federal Reserve to recalibrate the policy. On inflation outlook, she said that inflation is coming down but added that the decline is not fast enough.
Market reaction
The US Dollar Index stays deep in negative territory after these comments and was last seen losing 0.5% at around 101.00.
-
15:30
United States EIA Natural Gas Storage Change below expectations (28B) in April 7: Actual (25B)
-
14:50
USD/JPY drops to 132.00 neighbourhood, erases weekly gains amid broad-based USD weakness
- USD/JPY remains under heavy selling pressure for the second successive day on Thursday.
- The softer US PPI reaffirms bets for an imminent Fed rate hike pause and weighs on the USD.
- Looming recession risks benefit the safe-haven JPY and also contribute to the offered tone.
The USD/JPY pair comes under heavy selling pressure during the early North American session and drops to a three-day low, around the 132.00 round-figure mark in the last hour.
The US Dollar (USD) weakens across the board in reaction to the US Producer Price Index (PPI) and turns out to be a key factor dragging the USD/JPY pair lower for the second successive day. Against the backdrop of the softer US CPI report released on Wednesday, the US PPI print suggests that disinflation is progressing smoothly and may even accelerate. This, in turn, reaffirms expectations that the Federal Reserve (Fed) will be done with its monetary tightening after hiking one last time next month and weighs on the buck
Furthermore, the March FOMC meeting minutes showed that several policymakers considered pausing interest rate increases after the failure of two regional banks. Meanwhile, the prospects for an imminent pause in the Fed's rate-hiking cycle lead to a further decline in the US Treasury bond yields, resulting in the further narrowing of the US-Japan rate differential. This, along with looming recession risks, benefits the safe-haven Japanese Yen (JPY) and also contributes to the heavily offered tone surrounding the USD/JPY pair.
That said, the Bank of Japan's (BoJ) dovish near-term outlook might keep a lid on any meaningful gains for the JPY and hold back traders from placing aggressive bearish bets around the USD/JPY pair, at least for the time being. Nevertheless, spot prices now seem to have surrendered a major part of the weekly gains and remain at the mercy of the USD price dynamics. Apart from this, the US bond yields and the broader risk sentiment will be looked upon for short-term trading opportunities ahead of the US monthly Retail Sales data on Friday.
Technical levels to watch
-
14:38
ECB's Vasle: Considering 25 and 50 bps rate hike options for May
While speaking at the sidelines at the IMF event, European Central Bank (ECB) Governing Council member Bostjan Vasle said that they are considering 25 and 50 basis points (bps) rate hike options for the May policy meeting, per Reuters.
"Headline inflation is coming down but we are all focused on core inflation, which is still moving in the wrong direction," Vasle further noted. "This is, of course, not unexpected given the tightness of the labour market and still not fully materialised pass-through effects."
Market reaction
EUR/USD preserves its bullish momentum following these comments and was last seen trading at its highest level since March 2022 at 1.1060, gaining 0.65% on daily basis.
-
14:35
EUR/USD looks firmer and climbs to 12-month highs near 1.1060
- EUR/USD gathers extra pace and pokes with 1.1060.
- Industrial Production in the euro area surprised to the upside.
- US Producer Prices, weekly Claims came below consensus.
The upside momentum in the single currency and around the risk complex in general lifts EUR/USD to new highs near 1.1060 on Thursday.
EUR/USD: Next on the upside comes 1.1100
EUR/USD keeps the bid stance well and sound for the third session in a row on Thursday and trades in levels last seen around a year ago on the back of the unabated sell-off in the dollar.
Indeed, the greenback saw its decline gather extra impulse after US Producer Prices unexpectedly contracted 0.5% MoM in March, while weekly Initial Claims kept thew recent uptrend in place after rising more than estimated by 239K in the week to April 8.
Extra weakness in the dollar also comes in response to declining US yields in the short end and the belly of the curve, while expectations of a 25 bps rate hike by the Fed in May has been somewhat trimmed in the wake of US results.
Earlier in the domestic calendar, final inflation figures in Germany showed the CPI rose 7.4% in the year to March and 0.8% vs. the previous month, while Industrial Production in the broader Euroland expanded more than expected 2.0% YoY in February.
What to look for around EUR
EUR/USD advances well past the 1.1000 mark and records new YTD peaks on Thursday.
In the meantime, price action around the single currency should continue to closely follow dollar dynamics, as well as the incipient Fed-ECB divergence when it comes to the banks’ intentions regarding the potential next moves in interest rates.
Moving forward, hawkish ECB-speak continue to favour further rate hikes, although this view appears in contrast to some loss of momentum in economic fundamentals in the region.
Key events in the euro area this week: Germany Final Inflation Rate, EMU Industrial Production (Thursday).
Eminent issues on the back boiler: Continuation, or not, of the ECB hiking cycle. Impact of the Russia-Ukraine war on the growth prospects and inflation outlook in the region. Risks of inflation becoming entrenched.
EUR/USD levels to watch
So far, the pair is gaining 0.60% at 1.1057 and a break above 1.1100 (round level) would target 1.1184 (weekly high March 21 2022) en route to 1.1200. On the flip side, the next support comes at 1.0788 (monthly low April 3) followed by 1.0750 (55-day SMA) and finally 1.0712 (low March 24).
-
14:33
BoE's Pill: Precise path of inflation may be bumpier than we expect
Bank of England Chief Economist Huw Pill said on Thursday that they still expect Consumer Price Index (CPI) inflation to fall in the second quarter due to large rises in energy prices from last year dropping out of the annual comparison, per Reuters.
Key takeaways
"Bank staff continue to expect GDP to decline by 0.1% in 2023 Q1."
"Precise path of inflation may be bumpier than we expect."
"High frequency indicators of momentum in wage developments appear to be easing."
"Aggregate lending measures have slowed only slightly."
"Latest data is somewhat disappointing but much better than BoE forecasts from late last year."
"UK banking system remains very robust and resilient."
"Inflation persistence is the key focus for where monetary policy needs to go."
"Good news that latest job growth has come from falling inactivity rates."
"Open question whether unemployment will need to rise to dampen inflation pressures from higher wage growth."
Market reaction
GBP/USD showed no immediate reaction to these comments and was last seen rising 0.4% on a daily basis at 1.2530.
-
14:14
GBP/USD jumps to 1.2535 area, highest since June 2022 amid notable USD supply
- GBP/USD gains positive traction for the fourth successive day and touches a fresh YTD peak.
- Expectations for an imminent Fed rate-hike pause weigh on the USD and remain supportive.
- Acceptance above the 1.2500 mark favours bulls and supports prospects for additional gains.
The GBP/USD pair gains positive traction for the third successive day on Thursday and climbs to the 1.2530 area, or its highest level since June 2022, during the early North American session.
The US Dollar (USD) selling picks up pace following the release of the softer-than-expected US Producer Price Index (PPI) and turns out to be a key factor pushing the GBP/USD pair higher. In fact, the US Bureau of Labor Statistics reported that the US PPI fell to the 2.7% YoY rate in March from 4.9% previous (revised down from 4.6%). The annual Core PPI, meanwhile, declined to 3.4% during the reported month from 4.5% in February, matching analysts' estimate. On a monthly basis, the PPI and the Core PPI came in at -0.5% and -0.1%, respectively.
This comes on the back of the softer US CPI report on Wednesday and lifted hopes that disinflation is progressing smoothly, reaffirming expectations that the Federal Reserve (Fed) will soon pause its rate-hiking cycle. Moreover, the markets now expect the US central bank to start cutting rates during the second half of the year, which leads to a further decline in the US Treasury bond yields. Apart from this, a generally positive tone around the equity markets is seen denting demand for the safe-haven buck and lending support to the GBP/USD pair.
The aforementioned factors, to a larger extent, overshadow the mostly disappointing UK macro data released this Thursday. In fact, the UK Office for National Statistics reported that the economic growth remained flat in February as compared to the 0.1% rise estimated. Adding to this, the UK Manufacturing and Industrial Production figures missed expectations, overshadowing the better-than-expected Trade Balance data. That said, the recent mixed signals from the Bank of England (BoE) policymakers over future rate hikes might cap gains for the GBP/USD pair.
From a technical perspective, a move beyond the previous YTD peak and acceptance above the 1.2500 psychological mark could be seen as a fresh trigger for bullish traders. This, in turn, supports prospects for a further near-term appreciating move. Hence, some follow-through strength, towards reclaiming the 1.2600 round figure, looks like a distinct possibility.
Technical levels to watch
-
14:06
Germany Current Account n.s.a. up to €22.6B in February from previous €16.2B
-
14:00
Russia Central Bank Reserves $ rose from previous $593.9B to $600.8B
-
13:50
Breaking: Gold rises above $2,040 to highest since March 2022 after US data
Gold price rose more than $10 following the release of the March US Produce Price Index that came in below expectations and an increase in Initial Jobless Claims, triggering a dollar sell-off. XAU/USD jumped from below $2,030/oz to $2,040, the highest level since March 2022.
-
13:47
USD/CAD drops to nearly two-month low, bears flirt with 200-day SMA below 1.3400
- USD/CAD remains under some selling pressure for the fourth successive day on Thursday.
- Expectations for an imminent Fed rate-hike pause weigh on the USD and exert pressure.
- A modest pullback in Oil prices undermines the Loonie and helps limit any further losses.
The USD/CAD pair continues to drift lower for the fourth successive day on Thursday and drops to a nearly two-month low heading into the North American session. The pair is currently placed just below the 1.3400 mark, with bearish now awaiting a subsequent breakthrough the very important 200-day Simple Moving Average (SMA) before placing fresh bets.
The US Dollar (USD) selling remains unabated for the third straight day amid expectations that the Federal Reserve (Fed) is nearly done with its rate-hiking cycle and turns out to be a key factor exerting pressure on the USD/CAD pair. In fact, the markets now seem convinced that the US central bank will pause its monetary tightening after hiking one last time next month and the bets were reaffirmed by the softer-than-expected US Producer Price Index (PPI) figures released this Thursday.
According to the data published by the US Bureau of Labor Statistics, the US PPI declined to the 2.7% YoY rate in March from 4.9% previous (revised down from 4.6%). The annual Core PPI, meanwhile, fell to 3.4% during the reported period from 4.5%, matching analysts' estimate. On a monthly basis, the PPI and the Core PPI came in at -0.5% and -0.1%, respectively. This lifted hopes that disinflation is progressing smoothly and open the door for Fed to cut rates during the second half of the year.
Furthermore, the March FOMC minutes showed that several policymakers considered pausing interest rate increases after the failure of two regional banks. This, along with a generally positive tone around the equity markets, continues to weigh on the safe-haven Greenback and is seen dragging the USD/CAD pair lower. That said, retreating Crude Oil prices undermines the commodity-linked Loonie and assists spot prices to defend a technically significant 200-day SMA support, at least for now.
Technical levels to watch
-
13:46
EUR/USD Price Analysis: There is a minor hurdle at 1.1100
- EUR/USD advances further and records a new 2023 high.
- Extra upside could retest the round level at 1.1100 next.
EUR/USD keeps the bullish bias well in place and climbs to the 1.1040/50 on Thursday, or new YTD peaks.
The likelihood of extra advances appears favoured for the time being. Against that, the immediate target now appears at the round level at 1.1100 seconded by the weekly high at 1.1184 (March 21 2022).
Looking at the longer run, the constructive view remains unchanged while above the 200-day SMA, today at 1.0364.
EUR/USD daily chart
-
13:33
US: Annual PPI declines to 2.7% in March vs. 3% expected
- Annual producer inflation in the US declined sharply in March.
- US Dollar Index continues to push lower toward 101.00.
The Producer Price Index (PPI) for final demand in the US declined to 2.7% on a yearly basis in March from 4.9% in February (revised from 4.6%), the data published by the US Bureau of Labor Statistics revealed on Thursday. This reading came in lower than the market expectation of 3%.
The annual Core PPI dropped to 3.4% in the same period from 4.5%, matching analysts' estimate. On a monthly basis, the PPI and the Core PPI came in at -0.5% and -0.1%, respectively.
Market reaction
The US Dollar came under renewed selling pressure after this report and the US Dollar Index was last seen losing 0.35% on the day at 101.17.
-
13:33
US: Weekly Initial Jobless Claims rise to 239K vs. 232K expected
- Initial Jobless Claims in the US increased by 11,000 in the week ending April 8, to highest since January 2022.
- Continuing Jobless Claims decrease by 13,000 in the week ending April 1.
- US Dollar Index tumbled to the lowest since early February after US data.
There were 239,000 initial jobless claims in the week ending April 8, the weekly data published by the US Department of Labor (DOL) showed on Thursday. This print followed the previous week's unrevised print of 228,000 and came in above the market expectation of 232,000. It is the highest level since January 15, 2022.
"The 4-week moving average was 240,000, an increase of 2,250 from the previous week's unrevised average of 237,750. This is the highest level for this average since November 20, 2021 when it was 249,250", the DOL said.
Continuing Claims decline by 13,000 in the week ended April 1 to 1.810 million, above the 1.814 million of market consensus.
"The 4-week moving average was 1,813,500, an increase of 9,500 from the previous week's unrevised average of 1,804,000. This is the highest level for this average since November 13, 2021 when it was 2,007,000," the DOL noted.
Market reaction
The US Dollar Index tumbled to fresh monthly lows, approaching 101.00, after claims and also alongside lower-than-expected inflation data.
-
13:31
United States Continuing Jobless Claims came in at 1.81M, below expectations (1.814M) in March 31
-
13:31
United States Producer Price Index (YoY) below expectations (3%) in March: Actual (2.7%)
-
13:31
United States Producer Price Index ex Food & Energy (MoM) came in at -0.1% below forecasts (0.2%) in March
-
13:30
United States Initial Jobless Claims registered at 239K above expectations (232K) in April 7
-
13:30
United States Producer Price Index (MoM) came in at -0.5%, below expectations (0%) in March
-
13:30
United States Producer Price Index ex Food & Energy (YoY) in line with expectations (3.4%) in March
-
13:30
United States Initial Jobless Claims 4-week average rose from previous 237.75K to 240K in April 7
-
12:45
OPEC: World oil demand to rise by 2.32 million bpd in 2023
In its monthly report published on Thursday, the Organization of the Petroleum Exporting Countries (OPEC) said that it left the global oil demand growth forecast for 2023 unchanged at 2.32 million barrels per day, as reported by Reuters.
Additional takeaways
"China’s oil demand to rise by 760,000 bpd in 2023 (up from 710,000 bpd prev. forecast)."
"In summer oil market outlook, OECD inventories have been building in recent months, oil product balances are less tight than at the same time a year ago."
"Any economic weakness from rate hikes could weigh on US summer fuel demand, demand outlook for OECD europe forecast to remain challenged."
"Recent reopening of China has still not been sufficient to reverse declining trend in global refinery intakes."
"OPEC oil output fell by 86,000 bpd in March to 28.80 million bpd."
Market reaction
Crude oil prices showed no immediate reaction to this report and the barrel of West Texas Intermediate (WTI) was last seen posting small daily losses at around $83.
-
12:25
USD Index Price Analysis: Further losses exposes a drop to the 2023 low
- DXY gathers further downside traction and drops to 101.20.
- Extra decline now targets the 2023 low near 100.80.
DXY loses ground for the third session in a row and slips back to the area of 2-month lows around 101.20 on Thursday.
The loss of the 101.00 support could accelerate losses to the 2023 low at 100.81(February 2) in the relatively short-term horizon.
Looking at the broader picture, while below the 200-day SMA, today at 106.39, the outlook for the index is expected to remain negative.
DXY daily chart
-
12:10
Indonesia: Consumer Confidence remains strong – UOB
Economist Enrico Tanuwidjaja and Junior Economist Agus Santoso at UOB Group comment on the recently published Consumer Confidence gauge in Indonesia.
Key Takeaways
“Consumer Confidence Index (CCI) rose to 123.3 in Mar from 122.4 in Feb and only 5.6 points from its highest level of 128.9 in May 2022.”
“The improvement of CCI was driven by an increase in consumer confidence in current economic conditions and expectations for the economic outlook.”
“Increase in purchases of durable goods, especially by people with expenditure levels of more than IDR5 mn/month had contributed to the improvement of the CCI. Improvement in business activity, people mobility, and the 7.5% increase in average minimum wage were the supporting factors of higher domestic consumption in 1Q23.”
-
12:03
United Kingdom NIESR GDP Estimate (3M) registered at 0.1% above expectations (-0.1%) in March
-
11:57
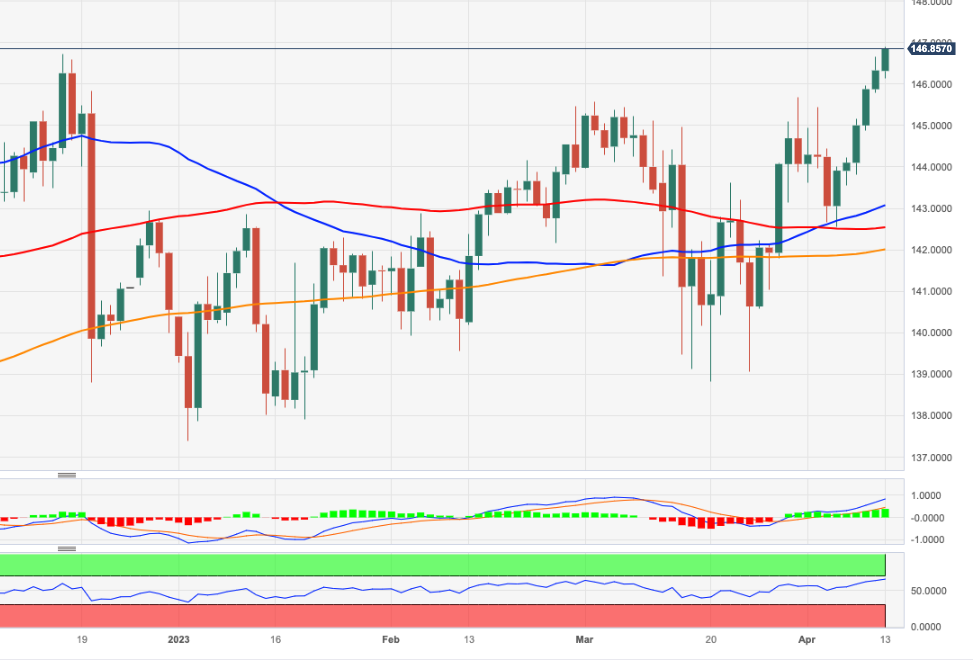
EUR/JPY Price Analysis: Bullish outlook remains unchanged
- EUR/JPY prints advances to new highs near the 147.00 hurdle.
- Further gains could now see the 2022 top revisited in the near term.
EUR/JPY maintains the needle-like recovery well in place and reaches fresh highs in the proximity of the 147.00 barrier on Thursday.
In light of the ongoing price action, further gains seem well on the cards for the time being. That said, the next target of note for the cross comes at the 2022 peak at 148.40 (October 21).
So far, further upside looks favoured while the cross trades above the 200-day SMA, today at 141.98.
EUR/JPY daily chart
-
11:52
China: Inflation lost further traction in March – UOB
Ho Woei Chen, Economist at UOB Group, assesses the release of the latest inflation figures in China.
Key Takeaways
“Headline inflation slowed to 0.7% y/y in Mar, the lowest since Sep 2021 when it was at the same level. However, core inflation (excluding food & energy) edged marginally higher to 0.7% y/y from 0.6% y/y in Feb.”
“Overall, headline and core inflation averaged 1.3% y/y and 0.8% y/y respectively in 1Q23. Given the weak price pressure to-date, we will revise our full-year headline inflation forecast lower to 2.0% from 2.8%. This will be similar to the inflation rate in 2022.”
“China’s Producer Price Index (PPI) declined y/y for the sixth consecutive month due to the high base of comparison but was flat on a sequential basis for the second straight month which may suggest the stabilization of the domestic economy.”
“PPI decline averaged -1.6% y/y in 1Q23. We retain our forecast that PPI will remain in deflation through 1H23 and average -1.0% in 2023 after rising 4.1% in 2022 and 8.1% in 2021.”
“The inflation data continues to indicate weak demand pressure in China that is consistent with PBoC’s accommodative monetary policy stance and calls for continued fiscal support.”
-
11:20
Gold Price Forecast: XAU/USD clings to gains near YTD peak, just below $2,030 level
- Gold price scales higher for the third successive day and moves back closer to the YTD peak.
- Expectations for an imminent Fed rate hike pause weigh on the US Dollar and lend support.
- Looming recession risks provide an additional boost to the safe-haven metal and favour bulls.
Gold price gains positive traction for the third successive day on Thursday and extends its steady intraday ascent through the first half of the European session. The XAU/USD currently trades around the $2,030 region, just below the YTD peak touched last week and seems poised to build on its recent strong gains recorded over the past month or so.
Bets for rate-hike pause by Federal Reserve benefit Gold price
The latest consumer inflation figures from the United States (USD) released on Wednesday reaffirmed market expectations that the Federal Reserve (Fed) may soon be finished raising interest rates. Adding to this, the March Federal Open Market Committee (FOMC) showed that several policymakers considered pausing interest rate increases after the failure of two regional banks. This leads to a further decline in the US Treasury bond yields and is seen as a key factor benefitting the non-yielding Gold price.
Weaker US Dollar further underpins Gold price
Meanwhile, growing acceptance that the Fed will pause its monetary tightening after hiking one last time next month and possibly start cutting rates during the second half of the year continues to weigh on the US Dollar (USD). In fact, the USD Index, which tracks the Greenback against a basket of currencies, drops to its lowest level since early February. This, along with worries about a deeper global economic downturn, contributes to the bid tone surrounding the US Dollar-denominated Gold price.
Looming recession risk contributes to the positive move
It is worth recalling that the International Monetary Fund (IMF) trimmed its 2023 global growth outlook on Tuesday, citing the impact of higher interest rates. Furthermore, the mixed Chinese trade data released earlier this Thursday raises concerns that the post-COVID recovery in the world's second-largest economy is losing steam. This is seen as another factor driving flows towards the safe-haven Gold price and supports prospects for an extension of the recent well-established short-term bullish trajectory.
Traders now look to macroeconomic data from United States
The aforementioned fundamental backdrop suggests that the path of least resistance for the XAU/USD is to the upside and any meaningful dip could be seen as a buying opportunity. Market participants now look forward to the US economic docket, featuring the release of the Producer Price Index (PPI) and the usual Weekly Initial Jobless Claims. The data might influence the USD price dynamics and provide some impetus to Gold price later during the early North American session.
Gold price technical outlook
From a technical perspective, some follow-through buying beyond the $2,032 area, or the YTD peak, will be seen as a fresh trigger for bullish traders. The gold price might then accelerate the momentum towards the $2,048-$2,050 intermediate resistance en route to the all-time high, around the $2,070-$2,075 region.
On the flip side, the daily swing low, around the $2,014-$2,013 zone, could act as a support and protect the immediate downside. Any subsequent fall is likely to attract fresh buyers near the $2,000 psychological mark. This should help limit losses for Gold price near the $1,990-$1,980 horizontal support.
Key levels to watch
-
11:02
Ireland Consumer Price Index (MoM) dipped from previous 1.6% to 1.1% in March
-
11:01
Portugal Consumer Price Index (YoY) remains unchanged at 7.4% in March
-
11:01
Ireland HICP (YoY) declined to 7% in March from previous 8.1%
-
11:01
Ireland HICP (MoM) declined to 0.9% in March from previous 1.5%
-
11:01
Portugal Consumer Price Index (MoM) unchanged at 1.7% in March
-
11:01
US Dollar devaluation continues after US inflation data
- US Dollar has continued to weaken against its major rivals following Wednesday’s selloff.
- EUR/USD technical outlook shows that the pair has the potential to renew 2023 highs.
- US Dollar could have a hard time staging a steady rebound as markets eye a looser Fed policy.
The US Dollar (USD) has been struggling to shake off the selling pressure on Thursday after having registered heavy losses against its major rivals on Wednesday. March inflation data from the United States seems to be the primary driver behind the broad-based USD weakness with markets forecasting a strong probability of one or more Federal Reserve (Fed) rate cuts in the second half of the year.
The US Bureau of Labor Statistics (BLS) reported on Wednesday that Consumer Price Index (CPI) declined to 5% on a yearly basis in March from 6% in February. This reading came in below the market expectation of 5.2%. Furthermore, the Core CPI, which excludes volatile food and energy prices, rose by 0.4% on a monthly basis, down from a 0.5% increase recorded in February.
Daily digest market movers: US Dollar under pressure ahead of PPI data
- The CME Group FedWatch Tool's probability for one more 25 basis points Fed rate increase in May holds above 60%. However, markets see a bigger-than-90% chance that the Fed will lower its policy rate back to the range of 4.75%-5% by September even if it opts for a rate hike at the upcoming meeting.
- The US Dollar Index (DXY), which tracks the USD performance against a basket of six major currencies, touched its lowest level since early February below 101.50 after having lost 0.6% on Wednesday.
- Commenting on the inflation data, "the beginning of the end of rate hikes – or the beginning of the countdown toward slashing borrowing costs? That seems to be the message from markets, which are rushing forward to price the next moves of the Federal Reserve (Fed)," noted FXStreet analyst Yohay Elam. "The world's largest economy is experiencing a "process of disinflation" that is somewhat frustrating but is on the right track. Markets are buying it."
- San Francisco Federal Reserve Bank President Mary Daly said on Wednesday that the strength of the US economy and elevated inflation suggests that they have more work to do on rate hikes.
- The BLS will release the Producer Price Index (PPI) data later in the day, which is forecast to fall to 3% on a yearly basis in March from 4.6% in February.
- The US Department of Labor’s weekly Initial Jobless Claims will also be featured in the US economic docket.
- Earlier in the week, NY Fed’s latest consumer survey revealed that the one-year inflation expectation climbed to 4.7% in March from 4.2% in February.
- NY Fed President John Williams argued on Monday that the pace of Fed rate increases was not behind the issues surrounding the two collapsed banks back in March. On Tuesday, "we've gotten policy to a restrictive stance, now we need to watch the data on retail sales, CPI and others," Williams stated.
- The US Bureau of Labor Statistics reported on Friday, April 7, that Nonfarm Payrolls in the US rose by 236,000 in March, slightly below the market expectation of 240,000. February’s print of 311,000 got revised higher to 326,000 from 311,000.
- Wage inflation in the US, as measured by Average Hourly Earnings, declined to 4.2% on a yearly basis from 4.6% in February. The Unemployment Rate ticked down to 3.5% with the Labor Force Participation Rate improving to 62.6% from 62.5%.
Technical analysis: US Dollar eyes further losses vs Euro
EUR/USD registered strong gains on Wednesday and continued to push higher early Thursday, advancing to its highest level in over two months above 1.1000 in the process. The Relative Strength Index (RSI) indicator on the daily chart is yet to climb above 70, suggesting that the pair has more room on the upside before turning technically overbought.
1.1035 (2023 high) aligns as interim resistance before 1.1100 (psychological level, static level) and 1.1160 (static level from April 2022).
On the downside, a daily close below 1.1000 could discourage buyers and open the door for an extended downward correction toward 1.0900 (psychological level, static level), 1.0850 (20-day Simple Moving Average SMA)) and 1.0800 (psychological level, static level).
How does Fed’s policy impact US Dollar?
The US Federal Reserve (Fed) has two mandates: maximum employment and price stability. The Fed uses interest rates as the primary tool to reach its goals but has to find the right balance. If the Fed is concerned about inflation, it tightens its policy by raising the interest rate to increase the cost of borrowing and encourage saving. In that scenario, the US Dollar (USD) is likely to gain value due to decreasing money supply. On the other hand, the Fed could decide to loosen its policy via rate cuts if it’s concerned about a rising unemployment rate due to a slowdown in economic activity. Lower interest rates are likely to lead to a growth in investment and allow companies to hire more people. In that case, the USD is expected to lose value.
The Fed also uses quantitative tightening (QT) or quantitative easing (QE) to adjust the size of its balance sheet and steer the economy in the desired direction. QE refers to the Fed buying assets, such as government bonds, in the open market to spur growth and QT is exactly the opposite. QE is widely seen as a USD-negative central bank policy action and vice versa.
-
11:01
Ireland Consumer Price Index (YoY) declined to 7.7% in March from previous 8.5%
-
10:26
USD/JPY struggles for a firm direction, stuck in a range around 133.00 mark
- USD/JPY oscillates in a narrow trading band and is influenced by a combination of diverging forces.
- Bets for an imminent pause in the Fed’s rate-hiking cycle weigh on the USD and act as a headwind.
- The BoJ’s more dovish outlook caps gains for the JPY and limits any meaningful slide for the major.
The USD/JPY pair struggles for a firm intraday direction on Thursday and seesaws between tepid gains/minor losses through the first half of the European session. The pair is currently placed just above the 133.00 round-figure mark, nearly unchanged for the day, and is influenced by a combination of factors.
Growing worries about a deeper global economic downturn drive some haven flows towards the Japanese Yen (JPY), which, along with the prevalent US Dollar (USD) selling bias, act as a headwind for the USD/JPY pair. It is worth recalling that the International Monetary Fund (IMF) trimmed its 2023 global growth outlook on Tuesday, citing the impact of higher interest rates. Furthermore, the mixed Chinese trade data released earlier today adds to worries that the post-COVID recovery in the world's second-largest economy is losing steam.
Furthermore, growing acceptance that the Federal Reserve (Fed) is nearly done with its rate-hiking cycle leads to a further decline in the US Treasury bond yields. The resultant narrowing of the US-Japan rate differential is seen as another factor that benefits the JPY. Investors now seem convinced that the Fed will pause its monetary tightening after hiking one last time next month and the bets were reaffirmed by the softer US CPI report on Wednesday. This, in turn, drags the USD to its lowest level since early February and contributes to capping the USD/JPY pair.
That said, the Bank of Japan's (BoJ) dovish near-term outlook keeps a lid on any meaningful gains for the JPY and acts as a tailwind for the USD/JPY pair. This, in turn, might hold back bearish traders from placing aggressive bets and warrants some caution before confirming that the one-week-old uptrend has run its course. Market participants now look forward to the US economic docket, featuring the release of the Producer Price Index (PPI) and the usual Initial Weekly Jobless Claims, for short-term trading opportunities later during the early North American session.
Technical levels to watch
-
10:15
United Kingdom 10-y Bond Auction climbed from previous 3.495% to 3.592%
-
10:01
Eurozone Industrial Production increases by 1.5% MoM in February vs. 1.0% expected
Eurozone Industrial Production extends its uptrend in February, the official data showed on Wednesday, suggesting that the manufacturing sector recovery is holding ground.
Eurozone’s Industrial Output rose by 1.5% MoM, the Eurostats said in its latest publication, vs. 1.0% expected and 0.7% previous print.
On an annualized basis, the old continent’s Industrial Production arrived at 2.0% in February versus a 0.9% figure registered in January and 1.5% estimates.
FX implications
The shared currency failed to find any inspiration from the upbeat German industrial figures. At the time of writing, EUR/USD is trading at around 1.1010, gaining 0.21% on the day.
-
10:00
European Monetary Union Industrial Production w.d.a. (YoY) above forecasts (1.5%) in February: Actual (2%)
-
10:00
European Monetary Union Industrial Production s.a. (MoM) came in at 1.5%, above expectations (1%) in February
-
09:30
AUD/USD climbs to over one-week high, eyes 50/200 DMA confluence hurdle
- AUD/USD scales higher for the third straight day and touches over a one-week high.
- The upbeat Australian jobs data, along with the weaker USD, lend support to the pair.
- Expectations for an imminent Fed rate hike pause drag the USD to a two-month low.
The AUD/USD pair builds on this week's recovery from the 0.6620 area, or the monthly low, and gains positive traction for the third successive day on Thursday. The momentum lifts spot prices to over a one-week high, around the 0.6735 region during the first half of the European session and is sponsored by a combination of factors.
The Australian Dollar is drawing support from the upbeat domestic jobs data, which showed that the jobless rate stayed near a 50-year low level of 3.5% and the number of employed people rose by 53K in March, more than the 20K expected. The markets started pricing in the possibility of a 25 bps rate hike at the next Reserve Bank of Australia (RBA) meeting in May, which, along with the underlying bearish sentiment surrounding the US Dollar, provides a modest boost to the AUD/USD pair.
In fact, the USD Index, which tracks the Greenback against a basket of currencies, drops to its lowest level since early February amid growing acceptance that the Federal Reserve (Fed) is nearly done with its rate-hiking cycle. The bets were reaffirmed by the softer-than-expected US consumer inflation figures released on Wednesday, which lifted hopes disinflation is progressing smoothly and may even accelerate, potentially opening the door for the Fed to cut rates during the second half of the year.
Adding to this, the March FOMC meeting minutes showed that several policymakers considered pausing interest rate increases after the failure of two regional banks. This, in turn, keeps the US Treasury bond yields depressed and continues to weigh on the Greenback. This, to a larger extent, overshadows looming recession risks and remains supportive of the bid tone surrounding the AUD/USD pair, though worries about a slowdown in the Chinese economy could cap the Aussie.
From a technical perspective, bullish traders are likely to wait for sustained strength beyond the 0.6745 confluence, comprising the 200-day Simple Moving Average (SMA) and the 50-day SMA. This is closely followed by the 100-day SMA, which if cleared will be seen as a fresh trigger for bullish traders and set the stage for additional gains. Market participants now look to the US economic docket, featuring the Producer Price Index (PPI) and Weekly Jobless Claims, for some trading impetus.
Technical levels to watch
-
09:12
South Korea: BoK paused its tightening cycle in April – UOB
Economist at UOB Group Ho Woei Chen reviews the latest monetary policy meeting by the Bank of Korea (BoK).
Key Takeaways
“In line with consensus expectation, BOK maintained its rate pause in Apr as it kept its benchmark 7-day repo rate unchanged at 3.50% for the second consecutive month. The rate decision was unanimous unlike the previous meeting in Feb when one policy board member voted for a 25bps hike.”
“Similar to the Feb meeting, five board members continue to see the terminal interest rate at 3.75% while one member sees it more favourable for the terminal rate to be at the current 3.50%.”
“However, the case for a further rate hike has weakened and we continue to expect the BOK to remain on hold at 3.50% for the rest of 2023.”
“The BOK signals that there may be scope to further downgrade its growth forecast of 1.6% for this year (reviewed in Feb). It sees 2023 headline inflation to be consistent with the Feb forecast of 3.5% but core inflation may turn out to be higher than the Feb forecast of 3.0% and is expected at a level close to 3.0% by year-end.”
-
09:12
Forex Today: US Dollar on the back foot following CPI-inspired selloff
Here is what you need to know on Thursday, April 13:
The US Dollar is having a difficult time finding demand early Thursday after having suffered heavy losses against its major rivals on soft inflation figures on Wednesday. Eurostat will release Industrial Production data for February and the US economic docket will feature the US Department of Labor's weekly Initial Jobless Claims and the Producer Price Index figures for March.
The annual Consumer Price Index (CPI) in the US declined to 5% in March from 6% in February, compared to the market expectation of 5.2%. With the initial reaction, the 10-year US Treasury bond yield fell sharply and the US Dollar Index (DXY) broke below 102.00. The DXY stays below 101.50 early Thursday and the 10-year US T-bond yield seems to have stabilized at around 3.4%. Following Wednesday's choppy action in Wall Street, US stock index futures trade modestly higher in the European session.
The data from China showed on Thursday that the trade surplus narrowed to $89.19 billion in March from $116.8 billion in February. This reading came in much better than the market expectation for a surplus of $39.2 billion.
EUR/USD registered impressive gains on Wednesday and continued to stretch higher early Thursday. The pair was last seen trading at its highest level since early February, a few pips above 1.1000.
GBP/USD preserves its bullish momentum and trades above 1.2500. The pair stays within a touching distance of the multi-month top it set at 1.2527 on April 4.
The Australian Bureau of Statistics reported early Thursday that the Unemployment Rate remained unchanged at 3.5% in March with an Employment Change of +53K. Supported by the upbeat jobs report and trade figures from China, AUD/USD gathered bullish momentum and was last seen rising more than 0.5% on the day at around 0.6730.
The Bank of Canada (BoC) left its policy rate unchanged at 4.5% following its April meeting as expected. In the policy statement, the BoC reiterated that the Governing Council will continue to assess whether monetary policy is sufficiently restrictive, adding that they remain prepared to raise rates if needed. USD/CAD closed the third straight day in negative territory and continued to push lower on Thursday. The pair was last seen trading at its lowest level in over a month at around 1.3400.
Gold price surged higher with the immediate reaction to US inflation data on Wednesday but erased a large portion of its daily gains amid recovering US yields. XAU/USD seems to have regained its traction early Thursday and it was last seen trading in positive territory above $2,020.
Bitcoin registered small losses on Wednesday before stabilizing near $30,000 on Thursday. Ethereum gained more than 1% on Wednesday and edged slightly higher early Thursday. At the time of press, ETH/USD was up marginally on the day at $1,930.
-
09:08
EUR/USD extends the upside bias beyond 1.1000
- EUR/USD climbs to fresh monthly highs above 1.1000.
- Final CPI in Germany matched the preliminary readings in March.
- US Producer Prices, Initial Claims take centre stage later in the session.
Further upside motivates EUR/USD to trespass the key 1.1000 barrier and print new monthly highs on Thursday.
EUR/USD now targets the 2023 peak at 1.1032
EUR/USD advances for the third session in a row and continues to challenge the key 1.1000 neighbourhood so far on Thursday, always amidst the persistent weakness in the greenback and the generalized upbeat mood in the risk-linked space.
In the meantime, hawkish narrative from ECB policymakers continue to lend legs to the pair’s ongoing recovery against the backdrop of divided opinions regarding the size of the next interest rate hike at the May gathering.
In the docket, final inflation figures in Germany showed the CPI rose 7.4% in the year to March and 0.8% vs. the previous month. Later in the session, EMU Industrial Production is due, while weekly Claims and Producer Prices will be in the limelight in the US calendar.
What to look for around EUR
EUR/USD advances beyond the 1.1000 and records new monthly peaks on Thursday.
In the meantime, price action around the single currency should continue to closely follow dollar dynamics, as well as the incipient Fed-ECB divergence when it comes to the banks’ intentions regarding the potential next moves in interest rates.
Moving forward, hawkish ECB-speak continue to favour further rate hikes, although this view appears in contrast to some loss of momentum in economic fundamentals in the region.
Key events in the euro area this week: Germany Final Inflation Rate, EMU Industrial Production (Thursday).
Eminent issues on the back boiler: Continuation, or not, of the ECB hiking cycle. Impact of the Russia-Ukraine war on the growth prospects and inflation outlook in the region. Risks of inflation becoming entrenched.
EUR/USD levels to watch
So far, the pair is gaining 0.26% at 1.1020 and a break above 1.1032 (2023 high February 2) would target 1.1100 (round level) en route to 1.1184 (weekly high March 21 2022). On the flip side, the next support comes at 1.0788 (monthly low April 3) followed by 1.0750 (55-day SMA) and finally 1.0712 (low March 24).
-
09:00
Italy Industrial Output s.a. (MoM) below forecasts (0.5%) in February: Actual (-0.2%)
-
09:00
Italy Industrial Output w.d.a (YoY) came in at -2.3%, below expectations (-0.2%) in February
-
08:45
USD/CNH: No changes to the side-lined theme so far – UOB
USD/CNH remains tilted to the continuation of the 6.8500-6.9200 range in the near term, comment UOB Group’s Economist Lee Sue Ann and Markets Strategist Quek Ser Leang.
Key Quotes
24-hour view: “Our expectations for USD to test 6.9050 yesterday did not materialize as it traded in a range of 6.8748/6.8942 before settling at 6.8824 (-0.17%). Downward momentum has improved a tad and USD is likely to edge lower today. As downward momentum is mild for now, any decline is unlikely to challenge the major support at 6.8500 (there is another support at 6.8650). Resistance is at 6.8840, followed by 6.8940.”
Next 1-3 weeks: “Our most recent narrative form Monday (10 Apr, spot at 6.8800) is still valid. As highlighted, the price actions of recent days appear to be consolidative and USD is likely to trade sideways between 6.8500 and 6.9200 for now.”
-
08:42
Natural Gas Futures: A sustained decline is not favoured
Open interest in natural gas futures markets noted traders scaled back their open interest positions for the fourth straight session on Wednesday, now by around 22.6K contracts. Volume, instead, resumed the uptrend and went up by nearly 48K contracts.
Natural Gas remains well supported around $2.00
Wednesday’s daily retracement in prices of the natural gas was in tandem with rising open interest, which removes strength from further retracement in the very near term. In the meantime, the 2023 low near $1.97 per MMBtu continues to emerge as a solid contention for the time being.
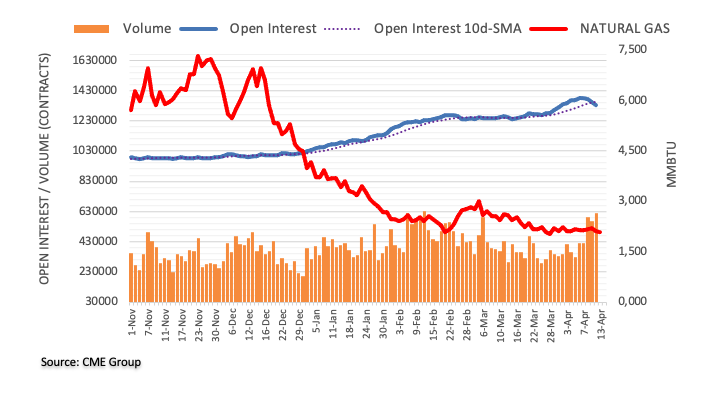
-
08:35
USD/JPY: Upside momentum seems to be losing traction – UOB
According to UOB Group’s Economist Lee Sue Ann and Markets Strategist Quek Ser Leang, the upward bias in USD/JPY seems to be fading.
Key Quotes
24-hour view: “We highlighted yesterday that ‘while USD is likely to trade with an upward bias, it is unlikely to break the major resistance at 134.40 today’. We added, “Support is at 133.20, followed by 132.70”. USD rose to 134.04 in Asian trade but in NY trade, it plummeted to a low of 132.72. Upward pressure has eased and the current movement is likely part of a consolidation phase. Today, we expect USD to trade in a range of 132.60/133.70.”
Next 1-3 weeks: “We have expected a stronger USD since the start of the week. After USD rose, we highlighted on Tuesday (11 Apr, spot at 133.30) that USD could consolidate for a couple of days before rising to 134.40. Yesterday (13 Apr), USD eked out a fresh high of 134.04 and then retreated. Upward momentum is beginning to fade and the odds of USD rising to 134.40 are diminishing. However, only a break of 132.20 (no change in ‘strong support’ level) would indicate that USD is not strengthening further.”
-
08:32
USD/CHF slips below mid-0.8900s, lowest since June 2021 amid softer USD/recession fears
- USD/CHF drifts lower for the third straight day and drops to its lowest level since June 2021.
- Expectations for an imminent Fed rate-hike pause weigh on the USD and exert some pressure.
- Looming recession fears benefit the safe-haven CHF and contribute to the ongoing downfall.
The USD/CHF pair remains under some selling pressure for the third successive day on Thursday and drops to its lowest level since June 2021 during the early part of the European session.
The US Dollar (USD) languishes near the monthly low amid expectations that the Federal Reserve (Fed) is nearing the end of its rate-hiking cycle and turns out to be a key factor weighing on the USD/CHF pair. In fact, the markets now seem convinced that the US central bank will be done with its monetary tightening after hiking one last time next month and the bets were reaffirmed by the softer-than-expected US consumer inflation figures released on Wednesday.
The crucial US CPI report lifted hopes that disinflation is progressing smoothly and may even accelerate, potentially opening the door for the Fed to cut rates during the second half of the year. Adding to this, the March FOMC meeting minutes showed that several policymakers considered pausing interest rate increases after the failure of two regional banks. This keeps the US Treasury bond yields depressed and continues to exert pressure on the Greenback.
The Fed officials, meanwhile, remain wary of a mild US recession this year in the wake of a banking crisis and as high-interest rates continue to hinder economic growth. The outlook tempers investors' appetite for riskier assets, which is evident from the prevalent cautious mood around the equity markets and benefits the safe-haven Swiss Franc (CHF). This, in turn, is seen as another factor that contributes to the offered tone surrounding the USD/CHF pair.
That said, the Relative Strength Index (RSI) on hourly charts is flashing oversold conditions and might hold back traders from placing fresh bearish bets around the USD/CHF pair. Nevertheless, the fundamental backdrop suggests that the path of least resistance for spot prices is to the downside. Market participants now look to the US economic docket, featuring the Producer Price Index (PPI) and the Weekly Jobless Claims data, for a fresh trading impetus.
Technical levels to watch
-
08:32
ECB: Debate on next rate move in May is converging on a 25 bps hike – Reuters
Citing five sources with direct knowledge of the discussion, Reuters reported on Thursday, European Central Bank (ECB) policymakers are converging on a 25 basis points (bps) interest rate hike in May.
Additional takeaways
“Though the debate is not over, with one small group still making case for a 50 bps hike in May; another small group advocating no change.”
“The baseline in the ECB’s March economic projections is seen as largely intact.”
“The peak in rates is now in sight and that this "last mile" is safer to navigate in smaller steps.”
“Another argument put forward for gradualism was that the ECB's deposit rate, now at 3%, is at a level which restricts growth.”
Market reaction
At the time of writing, EUR/USD is keeping its range play intact near 1.1000, up 0.05% on the day.
-
08:06
GBP/JPY consolidates its recent gains to YTD peak, holds steady below mid-166.00s
- GBP/JPY edges higher for the sixth straight day, albeit lacks follow-through buying.
- The mixed UK macro data is holding back the GBP bulls from placing aggressive bets.
- Looming recession risks benefit the JPY and contribute to capping gains for the cross.
The GBP/JPY cross trades with a mild positive bias for the sixth successive day on Thursday and is currently placed around the 166.25-166.30 region, just a few pips below the YTD peak touched the previous day.
The underlying bearish sentiment surrounding the US Dollar (USD) benefits the British Pound, which, in turn, is seen acting as a tailwind for the GBP/JPY cross. That said, a combination of factors is holding back traders from placing fresh bullish bets and keeping a lid on any meaningful upside for the cross, at least for the time being.
The softer UK macro releases come on the back of the recent mixed signals from the Bank of England (BoE) policymakers over future rate hikes and act as a headwind for the Sterling Pound. In fact, the UK Office for National Statistics reported that the economic growth remained flat in February as compared to the 0.1% rise estimated.
Adding to this, the UK Manufacturing and Industrial Production figures missed market expectations, which overshadows the better-than-expected Trade Balance data. This, along with looming recession fears, drives some haven flows towards the Japanese Yen (JPY) and further contributes to capping gains for the GBP/JPY cross.
Hence, it will be prudent to wait for strong follow-through buying before traders start positioning for any further near-term appreciating move for the GBP/JPY cross. The recent bounce from a technically significant 200-day Simple Moving Average (SMA), however, favours bulls and supports prospects for additional near-term gains.
Technical levels to watch
-
07:56
Gold Price Forecast: XAU/USD grinds higher past $2,000 key support – Confluence Detector
- Gold price cheers upside break of $2,000 confluence around 13-month high marked in the last week.
- Downbeat US inflation, unimpressive Fed Minutes join recession woes to underpin XAU/USD run-up.
- Gold price needs an extra boost from risk catalysts, additional US inflation clues to challenge a record high of $2,075.
Gold price (XAU/USD) picks up bids to refresh intraday high around $2,020 as it prints a three-day winning streak after crossing the key $2,000 hurdle, now support, amid the downbeat US Dollar.
US Dollar Index (DXY) appears all set for the consecutive fifth weekly loss on downbeat prints of the US inflation data, per the Consumer Price Index (CPI). Also exerting downside pressure on the DXY, as well as fueling the Gold price, are Federal Reserve (Fed) officials’ signals of easy monetary policy ahead, via the FOMC Minutes and recent public speeches. Elsewhere, optimism surrounding China’s economic growth, despite recently mixed inflation and trade numbers, joins the recession woes in the West, to also propel the XAU/USD prices.
That said, the market’s latest inaction amid a light calendar and repetition of the comments from policymakers seem to restrict immediate Gold price moves. However, more proof of the easing of US inflation and Fed policy pivot are eyed for immediate directions.
Also read: Gold Price Forecast: XAU/USD poised to test $2,043 resistance on dovish Federal Reserve outlook
Gold Price: Key levels to watch
As per our Technical Confluence Indicator, the Gold price manages to stay firmer past the $2,000 key support comprising the Fibonacci 38.2% on one-week, Pivot Point one-day S1 and previous daily low, not to forget the psychological mark.
Not only a clear upside break of the $2,000 mark but the XAU/USD’s sustained trading beyond the immediate resistances, now supports, also keeps the Gold buyers hopeful.
Among them is the Fibonacci 23.6% in one-week, around $2,014, followed by $2,010 support confluence including the previous monthly high and SMA10 on four-hour (4H).
With this, the Gold price appears all set to challenge the $2,030 hurdle, encompassing Pivot Point one-day R1.
Following that, the previous weekly high near $2,035 and Pivot Point one-week R1 around $2,045 can prod the XAU/USD bulls before directing them to the previous yearly high of $2,070 and then to the record high marked in 2020 around $2,075.
Here is how it looks on the tool

About Technical Confluences Detector
The TCD (Technical Confluences Detector) is a tool to locate and point out those price levels where there is a congestion of indicators, moving averages, Fibonacci levels, Pivot Points, etc. If you are a short-term trader, you will find entry points for counter-trend strategies and hunt a few points at a time. If you are a medium-to-long-term trader, this tool will allow you to know in advance the price levels where a medium-to-long-term trend may stop and rest, where to unwind positions, or where to increase your position size.
-
07:24
FX option expiries for Apr 13 NY cut
FX option expiries for Apr 13 NY cut at 10:00 Eastern Time, via DTCC, can be found below.
- EUR/USD: EUR amounts
- 1.0800 3.4b
- 1.0850 1.7b
- 1.0885-90 1.2b
- 1.0900 6.3b
- 1.0950 1.5b
- 1.1000 3.1b
- GBP/USD: GBP amounts
- 1.2360-80 1.1b
- USD/JPY: USD amounts
- 132.00-05 1.3b
- 132.20-25 663m
- 133.00 1.2b
- 134.00-05 1.0b
- AUD/USD: AUD amounts
- 0.6625-30 1.7b
- 0.6645-50 1.7b
- USD/CAD: USD amounts
- 1.3525 1b
- EUR/GBP: EUR amounts
- 0.8795-10 595m
-
07:18
UK’s Hunt: Economic outlook is looking brighter than expected
Commenting on the February GDP data, UK Finance Minister Jeremy Hunt said, “economic outlook is looking brighter than expected.”
“We are set to avoid recession thanks to steps we have taken,” Hunt added.
Market reaction
GBP/USD is keeping its range at around 1.2485 on the above comments, little impressed by the UK data flow.
-
07:13
Crude Oil Futures: Door open to extra upside
CME Group’s flash data for crude oil future markets noted traders reversed three consecutive daily pullbacks and increased by around 22.4K contracts on Wednesday. In the same direction, volume rose for the third session in a row, this time by almost 186K contracts.
WTI: Further gains likely above the 200-day SMA
Prices of the WTI kept the bullish stance unchanged on Wednesday amidst rising open interest and volume. That said, extra gains look favoured in the very near term and should pick up extra pace once the 200-day SMA at $83.13 is cleared in a convincing fashion.
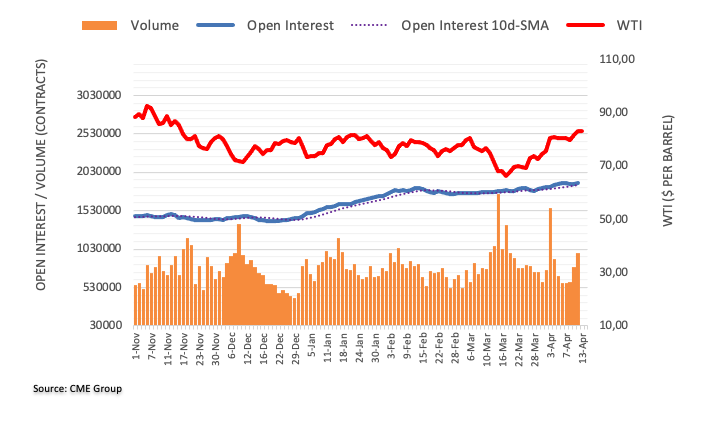
-
07:13
USD/CAD finds demand below 1.3430 as hawkish Fed bets remain solid despite US CPI cools
- USD/CAD has gauged buying interest after dropping below 1.3430 amid a recovery in the USD Index.
- Hawkish Federal Reserve bets despite cooling US Inflation have provided a cushion to the US Dollar.
- Bank of Canada Governor kept policy rates steady at 4.5% citing that the current monetary policy is restrictive enough to tame sticky inflation.
- USD/CAD is declining towards the horizontal resistance plotted from April 04 low at 1.3406.
The USD/CAD pair has sensed buying interest after defending the crucial support of 1.3430 in the early European session. The Loonie asset is looking to extend its recovery above the immediate resistance of 1.3437. The major has grabbed the attention of responsive buyers after a recovery move in the US Dollar Index (DXY). The USD Index has rebounded after building a firm base around weekly lows at 101.44 as hawkish Federal Reserve (Fed) bets are full of strength despite softening of United States inflation as expected by the market participants.
S&P500 futures have turned positive after negating bearish cues inspired by renewed fears of the US recession, portraying a recovery in the risk appetite of the market participants. US equities faces pressure on Wednesday and settled weak after Federal Open Market Committee (FOMC) minutes confirmed that the economy will face a mild recession later this year. It is highly likely that tight credit conditions by US commercial banks after the banking collapse and higher rates from the Federal Reserve will push the economy into recession.
Meanwhile, the demand for US Treasury bonds has improved on expectations that a slowdown in the US economy would force the Federal Reserve to consider rate cuts later. The yields offered on 10-year US Treasury bonds have slipped to near 3.41%.
Scrutiny of US Inflation report shows a different story
The US Dollar remained a major victim on Wednesday after US Consumer Price Index (CPI) softens more than expected and Fed policymakers anticipated a mild recession ahead, which would propel a dial back of quantitative easing. However, a scrutiny of US inflation is telling a different story. The US CPI report indicates that headline inflation has softened more than expectations to 5.0% vs. the former release of 6.0%. A deceleration in headline inflation was the outcome of weaker gasoline prices. The investing community is aware of the fact that oil prices have significantly rebounded in April after a surprise announcement of production cuts by OPEC+, which could spoil Gold Bull’s party in the coming months.
Speaking on the headline inflation, core CPI has rebounded to 5.6% as expected vs. 5.5% the former release as rent prices remained persistent. This indicates that core inflation could remain extremely stubborn ahead.
It would be early to consider a pause in the Quantitative tightening spell as inflation is still far from the desired target of 2%. San Francisco Fed Bank President Mary Daly said late Wednesday, "There's a lot more in the pipeline of monetary policy tightening," as reported by Reuters. However, she refrained from forecasting the end of the tightening cycle.
Bank of Canada stays with a neutral policy stance
The Canadian Dollar remained firm on Wednesday against the US Dollar despite the Bank of Canada (BoC) keeping its policy rates steady at 4.5%. Bank of Canada Governor Tiff Macklem believes that the current monetary policy is restrictive enough to tame sticky inflation.
The Bank of Canada also ignored upbeat Employment data, released last week, and maintained the status quo, in spite of the fact that upbeat demand for labor could fuel labor earnings and assures a recovery in Canada’s inflation. Analysts at TD Securities expect “The Bank of Canada’s interest rate to remain at 4.50% for all of 2023, as we do expect growth to slow markedly in Q2. That said, if the expected softening in the labor market does not emerge, the Bank of Canada may have little choice but to tighten it again. With markets likely to give the Bank of Canada a pass in June, we see more risk for rate hikes in the July and September meetings.”
USD/CAD technical outlook
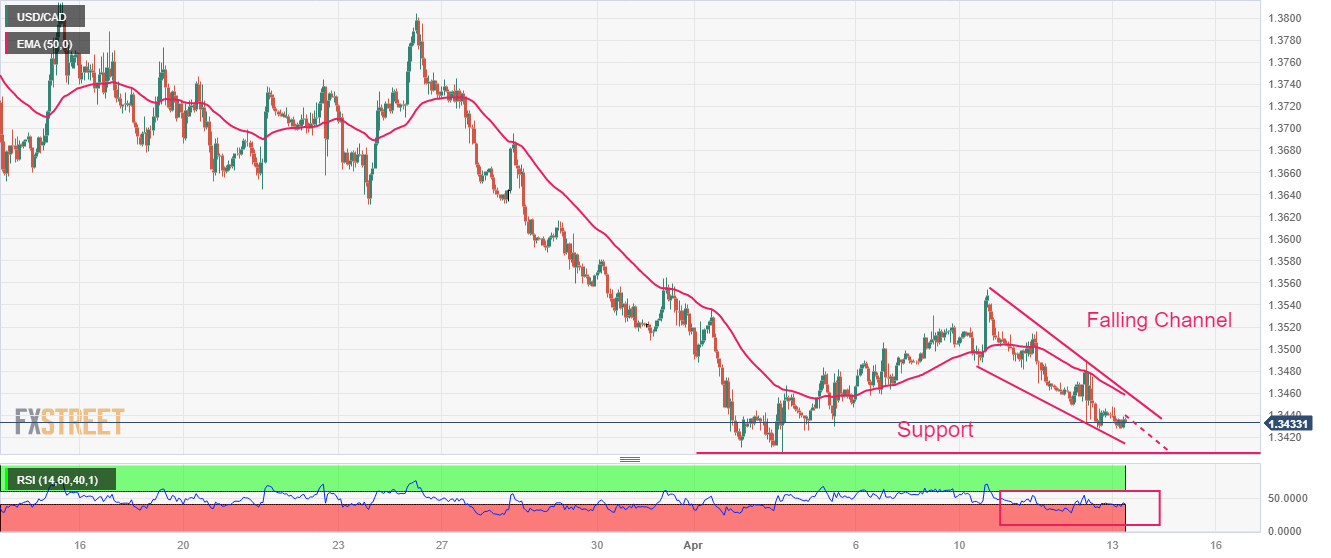
USD/CAD is auctioning in a Falling Channel chart pattern on an hourly scale in which every pullback is capitalized by investors as a selling opportunity. The Loonie asset is declining towards the horizontal resistance plotted from April 04 low at 1.3406.
The 50-period Exponential Moving Average (EMA) at 1.3460 is barricading US Dollar bulls from any kind of recovery.
A slippage of the Relative Strength Index (RSI) (14) into the bearish range of 20.00-40.00 will trigger the downside momentum.
-
07:08
GBP/USD: Down a few pips below 1.2500 on unimpressive UK statistics
- GBP/USD takes offers to refresh intraday low, extends early-day pullback from one-week high.
- UK GDP growth drops to 0.0%, Industrial Production MoM also eased in February.
- US Dollar traces yields to bounce off 10-week-old support.
- More US inflation clues, central bank talks and Brexit updates eyed for fresh impulse.
GBP/USD renews its intraday low near 1.2480 as the UK’s data dump for February marks mostly downbeat numbers during early Thursday in London. Adding strength to the Cable pair’s pullback moves could be the US Dollar’s corrective bounce amid a sluggish session and a light calendar.
UK’s February 2023 Gross Domestic Product (GDP) eased to 0.0% versus 0.1% expected and 0.4% prior while the Industrial Production improved on YoY but declined on MoM during the stated month. Further details suggest an increase in the UK’s trade deficit and no change in the Index of Services.
Also read: UK GDP arrives at 0% MoM in February vs. 0.1% expected
Apart from the UK data, the chatters surrounding no imminent UK-US trade deal, despite Rishi Sunak’s ability to strike a Brexit agreement with the European Union, seem to exert downside pressure on the GBP/USD prices. Furthermore, fears of easing inflation, as signaled by Bank of England (BoE) Governor Andrew Bailey, also allow the quote to pare recent gains.
On the other hand, the US Dollar Index (DXY) bounces off a 2.5-month-old support line, up 0.07% near 101.60 by the press time. With this, the greenback’s gauge versus six major currencies traces the Treasury bond yields. That said, the US 10-year and two-year Treasury bond yields print mild gains around 3.41% and 3.98% respectively. That said, the US 10-year Treasury bond yields snapped a three-day uptrend with mild losses to around 3.40% while the two-year counterpart also eased to 3.96% by marking the first daily negative in five.
It’s worth mentioning that the DXY dropped the most in three weeks the previous amid downbeat US inflation data and the Federal Reserve (Fed) officials’ downbeat comments and uninspiring FOMC Minute.
Having witnessed the initial reaction to the UK data dump for February, the GBP/USD pair traders may witness a lackluster day ahead amid an absence of major data/events, which in turn highlights risk catalysts as the factors to watch for clear directions. Even so, today’s US Producer Price Index (PPI) for March and Friday’s preliminary readings of the Michigan Consumer Sentiment Index for April can entertain the Cable pair traders.
Technical analysis
The latest pullback remains elusive unless GBP/USD slips beneath the previous key horizontal resistance comprising levels marked since December 2022, around 1.2450-45. Even so, a three-week-old ascending support line, near 1.2385 at the latest, can test the intraday bears. Alternatively, May 2022 top, surrounding 1.2665, remains on the Cable buyer’s radar.
-
07:03
UK Manufacturing Production arrives at 0% MoM in February vs. 0.2% expected
The industrial sector activity showed no growth in February, the latest UK industrial and manufacturing production data published by Office for National Statistics (ONS) showed on Thursday.
Manufacturing output arrived at 0% MoM in February versus 0.2% expected and -0.1% seen in January while total industrial output came in at -0.2% MoM vs. 0.2% expected and -0.5% last.
On an annualized basis, the UK Manufacturing Production data came in at -2.4% in February, beating expectations of -4.7%. Total industrial output dropped by 3.1% in the second month of the year against -3.7% expected and the previous print of -3.2%.
Separately, the UK goods trade balance numbers were published, which arrived at GBP-17.534 billion in February versus GBP-17.00 billion expectations and GBP-16.093 billion last. The total trade balance (non-EU) came in at GBP-6.519 billion in February versus GBP-6.574 billion previous.
Related reads
- UK GDP arrives at 0% MoM in February vs. 0.1% expected
- GBP/USD: Down a few pips below 1.2500 on unimpressive UK statistics
-
07:02
United Kingdom Total Trade Balance rose from previous £-5.861B to £-4.805B in February
-
07:02
United Kingdom Trade Balance; non-EU registered at £-6.519B above expectations (£-7.243B) in February
-
07:02
United Kingdom Industrial Production (YoY) came in at -3.1%, above forecasts (-3.7%) in February
-
07:01
United Kingdom Goods Trade Balance below forecasts (£-17B) in February: Actual (£-17.534B)
-
07:01
United Kingdom Manufacturing Production (MoM) registered at 0%, below expectations (0.2%) in February
-
07:01
UK GDP arrives at 0% MoM in February vs. 0.1% expected
- UK GDP arrived at 0% MoM in February vs. 0.1% expected.
- GBP/USD holds lower ground below 1.2500 on downbeat UK GDP.
The UK Gross Domestic Product (GDP) monthly release for February, reported this Thursday, showed that the British economy stagnated at 0% in February, compared with 0.1% expectations and a 0.3% prior reading.
Meanwhile, the Index of services (February) came in at 0.1% 3M/3M vs. -0.2% estimate and 0% previous.
Market reaction
The Cable wiped out minor gains on the downbeat UK GDP data. At the press time, the spot is neutral on the day at 1.2480, having consolidated below 1.2500 during the Asian session.
About UK GDP
The Gross Domestic Product released by the National Statistics is a measure of the total value of all goods and services produced by the UK. The GDP is considered a broad measure of the UK economic activity. Generally speaking, a rising trend has a positive effect on the GBP, while a falling trend is seen as negative (or bearish).
-
07:01
United Kingdom Index of Services (3M/3M) above forecasts (-0.2%) in February: Actual (0.1%)
-
07:01
United Kingdom Manufacturing Production (YoY) above expectations (-4.7%) in February: Actual (-2.4%)
-
07:01
Germany Harmonized Index of Consumer Prices (MoM) in line with forecasts (1.1%) in March
-
07:01
Germany Harmonized Index of Consumer Prices (YoY) in line with forecasts (7.8%) in March
-
07:01
Germany Consumer Price Index (YoY) meets expectations (7.4%) in March
-
07:00
Germany Consumer Price Index (MoM) in line with forecasts (0.8%) in March
-
07:00
United Kingdom Industrial Production (MoM) below forecasts (0.2%) in February: Actual (-0.2%)
-
07:00
United Kingdom Gross Domestic Product (MoM) came in at 0% below forecasts (0.1%) in February
-
06:45
EUR/USD Price Analysis: Bullish bias remains intact despite pullback targeting 1.0970
- EUR/USD grinds near intraday low after refreshing 2.5-month high.
- Overbought RSI backs Euro pair’s pullback from three-week-old resistance line.
- Previous weekly top restricts immediate downside, 1.0860 is the key support.
EUR/USD bulls take a breather around 1.0990 amid the initial hours of the European session on Thursday, after refreshing a 10-week top earlier in the day.
In doing so, the Euro pair takes a U-turn from an ascending resistance line from March 23 while justifying the overbought RSI conditions. However, bullish MACD signals and multiple levels towards the south keep the quote buyers hopeful.
That said, the previous weekly top surrounding 1.0970 appears immediate support for the EUR/USD bears to watch during further downside.
However, the weekly support line and the 200-Hour Moving Average (HMA), respectively near 1.0950 and 1.0910, could challenge the EUR/USD sellers afterward.
In a case where the EUR/USD bears dominate past 1.0910, the 1.0900 round figure and an upward-sloping support line from March 24, close to 1.0860 by the press time, will be the last defense of the pair buyers.
On the flip side, recovery moves need to cross the aforementioned three-week-long resistance line, near 1.1010 at the latest, to recall the EUR/USD bulls.
Even so, the yearly high marked in February around 1.1035 could challenge the Euro pair’s further upside before directing the buyers towards the late March 2022 peak of around 1.1185.
Overall, EUR/USD remains on the bull’s radar despite the latest retreat.
EUR/USD: Hourly chart
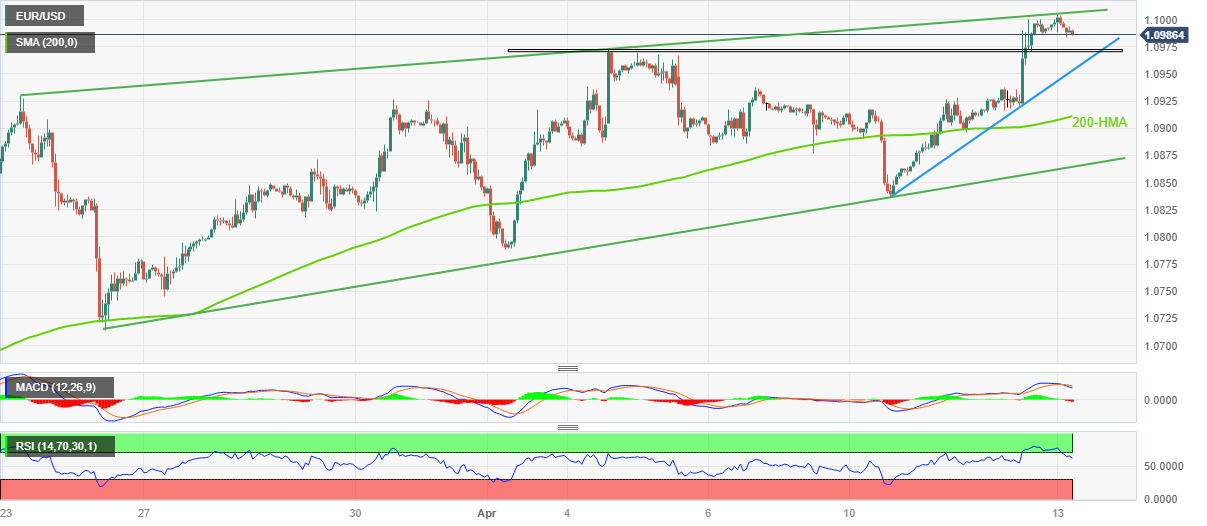
Trend: Limited downside expected
-
06:41
NZD/USD faces extra range bound near term – UOB
In the view of UOB Group’s Economist Lee Sue Ann and Markets Strategist Quek Ser Leang, NZD/USD is likely to trade within the 0.6140-0.6260 range in the next few weeks.
Key Quotes
24-hour view: “Our view for NZD to dip below 0.6180 yesterday was incorrect as it rebounded from 0.6184 to 0.6242 and then eased off. Despite the rebound, there is no significant increase in momentum and NZD is unlikely to advance much further. Today, NZD is more likely to trade between 0.6190 and 0.6250.”
Next 1-3 weeks: “On Monday (10 Apr, spot at 0.6250), we highlighted that ‘the underlying tone has softened somewhat and NZD is likely to edge lower’. After NZD dipped to 0.6185, we highlighted yesterday (12 Apr) that ‘downward momentum has increased and NZD is likely to weaken further but it remains to be seen if NZD could break and stay below 0.6140’. In NY trade, NZD popped to a high of 0.6242. While our ‘strong resistance’ level of 0.6260 is not breached, downward momentum has more or less fizzled out. In other words, instead of weakening further, NZD is more likely to trade in a range for now, expected to be between 0.6140 and 0.6260.”
-
06:37
USD Index regains composure near 101.50 ahead of data
- The index looks to revert two straight sessions with losses.
- Decent contention remains near the 101.40 region so far.
- Producer Prices, weekly Claims next on tap in the docket.
The greenback, in terms of the USD Index (DXY), manages to find some buying interest around the mid-101.00s so far on Thursday.
USD Index appears supported near 101.40
The index picks up small upside traction and attempts a tepid bounce off the vicinity of the 101.40 region on Thursday, leaving behind two consecutive sessions with losses.
The daily uptick in the dollar also comes in tandem with a mild recovery in US yields, as market participants continue to assess the recent release of the FOMC Minutes against the backdrop of steady speculation of a 25 bps rate hike at the May meeting.
Later in the NA session, Producer Prices are due along with the usual Initial Jobless Claims.
What to look for around USD
The index seems to have met some decent contention near 101.40 so far.
The recent marked recovery in the dollar has been underpinned by the loss of momentum in the view that the Federal Reserve could make an impasse in its current tightening bias as soon as at the May event.
In favour of a pivot in the Fed’s normalization process, however, still emerges the persevering disinflation, nascent weakness in some key fundamentals and somewhat persistent concerns surrounding the banking sector.
Key events in the US this week: Producer Prices, Initial Jobless Claims (Thursday) – Retail Sales, Industrial Production, Advanced Michigan Consumer Sentiment, Business Inventories (Friday).
Eminent issues on the back boiler: Persistent debate over a soft/hard landing of the US economy. Terminal Interest rate near the peak vs. speculation of rate cuts in 2024. Fed’s pivot. Geopolitical effervescence vs. Russia and China. US-China trade conflict.
USD Index relevant levels
Now, the index is gaining 0.03% at 101.55 and the breach of 101.41 (monthly low April 5) would open the door to 100.82 (2023 low February 2) and finally 100.00 (psychological level). On the other hand, the next resistance level emerges at 103.05 (monthly high April 3) seconded by 103.63 (100-day SMA) and then 105.11 (weekly high March 15).
-
06:30
Natural Gas Price Forecast: XNG/USD pares the biggest daily loss in a month near $2.20 amid sluggish markets
- Natural Gas remains sidelined after falling the most in a month.
- Mixed concerns surrounding recession, Fed and US dollar trouble XNG/USD traders.
- Bears keep the reins amid hopes of warmer weather in the West, less demand of Russian gas.
- EIA Natural Gas inventories, US inflation clues eyed for further directions.
Natural Gas (XNG/USD) price treads water around $2.22 during early Thursday morning in Europe. In doing so, the energy instrument justifies the market’s inaction while seeking more clues for a clear guide after falling the most in one month the previous day.
That said, increasing fears of recession, or at least softer growth numbers, in the West joined the talks of Northern Ireland’s (NI) ban on Russian gas imports to weigh on the XNG/USD prices the previous day. It’s worth noting that China’s downbeat inflation data also exerted downside pressure on the Natural Gas price before the recently upbeat trade figures from the dragon nation offered a tailwind.
Headlines from the International Monetary Fund (IMF) and World Bank (WB) flag fears of slower growth, if not recession, for the global economy moving forward. On the same line could be the macros suggesting the warmer weather in the West and more bans on Russian gas from nations of the old continent, namely Europe.
It’s worth noting, however, that downbeat US inflation and dovish Fed Minutes weigh on the US Dollar and allow the XNG/USD to consolidate the previous day’s losses as traders seek more catalysts after witnessing a volatile Wednesday.
While portraying the mood, the US 10-year and two-year Treasury bond yields print mild gains around 3.41% and 3.98% respectively. That said, the US 10-year Treasury bond yields snapped a three-day uptrend with mild losses to around 3.40% while the two-year counterpart also eased to 3.96% by marking the first daily negative in five. Further, S&P 500 Futures print mild gains despite downbeat Wall Street closing whereas Japan’s Nikkei 225 rise 0.60% intraday as we write.
Looking forward, the US Energy Information Administration (EIA) Natural Gas Storage Change for the week ended on April 07, prior -23B, will be important for intraday directions. That said, the US US Producer Price Index (PPI) for March and Friday’s preliminary readings of the Michigan Consumer Sentiment Index for April, as well as risk catalysts, could also entertain XNG/USD traders.
Technical analysis
Natural Gas price remains bearish between the 21-DMA and seven-week-old horizontal support zone, respectively near $2.31 and $2.12.
-
06:18
GBP/USD now faces resistance at 1.2525 ahead of 1.2600 – UOB
In light of the recent price action, GBP/USD is now expected to meet the next up barrier at 1.2525 seconded by 1.2600, note UOB Group’s Economist Lee Sue Ann and Markets Strategist Quek Ser Leang.
Key Quotes
24-hour view: “Our view of range trading in GBP was incorrect as it soared to a high of 1.2496. Strong upward momentum suggests further GBP strength and while it is likely to break above 1.2525, it might not be able to hold above this level. The next significant resistance level at 1.2600 is not expected to come into view today. On the downside, a break of 1.2445 (minor support is at 1.2470) would indicate that GBP is not strengthening further.”
Next 1-3 weeks: “Our latest narrative was from Monday (10 Apr, spot at 1.2425) wherein GBP is likely to consolidate between 1.2330 and 1.2520 for the time being. Yesterday (12 Apr), GBP soared to a high of 1.2496. Rapid improvement in momentum suggests GBP is ready to head higher. Resistance levels are at 1.2525 and 1.2600. On the downside, a break of 1.2400 (‘strong support’ level) would indicate that our view for a higher GBP is wrong.”
-
06:11
Asian Stock Market: Looks subdues as Fed cements fears of US recession, oil consolidates near $83.00
- Asian stocks are demonstrating a subdued performance amid soaring fears of a mild recession in the US.
- Chinese stocks are facing pressure despite the release of upbeat international data.
- Oil prices have turned sideways around $83.00 after the release of a mild build-up of oil inventories.
Markets in the Asian domain are showing a subdued performance after observing weak cues from United States markets. S&P500 settled Wednesday’s session on a bearish note as US core inflation rebounded to 5.6% from the former release of 5.5% due to persistent rent prices and signals of mild recession from the Federal Reserve’s (Fed) minutes of the May monetary policy meeting.
Fed minutes conveyed that policymakers are anticipating a mild recession later this year due to the banking crisis and higher interest rates.
The US Dollar Index (DXY) has shown a recovery as hawkish Fed bets have not waned despite softening of US inflation.
At the press time, Japan’s Nikkei225 gained 0.18%, SZSE Component dropped 0.56%, Hang Seng slipped 0.46%, and Nifty50 eased 0.16%.
Chinese stocks are facing pressure despite the release of upbeat international data. China’s Trade Balance data (in US Dollars) has landed at $88.19B, significantly higher than the consensus of $39.2B but lower than the former release of $116.8 B. Annual Imports have contracted by 1.4% while the street was expecting a contraction of 5%. However, Exports have expanded significantly by 14.8% against a contraction of 7.0% as expected.
An upbeat China’s EXIM data might roll back the lost confidence of investors that the economy has not derailed from the track of economic recovery.
Meanwhile, Japanese equities have been showing resilience as Bank of Japan (BoJ) Governor Kazuo Ueda has conferment continuation of expansionary monetary policy to keep inflation steadily above 2%. More stimulus in the Japanese economy would stimulate economic growth.
On the oil front, oil prices have turned sideways around $83.00 after the release of a mild build-up of oil inventories last week. The US Energy Information Administration (EIA) reported a build-up of oil stockpiles by 0.597 million barrels against the expectations of a drawdown for the week ending April 07.
-
06:10
Gold Futures: Still scope for extra gains
Considering advanced prints from CME Group for gold futures markets, open interest rose for the second session in a row on Wednesday, this time by nearly 6K contracts. Volume followed suit and also added around 95.4K contracts to the previous daily build.
Gold remains focused on the 2023 high
Gold prices extended the recovery on Tuesday amidst increasing open interest and volume, which is indicative that further gains should emerge on the horizon in the very near term. That said, the YTD peak at $2032 (April 5) appears as the immediate hurdle for bulls for the time being.
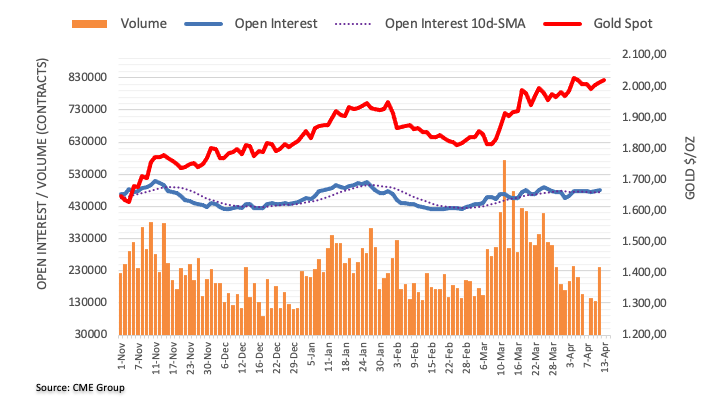
-
05:59
When are the UK data releases and how could they affect GBP/USD?
The UK Economic Data Overview
The British economic calendar is all set to entertain the Cable traders during the early hours of Thursday, at 06:00 GMT with the monthly release of February 2023 Gross Domestic Product (GDP) figures. Also increasing the importance of that time are Trade Balance and Industrial Production details for the stated period.
Having witnessed an improvement of 0.3% in economic activities during January 2023, market players will be interested in February month’s GDP figures to defy the fears of an economic slowdown.
Forecasts suggest that the UK GDP will mark stagnation of the British economy with 0.1% MoM figures for February. GBP/USD traders also await the Index of Services (3M/3M) for the same period, likely to decline to -0.2% versus 0.0% prior, for further insight.
Meanwhile, Manufacturing Production, which makes up around 80% of total industrial production, is expected to improve to 0.2% MoM in February, compared to -0.4% prior. Also, the total Industrial Production may rise by 0.2% versus the 0.3% previous expansion.
Considering the yearly figures, the Industrial Production for February is expected to have dropped by -3.7% YoY versus -4.3% previous while the Manufacturing Production is anticipated to have improved to -4.7% in the reported month versus -5.2% the last.
Separately, the UK Trade Balance; non-EU for February will be reported at the same time and is improve to deteriorate to £-7,243B versus the prior readings of £-7,808B.
How could affect GBP/USD?
GBP/USD struggles to defend the third consecutive profit-making day after bouncing off the one-week low on Tuesday. In doing so, the Cable pair portrays the market’s cautious mood ahead of the key UK data dump, as well as amid a lack of major data/events elsewhere.
The Cable pair’s latest gains could be linked to the US Dollar’s broad-based weakness amid downbeat US inflation and increasing odds of the Federal Reserve’s (Fed) policy pivot after March.
Adding strength to the upside momentum could be the Brexit optimism as US President Joe Biden visit Northern Ireland and has been recently praising the EU-UK deal. Furthermore, hawkish comments from Bank of England (BoE) Governor Andrew Bailey also favor the GBP/USD buyers of late.
That said, a positive surprise from the scheduled British statistics may, however, won’t be enough to keep the GBP/USD firmer amid looming recession woes and likely easing inflation in the UK. Hence, a kneejerk bounce in the Cable price could be witnessed in case of the firmer UK data.
Technically, a daily close below a three-week-old ascending support line, around 1.2390 by the press time, GBP/USD is well set to challenge May 2022 top surrounding 1.2665.
Key notes
GBP/USD Price Analysis: Eyes more gains above 1.2500 ahead of UK GDP and US PPI
GBP/USD bulls attack 1.2500 as US inflation, FOMC Minutes signal Fed policy pivot, UK data dump eyed
About the UK Economic Data
The Gross Domestic Product released by the Office for National Statistics (ONS) is a measure of the total value of all goods and services produced by the UK. The GDP is considered a broad measure of the UK's economic activity. Generally speaking, a rising trend has a positive effect on the GBP, while a falling trend is seen as negative (or bearish).
The Manufacturing Production released by the Office for National Statistics (ONS) measures the manufacturing output. Manufacturing Production is significant as a short-term indicator of the strength of UK manufacturing activity that dominates a large part of total GDP. A high reading is seen as positive (or bullish) for the GBP, while a low reading is seen as negative (or bearish).
The trade balance released by the Office for National Statistics (ONS) is a balance between exports and imports of goods. A positive value shows a trade surplus, while a negative value shows a trade deficit. It is an event that generates some volatility for the GBP.
-
05:53
EUR/USD: Improved momentum suggests extra gains – UOB
UOB Group’s Economist Lee Sue Ann and Markets Strategist Quek Ser Leang noted EUR/USD is now poised to extend the uptrend in the near term.
Key Quotes
24-hour view: “We expected EUR to trade in a range of 1.0870/1.0940 yesterday. However, EUR took off in early NY trade and surged to a 1-1/2-month high of 1.0000. Further EUR strength appears likely but overbought conditions suggest a sustained break above the major resistance at 1.0335 is unlikely today. Support is at 1.0960, a breach of 1.0930 would indicate that the current upward pressure has eased.”
Next 1-3 weeks: “Yesterday (11 Apr, spot at 1.0905), we held the view that EUR is likely to trade in a range of 1.0820/1.0980. We did not anticipate the strong surge that sent EUR to a high of 1.0000. Vastly improved momentum is likely to lead to further gains. However, 1.1035 is a major resistance and it remains to be seen if EUR can maintain a foothold above this level. Looking ahead, the next significant resistance level is at 1.1120. All in all, we hold a positive EUR now as long as it stays above the ‘strong support’ level, currently at 1.0900.”
-
05:48
USD/JPY: Mildly bid above 133.00 as yields grind higher, BoJ’s Ueda eyes easy inflation
- USD/JPY picks up bids to reverses the previous day’s pullback from one-month high.
- BoJ’s new Governor Ueda defends current monetary policy, eyes easing inflation.
- Softer US CPI, downbeat Fed Minutes weigh on US Dollar, yields despite latest corrective bounce.
- Risk catalysts, Fed talks eyed for clear directions.
USD/JPY remains sidelined around 133.20 during sluggish trading hours of early Thursday morning in Europe. In doing so, the Yen pair traces a mild recovery in the US Treasury bond yields while also cheering new Bank of Japan (BoJ) Governor Kazuo Ueda’s defense to the ultra easy monetary policy.
Early in Asia, Bank of Japan (BoJ) Governor Kazuo Ueda tried to defend the Japanese central bank’s easy-money policy while speaking at the Group of Seven (G7) nations’ gathering in Washington. “BoJ will continue monetary easing until the price target is stable and sustainably achieved,” said BoJ’s Ueda while also adding that Japan's consumer inflation is currently around 3% but likely to slow ahead.
It should be noted that the US 10-year and two-year Treasury bond yields print mild gains around 3.41% and 3.98% respectively. That said, , the US 10-year Treasury bond yields snapped a three-day uptrend with mild losses to around 3.40% while the two-year counterpart also eased to 3.96% by marking the first daily negative in five.
Additionally, Japan’s recalling of the emergency evacuation order after North Korean missile testing also provide tailwind to the risk barometer pair.
Elsewhere, the odds of the US Federal Reserve’s (Fed) policy pivot increase after downbeat US inflation data and unimpressive FOMC Minutes, which in turn drowned US Dollar and Treasury bond yields the previous day, especially amid the recession woes.
On Wednesday, US Consumer Price Index (CPI) dropped to the lowest level since May 2021, to 5.0% YoY in March from 6.0% prior and versus 5.2% market forecasts. However, the annual Core CPI, namely the CPI ex Food & Energy, improved to 5.6% YoY during the said month while matching forecasts and surpassing 5.5% prior.
On the same line, the Minutes of the latest Federal Open Market Committee (FOMC) Monetary Policy Meeting also challenged the Fed hawks by stating that the expectations for rate hikes were scaled back due to the turmoil in the banking sector. Furthermore, the latest comments from the Fed policymakers, including San Francisco Federal Reserve Bank President Mary Daly and Richmond Federal Reserve President Thomas Barkin, suggest easing inflation and challenges to the hawkish Fed, as well as for the US Dollar.
Amid these plays, S&P 500 Futures print mild gains despite downbeat Wall Street closing whereas Japan’s Nikkei 225 rise 0.60% intraday as we write.
Although a light calendar and mixed mood restrict USD/JPY moves of late, today’s US Producer Price Index (PPI) for March and Friday’s preliminary readings of the Michigan Consumer Sentiment Index for April can entertain the Yen pair traders.
Technical analysis
Repeated failures to cross the 200-day Exponential Moving Average (EMA), around 133.75 by the press time, teases USD/JPY bears to aim for a three-week-old support line, near 131.30 at the latetst.
-
05:33
NZD/USD Price Analysis: Remains confined below 0.6220 despite upbeat China’s international trade data
- NZD/USD has remained lackluster despite the release of solid China Trade Balance data.
- China’s annual Imports have contracted by 1.4% while Exports have expanded significantly by 14.8%.
- The Kiwi asset has been in a negative trajectory after a breakdown of the Rising Channel.
The NZD/USD pair is displaying back-and-forth moves in a narrow range of 0.6210-0.6220 in the Asian session. The Kiwi asset has turned sideways as the US Dollar Index has shown some recovery after an intense sell-off. Also, upbeat China’s international trade data (March) has failed to infuse blood into the New Zealand Dollar.
China’s Trade Balance data (in US Dollars) has landed at $88.19B, significantly higher than the consensus of $39.2B but lower than the former release of $116.8 B. Annual Imports have contracted by 1.4% while the street was expecting a contraction of 5%. However, Exports have expanded significantly by 14.8% against a contraction of 7.0% as expected.
It is worth noting that New Zealand is one of the leading trading partners of China and a lower-than-expected contraction in Chinese Imports would be supportive of the New Zealand Dollar.
Meanwhile, the USD Index is making efforts for keeping its feet steady above 101.50.
The New Zealand Dollar has been in a negative trajectory after a breakdown of the Rising Channel chart pattern formed on a four-hour scale. Also, the 20-and 50-period Exponential Moving Averages (EMAs) at 0.6217 and 0.6236 respectively are acting as barricades for the New Zealand Dollar. Potential horizontal support is plotted from March 08 low at 0.6084.
The Relative Strength Index (RSI) (14) has shifted into the 40.00-60.00 range from the bearish range of 20.00-40.00, which indicates a loss in the downside momentum..
A downside will be witnessed if the Kiwi asset surrenders April 11 low near 0.6170, which will drag the major to March 15 low at 0.6139 followed by March 08 low at 0.6084.
Alternatively, a decisive upside move above February 07 high at 0.6363 will expose the Kiwi asset to the round-level resistance at 0.6400 and December 05 high at 0.6443.
NZD/USD four-hour chart
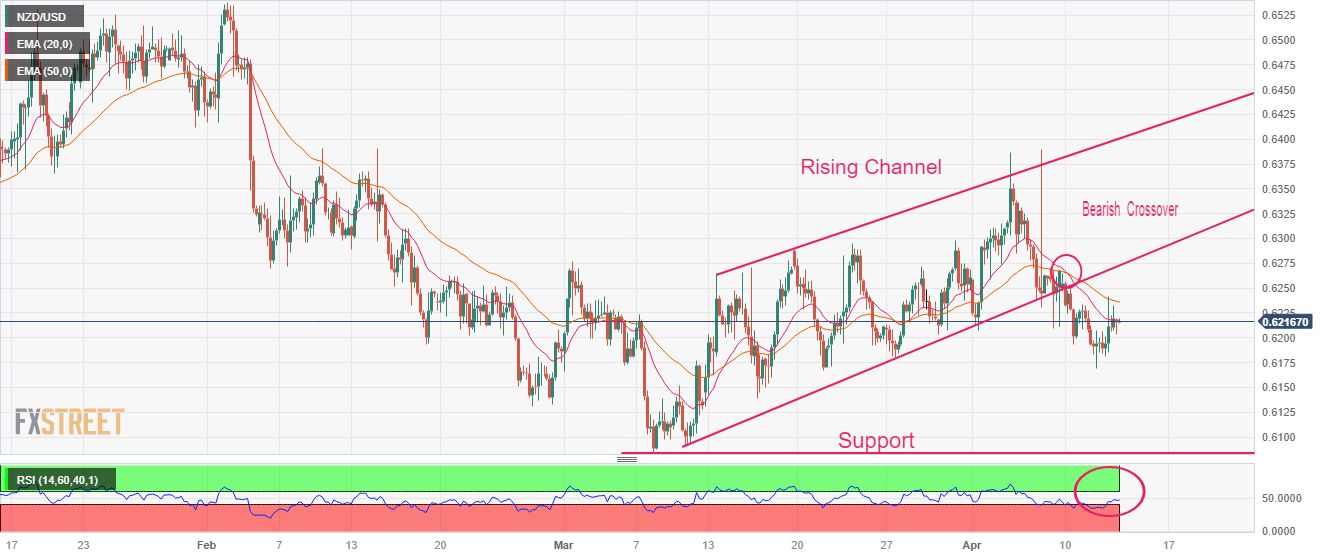
-
05:31
Netherlands, The Consumer Price Index n.s.a (YoY) down to 4.4% in March from previous 8%
-
04:53
Gold Price Forecast: XAU/USD struggles around $2,020 as US Dollar Index defends downside
- Gold price is facing resistance in surpassing the immediate resistance of $2,020.00 amid the USD Index’s recovery.
- The USD Index has defended further downside as chances of a 25 bps rate hike for the May meeting are more than 68%.
- US core CPI has rebounded to 5.6% vs. 5.5% the former release as rent prices remained persistent.
Gold price (XAU/USD) has displayed exhaustion in the upside momentum after hitting the crucial resistance of $2,020.00 in the Tokyo session. The upside bias for the precious metal is still solid as the impact of deceleration in the United States inflation would stay for longer. The US Dollar Index (DXY) has shown some defense after testing its critical low of 101.44 as the lower US Consumer Price Index (CPI) has failed to recede chances of consecutive 25 basis points (bps) rate hike from the Federal Reserve (Fed).
As per the CME Fedwatch tool, the chances of a 25 bps rate hike for the May monetary policy meeting are more than 68%.
Meanwhile, S&P500 futures have extended their gains after a bearish settlement on Wednesday, indicating a recovery in the risk-on mood.
A scrutiny of the US inflation report indicates that headline inflation has softened more than expectations to 5.0%, which was the outcome of weaker gasoline prices. The investing community is aware of the fact that oil prices have significantly rebounded in April after a surprise announcement of production cuts by OPEC+, which could spoil Gold Bull’s party.
Contrary to the headline inflation, core CPI has rebounded to 5.6% vs. 5.5% the former release as rent prices remained persistent. This indicates that core inflation could remain extremely stubborn ahead.
San Francisco Fed Bank President Mary Daly said late Wednesday, "There's a lot more in the pipeline of monetary policy tightening," as reported by Reuters. However, she refrained from forecasting the end of the tightening cycle.
Gold technical analysis
Gold price is auctioning in a Symmetrical Triangle chart pattern on an hourly scale, which indicates a sheer volatility contraction after wild moves. The upward-sloping trendline of the chart pattern is placed from April 10 low at $1,986.28 while the downward-sloping trendline is plotted from April 05 high at $2,032.09.
The 20-period Exponential Moving Average (EMA) at $2,014.48 is providing a cushion to the Gold bulls.
Meanwhile, the Relative Strength Index (RSI) (14) has slipped into the 40.00-60.00 range from the bullish range of 60.00-80.00, indicating exhaustion in the uptrend.
Gold hourly chart

-
04:42
AUD/USD prints three-day winning streak near 0.6700 despite mixed China trade data
- AUD/USD picks up bids during three-day uptrend, clings to mild gains of late.
- China’s trade surplus shrinks even as Exports jump in March.
- Strong Aussie employment supersedes softer Consumer Inflation Expectations to propel AUD/USD amid broad US Dollar weakness.
- US inflation, downbeat Fed Minutes renew policy pivot talks and weigh US Dollar, yields.
AUD/USD remains firmer for the third consecutive day even as China trade numbers fail to portray impressive outcomes for March, as well as amid softer Australia Consumer Inflation Expectations for April. The reason for the Aussie pair’s run-up could be linked to the early-day release of Australian employment data. That said, the risk barometer pair prints mild gains around 0.6710 by the press time.
That said, China’s headline Trade Balance improved to $88.10B in March versus the $39.2B expected and $116.8B prior whereas Exports grew much faster than Imports during the stated month.
Also read: China’s March Trade Balance: Surplus shrinks despite sharp jump in exports
Earlier in the day, the Australia Bureau of Statistics (ABS) mentioned that Employment Change jumps by 53K versus 20K expected and 64.6K prior while the Unemployment Rate remained unchanged versus the expectation of marking the 3.6% figure. Further, the Participation Rate also improved to 66.7% versus market forecasts of reprinting the 66.6% mark.
Additionally, Australia’s Consumer Inflation Expectations for April eased to 4.6% YoY versus 5.3% expected and 5.0% prior.
It should be noted that the previous day’s dovish remarks from Reserve Bank of Australia’s (RBA) Assistant Governor (Financial System) Michele Bullock prod the AUD/USD bulls, together with the latest fears of easy inflation and the RBA’s pause in rate hike trajectory.
On the other hand, the odds of the US Federal Reserve’s (Fed) policy pivot increase after downbeat US inflation data and unimpressive FOMC Minutes. That said, US Consumer Price Index (CPI) dropped to the lowest level since May 2021, to 5.0% YoY in March from 6.0% prior and versus 5.2% market forecasts. However, the annual Core CPI, namely the CPI ex Food & Energy, improved to 5.6% YoY during the said month while matching forecasts and surpassing 5.5% prior.
Further, the Minutes of the latest Federal Open Market Committee (FOMC) Monetary Policy Meeting also challenged the Fed hawks by stating that the expectations for rate hikes were scaled back due to the turmoil in the banking sector. “Several Federal Reserve policymakers last month considered pausing interest rate increases after the failure of two regional banks and a forecast from Fed staff that banking sector stress would tip the economy into recession,” mentioned Reuters.
Additionally, the latest comments from the Fed policymakers, including San Francisco Federal Reserve Bank President Mary Daly and Richmond Federal Reserve President Thomas Barkin, suggest easing inflation and challenges to the hawkish Fed, as well as for the US Dollar.
Against this backdrop, yields in Australia remain firmer while S&P 500 Futures print mild gains and the US Dollar remain pressured amid the cautiously optimistic markets.
To sum up, AUD/USD may witness further upside amid a light calendar for the day. However, the US Producer Price Index (PPI) and Fed talks will be eyed for clear directions.
Technical analysis
A successful break of the one-month-old previous support line, around 0.6700 by the press time directs AUD/USD buyers towards a downward-sloping resistance line from mid-February, around 0.6745 by the press time.
-
04:29
China’s March Trade Balance: Surplus shrinks despite sharp jump in exports
China's Trade Balance for March, in Chinese Yuan terms, came in at CNY601.01 billion versus CNY618.09 billion expected and CNY810.3 billion last.
The exports jumped by a whopping 23.4% in the reported period vs. 9.5% expected and 0.9% previous.
more to come ...
-
04:29
China Exports (YoY) above forecasts (-7%) in March: Actual (14.8%)
-
04:28
China Imports (YoY) came in at -1.4%, above forecasts (-5%) in March
-
04:28
China Trade Balance USD above expectations ($39.2B) in March: Actual ($88.19B)
-
04:26
China Trade Balance CNY came in at 601.01B below forecasts (618.07B) in March
-
04:26
China Exports (YoY) CNY above forecasts (9.5%) in March: Actual (23.4%)
-
04:25
China Trade Balance CNY registered at 88.19B, below expectations (618.07B) in March
-
04:25
USD/INR Price News: Rupee grinds near 81.90 as India growth optimism supersedes easy inflation woes
- USD/INR remains sidelined after snapping three-day downtrend the previous day.
- IMF expects India to lead global growth numbers, softer CPI appears already priced in.
- Downbeat US inflation numbers, unimpressive Fed Minutes weigh on US Dollar.
- Risk catalysts, more inflation clues eyed for clear directions.
USD/INR remains indecisive around 81.90 during early Thursday, following its first daily fall in four the previous day. In doing so, the Indian Rupee (INR) pair traces the broad market moves amid a light calendar and mixed macros.
The USD/INR pair’s fall on Wednesday could be linked to the downbeat US data and Fed Minutes, as well as comparatively better Indian numbers. Also fueling the Rupee are hawkish statements from the International Monetary Fund (IMF).
On Wednesday, India’s Consumer Price Index (CPI) for March slipped beneath market forecasts of 5.80% to 5.66%, versus 5.44% prior, whereas Industrial Output and Manufacturing Output improved for February. That said, India’s Industrial Output grew 5.6% versus 5.1% expected and 5.2% prior whereas the Manufacturing Output also rose by 5.3% in February compared to 0.2% expected and 3.47% previous readings.
On the other hand, IMF terms India as one of the fastest growing economies in the world even as it cuts New Delhi’s 2024 Gross Domestic Product (GDP) forecast. That said, the global lender estimates the Asian nation to grow by 5.9% in the current fiscal year versus 6.1% anticipated previously.
That said, the US CPI dropped to the lowest level since May 2021, to 5.0% YoY in March from 6.0% prior and versus 5.2% market forecasts. However, the annual Core CPI, namely the CPI ex Food & Energy, improved to 5.6% YoY during the said month while matching forecasts and surpassing 5.5% prior.
Further, the Minutes of the latest Federal Open Market Committee (FOMC) Monetary Policy Meeting also challenged the Fed hawks by stating that the expectations for rate hikes were scaled back due to the turmoil in the banking sector. “Several Federal Reserve policymakers last month considered pausing interest rate increases after the failure of two regional banks and a forecast from Fed staff that banking sector stress would tip the economy into recession,” mentioned Reuters.
It’s worth noting that the latest comments from the Fed policymakers, including San Francisco Federal Reserve Bank President Mary Daly and Richmond Federal Reserve President Thomas Barkin, suggest easing inflation and challenges to the hawkish Fed, as well as for the US Dollar.
Elsewhere, firmer prices of Oil, India’s major import item, join the geopolitical fears emanating from China and North Korea to prod the USD/INR bears of late.
Amid these plays, US Dollar Index (DXY) remains pressured after falling the most in three weeks the previous day whereas S&P 500 Futures print mild gain while snapping a three-day downtrend. Further, the US Treasury bond yields remain indecisive at the latest. That said, the US 10-year Treasury bond yields snapped a three-day uptrend with mild losses to around 3.40% while the two-year counterpart also eased to 3.96% by marking the first daily negative in five.
Moving on, Friday’s India trade deficit numbers will join more clues of the US inflation and Fed talks to entertain USD/INR traders moving forward.
Technical analysis
USD/INR seesaws within a one-month-old symmetrical triangle, currently around 82.20 and 81.80.
-
04:24
China Exports (YoY) CNY registered at 14.8% above expectations (9.5%) in March
-
04:24
China Exports (YoY) CNY below expectations (9.5%) in March: Actual (-1.4%)
-
04:16
EUR/USD faces barricades around 1.1000 as US Dollar attempts recovery, US Retail Sales eyed
- EUR/USD is facing hurdles in stretching its rally above 1.1000 as USD Index has attempted a recovery
- S&P500 futures have recovered losses generated in early Asia, portraying a recovery in the risk appetite.
- Monthly US Retail Sales data is expected to maintain its pace of contraction by 0.4%.
The EUR/USD pair is facing resistance in extending its rally above the psychological resistance of 1.1000 in the Asian session. The shared currency pair is struggling to accelerate further as the US Dollar index (DXY) has defended further downside after testing its weekly low of 101.44.
The major currency pair displayed a stellar north-side move on Wednesday after United States inflation landed lower as expected. Weak gasoline prices in March were a major catalyst for the extensive softening of the headline Consumer Price Index (CPI) to 5.0%. While core CPI that excludes oil and food prices rebounded to 5.6% as rent prices remained persistent.
Also, the release of Federal Reserve (Fed) minutes strengthened the downside bias for the USD Index. Fed minutes conveyed that 25 basis points (bps) interest rate hike was a last-minute move as policymakers were in favor of a 50 bps rate hike. The Fed decided to go light on interest rates due to banking turmoil.
Meanwhile, S&P500 futures have recovered losses generated in early Asia and have turned positive, at the time of writing, portraying a recovery in the risk appetite of the market participants. It seems that investors are digesting fears of a mild recession, which is anticipated by Fed policymakers later this year as per Federal Open Market Committee (FOMC) minutes.
Going forward, US Retail Sales data will remain in the spotlight. Monthly Retail Sales data is expected to maintain its pace of contraction by 0.4%.
On the Eurozone front, rising oil prices are posing a threat of recovery in inflationary pressures. The shared continent is a major importer of oil and higher oil prices could fuel inflation again. This might force the European Central Bank (ECB) to hike rates further.
ECB Governing Council member Robert Holzmann cited on Wednesday, “Inflation outlook argues for another 50bps hike in May.” He further added, “ECB needs to keep raising rates noticeably beyond May.”
-
04:02
EUR/GBP Price Analysis: Further downside hinges on 0.8770 and UK data dump
- EUR/GBP retreats from two-week high to print the first daily loss in three.
- 200-SMA, overbought RSI recently challenged EUR/GBP bulls.
- Clear upside break of the previous key resistance, bullish MACD signals keep buyers hopeful.
EUR/GBP takes offers to renew intraday low near 0.8800 as it snaps a two-day winning streak during early Thursday. In doing so, the cross-currency pair reverses from the highest levels in a fortnight ahead of a series of key UK data scheduled for publishing around 06:00 AM GMT.
Also read: GBP/USD bulls attack 1.2500 as US inflation, FOMC Minutes signal Fed policy pivot, UK data dump eyed
That said, the quote’s latest pullback could be linked to the pair’s inability to cross the 200-SMA hurdle of 0.8810 amid the overbought RSI (14).
However, the EUR/GBP pair’s successful trading above the previous resistance line stretched from March 07, now immediate support around 0.8790, keeps the bulls hopeful. Adding strength to the upside bias are the bullish MACD signals.
Even if the pair drops below the resistance-turned-support of 0.8790, an upward-sloping support line from April 04, close to 0.8770 by the press time, can act as the last defense of the EUR/GBP buyers.
Meanwhile, EUR/GBP bulls need to provide a successful break of the 200-SMA hurdle of 0.8810 to restore the market’s confidence in them.
Following that, the late March high of 0.8865 and the six-week-old horizontal resistance of 0.8900, may challenge the pair’s upside momentum before directing buyers to the previous monthly high of 0.8925.
Overall, EUR/GBP witnesses a pullback from the short-term key hurdle but is not off the buyer’s radar.
EUR/GBP: Four-hour chart

Trend: Recovery expected
-
03:45
USD/CNH stays pressured towards 6.8750 on upbeat China trade numbers, downbeat US Dollar
- USD/CNH holds onto the previous day’s bearish bias after China trade numbers.
- China’s January–March Exports grew 8.4% YoY, Imports increased 0.2% YoY in Yuan terms.
- Broad-based US Dollar weakness, optimism from China exerts downside pressure on USD/CNH prices.
USD/CNH clings to mild losses around 6.8790 during early Thursday, extending the previous day’s downside momentum amid broad US Dollar selling and upbeat trade numbers from China, not to forget optimism surrounding the dragon nation.
It’s worth noting that China’s January–March Exports grew 8.4% YoY while Imports increased 0.2% YoY in Yuan terms. “In the first quarter, China's trade remained resilient,” said China’s Customs Department after the trade data release.
Apart from the China data, the downbeat US Dollar Index (DXY) also weighs on the USD/CNF price. That said, the US Dollar Index (DXY) struggles for clear directions around 101.50 after falling the most in three weeks the previous day. That said, downbeat US inflation data and an absence of impressive Fed Minutes could be cited as the key catalysts for the DXY's latest fall.
US Consumer Price Index (CPI) dropped to the lowest level since May 2021, to 5.0% YoY in March from 6.0% prior and versus 5.2% market forecasts. However, the annual Core CPI, namely the CPI ex Food & Energy, improved to 5.6% YoY during the said month while matching forecasts and surpassing 5.5% prior.
On the other hand, the Minutes of the latest Federal Open Market Committee (FOMC) Monetary Policy Meeting also challenged the Fed hawks by stating that the expectations for rate hikes were scaled back due to the turmoil in the banking sector. “Several Federal Reserve policymakers last month considered pausing interest rate increases after the failure of two regional banks and a forecast from Fed staff that banking sector stress would tip the economy into recession,” mentioned Reuters.
It should be noted that the International Monetary Fund (IMF) held China’s economic forecasts for 2023 and 2024 intact but expects the dragon nation to join India to be the global economic growth engine.
Elsewhere, the odds of the People’s Bank of China’s (PBoC) sustained easy money policy is higher than the dovish Fed concerns and hence keep the USD/CNH prices directed towards the south.
Against this backdrop, S&P 500 Futures print mild gain while snapping a three-day downtrend while the US Treasury bond yields remain indecisive at the latest. That said, the US 10-year Treasury bond yields snapped a three-day uptrend with mild losses to around 3.40% while the two-year counterpart also eased to 3.96% by marking the first daily negative in five.
Moving on, risk catalysts and more clues of the US inflation will be eyed for clear directions. However, major attention should be given to the Fed talks and geopolitical/growth headlines.
Technical analysis
A 10-week-old ascending support line near 6.8745 restricts short-term USD/CNH downside.
-
03:30
Commodities. Daily history for Wednesday, April 12, 2023
Raw materials Closed Change, % Silver 25.498 1.8 Gold 2014.86 0.58 Palladium 1467.03 1.41 -
03:26
Silver Price Analysis: XAG/USD looks set to reclaim $26.00 despite overbought RSI
- Silver price remains firmer around the highest levels in a year, seesaws of late.
- Clear upside break of previous key resistance lines, bullish MACD signals favor buyers to aim for April 2022 high.
- Overbought RSI can test the XAG/USD bulls around $26.00 round figure.
Silver price (XAG/USD) clings to mild gains around $25.50-55 during early Thursday as bulls take a breather after refreshing the highest levels in a year the previous day. Also challenging the immediate XAG/USD upside is the overbought RSI (14) line.
However, a clear upside break of the one-week-old descending resistance line, now immediate support near $25.45, joins sustained trading beyond a one-month-old ascending trend line, close to $25.15, to keep the Silver buyers hopeful.
It’s worth noting that the precious metal’s successful U-turn from the previous resistance line from late March, around $25.10 by the press time, also challenges the Silver sellers.
In a case where the Silver price remains downbeat past $25.10, the $25.00 round figure and the 100-SMA support of $23.35 will act as the last defense of the XAG/USD bulls.
On the flip side, the $26.00 round figure may join the overbought RSI (14) to challenge the Silver buyers, a break of which could propel the XAG/USD price towards the April 2022 high of near $26.25.
Following the previous yearly high of around $26.95 and the $27.00 threshold will be in focus.
Overall, the Silver price remains on the bull’s radar despite the latest inaction around the multi-day top.
Silver price: Four-hour chart
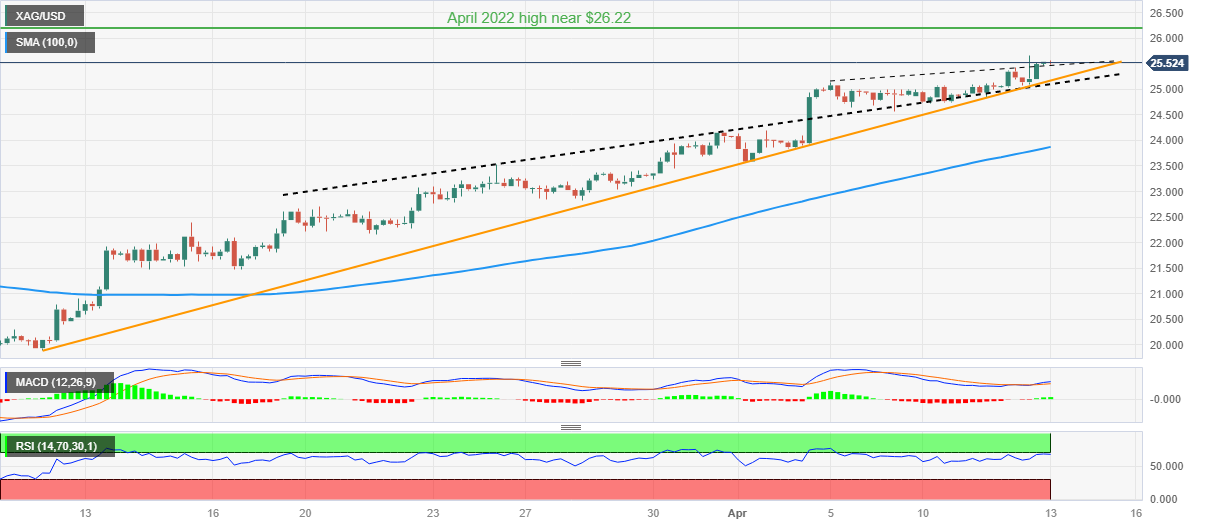
Trend: Further upside expected
-
03:05
Australia Treasury bond yields rally on strong Aussie job numbers
Australia Treasury bond yields soar during early Thursday as the Aussie employment report for March ruled out previous dovish bias.
The benchmark Australian 10-year Treasury bond yields take the bids to refresh a one-week high to around 3.30% whereas the two-year counterpart prints the biggest daily gains in 13 days around 2.98%, up 2.20% on a day at the latest.
Talking about the latest data from the Australia Bureau of Statistics (ABS), Employment Change jumps by 53K versus 20K expected and 64.6K prior while the Unemployment Rate remained unchanged versus the expectation of marking the 3.6% figure. Further, the Participation Rate also improved to 66.7% versus market forecasts of reprinting the 66.6% mark.
Also read: Breaking: Aussie jumps on strong labour market report
It should be noted that the US bond coupons also improve after printing the first daily loss of the week on Wednesday. That said, the US 10-year Treasury bond yields snapped a three-day uptrend with mild losses to around 3.40% while the two-year counterpart also eased to 3.96% by marking the first daily negative in five.
Also read: S&P 500 Futures improve amid steady yields, Fed talks, inflation concerns in focus
Looking forward, the dovish bias surrounding the Reserve Bank of Australia (RBA) may weigh on the Aussie bond coupons and hence signals for the same should be eyed carefully. On an immediate basis, China trade numbers will be crucial for intraday direction.
-
02:57
AUD/NZD Price Analysis: Bulls cross 1.0790 resistance confluence on welcome Australia employment report
- AUD/NZD jumps to fresh one-month high on upbeat Australia employment numbers for March.
- Clear break of 100-DMA, one-month-old descending trend line favors AUD/NZD bulls to approach 50-DMA hurdle.
- Convergence of one-week-old ascending trend line, 61.8% Fibonacci retracement appears a tough nut to crack for bears.
AUD/NZD bulls approach the highest levels since early March during a four-day uptrend following a release of strong Australian job numbers early Thursday. That said, the cross-currency pair takes the bids to refresh the multi-day high near 1.0810 by the press time.
As per the March month jobs numbers from the Australia Bureau of Statistics (ABS), Employment Change jumps by 53K versus 20K expected and 64.6K prior while the Unemployment Rate remained unchanged versus the expectation of marking the 3.6% figure. Further, the Participation Rate also improved to 66.7% versus market forecasts of reprinting the 66.6% mark.
Following the strong Aussie data, the AUD/NZD pair crossed the previous key resistance confluence surrounding 1.0790, comprising the 100-DMA and a one-month-old descending trend line.
Adding strength to the upside bias are the bullish MACD signals and firmer RSI (14) line, not overbought.
With this, the AUD/NZD bulls are all set to prod the 50-DMA hurdle of 1.0824. However, the previous monthly high of around 1.0895 and the 1.0900 round figure may check the upside moves afterward.
Alternatively, pullback remains elusive until the AUD/NZD pair stays beyond 1.0790 resistance-turned-support.
Following that, an upward-sloping trend line from March 05 and 61.8% Fibonacci retracement level of the pair’s run-up from December 2022 to February 2023, around 1.0705, becomes crucial to watch as a break of which may give a free hand to the bears in their further ruling.
AUD/NZD: Daily chart
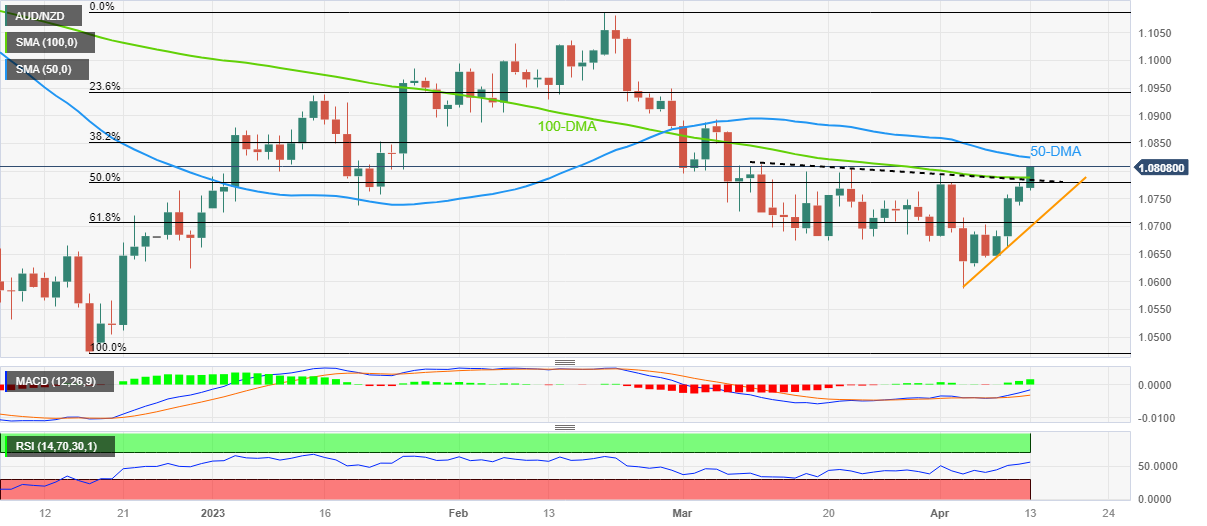
Trend: Further upside expected
-
02:47
UK’s Hunt: Election may be held as early as spring 2024
Speaking to Bloomberg TV at the International Monetary Fund’s (IMF) meetings in Washington late Wednesday, the UK Finance Minister Jeremy Hunt signaled an election may be held as early as spring 2024 as he expects the economy to have “turned the corner.”
Additional comments
“The UK will outperform the IMF’s GDP forecasts.”
“We do not believe a US trade agreement is imminent.”
Market reaction
At the time of writing, GBP/USD is keeping its range just shy of the 1.2500 barrier, adding 0.10% on the day.
-
02:36
AUD/USD soars above 0.6700 on upbeat Australian Employment data
- AUD/USD has scaled firmly above 0.6710 amid the release of upbeat Australian labor market data.
- Better-than-anticipated Australian Employment data would force the RBA to reconsider its steady policy stance.
- The USD Index is not showing any sign of recovery after dropping to near weekly lows around 101.44.
The AUD/USD pair has climbed above the round-level resistance of 0.6700 as the Australian Bureau of Statistics has reported upbeat Employment data. The Australian economy added 53K fresh jobs in March, higher than the consensus of 20K but lower than the former release of 64.6K. Also, the Unemployment Rate remained unchanged at 3.5% but lower than the estimates of 3.6%>
This is going to force the Reserve Bank of Australia (RBA) to reconsider its steady policy stance. Investors should be aware of the fact that RBA Governor Philip Lowe kept interest rates unchanged at 3.6% in its April monetary policy meeting.
Volatility in the Australian Dollar will stay further amid the release of China’s Trade Balance data. The street is expecting a deep contraction in Chinese exports and imports figures ahead. Also, the Trade Balance data (USD) is expected to plunge to $39.2B vs. the former release of $116.8B. It is worth noting that Australia is the leading trading partner of China and weak Chinese international trade would weigh on the Australian dollar.
Meanwhile, S&P500 futures have carry-forwarded downside journey as shown on Wednesday after the reading from Federal Reserve (Fed) minutes cemented fears of mild recession later this year. Apart from that, quarterly result season has also cautioned investors and a stock-specific approach has hogged the limelight.
The US Dollar Index (DXY) is not showing any sign of recovery after dropping to near-weekly lows around 101.44. Fed chair Jerome Powell is expected to pause its quantitative tightening process sooner as United States inflation has already softened significantly. For further guidance, US Retail sales data will be keenly watched.
Monthly Retail Sales data would contract by 0.4%, at a similar pace to the prior contraction. This might bolster the need to pause rates from the Fed.
-
02:36
AUD/JPY jumps 30 pips on surprisingly upbeat Australia employment data
- AUD/JPY takes the bids to renew intraday high during the five-day uptrend.
- Australia Employment Change jump, Unemployment Rate stays intact in March.
- BoJ’s Ueda tries to defend easy money policy but fails so far.
- Yields hold lower grounds as recession, geopolitical woes underpin bond demand.
AUD/JPY refreshes intraday high near 89.35 as the upbeat Aussie employment report for March favors bulls during five days of dominance on early Thursday. However, a divergence in the market’s bias towards the Reserve Bank of Australia (RBA) and the Bank of Japan (BoJ), as well as downbeat yields, prod the cross-currency pair buyers.
Australia’s headline Employment Change jumps by 53K versus 20K expected and 64.6K prior while the Unemployment Rate remained unchanged versus expectation of marking the 3.6% figure. Further, the Participation Rate also improved to 66.7% versus market forecasts of reprinting the 66.6% mark.
Also read: Breaking: Aussie jumps on strong labour market report
The latest upbeat Aussie data contrasts the previous day’s dovish remarks from t Reserve Bank of Australia’s (RBA) Assistant Governor (Financial System) Michele Bullock to keep the AUD/JPY bears hopeful.
On the other hand, Bank of Japan (BoJ) Governor Kazuo Ueda tried to defend the Japanese central bank’s easy-money policy while speaking at the Group of Seven (G7) nations’ gathering in Washington. “BoJ will continue monetary easing until the price target is stable and sustainably achieved,” said BoJ’s Ueda while also adding that Japan's consumer inflation is currently around 3% but likely to slow ahead.
It’s worth noting that the benchmark Treasury bond yields remain depressed after printing the first daily loss of the week the previous day. On Wednesday, the US 10-year Treasury bond yields snapped a three-day uptrend with mild losses to around 3.40% while the two-year counterpart also eased to 3.96% by marking the first daily negative in five.
While tracing the clues behind the bond buying, the fears of economic slowdown and geopolitical tensions emanating from China and North Korea seem to gain major attention.
Moving on, China’s trade numbers for March will be important to watch for immediate directions but major attention should be given to the bond market moves and the BoJ updates.
Technical analysis
Despite the latest run-up, AUD/JPY bulls should remain cautious until the quote stays below a six-week-old descending resistance line near 89.50 and the 90.00 round figure. On the other hand, a convergence of an upward-sloping support line from March 24 and the 21-DMA, around 88.45 by the press time, offers strong downside support to the pair.
-
02:34
Australia Consumer Inflation Expectations below forecasts (5.3%) in April: Actual (4.6%)
-
02:33
Breaking: Aussie jumps on strong labour market report
Australia´s employment data has been released by the Australian Bureau of Statistics as follows:
- Employment Change March: 53K (prev 20K, prevR 63.6K).
- Unemployment Rate: 3.5% vs. the expected 3.6%, prior 3.5%.
- Full-time employment +72.2k seasonally adjusted, s/adj.
- Part-Time Employment Change: -19.2K vs. the prior -10.3K.
- Participation rate +66.7 pct, s/adj (Reuters poll: +66.6 pct).
AUD/USD update
AUD/USD has rallied hard on the data to break above 0.6700 making a high so far of 0.6712.
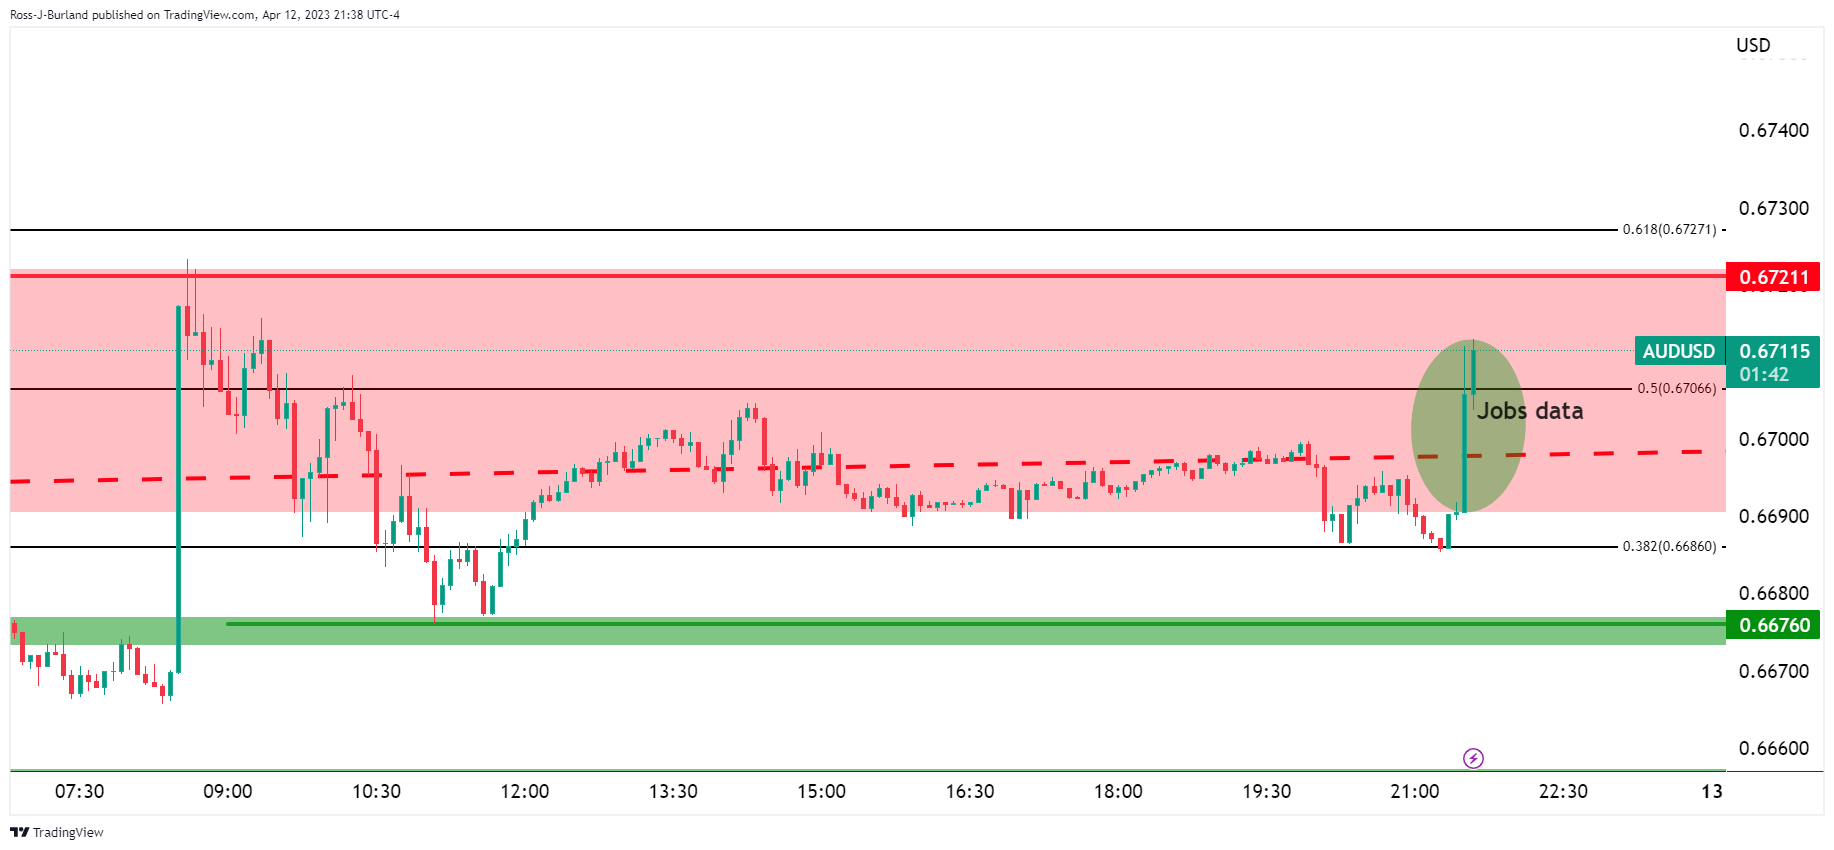
As per the prior analysis from earlier in the day, AUD/USD Price Analysis: Bears eye a break of key support structures, AUD/USD is testing major resistance.
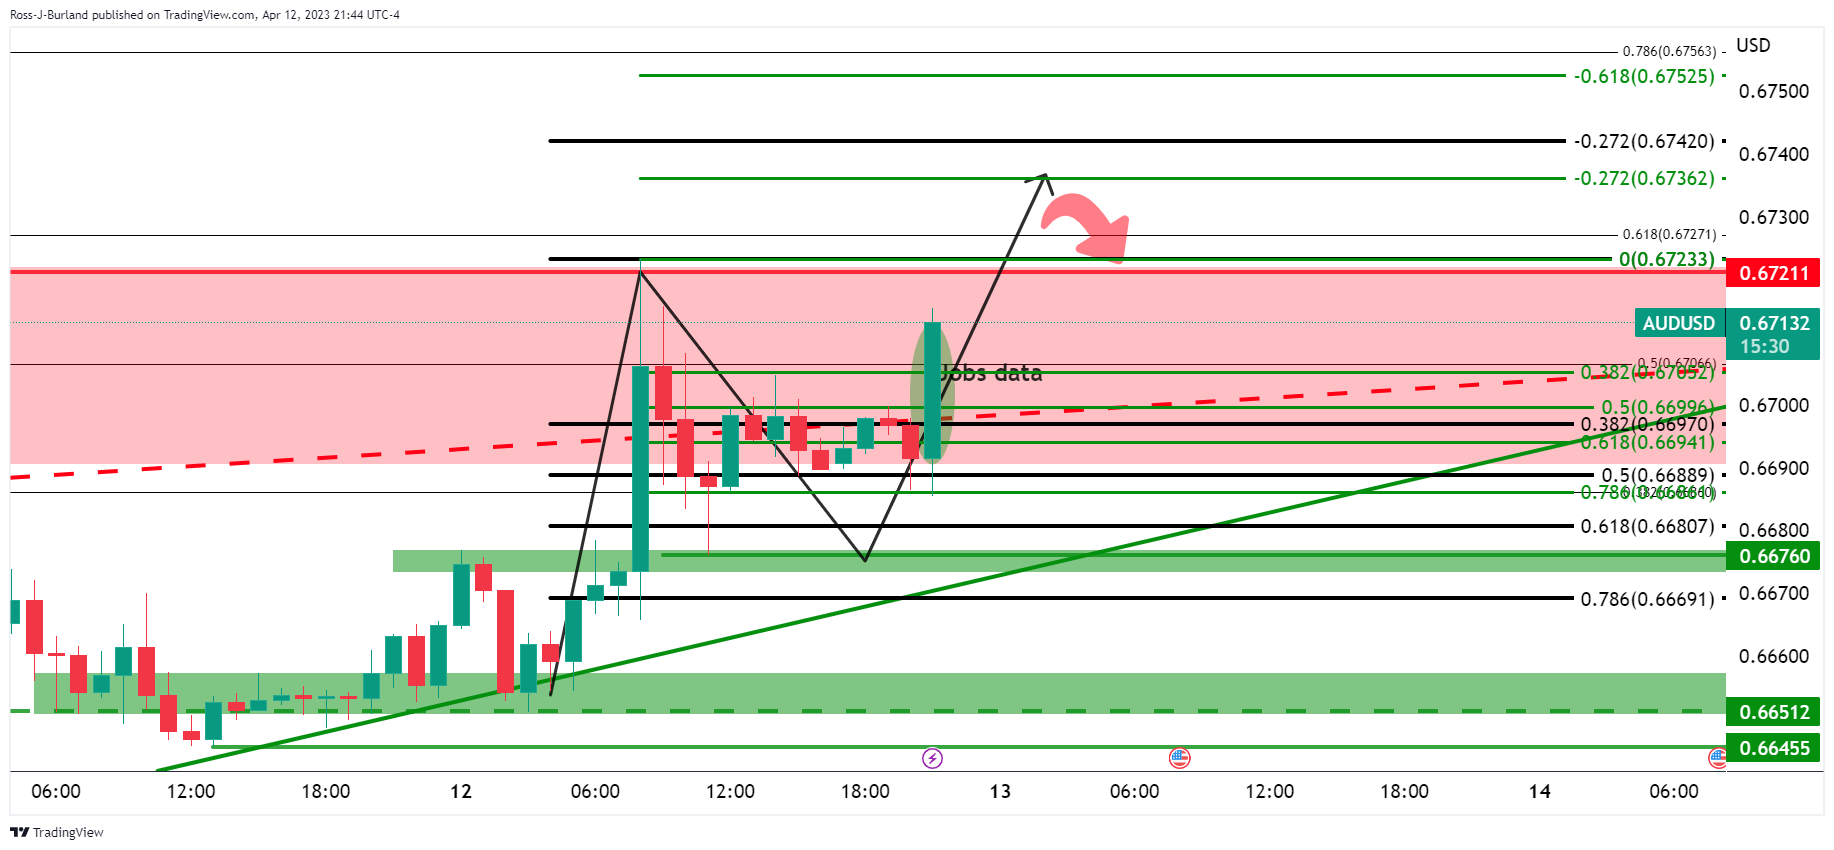
At this juncture, the hourly chart shows the price rallying within a bullish flag pattern with targets set above the key 0.6720 resistance while on the front side of teh bullish trend line support.
About the Employment Change
The Employment Change released by the Australian Bureau of Statistics is a measure of the change in the number of employed people in Australia. Generally speaking, a rise in this indicator has positive implications for consumer spending which stimulates economic growth. Therefore, a high reading is seen as positive (or bullish) for the AUD, while a low reading is seen as negative (or bearish).
-
02:33
Australia Part-Time Employment climbed from previous -10.3K to 19.2K in March
-
02:31
Australia Employment Change s.a. came in at 53K, above forecasts (20K) in March
-
02:31
Australia Full-Time Employment fell from previous 74.9K to 72.2K in March
-
02:30
Australia Unemployment Rate s.a. registered at 3.5%, below expectations (3.6%) in March
-
02:30
Australia Participation Rate above forecasts (66.6%) in March: Actual (66.7%)
-
02:18
S&P 500 Futures improve amid steady yields, Fed talks, inflation concerns in focus
- Market sentiment remains cautiously optimistic amid increasing sigs of Fed’s policy pivot.
- US inflation, FOMC Minutes increase odds of 0.25% Fed rate hike in May, as well as tease talks of pause in rate lifts.
- Geopolitical fears from North Korea, China join fears of easy economic growth to weigh on risk appetite.
- S&P 500 Futures print mild gains despite Wall Street’s downbeat closing, yields stabilize after falling the previous day.
Risk profile remains mildly positive as traders take a breather during early Thursday, after a volatile Wednesday. In doing so, the market players cheer hopes of easy rates while struggling with geopolitical and recession woes amid a sluggish Asian session.
While portraying the mood, the S&P 500 Futures print mild gains around 4,115 while snapping the three-day losing streak whereas the US Treasury bond yields seek clear directions after flashing the first daily loss in the week the previous day. On Wednesday, the US 10-year Treasury bond yields snapped a three-day uptrend with mild losses to around 3.40% while the two-year counterpart also eased to 3.96% by marking the first daily negative in five.
If we trace the receding fears of hawkish central bank actions, news/data from the US, Canada and Australia gain major attention. On the other hand, North Korea’s ballistic missile firing joins China’s dislike for the US-Taiwan ties and the Russia-Ukraine war to weigh on the sentiment. Also challenging the risk-takers are the fears of a recession in major economies, as conveyed by the International Monetary Fund (IMF).
On Wednesday, the US Consumer Price Index (CPI) dropped to the lowest level since May 2021, to 5.0% YoY in March from 6.0% prior and versus 5.2% market forecasts. However, the annual Core CPI, namely the CPI ex Food & Energy, improved to 5.6% YoY during the said month while matching forecasts and surpassing 5.5% prior.
Apart from the US inflation, the Minutes of the latest Federal Open Market Committee (FOMC) Monetary Policy Meeting also challenged the Fed hawks by stating that the expectations for rate hikes were scaled back due to the turmoil in the banking sector. “Several Federal Reserve policymakers last month considered pausing interest rate increases after the failure of two regional banks and a forecast from Fed staff that banking sector stress would tip the economy into recession,” mentioned Reuters.
Not only the US inflation and Fed Minutes, but comments from some of the Federal Reserve (Fed) Officials also suggest easing inflation and the need for a halt to the rate hike trajectory, which in turn weighed on the US Treasury bond yields and the US Dollar Index. That said, San Francisco Federal Reserve Bank President Mary Daly said that they had good news on inflation but added that she doesn't want to forecast the end of the tightening cycle. On the same line, Richmond Federal Reserve President Thomas Barkin said on Tuesday, in an interview with CNBC, that inflation certainly has peaked but warned that there are still ways to go.
Furthermore, dovish comments from the Reserve Bank of Australia (RBA) Assistant Governor (Financial System) Michele Bullock join the Bank of Canada’s (BoC) status quo to underpin the mildly positive mood.
Elsewhere, Japan had to issue an emergency evacuation notice early in Asia on North Korean missile testing, which was later recalled, while China has already marked its ability to destabilize Taiwan if it chooses to be close to the White House. Furthermore, the IMF revised down global economic forecasts while keeping the Gross Domestic Product (GDP) estimations for China intact.
Having witnessed the market’s reaction to this week’s top-tier data/events, market players will seek more inflation clues and can trace the central bankers’ speeches for a clear direction.
Also read: Forex Today: Dollar under pressure after US CPI, eyes on Australian employment
-
02:18
USD/CNY fix: 6.8658 vs. the last close of 6.8721
In recent trade today, the People’s Bank of China (PBOC) set the yuan at 6.8658 vs. the last close of 6.8721.
About the fix
China maintains strict control of the yuan’s rate on the mainland.
The onshore yuan (CNY) differs from the offshore one (CNH) in trading restrictions, this last one is not as tightly controlled.
Each morning, the People’s Bank of China (PBOC) sets a so-called daily midpoint fix, based on the yuan’s previous day's closing level and quotations taken from the inter-bank dealer.
-
02:16
Gold Price Forecast: XAU/USD bulls stay the course across dynamic daily support
- Gold price daily charts show the price hugging a supporting dynamic trendline.
- A break above $2,030 could encourage more buying pressure toward the target.
The Gold price climbed above $2,028/oz after briefly dipping to $1,990/oz on Monday which leaves the bulls in charge as per price action and market structure, as illustrated below. Meanwhile, the market is also taking its cues on the fundamentals with respect to softening US data, in the main, and the sentiment surrounding the Federal Reserve.
On Wednesday, and ahead of Friday´s Retail Sales US data, the Consumer Price Index (CPI) climbed 0.1% in March after advancing 0.4% in February, compared with a forecast of 0.2% gain in a Reuters poll. But in the 12 months through March, the core CPI gained 5.6%, after rising 5.5% on the same basis in February. That core measure strips out volatile food and energy prices and was posting a month-on-month gain of 0.4%.
Then followed the Federal Open Market Committee minutes. These revealed very little in the way of cues ahead of next month´s interest rate decision, but there was nothing to shift the focus away from a dovish narrative. The US dollar remains on a knife edge as a consequence.
Key quotes from the FOMC minutes:
"Given their assessment of the potential economic effects of the recent banking-sector developments, the staff’s projection at the time of the March meeting included a mild recession starting later this year, with a recovery over the subsequent two years."
"In assessing the economic outlook, participants noted that since they met in February, data on inflation, employment, and economic activity generally came in stronger than expected. They also noted, however, that the developments in the banking sector that had occurred late in the intermeeting period affected their views of the economic and policy outlook and the uncertainty surrounding that outlook."
"Participants agreed that the labor market remained very tight."
"Some participants noted that given persistently high inflation and the strength of the recent economic data, they would have considered a 50 basis point increase in the target range to have been appropriate at this meeting in the absence of the recent developments in the banking sector. However, due to the potential for banking-sector developments to tighten financial conditions and to weigh on economic activity and inflation, they judged it prudent to increase the target range by a smaller increment at this meeting."
"Members concurred that the U.S. banking system is sound and resilient. They also agreed that recent developments were likely to result in tighter credit conditions for households and businesses and to weigh on economic activity, hiring, and inflation, but that the extent of these effects was uncertain. Members also concurred that they remained highly attentive to inflation risks."
´´The minutes have confirmed our view that the FOMC will deliver a final hike of 25 bps at the May meeting and then remain on hold for the remainder of the year.,´´ analysts at Rabobank said. ´´Today’s CPI report underlines the importance of staying the course because core inflation remains persistent at a high level,´´ the analysts added.
Meanwhile, Fed funds futures traders are pricing in 69% probability that the Fed will raise rates by an additional 25 basis points at its May 2-3 meeting, down from around 76% before the data.
All in all, this has benefitted the Gold price as traders have positioned for one more hike in May followed by 2-to-1 bets of a pause in June.
Elsewhere, analysts at ANZ Bank explained that ´´the weaker USD and returning investment flows have been holding prices. Exchange-traded funds added 13,895 troy ounces of gold to their holdings in the last trading session, bringing this year's net sales to 422,266oz, according to data compiled by Bloomberg. This was the fifth straight day of growth.´´
Gold price technical analysis
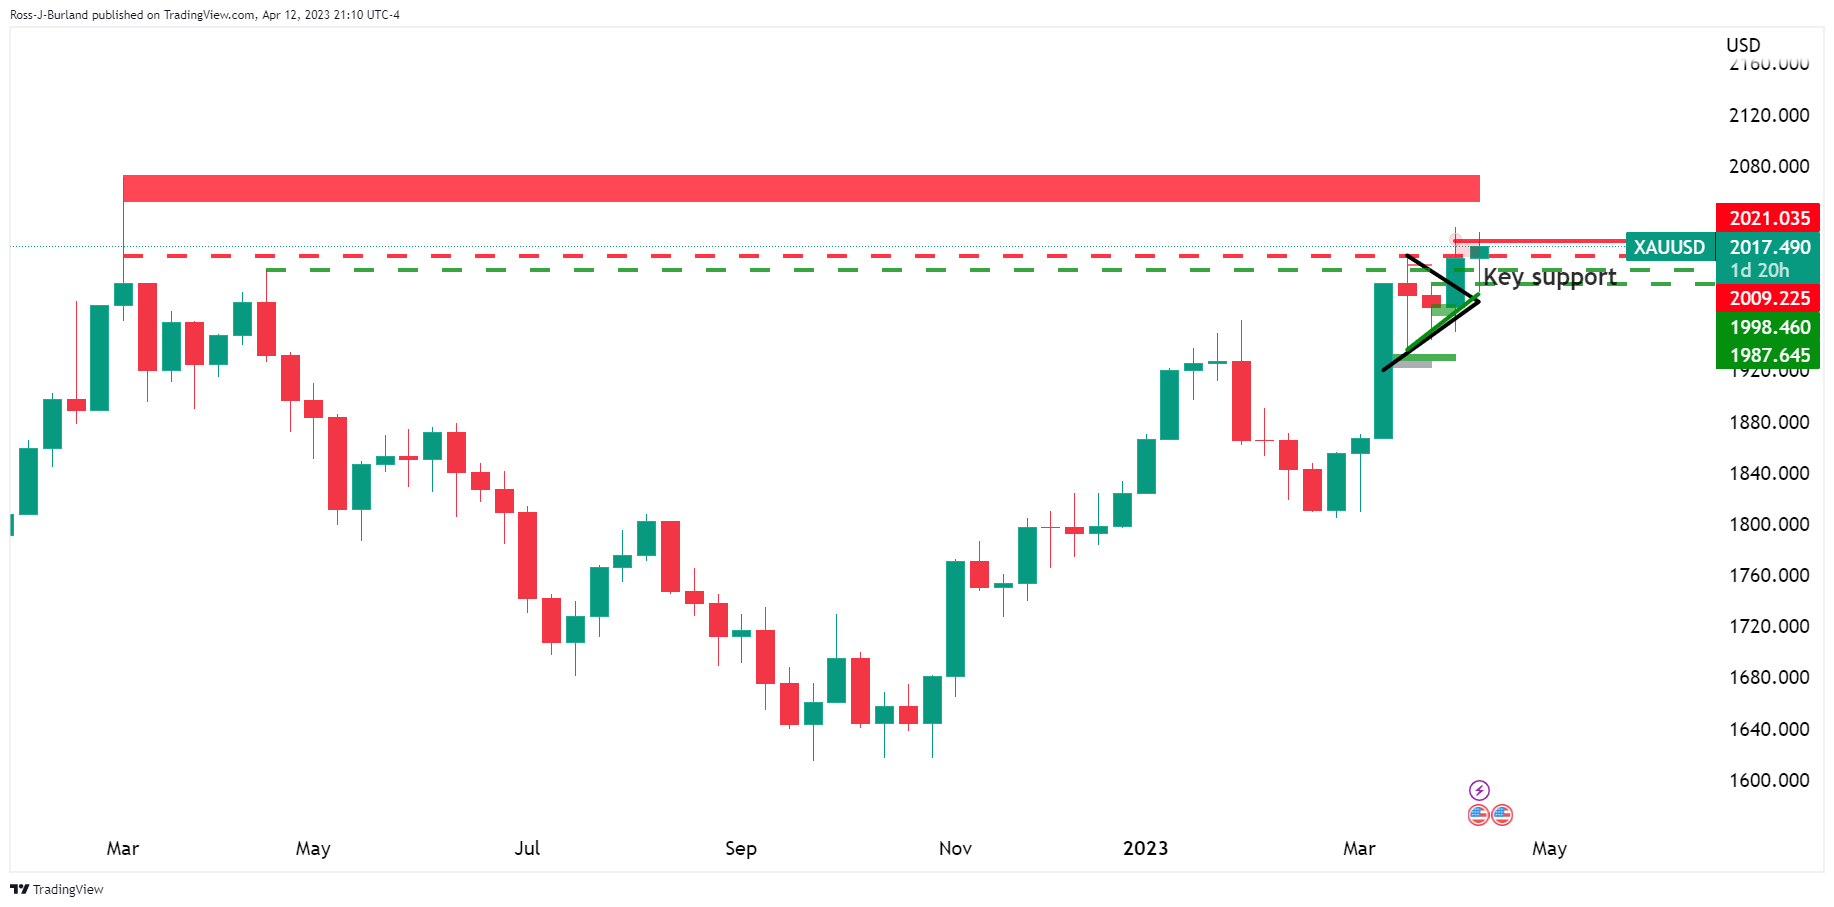
The weekly chart is bullish with the price breaking out of the geometrical pattern´s resistance.
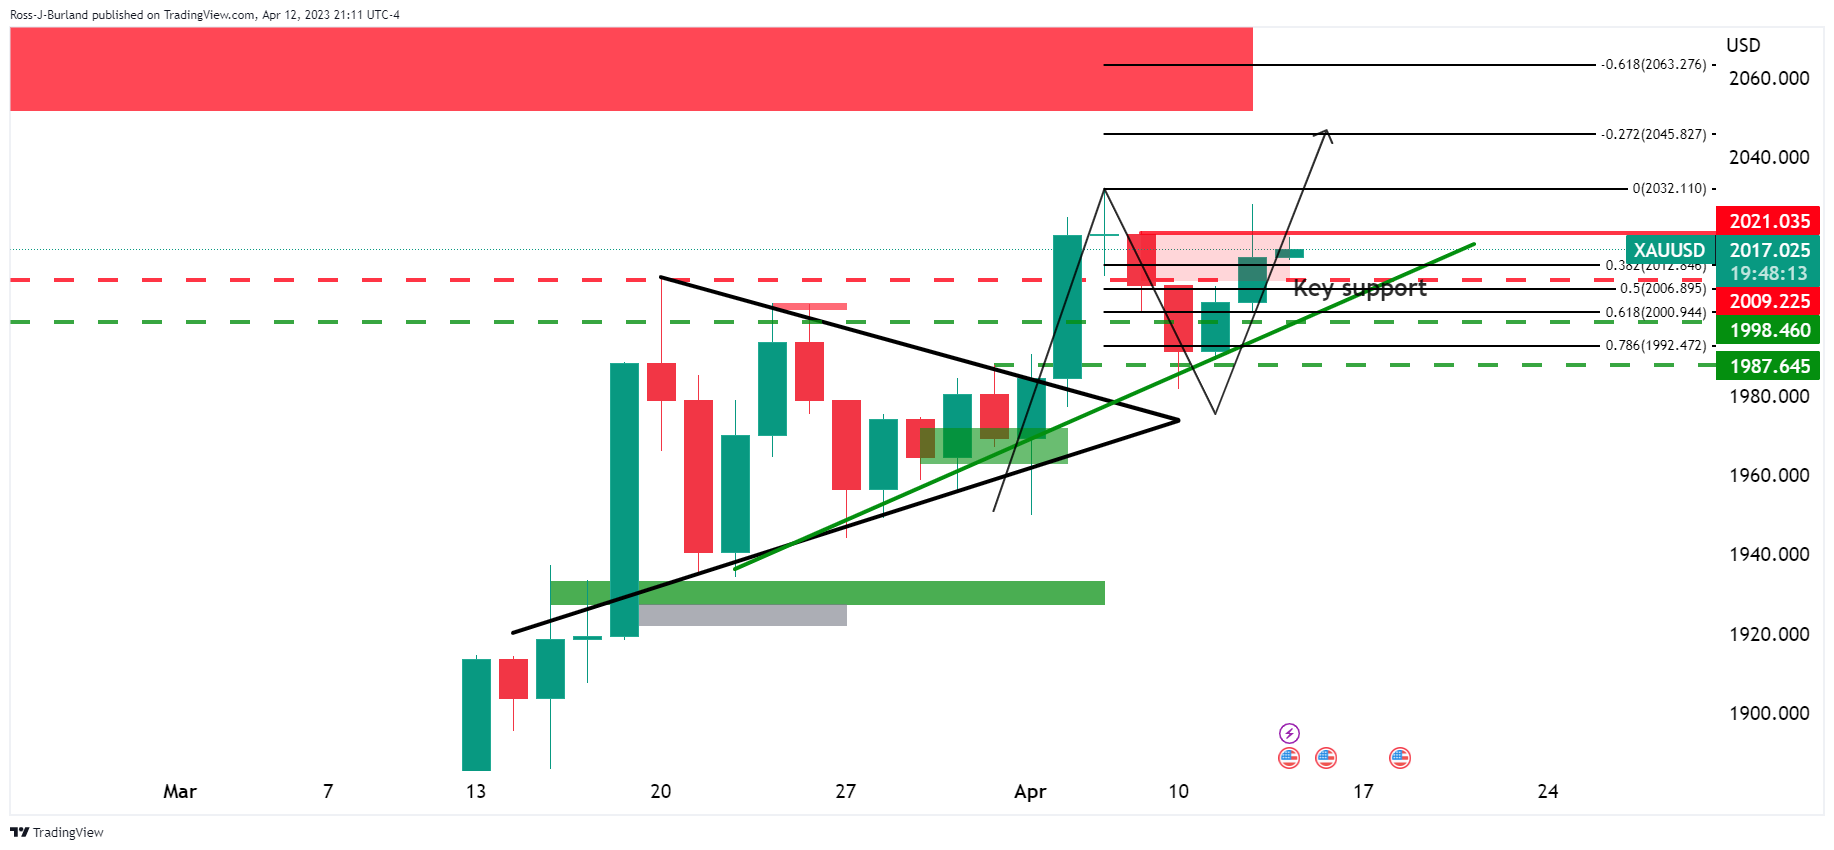
The daily charts show much of the same but a target near $2,045 has been identified as oper the Fibonacci measurement of the prior bear correction´s length. The Gold price is hugging a supporting dynamic trendline and a break above $2,030 could encourage more buying pressure toward the target.
-
02:06
GBP/USD Price Analysis: Eyes more gains above 1.2500 ahead of UK GDP and US PPI
- GBP/USD is expected to witness significant gains above 1.2500 as declining US inflation has weighed heavily on the US Dollar.
- The Pound Sterling is expected to show some action ahead of the release of the UK GDP and production-related (Feb) data.
- The impact of the weakness in US gasoline prices in March will be reflected in PPI figures.
The GBP/USD pair is gathering strength for recapturing the psychological resistance of 1.2500 in the Asian session. The Cable got significant bids on Wednesday after United States inflation softened as anticipated by the market participants.
The Pound Sterling is expected to show some action ahead of the release of the United Kingdom Gross Domestic Product (GDP) and production-related (Feb) data. Monthly GDP is expected to expand by 0.1% vs. the former expansion of 0.3%. Industrial and Manufacturing Production is likely to expand by 0.2% on a monthly basis.
Meanwhile, the US Dollar Index (DXY) seems vulnerable around 101.47 and is likely to witness more downside as the impact of weakness in gasoline prices in March will be reflected in Producer Price Index (PPI) figures. Monthly headline PPI is expected to remain stagnant against a deflation of 0.1%. Annual headline PPI would soften heavily to 3.0% from the prior release of 4.6%.
GBP/USD is marching towards the horizontal resistance placed from April 04 high at 1.2525 on an hourly scale. The Cable has got an adrenaline rush after a breakout of the Falling Channel chart pattern.
Upward-sloping 20-period Exponential Moving Average (EMA) at 1.2466 indicates more upside ahead.
An oscillation in the 60.00-80.00 range by the Relative Strength Index (RSI) (14) indicates that the bullish momentum is already active.
For further upside, the Cable needs to surpass the psychological resistance of 1.2500, which will drive the asset towards April 04 high at 1.2525. A breach of the latter would expose the Cable to a fresh nine-month high at 1.2597, which is 08 June 2022 high.
On the flip side, a break below the round-level support of 1.2400 will expose the asset to April 10 low at 1.2344 and March 30 low at 1.2294.
GBP/USD hourly chart
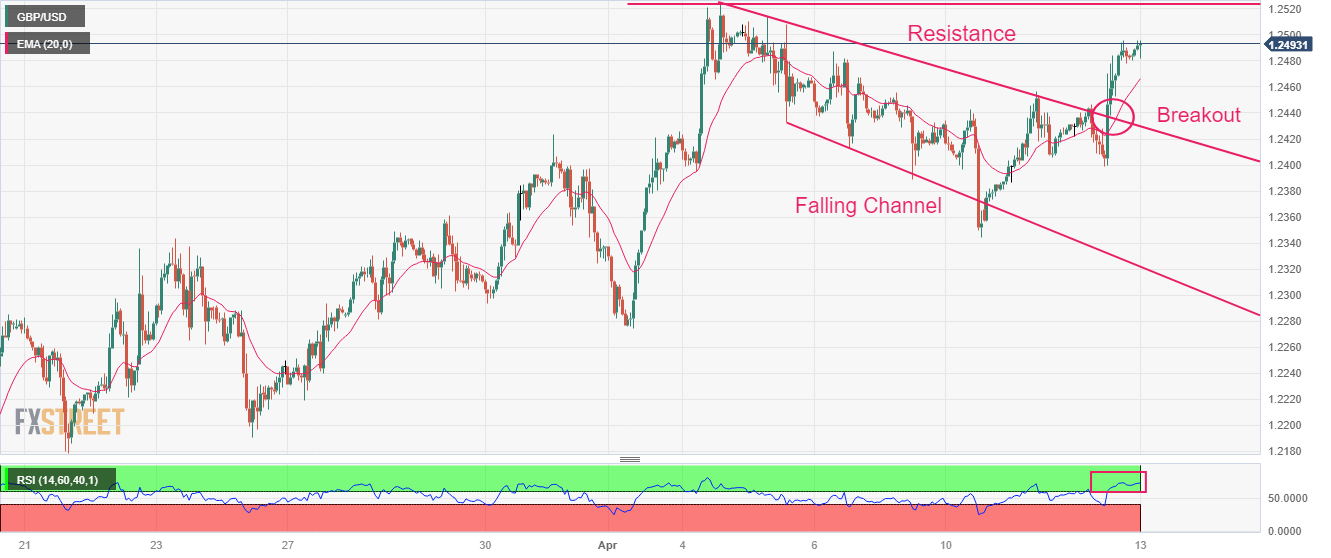
-
01:52
USD/CAD Price Analysis: Bears eye further downside towards 1.3400
- USD/CAD stays pressured around one-week low after three-day downtrend.
- Bearish MACD signals, U-turn from 100-EMA favor Loonie pair sellers.
- Bulls remain off the table below 1.3670; south run appears long and bumpy.
USD/CAD holds lower ground near the weekly low surrounding 1.3440 amid early Thursday, following a three-day losing streak.
In doing so, the Loonie pair justifies the previous day’s pullback from the 61.8% Fibonacci retracement of the February-March upside, as well as the previous retreat from the 100-bar Exponential Moving Average (EMA), amid bearish MACD signals.
It’s worth noting, however, that the RSI (14) line approaches the oversold territory and hence suggests limited downside room for the USD/CAD price.
As a result, a horizontal area comprising multiple lows marked since March 03, around 1.3400 becomes the key support to watch for the pair traders. Also acting as immediate support is the 78.6% Fibonacci retracement level surrounding 1.3390.
In a case where the USD/CAD ignores RSI conditions and drop below 1.3390, the odds of witnessing a bumpy south-run towards February’s low of 1.3262 can’t be ruled out.
On the contrary, the aforementioned 61.8% Fibonacci retracement level around 1.3490, also known as the golden Fibonacci ratio, restricts immediate recovery moves of the USD/CAD pair ahead of the 100-EMA hurdle of 1.3535.
Should the USD/CAD price remains firmer past 1.3535, a convergence of the 200-EMA and 50% Fibonacci retracement, around 1.3565, will be a strong challenge for the pair buyers.
Above all, the USD/CAD bulls should remain cautious unless witnessing a clear upside break of the previous support line from early February, close to 1.3670 by the press time.
USD/CAD: Four-hour chart
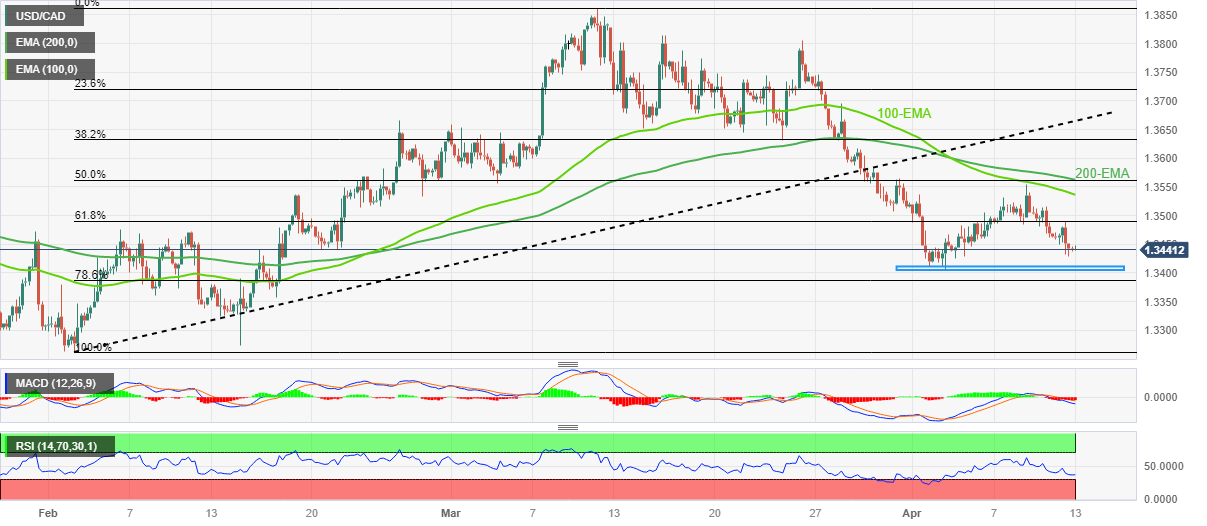
Trend: Limited downside expected
-
01:34
North Korea fired an intermediate-range or longer ballistic missile
North Korea fires an intermediate-range or longer ballistic missile from near Pyongyang according to the Soth Korean military, reported by Yonhap News agency.
As a consequence, Japan's government issued an evacuation order after the North Korean missile launch but has since lifted the order.
There has been no market reaction.
-
01:30
Stocks. Daily history for Wednesday, April 12, 2023
Index Change, points Closed Change, % NIKKEI 225 159.33 28082.7 0.57 Hang Seng -175.38 20309.86 -0.86 KOSPI 2.78 2550.64 0.11 ASX 200 34 7343.9 0.47 FTSE 100 39.14 7824.84 0.5 DAX 48.43 15703.6 0.31 CAC 40 6.66 7396.94 0.09 Dow Jones -38.29 33646.5 -0.11 S&P 500 -16.99 4091.95 -0.41 NASDAQ Composite -102.54 11929.34 -0.85 -
01:27
When is the Australian employment report and how could it affect AUD/USD?
March month employment statistics from the Australian Bureau of Statistics, up for publishing at 01:30 GMT on Thursday, will be the immediate catalyst for the AUD/USD pair traders.
Market consensus suggests that the headline Unemployment Rate may rise to 3.6% on a seasonally adjusted basis versus the 3.5% prior whereas Employment Change could ease by 20.0K versus the previous addition of 64.6K. Further, the Participation Rate is expected to remain unchanged at 66.6% during the stated month.
It’s worth noting that Australia Consumer Inflation Expectations for April, scheduled for 01:00 AM GMT also become an important event to watch for better predict the immediate AUD/USD moves. That said, the inflation precursor is expected to rise to 5.3% for April versus 5.0%.
Considering the Reserve Bank of Australia’s (RBA) pause to rate hike trajectory and the recent dovish comments from RBA Assistant Governor (Financial System) Michele Bullock, today’s Aussie inflation expectations and employment numbers appear more important for the AUD/USD pair.
Ahead of the event, FXStreet’s Matias Salord mentioned,
Bond markets around the globe seem to be pointing at rate cuts from central banks starting in the third quarter. Good economic data from Australia, more than increasing the odds of another rate hike, could help the Aussie by delaying the expected timing of such a rate cut.
How could the data affect AUD/USD?
AUD/USD takes offers to renew intraday low around 0.6690 as it snaps a two-day uptrend while preparing for the key Australia data during early Thursday. In doing so, the Aussie pair also bears the burden of the risk-off mood and dovish concerns about the RBA.
That said, the pre-data anxiety probes AUD/USD bulls amid hopes of downbeat Aussie data. However, the risk barometer pair is likely to remain firmer unless the data marks major disappointment. The reason could be linked to the broad US Dollar weakness amid Fed policy pivot talks. Hence, an upbeat Aussie report may help the quote to extend its two-day winning streak but softer data may not do much harm to the prices unless the US Dollar recovers.
Technically, a one-month-old horizontal support zone restricts immediate AUD/USD downside near 0.6625-20. The upside momentum, however, needs a successful break of the one-month-old previous support line, around 0.6700 by the press time.
Key Notes
AUD/USD Price Analysis: Bears eye a break of key support structures
Australian Employment Preview: Could another positive report help the Aussie?
AUD/USD Forecast: Bullish but needs to break 0.6700, attention turns to Australian jobs
About the Employment Change
The Employment Change released by the Australian Bureau of Statistics is a measure of the change in the number of employed people in Australia. Generally speaking, a rise in this indicator has positive implications for consumer spending which stimulates economic growth. Therefore, a high reading is seen as positive (or bullish) for the AUD, while a low reading is seen as negative (or bearish).
About the Unemployment Rate
The Unemployment Rate released by the Australian Bureau of Statistics is the number of unemployed workers divided by the total civilian labor force. If the rate hikes, indicates a lack of expansion within the Australian labor market. As a result, a rise leads to weaken the Australian economy. A decrease of the figure is seen as positive (or bullish) for the AUD, while an increase is seen as negative (or bearish).
-
01:19
USD/JPY Price Analysis: Bulls need to guard 132.50
- USD/JPY bulls will need to commit to the daily trendline support.
- 132.50/70 is key support if the thesis for a breakout above 134.00 to go higher can live on as per the weekly chart´s outlook.
As per the prior analysis, USD/JPY Price Analysis: Bulls eye a run to test 134.00 with eyes on US CPI, when USD/JPY was at 133.60, the price did indeed go on to test 134.00 ahead of the US consumer inflation that was due later in the day.
USD/JPY Prior analysis
The price was meeting a 50% mean reversion and rallying from there:
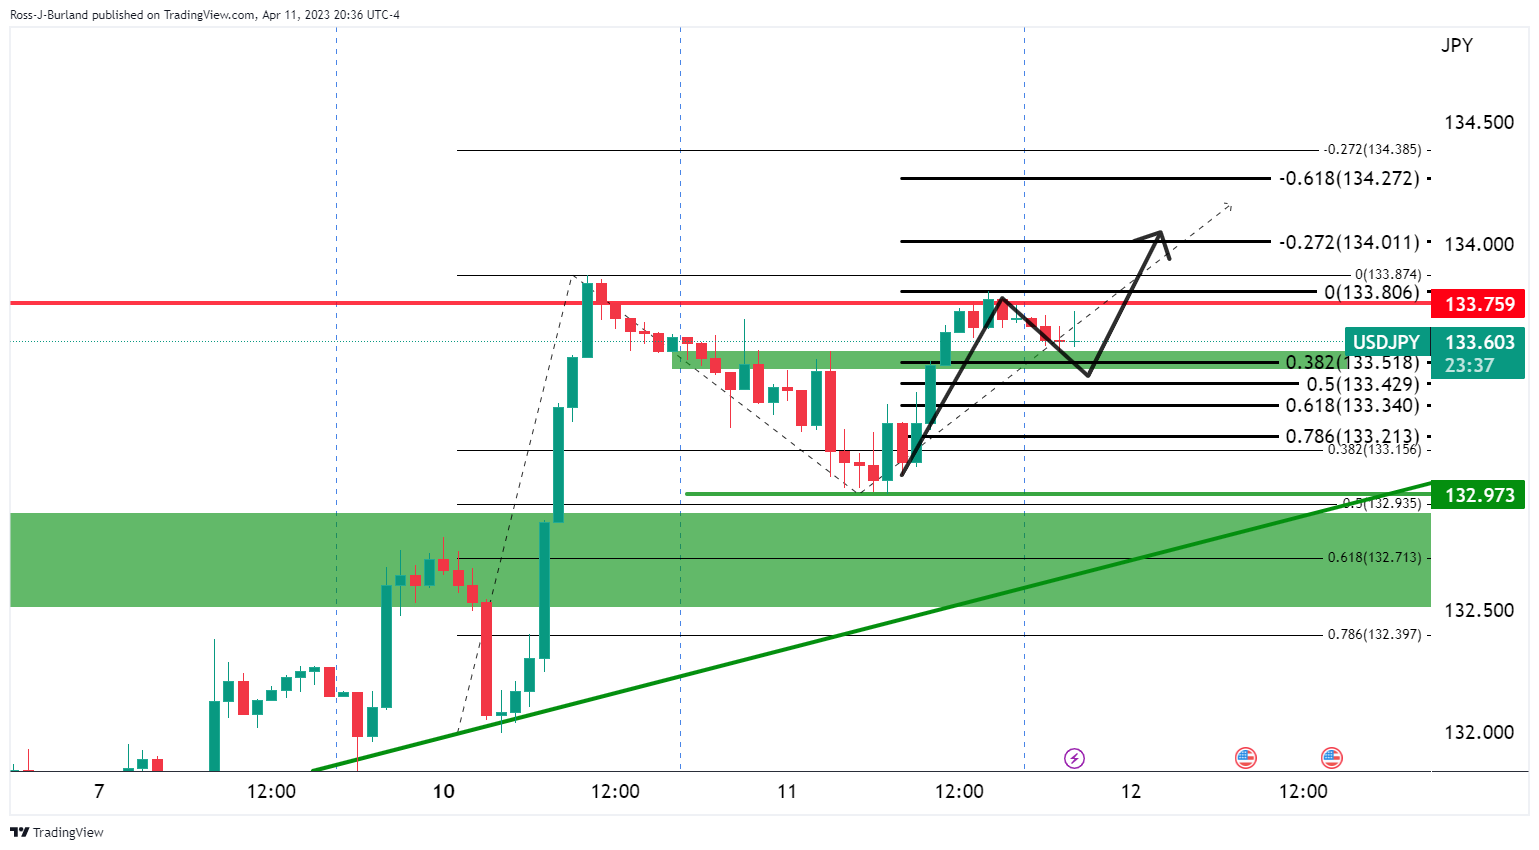
USD/JPY updates
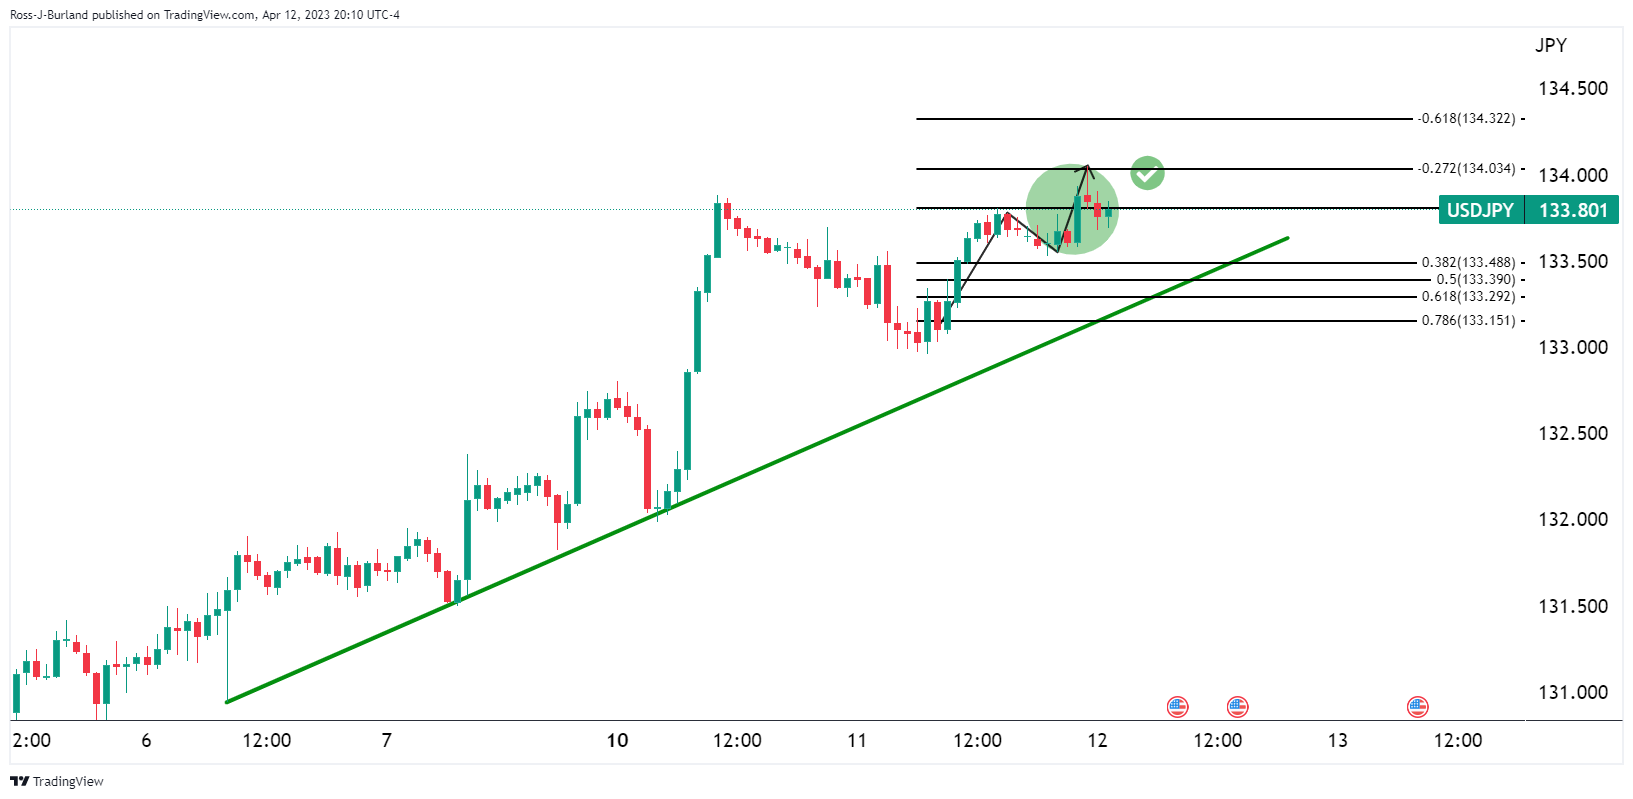
The objective was met as illustrated above. However, what followed next was a sell-off over the US CPI data:
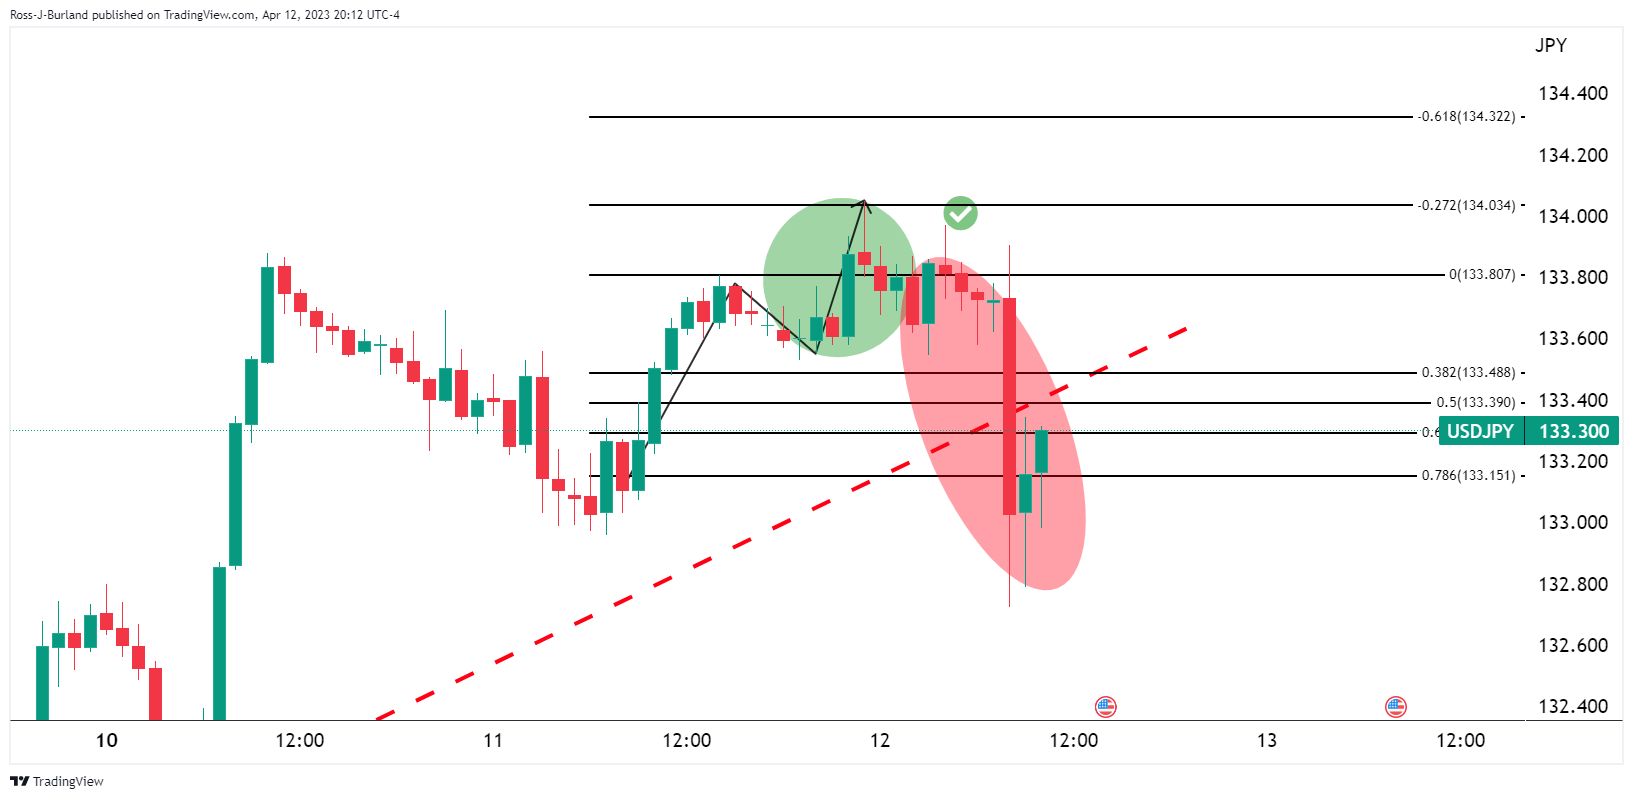
This is now leaving the price in no-man´s land:
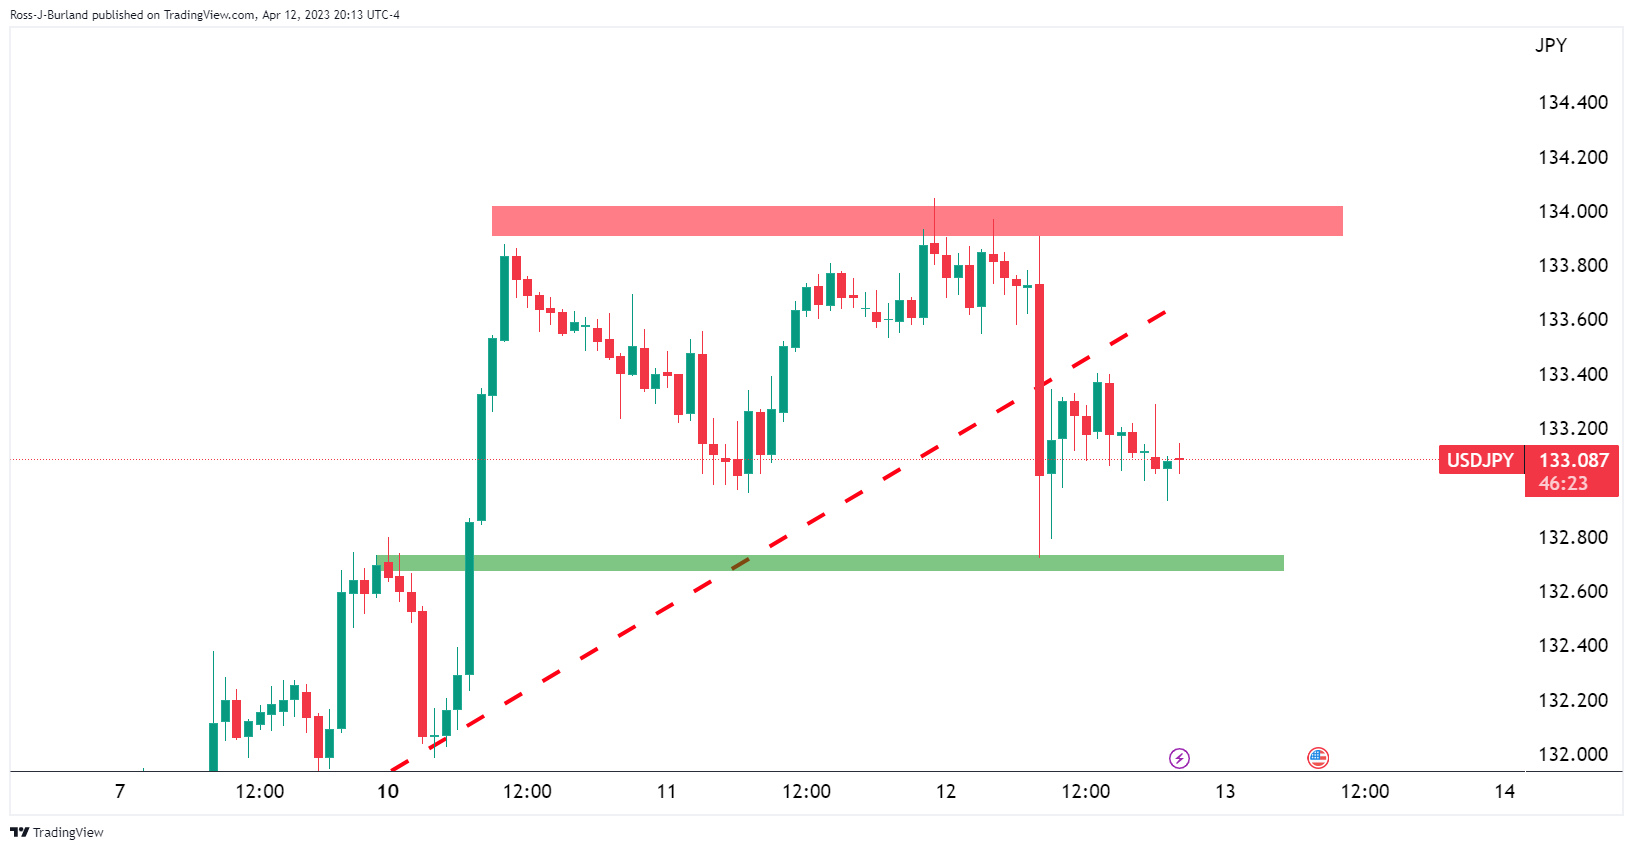
USD/JPY weekly chart, prior analysis
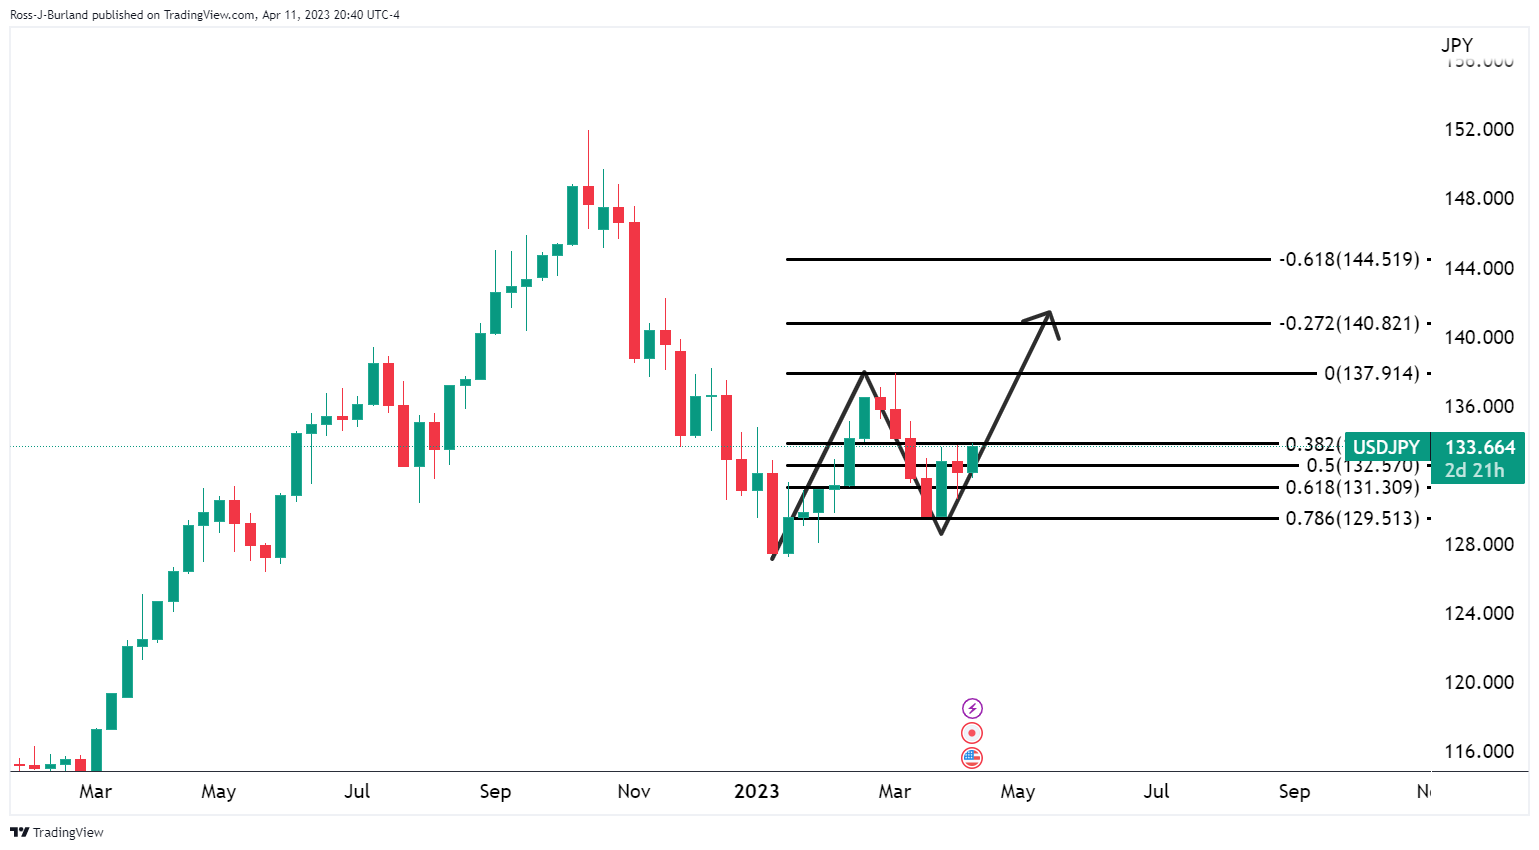
However, reverting back to the original analysis, the bigger picture remains bullish as per the weekly chart. It was stated that The weekly chart is showing that the price found support at a 78.6% Fibonacci retracement level of the prior weekly bullish impulse. This is bullish for the foreseeable future.
USD/JPY daily charts
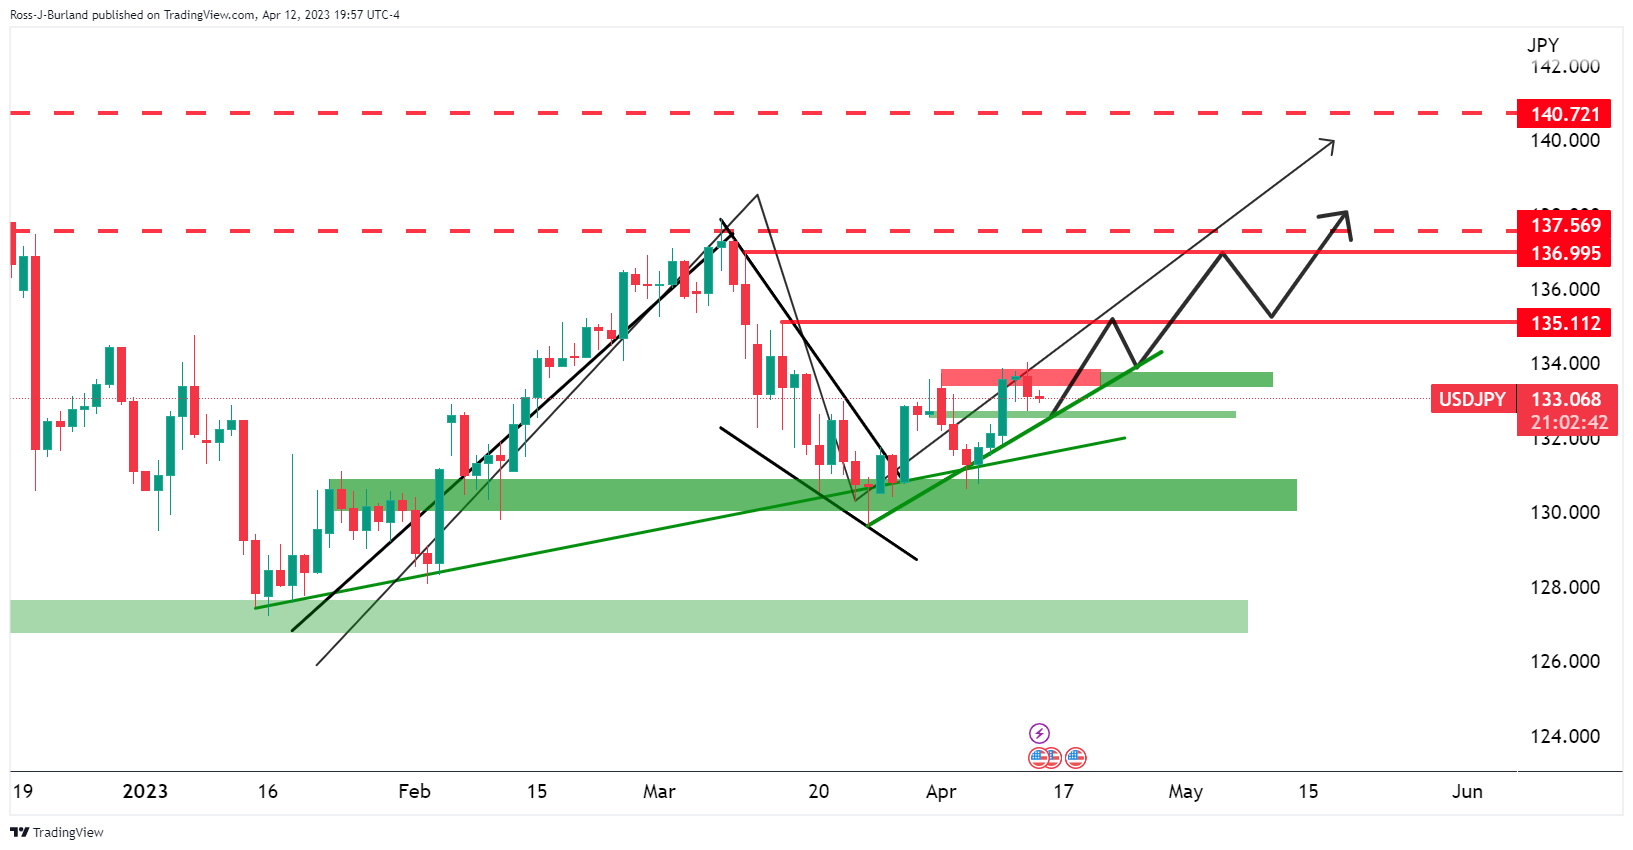
The bulls will need to commit, however, to the trendline support and preferably to above 132.50/70 for prospects of a breakout above 134.00.
-
01:15
USD/CHF eyes fresh 21-month low below 0.8930 as US Inflation cools further, US PPI eyed
- USD/CHF is expected to extend its downside journey to a fresh 21-month low below 0.8930 as US inflation has softened further.
- Lower gasoline prices would impact the input cost and its effects will be observed in the prices of goods and services.
- S&P500 futures have extended their downside as Fed policymakers are anticipating a mild recession.
The USD/CHF pair is juggling around its fresh annual low at 0.8943 in the Asian session. The Swiss Franc asset witnessed an intense sell-off on Wednesday after the United States inflation softened more than estimates.
On Wednesday, US headline Consumer Price Index (CPI) was reported at 5.0% while the street was estimating it at 5.2%. Headline CPI has decelerated to 5% from its peak of 9.1% and for that, the Federal Reserve (Fed) has gone through rigorous rate hikes. However, the core inflation that doesn’t include oil and gas prices rebounded to 5.6%, which indicates that Fed chair Jerome Powell has a lot to do to bring down inflationary pressures to 2%.
San Francisco Fed Bank President Mary Daly said late Wednesday, "There's a lot more in the pipeline of monetary policy tightening," as reported by Reuters. However, she refrained from forecasting the end of the tightening cycle
US inflation softening weighed heavily on the US Dollar Index (DXY). The USD Index has continued its downside momentum as a consistent deceleration in inflationary pressures has cemented an early pause to the policy-tightening cycle by the Fed.
Meanwhile, S&P500 futures have extended their downside after a bearish Wednesday as Fed minutes have conveyed that policymakers are anticipating a mild recession later this year, portraying a lower risk appetite for equities.
Going forward, US Producer Price Index (PPI) data will be keenly watched. Lower gasoline prices have reduced overall input costs for the production of goods and services and its impact will be observed in their prices fixed at factory gates. Monthly headline PPI is expected to remain stagnant against a deflation of 0.1%. Annual headline PPI would soften heavily to 3.0% from the prior release of 4.6%.
On the Swiss Franc front, the bailout proposal for Credit Suisse failed to get a blessing from Switzerland's parliament. Switzerland's parliament rejected on Wednesday the government's 109 billion Swiss francs ($120.82 billion) aid for Credit Suisse's merger with UBS as reported by Reuters.
-
01:15
Currencies. Daily history for Wednesday, April 12, 2023
Pare Closed Change, % AUDUSD 0.6693 0.6 EURJPY 146.324 0.29 EURUSD 1.09915 0.71 GBPJPY 166.183 0.04 GBPUSD 1.24832 0.45 NZDUSD 0.62139 0.39 USDCAD 1.34425 -0.16 USDCHF 0.89578 -0.8 USDJPY 133.123 -0.41 -
01:10
EUR/USD Price Analysis: Bulls approach 1.1010 key hurdle amid three-day uptrend
- EUR/USD seesaws around 10-week high after rising in the last two consecutive day.
- Three-week-old rising wedge’s top line joins overbought RSI (14) to challenge Euro bulls.
- Multiple hurdles towards the south to challenge EUR/USD bears, 1.0755 is the key.
EUR/USD bulls take a breather around 1.1000, making rounds to 2.5-month high amid a three-day uptrend during early Thursday.
The major currency pair’s latest run-up could be linked to a successful break of the previous weekly high, as well as the bullish MACD signals. However, the top line of a three-week-old rising wedge bearish chart formation joins overbought RSI (14) conditions to challenge the Euro bulls of late.
As a result, the EUR/USD pair’s upside appears to have little room unless it successfully stays beyond the 1.1010 immediate resistance.
Even if the quote manages to cross the 1.1010 hurdle, the Year-To-Date (YTD) high marked in February at around 1.1035 can act as an extra filter towards the north before directing EUR/USD towards the late March 2022 high of around 1.1185.
Alternatively, a downside break of one-week-old horizontal support around 1.0975-70, the previous resistance, puts a floor under the EUR/USD prices for intraday. Following that, a three-week-long horizontal support zone near 1.0930 will challenge the pair sellers.
However, a convergence of the 100-SMA and the stated wedge’s bottom line, around 1.0870-65, becomes crucial to watch during the quote’s further downside.
It should be noted that the 200-SMA level surrounding 1.0755 acts as an extra filter towards the south.
EUR/USD: Four-hour chart

Trend: Limited upside expected
-
00:53
Japan Money Supply M2+CD (YoY) meets forecasts (2.6%) in March
-
00:50
Japan Foreign Investment in Japan Stocks rose from previous ¥62.2B to ¥2368.9B in April 7
-
00:50
Japan Foreign Bond Investment dipped from previous ¥-483.4B to ¥-788.8B in April 7
-
00:44
US Dollar Index: Fed policy pivot chatters weigh on DXY near 101.50, inflation clues eyed
- US Dollar Index licks its wounds around one-week low after declining the most in three weeks.
- Lack of major positive surprises from US inflation, unimpressive FOMC Minutes weigh on DXY.
- Fears of no more Fed rate hikes past May gain momentum and weigh on yields, US Dollar.
- US PPI, Michigan Consumer Sentiment Index and inflation expectations eyed for further directions.
US Dollar Index (DXY) seesaw around a one-week low as it makes rounds to 101.50 during early Thursday, after falling the most since late March the previous day. In doing so, the greenback’s gauge versus the six major currencies seeks fresh clues to defend bears as most top-tier data/events from the US are out and loud.
Talking about inflation, the US Consumer Price Index (CPI) dropped to the lowest level since May 2021, to 5.0% YoY in March from 6.0% prior and versus 5.2% market forecasts. However, the annual Core CPI, namely the CPI ex Food & Energy, improved to 5.6% YoY during the said month while matching forecasts and surpassing 5.5% prior.
Further, Minutes of the latest Federal Open Market Committee (FOMC) Monetary Policy Meeting signaled that the expectations for rate hikes were scaled back due to the turmoil in the banking sector, which in turn offered no fresh information and raised doubts on the hawkish Fed moves, apart from May’s 0.25% rate hike. “Several Federal Reserve policymakers last month considered pausing interest rate increases after the failure of two regional banks and a forecast from Fed staff that banking sector stress would tip the economy into recession,” mentioned Reuters.
Not only the US inflation and Fed Minutes, but comments from some of the Federal Reserve (Fed) Officials also suggest easing inflation and the need for a halt to the rate hike trajectory, which in turn weighs on the US Treasury bond yields and the US Dollar Index.
That said, San Francisco Federal Reserve Bank President Mary Daly said that they had good news on inflation but added that she doesn't want to forecast the end of the tightening cycle. On the same line, Richmond Federal Reserve President Thomas Barkin said on Tuesday, in an interview with CNBC, that inflation certainly has peaked but warned that there are still ways to go.
Amid these plays, the US 10-year Treasury bond yields snapped a three-day uptrend with mild losses to around 3.40% while the two-year counterpart also eased to 3.96% by marking the first daily negative in five. Further, Wall Street closed with minor losses while S&P 500 Futures also print mild downside at the latest.
Looking ahead, today’s US Producer Price Index (PPI) for March and Friday’s preliminary readings of the Michigan Consumer Sentiment Index for April will be closely observed. Above all, the Fed talks and the bond market moves are crucial for DXY traders to follow for clear directions.
Technical analysis
A daily closing below a 10-week-old ascending support line, around 101.45 by the press time, becomes necessary for the US Dollar Index (DXY) bears to renew yearly low, currently around 100.80. Meanwhile, corrective bounce remains elusive unless the quote remains below a three-week-old descending resistance line, at 102.58 by the press time.
-
00:40
AUD/NZD consolidates around 1.0770 as investors await Australian Employment data
- AUD/NZD pair is displaying a back-and-forth action around 1.0770 ahead of Australia’s labor market data.
- RBA Lowe has already confirmed at policymakers are anticipating a slowdown in the economy due to higher rates.
- The Antipodeans will remain in action ahead of the release of China’s international trade data.
The AUD/NZD pair is displaying a back-and-forth action around 1.0770 in the early Asian session. The cross has turned sideways as investors are awaiting the release of the Australian labor market data for fresh impetus.
As per the consensus, the Australian economy added 20K jobs in March lower than the former release of 64.6k. And the Unemployment Rate is expected to jump to 3.6% from the former release of 3.5%. Easing labor market conditions are expected to soften consumer inflation expectations as lower demand for labor will also impact the labor cost index.
This would also support the Reserve Bank of Australia (RBA) in keeping its Official Cash Rate (OCR) steady at 3.60%. RBA Governor Philip Lowe has already confirmed at policymakers are anticipating a slowdown in the economy due to higher rates. Therefore, decelerating requirement for labor cannot be ruled out.
The Australian Dollar and the New Zealand Dollar will remain in action ahead of the release of China’s international trade data. The street is expecting a deep contraction in exports and imports figures ahead. Also, the Trade Balance data (USD) is expected to plunge to $39.2B vs. the former release of $116.8B.
It is worth noting that Australia and New Zealand are one of the leading trading partners of China and weaker international trade figures from China would impact the currencies of antipodeans.
The New Zealand Dollar remained in action last week after the Reserve Bank of New Zealand (RBNZ) hiked rates by 50 basis points (bps) surprisingly while the street was anticipating a 25 bps rate hike. RBNZ Governor Adrian Orr looked for a bigger rate hike as inflationary pressures are not showing evidence of softening despite the continuation of quantitative tightening.
-
00:16
Gold Price Forecast: XAU/USD bulls cheer downbeat US Treasury bond yields, US Dollar
- Gold price extends early week rebound, grinds higher of late.
- United States inflation, Federal Reserve Minutes weigh on US Treasury bond yields, USD and inspire XAU/USD buyers.
- Markets are in consolidation mode and hence Gold price pullback can’t be ruled out.
- More clues of US inflation, risk catalysts eyed for clear directions
Gold price (XAU/USD) remains sidelined around $2,015, mildly bid during the three-day uptrend, as broad-based US Dollar weakness joins downbeat United States Treasury bond yields. Behind the moves are the latest United States inflation numbers and the Minutes of the Federal Open Market Committee (FOMC) Monetary Policy Meeting.
Gold price justifies softer United States inflation, unimpressive Federal Reserve Minutes
Gold price rose on Wednesday after the downbeat prints of United States inflation and no fresh or impressive details from the Minutes of the latest Federal Reserve (Fed) monetary policy meeting weighed on the US Dollar and Treasury bond yields, via Fed bets.
On Wednesday, the United States inflation measure, per the Consumer Price Index (CPI), dropped to the lowest level since May 2021, to 5.0% YoY in March from 6.0% prior and versus 5.2% market forecasts. However, the annual Core CPI, namely the CPI ex Food & Energy, improved to 5.6% YoY during the said month while matching forecasts and surpassing 5.5% prior.
That said, the Minutes of the latest Federal Open Market Committee (FOMC) Monetary Policy Meeting signaled that the expectations for rate hikes were scaled back due to the turmoil in the banking sector, which in turn offered no fresh information and raised doubts on the hawkish Fed moves, apart from May’s 0.25% rate hike. “Several Federal Reserve policymakers last month considered pausing interest rate increases after the failure of two regional banks and a forecast from Fed staff that banking sector stress would tip the economy into recession,” mentioned Reuters.
Following the data, San Francisco Federal Reserve Bank President Mary Daly said that they had good news on inflation but added that she doesn't want to forecast the end of the tightening cycle. On the same line, Richmond Federal Reserve President Thomas Barkin said on Tuesday, in an interview with CNBC, that inflation certainly has peaked but warned that there are still ways to go.
As the aforementioned catalysts flashed downbeat signals for the Federal Reserve’s next move, the US Dollar Index (DXY) dropped to a one-week low and the Treasury bond yields marked their first daily loss of the week. That said, the US 10-year Treasury bond yields snapped a three-day uptrend with mild losses to around 3.40% while the two-year counterpart also eased to 3.96% by marking the first daily negative in five.
More clues of US inflation eyed for fresh XAU/USD directions
Having witnessed that the initial signals of the United States inflation and the FOMC Minutes both suggest the Fed’s policy pivot and underpin the Gold price upside, the XAU/USD traders may pay attention to more details of inflation to reconfirm the bullish bias about the bullion. As a result, today’s United State Producer Price Index (PPI) for March and Friday’s preliminary readings of the Michigan Consumer Sentiment Index for April will be closely observed. Above all, the Fed talks and the yields are crucial for Gold traders to follow for clear directions.
Gold price technical analysis
Gold price remains well past the short-term key supports despite the latest inaction. Also keeping the XAU/USD buyers hopeful is the near-50 condition of the Relative Strength Index (RSI), placed at 14, as well as the sluggish signals from the Moving Average Convergence and Divergence (MACD) indicator.
That said, a one-week-old ascending trend line and the 200-Hour Moving Average (HMA), respectively near $2,003 and $1,995, can restrict the short-term downside of the Gold price.
Following that, the previous resistance line from March 20, close to $1,982 at the latest, may act as the last defense of the XAU/USD bulls.
Meanwhile, a sustained upside break of $2,032 could defy the chatters that the Gold buyers are off the ground by portraying a run-up toward the previous yearly high of around $2,070.
In a case where the XAU/USD remains firmer past $2,070, the record high of the $2,075 mark printed in 2020 will be in the spotlight.
Gold price: Hourly chart
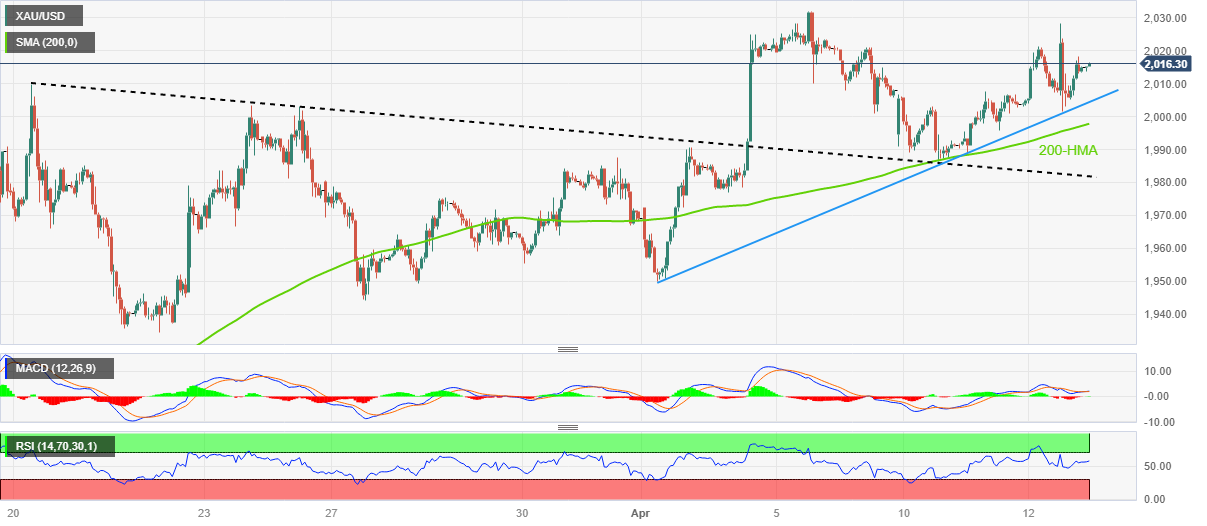
Trend: Further upside expected
-
00:11
WTI Price Analysis: Soft US Inflation infuses adrenaline rush into oil prices, $90.00 eyed
- The oil price managed to come out of the woods amid softening of US inflation.
- US inflation softening has weighed heavily on the US Dollar.
- Oil inventories reported a mild build-up of investors last week.
West Texas Intermediate (WTI), futures on NYMEX, have turned sideways after printing a fresh four-month high at $83.48 on Wednesday. The oil price received immense buying interest from the market participants after the United States inflation data matched expectations.
Headline US Consumer Price Index (CPI) has decelerated to 5.0% while core inflation that excludes oil and food prices rebounded to 5.6%, which has kept chances of consecutive 25 basis points (bps) rate hike from the Federal Reserve (Fed) at elevated levels.
The US Dollar Index (DXY) has dropped to near its two-week low around 101.42 and is expected to deliver more losses ahead.
Meanwhile, US Energy Information Administration (EIA) has reported a mild build-up of oil inventories for the week ending April 07 by 0.597 million barrels while the street was anticipating a drawdown.
On an hourly scale, the oil price has delivered a breakout of the Darvas Box chart pattern, which results in wider ticks and heavy volume after a sheer volatility contraction. The aforementioned chart pattern placed in a range of $79.00-81.80.
Advancing 20-period Exponential Moving Average (EMA) at $82.44 indicates that the upside trend is extremely solid.
Adding to that, the Relative Strength Index (RSI) (14) is oscillating in the bullish range of 60.00-80.00, which confirms the activation of bullish momentum.
For a fresh buy, a mean reversion move to near the 20-EMA around $82.44 would offer a decent risk-reward. This would trigger responsive buying and will drive the asset towards November 16 high at $87.47 followed by the round-level resistance at $90.00.
On the flip side, a downside move below April 03 low would force oil to fill the gap inspired by the surprise announcement of production cuts by OPEC+. This will drag the asset towards March 31 high at $75.78 and March 28 low at $72.26.
WTI hourly chart
-638169378155087074.png)
-
00:04
GBP/JPY Price Action: A doji emerges as the GBP sees marginal gains as the Asian session begins
- GBP/JPY has continued to rise steadily since the beginning of April after bouncing at the 20-day EMA.
- GBP/JPY Price Analysis: It is neutral-upwards, but downside risks remain below 166.00.
The GBP/JPY is extending its gains to six-consecutive days of gains as the Asian session begins. However, amid a risk-on sentiment, buyers and sellers appeared to be at equilibrium, as shown by Wednesday's price action. As the Asian session begins, the GBP/JPY trades at 166.14, increasing by a minuscule 0.02% gain.
GBP/JPY Price Action
The GBP/JPY remained sideways once it reached a new YTD high of 166.60. The formation of a doji in the daily chart means that neither buyers/sellers remain committed to opening new long/short positions. Nevertheless, the GBP/JPY bias remains intact, tilted upwards. But for a bullish continuation, GBP buyers need to crack the December 20 high at 167.01, posing a threat to test the 168.00 figure.
On the other hand, if GBP/JPY dives beneath 166.00, it would exacerbate a pullback, initially testing the 165.00 mark. Once broken, downside risk remains at the 20-day Exponential Moving Average (EMA), at 163.88, followed by the 163.00 figure.
Oscillator-wise, the Relative Strength Index (RSI), albeit in bullish territory, turned flat, suggesting the pair shifted neutral. On the opposite side, the Rate of Change (RoC), portrays that buying pressure is fading. Therefore, the bias remains neutral upwards, but downside risks remain.
GBP/JPY Daily Chart
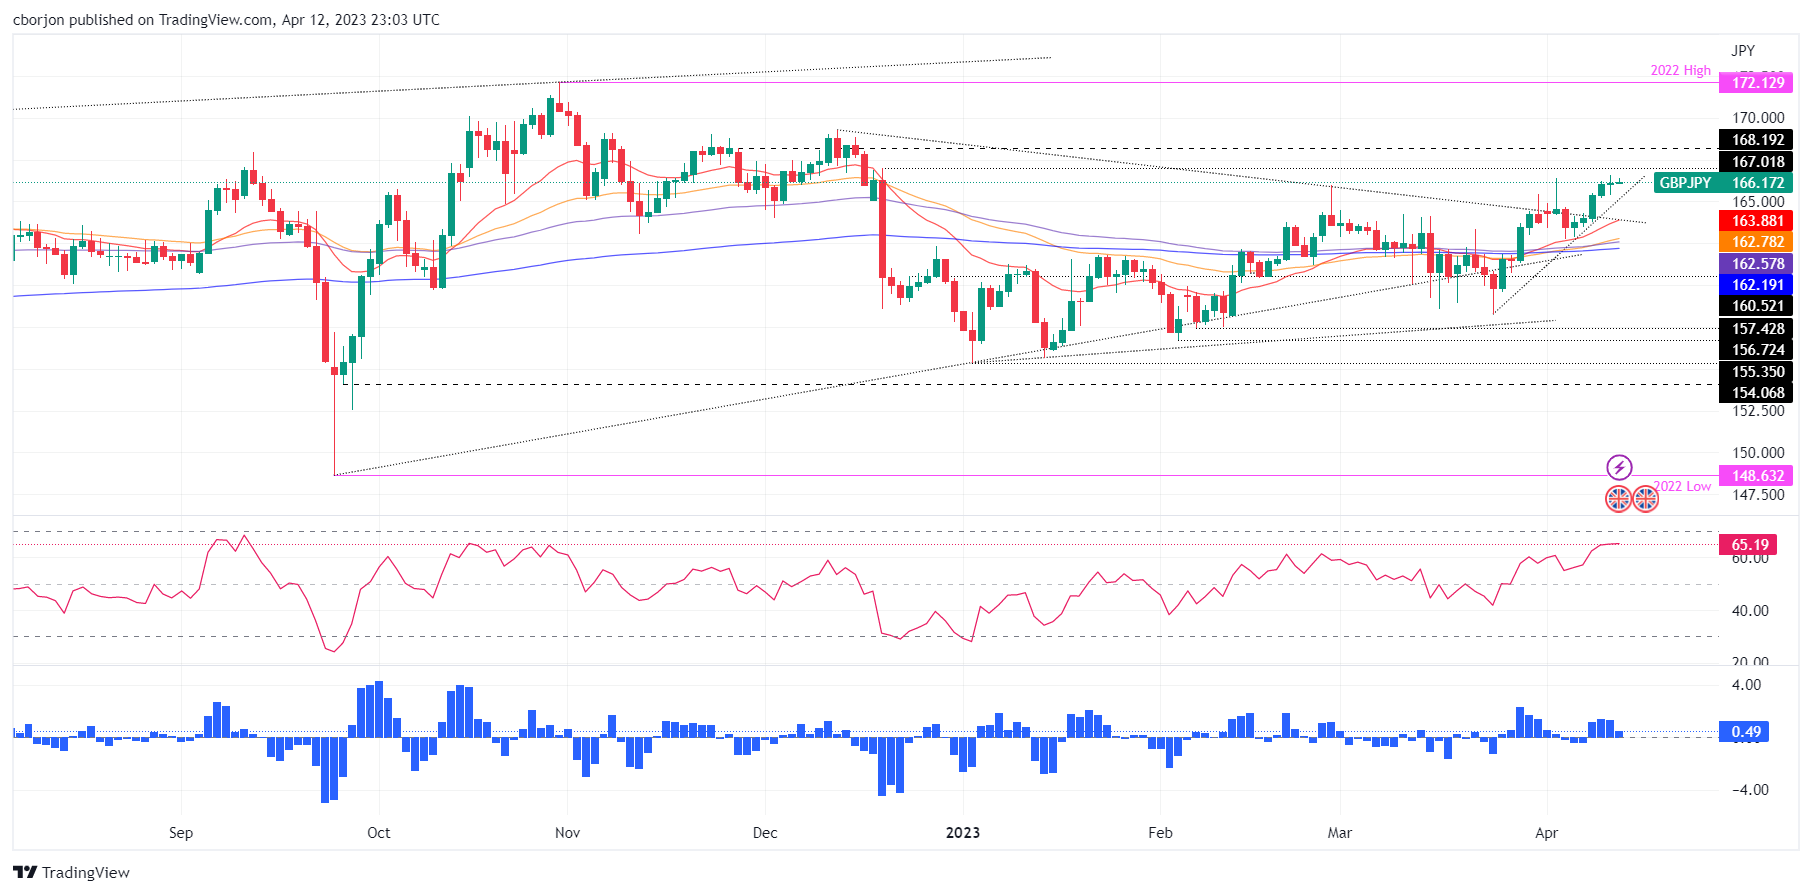
GBP/JPY Technical Levels
-
00:01
United Kingdom RICS Housing Price Balance came in at -43%, above forecasts (-48%) in March
-