Notícias do Mercado
-
22:50
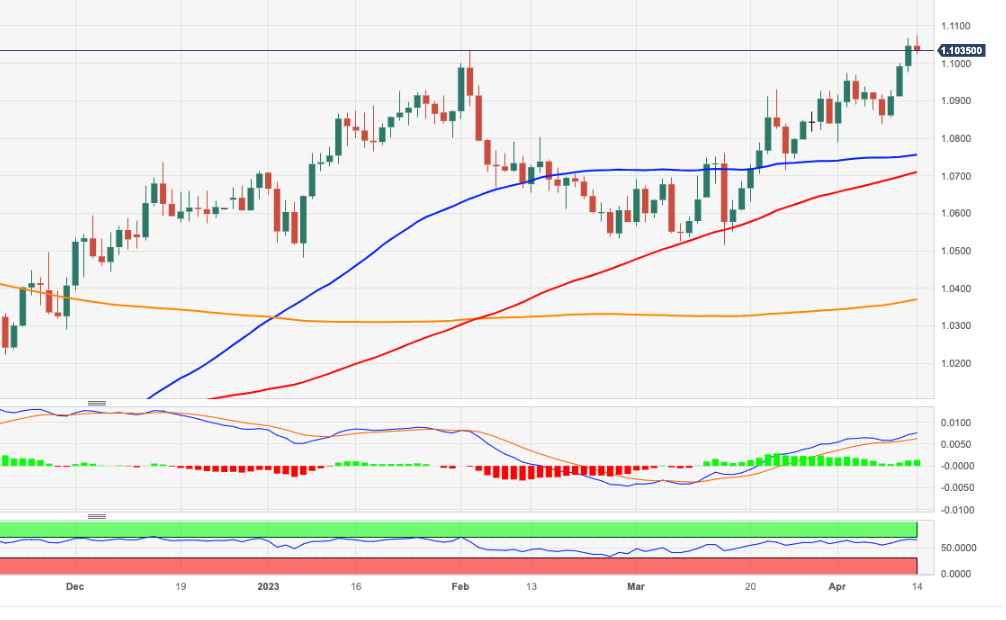
US Dollar Index: Could a double bottom at the weekly chart drive the DXY to 111.000?
- The US Dollar Index found bids at around the YTD lows at 100.788.
- USD bulls must retake 104.000 to challenge YTD high at 105.883 and maintain a double-bottom approach.
- Contrarily, USD bears must reclaim 100.788 to test the 200-week EMA at around 99.117.
The US Dollar Index (DXY), a basket of six currencies against a basket of peers, snaps three days of straight losses and climbs 0.56% as the New York session ends. At the time of writing, the DXY exchanges hand at 101.570 as a bullish engulfing candle pattern emerges in the daily chart.
US Dollar Index Price Action
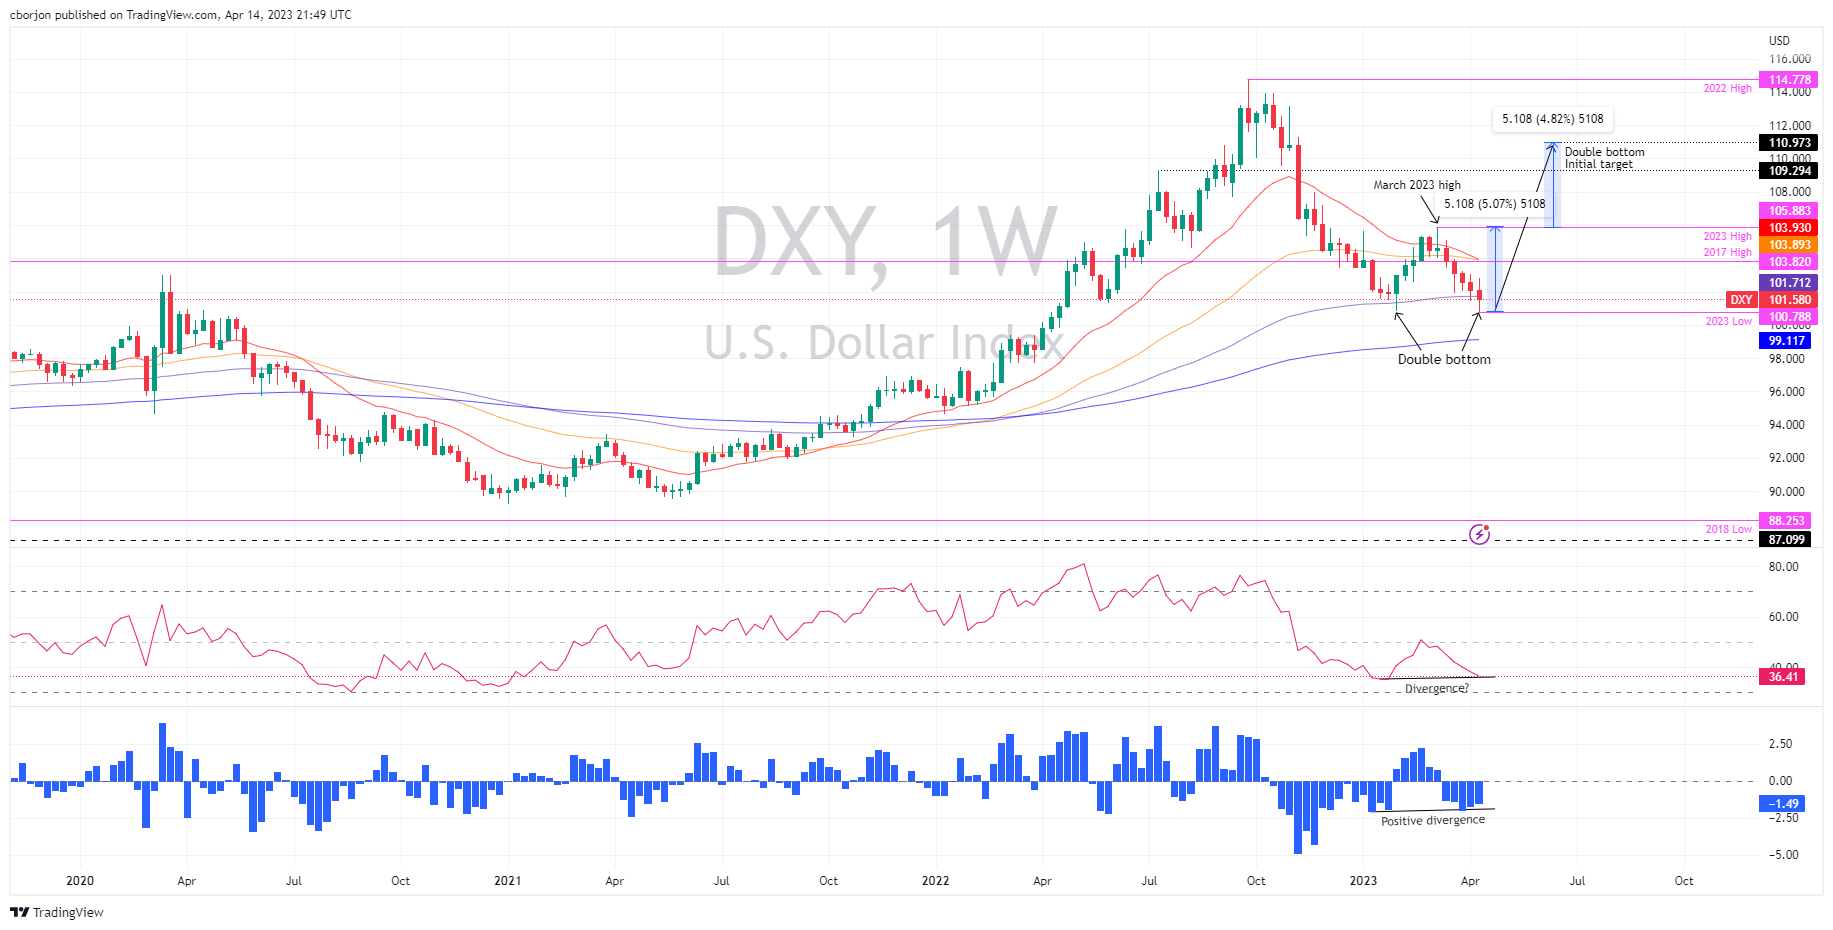
From a weekly chart perspective, the US Dollar Index remains upward biased. The DXY’s fall from around September 2022 highs at 114.728 towards 2023 lows of 100.788 bottomed around the latter, depicting a double bottom formation. Furthermore, the 200-week Exponential Moving Average (EMA) sits comfortably at around 99.117. The Relative Strength Index (RSI) is in bearish territory, but in the recent dip, the RSI is bottoming higher than the prior’s through. The Rate of Change (RoC) also displays that selling pressure is waning, which could pave the way for further upside.
Upside risks in the DXY lie at the confluence of the 50 and 20-week EMAs, around 103.893-103.930. The break above will expose the 2023 high at 105.883, the last peak, before clearing the way toward 111.000, the double-bottom initial target.
Conversely, the US Dollar Index’s first support would be 100.788. A dip below, and nothing would be in the way toward the 200-week EMA at 99.117.
US Dollar Index Weekly Chart
USD Dollar Index Technical Levels
-
21:33
United States CFTC Gold NC Net Positions down to $192.7K from previous $195.2K
-
21:32
Japan CFTC JPY NC Net Positions dipped from previous ¥-57K to ¥-57.2K
-
21:32
United States CFTC S&P 500 NC Net Positions increased to $-307.6K from previous $-321.5K
-
21:32
Australia CFTC AUD NC Net Positions dipped from previous $-27.2K to $-37.9K
-
21:32
European Monetary Union CFTC EUR NC Net Positions: €163.3K vs €143.4K
-
21:32
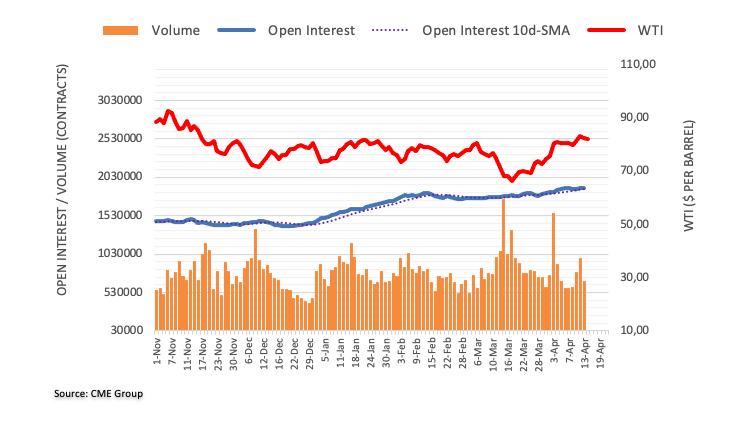
United States CFTC Oil NC Net Positions increased to 235.6K from previous 226.1K
-
21:31
United Kingdom CFTC GBP NC Net Positions climbed from previous £-14.8K to £-2.4K
-
20:27
NZD/USD ends two-day gain streak and falls toward 0.6200
- Sentiment deterioration, amidst mixed Fed signals, weakened the NZD.
- Inflation expectations in the United States moved higher, according to Americans.
- NZD/USD traders are eyeing next week’s NZ CPI report.
NZD/USD snapped two days of consecutive gains and slid past the 200, 50, and 100-day Exponential Moving Averages (EMAs) on a risk-off impulse spurred by Fed’s hawkish commentary and expectations for further tightening. US economic data showed further deterioration, but inflation expectations increased the likelihood of another Fed hike past the May meeting. At the time of writing, the NZD/USD is trading at 0.6207, down 1.38%.
The economy in the United States decelerates while inflation expectations arise
Wall Street is set to finish the last trading day of the week with losses. US data in the United States (US) showed that the economy is slowing down, as demonstrated by Retail Sales and Industrial Production. March’s sales dropped 1% MoM, below an anticipated contraction of 0.4%, while YoY figures came at 2.9%, below the prior’s month 5.9%. Meanwhile, Industrial Production (IP) fell for the first occasion in the year and grew 0.4% MoM, below February’s 0.9% reading.
In the meantime, a poll published by the University of Michigan revealed that American consumer sentiment in April improved to 63.5 from the previous reading of 62. The same report flashed that inflation expectations rose to 4.6% from 3.6% in the prior’s report.
Those two reasons drove the NZD/USD price action. As the data was released, the NZD/USD hovered around 0.6260 before collapsing toward the day’s low of 0.6195.
Additionally, to the abovementioned, Federal Reserve officials continued to cross newswires, though they gave mixed signals. Atlanta’s Fed President Raphael Bostic said he favors one more hike, then asses what’s needed in monetary policy. Contrarily, Fed Governor Christopher Waller noted that further tightening is need for a “substantial period and longer than markets anticipate.” Chicago’s President Austan Golsbee said he would focus on tighter credit conditions and lending data regarding his decision for the upcoming May 2-3 meeting.
On the New Zealand (NZ) front, the Business PMIS came at 48.1, below the prior’s month 51.7. Data was mainly ignored by NZD/USD traders, focusing on the following week’s CPI report, with estimates of 1.8% on QoQ Q1 inflation, while YoY is expected to remain at 7.2%.
NZD/USD Technical Levels
-
20:15
USD/CAD: Scope to move lower based on BoC and oil – MUFG
USD/CAD is on its way to the lowest weekly close since February below 1.3400. Analysts at MUFG Bank see that the Canadian Dollar has some scope in the short term to outperform.
Key quotes:
“We have been somewhat cautious over the prospects for CAD and indeed over the year as a whole, we suspect CAD will be a laggard versus most of G10 but taking a short term horizon we do see some scope for CAD to outperform.”
“We don’t expect any additional rate hikes but the resilience of the economy and the BoC’s modestly more hawkish communication this week has helped keep the USCA 2yr swap at levels supportive for further USD/CAD declines.”
“Our rates/crude oil short-term regression model indicates scope for USD/CAD to fall a couple of big figures from here. The IMM analysis below also reveals that CAD shorts are most stretched based on our z-score analysis and that could prompt some CAD buying as well.”
-
20:10
GBP/USD: Can the pound continue to outperform? – MUFG
The strength of the British Pound is reflecting less bad news rather than actual good news, point out analysts at MUFG Bank. They point out that next week UK data (inflation and employment) will be key for the Bank of England.
Key quotes:
“While the pound has performed well this year, data this week may have weighed on near-term performance. The pound is the 3rd worst performing G10 currency this week and the data yesterday looks to be weighing a little on GBP now, with EUR/GBP drifting higher. EUR/GBP is 0.7% higher this week with most of that gain coming since yesterday.”
“The break in GBP/USD above the 1.2500 level which has coincided with the break higher in EUR/USD is significant technically and in circumstances of US dollar sentiment remaining unchanged, there is certainly scope for the move to extend higher, in particular given the lack of conviction behind the move evident in IMM positioning data.”
“A weak set of data next week that changes expectations on a BoE rate hike on 11th May could well undermine GBP performance but that is more likely to be evident versus EUR than against the rest of G10 given many central banks have already moved to a pause and the curve in the US points to aggressive cuts by year-end.”
-
20:02
Argentina Consumer Price Index (MoM) climbed from previous 6.7% to 7.7% in March
-
19:40
Forex Today: Dollar revives, but not out of the woods
Here is what you need to know for next week:
Markets are offering mixed signs amid an uncertain outlook. Not even central bankers know what to do next. After crucial economic data from the US, what is clear is that the economy is softening and inflation is slowing down. Another week went without a banking failure.
The US Dollar staged a strong recovery on Friday, trimming weekly losses. Despite the revival, the trend remains down. Expectations point to one last rate hike by the Federal Reserve (Fed) in May and a long pause, before rate cuts. The bond market sees a recession ahead and, by the end of the year, lower interest rates than the current ones.
Next week, the S&P Global PMIs will offer the first glance of economic activity during April across the globe, an essential report in times of concerns about growth and central banks' "data-dependence". Growth data from China will show the extent of re-opening. The latest export data was encouraging, helping global risk sentiment.
The US Dollar Index dropped for the fifth consecutive week and posted the lowest weekly close since May. The DXY closed above 101.50, far from the lows, a positive sign for the US Dollar that does not suggest a reversal yet, but could point to a consolidation.
As has been the case since late February, EUR/USD rose for another week, and reached the highest level in a year above 1.1000. The trend is still up, but some exhaustion signs are spotted. Eurozone's PMIs next week could be critical for European Central Bank (ECB) expectations. Markets see the ECB raising rates further, but weak numbers could change the outlook for the second half of the year.
GBP/USD ended flat around 1.2400 after retreating from a multi-month high above 1.2500. The deterioration in risk sentiment on Friday weighed on the Pound, which lagged the Euro. EUR/GBP posted the highest weekly close since February above 0.8850. Critical UK data is due next week, with job numbers and consumer inflation.
USD/JPY finished the week little changed, with modest gains near the 133.00 area. The Japanese Yen lost strength amid risk appetite and after hopes for a turnaround in Bank of Japan's (BoJ) monetary policy stance vanished following the first press conference of Kazuo Ueda, the new governor.
USD/CHF continued to slide and broke decisively under 0.9000, to hit the weakest level since January 2021. The Swiss Franc and the Loonie were the top performers in the G10 space. USD/CAD bottomed around 1.3300, the lowest since February, then rebounded to 1.3400, to end the week with a loss of 140 pips. Next week, consumer inflation (Tuesday) and retail sales (Friday) are due in Canada.
When it looked like AUD/USD was ready for a run above 0.6800, it retreated, holding in the familiar range near 0.6700. This week's data showed strength in the labor market. The Reserve Bank of Australia (RBA) is still seen on hold at the next meeting. Next Tuesday, the central bank will release the minutes with details on the decision to pause the tightening cycle.
NZD/USD continued to retreat from the peak at 0.6378, which followed the Reserve Bank of New Zealand (RBNZ) 50 basis point rate hike, and ended near 0.6200. New Zealand's Q1 inflation is due on Thursday.
Latin American currencies were the best weekly performers despite falling on Friday. The Colombian Peso and the Chilean Peso gained more than 2.5% each versus the US Dollar.Gold looked at record highs and blinked, retreating on Friday to $2,000. The trend is still to the upside, but the sharp correction raises doubts about the short-term bullish potential. Silver lost 2% on Friday, trimming some of its weekly gains, but still scoring the fifth advance in a row.
Bitcoin gained 8% during the week and it was holding above $30,000 at the highest level since June 2022.
Like this article? Help us with some feedback by answering this survey:
Rate this content -
19:35
BoC’s Macklem: Officials discussed need for potential hikes at last meeting
Bank of Canada (BoC) Governor, Tiff Macklem mentioned on Friday, that the governing council discussed raising interest rates on Wednesday when they decided to leave them on hold at 4.50%, as expected.
BoC Governor reiterated that interest rates may need to stay at higher levels for a longer period of time to get inflation back to the target. Regarding quantitative tightening, he said that will likely continue amid interest rate normalization, but it could end earlier if the economy needs stimulus.
Macklem is in Washington attending the International Monetary Fund Spring Meeting.
Market reaction
USD/CAD is hovering around 1.3365, up on Friday, but on its way to the lowest weekly close since February. The Loonie outperformed during the week.
-
19:07
AUD/USD reverses course below 0.6700 after hitting resistance at 200-day EMA
- Retail Sales in the United States plunged as Industrial Production decelerated.
- US Consumer Sentiment improved, but the needle on inflation expectations rose.
- AUD/USD Price Analysis: Could test 0.6600 with a daily close below 0.6700.
AUD/USD reverses its course after failing to break the 200-day Exponential Moving Average (EMA) at 0.68099m re-treating beneath 0.6700. economic news from the United States (US), alongside a hawkish tone of US Federal Reserve (Fed) officials, were the driving factors of AUD/USD’s price action. The AUD/USD is trading at 0.6698, down 1.26%.
Risk-off impulse, and US consumer’s higher inflation expectations, bolstered the USD
Sentiment remains deteriorated. US Retail Sales in March dropped 1% MoM, disappointing analysts and indicating a sharper contraction than the anticipated 0.4%. Annual data for the month was 2.9%, falling short of the previous month’s 5.9%. Simultaneously, the Fed disclosed that Industrial Production had decreased for the first time in 2023, expanding only 0.4% MoM, trailing behind February’s 0.9% data and lower than the projected 0.2%. A reduction in durable goods caused a decline in production output.
In April, the University of Michigan (UoM) Consumer Sentiment poll indicated a rise in sentiment from 62 to 63.5. However, there was a 1% increase in inflation expectations for one year, climbing from 3.6% to 4.6%.
Following the UoM report, the AUD/USD extended its losses, as shown by US Treasury bond yields pushing higher, while the US Dollar (USD) jumped from new two-week lows of around 100.788, as portrayed by the US Dollar Index (DXY).
On the Australian front, a solid employment report crushing estimates of 20K, at 53K in March, suggests that although the Reserve Bank of Australia (RBA) paused hiking rates, the RBA might resume its campaign as the Unemployment Rate dipped to 3.5% from 3.6%. In the latest meeting, the RBA’s Governor Philipe Lowe said that the pause did not imply that further increases were off the table and commented that the central bank would be data dependent.
AUD/USD Technical Analysis
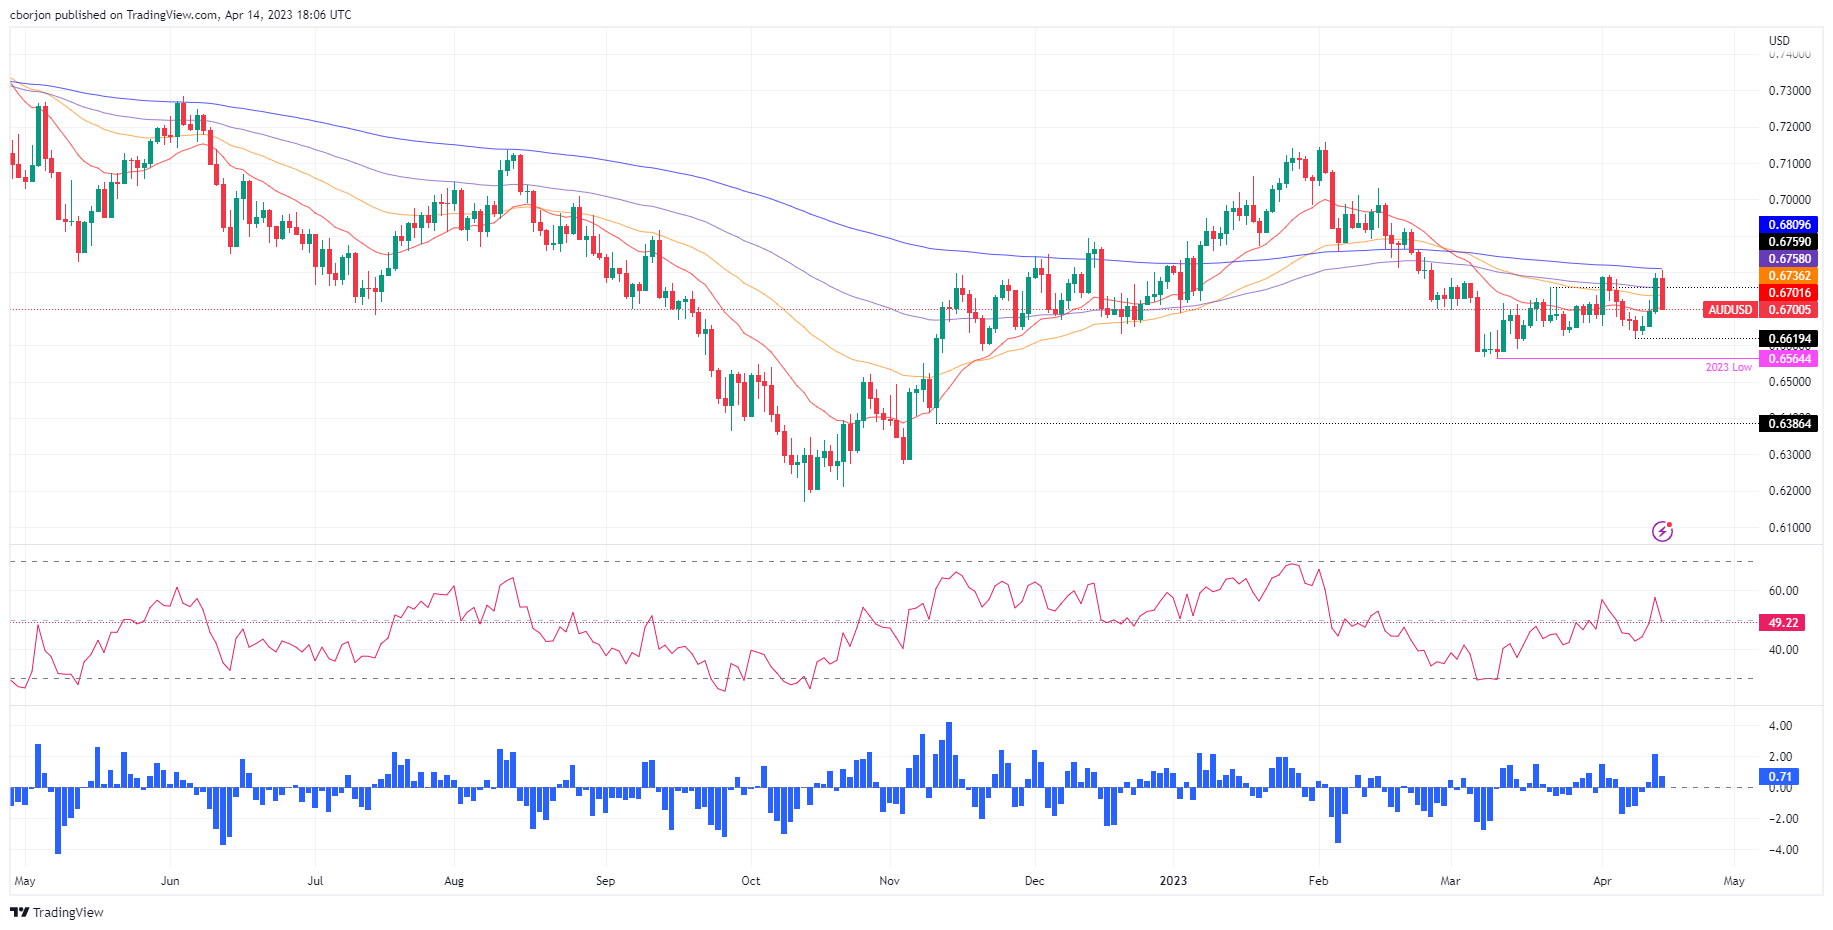
Given the backdrop, the AUD/USD plummeted sharply after testing the 200-day EMA. Nevertheless, the fall could be capped by the 20-day EMA at 0.6701, a price level sought by buyers, as the last line of defense. A further decline could pave the way toward the April 13 low at 0.6685, followed by the weekly low at 0.6619.
-
18:07
Colombia Retail Sales (YoY) down to 0.1% in February from previous 1.2%
-
18:07
United States Baker Hughes US Oil Rig Count fell from previous 590 to 588
-
17:19
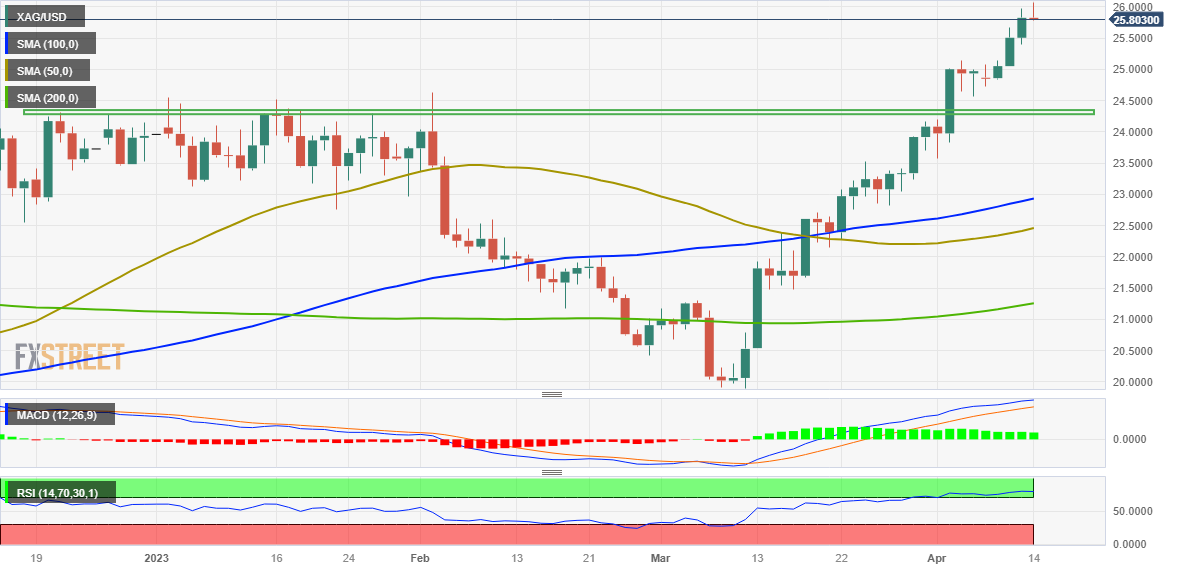
Silver Price Analysis: XAG/USD hit YTD high at $26.08 but retreated on a bearish-engulfing pattern
- XAG/USD is poised for five consecutive weeks of gains, up 0.81%.
- Silver’s break below $26.00 opened the door for a test of $25.00.
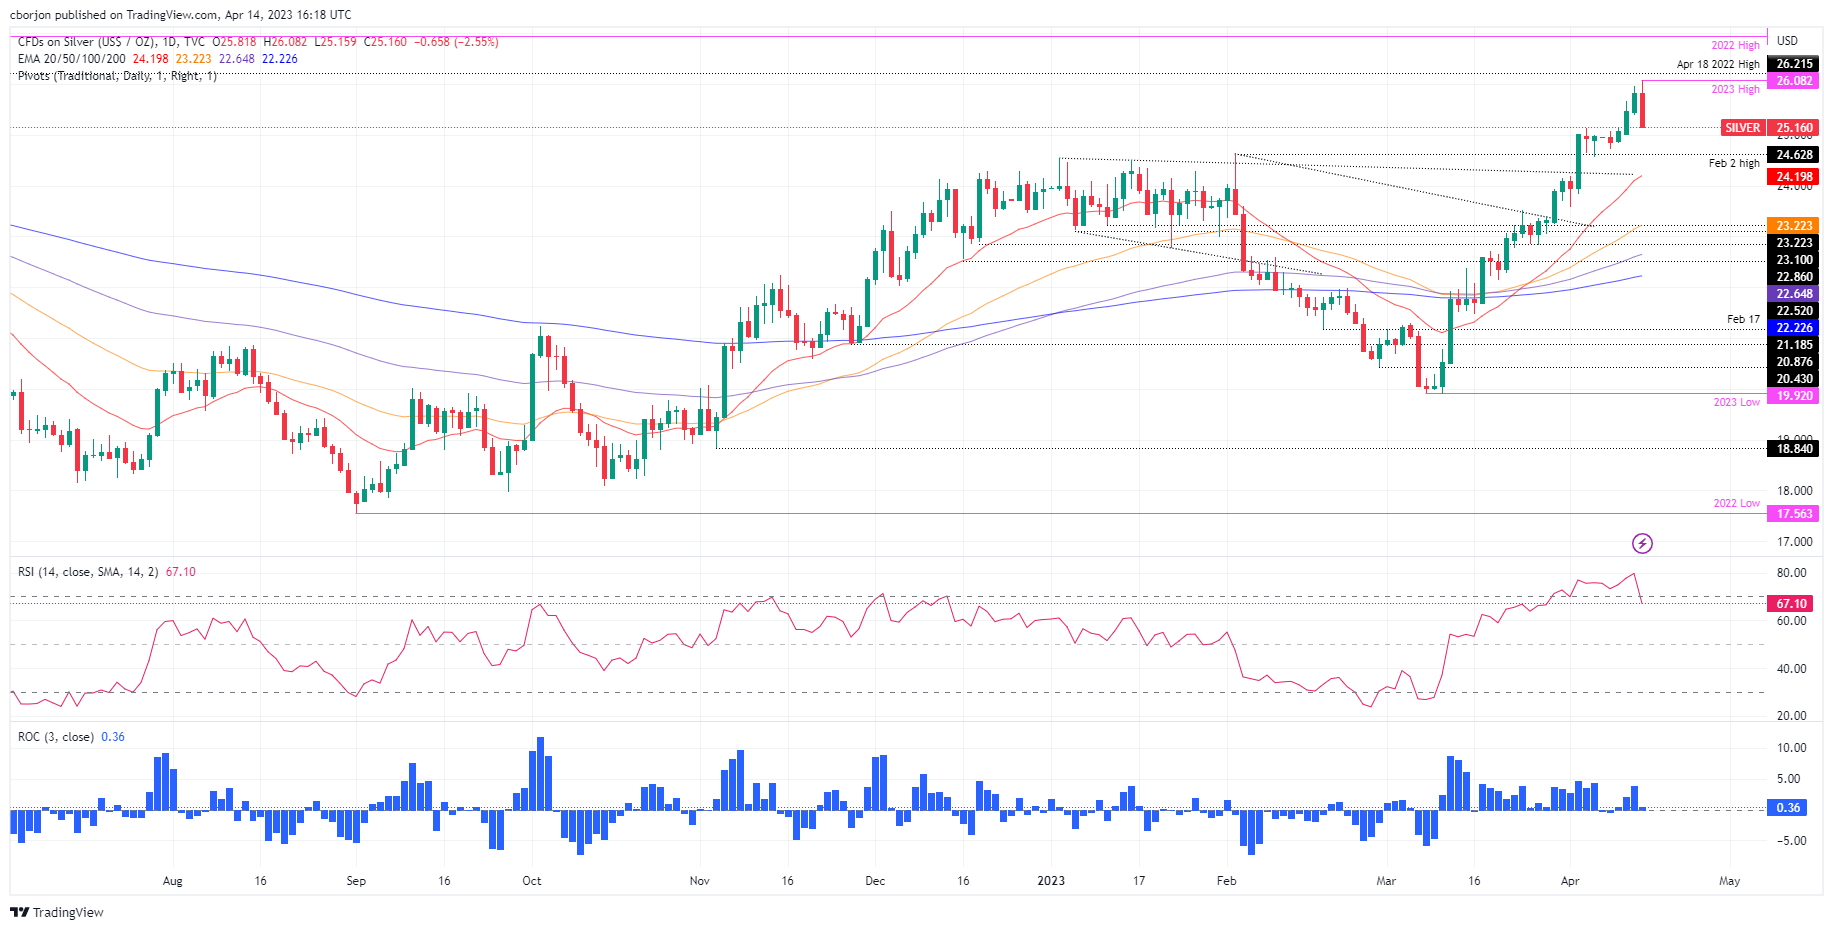
Silver price reached a new YTD high at $26.08, but retraces, as traders booking profits, are forming a bearish-engulfing candle pattern, suggesting that further downside is warranted. Among technical indicators, US economic news and Fed speakers underpinned the US Dollar (USD) to the detriment of the white metal. At the time of typing, the XAG/USD is trading at $25.23, down 2.26%.
XAG/USD Price Action
The XAG/USD is still upward biased from a daily chart perspective. The emergence of a bearish candlestick pattern and the Relative Strength Index (RSI) exiting oversold territory triggered profit-taking in the white metal. Additionally, a negative divergence between XAG/USD’s price action and the Rate of Change (RoC) indicates that buying pressure is waning, exacerbating Silver’s drop below $26.00.
If XAG/USD falls below $25.00, that will pave the way toward the February 2 high at $24.63, the previous resistance turned support, followed by the 20-day Exponential Moving Average (EMA) at $24.20. Once cleared, the psychological $24.00 level would be next.
Conversely, for a bullish continuation, the XAG/USD needs to get above the April 13 low of $25.40, which could motivate XAG buyers to re-enter the market at solid price levels. In that case, the XAG/USD first resistance would be the YTD high at $26.08, followed by April 18, 2022, swing high at $26.21, followed by 2022 high at $26.94.
XAG/USD Daily Chart
XAG/USD Technical Levels
-
16:45
US: Retail sales fell sharply as consumers became more cautious – CIBC
Retail Sales dropped 1% in March in the US, a larger-than-expected contraction. Despite those numbers, analysts at CIBC still see the Federal Reserve raising rates in May, for the last time.
Key quotes:
“US retail sales fell sharply in March as consumers became more cautious, adding to other recent data releases that have signaled a deterioration in activity.”
“The Fed is looking for definitive signs of a cooling in activity and this print is a step in the right direction, but with sales volumes in the control group still 5.8% above their pre-pandemic trend level, this won't prevent a 25bp hike at the May FOMC."
“This data adds to signs of a deterioration in activity that will likely intensify in the second quarter, but the progress in cooling activity won't be enough to prevent a final 25bp Fed hike in May.”
-
16:42
GBP/USD: Risks of dips to 1.20 this year – Rabobank
Analysts at Rabobank see risks of a decline in the GBP/USD pair to 1.20 this year, based on their view that further bouts of Dollar strength are likely.
Key quotes:
“In our view, a move in cable above the 1.26 would likely have to be initiated by further broadbased USD weakness. The market is putting distance between itself and last month’s banking sector jitters.”
“The cautious recovery in sentiment has pushed against the safe haven USD which has also being undermined by market optimism that the Fed may be cutting interest rates before the end of the year to soften recessionary risks. While the USD may retain a softer profile nearterm we see risk of further bouts of USD strength this year.”
“We cannot rule out the risk of further choppy conditions in the USD’s outlook and for choice we maintain the view that the USD will strengthen on a 6 month view. This suggests risks of a drop in cable back to the 1.20 area this year.”
-
16:34
EUR/USD tumbles amid stronger Dollar, drops below 1.1000
- US Dollar strengthens on Friday after US data and Fed talk.
- EUR/USD drops 80 pips from top, but holds firm to weekly gains.
The EUR/USD is losing ground on Friday as the US Dollar recovers a part of recent losses. The pair reached a fresh daily low at 1.0987 moving away from the one-year lows it hit on European hours at 1.1075.
The US Dollar Index (DXY) is up by 0.50% on Friday, hovering around 101.50 following mixed US economic data. Comments from Federal Reserve officials and higher US yields helped the Dollar.
Fed Governor Christopher Waller said that the central bank has not made much progress on the inflation goal and argued rates need to rise further. In an interview with CNBC, Chicago Fed President Austan Goolsbee mentioned that “a mild recession is definitively on the table as a possibility.”
Economic data came in mixed, with lower-than-expected numbers from Retail Sales, but Industrial Production and University of Michigan’s Consumer Sentiment rose more than expected.
Following data and comments, US yields jumped. The 2-year Treasury yield rose from under 4% to 4.10% and the 10-year from 3.45% to 3.52%. Eurozone bond yields are also rising but at a slower pace.
Despite Friday’s reversal, EUR/USD is still on its way to the highest weekly close in a year. It is holding up, however, the retreat from the highs raises doubts about more gains for the next session.
Price is hovering around daily lows at 1.0990. The next support area is seen at 1.0970 followed by 1.0935. On the upside, 1.1040 could become the immediate resistance.
Technical levels
-
16:25
USD/CAD rebounds from weekly lows on Fed speakers’ comments, despite soft US data
- USD/CAD is set to trim some of its weekly losses, with bulls eyeing 1.3400.
- US Retail Sales take a nosedive, plunging 1% MoM in March, while Industrial Production falls for the first time in 2023.
- Inflation expectations for one year in the United States soared 1%, from 3.6% to 4.6%.
The USD/CAD snaps four days of straight losses and bounces from weekly lows around 1.3300 early in the North American session. A tranche of US data flashes the economy is feeling the cumulative tightening by the US Federal Reserve (Fed) while Consumer Sentiment improved. The USD/CAD is trading at 1.3366, above its opening price.
US consumer sentiment improved, but inflation expectations rose
The Canadian Dollar (CAD) encountered headwinds like Fed’s official Christopher Waller saying that more tightening is needed amidst a solid labor market and stickier core inflation on the consumer and producer side. US Retail Sales disappointed analysts and plunged 1% MoM in March, compared to a 0.4% contraction. Annually-based data was 2.9%, below the prior’s month 5.9%.
At the same time, the Fed revealed that Industrial Production in March fell for the first time in 2023, expanding 0.4% MoM vs. estimates of 0.2%, and trailed February’s 0.9% data. Production output dropped due to a pullback in durable goods.
Lately, the University of Michigan (UoM) Consumer Sentiment poll showed an improvement in sentiment in April, up from 62 to 63.5, though inflation expectations for one year jumped 1% from 3.6% to 4.6%. That exacerbated a jump in US bond yields, with the 2-year recovering some ground, jumping 13 basis points, at 4.105%, and underpinning the US Dollar.
The US Dollar Index, a measure of the buck’s value against six currencies, is making a U-turn, up 0.48%, at 101.487.
Another Fed official, Chicago’s President Austan Golsbee, noted that he would focus on tighter credit conditions and lending data regarding his decision for the upcoming May 2-3 meeting. Golsbee added that although inflation is cooling, there is some “clear stickiness: in some price categories.
On the Canadian front, Statistics Canada revealed that manufacturing sales slid 3.6% in February, weighed by sales of petroleum and coal products. Expectations were for a 2.7% plunge, though the slippage in oil and coal products of 14.8% dragged the index lower.
USD/CAD Technical analysis
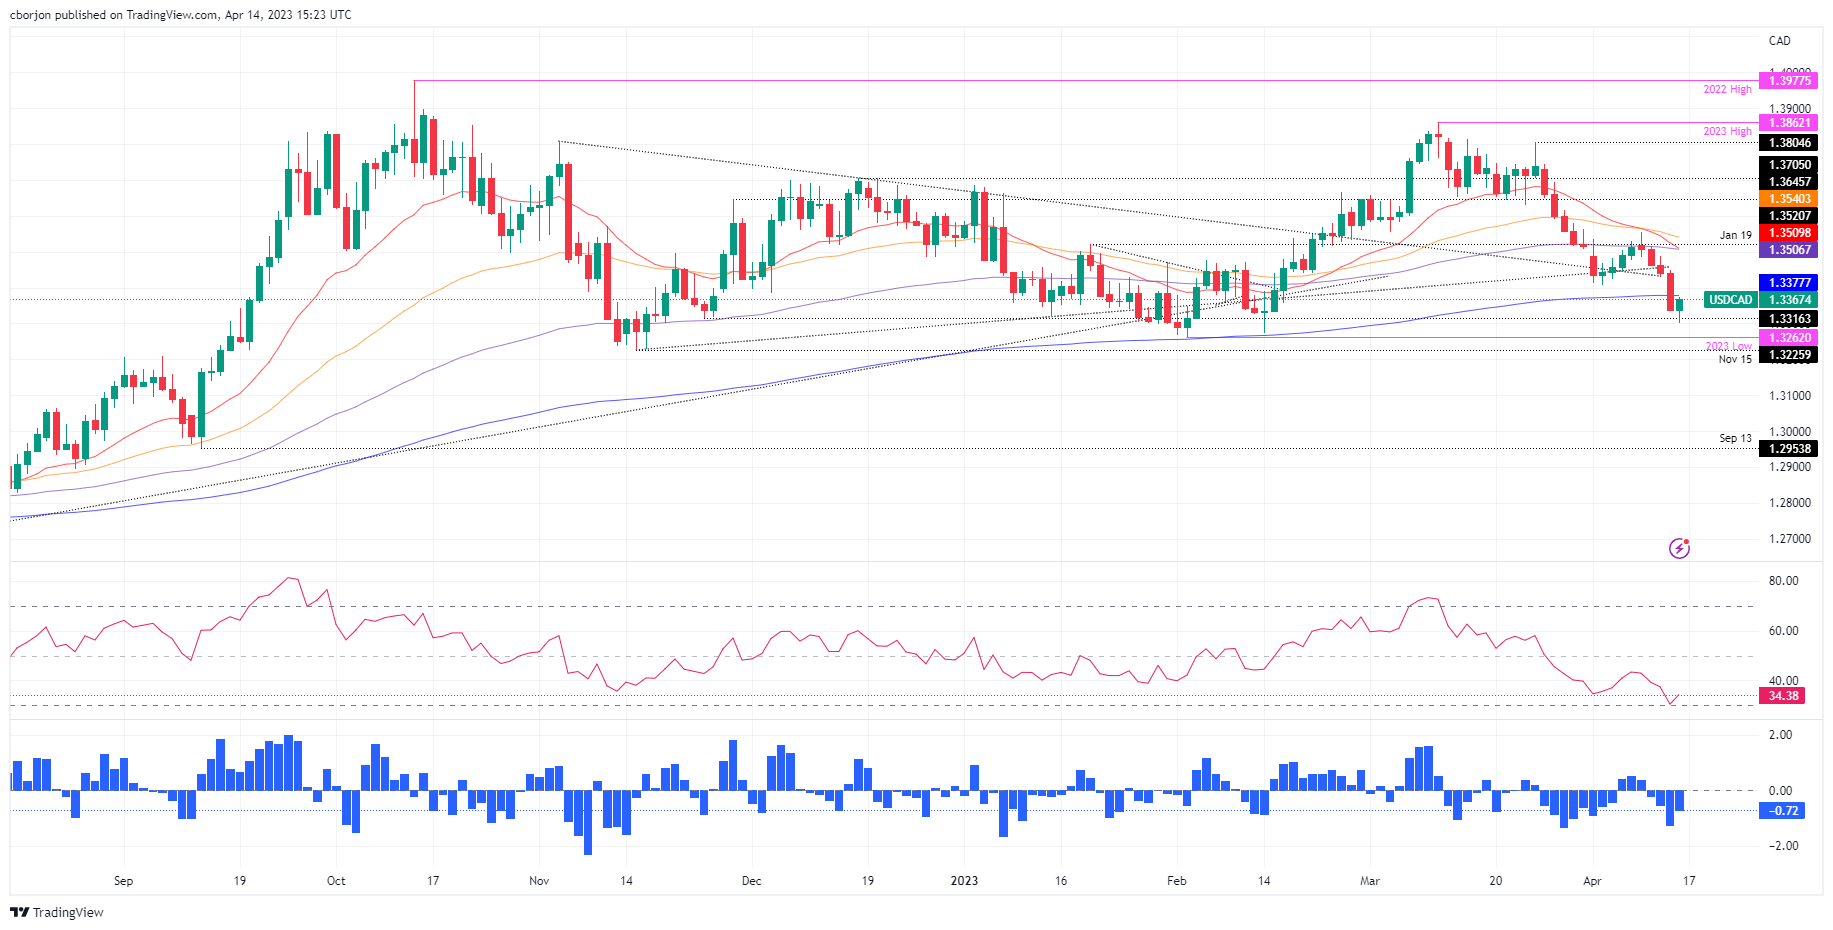
Given the backdrop, the USD/CAD found some bids before the weekend, though the upward correction toward the 200-day Exponential Moving Average (EMA) at 1.3377 could be short-lived. If USD/CAD buyers reclaim the 200-day EMA, that will expose 1.3400 and could shift the pair’s bias to neutral, with a daily close above the latter. Otherwise, USD/CAD sellers might step in and drag prices towards the YTD low at 1.3262, ahead of falling to 1.3200.
-
16:05
Colombia Industrial output (YoY) rose from previous 0.2% to 0.4% in February
-
15:23
GBP/USD tumbles below 1.2450 as US Dollar strengthens
- US Dollar rises across the board after US data.
- US bond yields and stocks rise despite weaker economic figures.
- GBP/USD erases most of the week’s gains on Friday.
The US dollar is rising sharply on Friday, trimming weekly losses after the release of US economic data. GBP/USD is falling almost a hundred pips on the day, trading at 1.2445.
The pair changed its course after reaching a fresh multi-month high on Asian hours at 1.2546. From the top it dropped more than a hundred pips, and bottomed after Wall Street’s opening bell at 1.2435.
USD shines despite US data
The US Dollar is up across the board, ending a three-day negative streak and recovering from the lowest levels in months. Higher US yields are supporting the Greenback on Friday. The US 10-year yield reached 3.50% and the 2-year is at 4.09%, up by 2.90% for the day.
Data from the US came in mixed. Retail Sales dropped by 1% in March, more than the 0.4% expected. Industrial Production expanded 0.4%, more than the 0.2% forecast. University of Michigan’s Consumer Sentiment Index improved in April to 63.5 from 62.
The key support to the Dollar came from Fed talk. Federal Reserve Governor Christopher Waller said on Friday that the central bank has not made much progress on the inflation goal and said rates need to rise further. In an interview with CNBC, Chicago Fed President Austan Goolsbee argued that “mild recession” is definitively on the table as a possibility.
Technical levels
-
15:05
US: UoM Consumer Confidence Index improves modestly to 63.5 in April vs. 62 expected
- Consumer Confidence Index in the US rose slightly in April.
- US Dollar Index clings to daily recovery gains above 101.00.
Consumer sentiment in the US improved modestly in early April with the University of Michigan's (UoM) Consumer Confidence Index rising to 63.5 (preliminary) from 62 in February. This reading came in better than the market expectation of 62.
"Year-ahead inflation expectations rose from 3.6% in March to 4.6% in April," the UoM further noted. "Uncertainty over short-run inflation expectations continues to be notably elevated, indicating that the recent volatility in expected year-ahead inflation is likely to continue. The bumpiness in inflation expectations is limited to the short run as long-run inflation expectations remained remarkably stable."
Market reaction
The US Dollar Index edged higher with the immediate reaction to this report and was last seen rising 0.3% on the day at 101.30.
-
15:00
United States UoM 5-year Consumer Inflation Expectation remains at 2.9% in April
-
15:00
United States Michigan Consumer Sentiment Index above forecasts (62) in April: Actual (63.5)
-
15:00
United States Business Inventories registered at 0.2%, below expectations (0.3%) in February
-
14:49
US: Consumer spending gradually losing momentum – Wells Fargo
Data released on Friday showed a larger-than-expected decline in US Retail Sales in March. According to analysts at Wells Fargo, the level of spending remains elevated, demonstrating there remains an underlying resilience among consumers.
Retail Sales slip again after unusually strong start to year
“But even with some payback after an unusually strong start to the year, the level of retail spend is still nearly 2% ahead of where it was in December. More plainly, consumers continue to spend at an elevated level, though the momentum appears to be downshifting.”
“The March retail sales data demonstrate continued reversal after an unusually strong gain in January sales. Consumers' appetite continues to shift away from goods, particularly those that come with a high price tag or typically require financing. The rise in borrowing costs over the past year may be starting to bite consumers desire to take on credit card debt or purchase a new auto or appliance.”
“Lost momentum and the slow end to the first quarter for retail positions for a weak second quarter of spending. We anticipate consumer spending continues to gradually lose momentum through Q2 before growth slips negative later this year.”
-
14:43
Gold Price Forecast: XAU/USD recedes from tops near $2050
- Gold prices correct lower after three daily gains in a row.
- The dollar’s rebound along with higher yields weigh on bullion.
- US Retail Sales surprised to the downside in March.
Following new 2023 highs near the $2050 mark per ounce troy as well as a 3-day positive streak, the precious metal embarked on a corrective decline which has so far met initial contention near $2015 on Friday.
Corrective drop triggered by USD, yields
The so far daily retracement in the yellow metal came in response to the rebound in the greenback after the USD Index (DXY) sank to new 2023 lows in the 100.80/75 band earlier in the European session. Also weighing on bullion appears the moderated bounce in US yields across the curve, at the time when investors continue to price in a 25 bps rate hike by the Fed at the May 3 gathering.
According to CME Group’s FedWatch Tool, the probability of the above-mentioned scenario hovers around the 80%, from around 40% a month ago.
Gold price technical outlook
If gold surpasses the so far 2023 peak at $2048 (April 13) it could then open the door to a probable move to the 2022 high at $2070 (March 8), which lies just ahead of the all-time top at $2075 (August 7 2020). Bears, in the meantime, should clear the minor support at the weekly low at $1981 (April 10) to spark a deeper retracement to the April low at $1949 (April 3) ahead of another weekly low at $1934 (March 22). Further losses could put the 55- and 100-day SMAs at $1909 and $1874, respectively, back on the traders’ radar prior to the March low at $1809 (March 8) and the 2023 low at $1804 (February 28).
-
14:25
US: Industrial Production rises by 0.4% in March vs. 0.2% expected
- Industrial Production in the US grew at a stronger pace than expected in March.
- US Dollar Index stays in positive territory above 101.00.
Industrial Production in the US expanded by 0.4% in March following February's increase of 0.2% (revised from 0%), the US Federal Reserve reported on Friday. This reading came in slightly better than the market expectation for a growth of 0.2%.
"In March, manufacturing and mining output each fell 0.5 percent," the Fed further noted in its publication. "Capacity utilization moved up to 79.8 percent in March, a rate that is 0.1 percentage point above its long-run (1972–2022) average."
Market reaction
The US Dollar stays resilient against its rivals after this report and the US Dollar Index was last seen rising 0.2% on the day at 101.22.
-
14:18
China: Exports surged in March – UOB
Economist at UOB Group Ho Woei Chen reviews the latest trade balance figures in China.
Key Takeaways
“Exports unexpectedly surged in Mar while imports were less robust but still came in above consensus’ expectation. China’s shipments improved amid the normalisation of domestic production and stronger demand from the Asian and European markets.”
“In volume terms, China’s imports of commodities such as crude and refined petroleum, LPG, coal and iron ore were strong compared to the year-ago period which is an indication of inventory rebuilding, pick-up in construction activity and concerns over energy shortages particularly as domestic demand rebounds. Commodity imports are expected to continue benefiting from domestic demand recovery and stronger construction activities ahead.”
“In 1Q23, exports rose 0.5% y/y while imports contracted by 7.1% y/y. Despite the strong export data, we are less convinced of a sustained improvement in China’s export outlook as global demand has remained sluggish with an upturn only expected in the later part of this year.”
“Overall, we maintain our forecast for China’s export to register a contraction of 3.0% this year while imports may see a small gain of around 2.0% in 2023 as domestic demand recovers.”
-
14:15
United States Industrial Production (MoM) came in at 0.4%, above forecasts (0.2%) in March
-
14:15
United States Capacity Utilization above expectations (79%) in March: Actual (79.8%)
-
14:02
EUR/USD Price Analysis: Outlook keeps pointing to extra gains near term
- EUR/USD clinches new YTD peak before sparking a corrective decline.
- The continuation of the uptrend could revisit the round level at 1.1100.
EUR/USD deflates from earlier 2023 highs around 1.1075 at the end of the week.
Despite the knee-jerk, the pair’s outlook keeps favouring the continuation of the uptrend for the time being. Against that, the surpass of the YTD high at 1.1075 (April 14) could then dispute the round level at 1.1100 prior to the weekly high at 1.1184 (March 21 2022).
Looking at the longer run, the constructive view remains unchanged while above the 200-day SMA, today at 1.0368.
EUR/USD daily chart
-
13:52
USD/JPY jumps above 133.00 after weak US Retail Sales
- US dollar gains momentum after US retail sales data.
- Data comes in below expectations but triggers dollar’s correction.
- USD/JPY bounces almost a hundred pips.
The USD/JPY rose sharply after the release of US economic data and climbed to 133.18, hitting a fresh daily high. The Greenback appreciated across the board despite a larger-than-expected slide in March Retail Sales.
US data below expectations
Retail Sales drooped 1% in March, against the consensus of a 0.4% slide; following a 0.2% decline (revised from -0.4%) in February. Sales excluding autos fell by 0.8% in March, more than the decline expected of 0.3%.
The Import Price Index fell at an annualized rate of 4.6%, more than the 3.7% of market consensus, and the Export Price Index fell by 4.8%, more than the 4.2% slide expected.
The latest economic figures suggest some weakness in demand and also diminishing inflation pressures. However, the immediate reaction following US Retail Sales triggered a bullish correction of the US Dollar across the board. US yields rose sharply, probably amid expectations of even weaker-than-expected figures. Wall Street futures remain in positive ground. The Japanese Yen printed fresh lows versus its main rivals.
The USD/JPY initially dropped to 132.17 and then bounced almost a hundred pips in a few minutes. It is trading at 133.10, at daily highs. The next resistance level is seen on Thursday’s high at 133.40. On the flip side, now 132.80 is the immediate support.
Technical levels
-
13:51
Fed's Waller: Fed hasn't made much progress on inflation goal, rates need to rise further
Federal Reserve Governor Christopher Waller argued on Friday that the recent data show that the Fed hasn't made much progress on its inflation goal and added that rates need to rise further, as reported by Reuters.
Key takeaways
"Extent of further increases depends on incoming data, credit tightening."
Still uncertain how SVB failure, bank stress, will impact broader credit conditions."
"Monetary policy will need to remain tight for a substantial period, and longer than markets anticipate."
"First quarter 2023 data continue to surprise with stronger growth, job creation."
"Significant credit tightening could offset need for rate hikes, but judgment difficult in real time."
"Developments so far validate decision to raise rates at last meeting, but continuing to watch data even more closely than usual."
"Liquidity steps taken after SVB failure appear to have succeeded in stabilizing the banking system."
Market reaction
The US Dollar benefits from these hawkish comments and the US Dollar Index was last seen rising 0.3% on the day at 101.30.
-
13:47
Fed’s Goolsbee: Mild recession is definitely on the table as a possibility
In an interview with CNBC on Friday, Federal Reserve Bank of Chicago President Austan Goolsbee said that a mild recession in the US was definitely on the table as a possibility, as reported by Reuters.
Additional takeaways
"When you have financial tightening occurring, that does the work of monetary policy."
"We still have several weeks before May meeting."
"I don't want to comment yet on what I am for at that meeting; still want to see the data."
"But let's be mindful we've raised a lot; some of the lag is coming through possibly in today's retail sales number."
"Inflation is coming down, still got clear stickiness on some inflation."
"Producer prices and retail sales show we are moving in right direction."
"I am focused on what is happening with credit conditions."
"We are spending too much time looking at wage growth as an indicator of prices."
"Wages do not serve as a leading indicator for inflation."
"We need to keep eye on prices series, not wages."
"I am going to spend next few weeks figuring out amount of credit tightening going on."
Market reaction
The US Dollar Index extends its recovery in the early American session after these comments and was last seen rising 0.3% on the day at 101.30.
-
13:32
Breaking: US Retail Sales decline by 1% in March vs. -0.4% expected
The data published by the US Census Bureau revealed on Friday that Retail Sales in the United States declined 1% on a monthly basis in March to $691.7 billion. This reading followed February's contraction of 0.2% (revised from -0.4%) came in worse than the market expectation for a decrease of 0.4%.
Retail Sales Ex-Autos fell by 0.8% in the same period, compared to analysts' estimate of -0.3%.
"Retail trade sales were down 1.2% from February 2023, but up 1.5% above last year," the publication further read. "Nonstore retailers were up 12.3% from last year, while food services and drinking places were up 13.0% from March 2022."
Market reaction
Following a quick decline with the immediate market reaction, the US Dollar Index reversed its direction and was last seen rising 0.15% on the day at 101.15.
-
13:31
United States Export Price Index (YoY) below expectations (-4.2%) in March: Actual (-4.8%)
-
13:31
United States Retail Sales (MoM) came in at -1%, below expectations (-0.4%) in March
-
13:31
United States Import Price Index (YoY) came in at -4.6%, below expectations (-3.7%) in March
-
13:30
United States Retail Sales ex Autos (MoM) came in at -0.8% below forecasts (-0.3%) in March
-
13:30
Canada Manufacturing Sales (MoM) below forecasts (-2.7%) in February: Actual (-3.6%)
-
13:30
United States Import Price Index (MoM) below expectations (-0.1%) in March: Actual (-0.6%)
-
13:30
United States Export Price Index (MoM) below forecasts (-0.1%) in March: Actual (-0.3%)
-
13:30
United States Retail Sales Control Group below forecasts (0.6%) in March: Actual (-0.3%)
-
13:14
AUD/USD flat-lines below 0.6700 mark, eyes US macro data for a fresh impetus
- AUD/USD stalls this week’s bullish trend near the 100-day SMA, just ahead of the 0.6700 mark.
- A modest USD recovery from a one-year high turns out to be a key factor acting as a headwind.
- Expectations for an imminent Fed rate-hike pause to cap the USD and lend support to the pair.
The AUD/USD pair struggles to capitalize on its weekly gains recorded over the past three sessions and seesaws between tepid gains/minor losses heading into the North American session on Friday. The pair, however, trades just a few pips below its highest level since February 24 touched on Thursday and is currently placed around the 0.6770-0.6775 area, nearly unchanged for the day.
A modest US Dollar (USD) bounce from a one-year low touched earlier this Friday is seen as a key factor acting as a headwind for the AUD/USD pair. The upside for the Greenback, however, remains capped amid firming expectations that the Federal Reserve (Fed) will pause its rate-hiking cycle amid signs of cooling inflationary pressures in the US. The bets were lifted by this week's release of softer consumer inflation figures and the Producer Price Index, which suggested that disinflation is progressing smoothly.
Apart from this, a generally positive risk tone might contribute to gains for the safe-haven buck and lend support to the risk-sensitive Aussie. Apart from this, the upbeat Australian jobs data on Thursday
revived bets for a 25 bps rate hike at the next Reserve Bank of Australia (RBA) meeting in May and supports prospects for the emergence of some dip-buying around the AUD/USD pair. That said, bulls might wait to move beyond the 100-day Simple Moving Average (SMA), around the 0.6700 mark, before placing fresh bets.Market participants now look forward to the US economic docket, featuring the release of monthly Retail Sales figures and the Preliminary Michigan Consumer Sentiment Index. This, along with the US bond yields and the broader market risk sentiment, might influence the USD price dynamics and provide some impetus to the AUD/USD pair. Nevertheless, spot prices remain on track to register strong weekly gains.
Technical levels to watch
-
12:41
When are US monthly Retail Sales figures and how could they affect EUR/USD?
US Monthly Retail Sales Overview
Friday's US economic docket highlights the release of monthly Retail Sales figures for March, due later during the early North American session at 12:30 GMT. The headline sales are expected to contract by 0.4% for the second straight month, while core sales, excluding automobiles, probably declined by 0.3% in March as compared to the 0.1% fall in the previous month. However, the downbeat expectations strengthen the case for an upside surprise.
According to Yohay Elam, Senior Analyst at FXStreet: “The relentless American consumer has a relatively low bar to pass, which may even be lower. The US retail sales report is highly important and will determine the closing moves of the week. I expect a small beat of the downbeat estimates, resulting in an ephemeral increase for the US Dollar, and an extension of the gradual gains in stocks.”
How Could It Affect EUR/USD?
Ahead of the key release, a modest US Dollar (USD) recovery from a one-year low keeps a lid on the EUR/USD pair's intraday uptick to the 1.1075 area, or the highest level since April 2022. A stronger US macro data could strengthen the USD further, though the immediate market reaction is likely to remain limited amid growing acceptance that the Federal Reserve (Fed) is nearing the end of its rate-hiking cycle.
Conversely, any disappointment from the US Retail Sales figures will reaffirm bets that the Fed will start cutting rates towards the end of the year, which should trigger a fresh leg down for the USD. This, in turn, suggests that the path of least resistance for the EUR/USD pair is to the upside and any meaningful pullback is more likely to attract fresh buyers at lower levels and remain limited.
Meanwhile, Eren Sengezer, Editor at FXStreet, offers a brief technical outlook and writes: “EUR/USD climbed out of the ascending regression channel and the Relative Strength Index (RSI) indicator on the four-hour chart rose toward 80, pointing to overbought conditions.”
Eren also outlines important technical levels to trade the EUR/USD pair“In case the pair stages a correction and returns within the ascending channel, 1.1020 (mid-point of the channel), 1.1000 (psychological level, static level) and 1.0970 (20-period Simple Moving Average (SMA)) align as support levels.”
“On the upside, 1.1100 (psychological level) aligns as the next bullish target ahead of 1.1150 (static level from March 2022),” Eren adds further.
Key Notes
• US Retail Sales Preview: Dollar set to jump above low barrier of expectations, three scenarios
• EUR/USD Forecast: Can Euro extend the rally?
• EUR/USD faces the next target at 1.1120 – UOB
About US Retail Sales
The Retail Sales released by the US Census Bureau measures the total receipts of retail stores. Monthly per cent changes reflect the rate of changes in such sales. Changes in Retail Sales are widely followed as an indicator of consumer spending. Generally speaking, a high reading is seen as positive (or bullish) for the USD, while a low reading is seen as negative (or bearish).
-
12:31
India FX Reserves, USD climbed from previous $578.45B to $584.76B in April 7
-
12:25
USD Index Price Analysis: A drop to 100.00 should not be ruled out
- DXY retreats further and prints fresh 2023 lows near 100.80.
- A deeper retracement could see the key 100.00 mark revisited.
DXY attempts a mild bounce off earlier 2023 lows in the 100.80/75 band at the end of the week.
If bears remain in control, the index could accelerate losses and put the psychological 100.00 mark to the test in the relatively short-term horizon. The loss of this region exposes a potential move to the late-March 2022 lows near 97.70.
Looking at the broader picture, while below the 200-day SMA, today at 106.36, the outlook for the index is expected to remain negative.
DXY daily chart
-
12:16
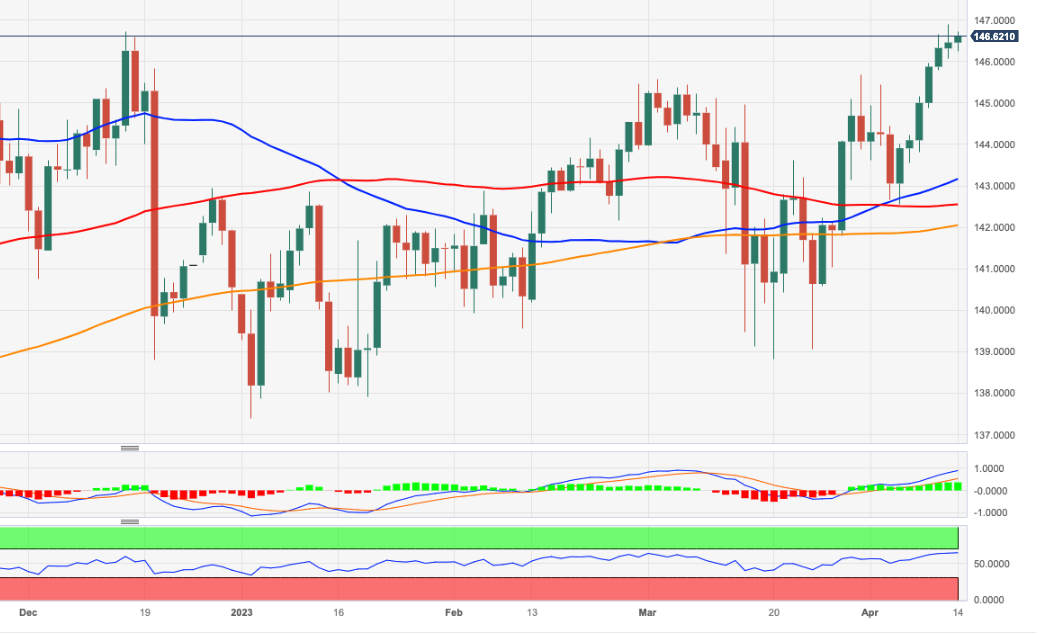
EUR/JPY Price Analysis: Next up-barrier emerges at the 2022 peak
- EUR/JPY remains well bid and trades close to the 147.00 region on Friday.
- The next target of note comes at the 2022 peak above 148.00.
The bid bias in EUR/JPY remains well and sound for yet another session at the end of the week.
Considering the ongoing price action, further gains in the cross remain in the pipeline for the time being. That said, the continuation of the upside momentum could extend further and challenge the 2022 peak at 148.40 (October 21) sooner rather than later.
So far, further upside looks favoured while the cross trades above the 200-day SMA, today at 142.02.
EUR/JPY daily chart
-
12:11
US: Inflation and FOMC Minutes till favour further tightening – UOB
UOB Group’s Head of Research Suan Teck Kin and Senior Economist Alvin Liew assess the latest US inflation figures and the FOMC Minutes.
Key Takeaways
“US headline consumer price index (CPI) increased by 0.1% m/m, 5.0% y/y in Mar (from 0.4% m/m, 6.0% y/y in Feb), slightly below Bloomberg’s survey and was also the lowest y/y headline reading since May 2021. However, core CPI (which excludes food and energy) proved to be stickier, as it rose sequentially at a faster m/m pace than the headline, at 0.4%, (from 0.5% in Feb). On a y/y basis, the Mar core CPI rose slightly faster to 5.6% (Feb: 5.5%).”
“US Inflation Outlook – For the full year, we still expect both headline and core inflation to average 3.0% in 2023, above the Fed’s 2% objective. But the 1Q CPI data showed that the balance of risk for US inflation remains on the upside as reflected by the persistent rise of shelter costs, still elevated food costs and components within core and services inflation remain elevated and rising.”
“Mar FOMC Minutes – Fed officials scaled back rate hike expectations this year due to the financial sector turmoil and monitoring for signs of a credit crunch. That said, Fed policymakers still raised their benchmark lending rate by 25-bps to a range of 4.75% to 5.00% in Mar, as they sought to balance the risk of a credit crunch with incoming data showing price pressures remained elevated. And furthermore, they did so even after taking into account that Fed staff economists were forecasting a “mild recession” later this year with recovery over the next two years.”
“FOMC Outlook – If our base case of no systemic impact on the US financial sector remains valid, it is reasonable to expect the US Fed to continue to stay focused on fighting inflation and push forward with its rate hike cycle. Thus, we will continue to assign a high probability the Fed will hike rates by a final 25bps to 5.00-5.25% at the upcoming May FOMC. We expect no rate cuts this year and this terminal rate of 5.25% to last through 2023.”
-
11:51
Gold Price Forecast: XAU/USD consolidates just below YTD peak ahead of US macro data
- Gold price enters a bullish consolidation phase near a fresh one-year high touched on Friday.
- Expectations for an imminent pause in the Federal Reserve's rate-hiking cycle lend support.
- The prevalent US Dollar selling bias further contributes to limiting the downside for the metal.
Gold price consolidates its recent gains to a fresh one-year high and seesaws between tepid gains/minor losses through the first half of the European session on Friday. The XAU/USD is currently placed around the $2,040 area and seems poised to prolong its recent upward trajectory witnessed over the past month or so.
Weaker US Dollar continues to underpin Gold price
The US Dollar (USD) languishes near its lowest level since April 2022 amid expectations that the Federal Reserve (Fed) will pause its rate-hiking cycle. This, in turn, is seen as a key factor acting as a tailwind for the US Dollar-denominated Gold price. Market participants now seem convinced that the Fed will be done with its policy tightening after hiking one last time in May in the wake of signs of easing inflationary pressures in the United States (US).
In fact, the US Producer Price Index (PPI) released on Thursday showed that US inflation at the wholesale level continued its downward slide and cooled dramatically in March. This comes on the back of the softer US Consumer Price Index (CPI) report on Wednesday and indicates that disinflation is progressing smoothly. Other data indicated that Jobless Claims rose more than expected last week, to the highest level since January 15, 2022.
Bets for an imminent pause by Federal Reserve also lend support
This was seen as a sign that labor market conditions were loosening up as higher borrowing costs continue to dampen demand in the economy, which should allow the Fed to pause after hiking one last time in May. Moreover, the March Federal Open Market Committee (FOMC) meeting minutes released on Wednesday revealed that several policymakers considered pausing interest rate increases after the failure of two regional banks.
Furthermore, Atlanta Fed president, Raphael Bostic, told Reuters this Friday that the recent developments are consistent with one more hike. This acts as a headwind for the US Treasury bond yields, which, in turn, keeps the USD bulls on the defensive and further acts as a tailwind for the non-yielding Gold price. Apart from this, a generally weaker tone around the equity markets is seen driving some haven flows towards the precious metal.
Looming recession risks further benefit the safe-haven XAU/USD
The International Monetary Fund (IMF) earlier this week trimmed its 2023 global growth outlook, citing the impact of higher interest rates. This, along with worries that the post-COVID recovery in China is losing steam, fuels recession fears and tempers investors' appetite for riskier assets. This, in turn, lends some support to traditional safe-haven assets, including the XAU/USD, and supports prospects for a further near-term appreciating move.
Traders now eye macro data from United States for a fresh impetus
That said, the slightly oversold Relatively Strength Index (RSI) on the daily chart is holding back traders from placing fresh bearish bets around the USD and acting as a headwind for the Gold price. Traders also prefer to wait on the sidelines ahead of Friday's US macro releases, monthly Retail Sales figures and the Preliminary Michigan Consumer Sentiment Index, which might influence the USD price dynamics and provide some impetus to the XAU/USD.
Gold price technical outlook
From a technical perspective, nothing seems to have changed for Gold price and the near-term bias remains tilted firmly in favour of bullish traders. Hence, some follow-through strength back towards retesting the all-time high, around the $2,070-$2,075 region, looks like a distinct possibility. On the flip side, any meaningful pullback could find decent support near the $2,020 area ahead of the $2,014-$2,013 region. The dip, however, is likely to attract fresh buyers near the $2,000 psychological mark, which should help limit losses for the XAU/USD near the $1,990-$1,980 horizontal support.
Key levels to watch
-
11:42
ECB's Lagarde: Inflation to continue to fall as lagged price pressures fade out
European Central Bank (ECB) President Christine Lagarde said on Friday that she expects inflation in the Euro area to continue to fall with lagged price pressure fading out, as reported by Reuters.
"Historically high wage growth, related to tight labour markets and compensation for high inflation, will support core inflation over the projection horizon, as it gradually returns to rates around our target," Lagarde further noted in her prepared statement delivered at the IMF spring event.
Market reaction
The EUR/USD pair showed no immediate reaction to these comments and it was last seen rising 0.1% on a daily basis at 1.1060.
-
11:33
USD/CNH risks extra losses below 6.8500 – UOB
Markets Strategist Quek Ser Leang and Senior FX Strategist Peter Chia at UOB Group suggest a deeper drop in USD/CNH is likely on a sustainable breach of 6.8500.
Key Quotes
24-hour view: “We expected USD to edge lower yesterday. However, we noted the mild downward momentum and held the view that any decline is unlikely to challenge 6.8500. USD dropped to a low of 6.8672 in NY trade. Downward momentum has improved, albeit not much. Today, USD is likely to trade with a downward bias but a clear break below 6.8500 is unlikely. Resistance is at 6.8780, followed by 6.8850.”
Next 1-3 weeks: “Our most recent narrative from Monday (10 Apr, spot at 6.8800) wherein we held the view that USD is likely to trade sideways between 6.8500 and 6.9200 for now. There is no change in our view for now even though, downward momentum is showing tentative signs of building. However, USD has to break clearly below 6.8500 before a sustained decline is likely. The likelihood of USD breaking below 6.8500 will increase in the next few days as long as USD stays below 6.9000.”
-
11:12
Fed's Bostic: Recent developments are consistent with one more rate hike in May
Atlanta Federal Reserve (Fed) President, Raphael Bostic, in an interview with Reuters this Friday, said that the recent developments are consistent with one more rate hike.
Additional quotes:
That can allow the Fed to pause and reassess.
We've got a lot of momentum suggesting that we're on the path to the 2% inflation target.
Still need to assess the economy, and inflation path to avoid unnecessary economic damage.
Rate increases in the past year now only starting to 'bite'; full impact may take some time.
Market reaction
The comments do little to influence the US Dollar (USD), which is seen languishing near a one-year high amid growing acceptance of an imminent pause in the Fed rate-hiking cycle.
-
11:00
US Dollar under pressure, Brazil’s Lula urges countries to ditch USD in trade
- US Dollar is struggling to find demand ahead of the weekend amid weak US data.
- Brazil President does not want to use US Dollar in international trade transaction.
- EUR/USD technical outlook shows that the pair could stage a technical correction in the short term.
The US Dollar (USD) stays on the back foot ahead of the weekend after having suffered large losses against its major rivals throughout the week. Soft inflation data from the United States, growing expectations for a Federal Reserve policy shift amid signs of economic slowdown and loudening calls to move away from the USD in trade transactions have been causing the currency to lose its value.
The US Dollar Index, which tracks the USD performance against a basket of six major currencies, touched its lowest level in over a year below 101.00 and is yet to stage a rebound.
Daily digest market movers: US Dollar eyes key US data releases
- While speaking at the inauguration ceremony of President Dilma Rousseff at the New Development Bank – formerly known as the BRICS bank – in Shanghai, Brazil President Luiz Inacio Lula Da Silva questioned why all countries have to use the US Dollar in their trade transactions. "Why can't a bank like BRICS have a currency that can finance the trade relationship between Brazil and China, between Brazil and other BRICS countries?" said Lula, adding to growing calls to look for an alternative currency to trade with.
- The US Census Bureau will release Retail Sales data for March, which is forecast to show a 0.4% contraction on a monthly basis.
- The Fed will publish Industrial Production figures for March and the University of Michigan’s will release the preliminary Consumer Sentiment Survey for April.
- The CME Group FedWatch Tool's probability for one more 25 basis points Fed rate increase in May holds near 70%. However, markets see a 90% chance that the Fed will lower its policy rate back to the range of 4.75%-5% by September, even if it opts for a rate hike at the upcoming meeting.
- The US Department of Labor's weekly publication revealed on Thursday that there were 239,000 Initial Jobless Claims in the week ending April 8, up from 228,000 in the previous week.
- The US Bureau of Labor Statistics (BLS) reported on Wednesday that the Consumer Price Index (CPI) declined to 5% on a yearly basis in March from 6% in February. This reading came in below the market expectation of 5.2%. Furthermore, the Core CPI, which excludes volatile food and energy prices, rose by 0.4% on a monthly basis, down from a 0.5% increase recorded in February.
- On Thursday, the BLS announced that the Producer Price Index (PPI) for final demand in the US declined to 2.7% on a yearly basis in March from 4.9% in February (revised from 4.6%). On a monthly basis, the PPI and the Core PPI came in at -0.5% and -0.1%, respectively, triggering a fresh leg of USD selloff.
- Commenting on the CPI inflation data, "the beginning of the end of rate hikes – or the beginning of the countdown toward slashing borrowing costs? That seems to be the message from markets, which are rushing forward to price the next moves of the Federal Reserve (Fed)," noted FXStreet analyst Yohay Elam. "The world's largest economy is experiencing a "process of disinflation" that is somewhat frustrating but is on the right track. Markets are buying it."
- San Francisco Federal Reserve Bank President Mary Daly said on Wednesday that the strength of the US economy and elevated inflation suggests that they have more work to do on rate hikes.
- Earlier in the week, NY Fed’s latest consumer survey revealed that the one-year inflation expectation climbed to 4.7% in March from 4.2% in February.
- NY Fed President John Williams argued on Monday that the pace of Fed rate increases was not behind the issues surrounding the two collapsed banks back in March. On Tuesday, "we've gotten policy to a restrictive stance, now we need to watch the data on retail sales, CPI and others," Williams stated.
- The US Bureau of Labor Statistics reported on Friday, April 7, that Nonfarm Payrolls in the US rose by 236,000 in March, slightly below the market expectation of 240,000. February’s print of 311,000 got revised higher to 326,000 from 311,000.
- Wage inflation in the US, as measured by Average Hourly Earnings, declined to 4.2% on a yearly basis from 4.6% in February. The Unemployment Rate ticked down to 3.5% with the Labor Force Participation Rate improving to 62.6% from 62.5%.
Technical analysis: US Dollar could limit losses against Euro in near term
EUR/USD extended its rally on Thursday and touched its highest level since early April above 1.1050. The pair seems to have gone into a consolidation phase early Friday and the near-term technical outlook suggests that the pair is about to turn overbought with the Relative Strength Index (RSI) indicator on the daily chart holding near 70.
In case EUR/USD pair stages a technical correction, 1.1000 (psychological level, former resistance) aligns as initial support before 1.0900 (20-day Simple Moving Average (SMA) and 1.0750 (50-day SMA).
On the upside, first resistance is located at 1.1100 (psychological level, static level) before 1.1160 (static level from April 2022) and 1.1200 (psychological level).
How does Fed’s policy impact US Dollar?
The US Federal Reserve (Fed) has two mandates: maximum employment and price stability. The Fed uses interest rates as the primary tool to reach its goals but has to find the right balance. If the Fed is concerned about inflation, it tightens its policy by raising the interest rate to increase the cost of borrowing and encourage saving. In that scenario, the US Dollar (USD) is likely to gain value due to decreasing money supply. On the other hand, the Fed could decide to loosen its policy via rate cuts if it’s concerned about a rising unemployment rate due to a slowdown in economic activity. Lower interest rates are likely to lead to a growth in investment and allow companies to hire more people. In that case, the USD is expected to lose value.
The Fed also uses quantitative tightening (QT) or quantitative easing (QE) to adjust the size of its balance sheet and steer the economy in the desired direction. QE refers to the Fed buying assets, such as government bonds, in the open market to spur growth and QT is exactly the opposite. QE is widely seen as a USD-negative central bank policy action and vice versa.
-
10:35
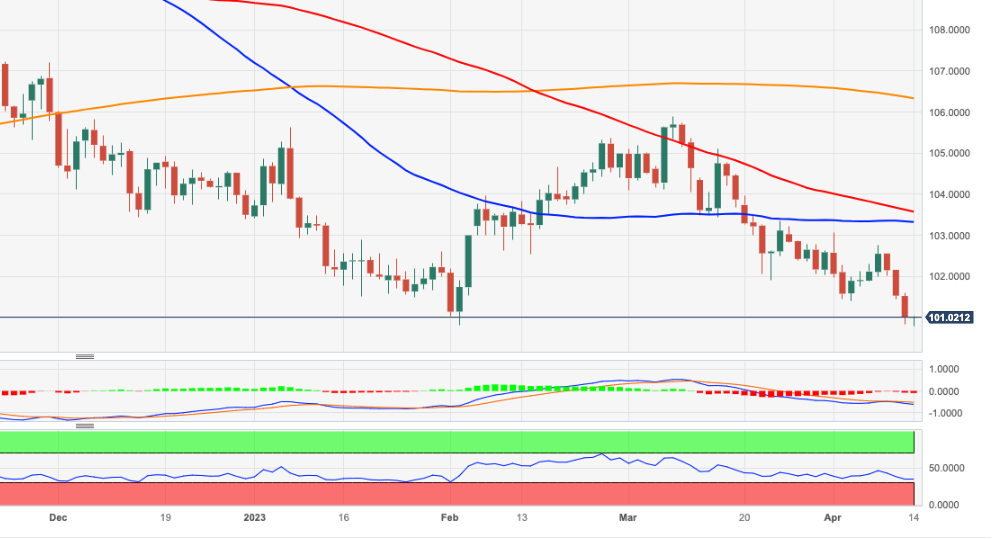
USD/JPY now faces some near-term consolidation – UOB
USD/JPY is likely to navigate within the 131.20-133.70 range in the next weeks, note Markets Strategist Quek Ser Leang and Senior FX Strategist Peter Chia at UOB Group.
Key Quotes
24-hour view: “We expected USD to trade in a range of 132.60/133.70 yesterday. However, USD dropped sharply to 132.01 and then rebounded. Despite the rebound, the weakness in USD has not stabilized. USD has scope to test 132.00 again before a sustained recovery is likely. On the upside, a breach of 133.25 (minor resistance at 132.90) would indicate that the weakness has stabilized.”
Next 1-3 weeks: “Yesterday (13 Apr, spot at 133.10), we noted that ‘upward momentum is beginning to fade and the odds of USD rising to 134.40 are diminishing’. We added, ‘only a break of 132.20 would indicate that USD is not strengthening further’. USD dropped to a low of 132.01 in NY trade. The breach of the ‘strong support’ at 132.20 indicates that the USD strength that started early this week has ended. USD appears to have moved into a consolidation phase and is likely to trade between 131.20 and 133.70 for now.”
-
10:33
PBOC: Will step up support to expand domestic demand
The People’s Bank of China (PBOC) said in a statement on Friday, they “will step up support to expand domestic demand.”
Additional takeaways
“Will make prudent monetary policy precise and forceful.”
“Will keep liquidity reasonably ample.”
“Will better use overall and structural policy tools.“
“Will stabilize growth, stabilize employment and prices.”
“Will deepen exchange rate reform, increase the flexibility of Yuan.”
“Will further improve monetary policy transmission mechanism.”
Related reads
- PBOC’s Yi: Expect China’s GDP this year to grow around 5%
- AUD/USD faces upside risks in the near term – UOB
-
10:20
USD/CAD consolidates its recent losses to two-month low, holds above 1.3300 mark
- USD/CAD drifts lower for the fifth straight day and drops to a fresh two-month low on Friday.
- Expectations for an imminent Fed rate-hike pause weigh on the USD and exert some pressure.
- A modest downtick in Oil prices undermines the Loonie and limits the downside for the major.
The USD/CAD pair enters a bearish consolidation phase and oscillates in a narrow range near a fresh two-month low touched earlier this Friday. The pair trades around the 1.3325-1.3330 region through the first half of the European session and remains in the negative territory for the fifth successive day.
The US Dollar (USD) drops to a one-year low amid growing acceptance that the Federal Reserve (Fed) is nearly done with its rate-hiking cycle and turns out to be a key factor exerting some pressure on the USD/CAD pair. In fact, the markets now seem convinced that the US central bank will pause after hiking one last time next month. The bets were lifted by the incoming US macro data, which pointed to signs of easing inflationary pressures.
Moreover, the March FOMC meeting minutes released on Wednesday showed that several policymakers considered pausing interest rate increases after the failure of two regional banks. This continues to act as a headwind for the US Treasury bond yields and is seen weighing on the Greenback. That said, a generally weaker tone around the equity markets helps limit losses for the safe-haven buck and lends some support to the USD/CAD pair.
The International Monetary Fund (IMF) earlier this week trimmed its 2023 global growth outlook, citing the impact of higher interest rates. This, along with worries that the post-COVID recovery in China is losing steam, raised recession fears and keep a lid on the optimism witnessed since the beginning of this week. Apart from this, softer Crude Oil prices undermine the commodity-linked Loonie and act as a tailwind for the USD/CAD pair.
Investors remain concerned that a deeper global economic downturn will dent fuel demand, which, in turn, drags Oil prices away from a fresh YTD peak touched on Wednesday. That said, a surprise decision last week by OPEC+ to cut output lends some support to the black liquid. This, along with the Bank of Canada's (BoC) readiness to raise borrowing costs again if needed to restore price stability, limits losses for the Canadian Dollar.
The aforementioned fundamental backdrop suggests that the path of least resistance for the USD/CAD pair is to the downside. The negative outlook is reinforced by the overnight breakdown through a multi-month-old ascending trend-line support and a technically significant 200-day Simple Moving Average (SMA). Hence, any attempted recovery might still be seen as a selling opportunity and runs the risk of fizzling out rather quickly.
Market participants now look forward to the US economic docket, featuring the release of monthly Retail Sales figures and the Preliminary Michigan Consumer Sentiment Index later during the early North American session. This, along with the US bond yields, will drive the USD demand and provide some impetus to the USD/CAD pair. Apart from this, traders will take cues from Oil price dynamics to grab short-term opportunities.
Technical levels to watch
-
09:57
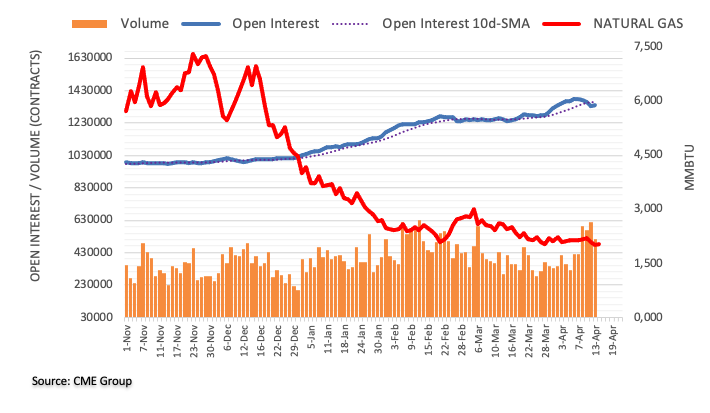
Natural Gas Futures: Extra losses in the pipeline
In light of advanced figures from CME Group for natural gas futures markets, open interest rose by nearly 8K contracts after fourth consecutive daily pullbacks on Thursday. Volume, on the other hand, shrank by around 101.3K contracts and reversed the previous daily build.
Natural Gas: Rising bets for another test of the sub-$2.00 area
Prices of the natural gas closed Thursday’s session just above the key $2.00 mark. The daily retracement was amidst rising open interest and opens the door to further weakness in the short-term horizon, and always with the immediate target at the 2023 low at $1.97 per MMBtu (February 22).
-
09:51
German Economy Ministry: Economy expected to avert recession
According to an Economy Ministry report published on Friday, the German economy is seen narrowly skirting a recession in the first quarter of the year.
Key takeaways
"A technical recession of two negative quarters in a row appears to have been averted.”
“Current forecasts also predict a slight year-on-year increase in gross domestic product (GDP) for 2023 as a whole.”
Market reaction
Despite upbeat remarks, EUR/USD is unable to capitalize, as it is consolidating its rally to fresh 13-month highs of 1.1076. The pair is trading at 1.1061, up 0.16% on the day.
-
09:48
AUD/USD faces upside risks in the near term – UOB
In the opinion of Markets Strategist Quek Ser Leang and Senior FX Strategist Peter Chia at UOB Group, AUD/USD could extend the current advance to the area beyond the 0.6800 hurdle in the near term.
Key Quotes
24-hour view: “While we expected AUD to rise yesterday, we underestimated the pace of advance as it surged to a high of 0.6797 (we were of the view that AUD is unlikely to challenge the major resistance at 0.6760). Not surprisingly, upward momentum is strong and AUD could continue to advance. However, severely overbought conditions suggest that AUD might not be able to break clearly above 0.6820 today. Overall, only a breach of 0.6730 (minor support is at 0.6760) would indicate that AUD is not advancing further.”
Next 1-3 weeks: “Our most recent narrative was from Monday (10 Apr, spot at 0.6670) wherein we held the view that AUD ‘is likely to trade in a range of 0.6600/0.6760 for the time being’. Yesterday (13 Apr), AUD lifted off and surged above 0.6760 (high has been 0.6797). The rapid improvement in momentum suggests AUD is likely to advance further. Resistance is at 0.6820, followed by a rather strong level at 0.6860. The upside risk is intact as long as AUD stays above 0.6700 in the next few days.”
-
09:47
WTI struggles near $82 after IEA warns of risks to global economic recovery
In its latest oil market report published on Friday, the International Energy Agency (IEA) said that “OPEC+ supply cuts risk aggravating expected oil supply deficit in H2 2023,” which could lead to high prices that will hurt consumers and threaten economic growth.
Additional takeaways
OECD industry stocks in Jan surged by 53 mln barrels to 2.830 bln barrels, highest since July 2021.
Russian oil exports in March rose to highest since April 2020, with oil shipments rising by 600,000 bpd.
Russian oil product flows returned to levels last seen before Russia invaded Ukraine.
Rising global oil stocks may have contributed to OPEC+ decision.
Gains of 1 mln bpd from non-OPEC+ starting in March will fail to offset a 1.4 mln bpd decline from OPEC+.
Extra cuts by OPEC+ will push world oil supply down 400,000 bpd by end-2023.
Oecd demand contracted by 390,000 bpd YoY in Q1 due to weak industrial activity, warm weather.
Non-OECD countries led by China will make up 90% of demand growth.
Global oil demand is set to rise by 2 mln bpd in 2023 to a record 101.9 mln bpd.
Market reaction
WTI is struggling near the $82 mark after IEA’s oil market outlook. The US oil is losing 0.41% on the day.
-
09:35
Crude Oil Futures: Outlook is expected to remain bullish
CME Group’s flash data for crude oil futures markets showed traders reduced their open interest positions by around 12.4K contracts on Thursday, while volume reversed three dailu pullbacks in a row and went up by around 294.3K contracts.
WTI appears supported by $80.00
Thursday’s knee-jerk in prices of the WTI came in tandem with declining open interest and volume, leaving scarce room for the continuation of the corrective decline in the very near term. In the meantime, the $80 region per barrel should hold the initial test for the time being.
-
09:34
Silver Price Analysis: XAG/USD eases from one-year peak, bullish bias remains intact
- Silver pulls back from a fresh one-year high touched earlier this Friday amid overbought RSI.
- The technical setup still favours bulls and supports prospects for a further appreciating move.
- Any meaningful corrective slide might still be seen as a buying opportunity and remain limited.
Silver touches a fresh one-year high on the last day of the week, albeit struggles to capitalize on the move and faces rejection near the $26.00 round-figure mark. The white metal surrenders its modest gains and trades near the lower end of its daily range, around the $25.85-$25.80 region during the early part of the European session.
Against the backdrop of a strong rally witnessed over the past month or so, the slightly overbought Relative Strength Index (RSI) on the daily chart turns out to be a key factor holding back traders from placing fresh bets around the XAG/USD. That said, the recent breakout through the $24.30-$24.40 strong horizontal barrier and a subsequent move beyond the $25.00 psychological mark support prospects for additional gains.
Hence, any subsequent pullback is more likely to attract fresh buyers near the $25.40-$25.35 area, or the overnight swing low. This should help limit the downside for the XAG/USD near the $25.00 mark. That said, a convincing break below the latter might prompt some technical selling and accelerate the corrective slide towards the $24.30-$24.40 resistance-turned-support. The latter should act as a strong near-term base for the metal.
On the flip side, bulls might now wait for some follow-through buying beyond the daily swing high, around the $26.00 mark, before placing fresh bets and positioning for a further appreciating move. The XAG/USD might then climb further towards the next relevant hurdle near the $26.40-$26.50 zone before eventually aiming to test the 2022 peak, just ahead of the $27.00 mark.
Silver daily chart
Key levels to watch
-
09:28
GBP/USD: A test of 1.2600 appears on the cards – UOB
The continuation of the upside momentum could motivate GBP/USD to challenge the 1.2600 neighbourhood in the next few weeks, suggest Markets Strategist Quek Ser Leang and Senior FX Strategist Peter Chia at UOB Group.
Key Quotes
24-hour view: “We highlighted yesterday that GBP ‘is likely to break 1.2525 but it might not be able to hold above this level’. We added, ‘The next significant resistance level at 1.2600 is not expected to come into view today’. As expected, GBP took out 1.2525 as it rose to a high of 1.2537. Despite the advance, upward momentum has not improved much. While GBP could continue to advance, 1.2600 is still unlikely to come into view today (there is a minor resistance level at 1.2560). Support is at 1.2500, a break of 1.2475 would indicate that the current upward pressure has eased.”
Next 1-3 weeks: “We highlighted yesterday (13 Apr, spot at 1.2490) that ‘the rapid improvement in momentum suggests GBP is ready to head higher’. We noted resistance levels are at 1.2525 and 1.2600. Our view for a higher GBP was not wrong as it rose above 1.2525 (high has been 1.2537). While momentum has not increased by all that much, GBP is likely to advance further to 1.2600, possibly 1.2665. On the downside, a break of 1.2440 (‘strong support’ level was at 1.2400 yesterday) would indicate that our view for GBP to continue to rise is wrong.”
-
09:22
EUR/USD remains firm and climbs to fresh highs near 1.1080
- EUR/USD advances further and prints new YTD peaks at 1.1075.
- The greenback remains offered and navigates fresh 2023 lows.
- US Retail Sales, Consumer Sentiment take centre stage in the NA session.
Further selling pressure in the greenback pushes EUR/USD to fresh 2023 highs in the vicinity of 1.1080 at the end of the week.
EUR/USD now looks at 1.1100 and above
EUR/USD advances for the fourth session in a row and consolidates further the recent breakout of the psychological 1.1000 hurdle on Friday in a context of persistent weakness hurting the dollar.
The pair’s weekly leg higher has been underpinned by investors’ firmer perception that the Fed might halt its hiking cycle in the near term and most likely following the May gathering, when it is still expected to hike the Fed Funds Target Range (FFTR) by another 25 b
Also propping up the solid momentum in the pair, many ECB rate setters have been advocating for the continuation of the tightening process in the region, putting back on the table a potential 50 bps rate raise next month.
Data wise in the region, final inflation figures in France showed the CPI rose 0.9% MoM in March and 5.7% from a year earlier.
It will be an interesting calendar across the pond, where Retail Sales are due along with Industrial Prodcution, the advanced Michigan Consumer Sentiment and Business Inventories. In addition, FOMC’s C. Waller (permanent voter, centrist) is due to speak.
What to look for around EUR
EUR/USD prints new peaks well north of 1.1000 the figure on the back of the pronounced decline in the greenback and expectations of further tightening by the ECB.
In the meantime, price action around the single currency should continue to closely follow dollar dynamics, as well as the incipient Fed-ECB divergence when it comes to the banks’ intentions regarding the potential next moves in interest rates.
Moving forward, hawkish ECB-speak continue to favour further rate hikes, although this view appears in contrast to some loss of momentum in economic fundamentals in the region.
Eminent issues on the back boiler: Continuation, or not, of the ECB hiking cycle. Impact of the Russia-Ukraine war on the growth prospects and inflation outlook in the region. Risks of inflation becoming entrenched.
EUR/USD levels to watch
So far, the pair is gaining 0.11% at 1.1058 and a break above 1.1075 (2023 high April 14) would target 1.1100 (round level) en route to 1.1184 (weekly high March 21 2022). On the flip side, the next support comes at 1.0788 (monthly low April 3) followed by 1.0754 (55-day SMA) and finally 1.0712 (low March 24).
-
09:07
EUR/USD faces the next target at 1.1120 – UOB
According to Markets Strategist Quek Ser Leang and Senior FX Strategist Peter Chia at UOB Group, further upside in EUR/USD should meet the next resistance level at 1.1120 in the near term.
Key Quotes
24-hour view: “While we expected EUR to strengthen yesterday, we were of the view that ‘a sustained break above 1.0335 is unlikely today’. The pace of the advance in EUR exceeded our expectations as it rose to 1.0975 before closing at a 1-year high of 1.1044 (+0.50%). There is scope for EUR to advance further even though the next significant resistance at 1.1120 is likely out of reach for today (there is a minor resistance at 1.1080). On the downside, a breach of 1.0995 (minor support is at 1.1020) would indicate that the advance in EUR is ready to take a breather.”
Next 1-3 weeks: “Yesterday (13 Apr, spot at 1.0990), we highlighted that the vastly improved momentum is likely to lead to further gains in EUR. We added, ‘it remains to be seen if EUR can maintain a foothold above this level’. EUR took out 1.1035 easily and soared to 1.1067 before closing at 1.1044 (+0.50%). The price actions suggest EUR is likely to continue to head higher. The next level to aim for is 1.1120, followed by 1.1160. Overall, only a breach 1.0940 (‘strong support’ level was at 1.0900 yesterday) would indicate that EUR is not strengthening further.”
-
08:58
USD/CHF hangs near its lowest level since January 2021, below 0.8900 mark
- USD/CHF drifts lower for the fourth straight day amid sustained USD selling bias.
- Expectations for an imminent Fed rate-hike pause drag the USD to a one-year low.
- Looming recession risks benefit the safe-haven CHF and contribute to the downfall.
The USD/CHF pair remains under some selling pressure for the fourth successive day on Friday and languishes near its lowest level since January 2021 touched the previous day. The pair trades just below the 0.8900 round figure during the early European session and seems vulnerable amid the underlying bearish sentiment surrounding the US Dollar (USD).
In fact, the USD Index, which tracks the Greenback against a basket of currencies, prolongs a four-day-old downtrend and drops to a one-year low amid expectations that the Federal Reserve (Fed) is nearly done with its rate-hiking cycle. The bets were lifted by the US Producer Price Index (PPI) report released on Thursday, which showed that inflation at the wholesale level cooled dramatically in March.
Against the backdrop of the softer US CPI on Wednesday, the data suggested that disinflation is progressing smoothly, which should allow the US central bank to pause its policy tightening. This, in turn, keeps the US Treasury bond yields depressed and weighs on the buck. Apart from this, a weaker risk tone benefits the safe-haven Swiss Franc (CHF) and exerts downward pressure on the USD/CHF pair.
Growing worries about a deeper global economic downturn keep a lid on the recent optimism, which is evident from a mild weakness around the equity markets. It is worth recalling that the International Monetary Fund (IMF) trimmed its 2023 global growth outlook on Tuesday, citing the impact of higher interest rates. This, in turn, boosts demand for safe-haven assets and drives some flows towards the CHF.
The aforementioned fundamental backdrop suggests that the path of least resistance for the USD/CHF pair is to the downside. That said, the Relative Strength Index (RSI) on the daily chart is flashing slightly oversold conditions and holding back traders from placing fresh bearish bets. Investors now look to the US macro data - Retail Sales figures and the Preliminary Michigan Consumer Sentiment Index - for a fresh impetus.
Technical levels to watch
-
08:00
Spain Consumer Price Index (YoY) meets forecasts (3.3%) in March
-
08:00
Spain Harmonized Index of Consumer Prices (YoY) meets forecasts (3.1%) in March
-
08:00
Spain Harmonized Index of Consumer Prices (MoM) meets expectations (1.1%) in March
-
08:00
Spain Consumer Price Index (MoM) meets forecasts (0.4%) in March
-
07:57
Gold Price Forecast: $2,050 prods XAU/USD bulls on the way to refresh all-time high – Confluence Detector
- Gold price seesaws within a choppy range after refreshing 13-month high.
- XAU/USD bulls keep the reins as downbeat US inflation clues tease Fed policy pivot and weigh on US Dollar.
- More proof of easing US inflation eyed as Gold buyers take a breather.
Gold price (XAU/USD) seesaws within a $15 trading range after refreshing the 13-month high with the $2,049 mark. Even so, the yellow metal remains well set for a four-day uptrend, as well as bracing for the second consecutive weekly high, amid broad-based US Dollar weakness. That said, the greenback bears the burden of the easing hawkish Fed bets, backed by softer inflation numbers. Also weighing on the US Dollar could be the looming threat to its reserve currency status.
Apart from the US Dollar Index (DXY) fall to a fresh one-year low, hopes of faster growth in Asia, one of the major Gold consumers, as well as fears of recession depicted by downbeat yields, also propel the XAU/USD prices.
Moving on, US Retail Sales for March, the Michigan Consumer Sentiment Index (CSI) for April and the University of Michigan’s (UoM) 5-year Consumer Inflation Expectations will be important to watch for clear directions for the Gold traders.
Considering the aforementioned catalysts, the Gold bulls are likely to keep the reins unless the scheduled data provide a major positive surprise. Even if the mentioned statistics rally, a light calendar in the next week, except for the Purchasing Managers Indexes (PMIs), may restrict the corrective pullback in the Gold Price.
Also read: Gold Price Forecast: XAU/USD eyes a pullback before resuming journey toward $2,075
Gold Price: Key levels to watch
Our Technical Confluence indicator highlights $2,050 as the key upside hurdle for the Gold price to cross to challenge the previous multi-month peaks of the XAU/USD. That said, the stated level comprises Pivot Point one-month R1 and the previous daily high.
Also acting as an immediate upside hurdle is the Pivot Point one-day R1 near $2,050.
Following that, a jump towards the Pivot Point one day R2 level around $2,070, also encompassing the previous yearly high, can’t be ruled out. However, the current all-time peak of around $2,075, marked in 2020, may challenge the Gold price upside afterward.
Meanwhile, a convergence of the Fibonacci 23.6% and upper Bollinger bank on one day, around $2,040, put a floor under the Gold price.
In a case where the Gold price remains weak past $2,040, the previous weekly high close to $2,033 may test the XAU/USD sellers.
It’s worth noting that Fibonacci 61.8% on one day around $2,027 and Pivot Point one day S1, close to $2,020, may act as the last defense of the Gold buyers before highlighting the $2,000 psychological magnet.
Here is how it looks on the tool
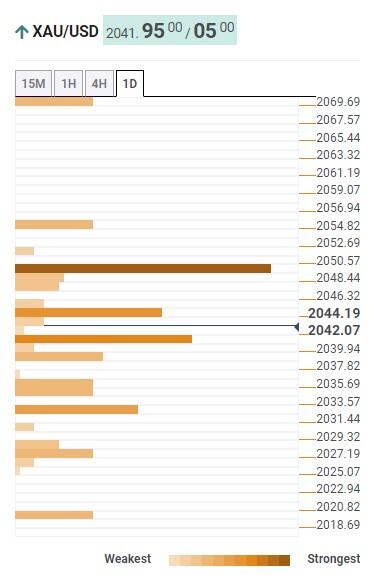
About Technical Confluences Detector
The TCD (Technical Confluences Detector) is a tool to locate and point out those price levels where there is a congestion of indicators, moving averages, Fibonacci levels, Pivot Points, etc. If you are a short-term trader, you will find entry points for counter-trend strategies and hunt a few points at a time. If you are a medium-to-long-term trader, this tool will allow you to know in advance the price levels where a medium-to-long-term trend may stop and rest, where to unwind positions, or where to increase your position size.
-
07:54
USD/JPY struggles for a firm intraday direction, flat-lines around mid-132.00s
- USD/JPY remains on the defensive amid the prevalent selling bias around the USD.
- Expectations for an imminent Fed rate-hike pause drag the USD to a one-year low.
- The BoJ’s dovish outlook holds back bears from placing fresh bets and lends support.
The USD/JPY pair struggles to capitalize on the previous day's late rebound from the 132.00 round-figure mark and remains on the defensive through the early European session on Friday. The pair currently trades around mid-132.00s, nearly unchanged for the day, and seems vulnerable amid the prevalent selling bias around the US Dollar (USD).
In fact, the USD Index, which tracks the Greenback against a basket of currencies, drops to a one-year high on the last day of the week amid firming expectations that the Federal Reserve (Fed) is nearing the end of its rate-hiking cycle. The bets were lifted by the US Producer Price Index (PPI) released on Thursday, which showed that inflation at the wholesale level cooled dramatically in March. This comes on the back of the softer US CPI report on Wednesday, which suggested that disinflation is progressing smoothly, which should allow the US central bank to pause its policy tightening.
Furthermore, the March FOMC meeting minutes on Wednesday showed that several policymakers considered pausing interest rate increases after the failure of two regional banks. This keeps the US Treasury bond yields depressed, which continues to weigh on the Greenback. Apart from this, looming recession risks benefit the Japanese Yen's (JPY) relative safe-haven status and further contribute to capping the upside for the USD/JPY pair. That said, the Bank of Japan's (BoJ) dovish near-term outlook is holding back bearish traders from placing fresh bets and lending support to the major.
Hence, it will be prudent to wait for strong follow-through selling before positioning for an extension of this week's retracement slide from the 134.00 round-figure mark, or a nearly one-month high touched on Wednesday. Market participants now look to the US economic docket, featuring the release of monthly Retail Sales figures and the Preliminary Michigan Consumer Sentiment Index later during the early North American session. This, along with the broader risk sentiment, might provide some impetus to the USD/JPY pair and allow traders to grab short-term opportunities.
Technical levels to watch
-
07:51
Forex Today: No love for US Dollar ahead of key data releases
Here is what you need to know on Friday, April 14:
The persistent US Dollar weakness continues early Friday with the US Dollar Index (DXY) staying at one-year lows below 101.00. Import and Export Price Index, March Retail Sales alongside Industrial Production data will be featured in the US economic docket later in the day. Ahead of the weekend, the University of Michigan will release the preliminary Consumer Sentiment Index for April.
US Retail Sales Preview: Dollar set to jump above low barrier of expectations, three scenarios.
Following Wednesday's soft inflation figures, the data from the US showed on Thursday that the Producer Price Index fell sharply in March, forcing the US Dollar (USD) to come under renewed selling pressure. Additionally, the US Department of Labor reported that the weekly Initial Jobless Claims rose to 239K in the week ending April 8, from 228K in the previous week. As Wall Street's main indexes gathered bullish momentum and registered strong daily gains, the DXY extended its slide late Thursday. In the European morning, however, US stock index futures trade in negative territory, pointing to a cautious market stance.
EUR/USD extended its daily rally above 1.1000 on Thursday and touched its strongest level since March 2022 above 1.1070 early Friday. There won't be any high-impact data releases from the Eurozone and the USD's valuation is likely to continue to drive the pair's action heading into the weekend.
GBP/USD closed the third straight day in positive territory on Thursday and managed to hold its ground during the Asian trading hours on Friday. As of writing, the pair was trading a few pips above Thursday's closing level of 1.2520.
Gold price registered impressive gains on Thursday and came within a touching distance of $2,050, the highest level since it set an all-time high in March 2022 at $2,070. XAU/USD seems to have gone into a consolidation phase at around $2,040 early Friday.
USD/JPY declined on Thursday amid the broad-based selling pressure surrounding the US Dollar. With the benchmark 10-year US Treasury bond yield holding steady above 3.4%, however, USD/JPY stays relatively quiet at around 132.50 on Friday.
Bitcoin cleared $30,000 hurdle and continued to push higher toward $31,000 early Friday. Ethereum gained more than 5% and rose above $2,000 for the first time since June. ETH/USD preserves its bullish momentum and was last seen rising another 5% on the day at $2,120.
-
07:45
France Inflation ex-tobacco (MoM) down to 0.7% in March from previous 1.1%
-
07:45
France Consumer Price Index (EU norm) (MoM) above forecasts (0.9%) in March: Actual (1%)
-
07:45
France Consumer Price Index (EU norm) (YoY) registered at 6.7% above expectations (6.6%) in March
-
07:30
Switzerland Producer and Import Prices (MoM) came in at 0.2%, above forecasts (-0.2%) in March
-
07:30
Switzerland Producer and Import Prices (YoY) below forecasts (2.7%) in March: Actual (2.1%)
-
07:29
FX option expiries for Apr 14 NY cut
FX option expiries for Apr 14 NY cut at 10:00 Eastern Time, via DTCC, can be found below.
- EUR/USD: EUR amounts
- 1.0890-00 2.2b
- 1.0950 1.1b
- 1.1000 2.0b
- 1.1050 721m
- 1.1100 626m
- USD/JPY: USD amounts
- 130.00 1.2b
- 132.00 1.0b
- 133.00 761m
- 134.00 602m
- USD/CAD: USD amounts
- 1.3440-45 1.7b
- NZD/USD: NZD amounts
- 0.6400 1.1b
-
07:13
GBP/USD Price Analysis: Ready to refresh multi-month high above 1.2500
- GBP/USD seesaws near the highest levels since June 2022 during four-day uptrend.
- Clear upside break of eight-day-old horizontal resistance, now support, hints at further advances of the Cable pair.
- Multiple key FE levels, mid-2022 peak can challenge buyer inside megaphone trend-widening pattern.
GBP/USD bulls take a breather at the highest levels in 10 months, making rounds to mid-1.2500s heading into Friday’s London open.
In doing so, the Cable pair bears the burden of the overbought RSI conditions while reassessing the odds of a further upside. However, a clear upside break of the previous key resistance comprising multiple levels marked since April 04, around 1.2510-2500, keeps the GBP/USD bulls hopeful of refreshing the multi-month top.
In that case, the 61.8% and 78.6% Fibonacci Expansion (FE) of the pair’s moves between March 21 and April 10, respectively near 1.2555 and 1.2615, could gain the market’s attention ahead of May 2022 high of around 1.2665.
It’s worth noting, however, that the top line of a three-week-old rising megaphone trend widening chart formation, around 1.2690 by the press time, can restrict the GBP/USD pair’s upside past 1.2665
Alternatively, pullback moves need to provide a convincing break below the 1.2500 round figure to recall the intraday sellers.
Even so, the aforementioned megaphone’s lower line, close to 1.2395 by the press time, can challenge the bears before giving them control.
Should the GBP/USD price remains bearish past 1.2395, multiple levels marked since early March constitute 1.2180-70 and 1.2015-05 as the key support to watch.
Overall, GBP/USD remains on the bull’s radar even if RSI conditions challenge the upside momentum of late.
GBP/USD: Four-hour chart
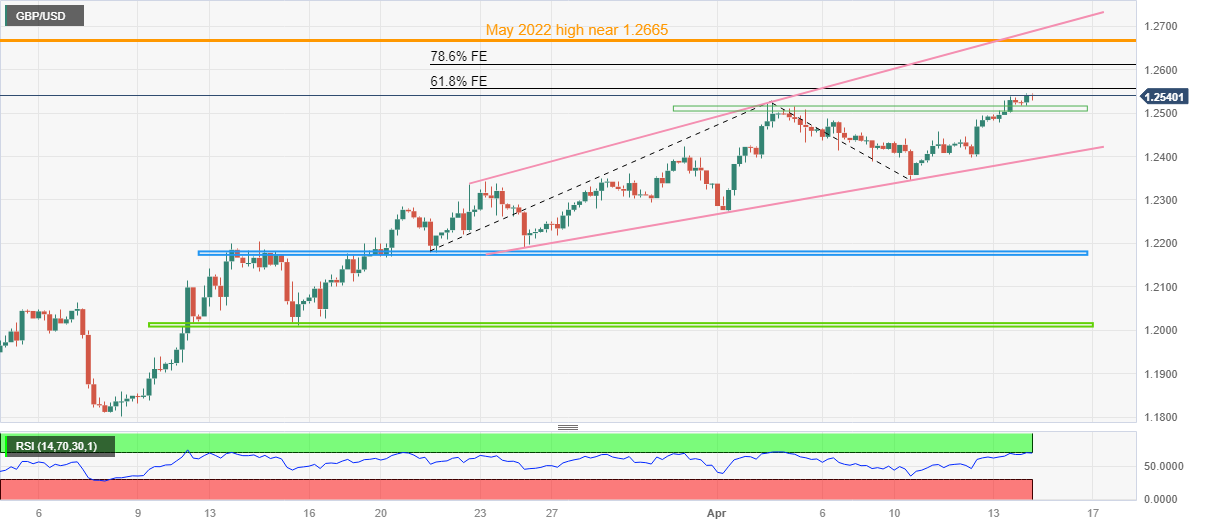
Trend: Gradual upside expected
-
07:13
EUR/USD aims to capture 1.1100 as Fed to reconsider rate-hiking spell , ECB eyes more hikes
- EUR/USD is looking to capture the critical resistance of 1.1100 as the risk-on mood strengthens.
- Federal Reserve is expected to reconsider further rate hikes amid softening US CPI and PPI and easing labor market.
- European Central Bank is divided over the pace of policy-hiking to arrest core inflation.
- EUR/USD is eyeing a seventh consecutive bullish weekly closing amid the declining US Dollar Index.
EUR/USD is displaying a back-and-forth action around 1.1070 in the early European session. The major currency pair is expected to continue its north-side journey towards the round-level resistance of 1.1100 as the US Dollar Index (DXY) is struggling to defend its downside momentum. The USD Index remained in the grip of bears on Thursday as the higher-than-anticipated softening of the United States Producer Price Index (PPI) report strengthened the need of pausing the policy-tightening cycle earlier than previously anticipated.
S&P500 futures have generated marginal losses in the Asian session. US equities were heavily bought on Thursday after the release extremely decelerated US PPI report as it triggered the need of reconsidering expectations of one more rate hike in the May monetary policy meeting by the Federal Reserve. The overall market mood is extremely positive as hopes for the adaptation of neutral policy by the Federal Reserve (Fed) have strengthened.
Apart from that, lower gasoline prices in March have bolstered expectations that S&P500 companies will report robust quarterly results. Input cost of firms must be remained lower amid below-average gasoline bills, which would have boosted operating profit margins.
The demand for US government bonds has improved marginally in hopes of a decline in US consumer inflation expectations. The 10-year US Treasury yields have slipped below 3.44%.
Synergic effect of decelerated US PPI and CPI to pause Fed’s rate hike spell
Scrutiny of the US PPI report showed that the US headline PPI softened heavily to 2.6% vs. the expectations of 3.0% and the former release of 4.6% amid lower gasoline prices. The core US PPI remained steady at 3.4% as expected by the market participants but critically lower than the former release of 4.8%. Firms passed on the benefit of lower input costs inspired by lower gasoline bills to end users by offering goods and services at lower prices at their factory gates.
This is going to ease overall retail demand in value terms and might force the Federal Reserve to look for pausing rates sooner.
US labor market conditions are easing further as US Department of Labor reported a jump in weekly Initial Jobless Claims data on Thursday. The economic data jumped to 239K from the estimates of 232K and the former release of 228K. This has also receded fears of stubborn US inflation further.
Apart from that, Bloomberg reported that US commercial banks reduced their borrowings from two Federal Reserve backstop lending facilities for a fourth straight week as liquidity constraints continue to ease following the collapse of Silicon Valley Bank last month. The synergic effect of tight credit conditions, softened US Consumer Price Index (CPI) and PPI, and loosening labor market would also force Fed chair Jerome Powell to dial back rate cuts.
Eurozone’s persistent core inflation supports hawkish European Central Bank bets
Weaker oil and energy prices are weighing heavily on Eurozone‘s headline inflation, however, core inflation is moving in the opposite direction and is extremely persistent. Thanks to the tight labor market, which is providing ample funds to households for disposal and keeping core inflation extremely sticky.
There is no denying the fact that the European Central Bank (ECB) has no other option than to continue elevating its interest rates higher in efforts of arresting galloping inflation. However, European Central Bank policymakers are divided over the pace of rate hikes by the central bank.
European Central Bank Governing Council member Bostjan Vasle said that they are considering 25 and 50 basis points (bps) rate hike options for the May policy meeting, per Reuters. Also, The European Central Bank policymaker Pierre Wunsch said on Friday, “The policy decision in May is between 25- and 50-basis-point rate hikes,” although “size depends in large part on April core inflation.” He further added, “Market pricing of terminal rate reasonable; but no quick rate cuts likely thereafter.”
EUR/USD technical outlook
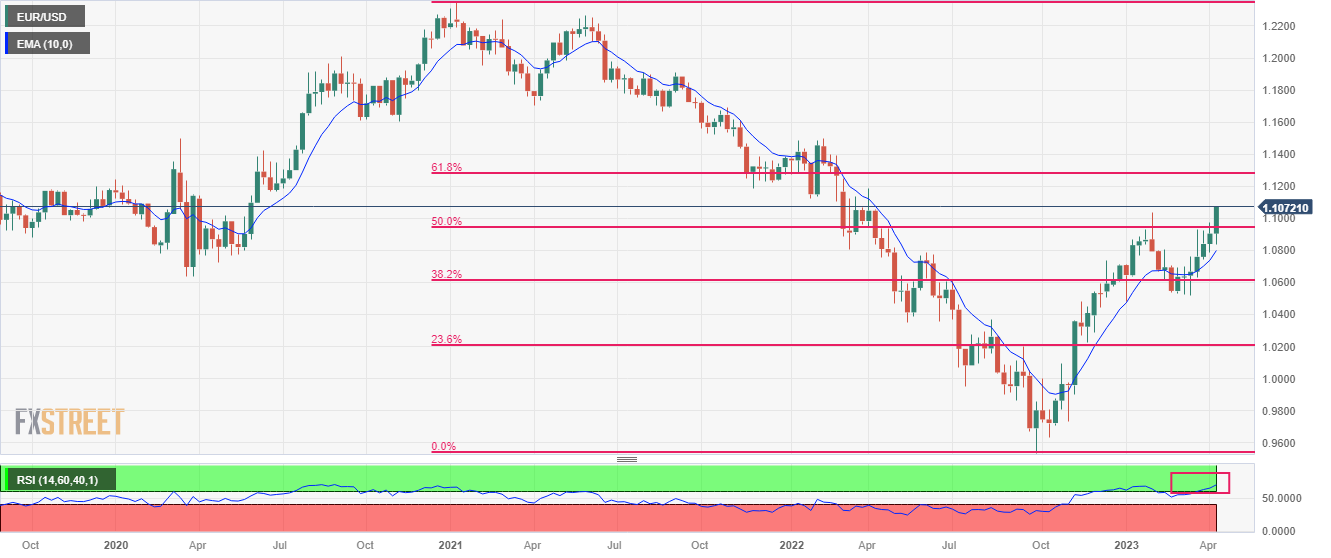
EUR/USD is highly expected to settle the week on a bullish note. This would be the seventh consecutive positive closing of the shared currency pair. The major currency pair is expected to close above the 50% Fibonacci retracement (plotted from 08 January 2021 high at 1.2350 to 30 September 2022 low at 0.9536) at 1.0952, which will strengthen the Euro bulls further.
Upward-sloping 10-period Exponential Moving Average (EMA) at 1.0800 is advocating more upside for the shared continent currency.
The Relative Strength Index (RSI) (14) has shifted into the bullish range of 60.00-80.00, indicating that the upside momentum is active now.
-
07:01
Germany Wholesale Price Index (MoM) above expectations (-1.1%) in March: Actual (0.2%)
-
07:00
Sweden Consumer Price Index (MoM) came in at 0.6% below forecasts (1%) in March
-
07:00
Sweden Consumer Price Index (YoY) below forecasts (11.1%) in March: Actual (10.6%)
-
07:00
Germany Wholesale Price Index (YoY) came in at 2% below forecasts (6.2%) in March
-
06:52
USD Index remains under pressure and drops to new 2023 lows
- The index deflates below the 100.80 mark, or new YTD lows.
- Markets continue to price in a potential pause by the Fed.
- Retail Sales, Industrial Production, Consumer Sentiment next on tap.
The greenback extends the weekly decline and prints new yearly lows in the 100.80/75 band when tracked by the USD Index (DXY) at the end of the week.
USD Index now looks at key data
The index extends the leg lower for the fourth consecutive session and remains under heavy pressure on Friday, always against the backdrop of the marked improvement in the risk-associated universe.
Despite market participants continue to favour a 25 bps rate hike by the Federal Reserve at the May gathering, the likelihood that the hiking cycle could be near its end seems to have boosted the optimism in the risk complex in detriment of the buck.
Later in the US data space, Retail Sales will take centre stage along with Industrial Production, the advanced Michigan Consumer Sentiment and Business Inventories.
What to look for around USD
The dollar remains on the back foot and keeps the price action around the index depressed, refocusing the attention at the same time to the psychological 100.00 mark in the near term.
The recent marked retracement in the dollar has been underpinned by the pick-up in the perception that the Federal Reserve could make a pause in its current tightening cycle just after the May meeting.
In favour of a pivot in the Fed’s normalization process, however, still emerges the persevering disinflation, nascent weakness in some key fundamentals and somewhat persistent concerns surrounding the banking sector.
Key events in the US this week: Retail Sales, Industrial Production, Advanced Michigan Consumer Sentiment, Business Inventories (Friday).
Eminent issues on the back boiler: Persistent debate over a soft/hard landing of the US economy. Terminal Interest rate near the peak vs. speculation of rate cuts in 2024. Fed’s pivot. Geopolitical effervescence vs. Russia and China. US-China trade conflict.
USD Index relevant levels
Now, the index is retreating 0.12% at 100.88 and the breach of 100.78 (2023 low April 14) would open the door to 100.00 (psychological level) and finally 99.81 (weekly low April 21 2022). On the other hand, the next resistance level emerges at 103.05 (monthly high April 3) seconded by 103.57 (100-day SMA) and then 105.11 (weekly high March 15).
-
06:38
USD/MXN Price Analysis: Bears run out of steam within a 10-pip zone around 18.00
- USD/MXN retreats from intraday high, snaps two-day losing streak.
- Three-week-old descending trend line restricts immediate upside ahead of the key SMAs.
- RSI pokes short-term resistance line during eight-day-long bearish trend, suggesting return of upside momentum.
- Rising support line from early March, YTD low joins downbeat RSI to challenge Mexican Peso buyers.
USD/MXN eases from the intraday high to 18.08 during the first positive day in three heading into Friday’s European session.
In doing so, the Mexican Peso (MXN) pair retreats from a downward-sloping resistance line from late March while fading the bounce off a five-week-old support line, marked the previous day.
Given the downward-sloping RSI (14), the USD/MXN weakness appears elusive. On top of that, the RSI line currently pokes an eight-day-long trend line resistance and hence a breakout can allow the momentum to improve, which in turn can trigger the pair’s rebound.
However, the 100-SMA and the 200-SMA levels, respectively around 18.20 and 18.32, can challenge the USD/MXN bulls. Also acting as an upside filter is the monthly high of 18.40.
It’s worth noting that the Mexican Peso buyers need validation from an upward-sloping support line from early March, around the 18.00 round figure, as well as from the RSI (14) that is currently weak.
Even if the USD/MXN price breaks the 18.00 support, the Year-To-Date (YTD) support near 17.89, marked in March, should lure the bears.
USD/MXN: Four-hour chart
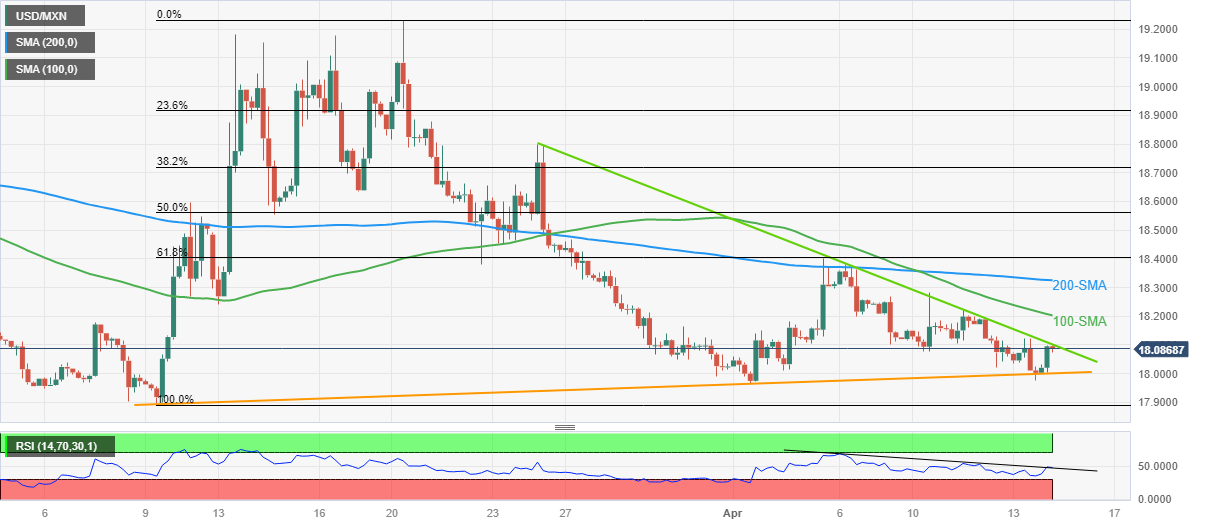
Trend: Recovery expected
-
06:27
Gold Futures: Door open to further upside
Open interest in gold futures markets rose for the third session in a row on Thursday, this time by around 8.4K contracts according to preliminary readings from CME Group. Volume followed suit and went up for the third straight session, now by nearly75K contracts.
Gold: Next on the upside emerges $2070
Gold prices started the second half of the week in a strong foot and reached fresh tops around the $2040 mark per ounce troy. The uptick was on the back of increasing open interest and volume and is indicative that extra gains remain in store for the time being. That said, the next target of note comes at the 2022 peak at $2070 (March 8).
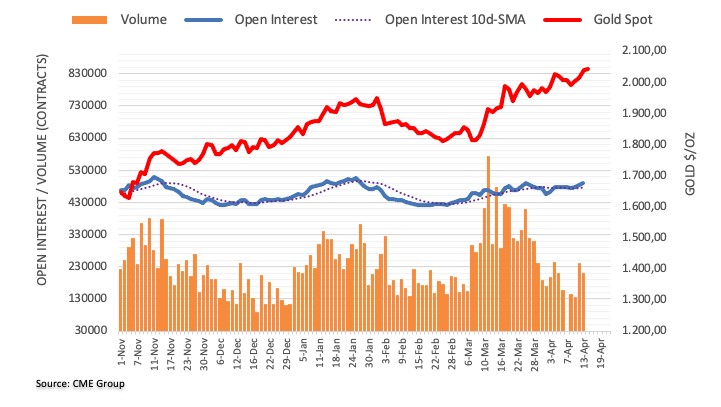
-
06:11
ECB’s Wunsch: May policy decision is between 25 bps and 50 bps rate hikes
The European Central Bank (ECB) policymaker Pierre Wunsch said on Friday, “the policy decision in May is between 25- and 50-basis-point rate hikes,” although “size depends in large part on April core inflation.”
Additional quotes
“ECB could fully stop asset purchase programme (APP) reinvestments this year.”
“Market pricing of terminal rate reasonable; but no quick rate cuts likely thereafter. “
Market reaction
EUR/USD has entered a phase of consolidation near yearly highs, trading at around 1.1070, as of writing. The pair is up 0.22% on the day.
-
06:09
Asian Stock Market: Cheers softening US Inflation expectations, oil recovers despite stable outlook
- Asian stocks have followed the footprints of the S&P500 rally after the release of the highly soft US PPI report.
- Japanese equities are running on steroids as BoJ Ueda is reiterating the need for the continuation of expansionary monetary policy.
- OPEC left the global oil demand growth forecast for 2023 unchanged at 2.32 million barrels per day.
Markets in the Asian domain have cheered the sheer softening of the United States Producer Price Index (PPI) data released on Thursday. Investors were gung ho for S&P500 as the weak US PPI report has bolstered expectations that the Federal Reserve (Fed) will dial back higher rates sooner than anticipated. US equities witnessed a massive inflow of funds from the market participants as a halt in the policy-tightening cycle would restart the expansion plans of firms as they would be able to fetch advances at lower interest obligations.
Deflated US PPI report led by weaker gasoline prices hammered the US Dollar Index (DXY) firmly. The USD Index fell like a house of cards and has refreshed its 11-month low at 100.78, at the time of writing.
At the press time, Japan’s Nikkei225 soared 1.09%, SZSE Component gained 0.47%, and Hang Seng remained flat.
Indian markets are closed on Friday on account of Dr. Baba Saheb Ambedkar Jayanti.
Japanese equities are running on steroids as Bank of Japan (BoJ) novel leader Kazuo Ueda is reiterating the need of continuation of expansionary monetary policy. BoJ Ueda told the G20 that Japan's core consumer inflation, which is currently around 3%, is likely to fall back below 2% in the second half of this fiscal year.
Meanwhile, Chinese stocks gained strength in hopes of a firmer recovery this year. People's Bank of China (PBOC) Yi Gang said in a statement on Friday, he is expecting the Gross Domestic Product (GDP) in China this year to grow around 5%, as the economy is rebounding and stabilizing, the property sector is rebounding and inflation is low.
On the oil front, oil prices have shown a recovery and are making efforts in extending their rebound move above the immediate resistance of $82.60. The black gold has shown a rebound despite expectations of a stagnant demand outlook. On Thursday, OPEC left the global oil demand growth forecast for 2023 unchanged at 2.32 million barrels per day, as reported by Reuters.
-
06:06
USD/CAD licks its wounds above 1.3300 amid sluggish Oil price, downbeat US Dollar ahead of key statistics
- USD/CAD holds lower grounds at two-month bottom, down for the fifth consecutive day.
- WTI crude oil struggles to recover amid sluggish data, mixed OPEC update.
- US Dollar Index drops to the lowest levels since late April 2022 as Fed hawks retreats amid easing inflation.
- US Retail Sales, Michigan CSI and UoM 5-year Consumer Inflation Expectations eyed for fresh impulse.
USD/CAD stabilizes around 1.3320-25 after refreshing the two-month low during early Friday in Europe. In doing so, the Loonie pair traces the inactive performance of the WTI crude oil price, Canada’s key export item, while also cheering the US Dollar weakness. It’s worth noting, however, that the cautious mood ahead of the key US consumer-centric data seems to prod the pair traders of late.
WTI crude oil clings to mild gains around $82.50 as it consolidates the previous day’s pullback from a five-month high amid inactive markets. It’s worth noting that the hopes of upbeat Oil demand and supply cuts seem struggling to please the black gold buyers amid recession woes. That said, the Organization of the Petroleum Exporting Countries (OPEC) released its monthly report on Thursday and left the global oil demand growth forecast for 2023 unchanged at 2.32 million barrels per day, as reported by Reuters. The OPEC report also mentioned, “OPEC oil output fell by 86,000 bpd in March to 28.80 million bpd.”
On the other hand, the US Dollar Index (DXY) slides beneath the lowest level of 2023, marked in February, as the greenback bears attack the 100.80 level, around 100.85 at the latest. In doing so, the greenback’s gauge versus the six major currencies portrays the market’s easing bias about the hawkish Federal Reserve (Fed) moves, mainly due to the downside of US inflation and recent employment numbers.
That said, the US Producer Price Index (PPI) for March dropped to a four-month low of -0.5% MoM versus 0.0% expected and prior. Further, the PPI YoY also declined to 2.7% from 4.9% in previous readouts, versus market forecasts of 3.0%. Additionally weighing on the hawkish Fed bets and the US Dollar is the US Initial Jobless Claims figure as it rose to 239K versus 232K expected and 228K prior.
Thursday’s downbeat US data was in line with the previous softer prints of the US Consumer Price Index (CPI). Also to note is the Fed policymakers’ hesitance in supporting further rate hikes, per the Minutes of the latest Federal Open Market Committee (FOMC) Monetary Policy Meeting published on Wednesday.
Amid these plays, the US 10-year and two-year Treasury bond yields retreat to 3.44% and 3.96% in that order while the S&P 500 Futures struggle after printing the biggest daily gain in two weeks.
At home, Bank of Canada (BoC) Governor Tiff Macklem tried defending the latest status quo on the monetary policy while saying, “We need a period of weak growth." BoC’s Macklem also said that the implied expectation in the market is that we're going to be cutting our policy rate later in the year. That doesn't look today like the most likely scenario to us.
Looking forward, US Retail Sales for March, the Michigan Consumer Sentiment Index (CSI) for April and the University of Michigan’s (UoM) 5-year Consumer Inflation Expectations will be important to watch for clear directions for the USD/CAD traders. That said, the bears are likely to keep the reins unless the scheduled data provide a major positive surprise.
Technical analysis
A daily closing below the five-month-old ascending support line, around 1.3300 by the pres time, becomes necessary for the bears to keep reins. Otherwise, the oversold RSI conditions can trigger a corrective bounce toward the previous weekly low of near 1.3405.
-
05:39
AUD/USD continues to juggle below 0.6800 ahead of US Retail Sales
- AUD/USD is consolidating below 0.6800 as investors await US Retail Sales for further guidance.
- The USD Index has printed a fresh 11-month low at 100.78 amid rising fears of a recession in the US economy.
- upbeat Australian Employment data has renewed fears of more rate hikes from the RBA.
The AUD/USD pair has turned sideways below the round-level resistance of 0.6800 in the Asian session after a juggernaut rally. The Aussie asset is showing a lackluster performance as investors are awaiting the release of the United States Retail Sales data. The reason behind the rally in the Aussie asset was a sheer decline in the US consumer inflation expectations after a more-than-anticipated deceleration in the US Producer Price Index (PPI) report.
S&P500 futures are showing rangebound moves after a perpendicular rally on Thursday, portraying a quiet mood amid the overall risk-appetite theme. The US Dollar Index (DXY) has printed a fresh 11-month low at 100.78 and is expected to extend its downside journey as the odds of the US economy entering into recession are extremely high amid tight credit conditions by US commercial banks after the banking fiasco.
US headline PPI softened heavily to 2.6% vs. the expectations of 3.0% and the former release of 4.6% amid lower gasoline prices. Firms passed on the benefit of lower input costs inspired by lower gasoline bills to end users by offering goods and services at lower prices.
Going forward, the synergic effect of decelerated US PPI and the Consumer Price Index (CPI) will force the Federal Reserve (Fed) to wrap up its policy-tightening spell.
Sheer volatility is expected from the USD Index ahead of the monthly Retail Sales (March) data. The street is anticipating a continuation of contraction in retail demand at a similar pace of 0.4% recorded in February. This could strengthen the requirement of pausing rates sooner by Fed chair Jerome Powell.
On the Australian Dollar front, upbeat Employment data has renewed fears of more rate hikes from the Reserve Bank of Australia (RBA). Investors should be aware that RBA Governor Philip Lowe kept rates unchanged at 3.6% in the April monetary policy meeting.
-
04:58
Gold Price Forecast: XAU/USD gathers strength to capture $2,050 as US economy eyes recession
- Gold price is aiming to capture the critical resistance of $2,050.00 as USD Index is eyeing more downside.
- Reduced borrowing by US banks from the Fed is advocating further slowdown in the US economy.
- Gold price is on the verge of delivering a breakout of the Rising Channel pattern.
Gold price (XAU/USD) is gathering strength to capture the critical resistance of $2,050.00 in the Asian session. The precious metal is looking to resume its upside journey after mild exhaustion in the upside momentum.
S&P500 futures are showing choppy moves in the Asian session after witnessing stellar buying on Thursday, portraying a risk appetite theme underpinned by the market participants. The US Dollar Index (DXY) has refreshed its 11-month low at 100.80 and is eyeing more weakness as investors are anticipating that the Federal Reserve (Fed) will look for pausing rate hikes after May monetary policy meeting.
Bloomberg reported that United States commercial banks reduced their borrowings from two Federal Reserve backstop lending facilities for a fourth straight week as liquidity constraints continue to ease following the collapse of Silicon Valley Bank last month. Lower credit disposal due to tight credit conditions could slow down the US economy, which might ease inflationary pressures sooner and force Fed chair Jerome Powell to wrap up the policy-tightening spell sooner.
On Friday, a power-pack action is expected from the USD Index amid the release of the US Retail Sales data. According to the consensus, the economic data will contract by 0.4%. The retail demand is likely to continue the pace of contraction as shown in February as US labor market conditions are cooling down.
Gold technical analysis
Gold price is auctioning in a Rising Channel chart pattern on a two-hour scale in which every pullback is capitalized for building fresh longs by the market participants. The yellow metal is consolidating near the breakout region of the aforementioned chart pattern.
Advancing 20-period Exponential Moving Average (EMA) at $2,031.00 is favoring more upside for Gold bulls.
The Relative Strength Index (RSI) (14) is oscillating in the bullish range of 60.00-80.00, indicating that the upside momentum is already active.
Gold two-hour chart
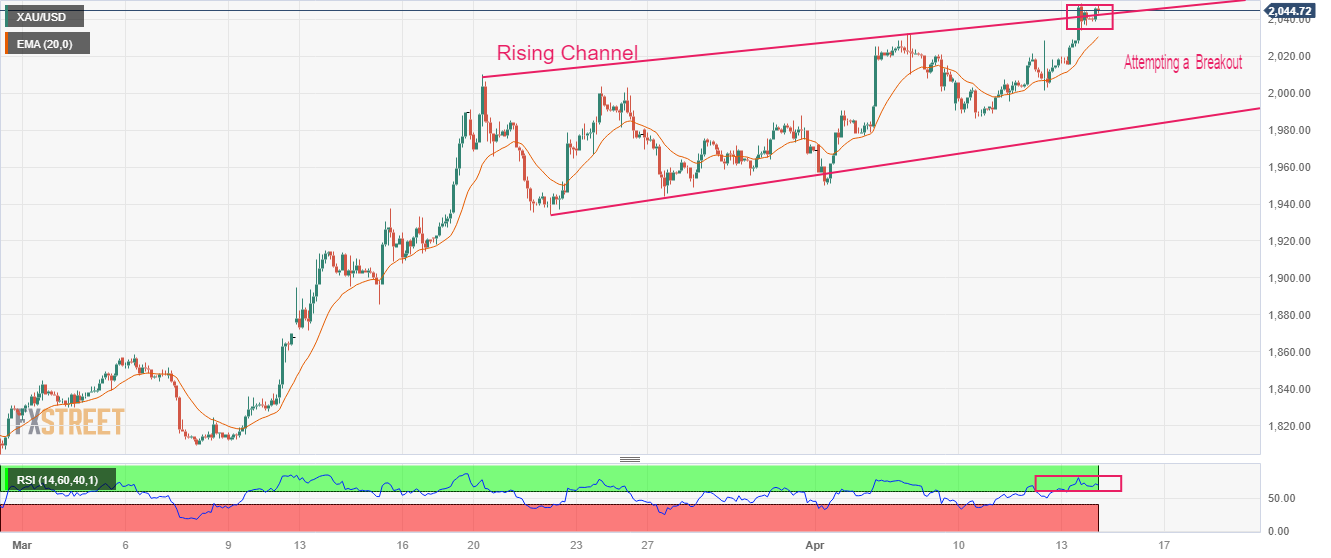
-
04:43
USD/INR Price Analysis: Indian Rupee buyers approach 81.45 resistance confluence
- USD/INR remains pressured at 11-week low, down for the third consecutive day.
- Clear downside break of ascending trend line from late January, bearish MACD signals favor Indian Rupee (INR) buyers.
- Convergence of 200-DMA, five-month-old rising support line restricts immediate downside of USD/INR.
- Indian Rupee sellers remain off the table below 82.10.
USD/INR clings to mild losses around 81.60 during early Friday, after falling to the lowest levels since late January before a few minutes.
In doing so, the Indian Rupee (INR) pair justifies the previous day’s downside break of an upward-sloping support line from January 23, now resistance. Adding strength to the bearish bias are the downbeat MACD signals.
However, the RSI (14) line is approaching the oversold territory and signals bottom picking of the USD/INR prices, which in turn highlights the 81.45 support confluence as the key for the USD/INR bears to watch. That said, the stated level encompasses the 200-DMA and an ascending trend line from November 2022.
If at all the USD/INR bears dominate past 81.45 and offer a daily closing below the same, the November 2022 low near 81.00 and the yearly trough surrounding 80.90 will be in the spotlight.
Meanwhile, recovery remains elusive unless the Indian Rupee pair remains below the support-turned-resistance line stretched from January, close to 81.95 by the press time.
Even if the USD/INR buyers manage to cross the 81.95 hurdle, the 82.00 round figure and a three-week-old descending resistance line, close to 82.10 at the latest, will be crucial challenges for them to conquer.
USD/INR Price: Daily chart
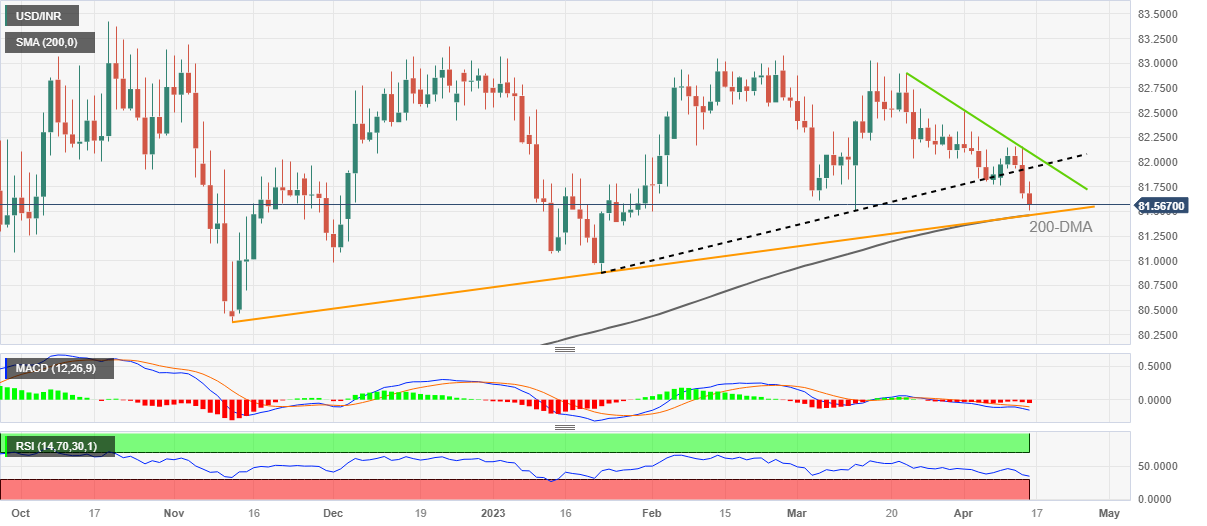
Trend: Limited downside expected
-
04:24
EUR/USD: Set to refresh 13-month high as DXY renews one-year low on soft US inflation
- EUR/USD remains firmer at the highest levels since March 2022, up for the fourth consecutive day.
- US Dollar Index (DXY) slips beneath 100.80 yearly low as softer yields strength bearish bias about the greenback.
- US PPI also disappoints Fed hawks and signal nearness to Fed’s policy pivot.
- Hawkish ECB talks, upbeat Eurozone data add strength to the upside momentum ahead of more inflation clues.
EUR/USD bulls hold the reins tightly at a 13-month high as a softer US Dollar joins hawkish hopes from the European Central Bank (ECB) during early Friday in Europe. That said, the Euro pair recently renewed the multi-day high to 1.1075, making rounds to 1.1065-70 by the press time.
With this, the US Dollar Index (DXY) slides beneath the lowest level of 2023 marked in February as the greenback bears attack the 100.80 level, around 100.85 at the latest.
While tracing the top-tier catalysts, hopes of sooner winding down of the hawkish Fed policy, backed by softer US inflation numbers and dovish Fed Minutes, gain major attention of the EUR/USD buyers. That said, the US Producer Price Index (PPI) for March dropped to a four-month low of -0.5% MoM versus 0.0% expected and prior. Further, the PPI YoY also declined to 2.7% from 4.9% in previous readouts, versus market forecasts of 3.0%. Additionally weighing on the hawkish Fed bets and the US Dollar is the US Initial Jobless Claims figure as it rose to 239K versus 232K expected and 228K prior.
On the other hand, Eurozone Industrial Production rose 1.5% MoM in February versus 1.0% expected and 0.7% prior. Further, the yearly figure was also impressive as it rose 2.0% YoY during the stated month compared to 1.5% analysts’ estimations and 0.9% previous readings.
Not only divergence between the Eurozone and the US data but the monetary policy signals from the European Central Bank (ECB) and the Federal Reserve (Fed) also exert downside pressure on the US Dollar and propel the EUR/USD price.
Furthermore, the recent retreat in the US Treasury bond yields, after the previous day’s corrective bounce, also weighs on the US Dollar and allow the EUR/USD to rush towards the fresh multi-month high. With this, the US 10-year and two-year Treasury bond yields retreat to 3.44% and 3.96% in that order.
Moving on, the final readings of the Eurozone inflation numbers may entertain EUR/USD traders. However, major attention will be given to the US Retail Sales for March, the Michigan Consumer Sentiment Index (CSI) for April and the University of Michigan’s (UoM) 5-year Consumer Inflation Expectations will be important to watch for clear directions.
Technical analysis
Unless falling back below the February 2023 high of around 1.1035, the EUR/USD appears well-set for March 2022 peak surrounding 1.1185.
-
04:00
USD/JPY Price Analysis: Retreats towards 100-SMA support above 132.00
- USD/JPY prints three-day downtrend, fades the previous day’s corrective bounce off weekly low.
- Three-week-old ascending trend channel keeps the Yen pair buyers hopeful beyond 131.40.
- Bearish oscillators, repeated pullbacks from 200-SMA favor sellers.
USD/JPY holds lower ground near 132.40 as it drops for the third consecutive day during early Friday, reversing late Thursday’s corrective bounce.
That said, the quote’s failure to extend the previous day’s rebound beyond the 38.2% Fibonacci retracement level of USD/JPY’s fall during March seems to tease the pair sellers. Adding strength to the downside bias are the bearish MACD signals and downbeat RSI (14), not oversold.
With this, the USD/JPY is well-set to retest the 100-SMA support of around 132.15. However, the quote’s further weakness appears limited at a three-week-long bullish trend channel that could challenge the Yean pair bears around 131.40.
Should the quote breaks the 131.40 support, the monthly low near 130.60 and the 130.00 psychological magnet can check the USD/JPY sellers before directing them to the yearly low of 129.65 marked in March.
On the flip side, the 38.2% Fibonacci retracement level of 132.85 guards the quote’s immediate upside ahead of the 200-SMA hurdle of 133.35.
Though, the 50% Fibonacci retracement and the aforementioned channel’s top line, respectively near 133.85 and 134.60, can challenge the USD/JPY buyers afterward.
Also acting as an upside filter is the 61.8% Fibonacci retracement of around 134.80, also known as the golden Fibonacci ratio, as well as tops marked during March 10-15, close to 135.10-15.
USD/JPY: Four-hour chart
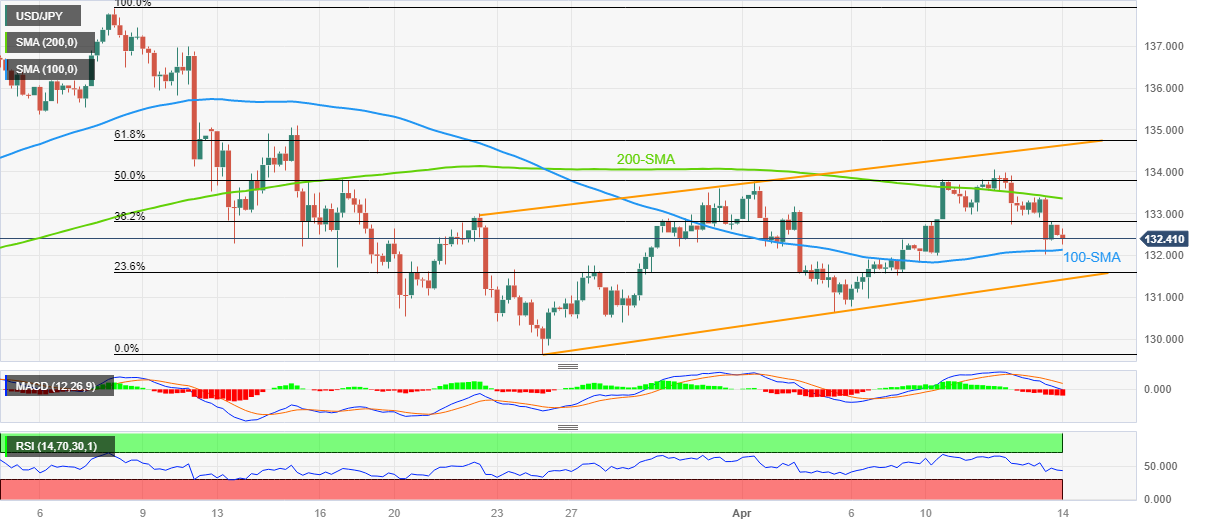
Trend: Limited downside expected
-
04:00
South Korea Money Supply Growth registered at 4.4%, below expectations (5.9%) in February
-
03:41
S&P 500 Futures struggle after the biggest daily jump of month, yields dribble ahead of US data, key earnings
- Markets remain dicey after a volatile day that drowned US Dollar and fuelled risk-on mood.
- Greenback drops as US inflation clues, employment data keep pushing back hawkish Fed bets.
- Recession woes, geopolitical concerns fail to provide tailwind to USD.
- S&P 500 Futures remain lackluster, US Treasury bond yields retreat ahead of US consumer-centric statistics.
Market players portray a mixed feelings during early Friday, following a volatile Thursday, amid anxiety ahead of the key US data. Also contributing to the trading inaction could be the lack of major data/events during the Asian session, as well as the lack of clarity over the economic optimism in Asia.
While portraying the mood, the S&P 500 Futures make rounds to 4,170-75 after rising the most in the current month whereas the US 10-year and two-year Treasury bond yields fade the previous day’s corrective bounce by retreating to 3.44% and 3.96% in that order. It should be noted that Wall Street closed with notable gains the previous day whereas the US Dollar Index (DXY) prods the lowest level of 2023 marked in February as the greenback bears attack the 100.80 level, around 100.90 by the press time.
The downbeat US inflation clues and the Fed policymakers’ hesitance in confirming the further rate hikes exert downside pressure on the yields and the US Dollar, while favoring the equities. Also weighing on the yields could be the fears of a recession in the West and geopolitical fears emanating from China, Russia and North Korea.
That said, the US Producer Price Index (PPI) for March dropped to a four-month low of -0.5% MoM versus 0.0% expected and prior whereas the PPI YoY also declined to 2.7% from 4.9% previous readouts, versus market forecasts of 3.0%. Previously, the Consumer Price Index (CPI), dropped to the lowest level since May 2021, to 5.0% YoY in March from 6.0% prior and versus 5.2% market forecasts. However, the annual Core CPI, namely the CPI ex Food & Energy, improved to 5.6% YoY during the said month while matching forecasts and surpassing 5.5% prior.
Additionally, Minutes of the latest Federal Open Market Committee (FOMC) Monetary Policy Meeting also direct traders toward the US Treasury bond yields and weigh on the US Dollar, as well as favor Wall Street. The reason could be linked to the Minutes stated saying that the expectations for rate hikes were scaled back due to the turmoil in the banking sector. With this, the Minutes offered no fresh information and raised doubts about the hawkish Fed moves, apart from May’s 0.25% rate hike.
Elsewhere, multiple statements from the International Monetary Fund (IMF) and the World Bank (WB) Spring Meeting of global central bank officials suggest that the recession woes are more likely in the West while suggesting an economic recovery in Asia. The same underpins the cautious optimism.
Moving on, the US Retail Sales for March, the Michigan Consumer Sentiment Index (CSI) for April and the University of Michigan’s (UoM) 5-year Consumer Inflation Expectations will be important to watch for clear directions. Also important will be the first quarter (Q1) earnings reports from key banks like JP Mogan, Wells Fargo and Citibank.
Also read: Forex Today: Dollar consolidates after heavy losses, remains vulnerable
-
03:30
Commodities. Daily history for Thursday, April 13, 2023
Raw materials Closed Change, % Silver 25.83 1.36 Gold 2040.7 1.3 Palladium 1503.04 2.55 -
03:20
USD/CAD Price Analysis: Downside resumes as US Dollar retreats and oil prices rebound
- USD/CAD has continued its four-day losing spell after dropping below 1.3333.
- The USD Index is on the verge of testing a two-month low of 100.82 as US inflation expectations have receded sharply.
- US firms passed on the benefit of lower gasoline prices to end consumers by lowering prices of goods and services.
The USD/CAD pair has continued its four-day losing streak by slipping below Thursday’s low of 1.3333 in the Asian session. The Loonie asset has attracted significant offers as oil prices have rebounded after a steep correction and the US Dollar Index (DXY) has resumed its downside journey after a short-loved pullback to near 101.00.
It is worth noting that Canada is the leading exporter of oil to the United States and a recovery in oil prices will support the Canadian Dollar.
The USD Index is on the verge of testing a two-month low of 100.82 as United States consumer inflation expectations have receded sharply after firms passed on the benefit of lower gasoline prices to end consumers by lowering prices of goods and services at factory gates. This is indicating that the Federal Reserve (Fed) will soon achieve price stability.
USD/CAD resumed its downside journey after a pullback move to near 10-period Exponential Moving Average (EMA) around 1.3533 on a daily scale. Investors capitalized on the pullback move as a fresh selling opportunity. Potential supports are placed from February 01 and 15 November 2022 low at 1.3267 and 1.3226 respectively.
The Relative Strength Index (RSI) (14) has slipped again into the bearish range of 20.00-40.00 after a failed attempt of a range shift, which indicates that the upside is capped.
For further downside, a break below the round-level support of 1.3300 will drag the Loonie asset toward February 01 low at 1.3267, followed by 15 November 2022 low at 1.3226.
Alternatively, a decisive break above April 10 high at 1.3554 will drive the asset toward the round-level resistance at 1.3600. A breach of the 1.3600 resistance will expose the asset to March 23 low at 1.3630.
USD/CAD daily chart
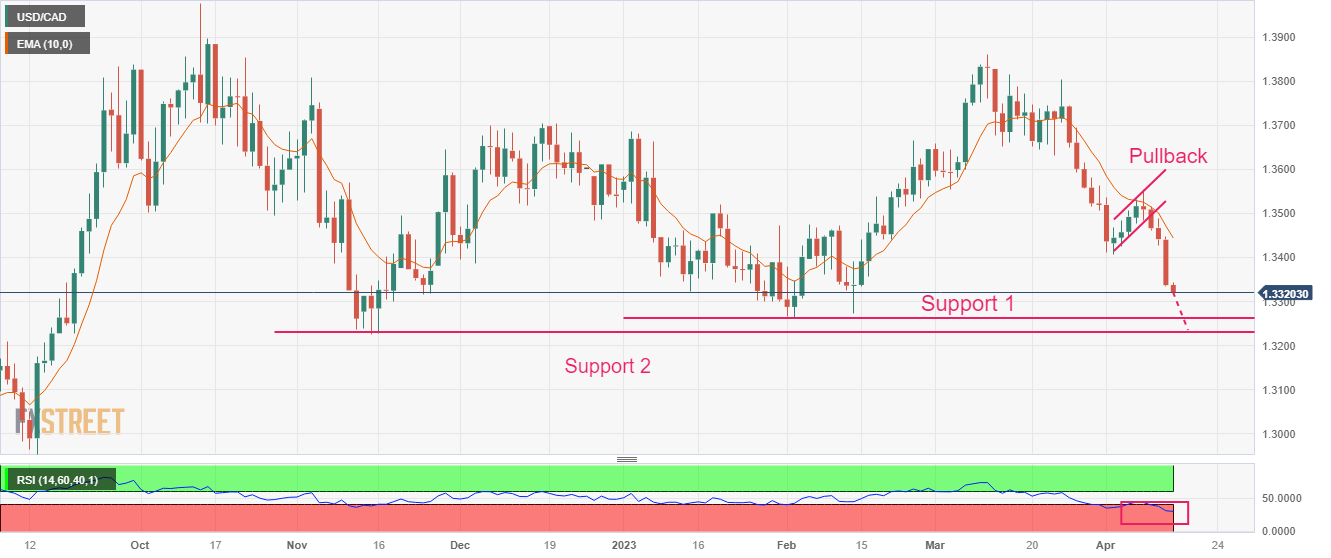
-
03:16
USD/CNH Price Analysis: Breaks 10-week-old support to renew monthly low around 6.8500
- USD/CNH takes offers to renew multi-day low during three-day downtrend.
- Clear break of 2.5-month-long ascending trend line direct offshore Chinese Yuan buyers towards 6.8100.
- Recovery remains elusive below 100-DMA; previous monthly high is the key upside hurdle.
USD/CNH stands on slippery grounds as it breaks the short-term key support while refreshing the lowest levels in two weeks to around 6.8500 during early Friday.
Not only a clear break of the ascending trend line from early February but a downbeat RSI (14), not oversold, joins the quote’s sustained U-turn from the 100-DMA to also favor the offshore Chinese Yuan (CNH) buyers, which in turn weighs on the USD/CNH price.
With this, the USD/CNH pair is all set to visit a 2.5-month-old horizontal support area surrounding 6.8100.
However, the 6.8000 round figure and the easing RSI (14) line could challenge the USD/CNH bears afterward, if not then multiple levels marked during late January and early February, respectively near 6.7900 and 6.7750, could act as the last defense of the buyers.
On the flip side, the aforementioned support-turned-resistance line restricts the USD/CNH pair’s corrective bounce near 6.8570.
Following that, the 100-DMA level of around 6.8890 and the 6.8900 round figure could challenge the pair buyers.
In a case where USD/CNH remains firmer past 6.8900, the 6.9000 round figure and the previous monthly high of 6.9970 will be crucial to watch as it holds the key to the bull’s dominance.
USD/CNH: Daily chart
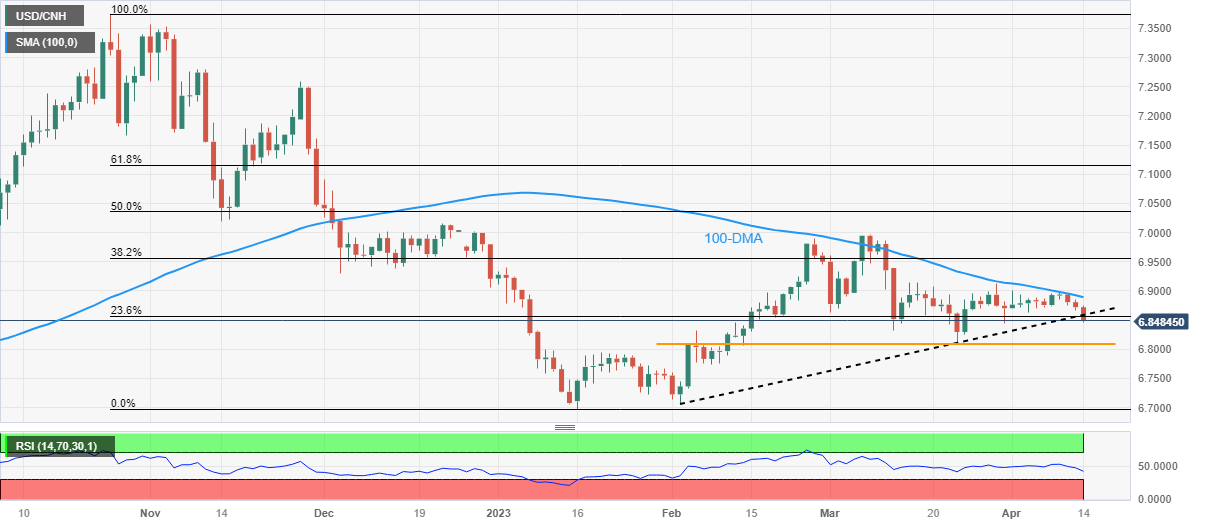
Trend: Further downside expected
-
03:01
USD/CHF drops back towards 27-month low with eyes on Swiss, US inflation clues
- USD/CHF fades late Thursday’s corrective bounce off the lowest levels since January 2021.
- US Dollar remains pressured as downbeat inflation clues push back hawkish Fed bets.
- Swiss Producer and Import Prices, US Retail Sales and University of Michigan’s Consumer Inflation Expectations eyed.
USD/CHF retreats to 0.8885 during early Friday, following its corrective bounce off 0.8860 the previous day. In doing so, the Swiss Franc (CHF) pair fades the bounce off the lowest levels in 27 months amid broad-based US Dollar weakness. It’s worth noting that the pair’s further downside appears limited amid the market’s cautious tone ahead of the key Swiss and US inflation numbers.
That said, the US Dollar Index (DXY) prods the lowest level of 2023 marked in February as the greenback bears attack the 100.80 level, around 100.90 by the press time.
The greenback’s latest losses could be linked to the recently downbeat US inflation data as it rules out the need for higher Federal Reserve (Fed) rates and weighs on the US Dollar and the USD/CHF price in turn.
That said, On Thursday, the US Producer Price Index (PPI) for March dropped to a four-month low of -0.5% MoM versus 0.0% expected and prior whereas the PPI YoY also declined to 2.7% from 4.9% previous readouts, versus market forecasts of 3.0%. Previously, the Consumer Price Index (CPI), dropped to the lowest level since May 2021, to 5.0% YoY in March from 6.0% prior and versus 5.2% market forecasts. However, the annual Core CPI, namely the CPI ex Food & Energy, improved to 5.6% YoY during the said month while matching forecasts and surpassing 5.5% prior.
Apart from US inflation clues, talks of Fed policymakers, signaled via the latest Minutes of the latest Federal Open Market Committee (FOMC) Monetary Policy Meeting also keep the USD/CHF bears hopeful. The reason could be linked to the Minutes stated saying that the expectations for rate hikes were scaled back due to the turmoil in the banking sector. With this, the Minutes offered no fresh information and raised doubts about the hawkish Fed moves, apart from May’s 0.25% rate hike.
Furthermore, multiple statements from the International Monetary Fund (IMF) and the World Bank (WB) Spring Meeting of global central bank officials suggest that the recession woes are more likely in the West. The same weigh on the US Dollar amid softer inflation data and propel the Gold price. Furthermore, hopes of economic recovery in Asia and the moves to destabilize the US Dollar’s reserve currency status by Russia, China and Brazil also exert downside pressure on the USD/CHF price.
Against this backdrop, S&P 500 Futures print mild losses by the press time, despite the firmer closing of Wall Street. Further, the US 10-year and two-year Treasury bond yields fade the previous day’s recovery and exert downside pressure on the DXY.
Moving on, Swiss Producer and Import Prices for March, expected to remain unchanged at -0.2% MoM, will precede the US Retail Sales for March, the Michigan Consumer Sentiment Index (CSI) for April and the University of Michigan’s (UoM) 5-year Consumer Inflation Expectations to direct USD/CHF moves.
Technical analysis
A clear downside break of an eight-month-old descending support line, now immediate resistance around 0.8930, directs USD/CHF bears toward the year 2021 low near 0.8760.
-
02:52
PBOC’s Yi: Expect China’s GDP this year to grow around 5%
People's Bank of China (PBOC) Yi Gang said in a statement on Friday, he is expecting the Gross Domestic Product (GDP) in China this year to grow around 5%, as the economy is rebounding and stabilizing, the property sector is rebounding and inflation is low.
Earlier this week, during the G20 meeting of finance ministers and central bank heads, Governor Yi and US Federal Reserve (Fed) Chairman Jerome Powell discussed the US and Chinese economic and financial developments.
Market reaction
USD/CNY was last seen trading at 6.8675, almost unchanged on the day. The Chinese Yuan failed to find any impetus from the above comment.
-
02:43
BoJ Uedao: Will maintain current monetary easing
Bank of Japan´s governor Kazuo Ueda has crossed the wires saying that he told the G20 that Japan's core consumer inflation, which is currently around 3%, is likely to fall back below 2% in the second half of this fiscal year.
Key comments
Told G20 counterparts we must be vigilant to risks regarding financial system, including nonbank sector, cross-border impact.
IMF has warned as risk scenario chance of severe global recession but our projection is for global growth to recover after period of slowdown.
IMF has warned as risk scenario chance of severe global recession but our forecast is for global growth to recover after period of slowdown.
Under our view that global economy to recover, we expect Japan's wages to continue rising.Told G20 BoJ will maintain current monetary easing.
It's been just a week since I became BoJ governor and I am now on a business trip so want to think about it once I fly back to Japan when asked about BoJ's April policy meeting.
Told G20 Japan's core consumer inflation, which is now around 3%, likely to slow back below 2% toward latter half of this fiscal year.
USD/JPY update
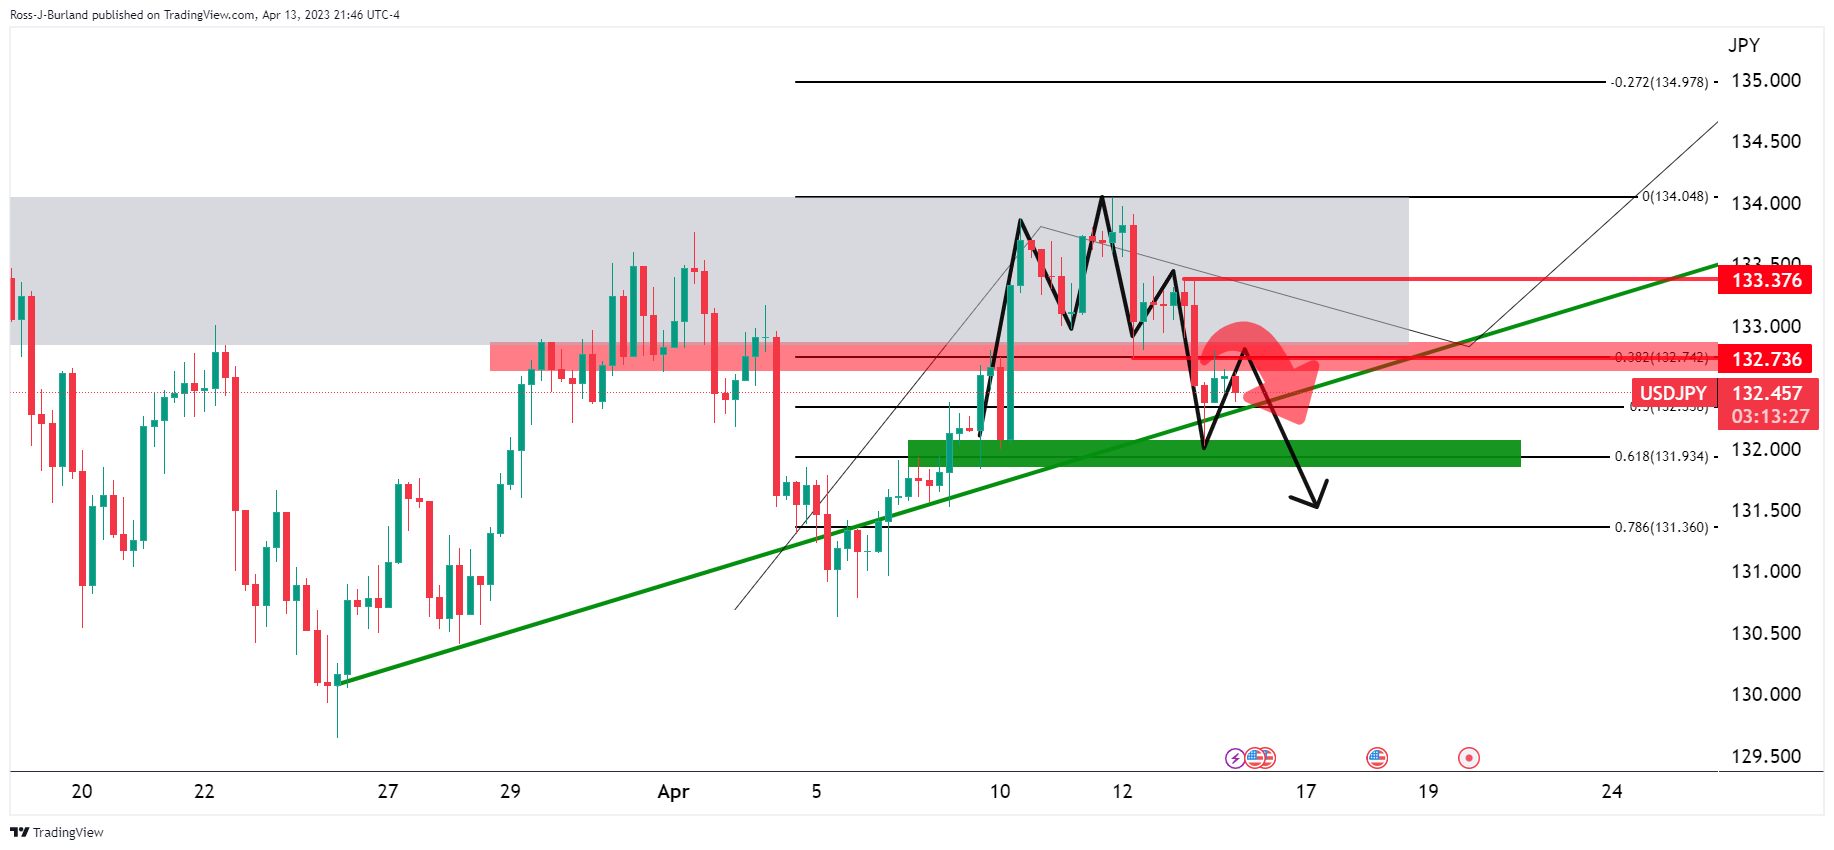
The price is testing the 132.70s resistance but on continuous failures, a bearish bias will continue to build for the forthcoming sessions with eyes on a break of trendline support as illustrated above, putting the focus on a break below 132.00 and then 131.50.
More on the technical outlook here:
-
USD/JPY bears eye a break of trendline support for a significant downside move
-
-
02:42
GBP/JPY Price Analysis: Upside momentum fades around 166.00 as UK inflation sets to decline
- GBP/JPY is juggling around 166.00 amid a restrictive upside on hopes that UK inflation will start declining sooner.
- Higher rates from the BoE are forcing firms to postpone their expansion plans.
- BoJ Ueda is advocating the continuation of an already decade-long ultra-loose monetary policy to sustain wage growth.
The GBP/JPY pair is inside the woods around 166.00 in the Asian session. The cross has been directionless from the past two trading sessions as investors are anticipating quick deceleration in the United Kingdom (UK) inflation amid easing labor market conditions. Higher rates from the Bank of England (BoE) are forcing firms to postpone their expansion plans, which are making a dent in labor demand.
BoE Chief Economist Huw Pill looked confident on Thursday that UK Consumer Price Index (CPI) will start falling from the second quarter due to large rises in energy prices from last year dropping out of the annual comparison, as reported by Reuters.
Meanwhile, Bank of Japan (BoJ) Governor Kazuo Ueda is following the footprints of ex-BoJ Governor Haruhiko Kuroda as the former is advocating the continuation of already decade-long ultra-loose monetary policy to sustain wage growth and pushing inflation rate steadily above desired levels.
Exhaustion in the upside momentum after reclaiming prior resistance plotted from April 04 high at 166.40 has triggered fears of reversal. The cross is oscillating in the range of 165.40-166.85, indicating an inventory distribution phase from institutional investors to retail participants.
The 20-period Exponential Moving Average (EMA) at 166.13 is overlapping the asset price, conveying a rangebound movement.
Also, the Relative Strength Index (RSI) (14) is oscillating in the 40.00-60.00 range, signaling that investors are awaiting a critical trigger for further action.
Should the cross breaks below April 12 low at 165.38 decisively, the Japanese Yen bulls will drag the asset toward April 10 low at 164.00 followed by April 05 low at 162.78.
On the flip side, an upside move above April 13 high at 166.85 will drive the asset toward December 16 high at 168.00 and December 15 high at 168.78.
GBP/JPY hourly chart
-638170332156752348.png)
-
02:31
Natural Gas Price Analysis: XNG/USD approaches $2.23 hurdle on bullish RSI divergence
- Natural Gas price picks up bids to refresh intraday high, snaps two-day downtrend.
- Higher low of XNG/USD price contradicts with lower lows of RSI to suggest further recovery.
- Immediate resistance line holds the key to further upside, weekly top prods Natural Gas buyers.
- XNG/USD bears need validation from $2.12 to retake control.
Natural Gas (XNG/USD) price renews intraday high near $2.20 as the energy instrument defies the previous two-day losing streak during early Friday. In doing so, the XNG/USD justifies hidden bullish RSI (14) divergence on the four-hour chart.
That said, Natural Gas price printed higher lows in the last two weeks but the RSI conditions commensurate to these troughs remain contradicting as the RSI (14) line marks a lower low. As a result, the price momentum towards the upside seems to gain acceptance and hence the XNG/USD buyers can expect more recovery.
However, a downward-sloping resistance line from Tuesday, near $2.23 by the press time, guards the quote’s immediate upside ahead of the weekly top surrounding $2.36.
Following that, a one-month-old horizontal resistance area surrounding $2.47-50 will be a tough nut to crack for the Natural Gas buyers before retaking the command.
Alternatively, pullback moves remain elusive unless the XNG/USD stays beyond an ascending support line stretched from late February, around $2.12 at the latest.
Even so, the $2.00 psychological magnet can challenge the Natural Gas bears before directing them to the July 2020 high of around $1.96.
XNG/USD: Four-hour chart
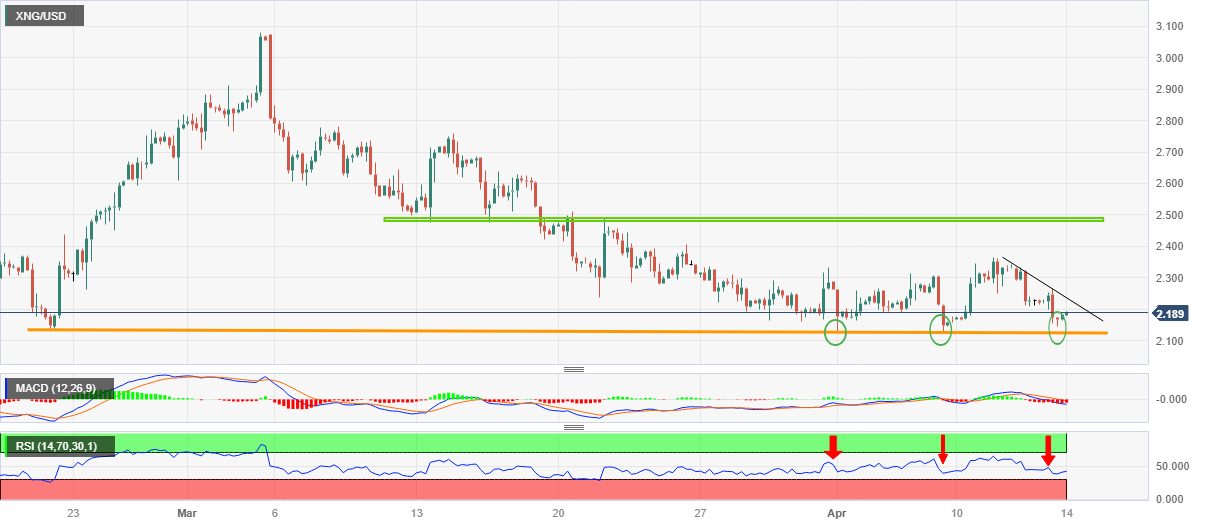
Trend: Further recovery expected
-
02:25
USD/CNY fix: 6.8606 vs. last close of 6.8680
In recent trade today, the People’s Bank of China (PBOC) set the yuan at 6.8606 vs. last close of 6.8680.
About the fix
China maintains strict control of the yuan’s rate on the mainland.
The onshore yuan (CNY) differs from the offshore one (CNH) in trading restrictions, this last one is not as tightly controlled.
Each morning, the People’s Bank of China (PBOC) sets a so-called daily midpoint fix, based on the yuan’s previous day's closing level and quotations taken from the inter-bank dealer.
-
02:09
NZD/USD Price Analysis: Bulls testing the 0.63s for bears lurking in key resistance
- NZD/USD bears could be about to make a move.
- The NZ Dollar bulls are probing key resistance on Friday.
The NZD benefited from the risk-on tone on Thursday and is yet to confirm a top. However, there are prospects of a bearish correction as the following analysis will illustrate.
NZD/USD H4 charts
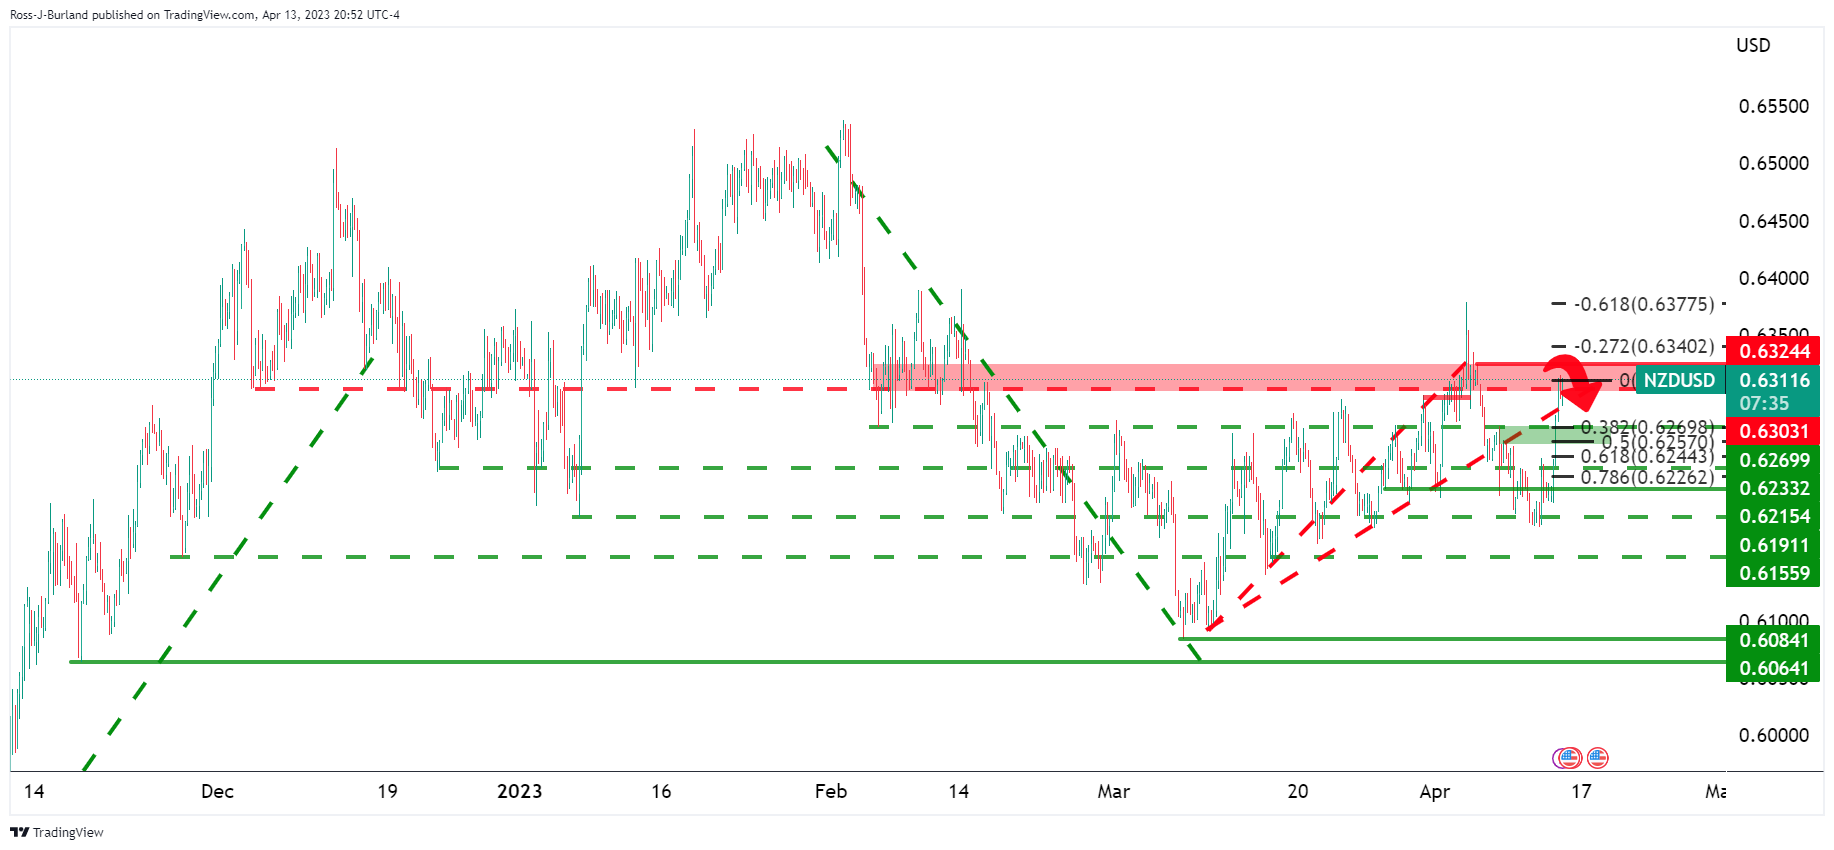
The pair has reached resistance and could be on the verge of a significant correction toward an area of confluence, better seen on a cleaner chart as follows:
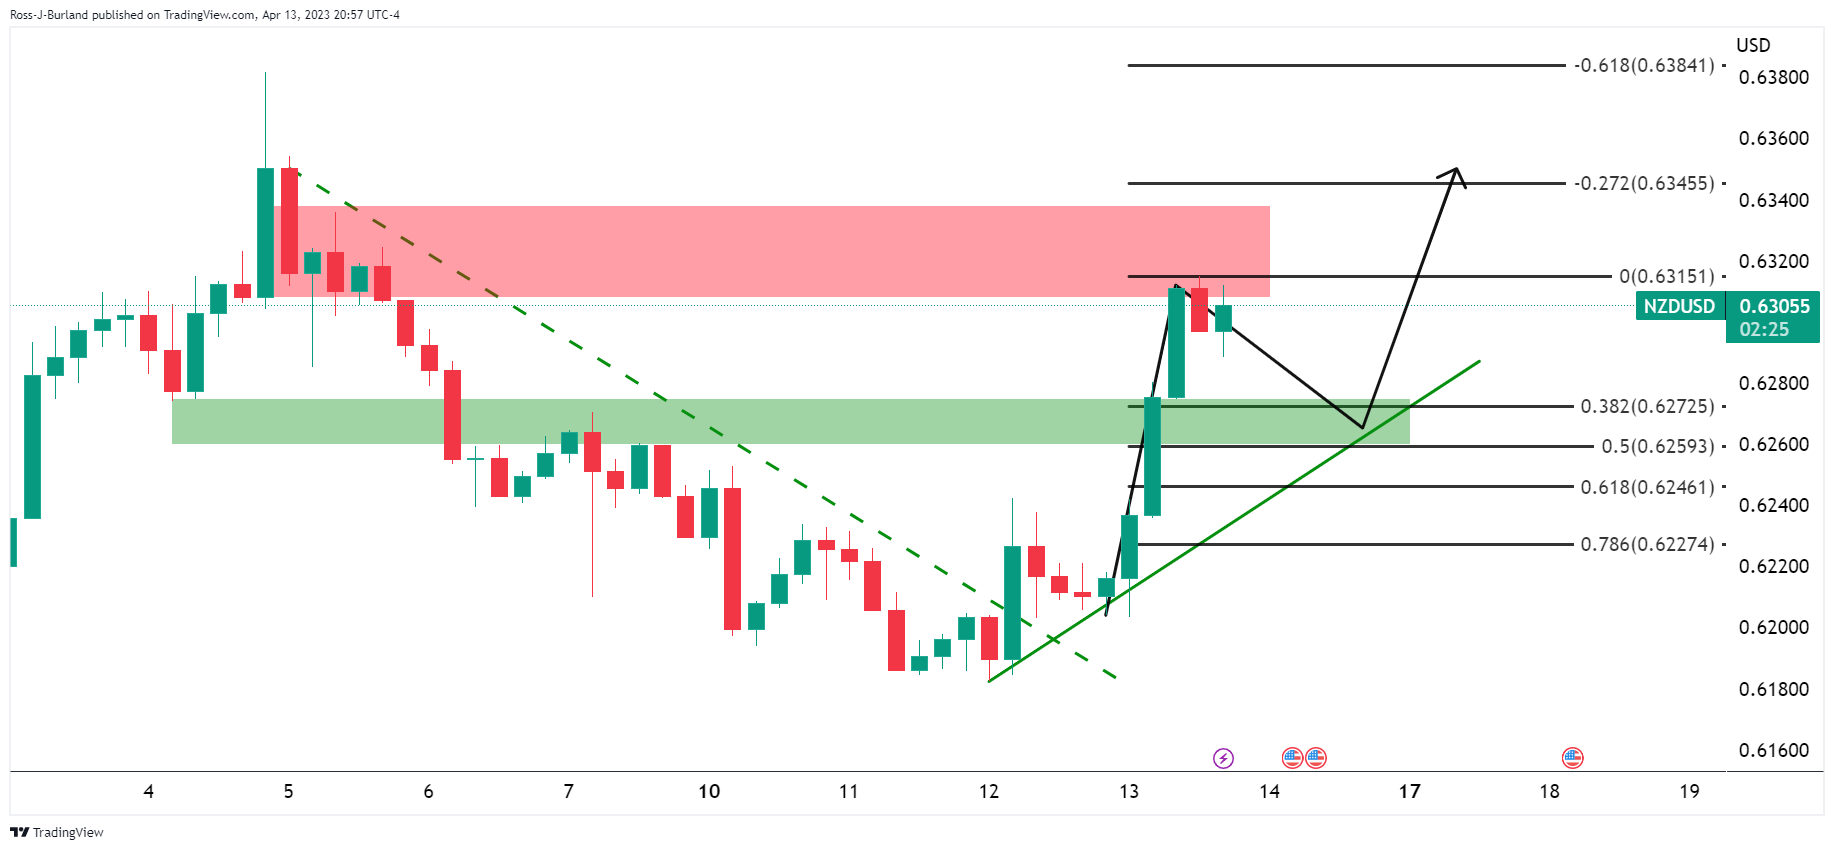
A 38.2% Fibonacci retracement could be on the cards to test the trendline support.
NZD/USD H1 chart
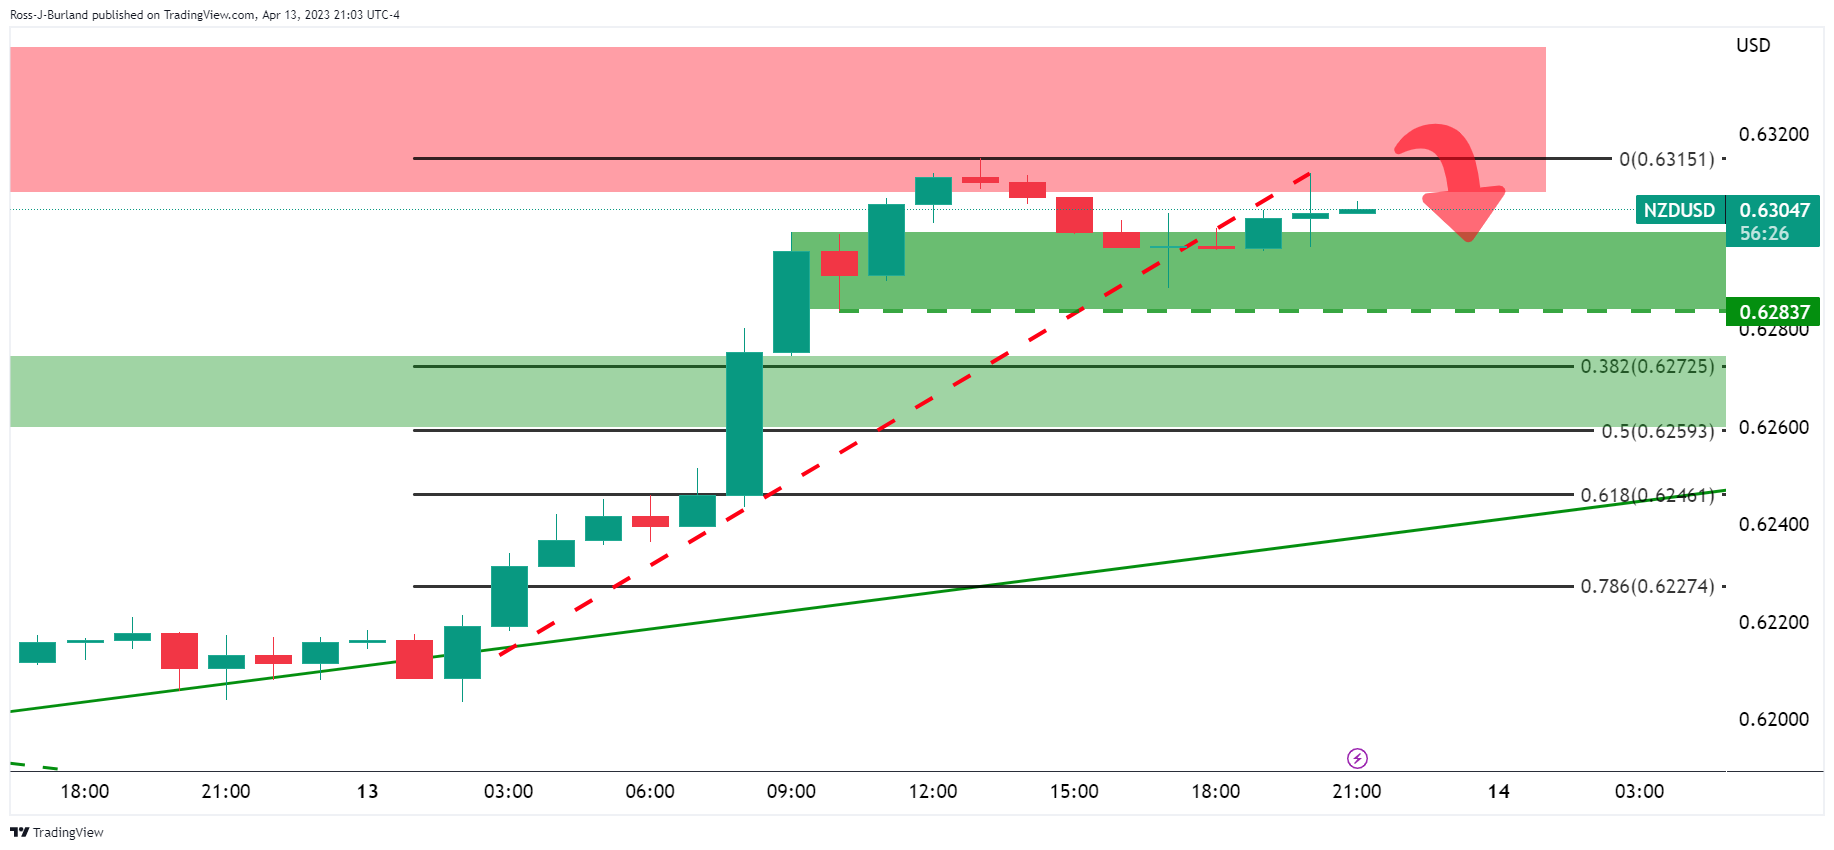
Meanwhile, from an hourly perspective, the 0.6280s is an area of support that if broken, will likely confirm the bearish bias. However, although the price is now on the backside of the prior hourly bullish dynamic supporting trendline, the bulls are coming up for a retest of the highs in the 0.63s and thus a peak formation is yet to be put in.
-
02:09
GBP/USD bulls keep the reins at 10-month high above 1.2500 even as inflation woes recede
- GBP/USD clings to mid gains at the highest levels since June 2022, prints four-day uptrend at the latest.
- Softer US inflation, Fed concerns weigh on US Dollar and allow the Cable pair to remain firmer despite mixed UK data.
- Talks of easing inflation in Britain, absence of hawkish clues from BoE officials prod GBP/USD bulls.
- Cable buyers need to watch US Retail Sales, Michigan CSI and Consumer Inflation Expectations for further directions.
GBP/USD bulls take a breather at the highest levels in 10 months while making rounds to 1.2520-30 during early Friday. In doing so, the Cable pair remains firmer for the fourth consecutive day, after rising to the March 2022 peak the previous day, even as bulls seek more clues to extend the latest run-up.
GBP/USD cheered downbeat US inflation data, versus mixed figures at home, to portray the recent north-run to the multi-day high. Though, a cautious mood ahead of Friday’s US Retail Sales for March, the Michigan Consumer Sentiment Index (CSI) for April and the University of Michigan’s (UoM) 5-year Consumer Inflation Expectations for the current month seems to challenge the pair buyers of late. On the same line could be the talks that the Bank of England (BoE) hawks are running out of steam.
On Wednesday, the US Producer Price Index (PPI) for March dropped to a four-month low of -0.5% MoM versus 0.0% expected and prior. Further, the PPI YoY also declined to 2.7% from 4.9% previous readouts, versus market forecasts of 3.0%. Additionally weighing on the hawkish Fed bets and the US Dollar is the US Initial Jobless Claims figure as it rose to 239K versus 232K expected and 228K prior.
That said, UK’s February 2023 Gross Domestic Product (GDP) eased to 0.0% versus 0.1% expected and 0.4% prior while the Industrial Production improved on YoY but declined on MoM during the stated month. Further details suggest an increase in the trade deficit and no change in the Index of Services (3M/3M) figure of 0.1% in February versus -0.2% expected. It should be noted that the UK NIESR GDP Estimate (3M) for March rose to 0.1% versus -0.1% expected and prior.
On a different page, UK Finance Minister Jeremy Hunt signaled an election may be held as early as spring 2024 as he expects the economy to have “turned the corner”, which in turn bolstered the GBP/USD prices the previous day. However, his comments like, “We do not believe a US trade agreement is imminent,” seemed to have probed the bulls afterward.
Additionally, Bank of England Chief Economist Huw Pill said on Thursday that they still expect Consumer Price Index (CPI) inflation to fall in the second quarter due to large rises in energy prices from last year dropping out of the annual comparison, per Reuters. "Bank staff continue to expect GDP to decline by 0.1% in 2023 Q1," added BoE’s Pill while also saying that the precise path of inflation may be bumpier than we expect.
Amid these plays, S&P 500 Futures print mild losses by the press time, despite the firmer closing of Wall Street. Further, the US 10-year and two-year Treasury bond yields fade the previous day’s recovery and exert downside pressure on the DXY.
Moving on, the aforementioned US data may allow the US Dollar to lick its wounds in case of a positive surprise. However, the GBP/USD pullback has limited scope unless BoE’s Silvana Tenreyro, who voted for a pause in the rate hike in the last monetary policy meeting, utters dovish words while speaking at the International Monetary Fund Spring Meetings.
Technical analysis
A successful rebound of a four-month-old previous resistance line, around 1.2375 by the press time, directs GBP/USD buyers towards the May 2022 high of around 1.2665.
-
02:07
EUR/GBP marches towards 0.8840 amid hawkish ECB bets and slowing UK labor market
- EUR/GBP is looking to recapture 0.8840 as the ECB is also considering the option of a 50 bps rate hike ahead.
- Eurozone core inflation is extremely persistent due to tight labor market conditions.
- The Pound Sterling is facing pressure as BoE policymakers are confident that inflation will start decelerating quickly.
The EUR/GBP pair is aiming to recapture the critical resistance of 0.8840 in the Toyo session. The cross witnessed a decent correction but has resumed its upside journey as investors are anticipating a severe hawkish monetary policy from the European Central Bank (ECB) ahead.
In Eurozone, headline inflation is not a concern now for ECB policymakers as it has been significantly softening, however, persistent core inflation is strengthening the cause of worry. ECB Governing Council member Bostjan Vasle said that they are considering 25 and 50 basis points (bps) rate hike options for the May policy meeting, per Reuters. He further added, "Headline inflation is coming down but we are all focused on core inflation, which is still moving in the wrong direction.
The reason behind persistent core inflation in Eurozone is the tight labor market conditions, which are fueling households with immense funds for disposal.
Reuters reported on Thursday, ECB policymakers are converging on a 25 basis points (bps) interest rate hike in May. Reuters further added, “Though the debate is not over, with one small group still making case for a 50 bps hike in May by ECB President Christine Lagarde; another small group advocating no change.”
On the United Kingdom front, the Pound Sterling is facing pressure as Bank of England (BoE) policymakers are confident that inflation will start decelerating quickly. BoE Chief Economist Huw Pill said on Thursday that they still expect Consumer Price Index (CPI) inflation to fall in the second quarter due to large rises in energy prices from last year dropping out of the annual comparison.
Meanwhile, the Financial Times reported that the UK job market is easing and lifting hopes of fading inflationary pressures, however, the easing UK labor market conditions are insufficient to support a pause in the rate-hike spell.
-
01:41
AUD/USD Price Analysis: Long-term EMA at 0.6810 acts as headwind to Aussie bulls
- AUD/USD remains firmer at the highest levels in seven weeks, mildly bid of late.
- 1.5-month-old ascending trend line, 200-EMA challenges Aussie buyers.
- Pullback moves can aim for 100-EMA but ascending support line from March becomes crucial for bear’s conviction.
AUD/USD clings to mild gains at the highest level in seven weeks, marked the previous day, making rounds to 0.6780-90 during early Friday. In doing so, the Aussie pair prints a four-day winning streak while justifying the bullish signals from the MACD indicator.
However, an upward-sloping resistance line from early March, near the 0.6800 round figure, guards the immediate run-up of the AUD/USD pair.
Following that, the 200-day Exponential Moving Average (EMA) level of around 0.6810 will be crucial for the Aussie buyers to tackle if they wish to keep the reins.
It’s worth noting that the RSI (14) line still has some gap before it hits the overbought territory, which in turn suggests the AUD/USD pair’s limited upside room.
In a case where the quote rises past 0.6810, the 0.7000 round figure and a mid-February high of around 0.7030 will be in the spotlight.
On the contrary, the 100-EMA level of 0.6760 can restrict pullback moves of the AUD/USD pair, a break of which can recall the 0.6700 psychological magnet to the chart.
Even so, the Aussie pair buyers should remain hopeful unless the quote offers a daily closing below a five-week-old ascending support line, close to 0.66303 at the latest.
AUD/USD: Daily chart
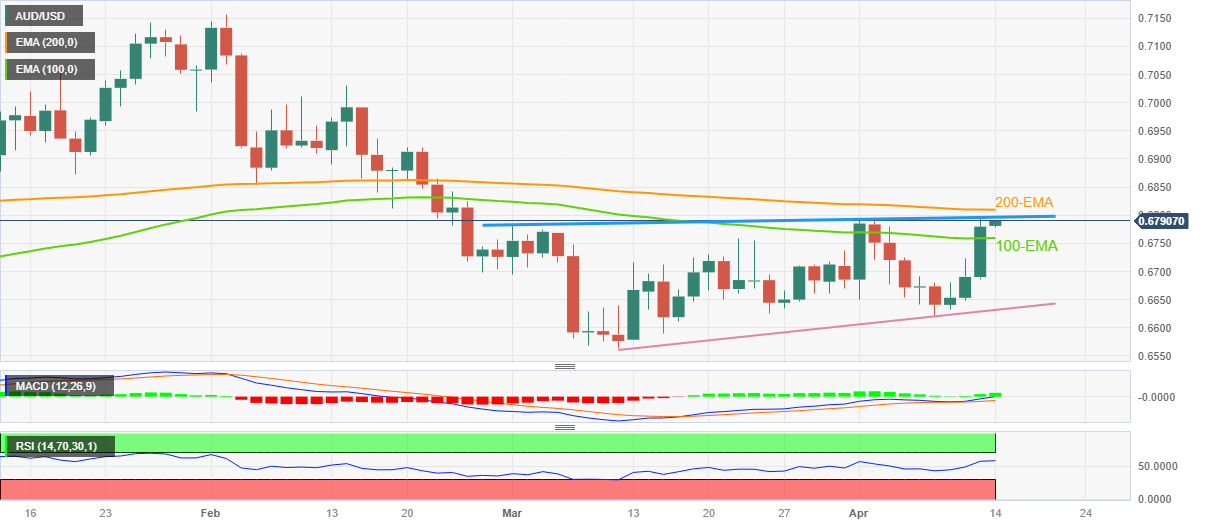
Trend: Limited upside expected
-
01:37
EUR/USD Price Analysis: Eyes 1.1100 as US Inflation softens and hawkish ECB bets soar
- EUR/USD has resumed its upside journey after building a base below 1.1050 amid a risk-on mood.
- ECB Vasle has kept doors open for a 25 bps or 50 bps rate hike for May’s policy meeting.
- The US Dollar is facing immense pressure amid expectations that the Fed will arrest stubborn inflation sooner than expected.
The EUR/USD pair has resumed its upside journey after building a base below 1.1050 in the Asian session. The major currency pair is gaining strength through support from both currencies. The US Dollar is facing immense pressure as the street is expecting that the Federal Reserve (Fed) will arrest the United States stubborn inflation sooner than expected after the sheer softening of the US Producer Price Index (PPI) led by lower gasoline prices.
S&P500 futures are showing marginal losses in the Asian session after a bullish Thursday, indicating a minor caution amid the overall upbeat market mood. The US Dollar Index (DXY) has shown a minor recovery to near 100.60 as investors booked short positions, however, the downside bias is still solid.
The Euro is gaining traction as investors are divided about the scale of an interest rate hike by the European Central Bank (ECB). Governing Council member Bostjan Vasle said that they are considering 25 and 50 basis points (bps) rate hike options for the May policy meeting, per Reuters. He further added, "Headline inflation is coming down but we are all focused on core inflation, which is still moving in the wrong direction.
On a two-hour scale, the shared currency pair delivered a breakout of the Rising Channel, which indicates the enormous strength of Euro bulls. The asset rallied after testing the breakout and printed a fresh annual high at 1.1068. Advancing 20-period Exponential Moving Average (EMA) indicates that 1.1010 indicates that the upside momentum is extremely solid.
The Relative Strength Index (RSI) (14) is hovering in the bullish range of 60.00-80.00, solidifying more upside ahead.
A healthy correction to near the 20-EMA will be a good bargain for investors, which will drive the asset to an annual high at 1.1068, followed by the round-level resistance at 1.1100.
In an alternate scenario, a decisive break below April 13 low at 1.0977 will drag the asset towards April 12 low at 1.0915 and April 10 low at 1.0837.
EUR/USD two-hour chart

-
01:30
Stocks. Daily history for Thursday, April 13, 2023
Index Change, points Closed Change, % NIKKEI 225 74.27 28156.97 0.26 Hang Seng 34.62 20344.48 0.17 KOSPI 11.02 2561.66 0.43 ASX 200 -19.8 7324.1 -0.27 FTSE 100 18.58 7843.38 0.24 DAX 25.86 15729.46 0.16 CAC 40 83.89 7480.83 1.13 Dow Jones 383.19 34029.69 1.14 S&P 500 54.27 4146.22 1.33 NASDAQ Composite 236.93 12166.27 1.99 -
01:18
Gold Price Forecast: XAU/USD eyes fresh record high on softer United States inflation, US Dollar
- Gold price remains firmer at 13-month high, braces for two-week uptrend.
- Easy United States inflation, Fed policy pivot talks weigh on US Dollar and propel XAU/USD.
- US Retail Sales, Michigan Consumer Sentiment Index and Consumer Inflation Expectations eyed for immediate Gold price directions.
Gold price (XAU/USD) remains firmer at the highest levels since March 2022 marked the previous day, making rounds to $2,040 amid early Friday in Asia. In doing so, the precious metals seek more clues to extend the latest run-up towards the record high of $2,075 reported in 2020.
Despite the latest inaction, the XAU/USD cheers softer US Dollar amid downbeat United States inflation clues and talks of the Federal Reserve (Fed) policy pivot, mainly backed by the latest data and events. Adding strength to the Gold price upside are the recession woes and upbeat headlines from China, one of the world’s biggest XAU/USD consumers.
Gold price cheers easing inflation clues from the United States
Gold price cheer slower inflation data as it rules out the need for higher Federal Reserve (Fed) rates and weighs on the US Dollar in turn.
On Thursday, the US Producer Price Index (PPI) for March dropped to a four-month low of -0.5% MoM versus 0.0% expected and prior whereas the PPI YoY also declined to 2.7% from 4.9% previous readouts, versus market forecasts of 3.0%.
Previously, the Consumer Price Index (CPI), dropped to the lowest level since May 2021, to 5.0% YoY in March from 6.0% prior and versus 5.2% market forecasts. However, the annual Core CPI, namely the CPI ex Food & Energy, improved to 5.6% YoY during the said month while matching forecasts and surpassing 5.5% prior.
It should be noted that the Minutes of the latest Federal Open Market Committee (FOMC) Monetary Policy Meeting signaled that the expectations for rate hikes were scaled back due to the turmoil in the banking sector. With this, the Minutes offered no fresh information and raised doubts about the hawkish Fed moves, apart from May’s 0.25% rate hike.
On a different page, multiple statements from the International Monetary Fund (IMF) and the World Bank (WB) spring gathering of global central bank officials suggest that the recession woes are more likely in the West. The same weigh on the US Dollar amid softer inflation data and propel the Gold price. Furthermore, hopes of economic recovery in Asia and the moves to destabilize the US Dollar’s reserve currency status by Russia, China and Brazil also exert downside pressure on the DXY and please the XAU/USD buyers.
Amid these plays, the US Dollar Index (DXY) remains depressed around the lowest levels in 10 weeks the previous day amid a three-day downtrend, proding the year 2023 low and propelling the Gold price. It’s worth observing that Thursday’s rebound in the US Treasury bond yields failed to underpin the DXY’s corrective bounce. That said, US 10-year and two-year Treasury bond yields fade the previous day’s recovery moves while retreating to 3.45% and 3.96% in that order.
China, India catalysts add strength to the XAU/USD upside
Apart from the US Dollar weakness and recession woes in the West, hopes of faster economic recovery in India and China, one of the world’s biggest Gold consumers, also allow the XAU/USD to remain firmer. Recently, the IMF signaled that India will be the global economic growth engine while New Delhi and Beijing together could contribute 50% of the world economic growth. With this, Gold traders ignored the recently easy inflation numbers from China and India, as well as mixed trade figures for Beijing.
More clues of US inflation eyed for clear directions
Looking forward, the Gold price is likely to remain firmer amid a light calendar during the early part of the day. That said, US Retail Sales for March, expected to repeat -0.4% MoM figure, precedes the preliminary readings of the US Michigan Consumer Sentiment Index (CSI), likely staying unchanged at 62, to entertain the XAU/USD traders afterward. Also important to watch will be the University of Michigan’s (UoM) 5-year Consumer Inflation Expectations, prior 2.9%. Should the scheduled data print downbeat figures, the Gold price may quickly jump to the previous all-time high and may even surpass the $2,075 key hurdle.
Gold price technical analysis
Gold price remains firmer at a 13-month high, recently flirting with the 11-week-old ascending resistance line amid overbought conditions of the Relative Strength Index (RSI) line, placed at 14.
The same joins impressive bullish signals from the Moving Average Convergence and Divergence (MACD) indicator to suggest a pullback in the Gold price.
As a result, a convergence of a fortnight-long ascending trend line and the 10-DMA, around $2003 at the latest, can’t be ruled out.
However, a three-week-old rising support line and a horizontal area comprising February’s high, respectively near $1,966 and $1960-58, could challenge the Gold bears afterward.
Alternatively, a clear upside break of the stated resistance line, close to $2,042 at the latest, may not hesitate to approach the previous yearly high of around $2,070, a break of which will shift the market’s attention to the record top of $2,075 marked in 2020.
Should the Gold price remains firmer past $2,075, the expectations of witnessing a rally toward the $2,100 threshold gain momentum.
Gold price forecast: Daily chart
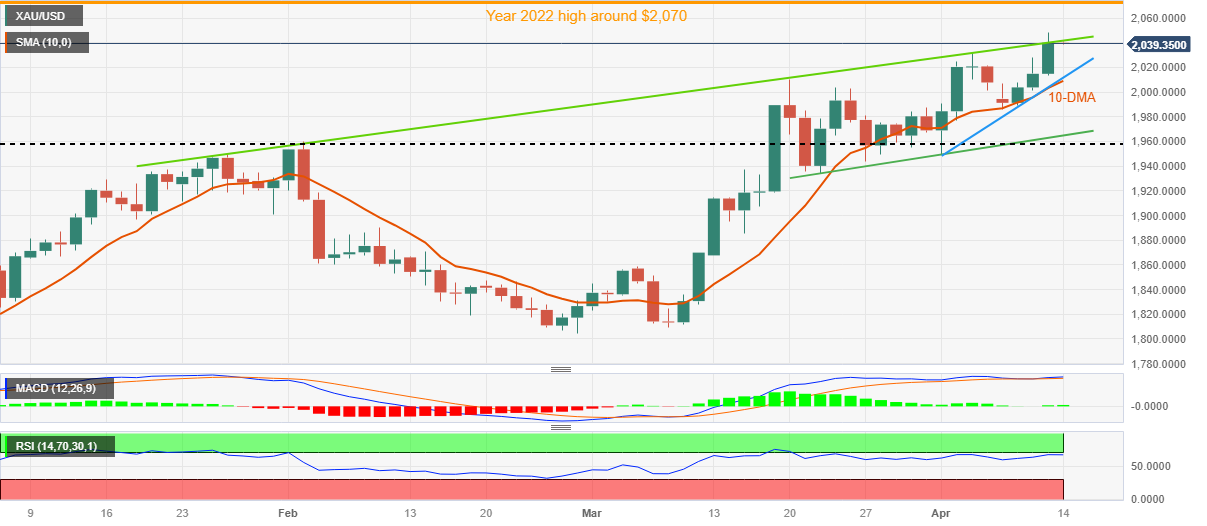
Trend: Further upside expected
-
01:16
USD/JPY bears eye a break of trendline support for a significant downside move
- USD/JPY bears are in the market and eye a downside continuation.
- The trendline support is vulnerable at this juncture.
USD/JPY is flat on the session so far as Tokyo traders come in on Friday with the price submerged below a key resistance area near 132.70 on the 4-hour charts. The US Dollar is under pressure due to data this week that has led markets to believe that the Federal Reserve will indeed pause in its tightening policy campaign after one last rate hike in May.
The main focus was on the Consumer Price Index (CPI) inflation data on Wednesday came in at 5% year-on-year in March, down from 6% in February. Then, on Thursday the easing inflationary pressures continue in data with the Producer Price Index (PPI) for final demand dropping 0.5% last month. In the 12 months through March, the PPI increased 2.7% which was the smallest year-on-year rise since January 2021 and followed a 4.9% advance in February.
to top it all off, the number of Americans filing new claims for unemployment benefits increased more than expected last week. Consequently, Fed funds futures traders are now pricing for the Fed's benchmark rate to peak at 5.002% in June, from 4.830% now, before falling back to 4.278% in December.
Meanwhile, as for the position, which will be updated later on Friday, JPY net short positions increased in the prior weeks, having fallen from the previous week to the last. Analysts at Rabobank anticipate that they remain well above the levels held earlier in the year ´´as speculators have lost faith in the view that the BoJ may soon announce a less accommodative monetary policy.´´
USD/JPY technical analysis
USD/JPY Price Analysis: Bulls depend on a lifeline at daily trendline support
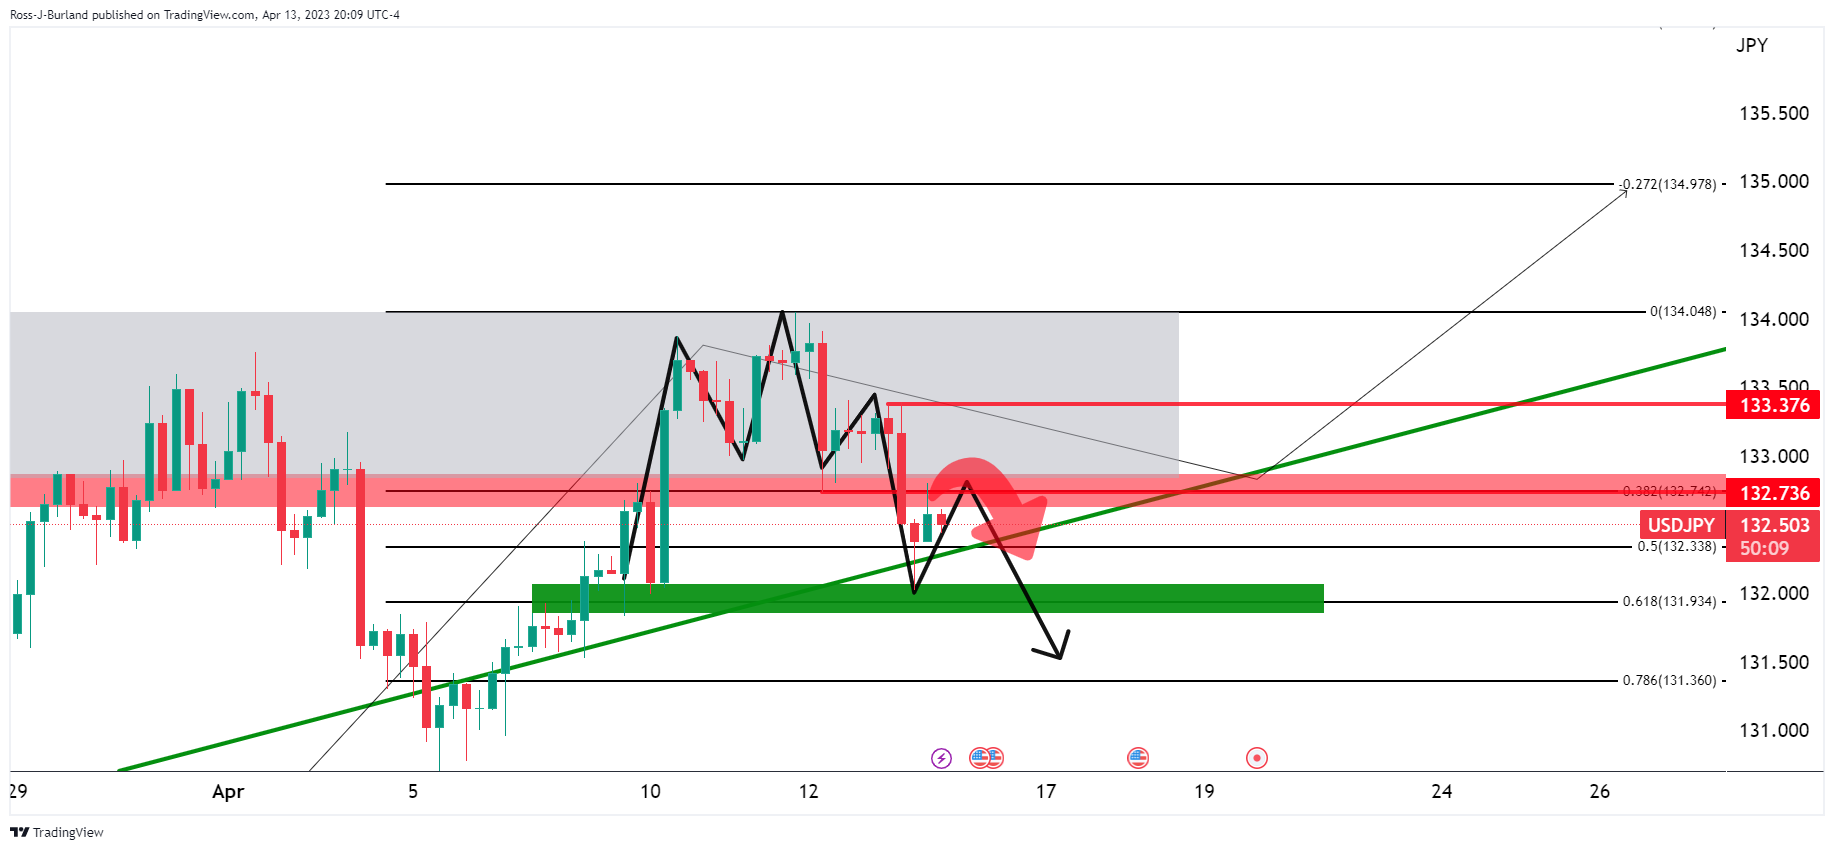
The bulls now need to get above the right shoulder of the head and shoulders on the 4-hour chart or face a blow-off to the downside and a break of the trendline support as per the head and shoulders on the 4-hour chart.
-
01:15
Currencies. Daily history for Thursday, April 13, 2023
Pare Closed Change, % AUDUSD 0.67828 1.34 EURJPY 146.432 0.01 EURUSD 1.1046 0.49 GBPJPY 166.033 -0.15 GBPUSD 1.25245 0.33 NZDUSD 0.62966 1.36 USDCAD 1.33399 -0.75 USDCHF 0.88941 -0.73 USDJPY 132.567 -0.48 -
01:03
Singapore Gross Domestic Product (QoQ) below expectations (-0.2%) in 1Q: Actual (-0.7%)
-
01:01
WTI Price Analysis: Crude Oil pullback remains elusive beyond $81.60
- WTI remains pressured after reversing from five-month high the previous day.
- Convergence of previous resistance line from December 2022, 200-EMA restricts immediate declines.
- 61.8% Fibonacci retracement, 100-EMA act as additional downside filter.
- Bulls need daily closing beyond $84.80 to restore confidence.
WTI crude oil defends the previous day’s U-turn from the multi-day high during early Friday, pressured around $82.20 by the press time. In doing so, the black gold price justifies the overbought RSI conditions.
With this, the energy benchmark prods the 61.8% Fibonacci retracement level of its fall from the last November to March, near $82.00.
However, the bullish MACD signals, as well as a convergence of the resistance-turned-support line from December 2022 and the 200-day Exponential Moving Average (EMA), around $81.60, appears a tough nut to crack for the WTI crude oil sellers.
Even if the quote drops below $81.60, the 50% Fibonacci retracement level and the 100-EMA, respectively near $78.50 and $78.30, could challenge the Oil bears afterward.
Meanwhile, WTI recovery remains elusive until the quote offers a daily closing beyond December’s high of $83.30. Even so, multiple hurdles marked during the late 2022 around $84.70-80 can challenge the Oil buyers afterward.
In a case where the black gold remains firmer past $84.80, the odds of witnessing the $90.00 back to the chart can’t be ruled out.
Overall, WTI crude oil is expected to witness further pullback but the bearish trend is not in the sight.
WTI: Daily chart
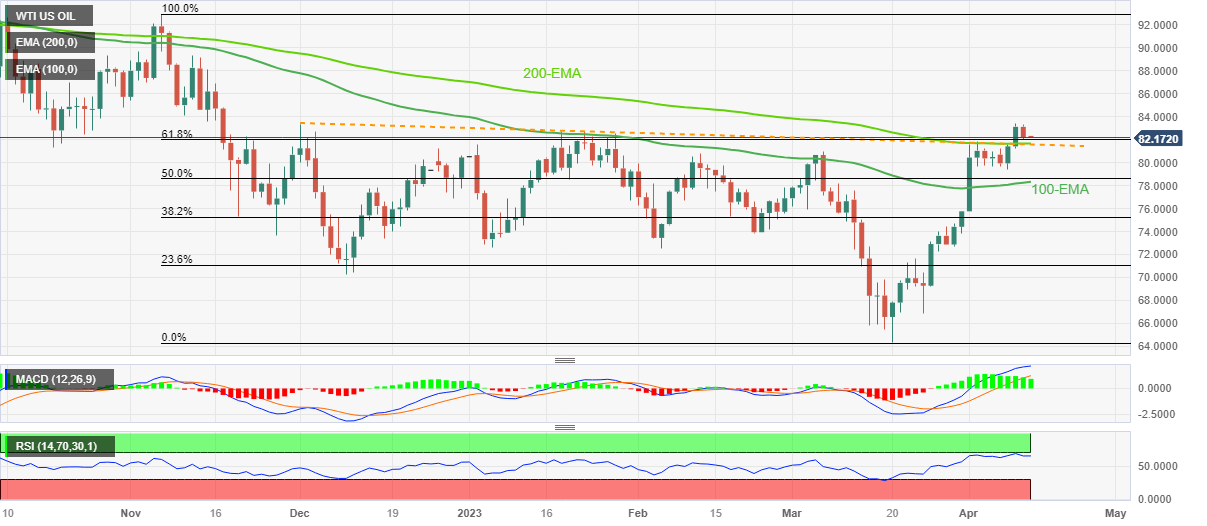
Trend: Limited downside expected
-
01:01
Singapore Gross Domestic Product (YoY) came in at 0.1%, below expectations (0.6%) in 1Q
-
00:55
USD/CHF delivers a pullback to near 0.8900, downside looks likely ahead of US Retail Sales
- USD/CHF has delivered a less-confident pullback move above 0.8890, however, the downside looks solid.
- The USD Index was heavily dumped after the release of the lower-than-anticipated US PPI report.
- Monthly Retail Sales data would contract by 0.4%, at a similar pace to the prior contraction.
The USD/CHF pair has attempted a recovery in the early Asian session after refreshing a two-year low at 0.8860. A pullback move in the Swiss Franc asset to near 0.8892 is expected to remain short-lived amid the absence of any fundamental change in the condition of the US Dollar Index (DXY).
The USD Index was heavily dumped by investors on Thursday after the lower-than-anticipated United States Producer Price Index (PPI) confirmed that the Federal Reserve (Fed) will dial back rate hikes sooner. Fed chair Jerome Powell has been rigorously hiking rates since last year to bring down the stubborn inflation to desired levels. US inflation is confidently softening led by lower gasoline prices, higher rates, and now tight credit conditions. Therefore, investors are anticipating a pause in the rite-hiking spell to safeguard the economy from a severe slowdown.
Meanwhile, S&P500 futures are showing mild losses in the early Asian session after a ramp-up move on Thursday, indicating that the overall market mood is quite upbeat. Lower gasoline prices have resulted in decelerating US Producer Price Index (PPI) report. This has resulted in a decline in input costs for firms and its benefit will be observed in quarterly results, which forced investors to gung-ho for US equities.
Going forward, US Retail Sales data (March) will be of utmost importance. Monthly Retail Sales data would contract by 0.4%, at a similar pace to the prior contraction. This might bolster the need to pause rates by Fed chair Jerome Powell.
On the Swiss Franc front, investors are awaiting Swiss Producer and Import Prices (PIP) (March) figures. The economic data is expected to remain steady at -0.2% and 2.7% on a monthly and an annual basis.
-
00:48
US Dollar Index: DXY bears prod 2023 bottom as US inflation clues prompt Fed policy pivot talks
- US Dollar Index remains pressured at the 2.5-month low, also near the lowest levels in 2023.
- Softer US inflation data, higher Initial Jobless Claims bolster calls for Fed policy pivot and weigh on DXY.
- US Retail Sales, Michigan CSI and Consumer Inflation Expectations eyed for fresh impulse.
US Dollar Index (DXY) remains pressured around 101.00 during early Friday’s sluggish trading, after falling to the lowest levels in 10 weeks the previous day amid a three-day downtrend. In doing so, the greenback’s gauge versus the six major currencies highlights the market’s positioning for the Federal Reserve (Fed) policy pivot after witnessing multiple downbeat clues of the US inflation.
Having witnessed disappointment from the headline US Consumer Price Index (CPI), the US Producer Price Index (PPI) for March dropped to a four-month low of -0.5% MoM versus 0.0% expected and prior. Further, the PPI YoY also declined to 2.7% from 4.9% previous readouts, versus market forecasts of 3.0%. Additionally weighing on the hawkish Fed bets and the US Dollar is the US Initial Jobless Claims figure as it rose to 239K versus 232K expected and 228K prior.
It’s worth noting that the Minutes of the latest Federal Open Market Committee (FOMC) Monetary Policy Meeting signaled that the expectations for rate hikes were scaled back due to the turmoil in the banking sector. With this, the Minutes offered no fresh information and raised doubts about the hawkish Fed moves, apart from May’s 0.25% rate hike. That said, the CME’s FedWatch Tool signals a 68% chance of a 0.25% rate hike in March versus 71% marked the previous day.
On a different page, multiple statements from the International Monetary Fund (IMF) and the World Bank (WB) spring gathering of the global central bank officials suggest that the recession woes are more likely in the West, which in turn weighs on the US Dollar amid softer inflation data. Furthermore, hopes of economic recovery in Asia and the moves to destabilize the US Dollar’s reserve currency status by Russia, China and Brazil also weigh on the US Dollar Index.
Against this backdrop, S&P 500 Futures print mild losses by the press time, despite the firmer closing of Wall Street. Further, the US 10-year and two-year Treasury bond yields fade the previous day’s recovery and exert downside pressure on the DXY.
Moving on, US Dollar Index may remain pressured even if the scheduled consumer-centric data provide a positive surprise, unless the data is too strong. That said, US Retail Sales for March, expected to repeat -0.4% MoM figure, precedes the preliminary readings of the US Michigan Consumer Sentiment Index (CSI), likely staying unchanged at 62. Also important to watch will be the University of Michigan’s (UoM) 5-year Consumer Inflation Expectations, prior 2.9%.
Technical analysis
Tuesday’s clear U-turn from the 21-day Exponential Moving Average (EMA), around 102.35 by the press time, allows the US Dollar Index to break the yearly low of 100.80.
-
00:22
USD/CAD hovers below 1.3350 after a nosedive move inspired by weak US Inflation outlook
- USD/CAD is oscillating near 1.3340 after an intense sell-off inspired by lower US consumer inflation expectations.
- The USD Index printed a fresh 11-month low at 100.42 as significantly decelerated US PPI joined already softened US CPI.
- US labor market conditions eased further as weekly Initial Jobless Claims jumped to 239K from the estimates of 232K.
The USD/CAD pair has turned quiet around 1.3340 after a nosedive move on Thursday as the aggressively softened United States Producer Price Index (PPI) confirmed that US consumer inflation expectations are set for a sheer decline. The Loonie asset has registered a four-day losing streak and the absence of signs of recovery is supporting more downside ahead.
S&P500 futures were heavily bought by the market participants as fears of further rate hikes beyond May receded as inflation has decelerated, indicating a cheerful market mood. However, Morgan Stanley US chief equity strategist Mike Wilson has a contrary view on S&P500. He expects the base-case scenario for the S&P500 to end the year is 3,900. The analyst at Morgan Stanley supported his view citing that, the earnings situation is way worse than what the consensus thinks and the banking stress only makes us even more confident of that.
The US Dollar Index (DXY) printed a fresh 11-month low at 100.42 as significantly decelerated US PPI joined the already softened US Consumer Price Index (CPI) and trimmed fears of persistent inflation. Annual headline US PPI decelerated to 2.7% vs. the estimate of 3.0%. And core PPI remained in line with expectations at 3.4%. The reason behind the severe decline in US PPI is the lower gasoline prices recorded in March. Producers passed on the benefit of lower input costs to ultimate consumers by reducing the prices of goods and services at factory gates.
Apart from that, US labor market conditions eased further as weekly Initial Jobless Claims jumped to 239K from the estimates of 232K and the former release of 228K. This has also receded fears of stubborn US inflation.
On the oil front, oil prices dropped below $83.00 after OPEC kept a stable oil demand outlook. The oil cartel left the global oil demand growth forecast for 2023 unchanged at 2.32 million barrels per day, as reported by Reuters.
It is worth noting that Canada is the leading exporter of oil to the United States and lower oil prices would impact the Canadian Dollar.
-
00:16
NZD/USD steadies near 0.6300 amid softer New Zealand PMI, recession woes
- NZD/USD stabilizes around one-week high after posting the biggest daily jump in a month.
- New Zealand’s Business NZ PMI drops to three-month low of 48.1 in March, NZ FinMin Robertson cites recession fears.
- Additional proof of easing in US inflation pressure propels Fed policy pivot talks and drowns Dollar.
- US Retail Sales, Michigan CSI and Consumer Inflation Expectations eyed for further directions.
NZD/USD justifies downbeat New Zealand (NZ) activity numbers by stabilizing around 0.6300, after rising the most in one month to renew the weekly top. Even so, the Kiwi pair remains on the bull’s radar amid broad US Dollar weakness ahead of the final dossier of the US data.
That said, Business NZ PMI for March dropped to the lowest levels in three months, not to forget mentioning a fall below the 50.0 level, as it printed a 48.1 mark for March versus 51.0 expected and 52.0 prior. Further, the Visitor Arrivals also eased to 4.998% from 6.480% prior but came in better than 2.1% market forecasts.
Also challenging the Kiwi pair buyers are the latest comments from New Zealand Finance Minister (FinMin) Grant Robertson as he said that New Zealand might have a recession, but it will be a shallow one. The diplomat, however, also stated that New Zealand economy is resilient and robust, which in turn puts a floor under the NZD/USD price.
It’s worth noting, however, that the downbeat signals of the US inflation bolstered calls for the Federal Reserve (Fed) policy pivot and weighed on the US Dollar. That said, US Producer Price Index (PPI) for March dropped to a four-month low of -0.5% MoM versus 0.0% expected and prior whereas the PPI YoY also declined to 2.7% from 4.9% previous readouts, versus market forecasts of 3.0%. Further, US Initial Jobless Claims rose to 239K versus 232K expected and 228K prior.
While cheering the broad US Dollar weakness, the NZD/USD pair also ignores mixed China trade numbers as the Trade Balance improved to $88.10B in March versus the $39.2B expected and $116.8B prior whereas Exports grew much faster than Imports during the stated month.
Apart from the softer US data, recent comments from the global rating agency Fitch also favors NZD/USD bulls as it said that solid fundamentals are supporting Australian and New Zealand banks in a more difficult environment.
Amid these plays, Wall Street remained firmer and the yields also improved but the US Dollar Index (DXY) dropped to the lowest levels since February. Additionally, the CME’s FedWatch Tool signals a 68% chance of a 0.25% rate hike in March versus 71% marked the previous day.
Looking forward, US Retail Sales for March, expected to repeat -0.4% MoM figure, precedes the preliminary readings of the US Michigan Consumer Sentiment Index (CSI), likely staying unchanged at 62, to entertain NZD/USD traders. Also important to watch will be the University of Michigan’s (UoM) 5-year Consumer Inflation Expectations, prior 2.9%.
Technical analysis
Multiple failures to provide a daily closing beyond the 100-DMA, around 0.6305 by the press time, challenges NZD/USD bull’s optimism. The pullback moves, however, remain elusive unless the quote remains beyond the 200-DMA support of 0.6165.
-
00:01
AUD/JPY Price Analysis: Double top emerges, around 90.00, after a 2% rally
- If AUD/JPY fails to crack 90.00, that will pave the way for a double-top confirmation.
- For a bullish continuation for the AUD/JPY, a break above 90.00 would expose the 200-day EMA at 90.86.
The Australian Dollar (AUD) posted gains vs. the Japanese Yen (JPY) on a risk-on impulse, spurred by softer US economic data revealed during Thursday’s North American session. Therefore, high beta currencies like the AUD were bolstered by speculations that the US Federal Reserve (Fed) will hike rates again, followed by a pause—that increased investors’ appetite for riskier assets. As the Asian session begins, the AUD/JPY exchanges hand at 89.94.
AUD/JPY Price Action
The AUD/JPY recent rally from April 6 swing low at 87.50 was capped by April’s 4 daily high at 90.17. Although the cross-currency pair challenged the latter, the AUD/JPY dipped below 90.00. That depicts the formation of a “double top” chart pattern, which could exacerbate a fall toward the 2023 lows at 86.06.
Oscillator-wise, the Relative Strength Index (RSI) is in bullish territory, though shifted flat. At the same time, the Rate of Change (RoC) portrays that buying pressure in the latest rally was made on lower volatility. That said, the AUD/JPY could be set to a downward correction in the near term.
If AUD/JPY drops below the 50-day Exponential Moving Average (EMA) at 89.61, sellers would be in charge, but they will need to crack support at the 20-day EMA around 88.96. The next floor in the near term would be the 88.00 figure, followed by a test of the April 6 low at 87.59.
For a bullish continuation, the AUD/JPY might reclaim 90.00. A breach of the latter will expose the 90.17 weekly high, followed by a test of the 100-day EMA.
AUD/JPY Daily Chart
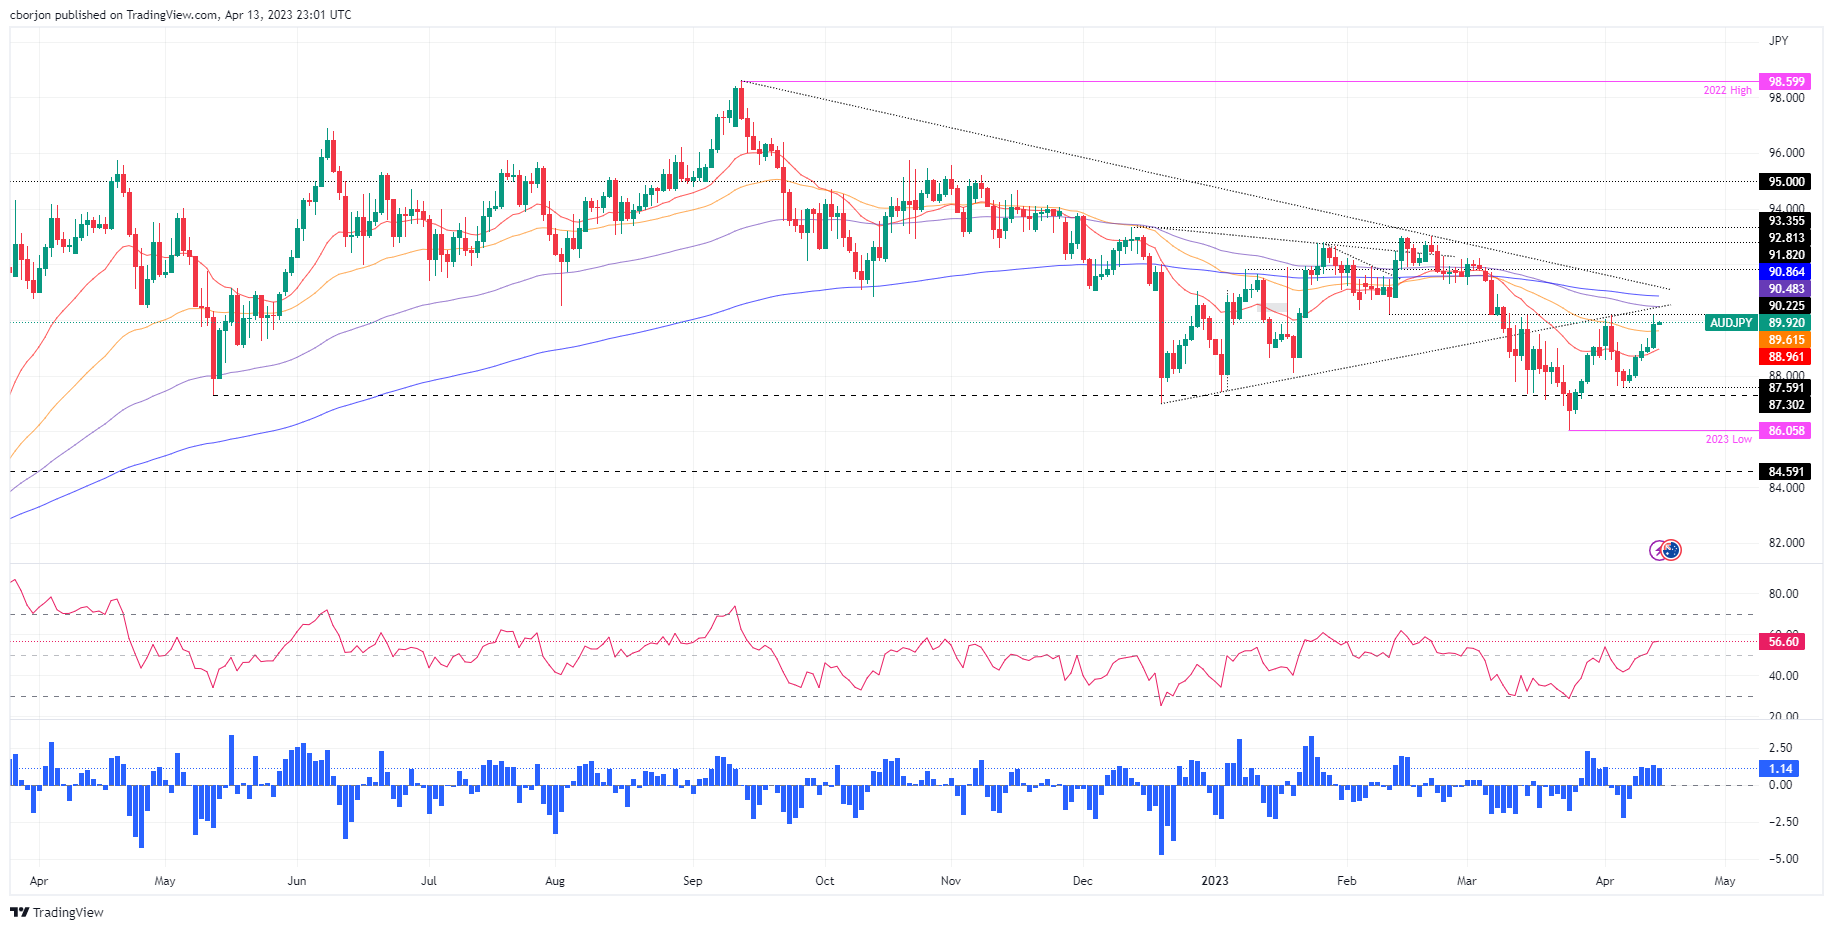
AUD/JPY Technical Levels
-