Notícias do Mercado
-
23:59
US Dollar Index licks its wounds at six-month low near 104.00 ahead of Fed’s verdict
- US Dollar Index struggles to defend the bounce off the lowest levels since June, marked the previous day.
- DXY dropped the most in two weeks to refresh multi-day low on downbeat US inflation data.
- Hawkish Fed bets retreat as US CPI slows down the most in over a year.
- Fed’s 50 bps rate hike is almost given, signals for futures moves will be crucial to watch.
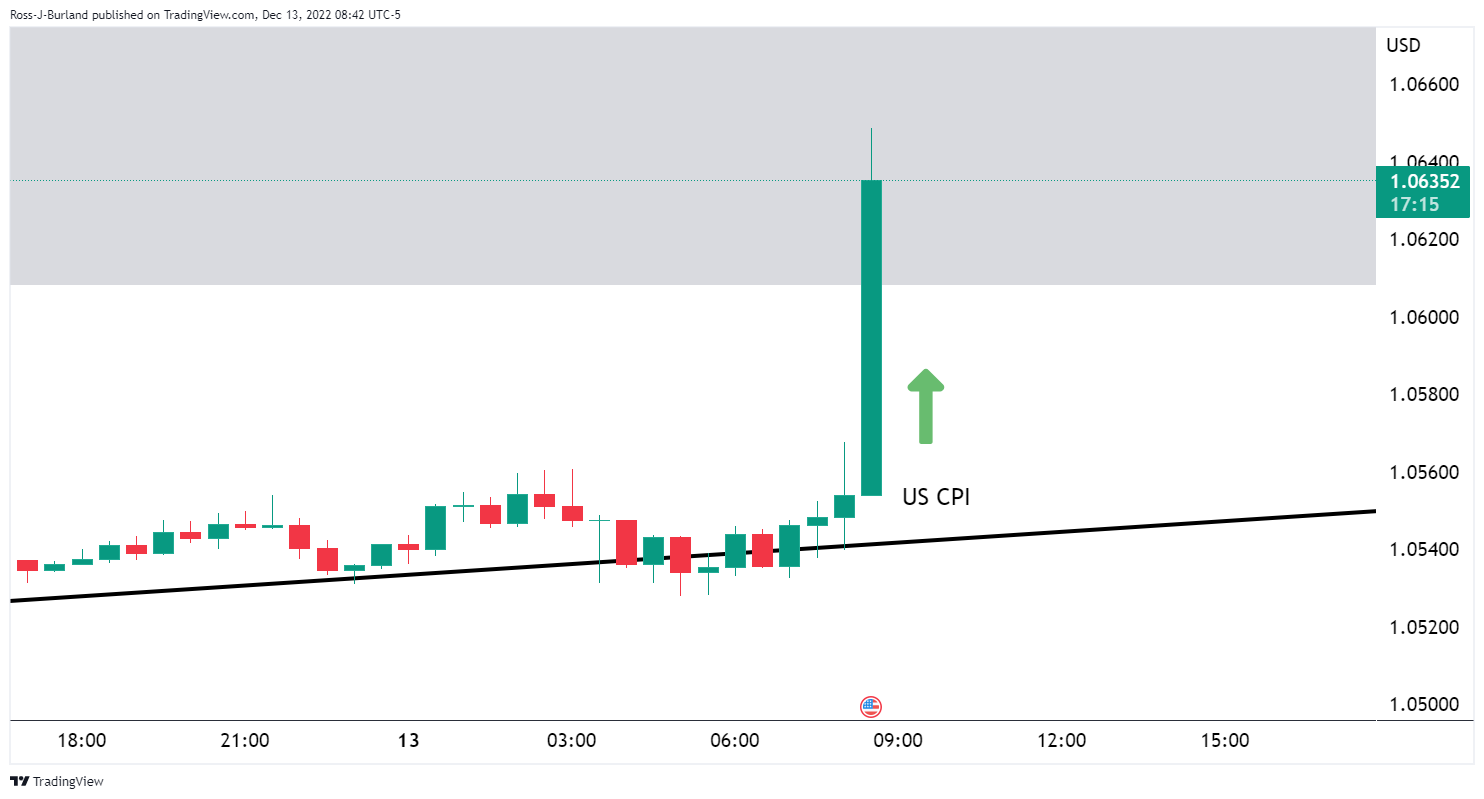
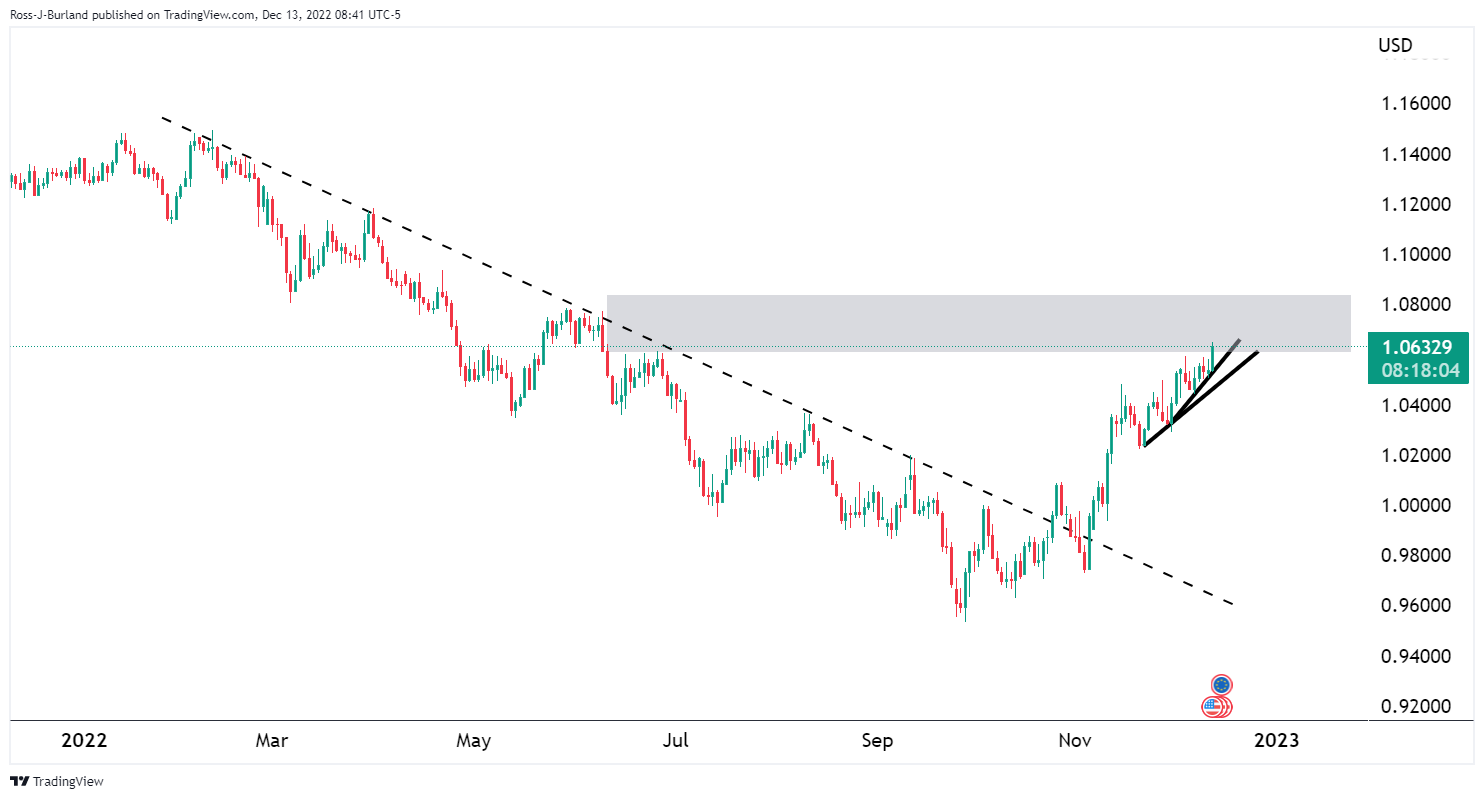
US Dollar Index (DXY) flirts with 104.00 during early Wednesday, after falling to the lowest levels in six months the previous day. In doing so, the greenback’s gauge versus the six major currencies portray the cautious mood ahead of today’s Federal Open Market Committee (FOMC) monetary policy meeting.
The DXY reported the biggest daily slump in two weeks while refreshing the multi-day low on Tuesday after the US inflation data raised hopes that Fed will ‘pivot’ sooner during early 2023.
That said, US Consumer Price Index (CPI) dropped to 7.1% YoY in November versus the 7.3% expected and 7.7% prior. Further, the CPI ex Food & Energy, known as the Core CPI, also declined to 6.0% YoY during the stated month compared to 6.1% market forecasts and 6.3% previous readings. “Traders of futures tied to the Federal Reserve’s policy rate boosted bets Tuesday that the U.S. central bank will notch down its interest-rate hike pace further early next year, after a government report showed inflation eased sharply in November,” said Reuters.
Additionally, helping the DXY to remain stable could be the headlines surrounding China that challenges the previous optimism for the dragon nation. the International Monetary Fund (IMF) Managing Director Kristalina Georgieva was spotted expecting slower economic growth for China due to the latest jump in the daily Covid cases. Additionally, Bloomberg came out with the news suggesting that the Chinese leaders delayed the economic policy meeting due to the COVID-19 problems.
Amid these plays, Wall Street closed positive but the S&P 500 Futures struggle for clear directions. Further, the US Treasury bond yields also remain sidelined after declining the most in a week to snap three-day uptrend.
Given the pre-Fed caution, the DXY may witness further sidelined performance as the latest US CPI challenges the policy hawks. Also, the already-given 50 bps rate hike and lesser odds of witnessing any surprises from the FOMC adds to the market’s action. However, a surprise from the Fed, either in the form of rate hike directions or economic projections, won’t be taken lightly.
Technical analysis
Unless providing a daily closing beyond a three-week-old descending resistance line, around 104.90 by the press time, DXY remains pressured towards May 2022 low of 105.30.
-
23:52
Japan Tankan Large Manufacturing Outlook meets forecasts (6) in 4Q
-
23:51
Japan Tankan Non - Manufacturing Outlook registered at 11, below expectations (16) in 4Q
-
23:51
Japan Machinery Orders (YoY) below forecasts (2.6%) in October: Actual (0.4%)
-
23:51
Japan Machinery Orders (MoM) above forecasts (2.6%) in October: Actual (5.4%)
-
23:50
Japan Tankan Non - Manufacturing Index above expectations (17) in 4Q: Actual (19)
-
23:50
Japan Tankan Large All Industry Capex registered at 19.2% above expectations (18.4%) in 4Q
-
23:50
Japan Tankan Large Manufacturing Index came in at 7, above expectations (6) in 4Q
-
23:49
FOMC Preview: Median dot to rise 50bp to a new peak of 5-5.25% – Goldman Sachs
Despite witnessing a sharp retreat in the hawkish Fed bets, Goldman Sachs (GS) defends its forecast of a median peak rate 5.00 to 5.25%.
The US bank initially stated, “Aside from a widely expected 50bp rate hike, the main event at the December FOMC meeting is likely to be an increase in the projected peak for the funds rate in 2023,” before adding that they expect the median dot to rise 50bp to a new peak of 5-5.25%, in line with their own forecast for Fed policy next year.
GS also stated that aside from the increase in the terminal rate, we do not expect major changes at the December meeting.
Key quotes
At some point the FOMC statement will likely be revised to say that ‘further’ rather than ‘ongoing’ rate hikes are appropriate, but not yet.
The economic projections are likely to show a bit less growth next year, but a broadly similar outlook.
And the dot plot is likely to show slightly larger cuts beyond 2023 from the new higher peak.
Also read: Federal Reserve Preview: How Powell may drain the Dollar of any dot-related gains
-
23:45
GBP/JPY eyes downside to near 167.00 as further BOE rate hike to bolster recession
- GBP/JPY is expected to decline further to near 167.00 on weak UK Employment data.
- Upbeat UK Average Earnings data to propel inflationary pressures ahead.
- Further BOE’s policy tightening will make the recession situation more vulnerable.
The GBP/JPY pair is struggling to hold itself above the cushion of 167.50 in the early Asian session. The cross witnessed a sharp sell-off on Tuesday as investors are hoping that the recession situation in the United Kingdom would get worsen if the Bank of England (BOE) escalate interest rates further. Meanwhile, the GBP/USD pair is displaying more pain amid a recovery in the US Dollar Index.
On Tuesday, the UK Office for National Statistics reported a significant jump in Claimant Count Change data. The initial jobless claims for November surprisingly reported a significant jump by 30.5K while the market participants were expecting a decline of 13.3K. Apart from that, Average Earnings soared to 6.1%, which has bolstered inflation expectations as higher households' earnings will result in robust retail demand.
The UK economy is already facing a recession situation and it is expected to get vulnerable further as the Bank of England (BOE) is set to hike its interest rates amid an absence of evidence that could convey a slowdown in inflationary pressures ahead.
On the Tokyo front, investors are expecting more stimulus packages from the Japanese administration in order to spurt the extent of economic activities. The Bank of Japan (BOJ) is already favoring the policy easing approach to accelerate inflation and is expected to continue further till inflation reaches to 2% target confidently.
GBP/JPY technical outlook
-638065719174622744.png)
On an hourly scale, the GBP/JPY pair has delivered a breakdown of the upward-sloping trendline plotted from December 2 low at 164.05. A bear cross, represented by the 20-and 50-period Exponential Moving Averages (EMAs) at 168.06, indicates more weakness ahead. The 200-EMA around 167.27 is still working as a support to the Pound Sterling.
Meanwhile, the Relative Strength Index (RSI) (14) has shifted into the bearish range of 20.00-40.00, which signifies that the downside momentum is active.
-
23:36
WTI stays defensive above $75.00 on mixed OPEC oil demand forecasts, API inventory build
- WTI crude oil fades bullish bias at one-week high, stays pressured at intraday low of late.
- OPEC defends yearly Oil demand forecasts but cuts quarterly projections for Q4 2022 and Q1 2023.
- API reports higher inventory build for the week ended on December 09.
- EIA inventories, FOMC announcements will be crucial as US inflation favors dovish Fed bets.
WTI crude oil traders struggle for clear directions around $75.30 during Wednesday’s Asian session. In doing so, the black gold differs from a three-day uptrend from the yearly low amid the market’s cautious mood ahead of today’s Federal Open Market Committee (FOMC).
Adding strength to the WTI inaction could be the mixed oil demand forecasts from the Organization of the Petroleum Exporting Countries (OPEC), as well as headlines surrounding China.
“Oil demand in 2023 will rise by 2.25 million barrels per day (bpd), or about 2.3%, the OPEC said in a monthly report, after growth of 2.55 million bpd in 2022. Both forecasts were unchanged from last month,” reported Reuters. The news also added, “While keeping the annual demand growth forecasts steady, OPEC trimmed the absolute demand forecasts in the fourth quarter of 2022 and the first quarter of 2023. Chinese demand, hit by COVID containment measures, has contracted in 2022,” OPEC said per Reuters.
On a different page, the International Monetary Fund (IMF) Managing Director Kristalina Georgieva was spotted expecting slower economic growth for China due to the latest jump in the daily Covid cases. Additionally, Bloomberg came out with the news suggesting that the Chinese leaders delayed the economic policy meeting due to the COVID-19 problems.
Oil bulls could have cheered the downbeat US inflation data but a surprise increase in the American Petroleum Institute’s (API) weekly inventory for the week ended on December 09, to 7.819M versus -6.289M prior, challenge the black gold buyers.
Above all, doubts over the market’s fears of fewer rate hikes and cautious mood ahead of the Fed’s verdict challenge the WTI traders.
Moving on, the risk surrounding China and pre-Fed moves could restrict WTI moves. Also likely to limit the Oil moves could be weekly official inventory data from the US Energy Information Administration (EIA), prior -5.187M.
Technical analysis
The 10-DMA precedes a five-week-old descending trend line to restrict short-term WTI crude oil upside near $75.40 and $78.80 in that order. The pullback moves, however, remain elusive unless refreshing the yearly low of $70.30.
-
23:13
NZD/USD Price Analysis: Bulls need clear break of 0.6480 to keep the driver’s seat
- NZD/USD struggles for clear directions at six-month high.
- Overbought RSI conditions, four-month-old horizontal resistance challenge bulls.
- Monthly support line, sustained trading beyond 200-DMA restrict bear’s entry.
NZD/USD remains sidelined around 0.6460 during Wednesday’s Asian session, after retreating from a six-month high before a few hours.
The quote rallied to the highest levels since June the previous day, and also posted the biggest daily gains in a fortnight, but failed to offer a daily closing beyond the key 0.6480 hurdle comprising tops marked in August, as well as during early December.
The pullback move also took clues from the overbought RSI conditions, suggesting further profit-booking on the road.
Though, an upward-sloping support line from early November, close to 0.6415 by the press time, puts a floor under the NZD/USD prices.
In a case where the Kiwi pair drops below 0.6415 support, a slump towards the November 29 peak of 0.6290 and then to the 200-DMA support of 0.6213 can’t be ruled out. However, a two-month-old ascending support line near 0.6190 could defend the bulls afterward.
On the flip side, a successful break of 0.6480 could propel the NZD/USD prices toward the tops marked in May and June, around 0.6568-75. Following that, a run-up towards March’s low near 0.6730 becomes more likely.
Overall, NZD/USD bulls stay in the driver’s seat but the pair’s further upside hinges on the 0.6480 breakout.
NZD/USD: Daily chart
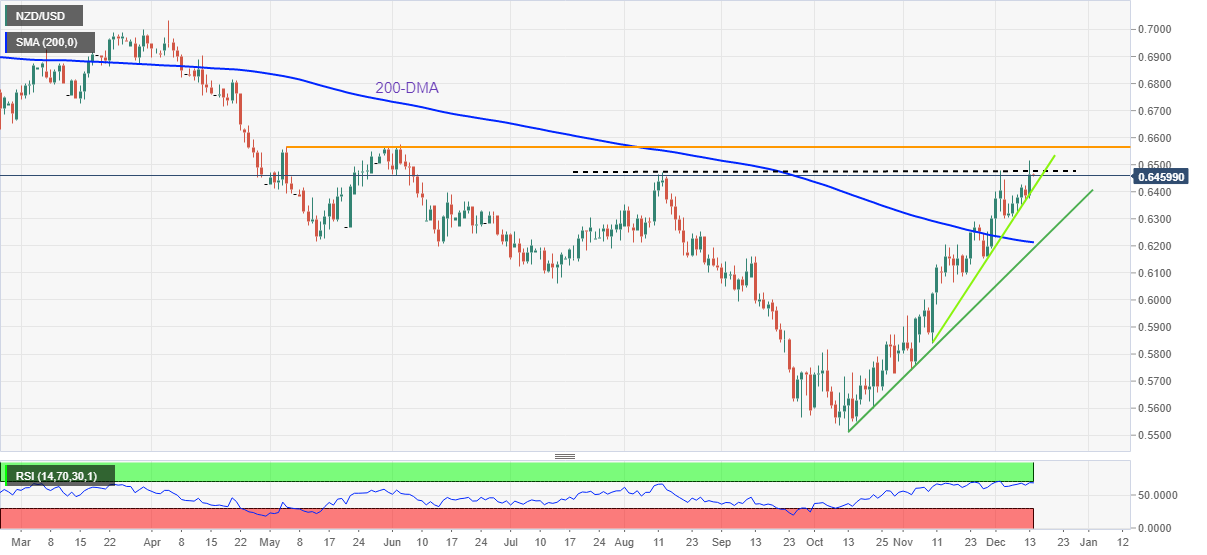
Trend: Pullback expected
-
23:11
AUD/JPY Price Analysis: Doji around 92.80-93.30s suggests consolidation ahead
- Tuesday’s price action of the AUD/JPY formed a classic doji, meaning traders are undecided about the current trend.
- AUD/JPY: Break above 93.00 would exacerbate a rally: otherwise, a fall toward the 200-DMA is on the cards.
The Australian Dollar (AUD) reached a fresh 2-week high around 93.35 on Tuesday, though it retraced some of those gains and registered a daily close slightly above the 20-day Exponential Moving Average (EMA), sitting around 92.86. However, as the Asian Pacific session begins, the AUD/JPY is trading at 92.90, printing minuscule losses of 0.03%.
AUD/JPY Price Analysis: Technical outlook
From the daily chart, the AUD/JPY remains neutral though slightly tilted to the downside. Most Exponential Moving Averages (EMAs) concentrated around the 92.87-93.42 area, above the exchange rate, suggesting the AUD/JPY might fall in the near term. Additionally, Tuesday’s full price action forming a classic “doji,” portrays the indecision of buyers and sellers. Investors should be aware that the Relative Strength Index (RSI) is in bearish territory, almost flat, while the Rate of Change (RoC) shows buying pressure begins to build up.
Therefore, upwards, the AUD/JPY first resistance would be the psychological 93.00. Break above will expose the confluence of the 50-day EMA and the December 13 daily high at around 93.35, followed by the 94.00 figure, ahead of the October 21 swing high of 95.73.
On the flip side, the AUD/JPY first support would be the 93.00 mark. A breach of the latter will exacerbate a fall toward the 200-day Exponential Moving Average (EMA) at 92.01, followed by the October 13 swing low of 90.83, followed by the August 2 daily low of 90.52.
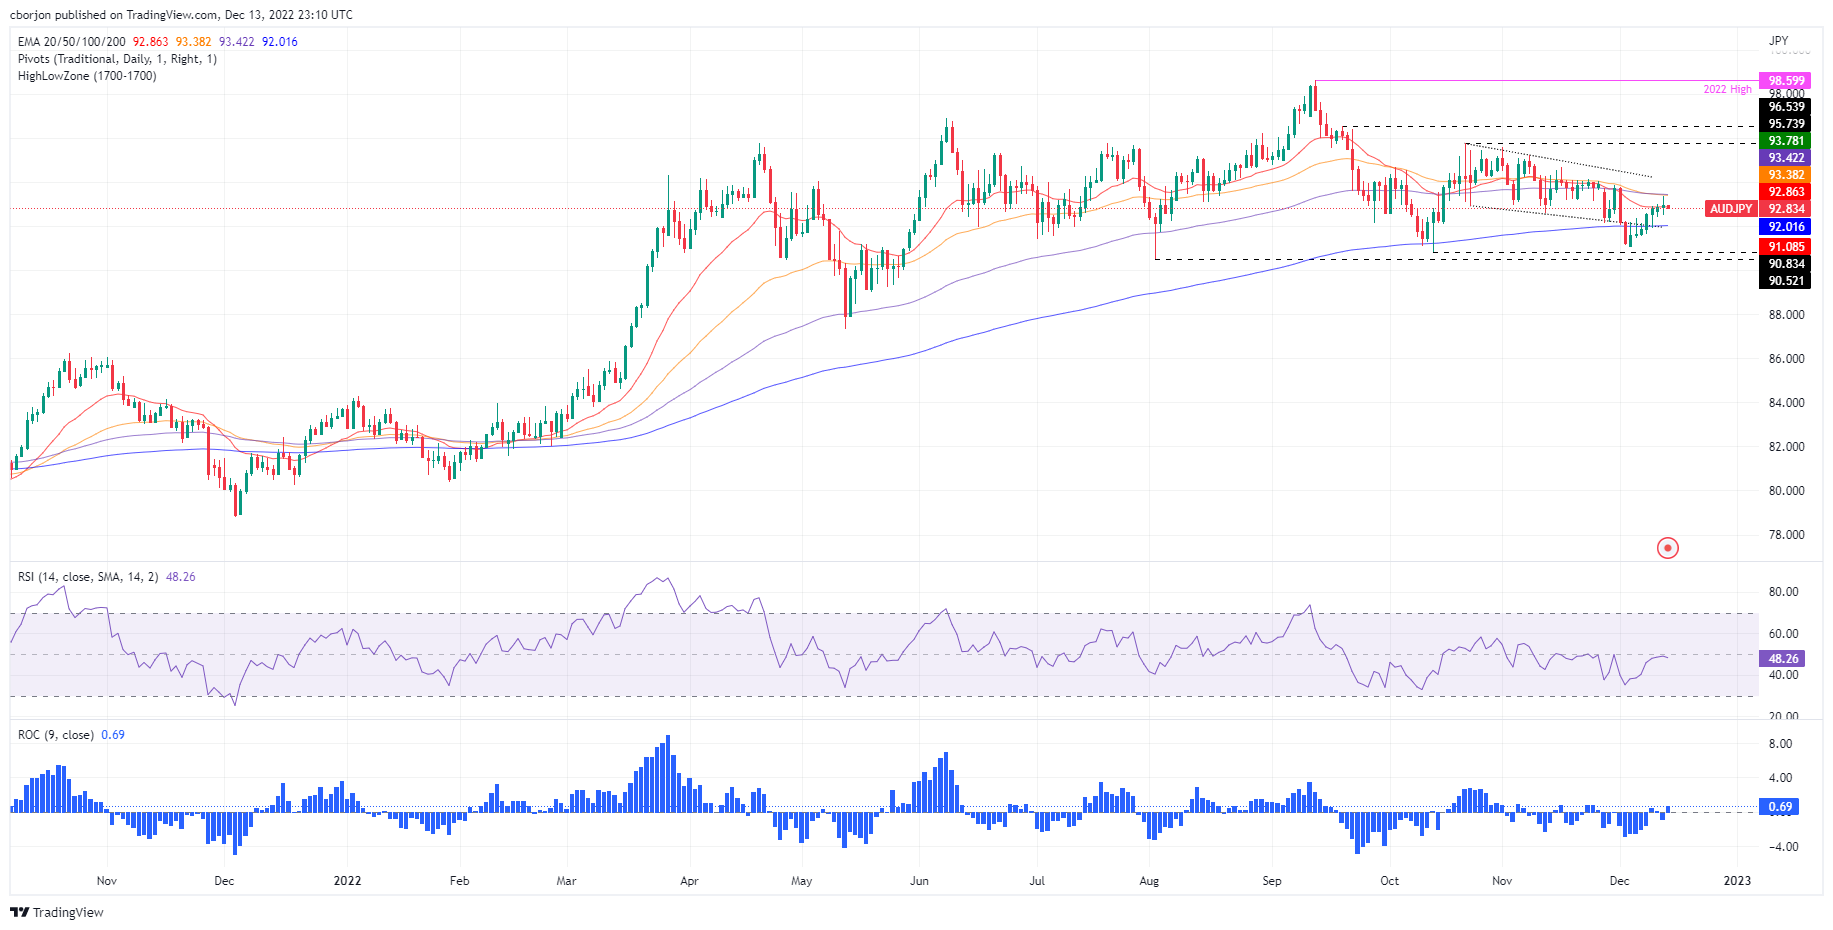
AUD/JPY Key Technical Levels
-
23:09
USD/CHF senses barricades around 0.9300 as less-hawkish Fed bets soar
- USD/CHF has sensed selling pressure while attempting to extend its recovery above 0.9300.
- The US Treasury yields have dropped to 3.50% as the Fed is set to slow down the extreme policy tightening pace.
- The SNB is expected to hike its interest rates by 50 bps to 1%.
The USD/CHF pair has faced hurdles in early Asia while attempting to cross the round-level resistance of 0.9300 after a rebound move from a fresh eight-month low of around 0.9231. The Swiss franc asset witnessed an intense sell-off on Tuesday after the release of a soft United States inflation report for November month.
Risk-perceived assets such as S&P500 extended their recovery dramatically as a significant decline in inflation data would trim weaker economic projections. The 500-stock basket surrendered some of its gains on settlement as investors are awaiting the interest rate decision by the Federal Reserve (Fed) for making informed decisions.
The US Dollar Index (DXY) is struggling to sustain above 104.00 as the Fed is expected to decelerate its interest rate hike pace led by a slowdown in inflation. Investors’ risk appetite has been strengthened as lower inflation has trimmed hopes of a recession in the United States economy. Meanwhile, the 10-year US Treasury yields have dropped to 3.50% as Fed chair Jerome Powell is expected to slow down the extreme policy tightening pace.
Meanwhile, Fed funds futures prices implied a better-than-even chance that the Fed will follow its expected half-point interest-rate hike this week with a smaller 25-basis-point rate hike in February, ultimately raising rates no higher than the 4.5%-4.75% range in its battle to beat inflation, as reported by Reuters.
On the Swiss franc front, Switzerland’s State Secretariat for Economic Affairs (SECO) in its latest economic forecasts said on Tuesday, the government expects the country's economic growth to slow next year but is unlikely to enter a recession. He further added that the energy situation in Europe is likely to remain tense with gas and electricity prices running high.
This week, the entire focus will remain on the monetary policy announcement by the Swiss National Bank (SNB). As per the consensus, SNB Chairman Thomas J. Jordan is expected to hike its interest rates by 50 basis points (bps) to 1%.
-
23:00
South Korea Unemployment Rate registered at 2.9% above expectations (2.8%) in November
-
22:56
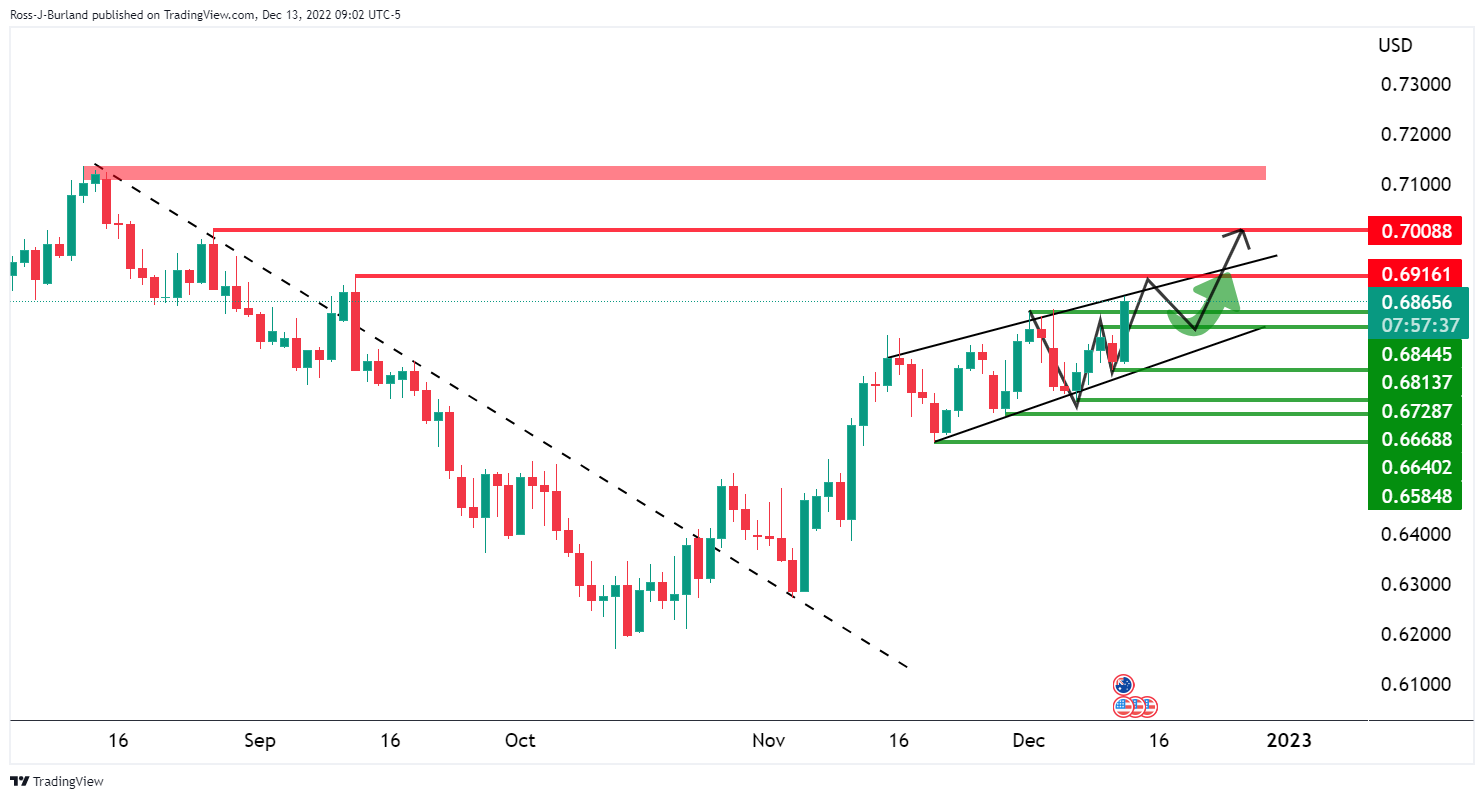
AUD/USD seesaws near 0.6850 as pre-Fed anxiety probes RBA Governor Lowe’s optimism
- AUD/USD fails to cheer positive economic expectations of RBA Governor Philip Lowe near a three-month high.
- RBA’s Lowe appears optimistic on cross-border payments, economic growth due to the same.
- US inflation bolstered case of slower Fed rate hikes and drowned the US Dollar ahead of FOMC.
- China-linked headlines, pre-Fed caution probe Aussie Dollar bulls.
AUD/USD treads water around 0.6855 during early Wednesday, after a volatile day that offered the biggest jump in a fortnight and refreshed a three-month low.
While the downbeat US inflation number propelled the Aussie pair, chatters surrounding China and the cautious mood ahead of the Federal Open Market Committee (FOMC) monetary policy meeting test momentum traders.
It’s worth noting that Reserve Bank of Australia (RBA) Governor Philip Lowe spoke recently at the AusPayNet Annual Summit. "Overall, we are optimistic that least-cost routing will help counter the forces that are adding to merchants' payment costs, particularly for small businesses," Lowe said per Reuters.
That said, US Consumer Price Index (CPI) dropped to 7.1% YoY in November versus the 7.3% expected and 7.7% prior. Further, the CPI ex Food & Energy, known as the Core CPI, also declined to 6.0% YoY during the stated month compared to 6.1% market forecasts and 6.3% previous readings. “Traders of futures tied to the Federal Reserve’s policy rate boosted bets Tuesday that the U.S. central bank will notch down its interest-rate hike pace further early next year, after a government report showed inflation eased sharply in November,” said Reuters. The same drowned the US Dollar Index (DXY) to a six-month low of 103.61 and fuelled the AUD/USD prices before the quote retreated from 0.6893.
Elsewhere, the International Monetary Fund (IMF) Managing Director Kristalina Georgieva was spotted expecting slower economic growth for China due to the latest jump in the daily Covid cases. Additionally, Bloomberg came out with the news suggesting that the Chinese leaders delayed the economic policy meeting due to the COVID-19 problems.
Furthermore, increasing chatters that today’s Fed rate hike worth 50 basis points (bps) rate increase is the last and the US central bank is up for slowing down the rate lift from 2023-start keep the traders on the edge.
Amid these plays, Wall Street closed positive and the US 10-year Treasury yields slumped nearly 11 basis points (bps) to 3.50% by the end of Tuesday’s North American session.
Looking forward, AUD/USD could remain sidelined amid the pre-FOMC cautious mood. However, increasingly dovish expectations raise fears of a wild slump in case of a hawkish surprise from the Fed.
Technical analysis
A daily closing beyond the one-month-old ascending resistance line, near 0.6885 by the press time, becomes necessary for the bulls to keep the reins. However, the bears will wait for a clear break of the 100-DMA support, near 0.6675 at the latest, to take the risk of entry. Hence, AUD/USD may witness further grinding towards the north.
-
22:35
GBP/USD corrects to near 1.2350, upside seems favored on hopes of a smaller Fed rate hike
- GBP/USD is expected to conclude its corrective move to near 1.2350 as the risk-on impulse is rock solid.
- The odds of a 50 bps rate hike by the Fed have bolstered on soft US inflation report.
- UK’s headline CPI could rise surprisingly as the food price inflation has soared amid escalating food supply crisis.
The GBP/USD pair has corrected at a casual pace to near 1.2350 in the early Asian session after registering a fresh six-month high at 1.2444. The Cable is expected to rebound ahead as investors’ risk appetite is extremely solid after the release of soft US inflation data on Tuesday.
S&P500 displayed a juggernaut rally on Tuesday as lower-than-anticipated inflation data trimmed the risk of recession in the United States economy. Gains in the 500-stock basket of the US trimmed near settlement as anxiety among investors still sustain ahead of the interest rate decision by the Federal Reserve (Fed). However, the risk-on impulse is still solid and is expected to keep reins in the risk-sensitive assets.
The US Dollar Index has shown a fragile recovery after registering a fresh five-month low at 103.59. Less-confident recovery in the USD Index could get terminated amid a decline in safe-haven appeal. Soft US inflation data has accelerated hopes of a smaller and slower interest rate hike by the Fed, which has resulted in higher demand for US Treasury bonds. The 10-year US Treasury yields have dropped to 3.50%.
A note from Commerzbank dictates that “The 50 basis points hike, which is generally expected for tomorrow's FOMC meeting, can be considered almost certain after today's data.” We continue to assume that the Fed will reduce the size of the rate hikes again at the beginning of 2023, moving by only 25 bps in February and March.
On the United Kingdom front, investors have shifted their focus toward the inflation data. The annual Consumer Price Index (CPI) is expected to decline to 10.9% from the former release of 11.1% for November. While the core CPI is seen unchanged at 6.5%. UK’s headline CPI could display a surprise rise as the food price inflation has soared amid escalating food supply crisis.
-
22:29
Gold Price Forecast: XAU/USD grinds near $1,820 hurdle with eyes on Fed
- Gold price seesaws around multi-day high after retreating from the key resistance.
- US Dollar plunged after inflation data as softer CPI figures cut hawkish Fed bets.
- Cautious mood ahead of FOMC, concerns surrounding China test XAU/USD bulls.
- US Federal Reserve is set for 50 bps rate hike but the future guidance will be key for Gold traders.
Gold price (XAU/USD) buyers struggle to defend the biggest daily jump in a fortnight as the metal seesaws around $1,810, following a retreat from the highest levels since late-June.
Slower-than-expected growth in the US inflation, actually the slowest in over a year, allowed Gold buyers to return to the desk and refresh multi-day high near $1,825. That said, the market’s anxiety ahead of today’s Federal Open Market Committee (FOMC) and a bit pale headlines from China seemed to have tested the XAU/USD bulls of late.
US Consumer Price Index (CPI) dropped to 7.1% YoY in November versus 7.3% expected and 7.7% prior. Further, the CPI ex Food & Energy, known as the Core CPI, also declined to 6.0% YoY during the stated month compared to 6.1% market forecasts and 6.3% previous readings. “Traders of futures tied to the Federal Reserve’s policy rate boosted bets Tuesday that the U.S. central bank will notch down its interest-rate hike pace further early next year, after a government report showed inflation eased sharply in November,” said Reuters. The same drowned the US Dollar Index (DXY) to a six-month low of 103.61 and propelled the Gold price.
On the other hand, the International Monetary Fund (IMF) Managing Director Kristalina Georgieva was spotted expecting a slower economic growth for China due to the latest jump in the daily Covid cases. Additionally, Bloomberg came out with the news suggesting that the Chinese leaders delayed the economic policy meeting due to the COVID-19 problems.
Above all, cautious mood ahead of today’s Fed, especially after Tuesday’s downbeat US inflation data, keeps the Gold traders on the edge.
Even so, Wall Street closed positive and the US 10-year Treasury yields slumped nearly 11 basis points (bps) to 3.50% by the end of Tuesday’s North American session.
Moving on, Gold traders may witness sidelined moves ahead of FOMC. Given the dovish expectations, with 50 bps rate hike on the card, surprise hawkish signals will be enough to recall the XAU/USD bears.
Gold price technical analysis
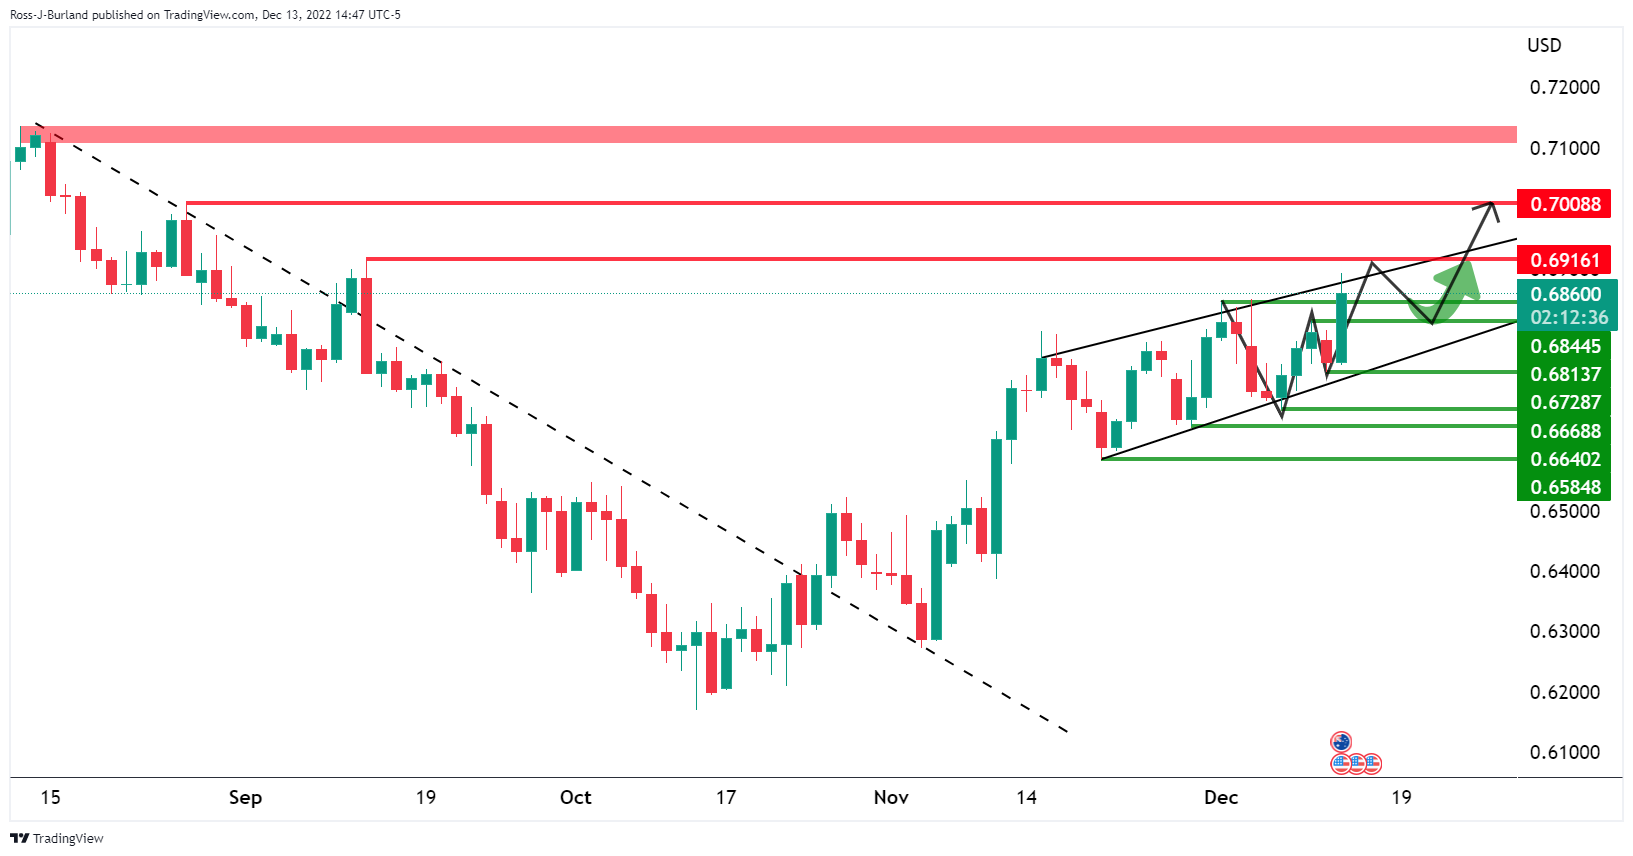
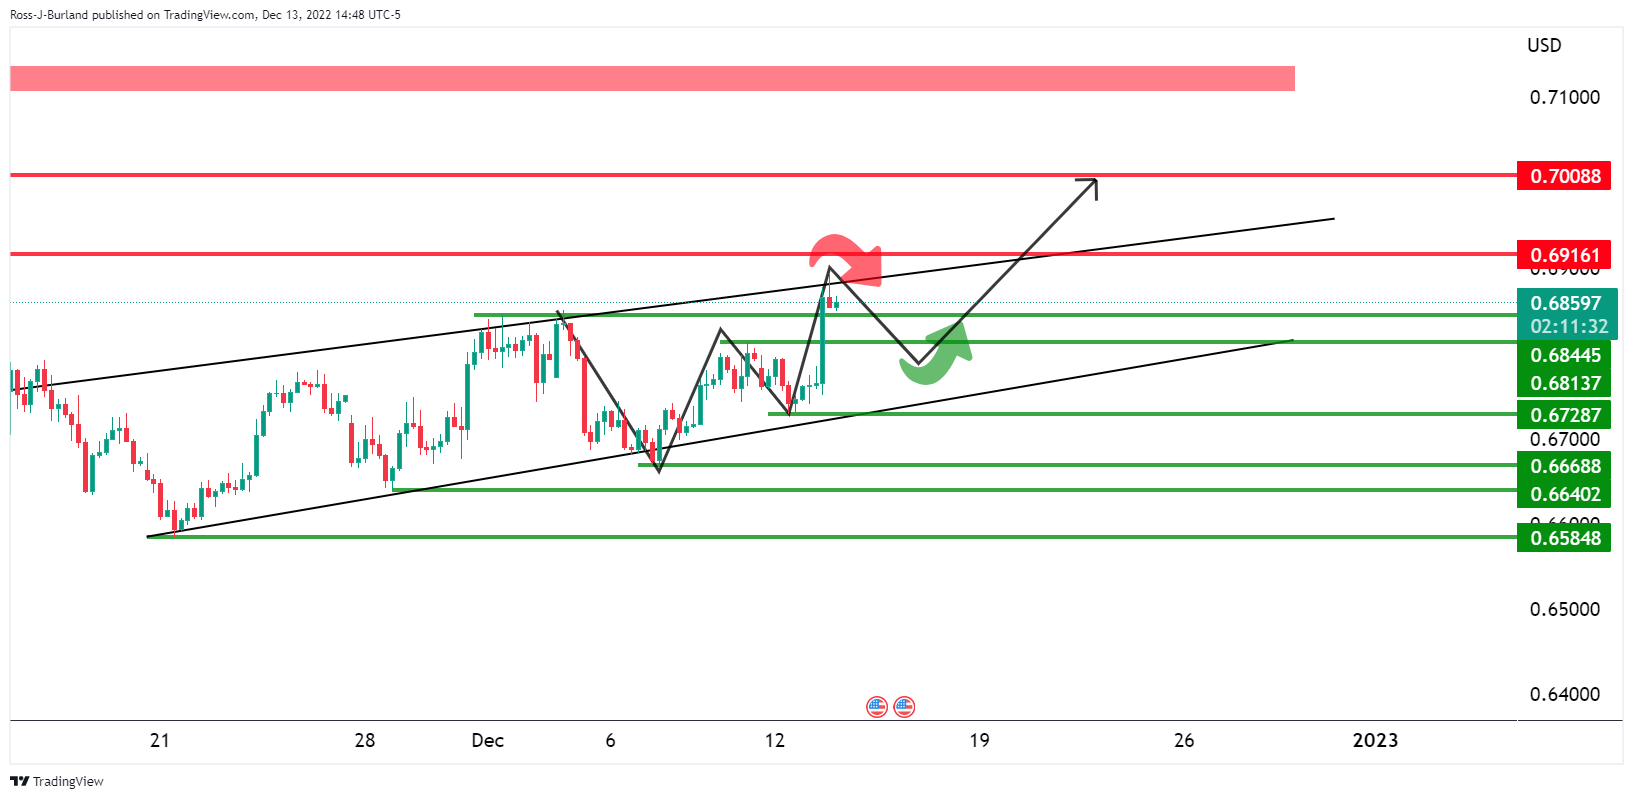
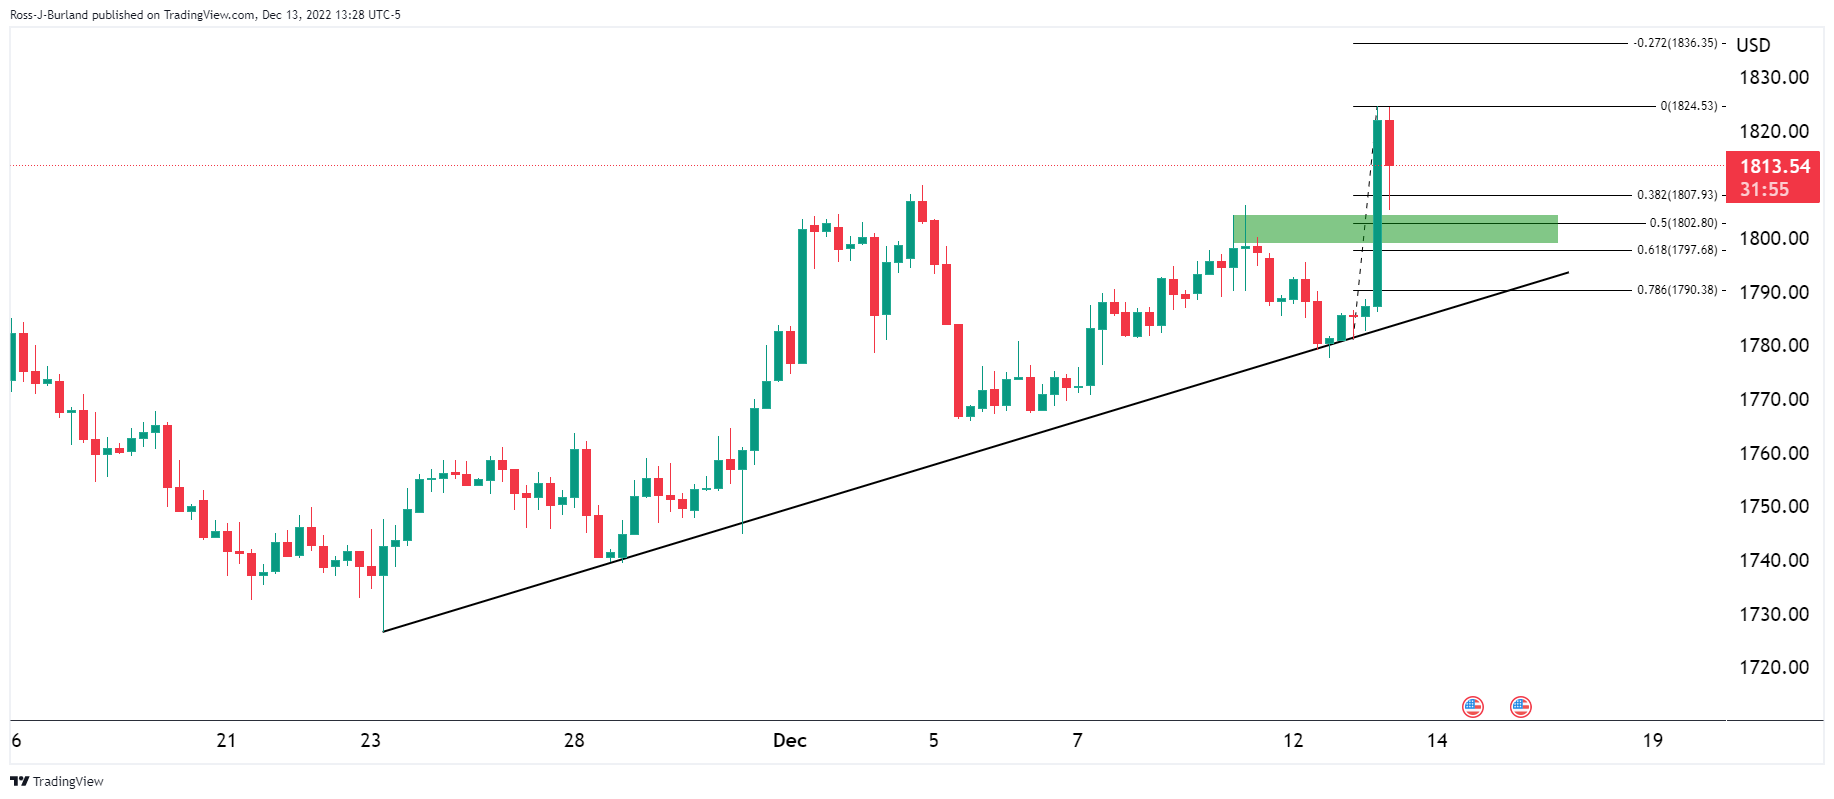
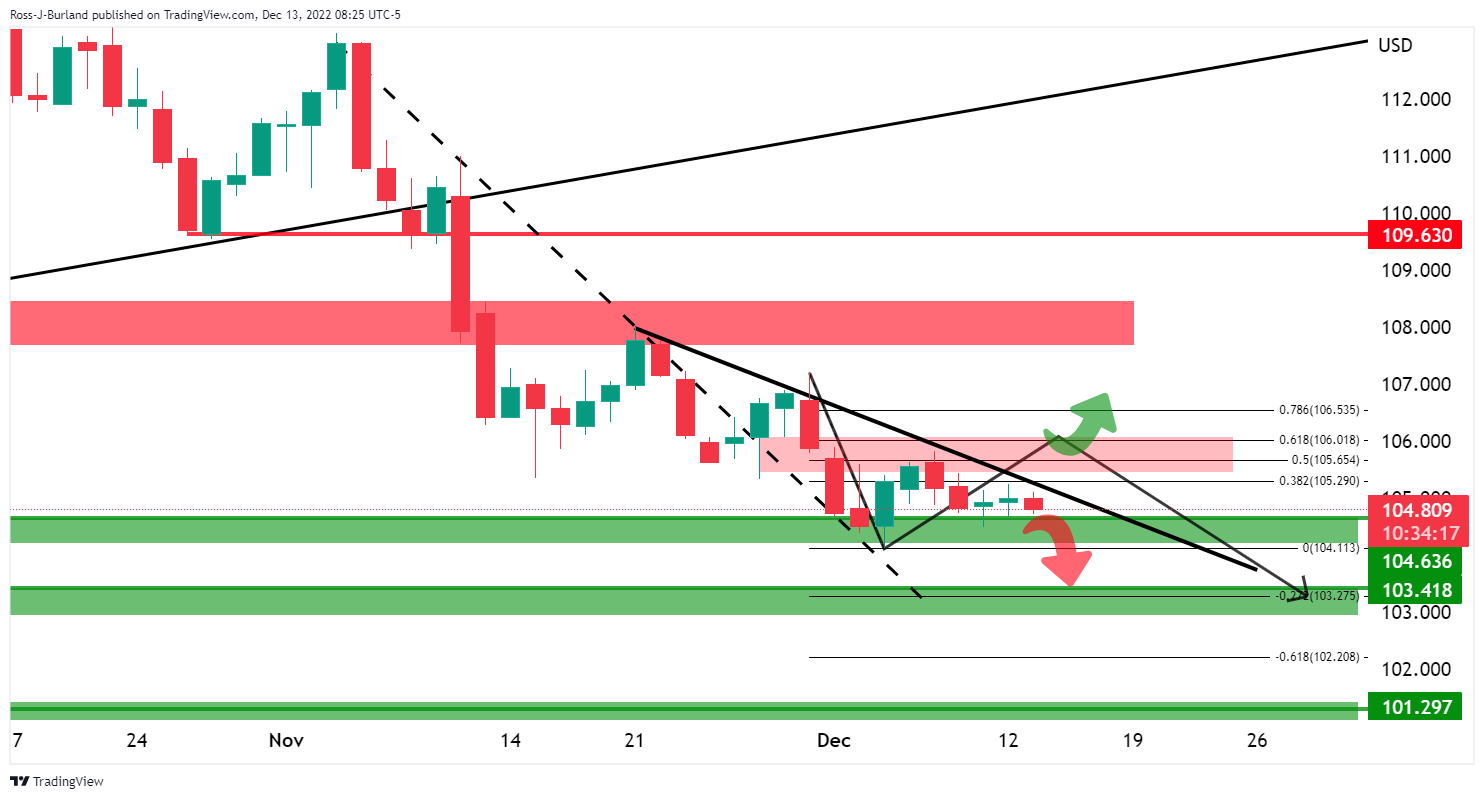
Gold price flirts with a six-month-old horizontal resistance surrounding $1,810 after faking the rising wedge confirmation the previous day. That said, the yellow metal also reversed from the stated one-month-old wedge’s upper line while consolidating the biggest daily gains in a fortnight.
Given the nearly overbought RSI and sluggish MACD signals, not to forget the XAU/USD pullback from the wedge’s top-line, currently around $1,820, the yellow metal may witness further grinding.
That said, a convergence of the 10-DMA and the wedge’s lower line offers strong downside support near $1,790, a break of which could quickly drag the quote towards September’s high near $1,735.
Alternatively, an upside clearance of the $1,820 hurdle won’t hesitate to propel the metal prices towards June’s peak surrounding $1,880.
Gold price: Daily chart
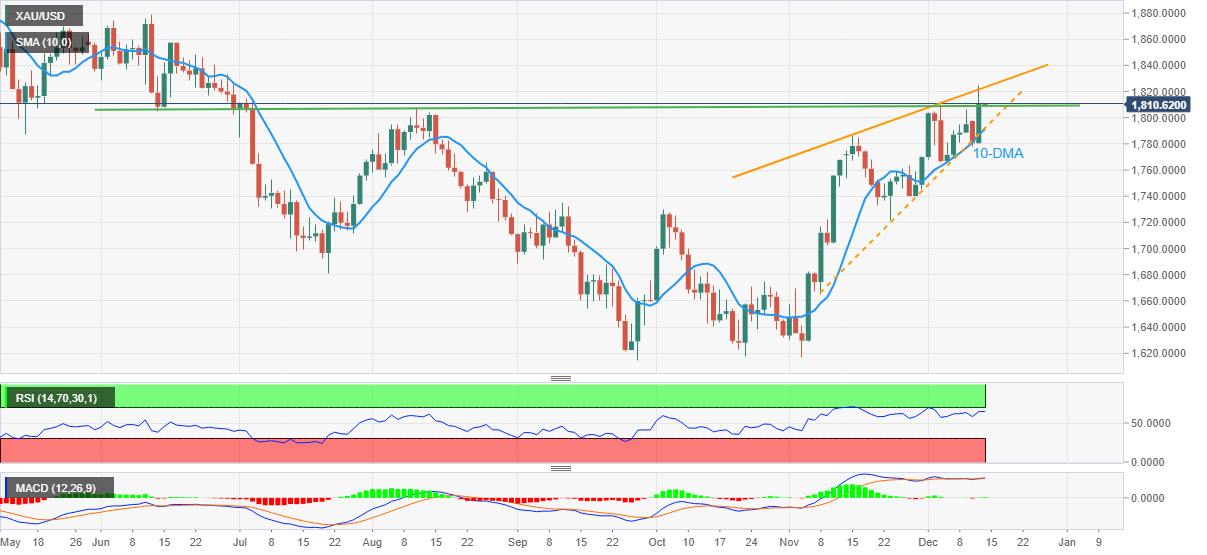
Trend: Limited upside expected
-
22:13
EUR/USD Price Analysis: Pierces and holds above 1.0600 and tests the 2020’s lows
- The Euro reached a seven-month high but cut some of its gains, up by 0.92%.
- A daily close above 1.0600 could pave the way for the EUR/USD toward 1.0700.
- EUR/USD: Break below 1.0600 could exacerbate a fall to 1.0500.
The EUR/USD hit a seven-month high at around 1.0673, but although it remains positive, it trimmed some of its earlier gains late in the New York session. Hence, the EUR/USD is trading at 1.0631, above its opening price by 0.89%, at the time of writing.
EUR/USD Price Analysis: Technical outlook
Tuesday’s price action depicts the EUR/USD trading at multi-month highs, punching through the 24-month-old downslope resistance trendline, broken around 1.0593, exacerbating a rally above the psychological 1.0600 mark. Additionally, the Euro is trading at around the 2020 lows, at 1.0635, which, once cleared, could open the door for a test of the 1.0700 mark.
The Relative Strength Index (RSI) is in bullish territory, about to enter the overbought region. Meanwhile, the Rate of Change (RoC) depicts that buying pressure is fading. Therefore, mixed signals suggest consolidation around the 1.0600-1.0630 area. A daily close above 1.0600 could exacerbate a rally toward 1.077, but it would depend on Wednesday’s Federal Reserve monetary policy meeting.
EUR/USD key resistance levels lie at 1.0673, followed by the psychological 1.0700 figure, followed by the May 30 swing high at around 1.0786. On the flip side, the EUR/USD first support would be the 1.0600 mark. Break below will expose the December 13 low of 1.0528, followed by the 1.0500 figure.
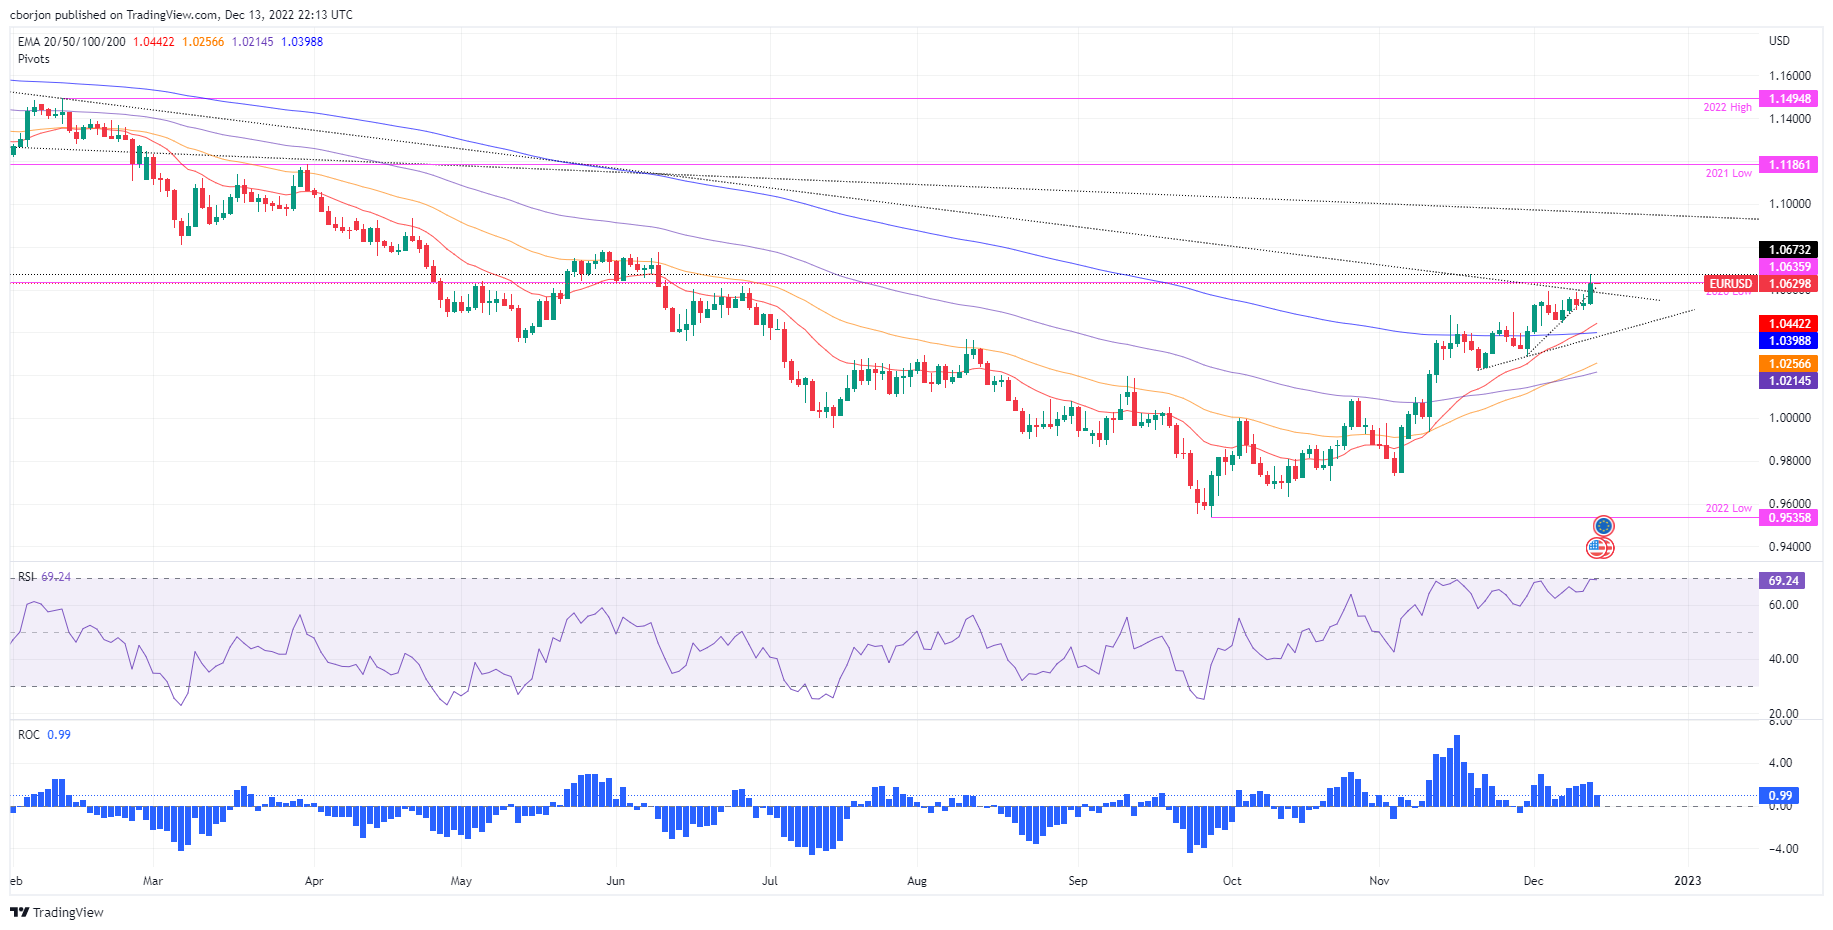
EUR/USD Key Technical Levels
-
22:08
USD/CAD declines towards 1.3500 as lower US Inflation cements less-hawkish Fed policy
- USD/CAD is declining towards the crucial support of 1.3500 as hopes of the Fed’s smaller rate hike have strengthened.
- A decline in gasoline cost and US PPI has trimmed inflation figures.
- Soft US inflation data has supported oil prices as the risk of recession has trimmed.
The USD/CAD pair is displaying back-and-forth moves around 1.3540 in the early Asian session. The Loonie asset has turned sideways after a breakdown of a five-day low of around 1.3561 on Tuesday. The major has been exposed to test the psychological support of 1.3500 as the risk-on impulse has strengthened after the release of a soft United States November inflation report.
The US Dollar Index (DXY) has registered almost a fresh six-month low at 103.59 and is expected to extend its losses further as a sheer decline in United States inflation has accelerated the odds of a slowdown in the current policy tightening pace of the Federal Reserve (Fed). S&P500 extended its upside on Tuesday as lower inflation has trimmed the risk of recession in the US economy. Meanwhile, the 10-year US Treasury yields have dropped significantly to 3.50%.
Fed policymakers were already discussing on slowing down the current interest rate hike to avoid financial risks. Now, a significant decline in inflation has bolstered the expectations.
The headline US Consumer Price Index (CPI) dropped to 7.1% from the expectations of 7.3% and the former release of 7.7%. Thanks to a decline in the cost of gasoline and prices of ultimate goods at the factory gate, which has resulted in a slowdown in inflationary pressures. Also, the core inflation that excludes oil and food prices declined to 6.0% vs. the consensus of 6.1% and the prior release of 6.3%.
On the oil front, oil prices have corrected after hitting $76.00 as a cool-off in ultra-hot US inflation has trimmed weaker economic projections. Meanwhile, investors are keeping an eye on oil inventories reported by the Energy Information Administration (EIA) for fresh cues. It is worth noting that Canada is a leading oil exporter to the US and higher oil prices support the Canadian Dollar.
-
21:46
New Zealand Current Account - GDP Ratio above forecasts (-8.7%) in 3Q: Actual (-7.9%)
-
21:45
New Zealand Current Account (QoQ) came in at $-10.2B below forecasts ($-10B) in 3Q
-
21:43
USD/JPY bears lurking at bulls come up for air
- USD/JPY is pressured on the front side of the trendline resistance.
- US Dollar was sent lower on the US CPI data and Fed expectations.
Against the Yen, the US Dollar dropped to a one-week low of 134.65 and is currently down 1.5% following the US Consumer Price Index that showed that inflation rose less than expected last month.
Subsequently, there are higher expectations that the Federal Reserve will slow the pace of rate increases after its two-day meeting on Wednesday.
US CPI below the mark
- US CPI MoM Nov: 0.1% (est 0.3%, prev 0.4%).
- US CPI Ex Food And Energy MoM Nov: 0.2% (est 0.3%, prev 0.3%).
- US CPI YoY Nov: 7.1% (est 7.3%, prev 7.7%).
- US CPI Ex Food And Energy YoY Nov: 6.0% (est 6.1%, prev 6.3%).
The Consumer Price Index has led to the markets pricing the terminal Fed rate down to 4.86% vs 4.98% prior to the report and US stocks on Wall Street opened bid in the cash market. The NASDAQ jumped over 400 points but was met with supply as traders took profits ahead of the Fed.
While the CPI report supported widely held expectations for a smaller Fed rate hike of 50 basis points and even as the Fed funds futures priced in a lower terminal rate, the US dollar found some traction late in the day. DXY, an index that measures the greenback vs. a basket of currencies, including the Yen, is down some 0.9% at 104.03 but off the lows of the day of 103.586.
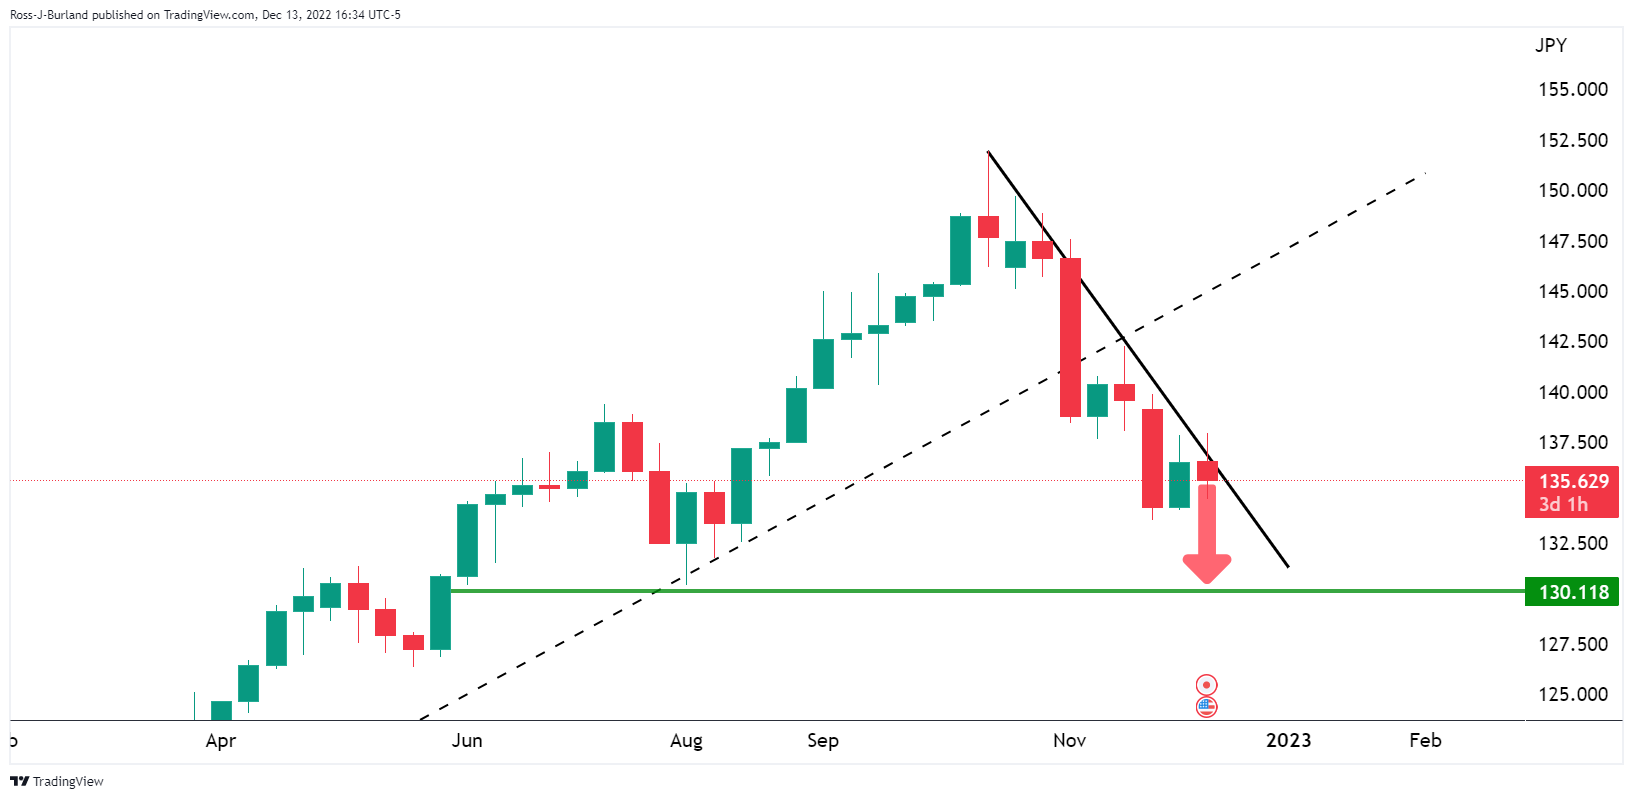
USD/JPY technical analysis
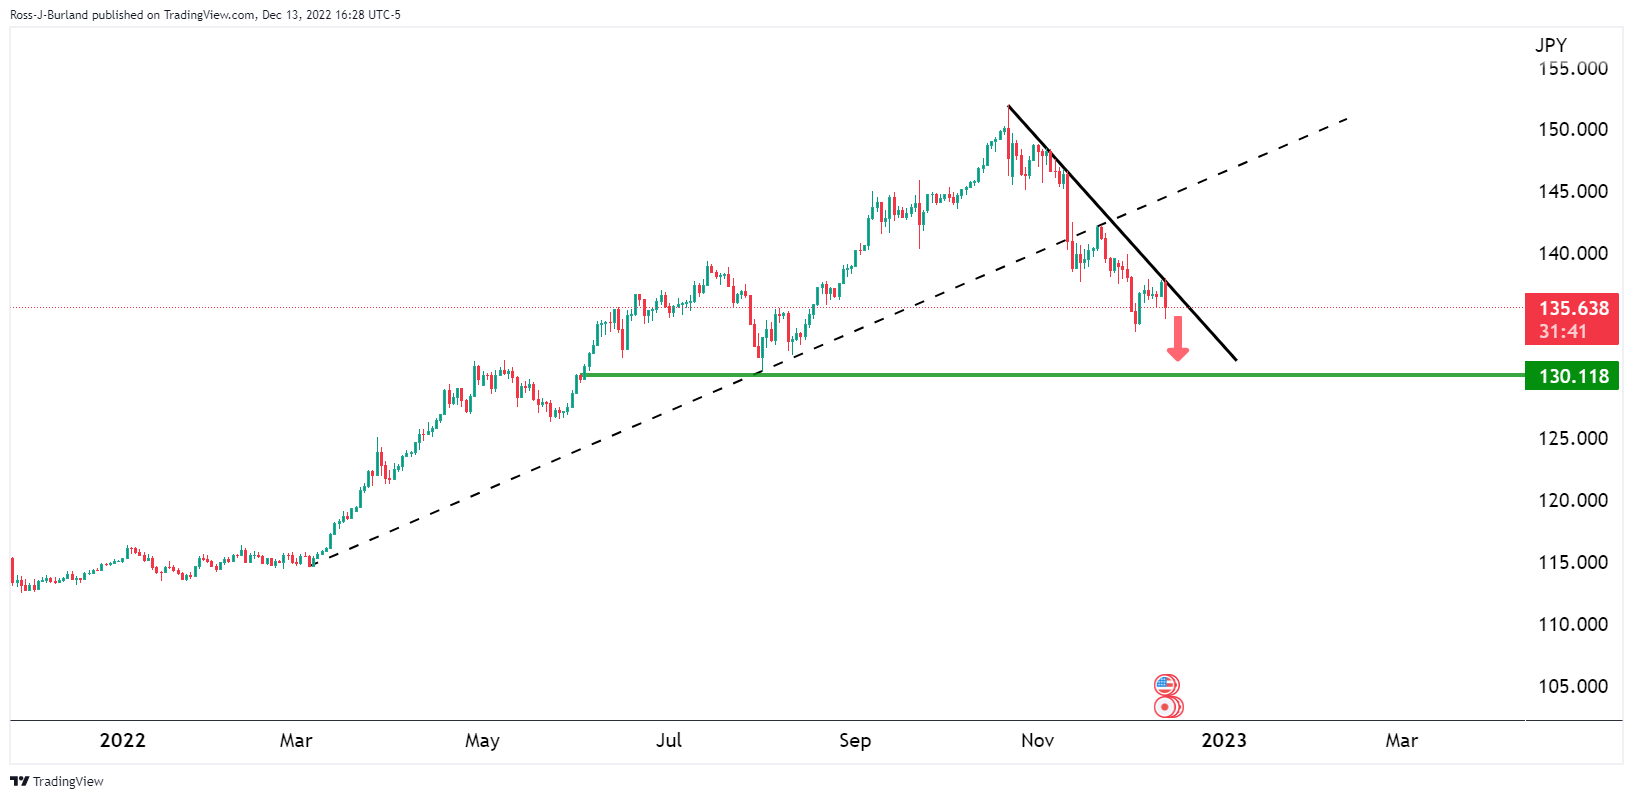
USD/JPY is pressured on the front side of the trendline resistance and the 130.00 area could be tested in the coming days or weeks if the bears stay the course. If fact, as per the following weekly chart, if the Fed turns out to be uber-dovish, the level could be reached before the close of the week. It has not been uncommon for the yen to fly 500 pips in a week:
-
20:41
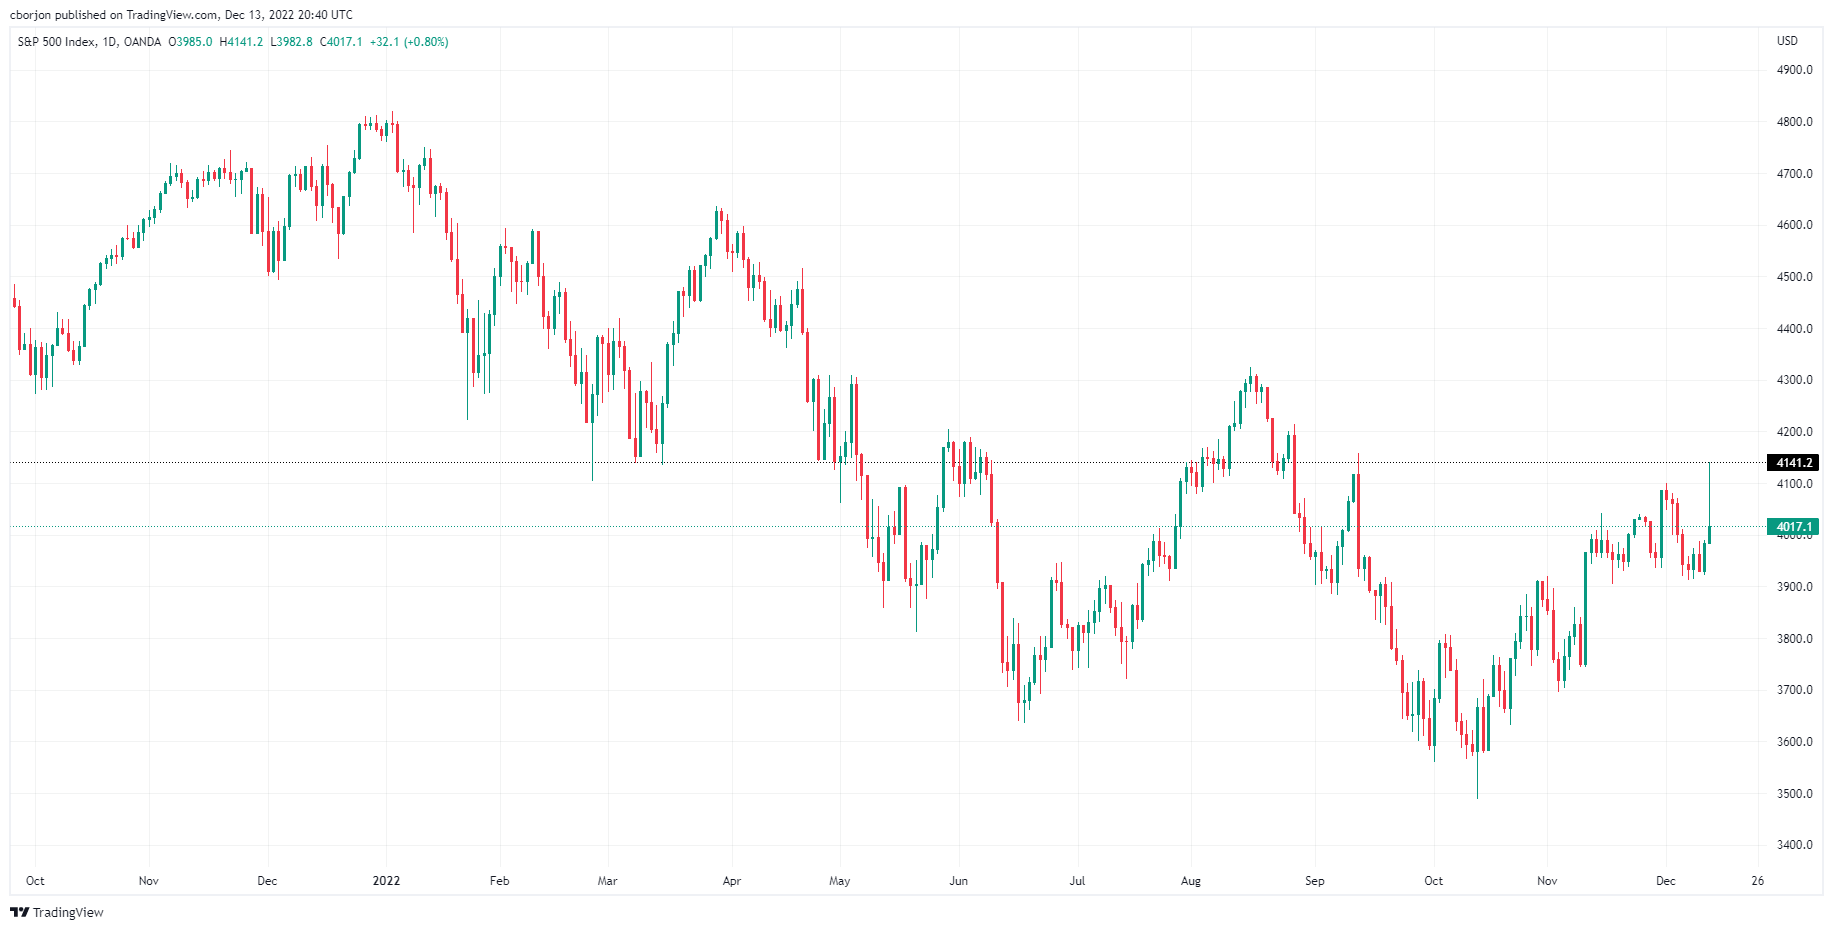
S&P 500 reclaims 4,000 following the release of a soft US inflation report
- The S&P 500, the Nasdaq 100, and the Dow Jones remain positive.
- Softer than expected, US CPI data augmented speculations that the Fed will be less aggressive.
- Traders expect the Federal Reserve to hike to 5% and cut rates ahead of Q4 2023.
US stocks remained volatile after the release of inflation data in the United States (US) and remain positive off the day's highs, with the S&P 500, the Nasdaq 100, and the Dow Joines Industrial Average, each gaining 0.98%, 1.33%, and 0.47%. At the time of writing, the S&P 500 sits around 4,026.90.
It should be said that the indices, albeit remaining positive, are trading well below the day’s highs, as shown by Tuesday’s price action, forming a vast “inverted hammer” candlestick. Some traders speculate that is the reflection of profit-taking ahead of Wednesday’s Federal Reserve monetary policy meeting.
Before Wall Street opened, the US Department of Labor revealed that November’s Consumer Price Index (CPI) rose less than the 7.3% YoY expected to 7.1%. The so-called core CPI for the same period, which excludes volatile items like food and energy, printed 6.0% vs. 6.3% estimates. The reaction on the data sent the S&P 500 rallying to fresh three-month highs.
Money market futures seem to indicate an upcoming rise in the Federal Funds rate, making it peak at 5%. Eurodollar futures portrayed traders speculating that the Federal Reserve would make its first rate cut of around 20 bps by September 2023. Meanwhile, the US Dollar Index appeared volatile as it fell to six-month lows near 103.586, although recovering shortly afterward and now resting comfortably at 103.987.
Elsewhere, US Treasury bond yields, namely the 10-year benchmark note rate, plunged 15 bps, from around 3.630% to 3.459%, though of late, recovered some ground, sitting around 3.514%.
Analysts at TD Securities said, “the November CPI report does not affect the expectation of a 50bp rate increase at tomorrow’s FOMC meeting. Additionally, given the strength in core services inflation, it is clear the Fed will need to remain in a tightening mode beyond the December meeting. We will be looking for any Fed communication tomorrow regarding a further downshift in the hiking pace for the February meeting.”
What to watch
Ahead of the week, the US economic docket will feature the Federal Reserve Open Market Committee (FOMC), where the Fed is expected to hike rates by 50 bps the Federal Funds rate (FFR). Additionally, the Summary of Economic Projections (SEP) would be released, and the dot-plot would portray the Fed officials’ expectations for interest rates.
S&P 500 Daily Chart
-
20:11
AUD/USD Price Analysis: Bulls are testing channel resistance, meeting the bears
- AUD/USD rallied to fresh bull cycle highs in North America but the bears are now moving in.
- AUD/USD bears seek a 50% mean reversion that meets prior resistance beat 0.6815, a level that guards 0.6800.
AUD/USD is higher by 1.6% and has rallied from a low of 0.6740 to a high of 0.6893 on the back of Tuesday's prelude event to Wednesday's Federal Open Market Committee meeting and interest rate decision.
However, while the data has been favourable to the bulls, there are technical structures forming that point to a meanwhile correction as the following analysis illustrates:
AUD/USD daily chart
The price is contained within a rising channel and is now pressing up towards the resistance of the same. Moreover, the W-formation, below, is a reversion pattern and the price could easily change course and move into the neckline for a test of support and bullish commitments:
AUD/USD H4 chart
The 4-hour chart is showing that the bears have already emerged:
A test below 0.6850 could be on the cards for the immediate future while a 50% mean reversion meets prior resistance beat 0.6815, a level that guards 0.6800.
-
19:37
Forex Today: US Dollar’s doom and gloom
What you need to take care of on Wednesday, December 14:
The US Dollar collapsed following the release of the United States Consumer Price Index. According to the Bureau of Labor Statistics, the Consumer Price Index (CPI) rose by 7.1% on a yearly basis in November, easing from 7.7% in October. In the same period, core CPI, which excludes volatile food and energy prices, rose by 6%, below the 6.1% expected.
The encouraging figures fueled speculation the US Federal Reserve will slow the pace of tightening and maybe announce the end of the current tightening cycle. Wall Street soared ahead of the opening, with the DJIA adding over 600 points but trimming most of its gains ahead of the close. Nevertheless, the Greenback remained on the back foot and near its recent multi-month lows.
The EUR/USD pair hovers around 1.0620 after peaking at 1.0672. GBP/USD, in the meantime, trades at 1.2350, ahead of the UK November Consumer Price Index.
The Australian Dollar holds on to substantial gains vs the USD, with the pair trading at around 0.6850. USD/CAD is down to 1.3540.
Crude oil prices kept advancing, with WTI trading at $75.20 a barrel. Oil surged after OPEC trimmed its forecast for oil demand by 140,000 bpd for the current quarter, citing slowing activity in China. OPEC also cut Q1 2023 forecast by 410,000 bpd.
The USD/JPY pair is down to 135.50, while the USD/CHF trades at 0.9290.
Spot gold peaked at $1,824.53 a troy ounce, now hovering around $1,810.00.
On Wednesday, the focus will be on the US Federal Reserve. The central bank is expected to hike rates by 50 bps and could anticipate the end of the tightening cycle. Chairman Jerome Powell has anticipated there’s a good chance the central bank will slow the pace of tightening as soon as in this meeting, and the encouraging inflation outcome for sure exacerbated the idea.
Top 3 Price Prediction Bitcoin, Ethereum, Ripple: Crypto vs. Inflation
Like this article? Help us with some feedback by answering this survey:
Rate this content -
19:17
NZD/USD is creeping lower into the closing hours of Wall Street
- NZD/USD bears move in as profit-taking ensues.
- The markets will look to he the NZ Half Year Economic and Fiscal Update on Wednesday and the Fed.
NZD/USD is higher by some 1.29% on the day as the markets take profits following a volatile spell on Wall Street and US data that showed softer inflation pressures in the month of November.
Both the Australian and New Zealand Dollars were tracking global shares higher into the US Consumer Price Index and rallied strongly when the data pointed towards a Federal Reserve pivot.
US CPI below the mark
- US CPI MoM Nov: 0.1% (est 0.3%, prev 0.4%).
- US CPI Ex Food And Energy MoM Nov: 0.2% (est 0.3%, prev 0.3%).
- US CPI YoY Nov: 7.1% (est 7.3%, prev 7.7%).
- US CPI Ex Food And Energy YoY Nov: 6.0% (est 6.1%, prev 6.3%).
The Consumer Price Index has led to the markets pricing the terminal Fed rate down to 4.86% vs 4.98% prior to the report. Consequently, US stocks on Wall Street opened bid in the cash market with the NASDAQ jumping over 400 points and rallying over 3.3%. However, there has been a sharp turnaround in markets that have resulted in a reversal in the Kiwi as well.
''This is likely just the first leg of volatility to be expected this week, with the Fed decision,'' analysts at ANZ Bank argued. ''Markets are now obviously going into it with a very dovish mindset – that’ll be fine if the Fed are dovish, but that doesn’t align at all well with recent comms, especially with US services inflation still rising, and the labour market so tight, and we may be in for a bumpy ride.''
''We get the he Half Year Economic and Fiscal Update today. This isn’t usually something FX markets watch, but if we do get extra bond supply, it could drive NZ interest rates up further, and that might be viewed in some quarters as a positive for the NZD.''
-
18:39
Gold Price Forecast: XAU/USD bulls cheer Fed pivot sentiment after US CPI miss
- The Gold price is making fresh bull cycle highs after the United States Consumer Price Index miss.
- The United States Federal Reserve interest rate announcement will be key for the Gold price.
- Gold price 4-hour chart shows the bears moving in and there are eyes on the prior resistance near $1,800.
The Gold price is higher after US Treasury yields declined due to a report that showed that inflation in the United States was less than estimated last month. At the time of writing, XAU/USD is higher by 1.5% and has travelled from a low of $1,781.02 to a high of $1,824.52.
The Consumer Price Index (CPI) rose +7.1% from a year earlier in November, compared with the consensus forecast for a +7.3% gain and the October reading of +7.7%. Prior to the data, markets were getting set in the case of a softer reading that could have been the catalyst for a dovish Federal Open Market Committee (FOMC) this week. As a consequence of the Consumer Price Index, the curve bull steepened sharply as the market lowered the terminal Federal Reserve rate and increased the number of cuts being priced in. Risk assets found a bid with the US stocks rallying hard, the commodities complex up and the US Dollar down.
''Given the strength in core services inflation, it is clear the Fed will need to remain in a tightening mode beyond the December meeting. We will be looking for any Fed communication tomorrow regarding a further downshift in the hiking pace for the February meeting,'' analysts at TD Securities said after today's Consumer Price index.
Federal Reserve and European Central Bank up next
The FOMC is meeting today and will wrap things up on Wednesday with their statement and interest rate decision followed by the Federal Reserve's chairman, Jerome Powell, who will speak with the press. Jerome Powell's press conferences are an event in themselves which can create immense volatility in financial markets.
Money markets are currently pricing a 50bps Federal Reserve rate hike after four successive 75bps rate increases. However, changes in the peak rate or whether policymakers think there will be a need to become more hawkish could be more fundamental than the interest rate decision itself and that is where Jerome Powell will be pushed by the press.
Nevertheless, another moderation in the monthly core Consumer Price Index in the United States has helped to reaffirm that the US Dollar peak could be here which is lifting spirits as reflected in the emerging market indexes. The Gold price, however, will now also depend on the outcome of the European Central Bank, (ECB)
There is the risk that the ECB sounds and acts more hawkishly than the Fed this week. If this were to transpire, the US Dollar is going to have a hard time correcting whatever potential unwind comes of a dovish Federal Reserve and today's inflation data.
ECB President Christine Lagarde will of course continue to underline their determination to fight inflation.
''We expect a 50bps hike, but can't completely rule out 75bps,'' analysts at TD Securities (TDS) said.''Focus is likely to be on Quantitative Tightening guidance, which the Governing Council has announced will come alongside the decision New forecasts are likely to show a worsening trade-off between growth and inflation, but the ECB likely only has another hike or two left before turning to QT as its main tool,'' the analysts at TDS added.
Gold technical analysis
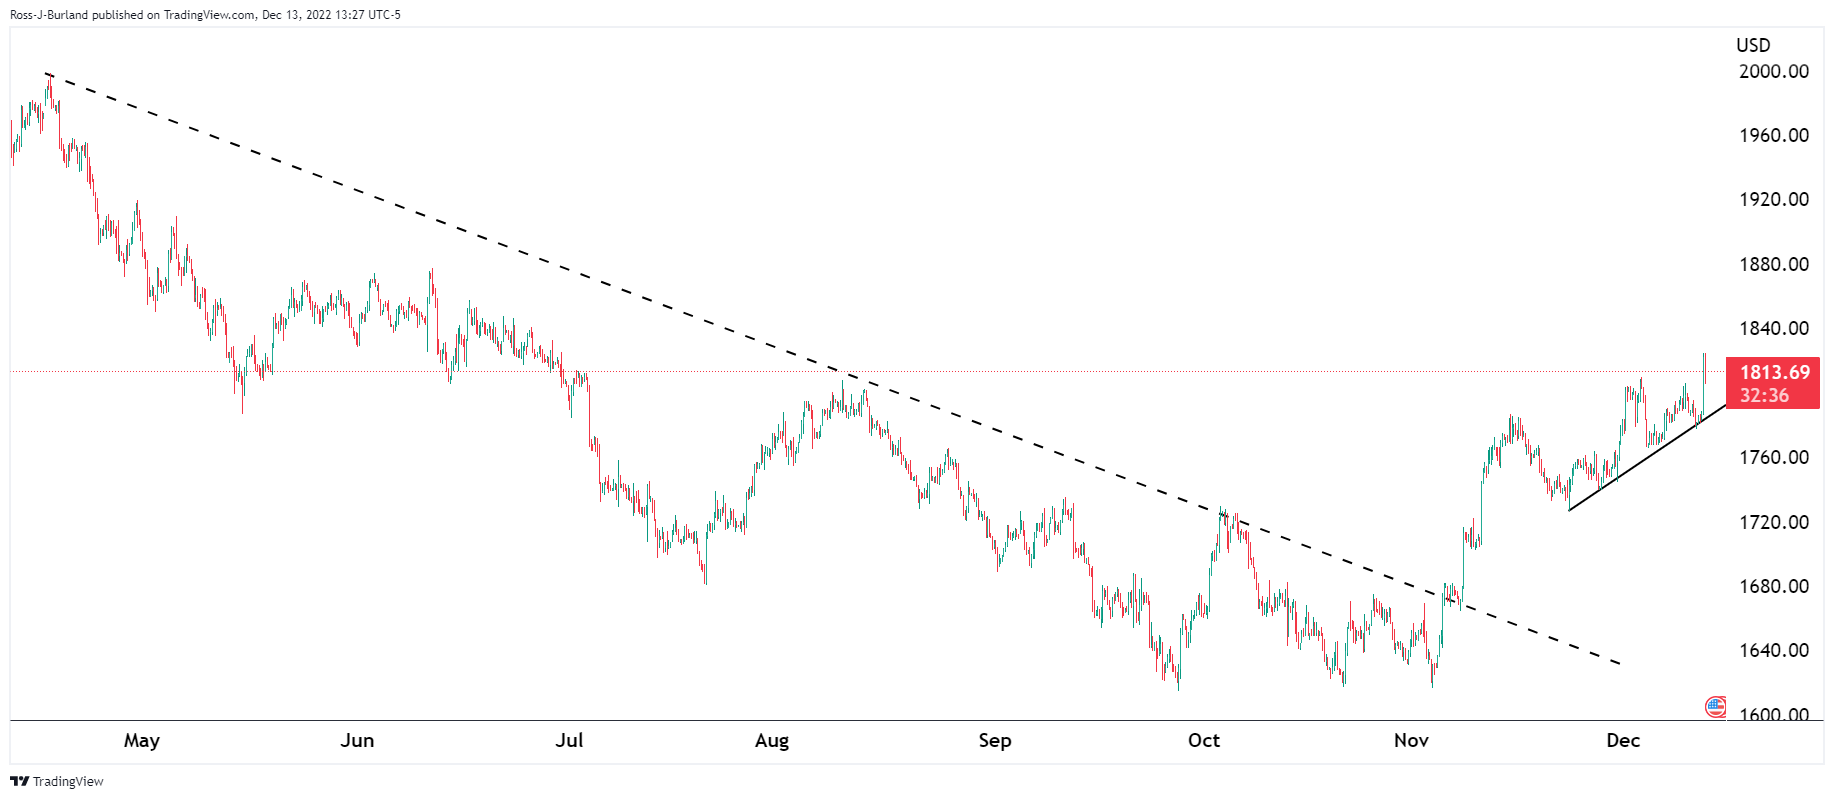
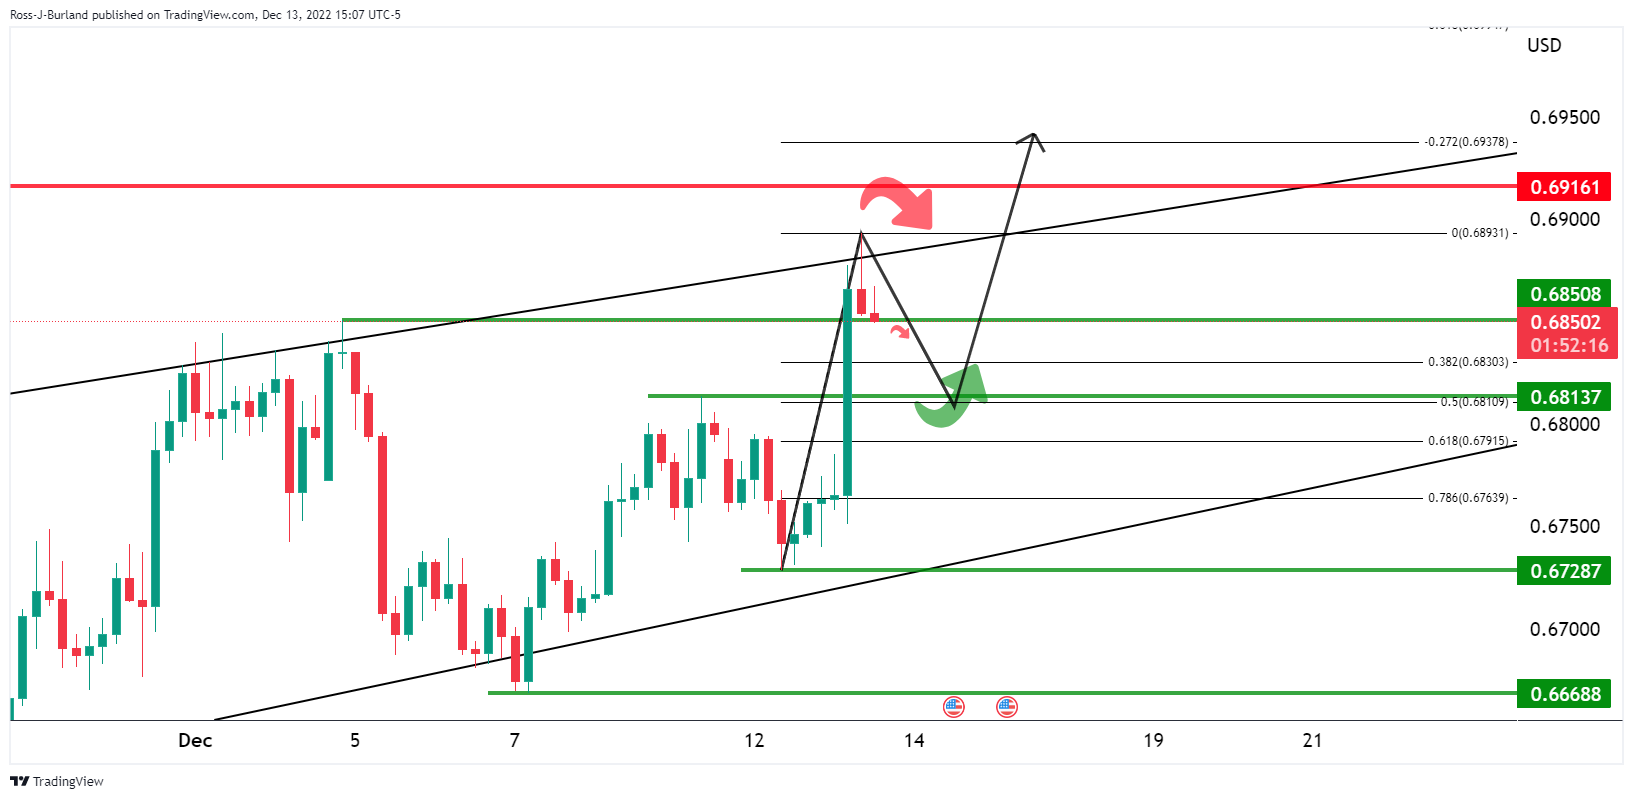
The Gold price, as illustrated in the above daily and 4-hour charts, has carved out a bullish scenario, although there are prospects of a correction. Gold price 4-hour chart shows the bears moving in and there are eyes on the prior resistance near $1,800. This Gold price level correlates with a 50% mean reversion of the CPI rally and could serve as a foundation for further buying activity in the coming days.
-
18:10
EUR/JPY Price Analysis: Struggles at 145.30 and drops towards 143.60s
- The Euro rose to multi-week highs but retraced and cleared the 20 and 50-day EMAs.
- EUR/JPY: A decisive break below 143.00 could pave the way towards the 100 and 200-day EMAs, around 142.55 and 139.88.
The EUR/JPY erases some of its earlier gains after hitting a daily high at 145.34 and tumbles more than 140 pips in the mid-Tuesday North American session, down by 1.02%. At the time of typing, the EUR/JPY is trading at 143.58.
EUR/JPY Price Analysis: Technical outlook
The EUR/JPY remains neutral-biased. After clearing the top-trendline of a descending channel on Monday, the cross pairs those gains and is back within the boundaries of the former. In addition, on its way south, the EUR/JPY conquered the 20 and 50-day Exponential Moving Averages (EMAs) around 143.89/144.04, eyeing a test of the last week’s low around 143.09.
Oscillators like the Relative Strength Index (RSI) crossing below 50, in bearish territory and the Rate of Change (RoC) beneath 0, suggest that sellers are gathering momentum, which would put in play, the 100-day EMA and also the bottom of the descending channel ahead of the 200-day EMA at 139.88.
Therefore, the EUR/JPY first support would be 143.09. Break below will expose the 100-day EMA at 142.55, followed by the December 2 at 142.54, followed by the 200-day EMA at 139.88.

EUR/JPY Key Technical Levels
-
18:02
United States 30-Year Bond Auction down to 3.513% from previous 4.08%
-
17:32
USD/CHF falls to multi-month lows around 0.9230s on soft US CPI
- US CPI climbs toward 7.1% YoY, while core inflation drops to the 6% threshold.
- USD/CHF: A daily close below 0.9300 to pave the way towards 0.9150.
- Investors focus shifted toward the Federal Reserve monetary policy on Wednesday.
The USD/CHF stumbles and refreshes eight-month lows, around 0.9231, after hitting a daily high of 0.9375, following the release of US inflation figures, which eased a bit, taking pressure off the Federal Reserve (Fed), which would meet on Wednesday, for the last time in the year. At the time of writing, the USD/CHF is trading at 0.9280, below its opening price, by 0.85%.
US inflation eases, a headwind for the USD/CHF
Wall Street remains trading with gains while the US Dollar (USD) sinks. On Tuesday, the US Department of Labor revealed the Consumer Price Index (CPI) for November, which decreased year-over-year by 7.1%, below analysts' predictions of 7.3%. In addition, core CPI shifted upwards during September and then moved back down again - standing at 6% lower than initial projections of 6.3% for November figures.
The US Dollar Index, a gauge of the buck’s value against a basket of six currencies, is dropping 0.99%, at 103.961, after hitting a low of 103.586, undermined by falling US Treasury yields. In the fixed income space, the US 10-year T-bond yield is falling twelve bps, at 3.485%, as traders began to price in a less aggressive Federal Reserve.
On the Switzerland side, the Seco economic forecasts confirmed that the Swiss economy is estimated to grow significantly below-average rate of 1.0% in 2023, followed by 1.6% in 2024 GDP. It should be said that the projections assume no energy supply shortages in 2022 and 2023 next winter.
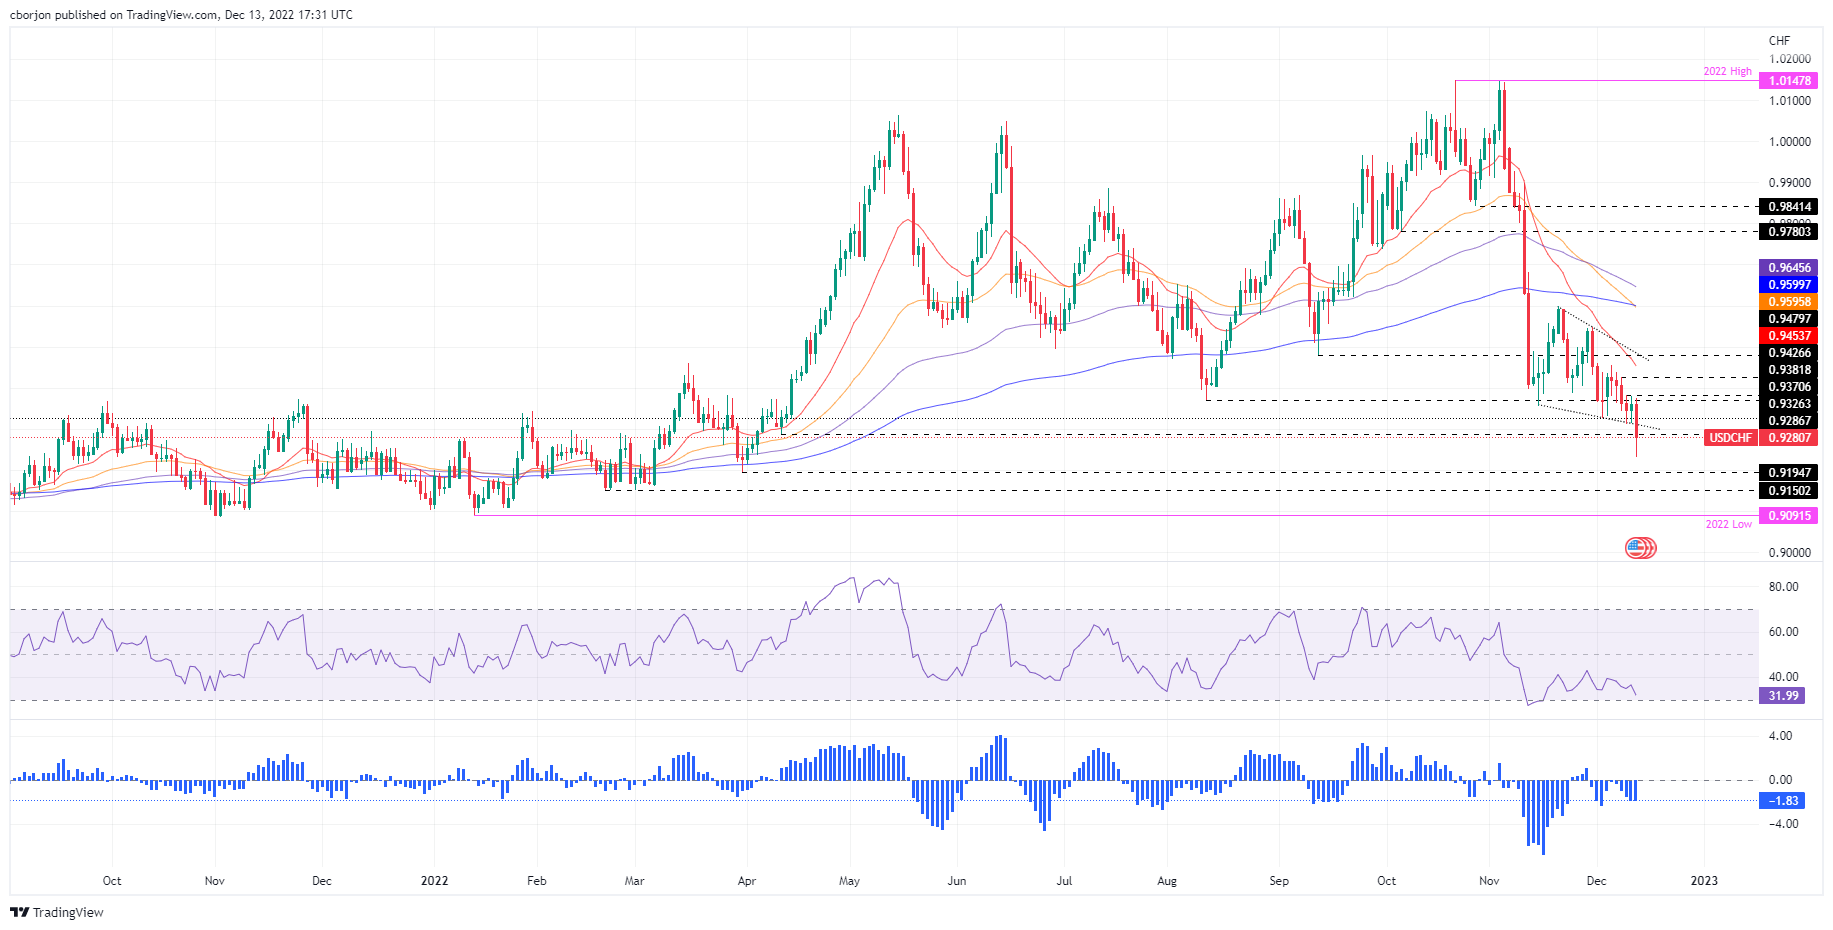
USD/CHF Price Analysis: Technical outlook
The USD/CHF broke to the downside, the falling wedge, though a daily close below 0.9300 would be needed, to further cement the downward bias, confirmed by oscillators. The Relative Strength Index (RSI), at bearish territory, points downward. In the case of the Rate of Change (RoC), it keeps pressuring to the downside, portraying that sellers are gathering momentum.
Hence, the USD/CHF key support levels are the 0.9200 figure, followed by the March 22 daily low at 0.9194, ahead of the February 21 daily low at 0.9150.
-
16:51
US: Broader inflation pressures are easing – RBC
Data released on Tuesday showed the US Consumer Price Index slowed to 7.1.% y/y from 7.7%. Analysts at RBC Capital Markets see the Federal Reserve raising the Fed Funds rate by 50 basis points on Wednesday and the tey pon out the more encouraging inflation signs make a pause in early 2023 more likely.
Key Quotes:
“November’s U.S. inflation report brought more green shoots that broader inflation pressures are easing. The headline CPI rate slowed to 7.1% from 7.7% year-over-year in October as price pressure for all major categories slowed.”
“Needless to say, despite green shoots in the near-term, price growth has further to fall before reaching the Fed’s 2% target. And consumer demand has been more resilient, adding some tailwinds to inflation trends. Still, higher interest rates will cut into household purchasing power in the year ahead and we look for inflation to continue to creep broadly lower. Overall, a smaller 50 bp hike is expected for the Fed’s meeting tomorrow, to be followed by another 50 bp over the first quarter next year before the Fed feels comfortable to pause the current cycle and reassess.”
-
16:40
USD: Another moderation in core CPI helps reaffirm USD has peaked – TD Securities
Inflation data from the United States released on Tuesday showed an increase in the Consumer Price Index in November of 0.1% below the 0.3% of market consensus. According to analysts from TD Securities another moderation in monthly core CPI helps to reaffirm that the USD peak is here.
Key Quotes:
“This print risks making the upcoming Fed meeting moot as claims of a "somewhat higher" terminal rate become harder to price in. USD positioning unwind flags overdone but with the risk that the ECB sounds and acts more hawkishly than the Fed this week means that a USD reversal is not harder to come by.”
“Near-term, we think USDJPY will remain heavy and risk a more significant break of the 200day especially if the Tankan survey shows more price passthrough (output prices are already at multi-decade highs). Strategically, we think a theme of divergence will dominate the yen (from a bullish side) as inflation peaks elsewhere (while it runs up further in Japan) and global central banks downshift or stop tightening (while the BOJ alters YCC).”
“For EURUSD, 1.0620 should be key resistance/pivot short-term, but the EUR was one of the first to lead USD underperformance so the risk here is that the move is tactically matured. We think this could be more likely on some crosses like the JPY.”
-
16:17
USD/MXN drops sharply toward 19.60 as US Dollar tumbles
- US Dollar plummets following the release of US inflation data.
- Mexican Peso has the best day in months versus US Dollar.
- USD/MXN back under 19.80 ahead of the Fed and Banxico.
The USD/MXN is falling sharply on Tuesday amid risk appetite and a weaker US Dollar across the board. The pair reversed sharply from monthly highs after the release of US inflation numbers.
The US Consumer Price Index rose below expectation in November and triggered a rally in Treasuries and sent the Dollar sharply lower. Attention now turns to the FOMC meeting. On Wednesday, the Federal Reserve will announce its decision on monetary policy. A 50 bps rate hike is expected.
The Bank of Mexico meets Thursday. Also a 50 bp rate hike to 10.5% is expected. “At the last policy meeting November 10, the bank hiked rates 75 bp to 10.0%. The vote was 4-1, with Deputy Governor Esquivel voting for a smaller 50 bp move. The bank said that the magnitude of future hikes will be decided the circumstances, suggesting greater data-dependence. Since then, headline inflation came in lower at 7.80% y/y in November, but core continues to accelerate to new highs. The swaps market is pricing in a policy rate peak near 10.75%”, explained analysts at Brown Brothers Harriman.
USD/MXN faces strong resistance near 19.80
The rally of the USD/MXN from the lowest level in years near 19.00 peaked on Monday at 19.92. It then started to pullback being unable to consolidate above the 19.80 key area and also rejected from above the 100-day Simple Moving Average (currently at 19.88).
A consolidation between 19.60 and 19.80 seems likely for now. A break under 19.60 should strengthen the Mexican Peso that could go toward the 20-day SMA at 19.47.
Technical levels
-
15:54
UK CPI Preview: Forecasts from five major banks, a November peak
The United Kingdom will release the Consumer Price Index (CPI) data on Wednesday, December 14 at 07:00 GMT and as we get closer to the release time, here are the forecasts by the economists and researchers of five major banks regarding the upcoming UK inflation print.
Headline is expected at 10.9% year-on-year vs. 11.1% in October while Core, which excludes volatile food and energy prices, is expected to remain steady at 6.5% YoY.
TDS
“Headline inflation likely ticked down to 10.9% YoY in November, in line with the BoE's November forecast, largely owing to base effects, while we think MoM price growth remained strong. Focus from the MPC should be more on core CPI though, and here we see slight upside risks as core goods inflation appears to have stayed strong despite mounting downside pressures. We forecast a rise to 6.6% YoY, while MPR forecasts implied a repeat 6.5% YoY reading. However, at the end of the day, given the substantial amount of volatility in the data, a minor upside surprise to the BoE's core forecast will likely not matter too much for the MPC.”
SocGen
“Despite a continued rise in core and food inflation, negative base effects should allow a marginal reduction in headline inflation from 11.1% to 11.0% in November, although risks are tilted to the upside. For core, both stronger services and goods inflation should contribute to an acceleration from 6.5% to 6.7%.”
Citibank
“UK inflation for November likely to show headline CPI decelerating marginally to 11.0% YoY while core CPI is expected to remain stable at 6.5%.”
ING
“Inflation looks like it has peaked, although BoE hawks will be keeping a close eye on the data due a day prior to its announcement. Headline CPI is likely to dip, however, core could be more sticky, and last month’s data saw core services inflation come in slightly higher than the bank had forecast in November.”
Deutsche Bank
“We expect CPI to have slowed from 11.1% to 10.9%. If our forecasts are broadly on the mark, we have crossed the peak in inflation. And now, the next stage begins. We anticipate CPI will be over 8% YoY next year before landing around 6% in the fourth quarter.”
-
15:39
Silver Price Forecast: XAG/USD trades at multi-month highs around $23.70s
- Silver hit a six-month high at around $24.12 before reversing its curse, though it remains positive.
- Inflation in the United States continues its downtrend, still far from the 2% goal.
- The Federal Reserve is expected to hike rates by 50 bps, with odds around 90%.
Silver price advanced sharply above the $24.00 figure following the November inflation report in the United States (US) release, which ticked lower, easing pressure on the Federal Reserve (Fed). The US Dollar (USD) is plunging while precious metals advance. At the time of writing, the XAG/USD is trading at $23.74 after hitting an eight-month high of $24.12.
The Department of Labor reported that the Consumer Price Index (CPI) rose marginally by 0.1% from last month and decreased slightly on a year-on-year basis to 7.1%, missing previous analyst expectations of 7.3%. Even though inflation has dropped since its peak in June at 9.1%, the so-called core CPI suddenly shifted upwards during September. Nevertheless, in the last two months, core CPI moved downwards, with November figures standing at 6%, below what analysts had predicted as 6.3%.
Money market futures suggest that the Federal Funds rate (FFR) may reach a peak of 5% before being cut in September 2023, around 20 bps. At the same time, weakness was seen for the US Dollar Index, which sank to six-month lows around 103.586, though it is trimming some of its earlier losses, sitting at 103.900.
Elsewhere, US Treasury bond yields, namely the 10-year benchmark note rate, plunged 15 bps, from around 3.630% to 3.459%, while US 10-year TIPS yield, a proxy for real yields, dropped 11 bps to 1.215%, a tailwind for the precious metal segment.
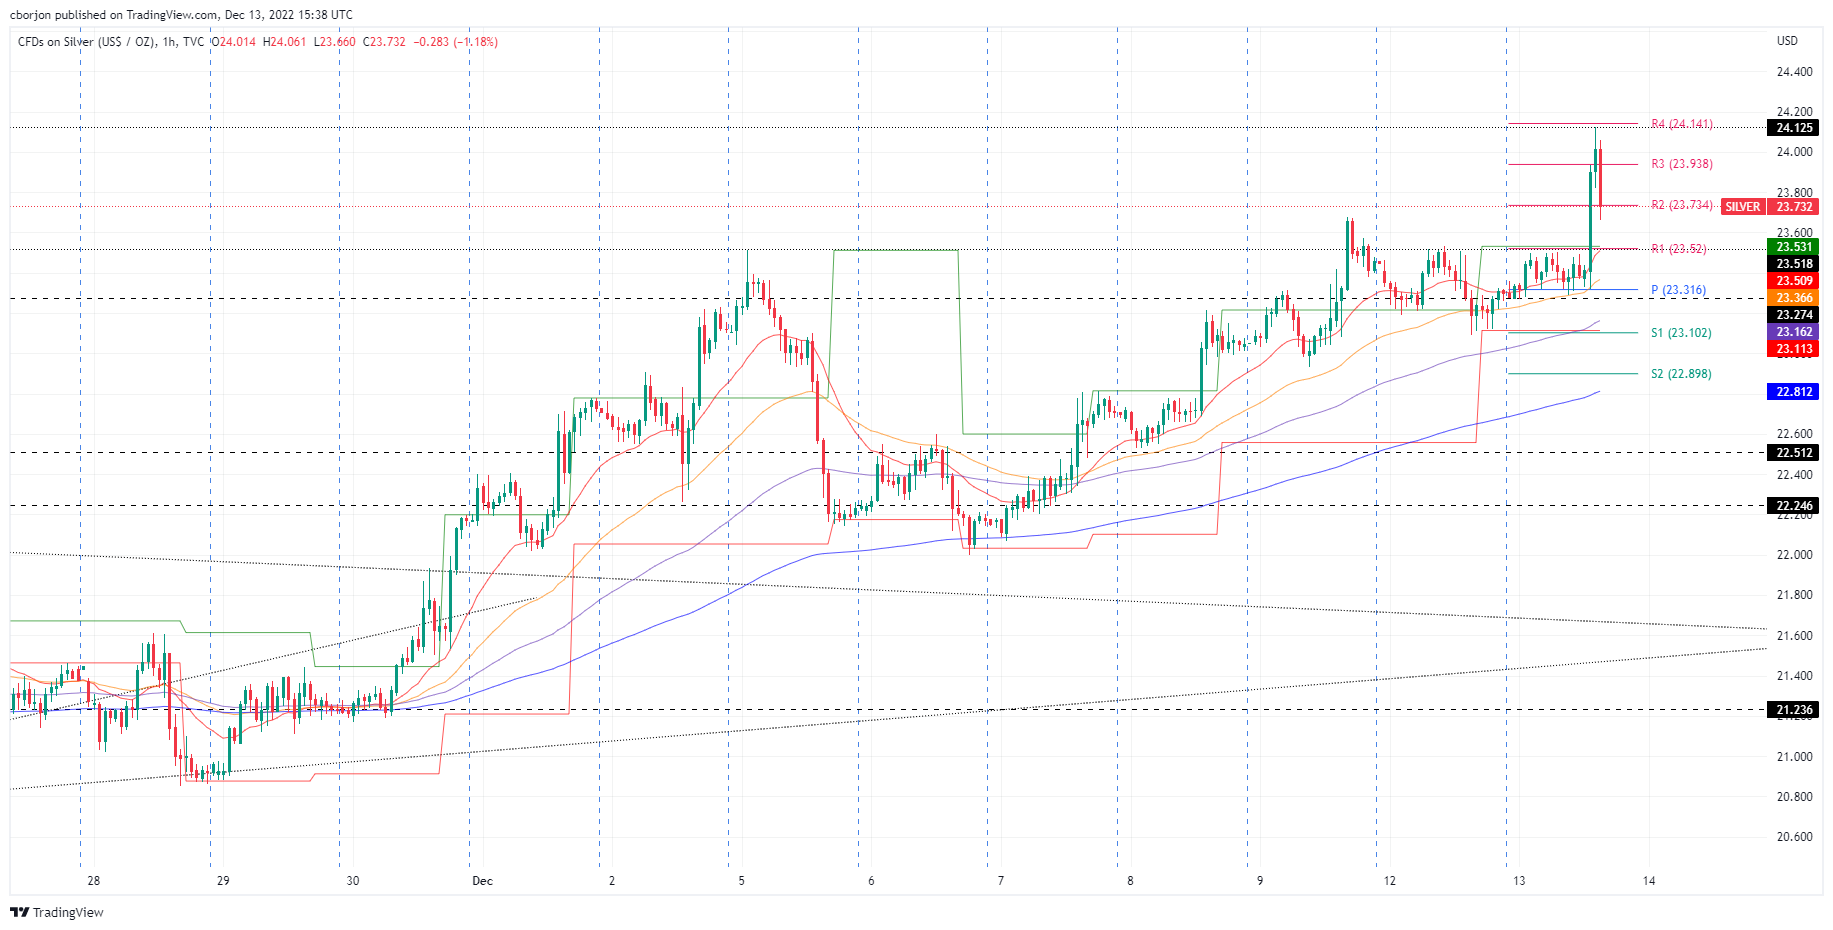
Silver (XAG/USD) Reaction to US CPI report
XAG/USD remains upward biased and rallied above $24.00, on traders speculating that the Federal Reserve might not be as aggressive as inflation continues to slow down. Silver found solid resistance at the R4 daily pivot at $24.14, since then, retraced $0.40 towards current prices, erasing some of its earlier gains. A fall below the $2 daily pivot at $23.73 could pave the way toward the R1 level at $23.52, followed by the daily pivot at $23.31, which would turn the white metal flat compared to Tuesday’s opening price.
-
15:29
Fed to stay in inflation-fighting mode for a while yet – Wells Fargo
Inflation is more firmly on a downward trend. But economists at Wells Fargo suspect the FOMC remains concerned about the ongoing strength in labor costs.
There is still work left to be done in the fight against inflation
“The Consumer Price Index came in lower than expected in November, with the headline rising 0.1% and the core advancing 0.2%. Nevertheless, a sustained return to the Fed's inflation goal remains some ways away. Services ex-shelter and ex-travel picked up in November, and the overall core index is running at a 4.3% annualized rate the past three months.”
“While the pace of inflation is expected to slow further over the next few months, the roughly 5% pace of wage growth is likely to keep the Fed in inflation-fighting mode for a while yet.”
“We look for the Fed to proceed with its signaled 50 bps hike tomorrow, although the prospect of a further downshift to a 25 bps hike come its first meeting of 2023 has increased with this report.”
-
15:05
USD/JPY falls more than 250 pips after US CPI
- US inflation slows more than expected in November.
- Japanese yen soars across the board following the report.
- USD/JPY drops below 135.00 to one –week lows.
The USD/JPY collapsed after the release of US inflation data. The pair dropped from 137.60 to as low as 134.60, reaching the lowest level in a week and approaching the multi-month low of 133.58.
Inflation slows down, FOMC meeting
The US Consumer Price Index rose in November by 0.1%, below the 0.3% of market consensus. The annual rate fell from 7.7% to 7.1%, reaching the lowest level in almost a year. Inflation numbers eased expectations about the future path of Fed rate hikes.
Following the numbers the US dollar collapsed across the board and the Japanese Yen soared, boosted by a rally in Treasuries. US bond yields sank with the US 10-year falling from 3.60% to 3.43%. The DXY is falling by 1.15% under 104.00.
On Wednesday, the Federal Reserve will announce its decision on monetary policy. A 50 basis points rate hike is expected. New macroeconomic forecast will be released. Powell will hold a press conference.
USD/JPY looking at the recent low
The sharp decline in USD/JPY damaged significantly the outlook for the Dollar. Price is back under the 200-day Simple Moving Average. Currently is testing the 135.00 area and a break under 134.60 would expose the next support around 134.10. Below attention would turn to the monthly low at 133.60.
Technical levels
-
15:04
United States IBD/TIPP Economic Optimism (MoM) registered at 42.9 above expectations (41.3) in December
-
15:02
Brent Crude Oil to end 2023 at $80 – Deutsche Bank
Brent Crude Oil has moving back into positive territory on a YTD basis. Economists at Deutsche Bank see prices at $80 by the end of the next year.
Supply disruption to temporarily lift Brent to $100 in Q1 2023
“Our bias is to the downside in price beyond the next quarter, as we see 2023 global inventory unchanged from Q4 2022 but higher versus the 2022 average.”
“Although supply disruption temporarily lifts Brent to $100/bbl in Q1 2023, prices resume their decline to Brent $80/bbl at year end of 2023.”
-
14:54
USD/CAD sinks like a stone after US CPI data miss
- The Canadian Dollar is breaking out on the back of a soft US CPI report.
- The bears have eyes on 1.3380 as a possible last defence for a much deeper correction vs. the US Dollar.
The Canadian Dollar, which had already been picking up a bid prior to the North American day, rallied hard on the back of the US Consumer Price Index that missed market expectations to the downside. At the time of writing, USD/CAD is trading at 1.3555, down 0.56% on the day after falling from a high of 1.3644 to a low of 1.3520 so far.
US CPI missed the mark
- US CPI MoM Nov: 0.1% (est 0.3%, prev 0.4%).
- US CPI Ex Food And Energy MoM Nov: 0.2% (est 0.3%, prev 0.3%).
- US CPI YoY Nov: 7.1% (est 7.3%, prev 7.7%).
- US CPI Ex Food And Energy YoY Nov: 6.0% (est 6.1%, prev 6.3%).
The Consumer Price Index has led to the markets pricing the terminal Fed rate down to 4.86% vs 4.98% prior to the report. Consequently, US stocks on Wall Street have opened bid in the cash market with the NASDAQ jumping over 400 points and rallying over 3.3%. The Canadian Dollar is risk-sensitive, belonging to the commodity complex, and the prospects of a pivot at the Fed are fuelling the bid with the CRB index up some 1% on the data.
USD/CAD technical analysis

The Canadian Dollar is breaking out and while below 1.3560, the bears will have their eyes set on 1.3380 as a possible last defence for a much deeper correction vs. the US Dollar.
-
14:46
GBP/USD rallied to a new six-month high at around 1.2440s after a soft US CPI report
- US Core Consumer Price Index hits the 6% threshold, weakening the US Dollar.
- The Pound Sterling hit a fresh six-month high at around 1.2442 following the release of US inflation.
- GBP/USD: Break above 1.2450 could pave the way to 1.2500; otherwise, it could fall to 1.2350.
The GBP/USD soared sharply following the release of a softer-than-expected inflation report in the United States (US) reported by the Bureau of Labor Statistics (BLS) on Tuesday. On the release, the US Dollar (USD) continues to weaken as traders speculate that the Federal Reserve (Fed) might turn less “hawkish” than expected on Wednesday’s FOMC meeting. At the time of writing, the GBP/USD is trading at 1.2420.
In the release, the GBP/USD broke to levels last seen in June 2022, hitting a fresh six-month high at around 1.2442, though it remains volatile in the aftermath of the release of the Consumer Price Index (CPI).
The BLS revealed that the headline CPI increased 0.1% MoM from the previous month and, on an annual based, ticked lower to 7.1% vs. estimates of 7.3%. Although general inflation continued its downtrend since peaking In June at 9.1%, the so-called core CPI it’s the spotlight, as it suddenly turned north in September. However, November’s data showed inflation is easing, with core CPI at 6%, below the 6.3% consensus.
That said, money market futures have priced in that the Federal Funds rate (FFR) would likely peak at around 5%, with traders expecting the first rate cut of 20 bps at around September 2023, as shown by Eurodollar futures. In the meantime, the US Dollar Index tumbled sharply to six-month lows around 103.586 before trimming some of its losses, closing into the 103.900 mark.
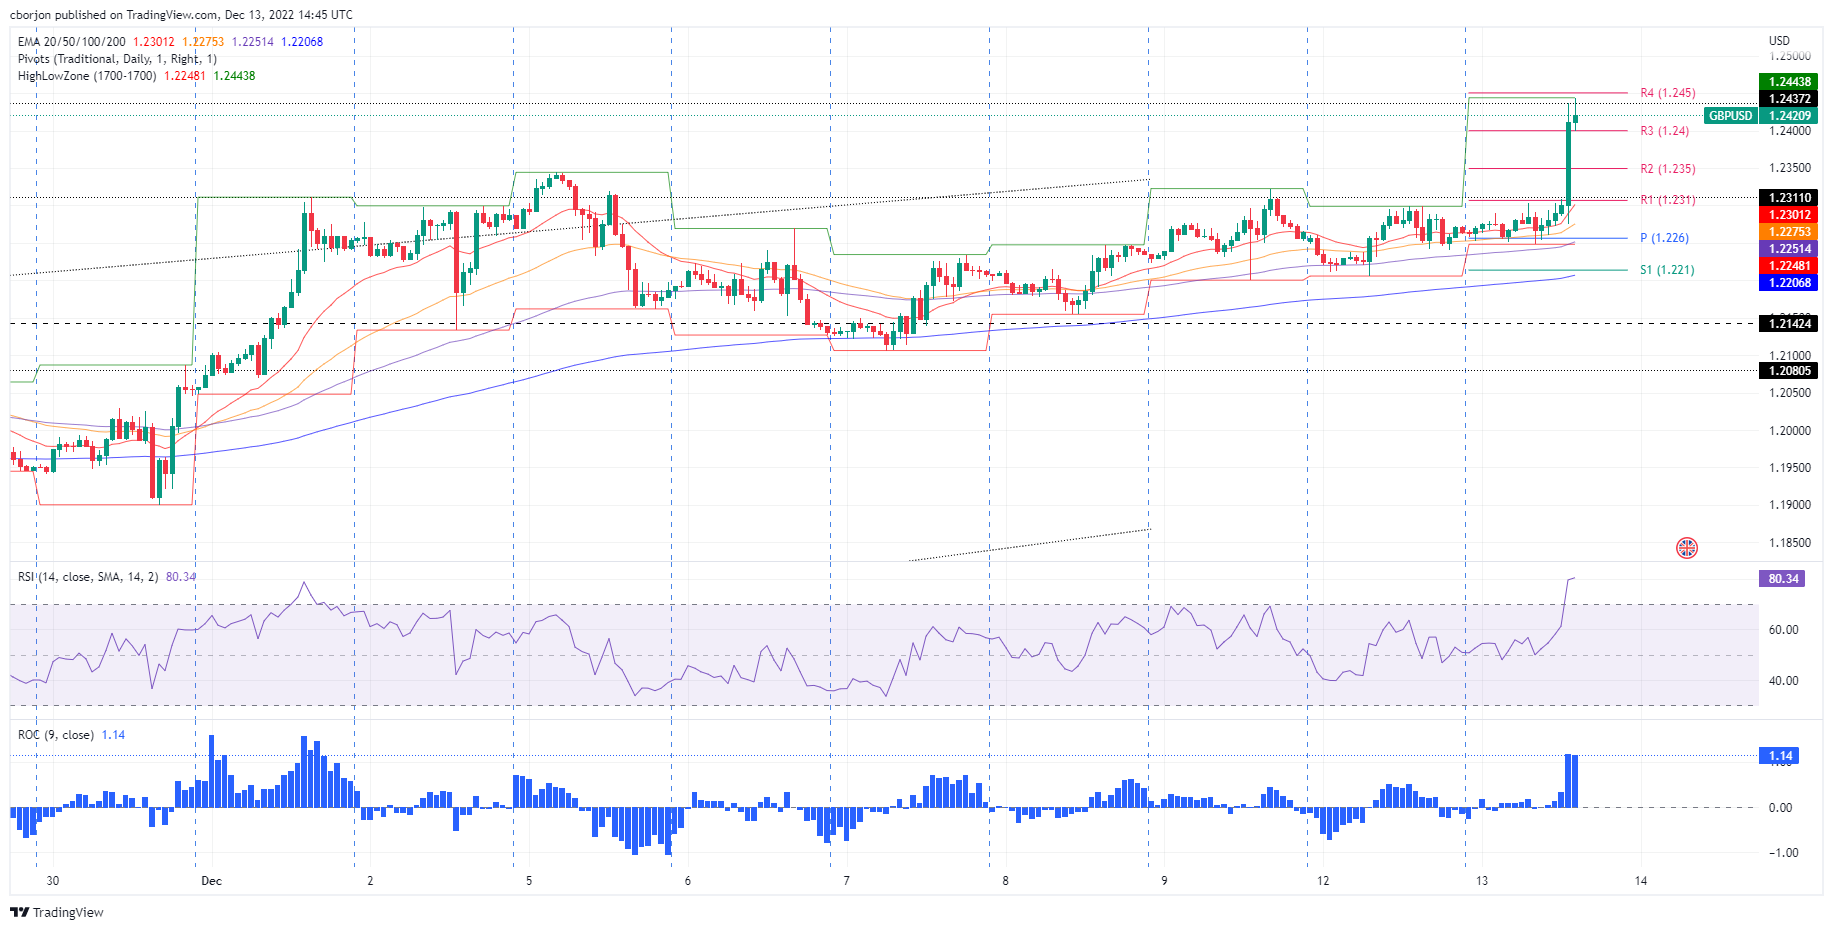
GBP/USD Reaction to US CPI report
The GBO/USD one-hour chart suggests the pair is still upward biased, as shown by the Relative Strength Index (RSI) aiming higher, while the Rate of Change (RoC) so far failed to follow the lead of the former. Since then, the GBP/USD has hit the R4 daily pivot and is hoovering around the R3 daily pivot point at 1.2400 and the R4 pivot level. Therefore, the breach of the R4 pivot level could pave the way toward 1.2500. Otherwise, a fall below 1.2400 could open the door towards the R2 pivot at 1.2350, followed by 1.2310.
-
14:18
Fed: 50 bps are practically a done deal after US inflation confirms downtrend – Commerzbank
US consumer prices rose by only 0.1% in November. The easing of inflationary pressure is likely to prompt the Fed to slow the pace of interest rate hikes, economists at Commerzbank report.
US inflation continued its downward trend in November
“US consumer prices rose by 0.1% in November compared with October. This was below expectations. Excluding energy and food, the increase was 0.2%, also less than forecast. The YoY rate of the CPI covering all goods, which had stood at 9.1% in June, fell to 7.1%, and that of the index excluding energy and food from 6.3% to 6.0%.”
“The 50 basis points hike, which is generally expected for tomorrow's FOMC meeting, can be considered almost certain after today's data.”
“We continue to assume that the Fed will reduce the size of the rate hikes again at the beginning of 2023, moving by only 25 bps in February and March.”
-
14:10
EUR/HUF to see a gradual drift lower below 400 next year – ING
The EUR/HUF cross rate continues its volatile path. Economists at ING expect the pair to see a gradual turn lower below 400 in 2023.
HUF to be moved by non-monetary events and shocks in the short run
“We believe the Hungarian Forint is more likely to be moved by non-monetary events and shocks in the short run. The government's conflict with the EU over the rule of law will remain a major issue at least until the end of this year. We expect a positive outcome on the rule of law issue and an unlocking of the potential of the Forint.”
“As some form of positive outcome of this story seems to be priced in already, and also market positioning seems to have flipped to a slightly longer view in recent weeks, the EU story has become asymmetric for the HUF.”
“Instead of a jump in Forint strength, we expect a gradual drift lower below 400 EUR/HUF next year. However, our strong conviction regarding a positive outcome for Hungary makes the Forint our currency of choice in the CEE4 space.”
-
14:09
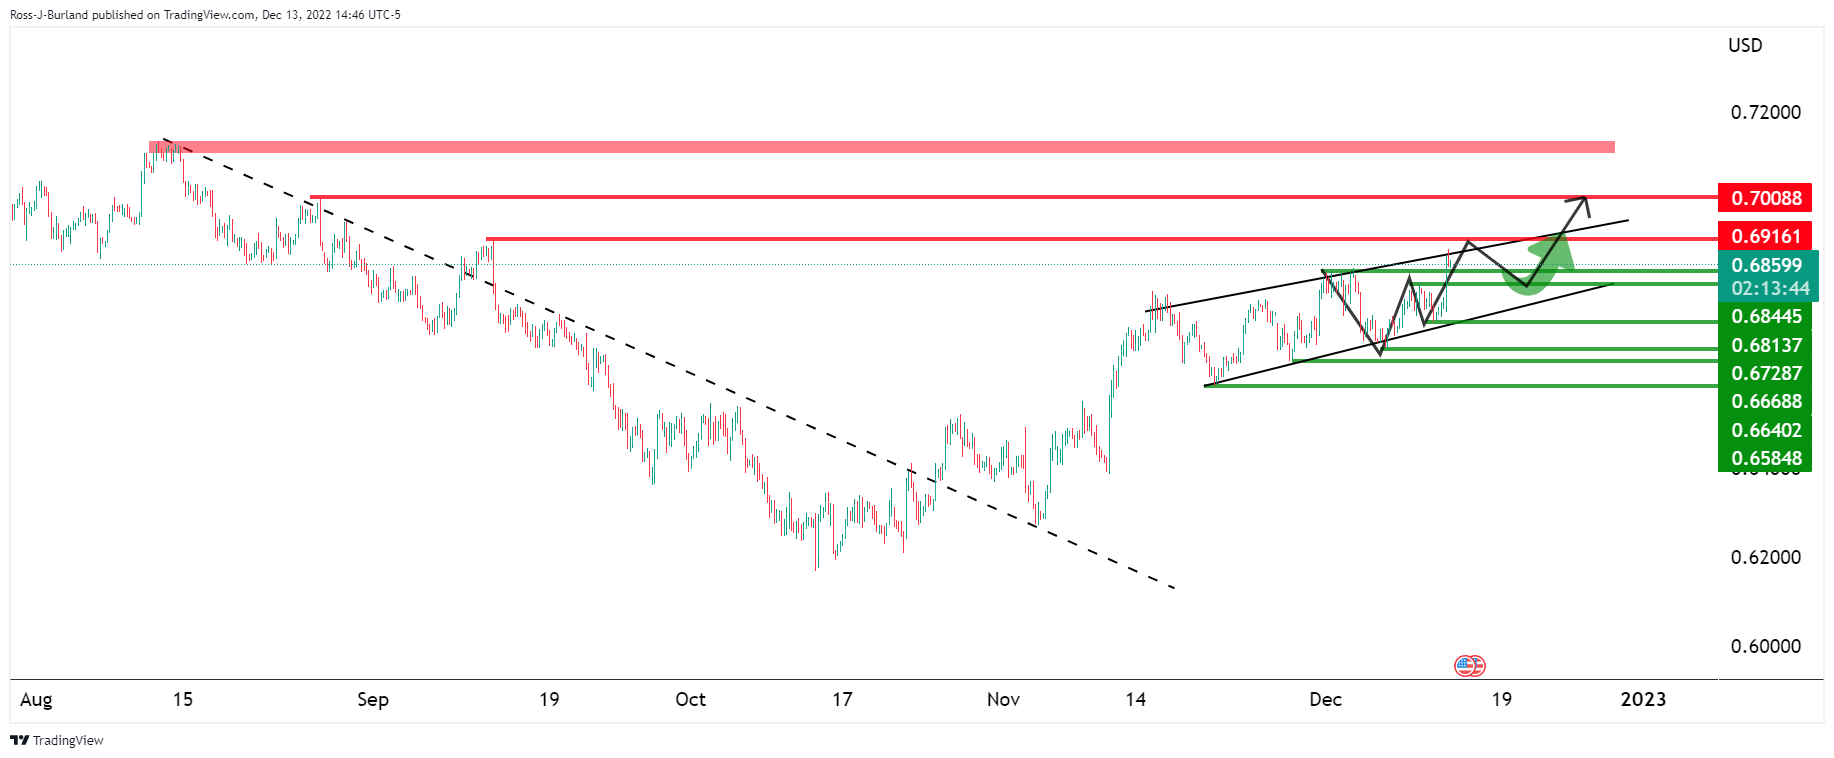
AUD/USD leaps towards channel resistance on soft US CPI
- AUD/USD jumps as risk appetite soars on softer than-expected US Consumer Price Index.
- AUD/USD bulls 0.7000 for the days/weeks ahead as Fed pivot is priced in further.
Risk appetite has been supported on the back of the US Consumer Price Index coming in softer than expected, fuelling the prospects of a pivot at the Federal Reserve. AUD/USD has subsequently got a boost from a weaker US Dollar that is tumbling on Wall Street as US equities soar.
AUD/USD is currently 1.7% higher, breaking prior bull cycle highs near 0.6844 and has printed a fresh high of 0.6877 so far on the day. following the data that arrived as follows:
US CPI below expectations
- US CPI MoM Nov: 0.1% (est 0.3%, prev 0.4%).
- US CPI Ex Food And Energy M/M Nov: 0.2% (est 0.3%, prev 0.3%).
- US CPI YoY Nov: 7.1% (est 7.3%, prev 7.7%).
- US CPI Ex Food And Energy Y/Y Nov: 6.0% (est 6.1%, prev 6.3%).
As a consequence of the Consumer Price Index, the terminal Fed rate is now down to 4.86% vs 4.98% prior to the report. US stocks on Wall Street are considerably higher with the NAS100 already trading around 500 points up on the day before the cash open.
As a consequence of the Consumer Price Index, the terminal Fed rate is now down to 4.86% vs 4.98% prior to the report which is weighing heavily on the US Dollar and US Treasury yields. DXY, an index that measures the US dollar vs. a basket of currencies fell to a low of 103.697 having been as high as 105.095 on the day. The Australian Dollar is highly correlated to US stocks and is riding the positive sentiment into the daily channel resistance as illustrated in the following technical analysis:
AUD/USD technical analysis
AUD/USD is carving out a W-formation which could hamstring the rally en route towards 0.6900. Nevertheless, should 0.6850 hold up on a retest of bullish commitments, then there will be prospects of a run towards 0.7000.
-
13:55
United States Redbook Index (YoY): 5.9% (December 9) vs 5.7%
-
13:51
Gold Price Forecast: XAU/USD rallies to fresh multi-month top on softer US CPI report
- Gold price regains strong positive traction on Tuesday and spikes to a fresh multi-month high.
- The intraday move-up picks up pace following the release of softer consumer inflation figures.
- Bets for less aggressive Federal Reserve drag US Treasury bond yields lower, along with US Dollar.
- The risk-on impulse could cap gains for the safe-haven Gold price ahead of the FOMC meeting.
Gold price catches fresh bids during the early North American session on Tuesday and jumps to a fresh five-month top following the release of the consumer inflation figures from the United States (US). The XAU/USD is currently placed around the $1,810 area and making a fresh attempt to build on its momentum beyond a technically significant 200-day Simple Moving Average.
Consumer inflation figures from United States come in softer than expected
The US Bureau of Labor Statistics reported that the headline Consumer Price Index (CPI) rose a modest 0.1% in November. The reading is well below the 0.3% expected and marks a notable slowdown from the 0.4% increase recorded in the previous month. Furthermore, the yearly rate decelerate from 7.7% in October to 7.1% during the reported month, again falling short of consensus estimates. Furthermore, the core CPI, which excludes food and energy prices, eased to 0.2% in November and fell to 6% on yearly basis from 6.3% in October.
Falling US Treasury bond yields weigh on US Dollar and benefit Gold price
The data reaffirms expectations that the Federal Reserve will slow the pace of its policy tightening and is evident from a fresh leg down in the US Treasury bond yields. This, in turn, drags the US Dollar to its lowest level since late June and turns out to be a key factor providing a strong lift to the Dollar-denominated Gold price. Bulls, however, seem reluctant to place aggressive bets and prefer to wait for more clarity on the Federal Reserve's rate hike path, which will determine the near-term trajectory for the non-yielding yellow metal.
Risk-on mood could cap gains for safe-haven Gold price
Apart from this, the risk-on impulse - as depicted by a strong rally in the US equity futures - further contributes to capping the upside for the safe-haven Gold price. The global risk sentiment remains well supported by the latest optimism over the easing of strict COVID-19 restrictions in China. Heading into the key central bank event risk, this might hold back traders from placing aggressive bullish bets and keep a lid on the XAU/USD. Nevertheless, the fundamental backdrop supports prospects for a further near-term appreciating move.
Gold price technical outlook
From a technical perspective, sustained strength beyond the $1,810-$1,812 horizontal resistance will mark a fresh bullish breakout and add credence to the positive outlook. Gold price might then accelerate the momentum towards the $1,830 intermediate hurdle en route to the next major barrier near the $1,745-$1,750 region.
On the flip side, the $1,800 round figure now seems to act as immediate support ahead of the $1,795-$1,95 area (200 DMA). Any subsequent slide might continue to attract some buyers at lower levels and remain cushioned near the $1,780-$1,777 support zone. The latter should act as a pivotal point, which if broken will set the stage for some meaningful downside for Gold price.
Key levels to watch
-
13:48
EUR/USD soars as US CPI comes in below expectations
- EUR/USD soars on the back of the sentiment for a Fed pivot following soft US Consumer Price Index (CPI).
- US CPI came in below expectations and sent risk assets higher, US Dollar lower.
EUR/USD has rallied heavily as the US Consumer Price Index has come in below expectations, leaving the door wide open for a pivot from the Federal Reserve that meets this week to decide on its monetary policy path. At the time of writing, EUR/USD is up on the day by over 1%, with the bulk of its gains coming in a knee-jerk reaction to the US inflation data as illustrated below.
The Euro reached a high of 1.0648 from 1.0555 off the bat vs. the US Dollar when US CPI printed as follows:
- US CPI MoM Nov: 0.1% (est 0.3%, prev 0.4%).
- US CPI Ex Food And Energy M/M Nov: 0.2% (est 0.3%, prev 0.3%).
- US CPI YoY Nov: 7.1% (est 7.3%, prev 7.7%).
- US CPI Ex Food And Energy Y/Y Nov: 6.0% (est 6.1%, prev 6.3%).
As a consequence of the data, the terminal Fed rate is now down to 4.86% vs 4.98% prior to the report which is weighing heavily on the US Dollar and US Treasury yields. DXY, an index that measures the US dollar vs. a basket of currencies fell to a low of 103.923 having been as high as 105.095 on the day as investors give a sigh of relief with the US benchmarks rallying - The Nasdaq jumped over 500 points.
EUR/USD technical analysis
(EUR/USD 30 min chart, above)
In the above daily chart, the market is on the front side of the bullish trend and there is every possibility that the price will continue higher into the in-the-money shorts towards 1.0800/50 in the days or weeks ahead.
-
13:31
United States Consumer Price Index Core s.a below expectations (300.896) in November: Actual (300.07)
-
13:30
United States Consumer Price Index ex Food & Energy (YoY) came in at 6%, below expectations (6.1%) in November
-
13:30
United States Consumer Price Index (MoM) below expectations (0.3%) in November: Actual (0.1%)
-
13:30
United States Consumer Price Index ex Food & Energy (MoM) came in at 0.2%, below expectations (0.3%) in November
-
13:30
Breaking: US annual CPI inflation declines to 7.1% in November vs. 7.3% expected
The US Bureau of Labor Statistics reported on Tuesday that inflation in the US, as measured by the Consumer Price Index (CPI), declined to 7.1% on a yearly basis in November from 7.7% in October. This reading came in below the market forecast of 7.3%.
Follow our live coverage of the market reaction to US inflation data.
Further details of the publication revealed that the annual Core CPI, which excludes volatile food and energy prices, declined to 6% from 6.3% in October. The monthly Core CPI came in at 0.2%, compared to analysts' estimate of 0.3%.
Market reaction
With the initial reaction, the US Dollar came under heavy selling pressure. The US Dollar Index was last seen trading at its lowest level since late June at 103.95, losing nearly 1% on a daily basis.
-
13:30
United States Consumer Price Index n.s.a (MoM) below expectations (298.045) in November: Actual (297.711)
-
13:30
United States Consumer Price Index (YoY) below expectations (7.3%) in November: Actual (7.1%)
-
13:29
US Dollar' Price Analysis: DXY fate lies in US CPI
The US Dollar is sitting in a technical bundle of key structures that has something for both the bulls and bears ahead of the release of US inflation data and the final Federal Reserve meeting of the year.
Traders are looking for signs of a Fed pivot, i.e., for its policy outlook to change course from its currently contractionary (tight) monetary policy to expansionary (loose).
A Fed pivot typically happens when economic conditions have fundamentally changed in such a way that the Fed can no longer continue its prior policy stance and the US Consumer Price Inflation data is used as a primary gauge in that respect. In fact, the DXY's biggest daily drop and second-largest daily gain in 2022 have come on the back of prior CPI data.
The Fed is widely expected to hike the funds rate by 50 basis points (bp) on Wednesday, after four consecutive 75 bp hikes. If the data comes in hotter than expected, this will be problematic for the Fed eager to slow the pace of tightening and potentially weigh on risk assets and thus lead to a stronger US Dollar.
The headline is expected at 7.3% YoY vs. 7.7% in October, while the core is expected at 6.1% YoY vs. 6.3% in October. Last week, the Producer Price Index came in higher than expected, raising concerns that inflation is likely to prove to be much stickier than the markets are pricing.
DXY technical analysis
The trendline was broken and the bulls are on the back side of it. If the data comes in hot, a move beyond the 50% mean reversion resistance near 1.05.65 could spell an upside correction continuation scenario for the near future. On the flip side, 103.00 will be a key target for the remaining weeks of the year should a Fed pivot be priced in even further.
-
13:14
USD Index: Failure to reclaim 105.80 could lead to one more leg of correction – SocGen
US Dollar is near six-month low. Reclaiming at 105.80 is crucial to highlight short-term bounce, economists at Société Générale report.
Short-term resistance is located at 108.20
“Daily MACD is within deep negative territory pointing towards an overstretched move however failure to reclaim at 105.80 could lead to one more leg of correction towards next support zone at 2017/2020 peaks of 103.80/103.00.”
“Short-term resistance is located at 108.20, the 38.2% retracement of recent down move.”
See: US Dollar to strengthen through the first quarter of 2023 – ING
-
12:54
AUD/USD sticks to gains near daily high, below 0.6800 ahead of the crucial US CPI report
- AUD/USD regains some positive traction on Tuesday amid a modest USD weakness.
- A positive risk tone and softer US bond yields keep the USD bulls on the defensive.
- Traders now look to the US CPI for a fresh impetus ahead of the key FOMC meeting.
The AUD/USD pair attracts fresh buying near the 0.6740-0.6735 region on Tuesday and reverses a major part of the previous day's retracement slide. The pair maintains its bid tone heading into the North American session and is currently placed near the daily peak, around the 0.6780 area.
A combination of factors prompts some selling around the US Dollar, which, in turn, is seen offering support to the AUD/USD pair. Against the backdrop of the uncertainty over the Fed's rate hike path, a softer tone surrounding the US Treasury bond yields keeps the USD bulls on the defensive. Moreover, the easing of COVID-19 curbs in China remains supportive of a generally positive risk tone, which further undermines the safe-haven buck and benefits the risk-sensitive Aussie.
That said, growing worries about a deeper global economic downturn should keep a lid on the risk-on rally in the markets. Traders might also refrain from placing aggressive directional bets ahead of the crucial US consumer inflation figures, due for release a while from now. The data will influence the USD price dynamics ahead of the highly-anticipated FOMC policy decision on Wednesday. This, in turn, will determine the next leg of a directional move for the AUD/USD pair.
Heading into the key data/event risks, the fundamental backdrop warrants some caution for bulls and before positioning for any further intraday appreciating move for the AUD/USD pair. Hence, any subsequent move up is more likely to confront stiff resistance near the 0.6800 mark. That said, some follow-through buying has the potential to lift spot prices back towards the monthly swing high, around the 0.6850 region touched last week.
Technical levels to watch
-
12:52
S&P 500 Index to end 2023 at 4500 – Deutsche Bank
S&P 500 Index has rallied 17% from its mid-October low. Economists at Deutsche Bank analyze how the equity index could evolve next year.
Current bear market rally to continue into Q1
“In the short-term we see the current bear market rally continuing into Q1.”
“As the recession begins in Q3, the S&P 500 to bottom at 3250, before recovering into year-end.”
“A year-end 2023 target of 4500 for the S&P 500.”
See: Lasting rise in equity markets no sooner than the first half of 2023 – Natixis
-
12:15
EUR/USD: Hawkish message by the ECB could steer Euro over 1.06 – SocGen
EUR/USD maintains bid tone around 1.05. Hawkish ECB hike and QT plan could spark buying through 1.06, economists at Société Générale report.
200DMA at 1.0350 is near term support
“Optimism of a shallower recession in the euro area and a hawkish message by the ECB on Thursday could steer EUR/USD over 1.06. Next potential hurdle is at the March 2020 low of 1.0630/1.0690.”
“Technically, the return over the 200-Day Moving Average at 1.0350 in mid-November supports the view that the tide has turned.”
“A stronger Euro would lighten the burden on the ECB in its battle against inflation via commodity prices and nonenergy/industrial goods priced in Dollar.”
-
12:13
When is the US consumer inflation (CPI report) and how could it affect EUR/USD?
US CPI Overview
Tuesday's US economic docket highlights the release of the critical US consumer inflation figures for November, scheduled later during the early North American session at 13:30 GMT. On a monthly basis, the headline CPI is anticipated to have risen by 0.3% during the reported month as compared to the 0.4% increase recorded in October. The yearly rate, however, is expected to decelerate to 7.3% in November from the 7.7% previous. Meanwhile, core inflation, which excludes food and energy prices, is projected to remain steady at 0.3% in November and decelerate to 6.1% on yearly basis from 6.3% in October.
Analysts at ANZ offer a brief preview of the key macro data and explain: “We expect US core CPI to rise by 0.4% MoM in November. Goods prices are trending in a disinflationary/deflationary manner, while CPI rent will remain elevated until mid-2023 and should trend lower thereafter. Key to the inflation outlook will be the prices of services excluding rent. As wages are the largest cost in providing these services, watching labour market trends will be important. Wages growth is above levels consistent with 2% inflation as demand for labour outstrips supply. As supply is slow to adjust, the Fed needs to limit demand. The Fed still has more work to do to achieve its price stability mandate.”
How Could it Affect EUR/USD?
A softer-than-expected reading will reinforce market expectations that the Fed will slow the pace of its policy tightening and prompt fresh selling around the US Dollar. This, in turn, should allow the EUR/USD pair to break out of a nearly two-week-old trading range and capitalize on its recent momentum beyond a technically significant 200-day SMA. Conversely, a surprisingly stronger US CPI print could lead to a reevaluation of the Fed's rate-hike path and trigger an aggressive USD short-covering move.
The immediate market reaction, however, is likely to remain limited as investors might prefer to wait for the highly-anticipated FOMC policy decision, scheduled to be announced on Wednesday. Nevertheless, any meaningful divergence from the expected readings should infuse some volatility in the markets and allow traders to grab short-term opportunities around the EUR/USD pair.
Eren Sengezer offers a brief technical outlook for the major and explains: “EUR/USD holds above the 20-period and the 50-period Simple Moving Averages on the four-hour chart. The Relative Strength Index (RSI) indicator on the same chart stays slightly above 50, pointing to a lack of seller interest.”
Eren also outlines important technical levels to trade the EUR/USD pair: “On the upside, 1.0580 (static level) aligns as interim resistance before 1.0600 (psychological level, static level) and 1.0630 (static level from June). Supports are located at 1.0520 (50-period SMA), 1.0500 (psychological level, static level) and 1.0450 (static level).”
Key Notes
• US Inflation Cheat Sheet: Five scenarios for Core CPI and the Dollar's explosive reaction
• US CPI Preview: Forecasts from 10 major banks, inflation appears to have peaked
• EUR/USD edges higher in a familiar range, hovers around mid-1.0500s as traders await US CPI
About the US CPI
The Consumer Price Index released by the US Bureau of Labor Statistics is a measure of price movements by the comparison between the retail prices of a representative shopping basket of goods and services. The purchasing power of the USD is dragged down by inflation. The CPI is a key indicator to measure inflation and changes in purchasing trends. Generally speaking, a high reading is seen as positive (or bullish) for the USD, while a low reading is seen as negative (or Bearish).
-
11:33
Gold Price Forecast: XAU/USD could make a renewed bid for $1,800 on CPI downside suprise – Commerzbank
Gold price grinds higher ahead of the US Consumer Price Index (CPI). Softer-than-expected data could lift XAU/USD to the $1,800 level, strategists at Commerzbank report.
Gold price under the spell of US inflation figures and Fed
“The market now firmly believes that rates will be increased by 50 basis points. The Fed had raised its key rate by 75 bps at each of its previous four meetings. According to the Fed Fund Futures, interest rates are likely to peak at around 5% next May/June.”
“The US inflation data for November could prompt another shift in market expectations and thus affect the short-term performance of the Gold price. In the event of a surprise to the downside, XAU/USD could make a renewed bid for the $1,800 mark after dipping yesterday.”
See – US CPI Preview: Forecasts from 10 major banks, inflation appears to have peaked
-
11:17
GBP/USD could test last week’s high of 1.2345 – SocGen
Sterling stays within touching distance of 1.23 against the Dollar. The GBP/USD pair could test resistance at 1.2345, in the view of analysts at Société Générale.
50 bps priced in for Thursday
“The high of 1.2345 last week is first resistance if equities come through US CPI, Fed, ECB and BoE unscathed. The 30-day correlation with the S&P is 0.6.”
“A dovish split on the MPC at the meeting on Thursday could also backfire for Sterling via higher EUR/GBP. Some members could prefer 75 bps, others 50 bps, others 25 bps and some no change. We are in line with consensus for 50 bps to 3.50%.”
-
11:00
United States NFIB Business Optimism Index registered at 91.9 above expectations (90.4) in November
-
10:46
USD/INR: Resistance at 83.30/83.60 must be overcome for affirming resumption in uptrend – SocGen
USD/INR has rebounded sharply after testing the multi month trend line at 81.00. The pair could extend its race higher on a move above 83.30/60, economists at Société Générale report.
A phase of consolidation is not ruled out
“USD/INR is gradually heading towards the peak formed in October near 83.30/83.60. This remains an important resistance zone and must be overcome for affirming resumption in uptrend. A phase of consolidation is not ruled out.”
“In case the pair breaks recent bullish gap support at 81.90, a retest of the trend line near 81.00/80.50 is likely.”
-
10:34
BOE: Financial pressures on UK companies expected to rise in 2023
In its latest Financial Stability Report, the Bank of England (BOE) said that financial pressures on UK companies, especially for smaller firms, are expected to rise in 2023.
Additional takeaways as summarized by Reuters
"Risk of global debt vulnerabilities crystallising has increased."
"Will monitor UK credit conditions for signs of unwarranted tightening."
"Financial pressure on households will rise in 2023, more resilient than before the global financial crisis."
"Low risk at present of large or rapid fall in foreign investor demand for UK assets."
"Widespread signs of financial difficulty among UK households are yet to emerge."
"Will maintain UK banks' counter-cyclical capital buffer requirement at 2%."
"Financial institutions and investors should take an especially cautious and prudent approach to crypto assets due to lack of regulation."
"Enhanced regulation and law enforcement needed for crypto markets and activities."
Market reaction
GBP/USD largely ignored this publication and was last seen trading at 1.2287, where it was up 0.15% on a daily basis.
-
10:32
United Kingdom 10-y Bond Auction dipped from previous 3.426% to 3.333%
-
10:29
GBP/USD sticks to modest intraday gains, remains below 1.2300 mark ahead of US CPI
- GBP/USD edges higher on Friday and draws support from a combination of factors.
- Stronger UK wage growth data underpins the British Pound and acts as a tailwind.
- Subdued USD demand offers additional support, though the upside remains capped.
- Investors now await the key CPI reports from the US and the UK ahead of the FOMC.
The GBP/USD pair struggles to capitalize on its modest intraday uptick and retreats a few pips from the daily top, around the 1.2300 mark touched during the early European session. The pair is currently placed just above the mid-1.2200s and remains well within a familiar trading range held over the past week or so.
The British Pound gets a minor lift after stronger UK wage growth data revived bets for a supersized 75 bps rate hike by the Bank of England. In fact, the UK Office for National Statistics (ONS) reported that Average Weekly Earnings, excluding bonuses, rose by +6.1% during the three months to October as compared to +5.8% in the previous month. Moreover, the gauge including bonuses edged higher to 6.1% in October from 6.0% in September, suggesting that upward pressure on inflation coming from rising salaries might continue to grow.
This, to a larger extent, helps offset an uptick in the unemployment rate and an unexpected rise in the number of people claiming unemployment-related benefits. Apart from this, subdued US Dollar demand turns out to be another factor offering additional support to the GBP/USD pair. A generally positive mood around the equity markets, bolstered by the optimism over the easing of COVID-19 curbs in China, keeps the USD bulls on the defensive. That said, the uncertainty over the Fed's rate hike path holds back traders from placing aggressive bets.
Market participants seem convinced that the Fed will slow the pace of its policy tightening and have been pricing in a relatively smaller 50 bps lift-off in December. That said, the incoming positive US economic data has been fueling speculations that the Fed might lift rates more than projected. Hence, the focus will remain on the outcome of a two-day FOMC policy meeting, scheduled to be announced on Wednesday. In the meantime, traders will take cues from the latest US consumer inflation figures, due later during the early North American session on Tuesday.
Technical levels to watch
-
10:19
Spain 9-Month Letras Auction climbed from previous 2.363% to 2.366%
-
10:14
Gold Price Forecast: XAU/USD to fall if US Core CPI beat estimates
Gold price is attempting a minor comeback while within a familiar range below the $1,800 mark ahead of the all-important United States Consumer Price Index (CPI) data. FXStreet’s Dhwani Mehta analyzes how the yellow metal could react to inflation figures.
US CPI could impact Federal Reserve’s outcome
“Any upside surprise in the Core CPI data could prompt the Federal Reserve policymakers to revise higher their forecasts for the terminal rate, eventually impacting the US central bank’s Dot Plot chart, which will be announced on Wednesday.”
“Should the US Core Consumer Price Index beat estimates, it could trigger a US Dollar rally alongside the US Treasury bond yields, weighing negatively on the non-interest-bearing Gold price.”
See – US CPI Preview: Forecasts from 10 major banks, inflation appears to have peaked
-
10:06
German ZEW Economic Sentiment Index improves to -23.3 in December vs. -26.4 expected
- Economic sentiment in Germany and the Eurozone continued to improve in December.
- EUR/USD trades flat on the day slightly below 1.0550 after the data.
The German ZEW headline numbers showed that the Economic Sentiment Index improved sharply to -23.3 in December from -36.7 in November, beating the market expectation of -26.4. Furthermore, the Current Situation Index rose to -61.4 from -64.5 but fell short of the market expectation of -57.
In the same period, the ZEW Economic Sentiment Index for the Eurozone rose to -23.6 from -38.7.
Commenting on the data, "the vast majority of financial market experts expect the inflation rate to decline in the coming months," the ZEW Institute said. "Together with the temporary stabilisation on the energy markets, this leads to a significant improvement in the economic outlook."
Market reaction
The EUR/USD pair edged slightly lower with the initial reaction to this report and was last seen trading virtually unchanged on the day at 1.0535.
-
10:03
European Monetary Union ZEW Survey – Economic Sentiment came in at -23.6, above forecasts (-25.7) in December
-
10:00
Germany ZEW Survey – Current Situation below expectations (-57) in December: Actual (-61.4)
-
10:00
Germany ZEW Survey – Economic Sentiment came in at -23.3, above forecasts (-26.4) in December
-
09:57
US Dollar to strengthen through the first quarter of 2023 – ING
Today's US inflation report will set the Dollar tone for tomorrow's FOMC meeting and into the first quarter of 2023. Economists at ING expect the greenback to strengthen into the first quarter of next year.
Plenty to play for over the next 36 hours
“We think the market is being a little early in pricing 50 bps of rate cuts for 2H23 and could see the Dollar bouncing on any upside surprise in today's CPI data – including upward revisions to last month's reading. The data probably will not be a knock-out blow to the Dollar – one way or the other – given tomorrow's big FOMC meeting including a new set of Dot Plots.”
“A DXY close above its 200-Day Moving Average at 105.80 would be helpful in supporting our view that the Dollar will be strengthening through 1Q23.”
See – US CPI Preview: Forecasts from 10 major banks, inflation appears to have peaked
-
09:51
Spain 3-Month Letras Auction rose from previous 1.369% to 1.617%
-
09:31
South Africa Business Confidence Index: 109.4 (October) vs previous 110.9
-
09:30
South Africa Business Confidence Index remains unchanged at 110.9 in November
-
09:30
South Africa Business Confidence Index unchanged at 110.9 in October
-
09:27
EUR/USD could drift up to 1.08 and even 1.0950/1.1000 on a close above 1.0600/10610 – ING
EUR/USD failed to make a decisive move in either direction and closed the day flat. Economists at ING highlight two key technical levels to watch.
200-Day Moving Average is now at 1.0350
“If we were to pick out two levels, we would say the 1.0600/10610 area is key resistance. A close above that on a soft US CPI release would warn of a lot more pain into year-end and EUR/USD drifting up to 1.08 and even 1.0950/1.1000.”
“On the downside, the 200-Day Moving Average is now 1.0350 and would be a level any investors trapped long Dollars at higher levels might choose to offload some Dollars.”
-
09:25
USD/CAD slides to 1.3600 neighbourhood amid positive oil prices, modest USD downtick
- USD/CAD meets with some supply on Tuesday and is pressured by a combination of factors.
- A further recovery in oil prices underpins the Loonie and exerts pressure amid a softer USD.
- The downside seems limited as traders look to the US CPI for a fresh impetus ahead of FOMC.
The USD/CAD pair comes under some selling pressure during the first half of the European session and drops to a fresh daily low, around the 1.3600 mark in the last hour.
Crude oil prices build on the previous day's bounce from the vicinity of the YTD low and scale higher for the second straight session on Tuesday. This, in turn, is seen underpinning the commodity-linked Loonie, which, along with a modest US Dollar downtick, exerts some downward pressure on the USD/CAD pair.
The optimism over the easing of COVID-19 curbs in China remains supportive of the recent recovery in the risk sentiment and continues to weigh on the safe-haven buck. Furthermore, the uncertainty over the Fed's rate hike path acts as a headwind for the US Treasury bond yields and keeps the USD bulls on the defensive.
Traders, however, might refrain from placing aggressive bets ahead of the latest US consumer inflation figures, due for release later during the early North American session. The crucial US CPI report will play a key role in influencing the Fed's policy outlook and help determine the near-term trajectory for the greenback.
The focus will then shift to the outcome of a two-day FOMC monetary policy meeting, scheduled to be announced on Wednesday amid the uncertainty over the US central bank's rate hike path. This makes it prudent to wait for some follow-through selling before positioning for any further depreciating move for the USD/CAD pair.
Technical levels to watch
-
09:00
USD/ZAR: Current levels near 17.50 may not last for long – ING
Outside of the Russian Rouble, the Rand is the worst EMEA FX performer since 10 November. Economists at ING do not expect the USD/ZAR pair to trade at current levels near 17.50 for long.
President Ramaphosa faces proxy impeachment vote
“President Cyril Ramaphosa has been caught up in a scandal, whereby an independent panel has concluded he might have violated the constitution in the way he handled the investigation into the theft of cash at his property. The findings of that panel will today be put to a vote in the South African parliament – seen as a proxy impeachment vote for Ramaphosa.”
“We would have thought the rand would be trading a lot stronger were it not for this vote. But equally, if the vote goes through, USD/ZAR could easily be trading over 18.00 in thin December markets. In short, current levels near 17.50 may not last for long.”
-
09:00
Italy Industrial Output w.d.a (YoY) below forecasts (-0.1%) in October: Actual (-1.6%)
-
09:00
Italy Industrial Output s.a. (MoM) registered at -1%, below expectations (-0.4%) in October
-
08:44
NZD/USD steadily climbs back above 0.6400 mark, focus remains on US CPI ahead of FOMC
- NZD/USD regains some positive traction on Tuesday amid a modest USD downtick.
- A positive risk tone and softer US bond yields keep the USD bulls on the defensive.
- The upside seems capped ahead of the US CPI on Tuesday and FOMC on Wednesday.
The NZD/USD pair catches fresh bids on Tuesday and steadily climbs back above the 0.6400 mark during the early part of the European session.
A combination of factors attracts some selling around the US Dollar, which, in turn, is seen lending support to the NZD/USD pair. The optimism over the easing of COVID-19 curbs in China remains supportive of the recent recovery in the risk sentiment. Furthermore, the uncertainty over the Fed's rate hike path acts as a headwind for the US Treasury bond yields and keeps the USD bulls on the defensive.
The upside for the NZD/USD pair, meanwhile, is likely to remain limited as traders might refrain from placing aggressive bets ahead of this week's key data/event risks from the US. The crucial US consumer inflation figures for November are due for release later during the North American session. The focus, however, will remain glued to the outcome of a two-day FOMC monetary policy meeting on Wednesday.
Market participants seem convinced that the Fed will slow the pace of its rate-hiking cycle and expect a relatively smaller 50 bps lift-off. That said, the incoming positive US macro data has been fueling speculations that the US central bank may raise rates more than projected. Hence, investors will seek clarity on the Fed's policy outlook, which should influence the near-term USD price dynamics.
Heading into the key data/central bank event risks, the fundamental backdrop warrants caution before positioning for a further appreciating move. Even from a technical perspective, the 0.6420-0.6425 area seems to have emerged as an immediate barrier. This is closely followed by the 0.6440-0.64450 region, or the highest level since mid-August, which should act as a pivotal point for the NZD/USD pair.
Technical levels to watch
-
08:34
GBP/USD: UK jobs data could light the fuse of a Cable rally – ING
Stronger UK wage growth figures anticipate positive for Sterling. The GBP/USD could surpass the 1.2300/10 area, economists at ING report.
Better jobs data gives the BoE a headache
“The November payroll increased more than double what was expected and the weekly earnings rate ex-bonus nudged up to 6.1% 3m/YoY, the highest in a year. This adds to thoughts of a full employment recession and supports some of the more hawkish pricing of the Bank of England (BoE) policy cycle. It is probably not enough to prompt the BoE into another 75 bps hike on Thursday but will support Sterling.”
“Today's UK data could light the fuse of a Cable rally, were US CPI data to oblige.”
“Our prior has been that this rally stalls around this 1.2300/2310 area – but a close above here warns of another three to four big figures higher during thin, year-end markets.”
-
08:29
Swiss government sees economic slowdown in 2023 but no recession
In its latest economic forecasts, Switzerland’s State Secretariat for Economic Affairs (SECO) said on Tuesday, the government expects the country's economic growth to slow next year but is unlikely to enter a recession.
Key takeaways
However, the energy situation in Europe is likely to remain tense with gas and electricity prices running high.
Furthermore, high international inflation and the tightening of monetary policy are likely to curb demand.
Swiss government forecasts 2022 CPI at +2.9% (vs +3.0% in prior projections).
The Swiss government anticipates that the Consumer Price Index will +1.5% in 2024.
Swiss government sees 2024 CPI at +1.5%. Sees 2023 CPI at +2.2% (previous forecast was +2.3%).
2022 GDP growth forecast at +2.0% (previously +2.0%).
2023 GDP growth forecast at +1.0% (previously +1.1%).
2024 GDP growth forecast at +1.6%.
-
08:16
EUR/CZK: Inflation not falling in 2023 as expected with CNB rejecting rate hikes to hit Koruna – Commerzbank
The litmus test for the Czech central bank's (CNB) credibility and thus the CZK will follow next year. Higher-than-expected inflation alongside the bank rejecting rate hikes would weigh on the Koruna, economists at Commerzbank report.
CNB to leave the key rate unchanged at 7% next week
“The bank is likely to be confident to leave the key rate unchanged at 7% next week, despite a continued rise in prices that was recorded regardless of levels being dampened by the government’s support measures towards energy costs for private households.”
“If inflation does not fall as expected so that real interest rates will become less negative, the CNB will have to decide whether it has to take renewed action and hike the key rate again, a step it has avoided since the last rate hike in June.”
“If inflation were not to fall in 2023 as expected by the CNB with the bank rejecting rate hikes at the same time that would be bad for the central bank’s credibility and CZK.”
-
07:51
NZD/USD see whippy price action ahead of US CPI – ANZ
NZD/USD slipped below the 0.64 mark. Economists at ANZ Bank expect a degree of treading water ahead of US Consumer Price Index (CPI) data.
It makes sense to brace for volatility
“Today is likely to see similar whippy price action ahead of US CPI, which is the first big event of the week. This will be the final data point ahead of Thursday’s Fed meeting, which we think will be hawkish and arguably poses the greatest risk to the Kiwi (in terms of its potential to drive an upside correction in the USD DXY).”
“We think it makes sense to brace for volatility.”
See – US CPI Preview: Forecasts from 10 major banks, inflation appears to have peaked
-
07:43
No new momentum for USD amid easing inflation – Commerzbank
The US Consumer Price Index is slated for release at 13:30 GMT. Will inflation data move the Dollar? Economists at Commerzbank believe that the report is unlikely to inject new momentum into the US Dollar.
If inflation still were to stand at 7% in six months’ time that would be worrying
“A fall from approx. 9% around the middle of the year to 7% is generally expected for the November data. If inflation still were to stand at 7% in six months’ time that would indeed be worrying. Today, a similar result is unlikely to cause much concern though.”
“It would probably be critical if the data were to show a surprise rise in inflation. It is by no means trivial how the USD would react to higher inflation data. It might be able to appreciate once again if the market were to expect stronger rate hikes. I can also imagine though that the Dollar would depreciate if doubts arise whether the central bank will be able to control inflation at all.”
“The most likely scenario is that inflation has fallen further in November and that as a result there will be no new momentum for the US Dollar.”
See – US CPI Preview: Forecasts from 10 major banks, inflation appears to have peaked
-
07:42
GBP/JPY hits fresh multi-week high on stronger UK wage growth data, lacks follow-through
- GBP/JPY touches a five-month high on Tuesday, albeit lacks follow-through buying.
- A generally positive risk tone undermines the safe-haven JPY and remains supportive.
- The mixed UK jobs data fails to impress bulls or provide a fresh impetus to the cross.
- Traders also seem reluctant ahead of the UK CPI report and the BoE meeting this week.
The GBP/JPY cross edges higher for the fifth successive day and climbs to a five-week high, around the 169.25 region during the early European session.
A generally positive risk tone, bolstered by the easing of COVID-19 curbs in China, continues to weigh on the safe-haven Japanese Yen and acts as a tailwind for the GBP/JPY cross. The British Pound, on the other hand, draws support from stronger UK wage growth figures, which suggests that the Bank of England will continue to raise borrowing costs to combat stubbornly high inflation.
The UK Office for National Statistics (ONS) reported that Average Weekly Earnings, excluding bonuses, rose by +6.1% during the three months to October as compared to +5.8% in the previous month. The gauge including bonuses edged higher to 6.1% in October from 6.0% in September. This helps offset an uptick in the unemployment rate and an unexpected rise in the claimant count change.
That said, a bleak outlook for the UK economy acts as a headwind for the Sterling Pound and keeps a lid on any further gains for the GBP/JPY cross. In fact, British Finance Minster Jeremy Hunt told BBC News on Monday that the UK economy is likely to get worse before it gets better. Traders also seem reluctant to place aggressive bets ahead of this week's key data/central bank event risk.
The latest UK consumer inflation figures are due for release on Wednesday. This will be followed by the Bank of England meeting on Thursday. This, in turn, warrants some caution for bullish traders and positioning for any further appreciating move for the GBP/JPY cross. The fundamental backdrop, however, suggests that any meaningful dip might be seen as a buying opportunity and remain limited.
Technical levels to watch
-
07:36
FX option expiries for Dec 13 NY cut
FX option expiries for Dec 13 NY cut at 10:00 Eastern Time, via DTCC, can be found below.
- EUR/USD: EUR amounts
- 1.0400 308m
- 1.0420-25 243m
- 1.0450 670m
- 1.0500 667m
- 1.0525 736m
- 1.0550-55 812m
- 1.0600 345m
- 1.0610-15 316m
- 1.0700 353m
- USD/JPY: USD amounts
- 138.45 345m
- USD/CHF: USD amounts
- 0.9375 230m
- AUD/USD: AUD amounts
- 0.6750 613m
- 0.6800 710m
- USD/CAD: USD amounts
- 1.3500 308m
- 1.3700 336m
- NZD/USD: NZD amounts
- 0.6300 306m
- EUR/GBP: EUR amounts
- 0.8750 405m
- EUR/JPY: EUR amounts
- 142.00 560m
- 144.00 694m
-
07:33
US CPI Preview: Forecasts from 10 major banks, inflation appears to have peaked
The US Bureau of Labor Statistics will release the Consumer Price Index (CPI) figures for November on Tuesday, December 13 at 13:30 GMT and as we get closer to the release time, here are the forecasts by the economists and researchers of 10 major banks regarding the upcoming US inflation print.
Annual CPI in the US is forecast to decline to 7.3% in November while Core CPI is expected to edge lower to 6.1% from 6.3%. On a monthly basis, the Core CPI is projected to match October’s print of 0.3%.
ANZ
“We expect US core CPI to rise by 0.4% MoM in November. Goods prices are trending in a disinflationary/deflationary manner, while CPI rent will remain elevated until mid-2023 and should trend lower thereafter. Key to the inflation outlook will be the prices of services excluding rent. As wages are the largest cost in providing these services, watching labour market trends will be important. Wages growth is above levels consistent with 2% inflation as demand for labour outstrips supply. As supply is slow to adjust, the Fed needs to limit demand. The Fed still has more work to do to achieve its price stability mandate.”
Commerzbank
“The surprisingly sharp drop in the inflation rate fueled hopes that the inflation peak had passed. In fact, we expect a further slowdown in November. The small 0.2% increase in consumer prices from October that we forecast would mean that the YoY rate would fall from 7.7% to 7.2%, moving further away from the high for the year of 9.1% in June. In this context, we assume that gasoline prices fell by just under 2%. Other energy sources such as natural gas and electricity are also likely to have become cheaper. We expect food prices to rise by only 0.5% MoM, after 0.6% in October and rates of 1% in the summer. Price rises for other goods are also down significantly. Only in services (excluding energy and food) is inflationary pressure still increasing. This is mainly due to rents. Thus, the core inflation rate, which excludes energy and food prices, is falling only slowly - probably from 6.3% to 6.1% in November. We reiterate our view that the noticeable decline in the US inflation rate, which is likely to continue next year, should not obscure the fact that the fundamental inflation problem is not being solved. We consider a sustained return to 2% inflation to be unlikely.”
TDS
“We expect November headline CPI to have increased 0.2% MoM, a downshift from 0.4% in October, and for core CPI to have moved up a still strong 0.3% MoM, similar to October. Shelter inflation likely remained the key wildcard, though we look for goods deflation to act again as an offset. Importantly, gas prices are expected to provide relief to the CPI, as they fell in Nov. All told, our MoM forecasts imply 7.3%/6.1% YoY for total/core prices.”
RBC Economics
“A drop in gasoline prices in November has likely sent US inflation growth lower. We expect the US CPI reading to come in at 7.4%. That’s down from 7.7% in October and a 9.0% peak in June. Food inflation was still likely running almost 11% YoY. But a decline in commodity prices means that measure has finally started to turn a corner. Excluding more volatile food and energy products, we expect core CPI held flat on yearly basis at 6.3% while accelerating on monthly basis following a surprise decrease in October. A 0.5% rise in November core prices from October will match the average monthly change this year. But that’s still double the average pre-pandemic pace. Much of that strength continues to reflect surging rent prices from a year ago as higher market asking rents flow through to the CPI rent index. An easing in current market rent prices means those CPI increases will slow in the year ahead.”
NBF
“The food component likely remained strong, but this increase should have been compensated in part by lower gasoline prices. As a result, headline prices could have increased by 0.3% MoM. If we’re right, the YoY rate should come down from 7.7% to 7.3%. the core index, meanwhile, may have continued to be supported by rising rent prices and advanced 0.3% on a monthly basis. This would translate into a three-tick decline of the 12-month rate to 6.0%.”
SocGen
“We look for a gain of 0.3% MoM in both the headline and the core CPI in November. Energy prices should decline, but that should be offset by rising food prices. We expect used auto prices to continue to fall in November and for many months to come. A further slowing in the YoY trend is expected.”
Deutsche Bank
“We expect a softer print than consensus with +0.21% unrounded on headline (vs. +0.44% previously and +0.3% consensus) and +0.29% on core (vs. +0.27%, +0.3% consensus). This would leave headline dropping from 7.7% to 7.2% (7.3% consensus) and from 6.3% to 6.1% for core. So a big day for financial markets.”
CIBC
“Oil prices eased off on demand fears in November, translating into relief on gasoline prices for consumers. However, with food inflation still elevated, total monthly price pressures likely decelerated by only a tick, to 0.3%. That would also include pressure in core (excluding food and energy) categories, as strong demand for services, and continued increases in the shelter components, likely offset any relief in core goods prices on improvements in supply chains. Overall, core monthly prices likely maintained a 0.3% pace in November, which is still too fast to achieve a 2% annual pace of inflation. We are in line with the consensus and market reaction should therefore be limited.”
Citibank
“US CPI MoM – Citi: 0.2%, prior: 0.4%; CPI YoY – Citi: 7.2%, prior: 7.7%; CPI ex Food, Energy MoM – Citi: 0.3%, prior: 0.3%; CPI ex Food, Energy YoY – Citi: 6.0%, prior: 6.3%. We expect US core CPI to rise 0.3% MoM (0.29% unrounded) in November, marking the first consecutive sub-0.5% monthly increase in core CPI since September 2021. While the overall pace of core inflation should appear relatively softer in November, weakness, for now, should largely be concentrated in goods prices which could stabilize in 2023 that may also lead to slowing shelter prices.”
Wells Fargo
“We expect to see that inflation in November decelerated to a 0.2% MoM gain, translating to a 7.2% YoY pace. Food prices, at the grocery store and at restaurants, likely continued to rise at a strong monthly pace. However, a decline in energy prices and used car prices look to have dampened the overall gain in price level. Stripping out food and energy, we expect core CPI rose 0.4% in November, still too high, but at least decelerating on a three-month annualized basis. We expect the decelerating trend in inflation to signal that the Fed's rate hikes are working, but for the overall pace to illustrate that the job is not yet done.”
-
07:30
Forex Today: Investors on edge as focus shifts to US CPI
Here is what you need to know on Tuesday, December 13:
Following Monday's choppy action, financial markets remain cautious early Tuesday as the focus shifts to November Consumer Price Index (CPI) data from the US. The US Dollar Index stays quiet below 105.00 and the 10-year US Treasury bond yield moves sideways at around 3.6% after having registered modest gains on Monday. Ahead of the US inflation report, ZEW sentiment data for Germany and the Eurozone will also be looked upon for fresh impetus. Meanwhile, US stock index futures trade flat in the European morning.
US Inflation Cheat Sheet: Five scenarios for Core CPI and the Dollar's explosive reaction.
The data published by the UK's Office for National Statistics revealed earlier in the day that the ILO Unemployment Rate edged higher to 3.7% as expected in three months to October from 3.6% previously. The Average Earnings Including Bonus rose by 6.1% in the same period, compared to the market expectation of 6.2%. These figures, however, failed to trigger a noticeable market reaction and GBP/USD was last seen clinging to modest daily gains while trading at around 1.2300.
During the Asian trading hours, the National Australia Bank reported that the Business Conditions Index declined to 20 in November from 22 in October and the Business Confidence Index worsened to -4 from 0, missing analysts' estimate of 5 by a wide margin. AUD/USD declined below 0.6750 after the data but managed to stage a rebound toward 0.6770 in the early European session.
EUR/USD failed to make a decisive move in either direction and closed the day flat. The pair edged higher early Tuesday and trades in positive territory near 1.0550. Germany's Destatis reported that the annual CPI stood at 10% in November, matching the flash estimate and the market expectations.
USD/JPY took advantage of rising US T-bond yields on Tuesday and registered its highest daily close in nearly two weeks at 137.66. The pair was last seen moving up and down in a tight range near that level. On Wednesday, Machinery Orders and Tankan Large Manufacturing Index data will be featured in the Japanese economic calendar.
With the 10-year US T-bond yield gaining nearly 1% on Monday, Gold price turned south and dropped below $1,780. XAU/USD managed to regain its traction early Tuesday and started to edge higher toward $1,790.
US November CPI Preview: Gold is the asset to watch.
Bitcoin closed modestly higher on Monday but failed to gather bullish momentum. BTC/USD declines toward $17,000 early Tuesday. Ethereum is losing more than 1% so fat on the day, trading near $1,250.
Samuel Bankman-Fried arrested, charged by the US Government with money laundering, wire and securities fraud.
-
07:09
China plans over $143 billion package to boost domestic chips, compete with US – Reuters
Citing three sources, Reuters reported on Tuesday, China plans to allocate more than CNY1 trillion ($143 billion) as a support package to boost its domestic semiconductor industry.
Additional takeaways
"China plans to roll out a support package as soon as the first quarter of 2023, and over five years mainly as subsidies and tax credits."
"The majority of financial assistance will be used to subsidize purchases of domestic semiconductor equipment by Chinese firms."
On Monday, China’s Commerce Ministry filed a dispute with the World Trade Organization (WTO) after the US Department of Commerce introduced sanctions in early October to make it harder for China to buy or develop advanced semiconductors.
Market reaction
These headlines add to the improved market mood, with AUD/USD holding higher ground near 0.6770 while the US S&P 500 futures are up 0.10% on the day.
-
07:08
GBP/USD pierces 1.2300 despite mixed UK jobs report, BOE’s Bailey, US inflation eyed
- GBP/USD picks up bids to reverse early-day losses, prints five-day uptrend.
- UK Claimant Count Change increased in November, Unemployment Rate rose during three months to October.
- Market’s cautious optimism, mixed signals surrounding US inflation weigh on the US Treasury yields, US Dollar.
- US CPI, speech from BOE Governor Bailey will be crucial for clear directions.
GBP/USD prints mild gains while picking up bids to refresh intraday high during the five-day uptrend to early Tuesday morning in the UK. That said, the Cable pair buyers attack 1.2300 round figure, up 0.20% intraday near 1.2280 heading into Tuesday’s London open, despite mixed employment data.
As per the latest jobs report from the UK’s Office for National Statistics (ONS), the monthly Claimant Count Change marked a positive surprise of 30.5K in November versus -13.3K expected and -6.4K prior. Further, the Unemployment Rate matched 3.7% market forecast during the three months to October. It should be noted that the upbeat average earnings seemed to have favored the GBP/USD buyers.
Also read: UK ILO Unemployment Rate rose to 3.7% in October vs. 3.7% expected
It’s worth noting that the US Dollar began the day’s trading on the positive side but failed to defend the gains afterward. The reason could be linked to the downbeat US Treasury bond yields amid hopes of softer US inflation data. That said, a slump in the one-year inflation precursor from the New York Federal Reserve joins the softer US Producer Price Index (PPI) for November to bolster the hopes of downbeat US Consumer Price Index (CPI), which in turn tests hawkish Fed bets and propel the GBP/USD prices.
That said, the US CPI, expected 7.3% YoY, versus 7.7% prior figure, will be crucial for near-term directions. It should be noted that the CPI ex Food & Energy appears to be the key and is expected to be unchanged at 0.3% MoM.
Looking forward, a speech from Bank of England (BOE) Governor Andrew Bailey will be important for the GBP/USD pair traders as they await the next moves of the “Old Lady”, as the BOE is informally called. Additionally, important will be the monthly prints of the US CPI and Core CPI data, with eyes on the Fed meeting. Given the latest improvement in the UK data and mixed concerns surrounding the US inflation, the odds of the Cable pair’s further upside momentum are higher.
Also read: US Consumer Sentiment Preview: Dollar set to decline on falling inflation expectations
Technical analysis
A one-week-old descending resistance line near 1.2315 restricts immediate GBP/USD upside. The downside moves, however, remain elusive unless the quote breaks the two-week-old ascending trend line, around 1.2270 by the press time.
-
07:04
United Kingdom Claimant Count Rate remains unchanged at 3.9% in November
-
07:03
UK ILO Unemployment Rate rose to 3.7% in October vs. 3.7% expected
- The Unemployment Rate in the UK arrived at 3.7% in October.
- UK Claimant Count Change came in at +30.5K in November.
- The UK wages excluding bonuses rose by 6.1% YoY in October vs. 5.9% expected.
According to the latest data released by the Office for National Statistics (ONS) on Tuesday, the UK’s ILO Unemployment Rate rose from 3.6% to 3.7% in October vs. the 3.7% expected while the claimant count change showed an unexpected jump in the reported month.
The number of people claiming jobless benefits leaped by 30.5K in November when compared to -6.4K booked previously and -13.3K expectations.
The UK’s average weekly earnings, excluding bonuses, arrived at +6.1% 3Mo/YoY in October versus +5.8% last and +5.9% expected while the gauge including bonuses came in at +6.1% 3Mo/YoY in October versus +6.0% previous and +6.2% expected.
Key points (via ONS)
“Payrolled employment increased by 107,000 employees (0.4%) in November 2022 when compared with October 2022, though this should be treated as a provisional estimate and is likely to be revised when more data are received next month.”
"The UK November Payrolls Change 107k vs 74k prior."
GBP/USD reaction
GBP/USD remains unfazed by the mixed UK employment data, adding 0.20% on the day to trade near 1.2300, as of writing.
About UK jobs
The UK Average Earnings released by the Office for National Statistics (ONS) is a key short-term indicator of how levels of pay are changing within the UK economy. Generally speaking, positive earnings growth anticipates positive (or bullish) for the GBP, whereas a low reading is seen as negative (or bearish).
-
07:02
United Kingdom ILO Unemployment Rate (3M) meets forecasts (3.7%) in October
-
07:02
United Kingdom Average Earnings Including Bonus (3Mo/Yr) below expectations (6.2%) in October: Actual (6.1%)
-
07:01
United Kingdom Average Earnings Including Bonus (3Mo/Yr) registered at 6%, below expectations (6.2%) in October
-
07:01
United Kingdom Claimant Count Change registered at 30.5K above expectations (-13.3K) in November
-
07:01
Germany Consumer Price Index (YoY) meets forecasts (10%) in November
-
07:01
EUR/USD edges higher in a familiar range, hovers around mid-1.0500s as traders await US CPI
- EUR/USD gains some positive traction on Tuesday amid a modest USD downtick.
- A generally positive risk tone undermines the safe-haven buck and offers support.
- The upside seems limited ahead of the US CPI and the crucial central bank meeting.
The EUR/USD pair attracts fresh buying on Tuesday and sticks to its modest intraday gains through the early European session. Currently placed around mid-1.0500s, spot prices, however, remain confined in a familiar range held over the past one-and-half week or so as traders await this week's key macro data and central bank meetings.
Market participants will confront the release of the latest US consumer inflation figures later during the early North American session on Tuesday. The crucial US CPI report will play a key role in driving the US Dollar demand and provide some impetus to the EUR/USD pair ahead of the highly-anticipated FOMC monetary policy decision on Wednesday. This will be followed by the European Central Bank (ECB) meeting on Thursday, which should determine the next leg of a directional move for the major.
In the meantime, the easing of COVID-19 curbs in China remains supportive of a generally positive risk tone. This, in turn, is seen undermining the safe-haven buck and offering support to the EUR/USD pair. That said, worries about a deeper global economic downturn should keep a lid on the optimism. This, along with the uncertainty about the Fed's rate-hike path, might hold back traders from placing fresh bearish bets around the USD and act as a headwind for the major, at least for the time being.
In fact, market participants seem convinced that the US central bank will slow the pace of its policy tightening and have been pricing in a relatively smaller 50 bps lift-off in December. That said, the incoming positive US economic data has been fueling speculations that the Fed might lift rates more than recently projected. Apart from this, diminishing odds for another supersized 75 bps rate hike by the European Central Bank (ECB) should contribute to capping gains for the EUR/USD pair.
Even from a technical perspective, the recent range-bound price action and repeated failures near the 1.0600 mark warrant some caution for aggressive bullish traders. Hence, it will be prudent to wait for strong follow-through buying before positioning for any further appreciating move for the EUR/USD pair. Traders on Tuesday will now look to the release of the German ZEW Economic Sentiment Index for short-term impetus, though the focus will remain glued to the closely-watched US CPI report.
Technical levels to watch
-
07:01
United Kingdom Average Earnings Excluding Bonus (3Mo/Yr) came in at 6.1%, above forecasts (5.9%) in October
-
07:01
China New Loans climbed from previous 615.2B to 1210B in November
-
07:01
China M2 Money Supply (YoY) above forecasts (11.7%) in November: Actual (12.4%)
-
07:00
Germany Harmonized Index of Consumer Prices (YoY) in line with forecasts (11.3%) in November
-
07:00
Germany Harmonized Index of Consumer Prices (MoM) meets forecasts (0%) in November
-
07:00
Germany Consumer Price Index (MoM) meets expectations (-0.5%) in November
-
07:00
Turkey Industrial Production (YoY) climbed from previous 0.4% to 2.5% in October
-
06:59
Gold Price Forecast: XAU/USD confirms bearish wedge, bearish breakdown to extend?
Where is the Gold price headed next after a rising wedge breakdown? FXStreet’s Dhwani Mehta analyzes XAU/USD’s technical outlook.
Immediate resistance seen at the 200DMA of $1,790
“Gold price yielded a rising wedge breakdown after closing Monday below the rising trendline support at $1,782. The downside break opens floors to test the mildly bullish 21-Daily Moving Average (DMA) at $1,768. Further south, the $1,750 psychological level could be on Gold sellers’ radars.”
“On the upside, the immediate resistance is seen at the 200DMA at $1,790, above which the $1,800 mark will be a tough nut to crack for Gold bulls.”
-
06:31
France Nonfarm Payrolls (QoQ) meets forecasts (0.4%) in 3Q
-
06:28
Gold Price Forecast: $1,791, US inflation to test XAU/USD bulls – Confluence Detector
- Gold price regains upside momentum after posting the biggest daily fall in a week.
- US Dollar retreat, mixed concerns surrounding CPI enables XAU/USD buyers to remain hopeful.
- Hawkish Fed bets, multiple hurdles to the north challenge Gold buyers ahead of US CPI.
Gold price (XAU/USD) grinds higher as bulls struggle to retake control amid a cautious mood ahead of the US Consumer Price Index (CPI) on early Tuesday. That said, the yellow metal’s latest run-up to $1,785 remains elusive as our technical confluence indicator shows that the quote is yet to cross the key hurdles.
It’s worth noting that the mixed precursors for the US inflation joined cautious optimism surrounding China, as well as sluggish Treasury bond yields to underpin the Gold price recovery. Also likely to have favored the XAU/USD rebound is the market’s inaction that allows traders to consolidate the biggest daily fall in a week.
That said, the US CPI for November, expected 7.3% YoY, versus 7.7% prior figure, will be crucial for intraday Gold traders. It should be noted that the CPI ex Food & Energy appears to be the key and is expected to be unchanged at 0.3% MoM, which can please the DXY buyers and weigh on XAU/USD should it manage to post the positive surprise.
Also read: Gold Price Forecast: XAU/USD confirms bearish wedge ahead of United States inflation data
Gold Price: Key levels to watch
The Technical Confluence Detector shows that the Gold price recently crossed the short-term key hurdle and is ready to confront another one surrounding $1,788 that comprises the previous monthly high and 100-HMA.
The quote’s further upside, however, hinges on a successful break of the $1,791 resistance confluence that includes the Fibonacci 61.8% on one-day, 50-HMA and middle Bollinger on the four-hour play.
Should Gold buyers manage to stay firmer past $1,791, Fibonacci 61.8% on weekly formation near $1,795 and previous daily high near $1,798 could challenge the XAU/USD bulls.
On the flip side, the $1,785 level encompassing Fibonacci 38.2% on a daily and SMA 5H on a four-hour timeframe restricts the immediate downside of the Gold price.
Following that, Fibonacci 38.2% on weekly and 10-HMA could act as the last defense of buyers around $1,783.
Should the quote remains bearish past $1,783, the odds of witnessing a slump towards $1,776, including Fibonacci 23.6% on weekly can’t be ruled out.
Here is how it looks on the tool
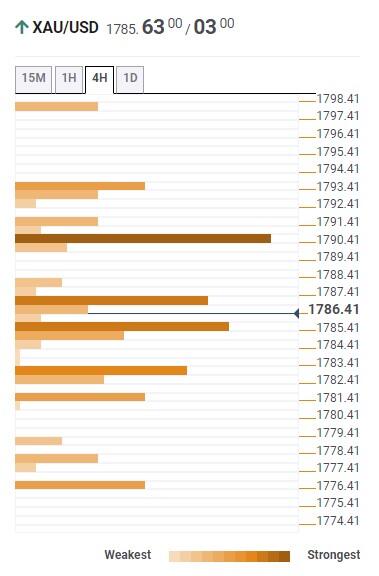
About Technical Confluences Detector
The TCD (Technical Confluences Detector) is a tool to locate and point out those price levels where there is a congestion of indicators, moving averages, Fibonacci levels, Pivot Points, etc. If you are a short-term trader, you will find entry points for counter-trend strategies and hunt a few points at a time. If you are a medium-to-long-term trader, this tool will allow you to know in advance the price levels where a medium-to-long-term trend may stop and rest, where to unwind positions, or where to increase your position size.
-
06:15
US Dollar Index Price Analysis: Symmetrical Triangle awaits US inflation release for an explosion
- The US Dollar Index has dropped to near day’s low around 104.90.
- Volatility in the US Dollar Index has contracted ahead of the US Inflation release.
- The 200-EMA at 105.20 is acting as a major barricade for the USD Index.
The US Dollar Index (DXY) is displaying wild moves as investors are dwindling ahead of the release of the United States Consumer Price Index (CPI) data. Anxiety ahead of the release of the US inflation is restricting investors from making decisive moves in the early European session. The USD Index has sensed selling pressure while attempting to cross the critical resistance of 105.10.
The asset has dropped to near day’s low below 105.00. Meanwhile, S&P500 futures have recovered after a marginal sell-off in the Tokyo session. It seems that the risk-appetite theme is regaining traction.
On an hourly scale, the USD Index is auctioning in a symmetrical triangle chart pattern that indicates volatility contraction. The upward-sloping trendline of the chart pattern is plotted from December 9 low at 104.48 while the downward-sloping trendline is placed from December 8 high at 105.43.
The 200-period Exponential Moving Average (EMA) at 105.20 is acting as a major barricade for the asset. Meanwhile, the Relative Strength Index (RSI) (14) is oscillating in a 40.00-60.00 range, which indicates a consolidation ahead.
Should the USD Index break below December 12 low at 104.66, bulls will drag the asset toward December 5 low at 104.12, followed by June 16 low at 103.42.
Alternatively, a decisive move above December 12 high at 105.20 will result in a symmetrical triangle breakout, which will send the USD Index toward December 8 high at 105.43. A break above the latter will drive the asset toward December 7 high at 105.77.
US Dollar Index hourly chart
-638065088341043662.png)
-
05:51
USD/JPY treads water below 138.00 as US Dollar, Treasury bond yields struggle ahead of US inflation
- USD/JPY remains sidelined after rising to an eight-day high.
- Treasury bond yields snap four-day uptrend, US Dollar stays depressed.
- Mixed concerns surrounding US CPI, challenges for BOJ’s pivot restrict immediate USD/JPY moves.
USD/JPY traders witness a lack of direction as the quote grinds higher around 137.70 during the early Tuesday in Europe, after refreshing the multi-day top in the Asian session.
The yen pair’s latest inaction could be linked to a lack of major data/events, as well as the cautious mood ahead of the US Consumer Price Index (CPI) for November. It should be noted that the mixed concerns surrounding the Bank of Japan’s (BOJ) next moves and sluggish US Treasury yields also restrict the immediate USD/JPY moves.
Recently, Bloomberg released an analysis, relying on the data from the Japanese Bankers Association, which challenges the market’s hopes of the BOJ’s monetary policy tightening. “Japan’s financial regulator is examining how vulnerable lenders would be to a sudden slump in government bonds should the nation’s central bank pivot away from its ultra-loose monetary policy in future,” per Bloomberg. It should be noted that the recently firmer inflation and nearness to the end of BOJ Governor Haruhiko Kuroda’s term underpinned the talks of BOJ’s exit from the easy-money policies.
Elsewhere, the US 10-year and two-year Treasury bond yields print the first daily loss in four around 3.59% and 4.36% in that order while the US Dollar Index (DXY) retreats to 104.95 at the latest.
On Monday, the one-year inflation precursor from the New York Fed slumped the most on record but contrasted with the upbeat inflation expectations for the 5-year and 10-year reported by the St. Louis Federal Reserve (FRED) data. On the same line, the last week’s downbeat prints of the United States Producer Price Index (PPI) also hinted at softer US inflation but the University of Michigan’s (UoM) Consumer Sentiment Index, as well as the US ISM Services PMI and inflation expectations from the UoM Survey, suggested firmer prints of the US CPI.
Amid these plays, the S&P 500 Futures print mild losses whereas stocks in the Asia-Pacific region trade mixed even as Wall Street benchmarks posted notable gains.
Moving on, the mixed messages from the market, as well as from concerns surrounding Russia and China, could restrict USD/JPY moves ahead of the US inflation data. However, a firmer print of the US CPI, expected at 7.3% YoY versus 7.7% prior, won’t hesitate to recall the pair buyers amid recent hawkish Fed bets.
Also read: US Consumer Sentiment Preview: Dollar set to decline on falling inflation expectations
Technical analysis
USD/JPY’s latest run-up could be linked to the week-start break of a descending resistance line from November 23, now support around 136.10. Also keeping the USD/JPY buyers hopeful are the bullish MACD signals and the firmer RSI (14), not overbought.
However, a convergence of the 61.8% Fibonacci retracement level of the Yen pair’s run-up between August and October, as well as a seven-week-long downward-sloping trend line, challenges the USD/JPY bulls around 138.70.
-
05:38
EUR/GBP oscillates below 0.8600 ahead of UK job data, ECB/BOE policy key trigger ahead
- EUR/GBP is auctioning below 0.8600 as investors await UK Employment data.
- Increment in households’ earnings data could be a double-edged sword for the UK economy.
- The ECB is expected to hike its interest rates by 50 bps to 2.50%.
The EUR/GBP pair is displaying back-and-forth moves marginally below the crucial hurdle of 0.8600 in the early European session. The cross is displaying a sideways auction profile as investors are awaiting the release of the United Kingdom Employment data.
The asset remained topsy-turvy on Monday despite upbeat UK Gross Domestic Product (GDP) data. The monthly GDP data (October) reported an expansion of 0.5% while the street was expecting a contraction of 0.1%. Also, Industrial and Manufacturing Production data remained better than anticipation but were contracted on an annual basis for October month.
Now, investors have shifted their focus to the UK Employment data. As per the projections, the jobless claims gamut will witness a decline of 13.3K. While the quarterly Unemployment Rate (October) is seen higher at 3.7% against the former release of 3.6%.
Apart from that, Quarterly Average Earnings data excluding Bonuses is seen higher at 5.9% vs. the former release of 5.7%. An increment in households’ earnings could be a double-edged sword. No doubt, higher earnings will delight households in offsetting inflation adjusted-payouts but will also increase retail demand, which will escalate inflation further.
This week, the interest rate policy by the Bank of England (BOE) will hog the limelight. Analysts from Danske Bank are expecting a 50 basis point (bps) rate hike announcement.
On the Eurozone front, investors are awaiting a monetary policy announcement from the European Central Bank (ECB), which is scheduled for Thursday. Analysts at Rabobank think that the ECB is likely to raise the policy rate by 50 basis points in December but note that they are not fully discounting the possibility of a 75 bps hike. They have forecasted a terminal rate of 3%.
-
05:21
AUD/USD Price Analysis: Bears have an upper hand despite latest rebound to 0.6760
- AUD/USD recovers from intraday low but stays indecisive on a daily basis.
- Bearish RSI divergence, rising wedge keeps sellers hopeful even as 100-DMA adds to the downside filters.
- Recovery remains elusive below 0.6880, weekly high guards immediate upside.
AUD/USD picks up bids to pare the previous day’s losses around 0.6755-60 heading into Tuesday’s European session. In doing so, the Aussie pair bounces off intraday low but stays inside a one-month-old rising wedge bearish chart pattern.
In addition to the rising wedge, the bearish RSI divergence also teases the AUD/USD bears despite the pair’s latest recovery. On the same line could be the consecutive bearish MACD signals published in the last week.
When a higher high on prices fails to gain support from the higher tops of the RSI, it is called the bearish RSI divergence and suggests the quote’s downside.
That said, the 0.6800 round figure and the weekly high near 0.6815 challenge the near-term AUD/USD upside ahead of the stated wedge’s upper line, close to 0.6680 by the press time.
In a case where the Aussie bulls manage to keep the reins past 0.6880, September’s high near 0.6915 will be in focus.
Alternatively, pullback moves could aim for the aforementioned wedge’s lower line, near 0.6695 at the latest, a break of which will confirm the bearish chart pattern that theoretically suggests a south-run towards the mid-0.6400s.
During the fall, tops marked in October near 0.6550 and 0.6520, as well as the 100-DMA level surrounding 0.6675, could act as intermediate halts.
AUD/USD: Daily chart

Trend: Further downside expected
-
05:07
USD/CAD defends 1.3600 as US Dollar recovers ahead of US Inflation and Fed policy
- USD/CAD has managed to pick bids above the crucial support of 1.3600.
- A decline in United States inflation will set the stage for a slowdown in the interest rate hike by the Federal Reserve.
- The Bank of Canada is ready to hike interest rates further if it fails to see signs of a slowdown in inflation.
- USD/CAD is expected to display a sheer move as the RSI (14) is hinting at a volatility contraction.
USD/CAD has attempted a recovery after dropping marginally below the crucial support of 1.3620 in the early European session. The Lonnie asset is aiming to conquer the immediate resistance of 1.3640 as the US Dollar Index (DXY) has recovered sharply as the market mood has turned cautious again ahead of the United States inflation and the outcome of the Federal Reserve (Fed) policy.
The US Dollar Index (DXY) has recovered sharply after a corrective move below the round-level support of 105.00. The USD Index has accelerated its recovery to near 105.06 and is expected to remain volatile ahead. Investors are confused about whether to underpin the risk-aversion theme as the Federal Reserve is set to hike its interest rate peak guidance in its monetary policy meeting on Wednesday or to support the risk appetite theme due to lower consensus for the United States Consumer Price Index (CPI) data.
Meanwhile, S&P500 futures are displaying a marginal fall in early London after posting solid gains on Monday. The 10-year US Treasury yields are hovering around the critical resistance of 3.60%, displaying obscurity in the market mood.
Upbeat US PPI and lower annual inflation expectations trim inflation consensus
Market participants have got anxious ahead of the release of the US inflation. Price pressures have remained the talk of the town this year as the sentiment of the households remained dented and the Federal Reserve policymakers remained worried thinking about the consequences of a higher price rise index.
A surprise drop in November’s Producer Price Index (PPI) report and one-year consumer inflation expectations is hinting at a slowdown in the current inflation rate. The headline PPI dropped to 7.4% as producers are worried about a decline in consumer spending. While one-year consumer inflation expectations have declined to 5.2% in November from 5.9% in October, marking the biggest one-month decline on record.
This has led to a decline in the consensus for headline inflation to 7.4% vs. the former release of 7.7%. While the core CPI is expected to trim to 6.1% against 6.4% reported earlier. Analysts at JP Morgan Chase & Co. have cited that a soft reading in US CPI data could spark a powerful rally in US equities. The 500-stock basket of the United States could rally up to 10% if headline inflation drops to 6.9% or lower, as reported by Bloomberg.
Lower inflation to cement a slowdown in Federal Reserve’s interest rate hike pace
Mounting inflation pressures have been forcing the Federal Reserve to tighten the interest rate policy despite the accelerating risks of a recession. The agenda of the Federal Reserve chair Jerome Powell has been the achievement of price stability. Signs of deceleration in the inflationary pressures will set the stage for a slowdown in the policy tightening pace by the Federal Reserve.
The risk of higher interest rate peak guidance for CY2023 as the inflation rate will remain beyond the targeted rate of 2% for a while. Rabobank analysts said they expect the US central bank to hike the policy rate by 50 basis points (bps) and see policymakers revising the terminal rate projection to the neighborhood of 5%.
BOC Governor seems on foot to hike rates further if fails to dwindle inflation
The speech from Bank of Canada (BOC) Governor Tiff Macklem on Monday cleared that the Canadian central bank won’t think twice about hiking interest rates further if inflation remains stubborn ahead. While speaking to business leaders in Vancouver, the Bank of Canada Governor said that policy tightening has begun to work but would take time to feed the economy. The present challenge in front of the Bank of Canada is that higher interest rates could push the economy into an unnecessarily painful recession, as reported by Reuters.
USD/CAD technical outlook
USD/CAD has dropped after facing barricades around the supply zone placed in a narrow range of 1.3690-1.3700 on an hourly scale. On a broader note, the 20-period Exponential Moving Average (EMA) at 1.3640 is overlapping with the Loonie asset price, which indicates a sideways auction profile.
Meanwhile, the Relative Strength Index (RSI) (14) is oscillating in a 40.00-60.00 range, which indicates a consolidation ahead till the release of a potential trigger.
-
04:58
GBP/USD snaps four-day uptrend ahead of UK employment, US inflation data
- GBP/USD prints mild losses as it pushes back buyers after four-day ruling.
- Fears of UK’s recession joins hawkish Fed bets to underpin bearish bias.
- UK jobs report, inflation data may entertain traders ahead of “Super Thursday”.
- US CPI for November could favor FOMC hawks in case of firmer outcome.
GBP/USD holds lower ground near the intraday bottom as it seesaws near 1.2260 during the first negative in five heading into Tuesday’s London open. In doing so, the Cable pair justifies economic pessimism surrounding the UK, as well as hawkish bets on the US Federal Reserve’s (Fed) next moves, ahead of the key British employment numbers and the US inflation data.
On Monday, the UK’s Gross Domestic Product (GDP) for October rose to 0.5% MoM versus -0.1% expected and -0.6% prior. With this, the UK GDP came in above the pre-COVID-19 level of 0.4% which was flashed in February 2020. Further details mentioned that the Manufacturing Production growth rallied by 0.7% compared to -0.1% market consensus and 0.0% previous readouts while the Industrial Production marked a positive surprise of 0.0% % MoM for October compared to -0.3% expected and 0.2% prior. Following the data, UK Finance Minster Jeremy Hunt said in a BBC News interview on Monday that the economy is “likely to get worse before it gets better.”
On the other hand, the US Dollar cheered Friday’s upbeat data but the mixed signals for today’s US Consumer Price Index (CPI) for November limited the Greenback’s further upside. That said, the one-year inflation precursor from the New York Fed slumped the most on record but contrasts with the upbeat inflation expectations for the 5-year and 10-year reported by the St. Louis Federal Reserve (FRED) data. On the same line, the last week’s downbeat prints of the United States Producer Price Index (PPI) also hinted at softer US inflation but the University of Michigan’s (UoM) Consumer Sentiment Index, as well as the US ISM Services PMI and inflation expectations from the UoM Survey, suggested firmer prints of the US CPI.
It should be noted that the fears surrounding the escalation in Russia versus the West tussles, mainly due to the oil price cap, join the Sino-American woes over the US sanctions on Chinese diplomats, to weigh on the market sentiment. However, China-linked Covid optimism restricts the bearish bias surrounding the GBP/USD pair.
While portraying the mood, US Treasury bond yields print the first daily loss in four while the S&P 500 Futures print mild losses near 4,020 despite a strong Wall Street close on Monday.
Looking forward, the UK Claimant Count Change for November, expected -13.3K versus 3.3K prior, will join the ILO Unemployment Rate for three months to October, likely increasing to 3.7% versus 3.6% prior, to direct immediate GBP/USD moves. Following that, the US CPI, expected 7.3% YoY, versus 7.7% prior figure, will be crucial for near-term directions. It should be noted that the CPI ex Food & Energy appears to be the key and is expected to be unchanged at 0.3% MoM, which can please the DXY buyers and weigh on GBP/USD prices in case of a firmer print.
Technical analysis
A clear downside break of the two-week-old ascending trend line, around 1.2270 by the press time, becomes necessary for the GBP/USD bears to keep the reins. However, recovery moves remain elusive unless crossing a downward-sloping resistance line from December 05, close to 1.2315 at the latest.
-
04:37
WTI Price Analysis: Grinds higher towards $74.55 hurdle
- WTI picks up bids to extend recovery from yearly low, seesaws around intraday high.
- One-week-old descending trend line, nearly overbought RSI challenge oil buyers.
- Convergence of 50-HMA, previous resistance line restrict immediate downside.
WTI crude oil stays on the front foot around $74.10 as it prints a two-day uptrend after posting a Doji candlestick nearly the yearly low on Friday.
In addition to the trend reversal suggesting candlestick formation on the Daily chart, the nearly oversold RSI conditions also triggered the black gold’s latest recovery.
The upside momentum gained acceptance after the bulls cross a one-week-old descending trend line and the 50-HMA.
However, the downward-sloping support line from the last Wednesday and the RSI (14), which is near the overbought territory, challenges the WTI crude oil’s immediate upside near $74.55.
In a case where the quote crosses the $74.55 hurdle, the 200-HMA level near $76.20 could challenge the commodity buyers.
Should the energy benchmark remains firmer past $76.20, the odds of witnessing a run-up toward $78.00 and then to the $80.00 round figure can’t be ruled out. Though, a monthly high of $83.30 will be a tough nut to crack for the WTI bulls afterward.
On the contrary, a convergence of the 50-HMA and the previous resistance line, around $72.30 by the press time, puts a floor under the quote.
Following that, a slump towards refreshing the yearly low, currently around $70.30, appears imminent. In that case, the $70.00 psychological magnet may gain major attention.
WTI crude oil: Hourly chart
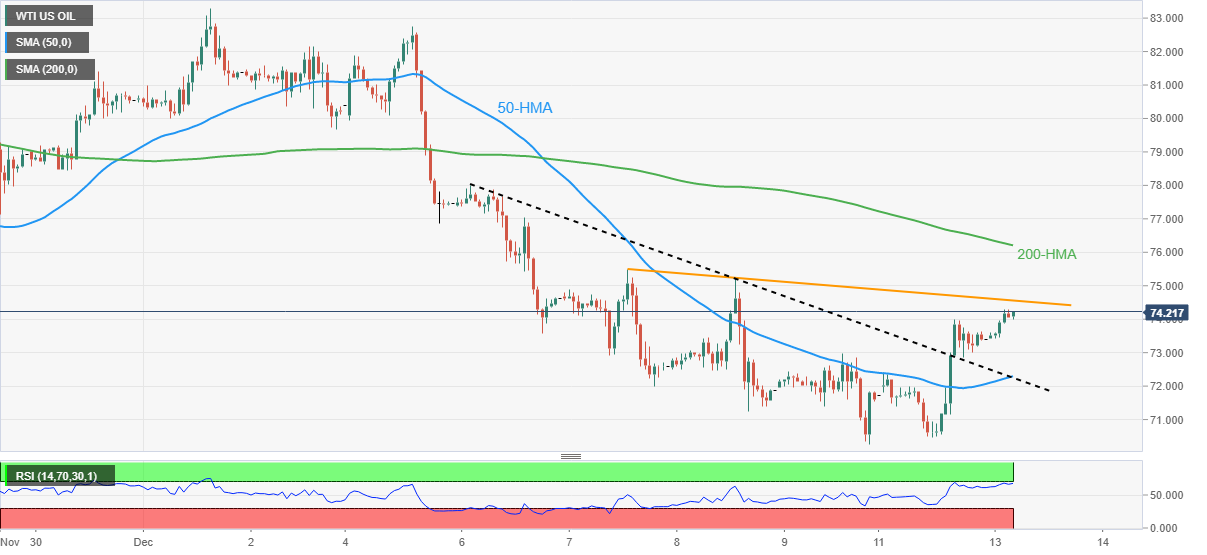
Trend: Limited recovery expected
-
04:18
EUR/USD steadies around 1.0550 as traders await German data, US inflation
- EUR/USD probes two-day downtrend amid inactive markets, retreat from intraday high of late.
- Fears of economic recession in the bloc joins mixed concerns surrounding US CPI to challenge EUR/USD moves.
- Germany’s ZEW sentiment data, final readings of HICP could entertain traders ahead of the key US inflation number.
EUR/USD remains on the back foot around 1.0550, despite recent inaction, as markets await the US inflation data during early Tuesday. The major currency pair’s latest inaction could be linked to the mixed signals concerning the US Consumer Price Index (CPI) for November. However, economic fears surrounding the Euro Area keep the bears hopeful.
Concerns surrounding Europe’s ability to successfully manage to survive through the winter, amid the Russia-linked energy crisis, seem to challenge the Euro buyers. Even so, European Commission President Ursula von der Leyen said in a press conference on Monday that Europe's energy supply will be safe this winter, as reported by Reuters. "Despite the action that we have taken, we might still face a gap of up to 30 billion cubic metres (bcm) of gas next year," she added and called on EU members to adopt the energy proposals swiftly. The same raise geopolitical fears as Russian President Vladimir Putin has already rejected to supply oil to countries supporting the EU-backed oil price cap.
Elsewhere, a slump in the one-year inflation precursor from the New York Fed contrasts with the upbeat inflation expectations for the 5-year and 10-year reported by the St. Louis Federal Reserve (FRED) data. That said, the latest prints of the 5-year and 10-year inflation expectations portray a rebound to 2.28% and 2.35% respectively. On the same line, the last week’s downbeat prints of the United States Producer Price Index (PPI) also hinted at softer US inflation but the University of Michigan’s (UoM) Consumer Sentiment Index, as well as the US ISM Services PMI and inflation expectations from the UoM Survey, suggested firmer prints of the US CPI.
On a broader front, the recently hawkish bias over the Federal Reserve (Fed) versus the European Central Bank (ECB) officials’ cautious tone, mainly due to the recession woes, seems to weigh on the EUR/USD prices. However, mixed risk catalysts and optimism over China’s Covid moves join sluggish markets to challenge the pair’s momentum ahead of the key data.
Amid these plays, the US 10-year and two-year Treasury bond yields print the first daily loss in four around 3.59% and 4.36% in that order while the S&P 500 Futures print mild losses near 4,020 despite strong Wall Street close on Monday. It should be noted that the oil price improved and the US Dollar Index (DXY) eased but the traders remain cautious overall.
Looking forward, Germany’s ZEW Sentiment numbers for December and final prints of the November month Harmonized Index of Consumer Prices (HICP), expected to confirm 11.3% YoY initial forecast, could offer immediate moves ahead of the US CPI data. The market forecasts for the headline CPI for November signal a softer print of 7.3% YoY, versus 7.7% prior figure, while the monthly CPI may ease to 0.3% compared to 0.4% previous readings. It should be noted that the CPI ex Food & Energy appears to be the key and is expected to be unchanged at 0.3% MoM, which can please the DXY buyers and weigh on EUR/USD prices in case of a firmer print.
Technical analysis
Repeated failures to cross the 61.8% Fibonacci retracement level of the pair’s downside between late March and September 28, around 1.0555, joins bearish RSI divergence to keep sellers hopeful.
The bearish RSI divergence could be witnessed when the price makes a higher high but the oscillator makes a lower high, suggesting the lack of buying momentum and likely entry of bears.
-
03:49
USD/INR Price Analysis: Aims to test 83.00 as oil extends firmer recovery
- A recovery in the US Dollar Index is indicating extreme uncertainty in the FX domain.
- The asset has comfortably established above the downward-sloping trendline plotted from 83.43.
- Advancing 20-and 50-EMAs add to the upside filters.
The USD/INR pair has shifted its auction profile above the critical hurdle of 82.50 in the Asian session. The asset is aiming higher as the US Dollar Index (DXY) has recovered after dropping to near 104.90, displaying sheer volatility ahead of the United States inflation data.
The risk profile is displaying mixed responses as a lower consensus for US inflation is supporting markets while anxiety among investors is capping the upside. Meanwhile, the oil price has surpassed the critical hurdle of $74.00. Asian economies significantly bank upon oil imports to cater to their domestic needs. Therefore, advancing oil prices are impacting the Indian Rupee.
On a four-hour scale, the pair has comfortably established above the downward-sloping trendline plotted from October 19 high at 83.43. The 20-and 50-period Exponential Moving Averages (EMAs) at 82.47 and 82.19 respectively are advancing, which adds to the upside filters.
Meanwhile, the Relative Strength Index (RSI) (14) has shifted into the bullish range of 60.00-80.00, which indicates that upside momentum is active.
Going forward, a break above December 7 high at 82.77 will drive the asset towards the round-level resistance at 83.00, followed by October 19 high at 83.43.
On the contrary, a slippage below Friday’s low at 82.08 will drag the asset towards November 25 low at 81.41 and December 01 low at 81.00.
USD/INR four-hour chart
-638065001301503140.png)
-
03:49
Gold Price Forecast: XAU/USD rebound needs validation from $1,788 and US inflation
- Gold price picks up bids to consolidate the biggest daily loss in a week.
- Rising wedge confirmation, hawkish Fed bets challenge XAU/USD buyers despite US Dollar’s retreat.
- US CPI for November bears downbeat forecasts but Core CPI signals firmer outcomes and can challenge Gold buyers.
Gold price (XAU/USD) retreats from intraday high as bulls battle with the key support-turned-resistance below $1,800 during early Tuesday morning in Europe.
In doing so, the yellow metal cheers the broad pullback in the US Dollar ahead of the key US Consumer Price Index (CPI) for November. Also fueling the quote could be the market’s cautious optimism surrounding China and softer US Treasury yields.
That said, the US Dollar Index (DXY) remains sluggish around 105.00 after rising in the last two consecutive days. The greenback’s latest inaction could be linked to the mixed signals surrounding the upcoming US inflation data, as well as mixed geopolitical headlines.
The short-term inflation precursor from the New York Fed contrasts with the upbeat inflation expectations for the 5-year and 10-year reported by the St. Louis Federal Reserve (FRED) data. That said, the latest prints of the 5-year and 10-year inflation expectations portray a rebound to 2.28% and 2.35% respectively.
On the same line, the last week’s downbeat prints of the United States Producer Price Index (PPI) also hinted at softer US inflation but the University of Michigan’s (UoM) Consumer Sentiment Index, as well as the US ISM Services PMI and inflation expectations from the UoM Survey, suggested firmer prints of the US CPI.
Elsewhere, optimism surrounding China’s gradual removal of the Zero-Covid policy also helps the XAU/USD buyers. That said, the government of Shanghai city announced on Monday that they will deem all districts as "not at risk of Covid" from Tuesday, December 13, as reported by Reuters. Earlier on Monday, Chinese officials announced that they will take the application used to track coronavirus cases offline later this week.
Alternatively, Chinese Foreign Ministry spokesman Wang Wenbin conveyed dislike for the US sanctions on two of their diplomats on Monday. “These illegal sanctions severely affected Sino-American relations,” Wang said as per Reuters. Elsewhere, Russian President Vladimir Putin’s rejection to supply oil to countries respecting the Europe-led price cap also raise the market’s fears and exert downside pressure on the XAU/USD price.
While portraying the mood, the US 10-year and two-year Treasury bond yields print the first daily loss in four around 3.59% and 4.36% in that order while the S&P 500 Futures print mild losses near 4,020 despite strong Wall Street close on Monday. It should be noted that the oil price improved and the US Dollar Index (DXY) eased but the traders remain cautious overall.
Looking forward, Gold traders will pay attention to the US inflation data as the market forecasts for the headline CPI for November signals a softer print of 7.3% YoY, versus 7.7% prior figure, while the monthly CPI may ease to 0.3% compared to 0.4% previous readings. It should be noted that the CPI ex Food & Energy appears to be the key and is expected to be unchanged at 0.3% MoM, which can please the DXY buyers and weigh on XAU/USD prices in case of a firmer print.
Gold price technical analysis
Gold price struggles to recall the buyers after confirming the one-month-old rising wedge bearish chart pattern. In doing so, the yellow metal bounces off the weekly low after declining the most since December 05 the previous day.
However, a convergence of the 10-Day Moving Average (DMA) and the previous support line of the aforementioned wedge, around $1,788, challenges the XAU/USD bulls of late.
Even if the bullion manages to cross the $1,788 hurdle, the $1,800 threshold and a horizontal line comprising tops marked in August and early December, near $1,810, may restrict the precious metal’s further upside.
Alternatively, the late November swing high near $1,763 and October’s high, near $1,730, could lure short-term Gold sellers during the theoretically anticipated fall toward the $1,690 level.
It should be noted that the bearish MACD signals and steady RSI (14) also keep Gold sellers hopeful.
Gold price: Daily chart
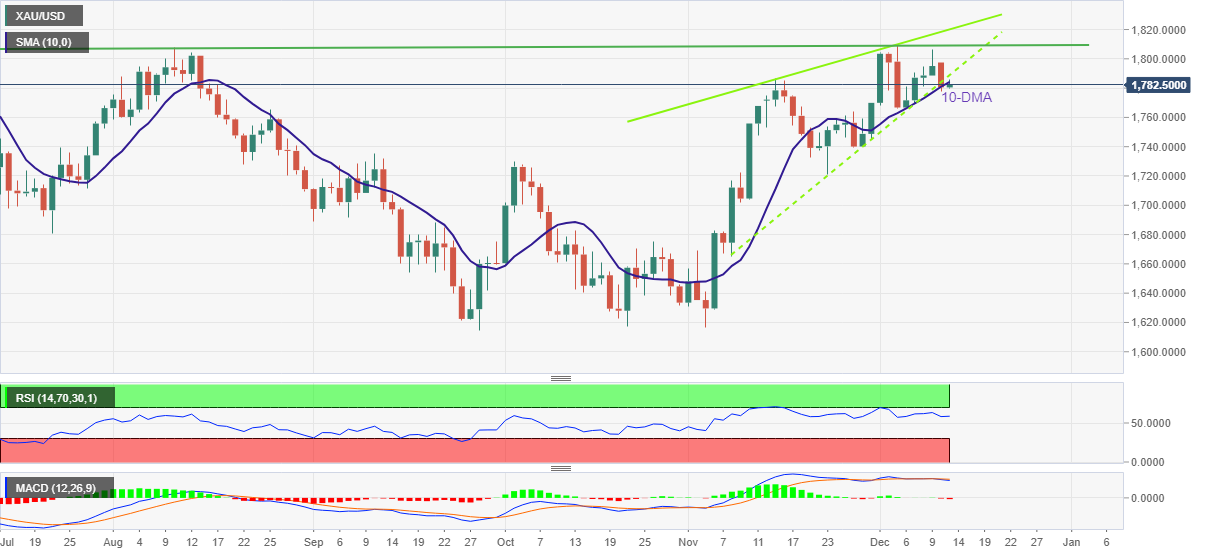
Trend: Further downside expected
-
03:46
RBA: Pandemic cheap lending policy to business failed
In a research paper published on Tuesday, the Reserve Bank of Australia (RBA) said that its Term Funding Facility (TFF) failed to boost borrowing by businesses.
The central bank had introduced a cheap lending facility as a part of its Covid policy response.
Additional takeaways
“It achieved a key objective of providing banks with three-year low-cost funding and was available for drawdown until 30 June 2021.”
“We find no statistically significant evidence that the TFF increased credit supply to businesses.”
“However, our confidence intervals are wide and there are significant identification challenges involved in disentangling the effects of the TFF from the effects of pandemic-related disruptions and other policy interventions on credit supply and demand.“
“Nonetheless, the TFF provided an assured source of funding at a time of considerable stress in the financial system and lowered banks’ funding costs, and any effects on business lending via these channels may not be fully reflected in our results.”
Related reads
- AUD/USD looks to regain 0.6800 as US Dollar retreats ahead of inflation data, Fed
- US November CPI Preview: Gold is the asset to watch
-
03:15
Asian Stock Market: Indices display rough recovery firmer market mood, oil advances, US CPI eyed
- Asian equities have failed to trace strength in S&P500 led by a recovery in oil prices.
- A decline in factory gate prices of goods by manufacturers has trimmed the US inflation consensus.
- Chinese equities are set for a multi-quarter recovery as Covid-19 lockdown restrictions ease further.
Markets in the Asian domain failed to trace the strength of the S&P500 on Tuesday. Asian equities have displayed a poor recovery despite investors shrugging off uncertainty ahead of the United States Consumer Price Index (CPI) data, which will release on Tuesday. The US Dollar Index (DXY) has surrendered the immediate support of 105.00 and is expected to remain on the tenterhooks ahead.
At the press time, Japan’s Nikkei225 gained 0.31%, ChinaA50 added 0.38% and Hang Seng jumped 0.93%.
S&P500 displayed a solid recovery on Monday as the street is expecting a further slowdown in the US inflation data. The odds for a decline in inflation have been cemented by a significant drop in US Producer Price Index (PPI) data. A sheer decline in prices of goods at the factory gate has trimmed consensus for inflationary pressures.
The headline inflation is expected to drop to 7.3% while the core CPI that excludes oil and food prices is seen lower at 6.1%. Analysts at JP Morgan Chase & Co. have cited that a soft reading in US CPI data could spark a powerful rally in US equities. The 500-stock basket of the United States could rally up to 10% if headline inflation drops to 6.9% or lower, as reported by Bloomberg.
Meanwhile, further ease in lockdown restrictions in China is expected to bring a recovery in Chinese equities ahead. The rollback of restrictions on the movement of men, materials, and machines has brought optimism to the second-largest economy. In a note from banking giant Morgan Stanley, chief China equity strategist Laura Wang wrote, “Multiple positive developments alongside a clear path set toward reopening warrant an upgrade and index target increases for China.
On the oil front, the supply crisis in the US led by a shutdown of the main pipeline that passes oil has triggered the risk of volatility in the demand-supply mechanism. The oil prices have managed to overstep the immediate resistance of $74.00 in the Asian session and are expected to deliver a solid rally ahead.
-
03:00
South Korea Money Supply Growth below forecasts (6.6%) in October: Actual (5.9%)
-
02:46
NZD/USD bulls attack 0.6400 on upbeat options market signals
NZD/USD picks up bids to print mild gains around 0.6395 during the mid-Asian session on Tuesday. In doing so, the Kiwi pair consolidates the biggest daily loss in a week as traders await the US Consumer Price Index (CPI) for November.
That said, firmer prints of the options market barometer, namely the Risk Reversals (RR), also underpin the NZD/USD pair’s latest run-up. It should be noted that the RR the key options market gauge calculated by marking the difference between the call and put options.
The one-month RR of the NZD/USD pair, the key options market gauge, braces for the fourth consecutive weekly gain while printing the 0.020 figure at the latest, the same is the daily RR for Monday.
Although the options market indicator is bullish, the fears of hawkish Fed and softer prints of New Zealand’s Food Price Index for November, to 0.0% versus 0.1% expected 0.8% prior, seem to challenge the NZD/USD buyers of late.
Also read: NZD/USD Price Analysis: Struggles to extend the bounce off 0.6370 support confluence
-
02:32
USD/JPY Price Analysis: Further upside hinges on 138.70 breakout
- USD/JPY grinds higher after refreshing two-week top.
- Clear break of three-week-old descending trend line, upbeat oscillators favor buyers.
- Convergence of 61.8% Fibonacci retracement level, downward-sloping resistance line from late October challenges further upside.
USD/JPY bulls struggle to defend the previous day’s run-up around 137.70-80, despite refreshing a multi-day high, during early Tuesday. That said, the Yen pair remains sidelined after rising to the highest levels since December 01.
The quote’s latest run-up could be linked to the week-start break of a descending resistance line from November 23, now support around 136.10. Also keeping the USD/JPY buyers hopeful are the bullish MACD signals and the firmer RSI (14), not overbought.
However, a convergence of the 61.8% Fibonacci retracement level of the Yen pair’s run-up between August and October, as well as a seven-week-long downward-sloping trend line, challenges the USD/JPY bulls around 138.70.
Should the USD/JPY buyers manage to cross the 138.70 resistance confluence, the odds of their rush towards the tops marked during late November, near 139.90 and 142.25, can’t be ruled out.
On the flip side, pullback moves may aim for the previous resistance line near 136.10 to convince the sellers. Even so, the 200-DMA could challenge the USD/JPY pair’s short-term downside near 135.25.
In a case where the quote remains bears past 135.25, the sellers could aim for refreshing the monthly low, currently around 133.60.
USD/JPY: Daily chart
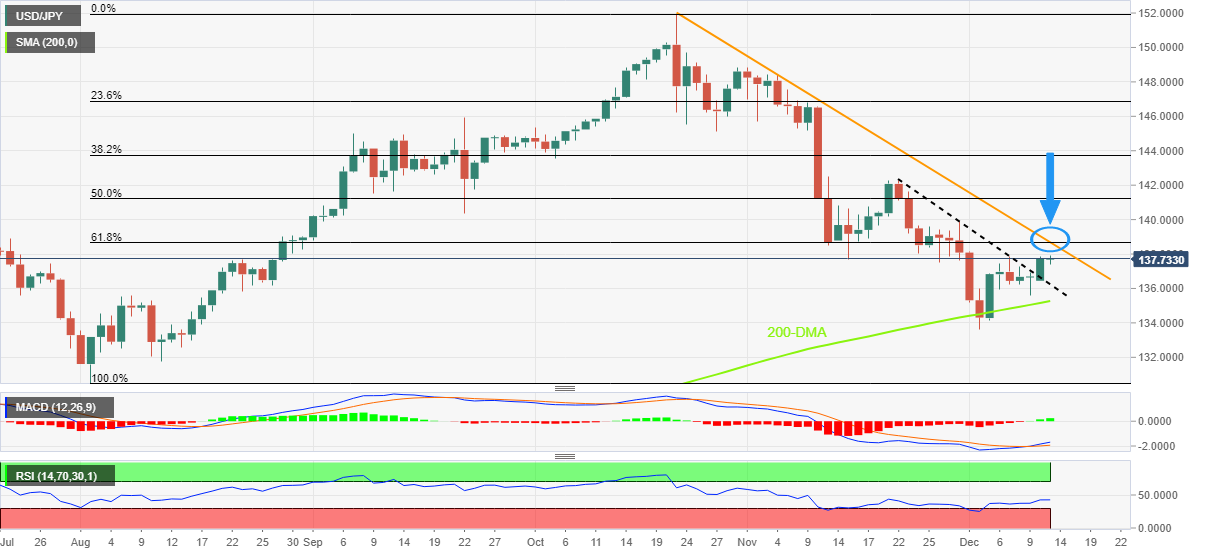
Trend: Further upside expected
-
02:30
Commodities. Daily history for Monday, December 12, 2022
Raw materials Closed Change, % Silver 23.308 -0.36 Gold 1781.59 -0.8 Palladium 1888.86 -2.66 -
02:25
Japan’s banks could suffer $1.1 trillion bond loss if BoJ pivots
Citing the latest data from the Japanese Bankers Association, Bloomberg reported on Tuesday, the country’s banks could suffer losses on their government bonds to the tune of $1.1 trillion should the Bank of Japan (BoJ) loosen its grip on 10-year JGB yields.
“Japan’s financial regulator is examining how vulnerable lenders would be to a sudden slump in government bonds should the nation’s central bank pivot away from its ultra-loose monetary policy in future,” per Bloomberg.
developing story ...
-
02:14
AUD/USD looks to regain 0.6800 as US Dollar retreats ahead of inflation data, Fed
- AUD/USD prints mild gains to pare the biggest daily loss in a week, grinds near intraday high of late.
- Australia’s NAB Business Conditions, Confidence eased in November.
- Global markets remain dicey amid cautious mood ahead of the key US inflation data.
- Mixed early signals for US CPI, optimism surrounding China adds strength to bullish bias.
AUD/USD renews its intraday high around 0.6760 as it consolidates the previous day’s heavy losses during early Tuesday. In doing so, the Aussie pair also cheers the US Dollar’s weakness ahead of the key US Consumer Price Index (CPI) for November.
That said, the quote snapped a three-day uptrend the previous day as the US Dollar benefited from firmer Treasury bond yields, as well as Friday’s strong data suggesting upbeat prints of the US CPI.
Even so, mixed prints of the US inflation expectations from the Federal Reserve (Fed) banks of New York and St. Louis seem to lure the bearish bias surrounding the US CPI and favor the AUD/USD bulls of late. On Monday, the New York Federal Reserve’s (Fed) Survey of Consumer Inflation Expectations Survey stated that the 1-year ahead inflation expectations slumped to their lowest level since 2021 and marked the biggest month-to-month decline in November on record. The short-term inflation precursor from the NY Fed contrasts with the upbeat inflation expectations for the 5-year and 10-year reported by the St. Louis Federal Reserve (FRED) data. That said, the latest prints of the 5-year and 10-year inflation expectations portray a rebound to 2.28% and 2.35% respectively.
It’s worth noting that the last week’s downbeat prints of the United States Producer Price Index (PPI) also hinted at softer US inflation but the University of Michigan’s (UoM) Consumer Sentiment Index, as well as the US ISM Services PMI and inflation expectations from the UoM Survey, suggested firmer prints of the US CPI.
Other than the mixed forecasts for US inflation, optimism surrounding China’s gradual removal of the Zero-Covid policy also helps the AUD/USD buyers. That said, the government of Shanghai city announced on Monday that they will deem all districts as "not at risk of Covid" from Tuesday, December 13, as reported by Reuters. Earlier on Monday, Chinese officials announced that they will take the application used to track coronavirus cases offline later this week.
On the contrary, downbeat Australian statistics, fears of the Sino-America tussles and hawkish hopes from the Fed challenge the AUD/USD bulls.
Earlier in the day, National Australia Bank’s (NAB) Business Confidence gauge slumped to -4.0 for November versus 5.0 expected and 0.0 prior. Further, the NAB Business Conditions also eased to 20.0 while matching market forecasts, compared to 22.0 prior. Elsewhere, Chinese Foreign Ministry spokesman Wang Wenbin conveyed dislike for the US sanctions on two of their diplomats on Monday. “These illegal sanctions severely affected Sino-American relations,” Wang said as per Reuters. Elsewhere, Russian President Vladimir Putin’s rejection to supply oil to countries respecting the Europe-led price cap also raise the market’s fears and exert downside pressure on the USD/CHF price.
Amid these plays, the US 10-year and two-year Treasury bond yields print the first daily loss in four around 3.59% and 4.36% in that order while the S&P 500 Futures print mild losses near 4,022 despite strong Wall Street close on Monday. It should be noted that the oil price improved and the US Dollar Index (DXY) eased but the traders remain cautious overall.
Moving on, AUD/USD traders could witness lackluster markets ahead of the US inflation release. It should be observed that US CPI for November is likely to ease to 7.3% YoY, versus 7.7% prior figure, while the monthly CPI may retreat to 0.3% compared to 0.4% previous readings. It should be noted that the CPI ex Food & Energy appears to be the key and is expected to be unchanged at 0.3% MoM.
Technical analysis
Despite the latest rebound, AUD/USD remains indecisive as it stays between the 21-DMA and the one-week-old resistance line, respectively near 0.6730 and 0.6795.
-
01:59
EUR/USD Price Analysis: Bears are lurking below 1.0550, eyes on a significant correction
- EUR/USD runs into an area of resistance and focus is on the trendline support.
- Bears are chipping away at the bullish trend and eyes are on a correction.
EUR/USD has been rallying over the course of the winter months and into year-end. However, there are prospects of a bearish correction in the meantime as the following technical analysis will illustrate.
EUR/USD weekly chart
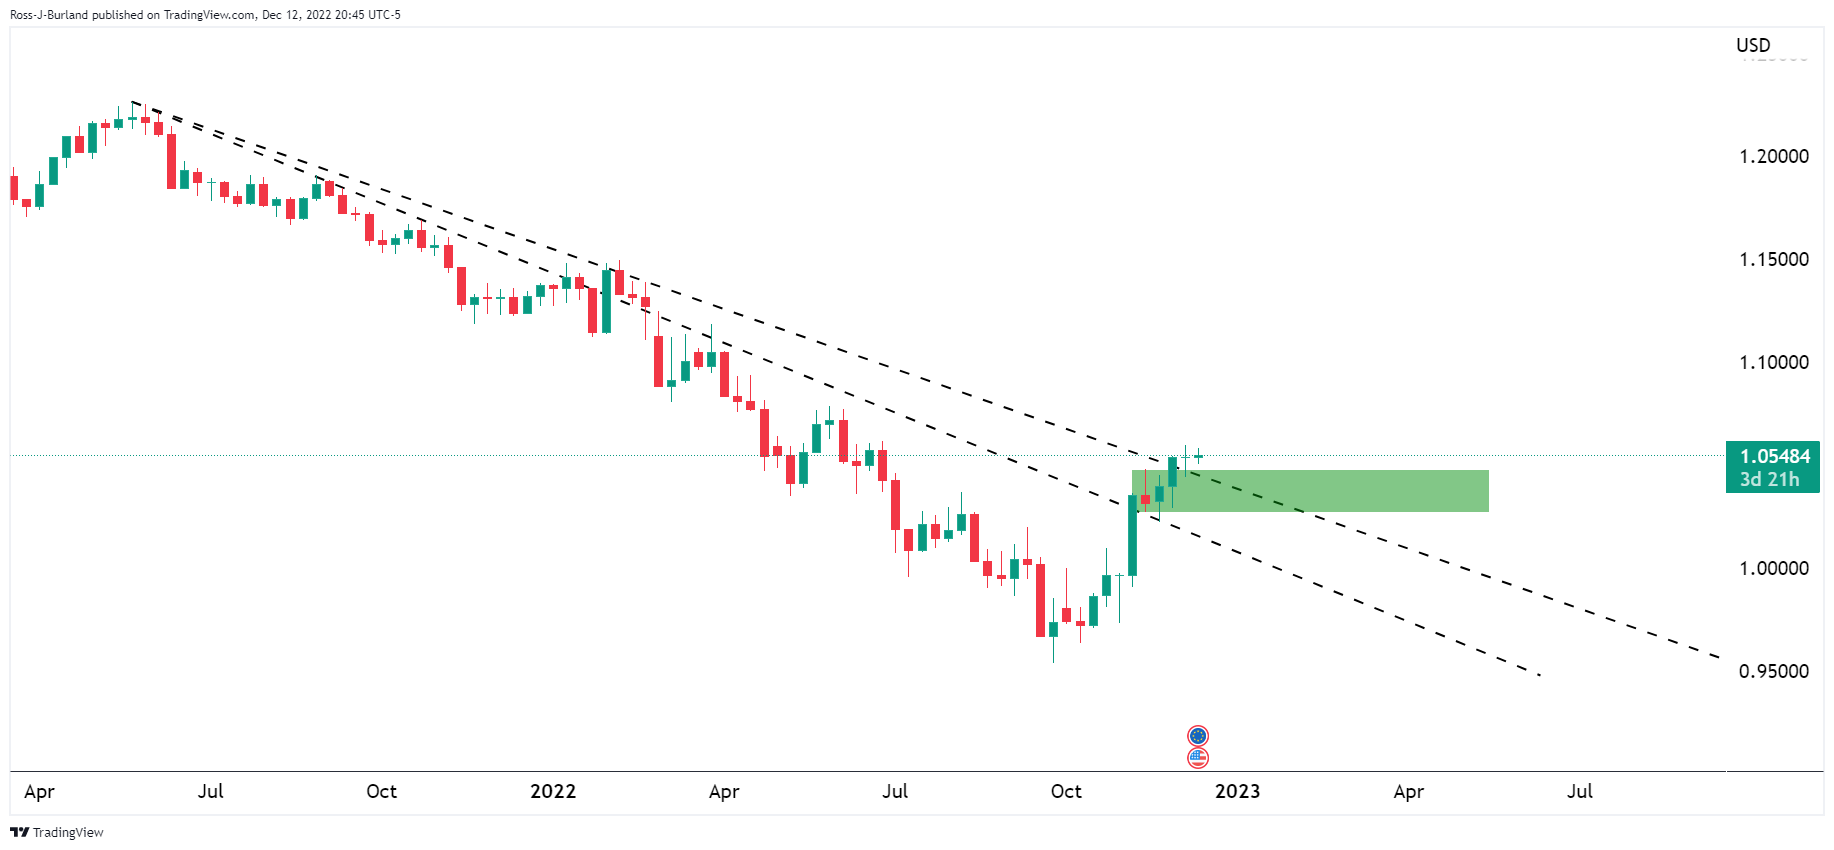
The bulls are taking out key weekly trendlines as the price moves into the mid-1.0550 resistance area. While the bias is to the upside, there are prospects of a bearish correction as follows:
EUR/USD daily charts
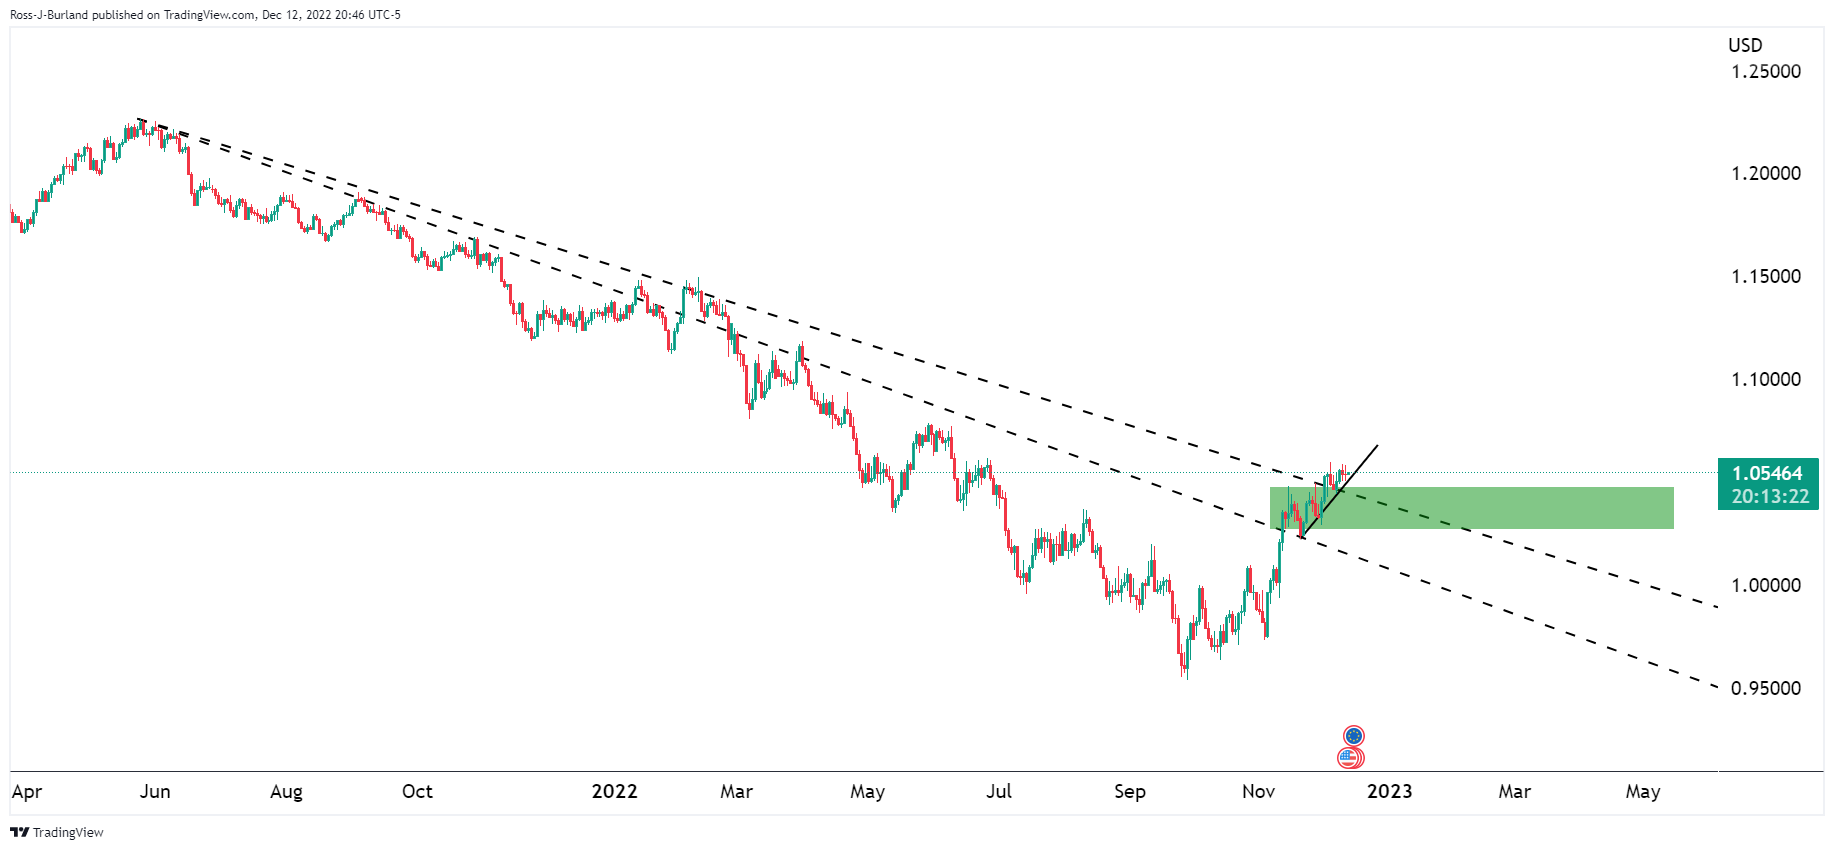
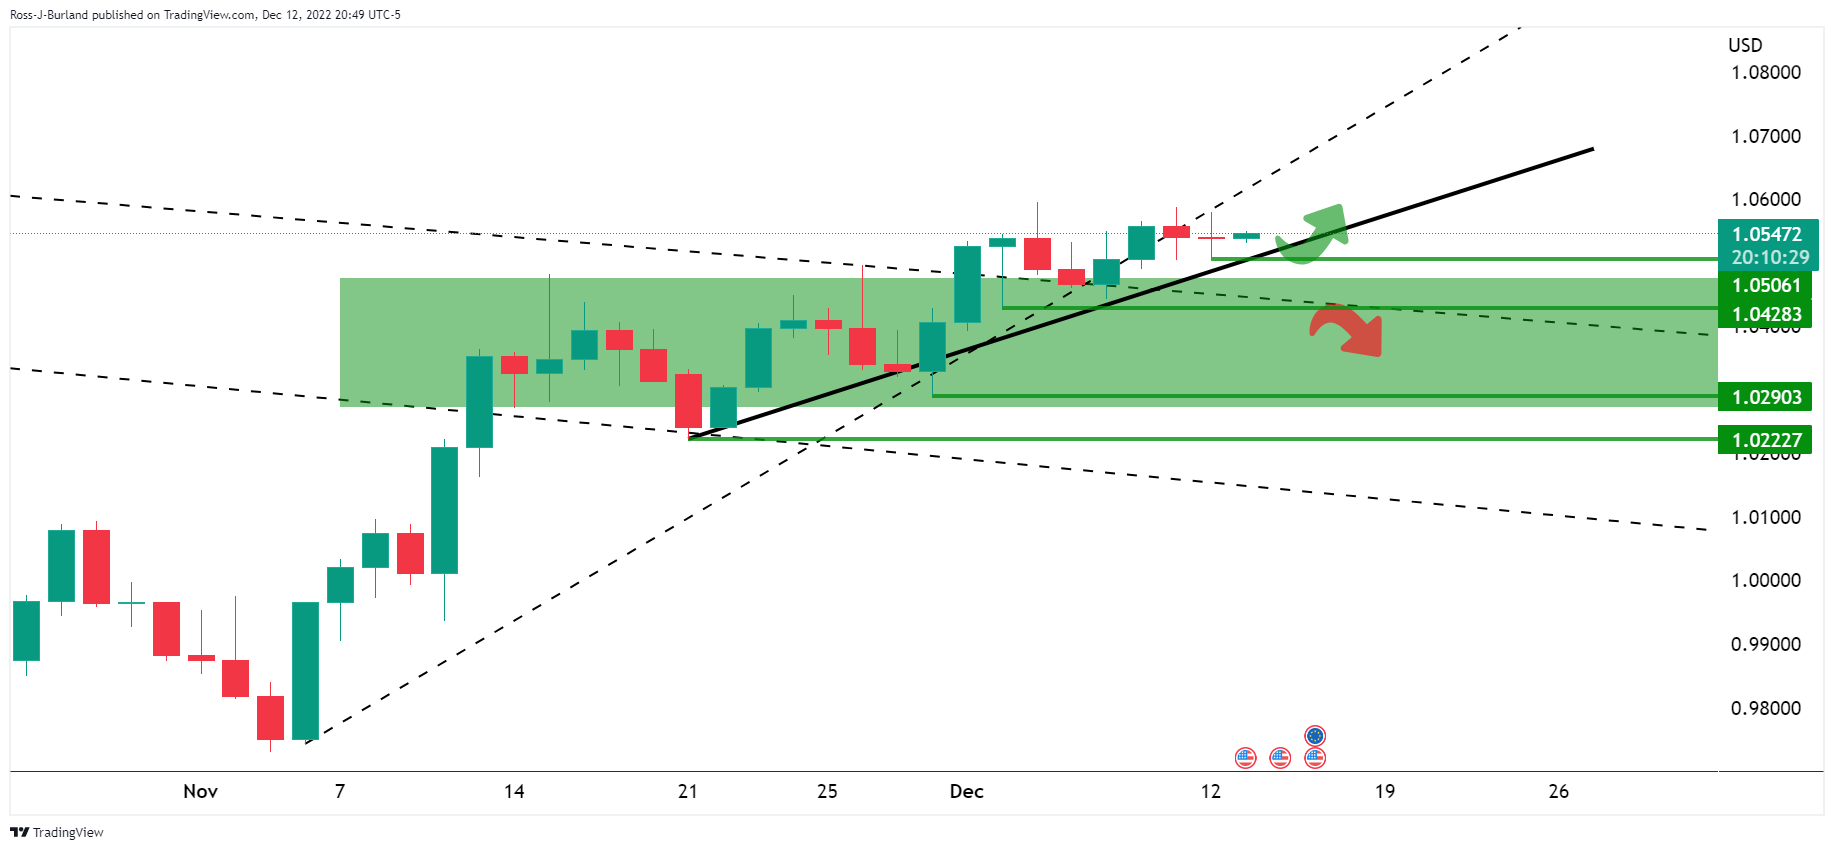
The price is decelerating on the bid and is starting to erode the trend with a move that is taking out the micro trendline as illustrated above. A break of the 1.0500 level opens the risk of a deep correction for the days ahead.
-
01:48
EUR/JPY Price Analysis: Bulls cheer break of 144.70 hurdle to refresh three-week high
- EUR/JPY stays mildly bid at the highest levels since November 23.
- Clear break of 50-DMA, seven-week-old descending trend line join bullish MACD signals to favor buyers.
- Sellers need to conquer four-month-old support line to retake control.
EUR/JPY remains sidelined above 145.00 after refreshing the three-week top during early Tuesday, near 145.20 by the press time.
The cross-currency pair rose to a fresh multi-day high after crossing the 144.70 resistance confluence, now support, which comprises 50-DMA and a downward-sloping trend line from October 13.
The resistance breakout also gains support from the bullish MACD signals to direct the EUR/JPY buyers towards September’s high near 145.65. However, the late November swing highs near 146.15 could challenge the pair’s further upside.
That said, multiple hurdles around 147.20 and 147.80 also challenge the EUR/JPY pair’s further advances ahead of highlighting the yearly peak of 148.40 marked in October.
In a case where the quote remains firmer past 148.40, the odds of witnessing the 150.00 round figure on the chart can’t be ruled out.
Meanwhile, pullback moves remain elusive unless the EUR/JPY pair stays beyond 144.40 resistance-turned-support.
Following that, a downward trajectory towards the 38.2% Fibonacci retracement level of the August-October upside, near 142.70, can’t be ruled out.
However, an ascending trend line from early August, close to 142.00, appears crucial for the EUR/JPY bears to break before taking control.
EUR/JPY: Daily chart
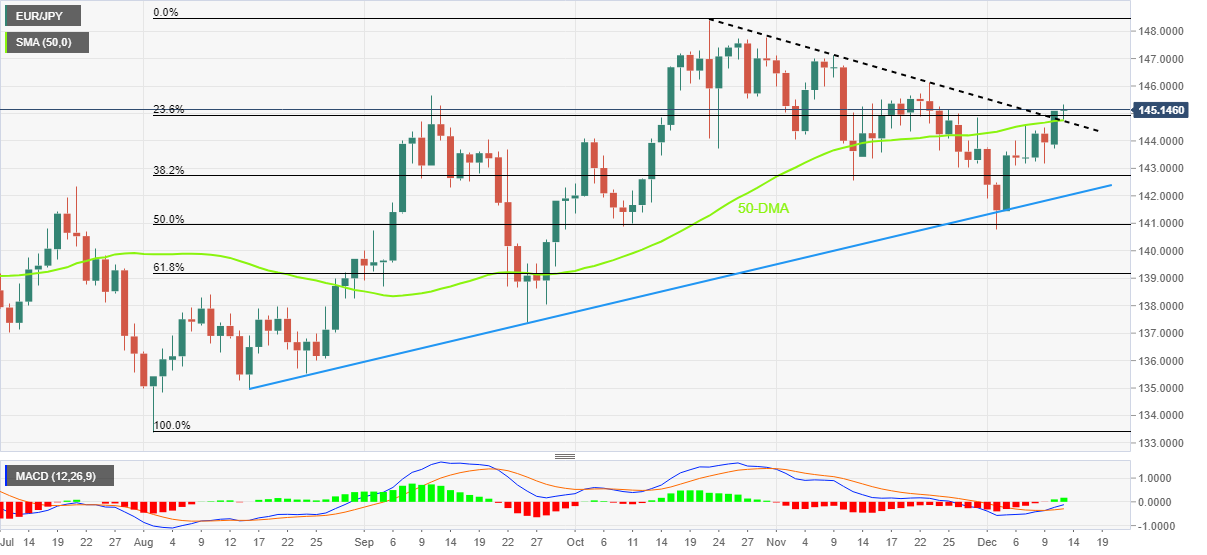
Trend: Further upside expected
-
01:36
Gold Price Forecast: XAU/USD shines above $1,780 amid volatile US Dollar, spotlight is on US CPI
- Gold price has sensed decent demand after dropping below $1,780.00 as the US Dollar has turned volatile.
- S&P500 futures recovered vigorously as investors shrugged off inflation expectations-inspired uncertainty.
- A decline in US one-year inflation expectations has also dented casual inflation consensus.
Gold price (XAU/USD) has displayed a recovery after dropping below the crucial support of $1,780.00 in the Asian session. The precious metal witnessed a steep fall on Monday as investors are expecting higher interest rate peak guidance by the Federal Reserve (Fed) for CY2023.
A recovery in Gold price banks upon an improvement in the risk appetite theme. The US Dollar Index (DXY) has dropped below 105.00 in early trade and is expected to extend its losses ahead. S&P500 futures recovered vigorously on Monday as investors shrugged off inflation expectations-inspired uncertainty. The 10-year US Treasury yields have sensed pressure and have dropped below 3.60% as the Fed is highly likely to buzz a slowdown in the interest rate hike pace ahead.
A decline in United States one-year consumer inflation expectations has also dented consensus for casual inflation figures. The economic data declined to 5.2% in November from 5.9% in October, marking the biggest one-month decline on record. The headline inflation is seen slowing down to 7.3% from the former release of 7.7%.
Analysts at JP Morgan Chase & Co. believe that a soft reading in United States Consumer Price Index (CPI) data could spark a powerful rally in United States equities. The 500-stock basket of the United States could rally up to 10% if headline inflation drops to 6.9% or lower, as reported by Bloomberg.
Gold technical analysis
Gold price has found cushion on a confluence of the 200-period Exponential Moving Average (EMA), which is marginally above $1,780.00 and the upward-sloping trendline plotted from November 23 low at $1,721.23 on an hourly scale.
Meanwhile, the Relative Strength Index (RSI) (14) is looking to come out of the bearish range of 20.00-40.00 for a decisive recovery.
Gold hourly chart
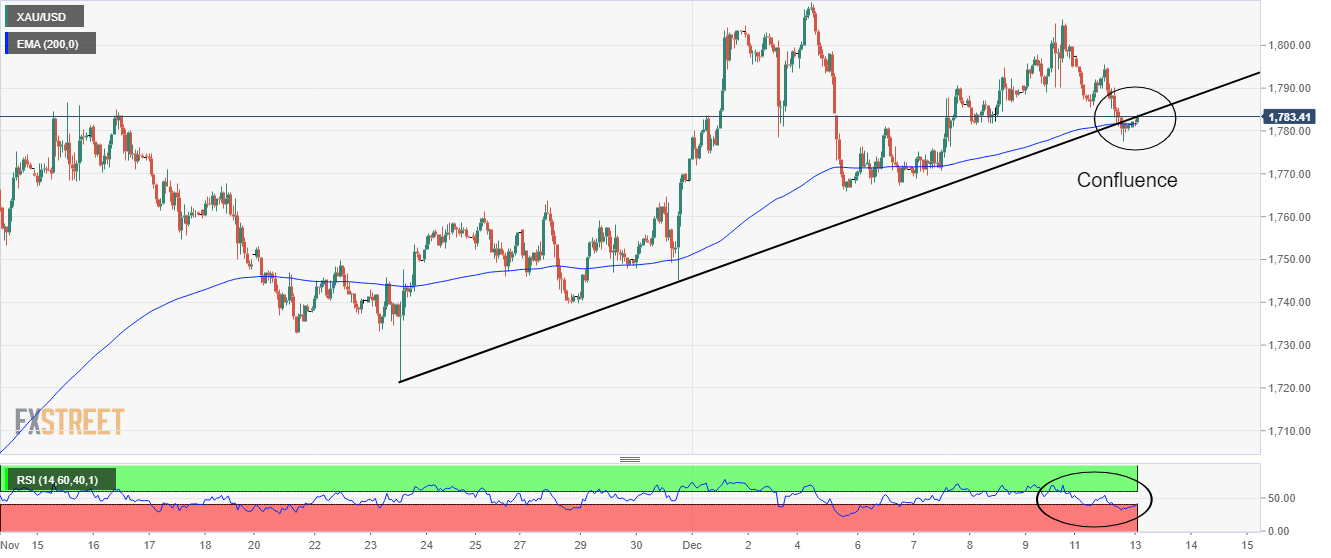
-
01:22
S&P 500 Futures, US Treasury bond yields portray market’s anxiety ahead of US inflation release
- Global markets remain dicey ahead of the key US CPI for November.
- S&P 500 Futures struggle despite upbeat closing on Wall Street.
- US 10-year, 2-year Treasury bond yields snap three-day uptrend.
- Mixed precursors for US inflation readings, lighter macros also restrict trading momentum.
Typical pre-data inaction prevails during early Tuesday in the market as traders brace for the US Consumer Price Index (CPI) for November. Also likely to have restricted the trading moves could be the mixed signals for the US inflation data, as well as a light macro line and lack of major data in the Asian session.
Traders witnessed downbeat prints of the United States Producer Price Index (PPI) on Friday, as well as firmer readings of the University of Michigan’s (UoM) Consumer Sentiment Index, inflation expectations from the UoM Survey and ISM Services PMI.
However, on Monday, the New York Federal Reserve’s (Fed) Survey of Consumer Inflation Expectations Survey stated on that the 1-year ahead inflation expectations slumped to their lowest level since 2021 and marked the biggest month-to-month decline in November on record. The short-term inflation precursor from the NY Fed contrasts with the upbeat inflation expectations for the 5-year and 10-yaer reported by the St. Louis Federal Reserve (FRED) data. That said, the latest prints of the 5-year and 10-year inflation expectations portray a rebound to 2.28% and 2.35% respectively.
On a different page, mixed headlines from China and Russia also challenged the market moves. Chinese Foreign Ministry spokesman Wang Wenbin conveyed dislike for the US sanctions on two of their diplomats on Monday. “These illegal sanctions severely affected Sino-American relations,” Wang said as per Reuters. Further, Russian President Vladimir Putin rejected to supply oil to the countries respecting Europe-led price cap.
Amid these plays, the US 10-year and two-year Treasury bond yields print the first daily loss in four around 3.59% and 4.36% in that order while the S&P 500 Futures print mild losses near 4,022 despite strong Wall Street close on Monday.
-
01:20
USD/CNY fix: 6.9746 vs. last close 6.9779
In recent trade today, the People’s Bank of China (PBOC) set the yuan (CNY) at 6.9746 vs. the last close of 6.9779.
About the fix
China maintains strict control of the yuan’s rate on the mainland.
The onshore yuan (CNY) differs from the offshore one (CNH) in trading restrictions, this last one is not as tightly controlled.
Each morning, the People’s Bank of China (PBOC) sets a so-called daily midpoint fix, based on the yuan’s previous day's closing level and quotations taken from the inter-bank dealer.
-
01:18
USD/CAD Price Analysis: Bulls and bears battle around key trendlines
- USD/CAD bulls need to commit and get onto the backside of the trend.
- A break of the 1.3620d opens downside risks for the day ahead.
USD/CAD bears are in play as the price moves in to test the 1.3620s as the following technical analysis illustrates. The bears are moving in as the price seeps out to the backside of the 4-hour bullish trendline.
USD/CAD H4 chart
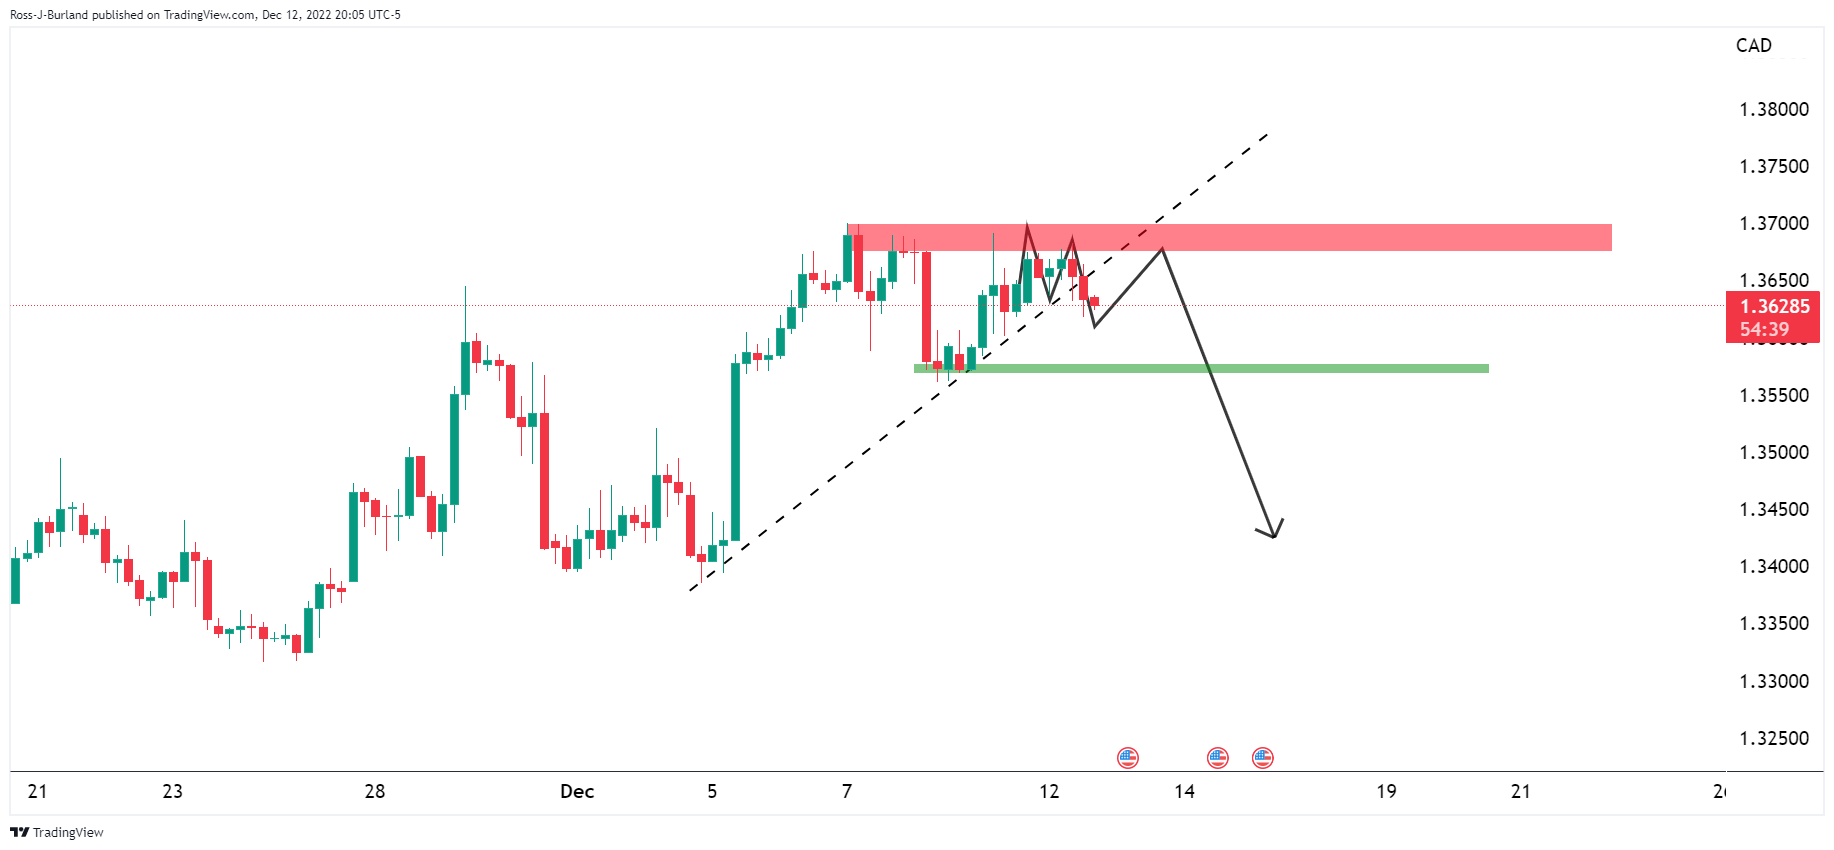
A phase of distribution could start to come into play and that leaves prospects of a meanwhile retest of resistance near 1.3700 recent highs. However, the 4-hour M-formation's neckline could act as a meanwhile resistance in the 1.3650s.
USD/CAD M5 chart
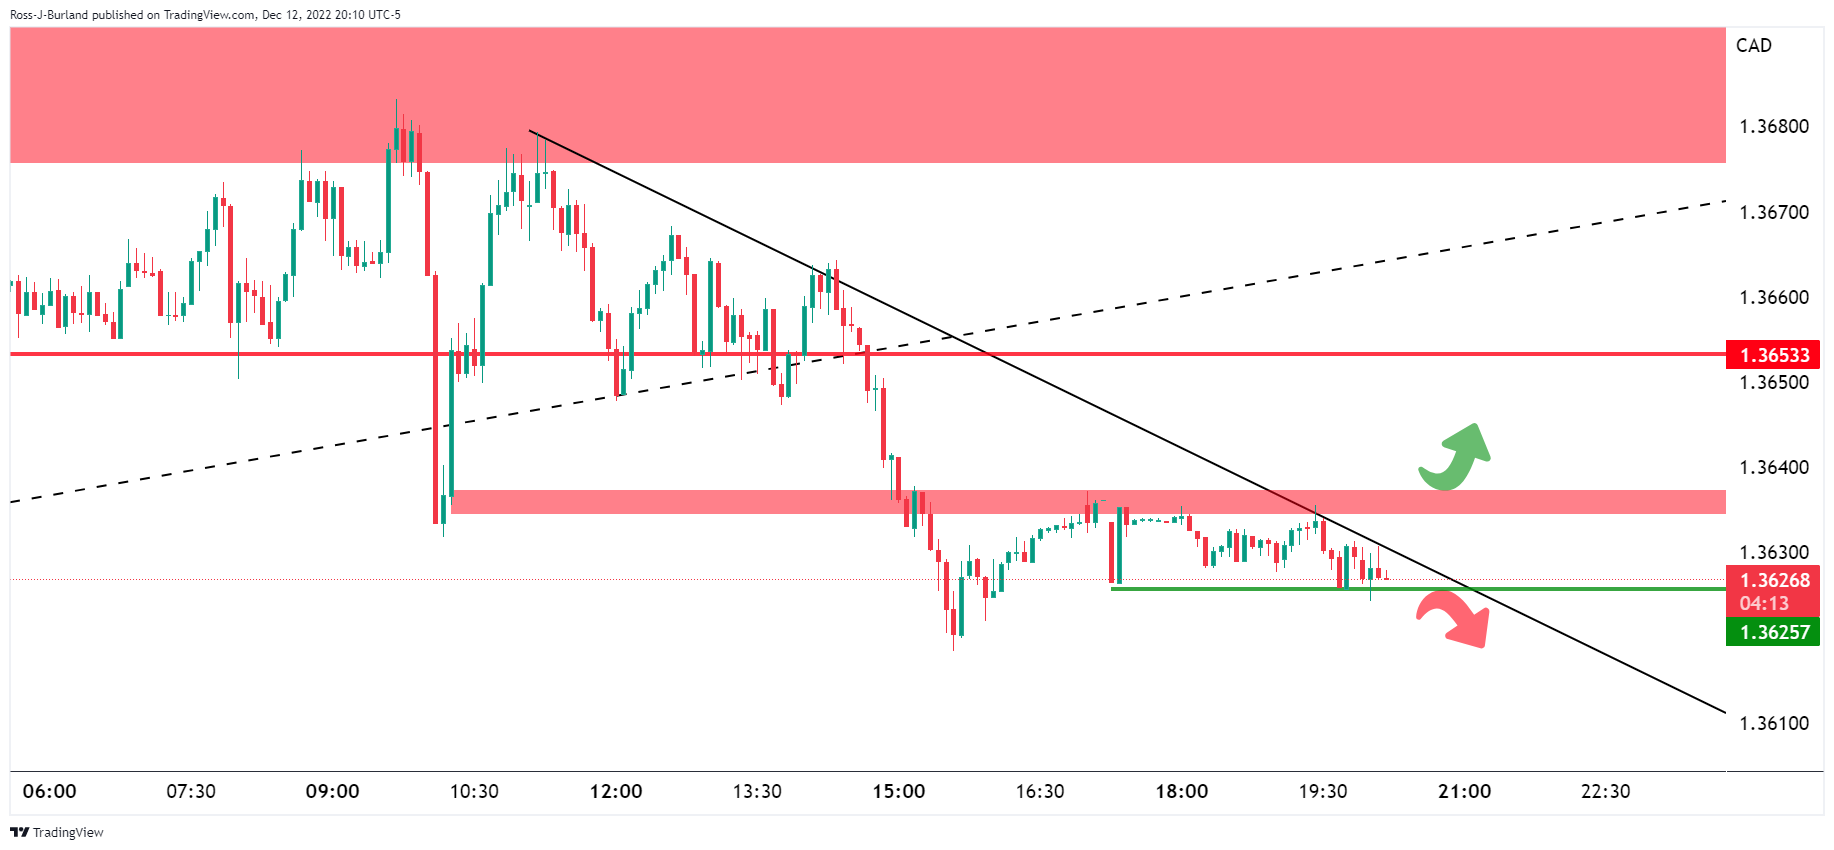
The bulls need to get onto the backside of the bearish trendline or face a potential continuation to the downside on a break below 1.3625. If, on the other hand, the bulls do manage to accumulate on the backside of the trend, then the H4 M-formation's neckline will be exposed for a move into the 1.3650s.
-
01:03
Silver Price Analysis: Bull flag teases XAG/USD buyers above $23.00
- Silver price remains mildly bid inside a bullish chart pattern.
- XAG/USD buyers need validation from $23.40, key HMAs restrict immediate downside.
- Impending bulls cross on MACD, firmer RSI add strength to the bullish bias.
Silver price (XAG/USD) renews its intraday high around $23.35 as it prints mild gains to reverse the previous day’s losses during early Tuesday. In doing so, the bright metal remains inside a bull flag chart pattern suggesting the quote’s further upside.
In addition to the bull flag, the looming bullish cross on the MACD and mostly steady RSI (14) also keep the XAG/USD buyers hopeful as they refresh the daily top.
However, a clear upside break of the stated flag’s upper line, near $23.40 by the press time, becomes necessary for the Silver buyers.
Following that, the monthly high near $23.70 and March’s low near $24.00 may act as intermediate halts during the theoretical target surrounding $25.10.
In a case where the XAG/USD remains firmer past $25.10, April’s high and the yearly top, around $26.00 and $26.95 in that order, will gain the market’s attention.
Alternatively, the Silver bears need to conquer the stated flag’s support line, close to $23.00 at the latest, for entries.
Even so, the 100-Hour Moving Average (HMA) and the 200-HMA, respectively near $22.95 and $22.75, could challenge the XAG/USD sellers before giving them control.
Overall, silver is likely to witness further upside but the $23.40 is the key to watch.
Silver price: Hourly chart

Trend: Further upside expected
-
01:01
GBP/USD aims to recapture 1.2300 amid upbeat market mood, US/UK Inflation in focus
- GBP/USD is looking to recapture 1.2300 amid positive market sentiment.
- The US Dollar Index has dropped below 105.00 on expectations of a decline in US Inflation.
- Investors should not ignore the expectations of a surprise rise in UK inflation amid a solid food price rise.
The GBP/USD pair has picked demand after dropping to near 1.2260 in the Tokyo session. The Cable is aiming to recapture the round-level resistance of 1.2300 as investors’ risk appetite has improved dramatically ahead of the release of the United States inflation data.
The US Dollar index (DXY) has dropped below the round-level support of 105.00 as pre-US inflation anxiety among investors has faded. S&P500 futures are withstanding their Monday’s gains recorded on expectations of a decline in the inflationary pressures. On a broader note, an expected shift in the approach of the Federal Reserve (Fed) toward the pace of interest rates has underpinned optimism.
The street is expecting a decline in the US Consumer Price Index (CPI) led by a decline in gasoline prices and one-year consumer-inflation expectations. New York's monthly Survey of Consumer Expectations showed on Monday that the US consumers' one-year inflation expectation declined to 5.2% in November from 5.9% in October, marking the biggest one-month decline on record. This has resulted in a decline in consensus for headline inflation to 7.3% and core inflation to 6.1%.
On the Pound Sterling front, investors are awaiting the release of the United Kingdom Employment and CPI data, which are due on Tuesday and Wednesday respectively. The quarterly Unemployment Rate (October) is seen higher at 3.7% against the former release of 3.6%. Apart from that, the crucial catalyst is the Average Earnings data. Quarterly Average Earnings excluding Bonus data are seen higher at 5.9% vs. the former release of 5.7%.
While the UK headline inflation is expected to decline to 10.9% from the former release of 11.1%. Investors should not ignore the expectations of a surprise rise in inflation as food price inflation has soared led by the food supply crisis due to shortages of labor and higher input costs.
-
00:51
WTI bulls move in on supply side issues, Fed looms
- Crude Oil was higher on Monday, as supply-side issues offset concerns of weaker demand.
- TC Energy Corp said its continuing its recovery efforts but gave no indication of a restart.
West Texas Intermediate, WTI, crude oil was higher on Monday, as supply-side issues offset concerns of weaker demand. At the time of writing, WTI is trading at $73.40 and a touch higher by some 0.1% having climbed from a low of $73.27 to reach a high of $73.51.
Supply issues have overcome recession worries despite the pending US consumer Price index and the Federal Reserve meeting which are events coming up over the next sessions. The Fed is expected to hike rates by 50 bps on Wednesday after today's inflation data from other US which could cement the sentiment surrounding the Fed.
''Core prices likely maintained a firm pace in November, rising 0.3% MoM for a second consecutive month. Shelter inflation likely remained the key wildcard, though we look for goods deflation to act again as an offset. Importantly, gas prices are expected to provide relief to the CPI, as they fell in Nov. All told, our m/m forecasts imply 7.3%/6.1% YoY for total/core prices,'' analysts at TD Securities said.
Meanwhile, the money markets are currently pricing an almost 75% chance that the US central bank will hike rates by 50 basis points after delivering four successive 75 basis point rate increases. However, some analysts anticipate a hawkish outcome from the event.
TC Energy Corp latest
For oil-related news, despite reports that the Keystone pipeline was being partially reopened, it remained completely shut on Monday, analysts at ANZ Bank explained:
''TC Energy Corp said its continuing its recovery efforts but gave no indication of a restart. The pipeline is a key conduit for Canadian crude into the WTI pricing point of Cushing. WTI subsequently rallied more than 3%.''
Meanwhile, the analysts noted that the uncertainty surrounding the impact of European sanctions on Russian oil is subsiding:
''Ship tracking data suggests Russian crude is being diverted to China and India. The flows into Asia have surge to more than 3mb/d in the week to 9 December. This accounts for 89% of all shipments from Russia. Weakness in China is also persisting. The number of supertankers signalling China as their next destination fell to 104, the lowest level since 30 September. The glut of tankers in Turkey’s vital shipping strait is also clearing. On Sunday, only 19 tankers were waiting to pass through, down from 27 on Saturday.''
-
00:40
US 5-year, 10-year inflation expectations rebound ahead of US CPI release
US inflation expectations as per the 10-year and 5-year breakeven inflation rates per the St. Louis Federal Reserve (FRED) data, challenge the recently dovish bias over the US Federal Reserve (Fed), as well as downbeat forecasts for the US Consumer Price Index (CPI). The inflation precursors might have taken clues from Friday’s mixed data to challenge the US Dollar Index moves ahead of the key US inflation readings. That said, the latest prints of the 5-year and 10-year inflation expectations portray a rebound to 2.28% and 2.35% respectively.
It’s worth noting that the New York Federal Reserve’s (Fed) Survey of Consumer Inflation Expectations Survey stated that the 1-year ahead inflation expectations slumped to their lowest level since 2021 and marked the biggest month-to-month decline in November on record.
On Friday, downbeat prints of the United States Producer Price Index (PPI) also hinted at softer US inflation. However, the University of Michigan’s (UoM) Consumer Sentiment Index, as well as the US ISM Services PMI and inflation expectations from the UoM Survey, suggested firmer prints of the US CPI.
Amid these plays, market players forecast the US CPI for November to print a softer 7.3% YoY versus 7.7% prior figure. Further, the monthly CPI is likely to ease to 0.3% compared to 0.4% in previous readings. It should be noted that the CPI ex Food & Energy appears to be the key and is expected to be unchanged at 0.3% MoM, which can please the US Dollar Index (DXY) buyers in case of a firmer print.
Also read: US Dollar Index pares recent gains around 105.00 with eyes on US inflation, Fed
-
00:30
Australia National Australia Bank's Business Confidence below expectations (5) in November: Actual (-4)
-
00:30
Australia National Australia Bank's Business Conditions meets forecasts (20) in November
-
00:30
Stocks. Daily history for Monday, December 12, 2022
Index Change, points Closed Change, % NIKKEI 225 -58.68 27842.33 -0.21 Hang Seng -437.24 19463.63 -2.2 KOSPI -16.02 2373.02 -0.67 ASX 200 -32.4 7180.8 -0.45 FTSE 100 -30.63 7445.97 -0.41 DAX -64.09 14306.63 -0.45 CAC 40 -27.09 6650.55 -0.41 Dow Jones 528.58 34005.04 1.58 S&P 500 56.18 3990.56 1.43 NASDAQ Composite 139.12 11143.74 1.26 -
00:29
NZD/USD Price Analysis: Struggles to extend the bounce off 0.6370 support confluence
- NZD/USD seesaws around intraday high, remains indecisive on a day.
- Convergence of 50-SMA, one-week-old ascending trend appears a tough nut crack for bears.
- Bulls need validation from 0.6420 to retake control.
NZD/USD takes rounds to 0.6390 during early Tuesday as the Kiwi pair traders await more clues to extend the latest recovery from the key support confluence. In doing so, the quote highlights the market’s cautious mood ahead of the United States inflation numbers for November, namely the Consumer Price Index (CPI).
Although NZD/USD snapped a three-day uptrend the previous day, the bears couldn’t conquer a convergence of the 50-bar Simple Moving Average (SMA) and a one-week-old ascending support line, around 0.6370.
The pair’s rebound, however, battles with the bearish MACD signals to challenge the NZD/USD buyers. Also challenging the Kiwi pair’s upside momentum could be the downward-sloping resistance line from December 05, close to 0.6420 by the press time.
In a case where the NZD/USD remains firmer past 0.6420, the odds of witnessing a run-up to refresh the monthly high surrounding 0.6475-80 can’t be ruled out.
On the flip side, a clear break of the 0.6370 support confluence could quickly fetch the quote towards the previous weekly low near the 0.6300 round figure.
However, the 100-SMA and 61.8% Fibonacci retracement level of the NZD/USD pair’s November 28 to December 01 upside, respectively near 0.6290 and 0.6280, could challenge the bears afterward.
NZD/USD: Four-hour chart
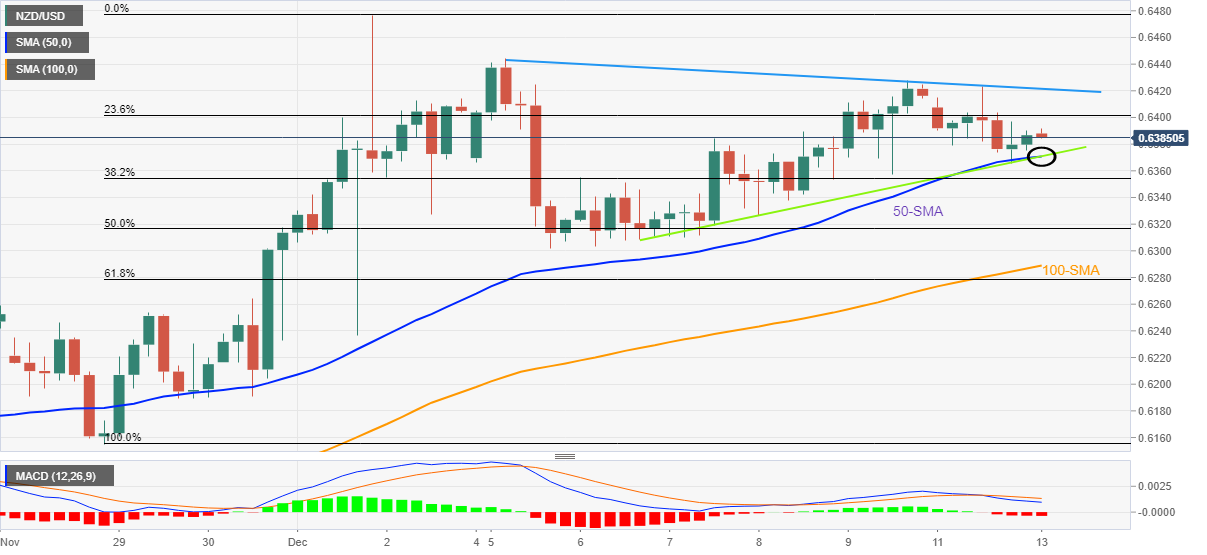
Trend: Limited upside expected
-
00:27
USD/JPY rebounds from 137.50 despite risk-on mood hogs limelight, US Inflation eyed
- USD/JPY has resurfaced after dropping to near 137.50 despite the cheerful market mood.
- The US Dollar index has turned volatile after failing to surpass the critical hurdle of 105.20.
- A fresh rebound in labor demand and an upbeat US service sector could propel a surprise rise in inflation.
The USD/JPY pair has rebounded after displaying a brief inventory adjustment of around 137.50 in the early Asian session. The US Dollar Index (DXY) has turned volatile after failing to surpass the critical hurdle of 105.20 consecutively. The USD Index (DXY) is hovering below the crucial support of 105.00.
Apart from that, a significant recovery in the risk-on profile is supporting the Japanese Yen. S&P500 futures are holding their Monday’s gains made on expectations of a decline in the United States Consumer Price Index (CPI) data.
Meanwhile, the demand for US Treasury bonds has dropped as investors expect higher interest rate guidance by the Federal Reserve (Fed) in its monetary policy meeting on Wednesday. The 10-year US Treasury yields have surpassed the critical resistance of 3.60%.
In Tuesday’s session, the spotlight will remain on the US inflation data. The headline CPI is seen lower at 7.3% against the former release of 7.7% led by a significant fall in oil prices and US Producer Price Index (PPI) data. Also, the core CPI is seen lower at 6.1% vs. the prior figure of 6.3%. Investors should not ignore a fresh rebound in demand for labor and upbeat demand in the US service sector, which could result in a surprise rise in the inflation rate.
On the Tokyo front, a fresh drive of policy easing is expected from Bank of Japan (BOJ) policymakers to spur the extent of economic activities. Subdued demand from households led by weak wage growth is restricting inflation to steady at 2%.
-
00:23
New Zealand REINZ House Price Index (MoM) fell from previous 0.2% to -1.4% in November
-
00:23
AUD/USD Price Analysis: Bulls testing bearish commitments at key H4 resistance
- AUD/USD M-formation is compelling and traders will wait to see if the bears commit at the neckline resistance.
- A break of the trendline support, however, opens the risk of a move to test 0.6650 and then 0.6580.
AUD/USD is up 0.13% having rallied from a low of 0.6744 to a high of 0.6759 in what appears to be a technical move, retesting a 4-hour M-formation;'s neckline in what could be the last defence for a considerable;e move higher.
However, should the resistance hold, there will be prospects of a downside continuation and even a break of the channel's support for the days ahead. Fundamentally, renewed fears of a global recession could weigh on commodity-linked currencies as we head into key events from the US, including the Consumer Price Index on Tuesday and the Federal Reserve on Wednesday.
Meanwhile, the Aussie's flight trajectory could b3 something along the lines of the following:
AUD/USD H4 charts

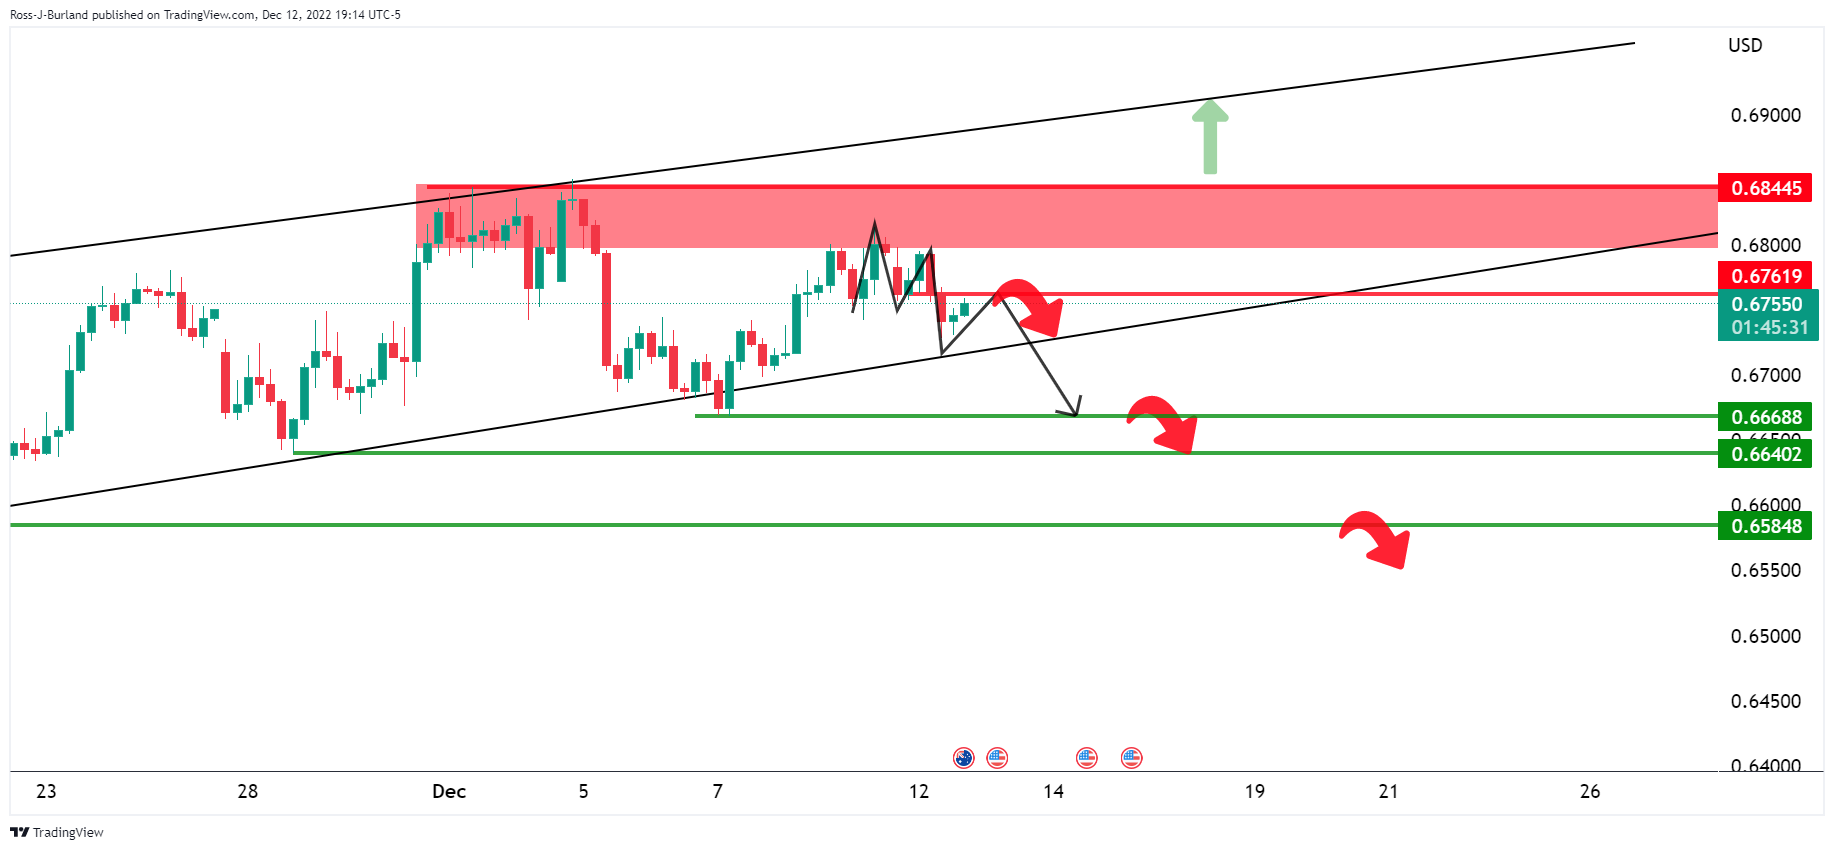
As illustrated, the price of AUD/USD has been moving to the upside in a channel following the break of the prior bear trend. The M-formation is compelling and traders will wait to see if the bears commit at the neckline resistance near 0.6760 or if the bulls can get back control with eyes on 0.6850. A break of the trendline support, however, opens the risk of a move to test 0.6650 and then 0.6580.
-
00:15
Currencies. Daily history for Monday, December 12, 2022
Pare Closed Change, % AUDUSD 0.67477 -0.59 EURJPY 145.034 0.95 EURUSD 1.05379 0.09 GBPJPY 168.794 0.9 GBPUSD 1.22647 0.1 NZDUSD 0.63831 -0.39 USDCAD 1.36335 0.05 USDCHF 0.93592 0.36 USDJPY 137.626 0.84 -
00:07
US Dollar Index pares recent gains around 105.00 with eyes on US inflation, Fed
- US Dollar Index snaps two-day recovery, prints mild losses of late.
- Mixed sentiment, cautious mood ahead of US CPI, Fed meeting challenge DXY traders.
- Risk catalysts offer additional trading filters amid a light calendar in Asia.
US Dollar Index (DXY) portrays the market’s cautious mood ahead of the United States' key inflation numbers for November, namely the Consumer Price Index (CPI), up for publishing on Tuesday. That said, the greenback’s gauge versus the six major currencies rose during the last two days before printing a sluggish start to Tuesday’s trading, around 104.95 by the press time.
That said, the DXY’s inaction could be linked to the mixed prints of the early signals for the US CPI, as well as the mixed reaction to the headlines surrounding China and Russia.
On Monday, the New York Federal Reserve’s (Fed) Survey of Consumer Inflation Expectations Survey stated that the 1-year ahead inflation expectations slumped to their lowest level since 2021 and marked the biggest month-to-month decline in November on record. It’s worth observing that the last week’s downbeat prints of the United States Producer Price Index (PPI) also hinted at softer US inflation but the University of Michigan’s (UoM) Consumer Sentiment Index, as well as the US ISM Services PMI and inflation expectations from the UoM Survey, suggested firmer prints of the US CPI.
Elsewhere, Chinese Foreign Ministry spokesman Wang Wenbin conveyed dislike for the US sanctions on two of their diplomats on Monday. “These illegal sanctions severely affected Sino-American relations,” Wang said as per Reuters. Further, Russian President Vladimir Putin’s rejection to supply oil to the countries respecting Europe-led price cap also raise the market’s fears and propel the DXY.
Amid these plays, the US 10-year Treasury bond yields rose three basis points (bps) to 3.61% but Wall Street also closed in greed and tried to challenge the DXY buyers by the end of Monday’s North American session.
Looking forward, market forecasts for the US CPI for November hint at a softer print of 7.3% YoY, versus 7.7% prior figure, while the monthly CPI is likely to ease to 0.3% compared to 0.4% previous readings. It should be noted that the CPI ex Food & Energy appears to be the key and is expected to be unchanged at 0.3% MoM, which can please the DXY buyers in case of a firmer print. Additionally, firmer inflation data can push the Federal Open Market Committee (FOMC) members to stay away from the bearish bias and defend the latest rate hikes, which in turn could signal more upside for the DXY.
Technical analysis
A one-month-old bearish channel formation, currently between 103.60 and 106.00, restricts short-term US Dollar Index moves.
-