Notícias do Mercado
-
23:46
USD/CAD Price Analysis: Bulls eye a break of 1.3450 for a look in at the 1.35 area
- USD/CAD is based above a prior target low in the 1.3320s.
- USD/CAD is embarking on a correction but 1.3450 needs to give.
As per the prior analysis, the bears were in control and ran into the target in the 1.3320s but threw in the towel there. The price has since been established and moved in to test the 1.34s.
The bears are in charge now and the 1.3350s guard a run to the 1.3300 target:
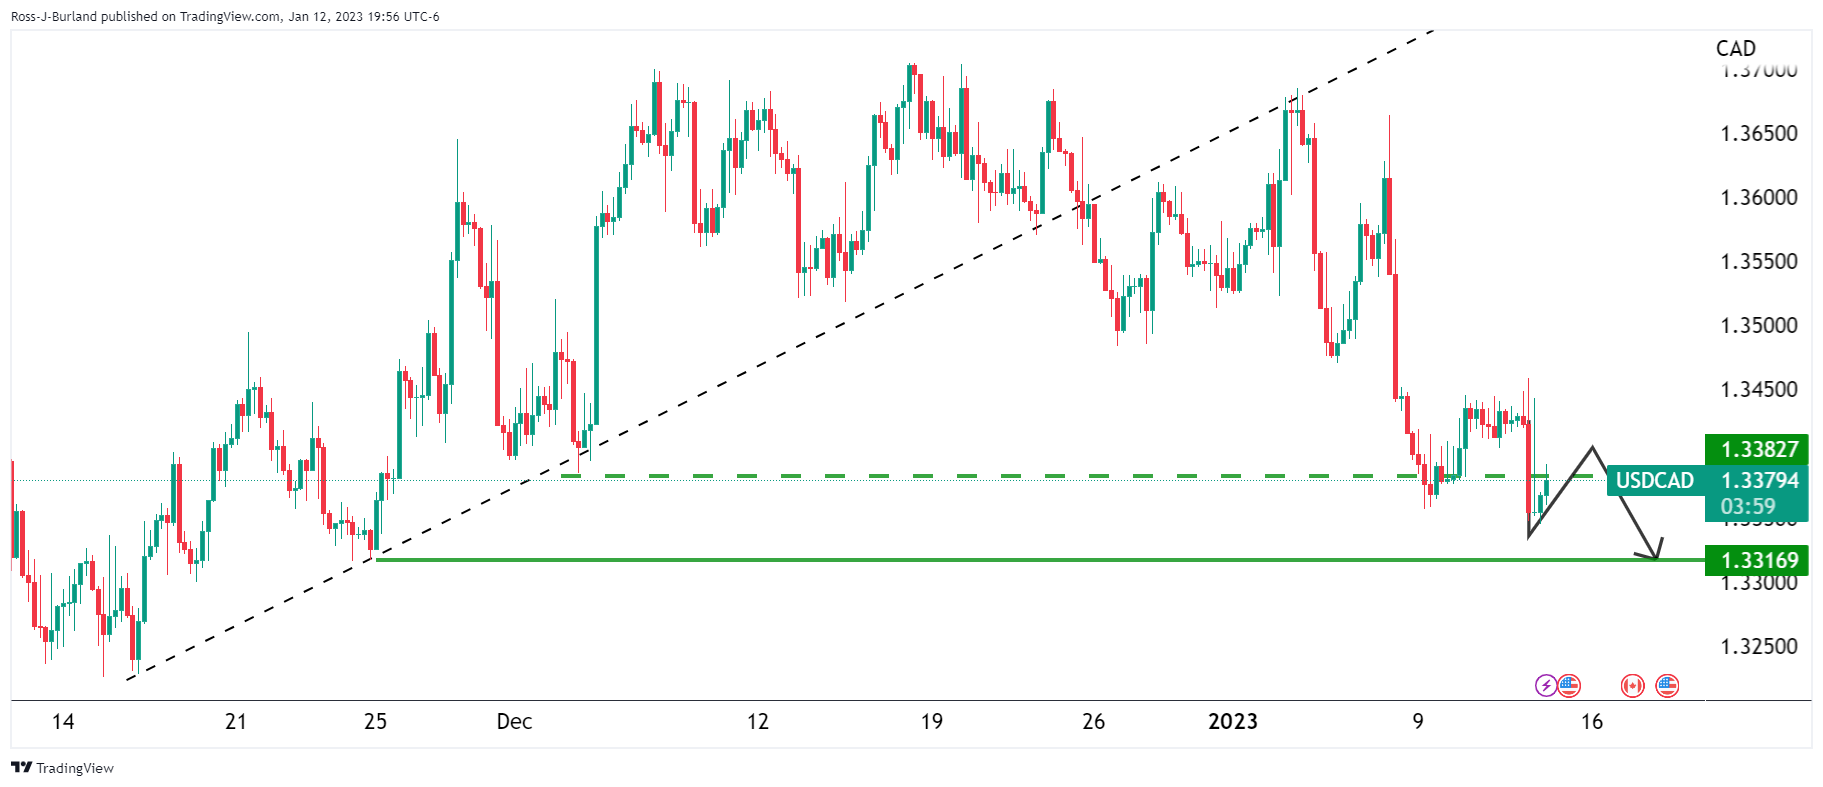
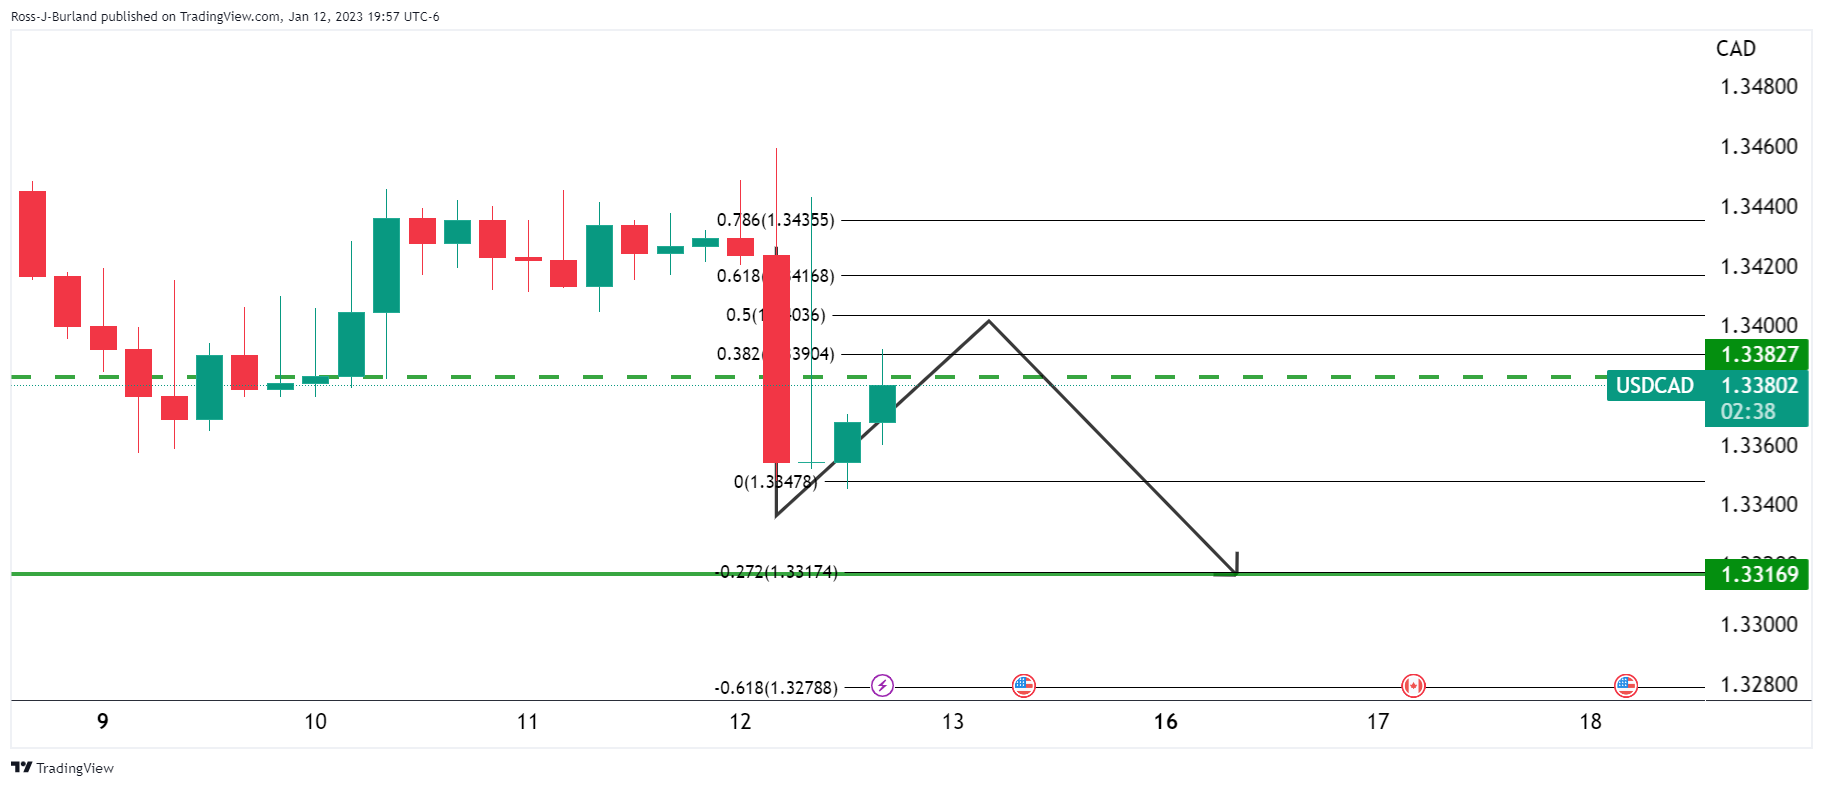
USD/CAD update

At this juncture, the price is embarking on a correction but 1.3450 needs to give:
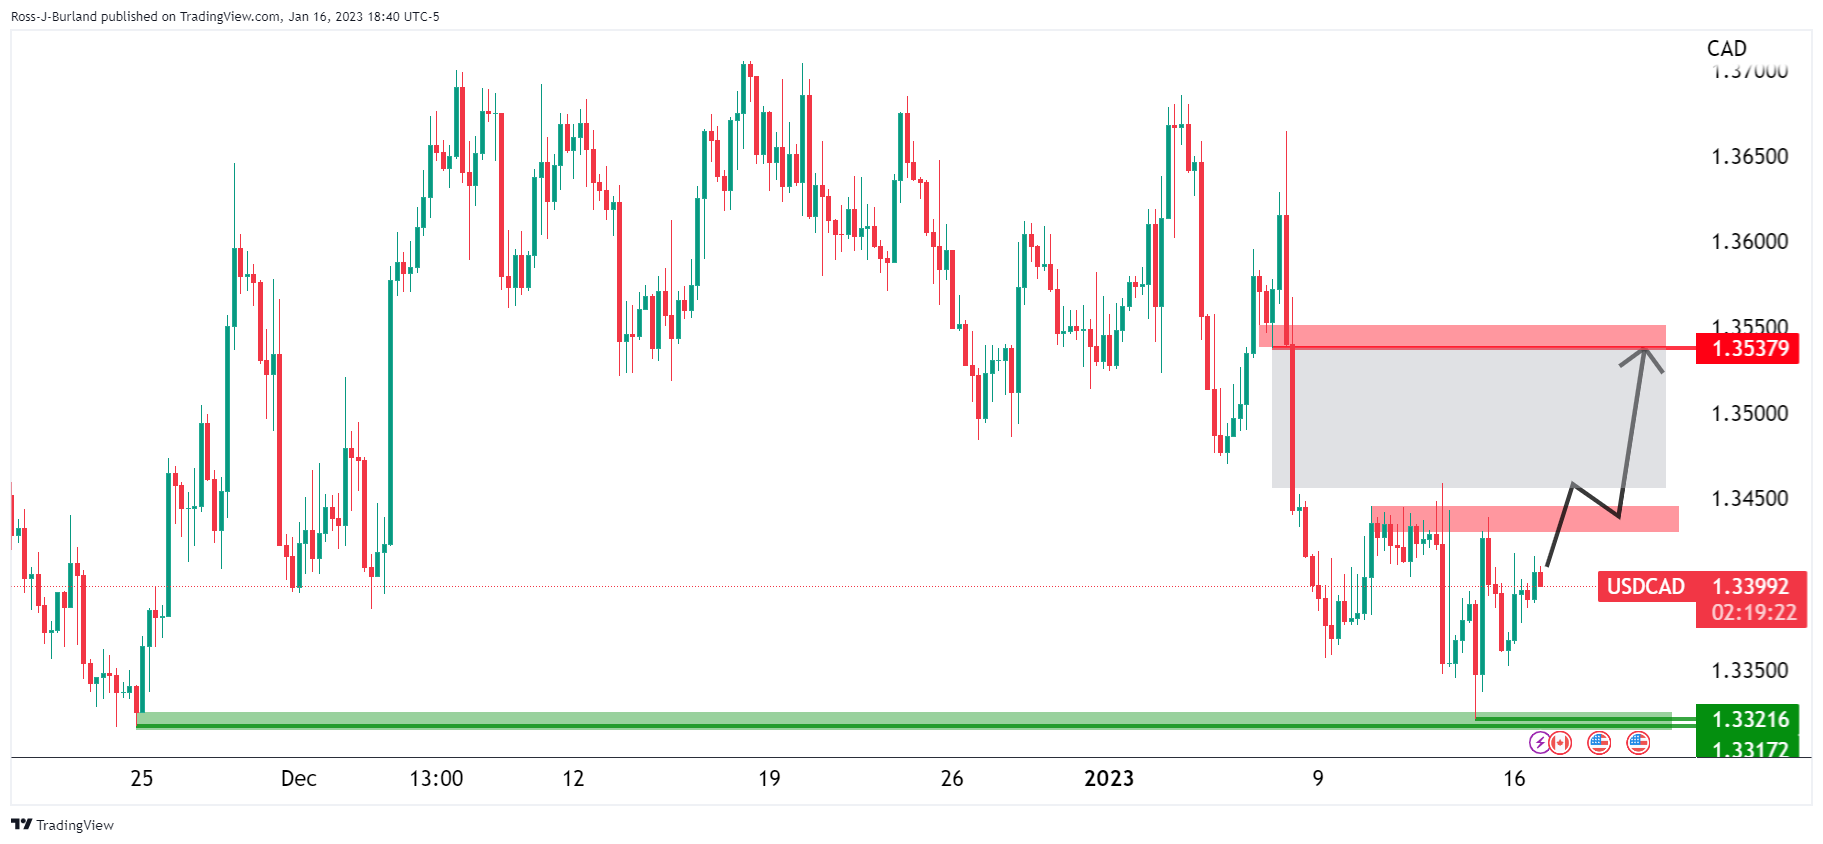
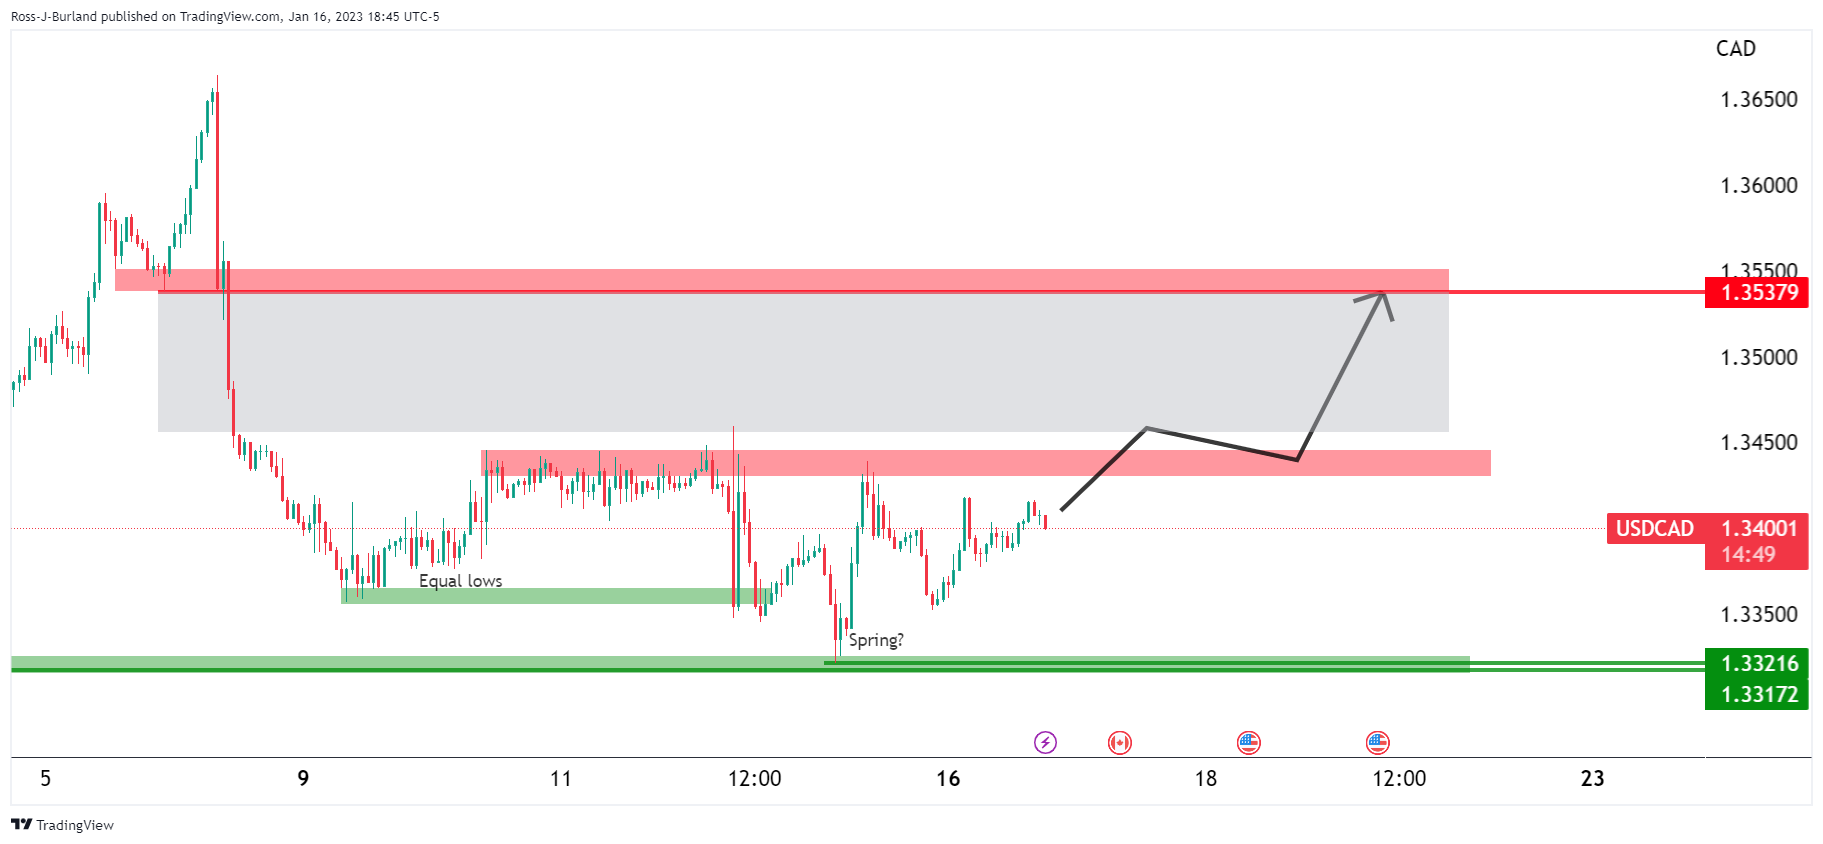
There is a price imbalance that has been left behind since the major sell-off at the start of the year that could be mitigated in the coming days towards 1.3550.
-
23:45
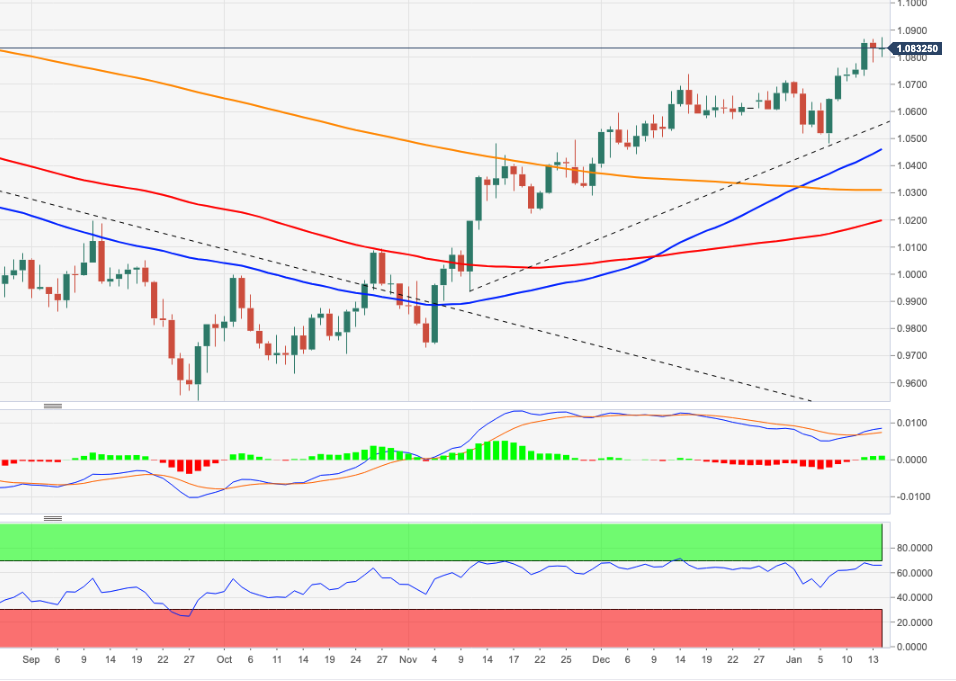
EUR/USD aims to surpass 1.0830 amid hawkish ECB bets
- EUR/USD is aiming to deliver a break of the consolidation above 1.0830 as hawkish ECB bets soar.
- The ECB is expected to hike interest rates by 50 bps in February and March, and by 25 bps in May.
- A recovery in the S&P500 futures indicates that the risk-off impulse is fading away.
The EUR/USD pair is regaining strength after a sell-off move on Monday. The major currency pair is oscillating below the immediate resistance of 1.0830 in the early Asian session. Risk-perceived currencies witnessed a healthy correction on Monday amid a recovery in the US Dollar Index (DXY).
Investors’ risk appetite is improving again as the S&P500 futures have recovered half of Monday’s losses in early Tokyo. There is no denying the fact that the 500-stock basket futures of the United States will display sheer volatility today as US markets are opening after a stretched weekend.
The USD Index is displaying signs of volatility contraction around 102.00 after a solid recovery as investors are expected to make significant positions after the release of the US Producer Price Index (PPI) data, which will release on Wednesday. As per the consensus, the economic data is expected to decline further. The headline PPI (Dec) is seen lower at 6.8% while the core PPI is seen declining to 5.9%. Producers might look to trim their losses inspired by lower prices through easing wage growth or by lay-offs, which would trim inflation projections further.
Apart from the US PPI data, monthly Retail Sales data will be keenly watched. The economic data is expected to expand by 0.1% vs. the contraction of 0.6% released earlier. It could provide strength to the US Dollar ahead.
On the Eurozone front, considering the stubborn nature of inflation and rising wage growth due to the tight labor market, European Central Bank (ECB) Governing Council member Olli Rehn said on Monday, “I see significant rate hikes at the next meetings,”
A poll from Bloomberg predicts that the ECB will reach to its terminal rate by May. ECB’s interest rate will peak at 3.25% from its current rate of 2%. Further outcomes from the poll claim that ECB President Christine Lagarde will hike the interest rates by 50 basis points (bps) in February and March meetings. And, a rate hike of 25 bps will be announced in May. Also, the central bank may not look for lowering interest rates in CY2023.
-
23:36
We could see another USD/JPY sell-off of roughly 3% – Goldman Sachs
As markets brace for Wednesday’s Bank of Japan (BoJ) monetary policy meetings, multiple investment banks and analysts convey their forecasts for the USD/JPY pair that’s been lately gaining more attention, especially after the BoJ’s tweak to the Yield Curve Control (YCC).
Analysts at Goldman Sachs (GS) are from the same lot and anticipate the Yen pair to decline further by suggesting a 3.0% drop, or a fall to just below the 125.00 level. However, the GS also states that the bigger driver of the cross should be US rates rather than domestic monetary policy.
The GS also signals that their economists expect the BoJ to keep YCC in place with possible further tweaks to improve its sustainability. However, the increased risk of a complete exit means they see more limited room for USD/JPY upside.
It’s worth noting that majority of market estimates don’t suggest any major change to the BoJ’s monetary policy. However, hints for the exit from the ultra-easy money days will be closely observed for clear directions.
That said, the Yen pair began the week’s trading by dropping to the lowest levels since late May 2022 before bouncing off 127.21, mildly offered near 128.30 by the press time.
Also read: USD/JPY Price Analysis: Bulls on course for a 129.50 target
-
23:31
Australia Westpac Consumer Confidence: 5% (January) vs 3%
-
23:28
NZD/USD Price Analysis: Teasing sellers inside weekly triangle, 0.6345 is the key
- NZD/USD struggles to defend bulls inside one-week-old ascending triangle.
- 200-SMA, previous resistance from mid-December adds to the downside filters.
- RSI retreat, sluggish MACD lures bears amid dull markets.
NZD/USD stays defensive around 0.6390, following a retreat from multi-day high, as traders await the key China Gross Domestic Product (GDP) for the fourth quarter (Q4) during early Tuesday. Also likely to have probed the Kiwi pair buyers are recently released downbeat quarterly economic forecasts by the New Zealand Institute of Economic Research (NZIER).
Also read: NZIER QSBO: New Zealand business confidence at lowest since 1974
That said, the quote pokes the support line of the weekly ascending triangle, close to 0.6375 by the press time, amid mildly bearish MACD signals and the RSI (14) weakness.
With this, the NZD/USD prices are likely to break the immediate support surrounding 0.6375. However, the 200-Simple Moving Average (SMA) level surrounding 0.6345 appears crucial for the bears.
Following that, the resistance-turned-support line from December 13, 2022, around 0.6265 at the latest, could challenge the Kiwi bears before giving them control.
On the flip side, the aforementioned triangle’s top line, close to 0.6425 by the press time, restricts the short-term NZD/USD upside.
Should the Kiwi pair buyers defy the triangle formation and keep the reins past 0.6425, the 0.6500 round figure and previous monthly peak near 0.6515 could challenge the quote’s upside momentum.
Overall, NZD/USD pair is likely to witness further weakness but the rejection of the bullish trend is yet absent from the radar.
NZD/USD: Four-hour chart
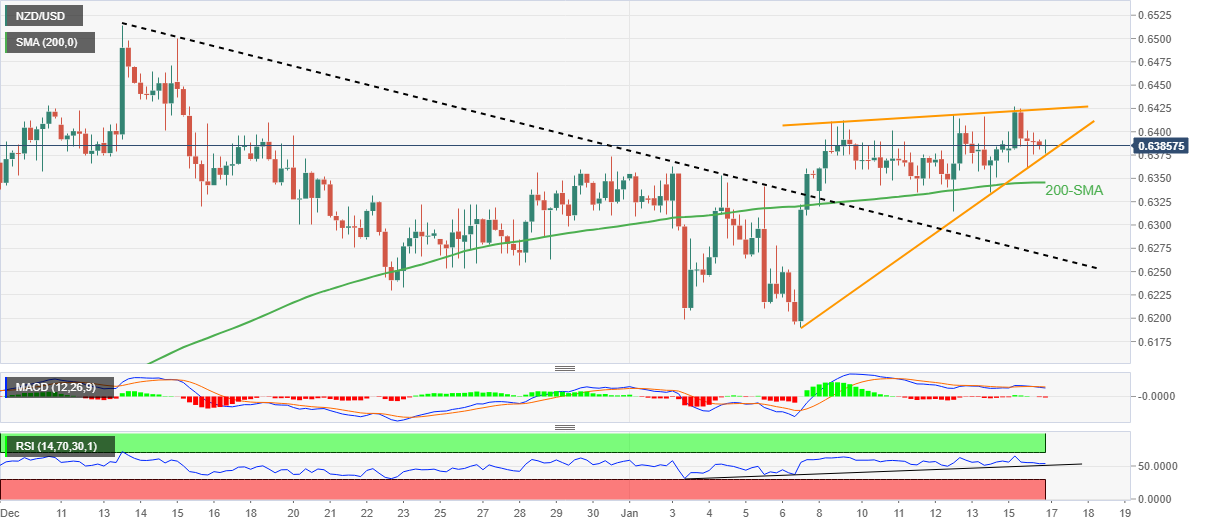
Trend: Further downside expected
-
23:20
GBP/JPY Price Analysis: Hovers around 156.40s on risk-off impulse
- GBP/JPY trimmed some of last Friday’s losses and reclaimed 156.00.
- GBP/JPY Price Analysis: Failure to crack 157.00, to pave the way towards 155.00 and beyond.
The British Pound (GBP) capped its two-day downfall and formed an inverted hammer nearly last week’s lows of 155.64, and rose above 156.00 on Monday. As the Tokyo session begins, the GBP/JPY is trading at 156.46, slightly below its opening price by 0.03%.
GBP/JPY Price Analysis: Technical outlook
The GBP/JPY remains downward biased, although the cross formed a double bottom. However, oscillators like the Relative Strength Index (RSI) at bearish territory and the Rate of Change (RoC) suggest that sellers remain in charge, even though the pair’s corrected upwards.
If the GBP/JPY fails to clear 157.00, that will open the door for further losses. Hence, the GBP/JPY first support would be 156.00. The break above will send the GBP/JPY tumbling toward the YTD Low of 155.35, followed by 155.00.
On the flip side, the GBP/JPY first resistance would be the 157.00 figure. A breach of the latte would clear the way toward January’s 13 daily high of 158.02, followed by the 159.00 figure and the 20-day Exponential Moving Average (EMA) at 159.63.
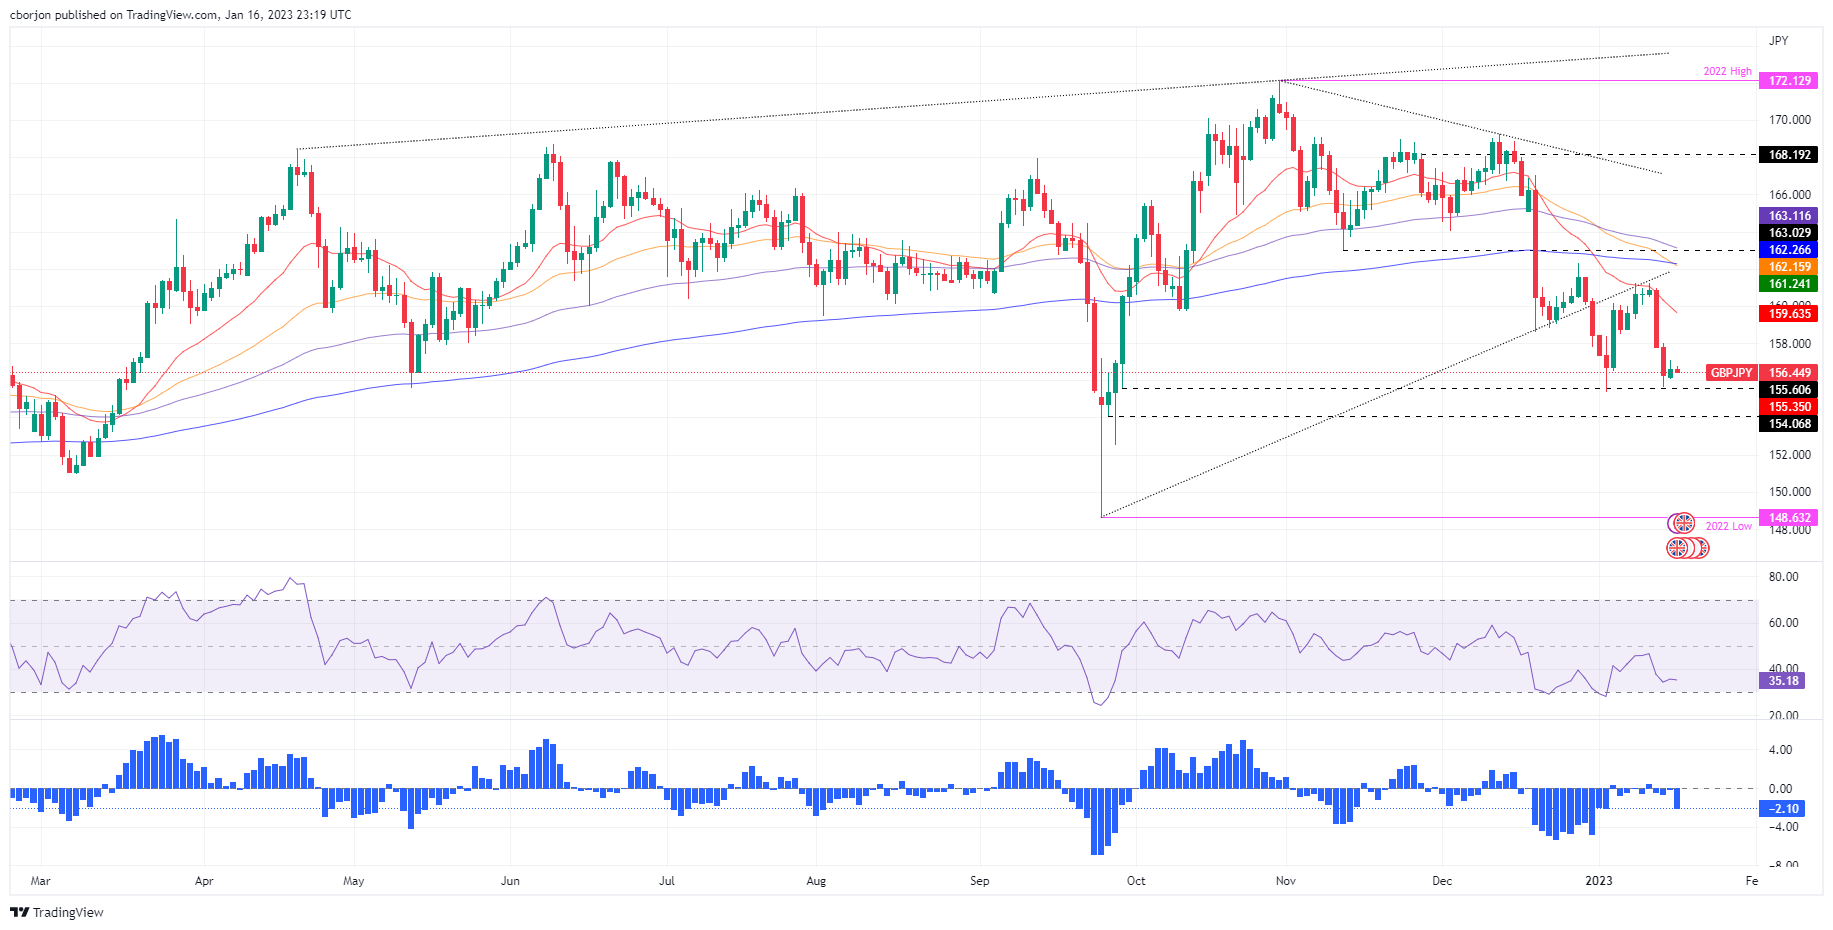
GBP/JPY Key Technical Levels
-
23:05
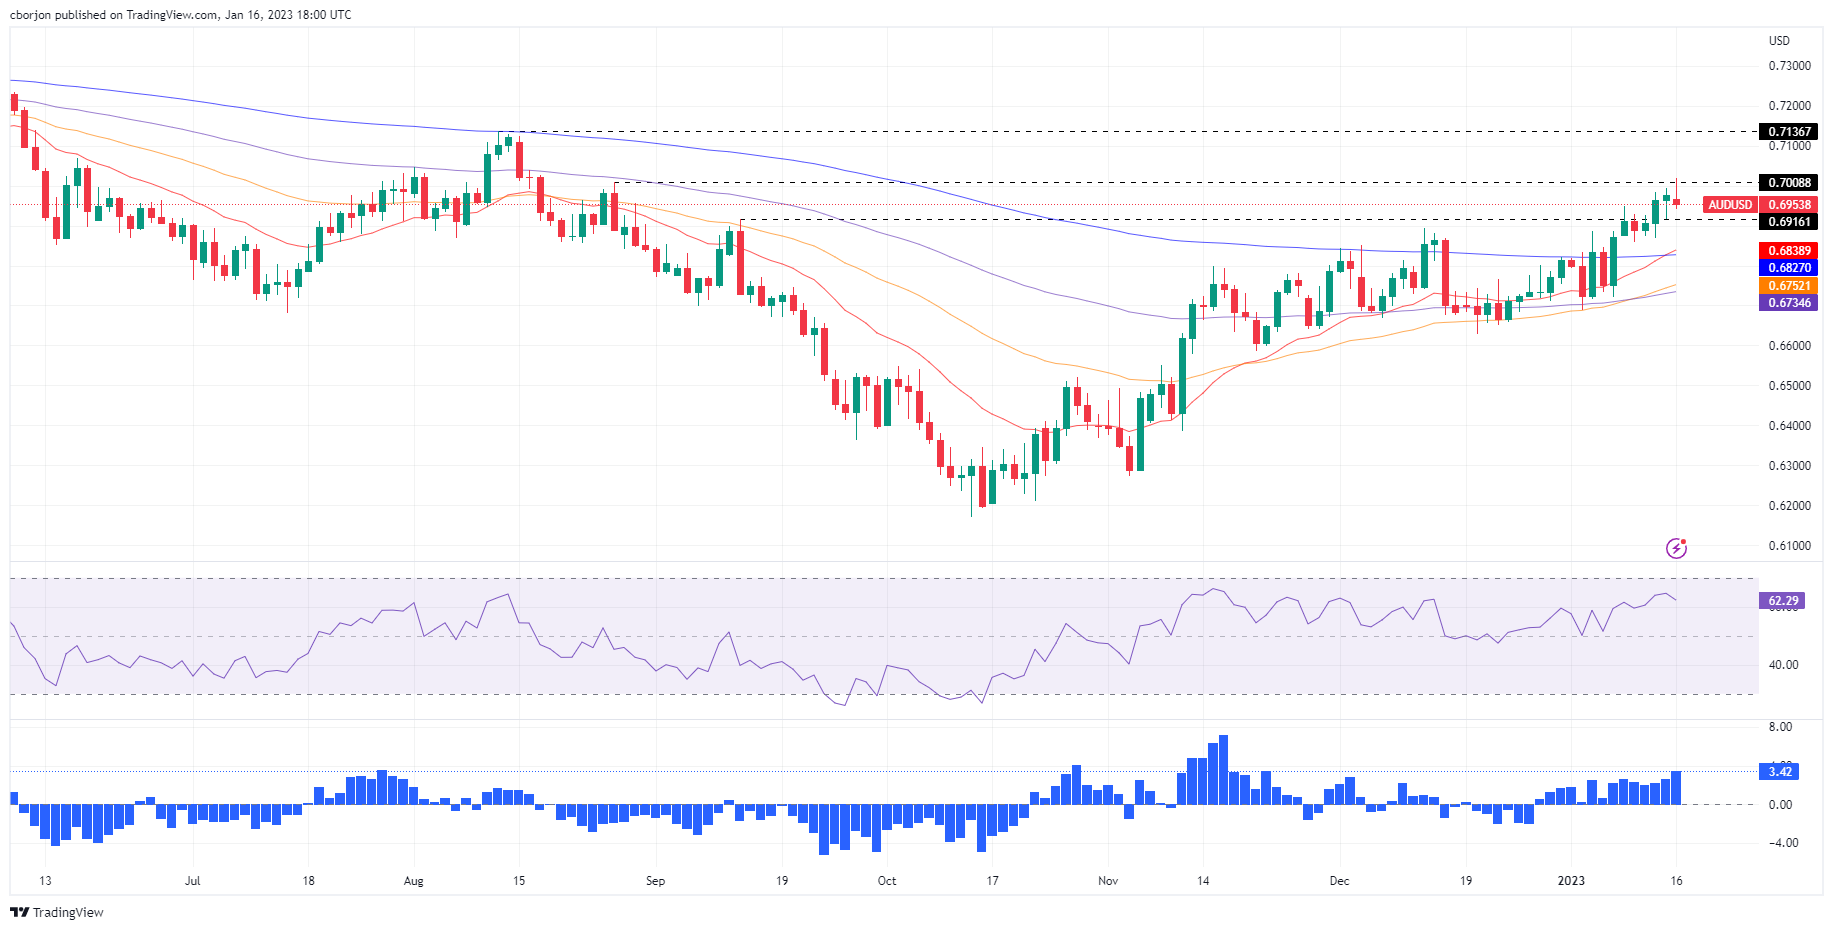
AUD/USD treads water around mid-0.6900s ahead of China Q4 GDP
- AUD/USD steadies after reversing from five-month high, inactive of late.
- Market sentiment remains dicey amid US holiday, cautious mood ahead of key data from China, Australia.
- China Q4 GDP bears downbeat forecasts, can help extend AUD/USD pullback in case of softer prints from Australia’s biggest customer.
AUD/USD remains sidelined around 0.6955 after retreating from the highest levels since August 2022 during Tuesday’s sluggish Asian session. In doing so, the Aussie pair portrays the market’s anxiety ahead of the key China Gross Domestic Product (GDP) for the fourth quarter (Q4), as well as some second-tier data from Australia, not to forget mixed concerns surrounding the US “soft landing,” and the Fed’s policy pivot.
The Aussie pair began the week on a negative note by snapping a three-day uptrend around the multi-day top. The underlying reason could be linked to the market’s reassessments of the dovish bias about the Federal Reserve (Fed), especially after Friday’s upbeat prints of the Michigan Consumer Sentiment Index (CSI) and 5-year inflation expectations. However, Martin Luther King’s Birthday restricted the market’s moves.
Even so, a sustained rebound in the US Treasury bond yields underpinned the US Dollar Index (DXY) recovery from the lowest levels since June 2022, which in turn probed the AUD/USD traders even as the equities were mildly positive.
Also likely to have challenged the AUD/USD bulls could be the easing in Australia’s TD Securities Inflation for December, 0.2% MoM versus 1.0% prior.
Furthermore, China’s reopening boosts AUD/USD considering the strong ties between Canberra and Beijing. However, the lack of easing in Beijing’s Covid numbers and geopolitical tensions with the US, mainly surrounding Taiwan, seems to challenge China-linked optimism and the Aussie pair of late.
Above all, anxiety ahead of the key data from major customer China and the US Retail Sales for December, expected 0.1% YoY versus -0.6% prior, scheduled for release on Wednesday, weigh on the AUD/USD prices of late.
To sum up, AUD/USD traders should pay attention to China Q4 GDP, expected -0.8% QoQ versus 3.9% prior, for fresh impulse but major attention will be given to the US Retail Sales and Australia’s employment data for December, up for publishing on Thursday.
Technical analysis
Nearly overbought conditions of the RSI (14) join the AUD/USD pair’s U-turn from a two-month-old ascending resistance line, close to 0.7025 at the latest, to tease the Aussie pair sellers. It’s worth noting, however, that, a daily closing below the 200-DMA, around 0.6825 at the latest, becomes necessary for the AUD/USD bears to retake control.
-
23:03
USD/CHF drops to near 0.9240 after a rangebound move, US PPI hogs limelight
- USD/CHF has dropped as the risk-off impulse is losing strength.
- A full-blown recession in the US economy could trigger a 15-20% fall in S&P500.
- A meaningful decline in the US PPI might trim inflation projections further and will also weigh on wage growth ahead.
The USD/CHF pair has sensed selling pressure after failing to surpass the critical resistance of 0.9280 in the early Asian session. The Swiss franc asset has picked offers and has dropped to near 0.9240. It seems that the risk-off impulse is fading away as the United States markets will open today after a stretched weekend on account of Martin Luther King Jr. Day.
On Monday, the S&P500 futures witnessed a moderate fall amid holiday-inspired anxiety among the market participants. No doubt, the 500-stock basket is displaying signs of recovery from the past few weeks as the Federal Reserve (Fed) is expected to reach the terminal rates sooner and is looking to trim the pace of hiking interest rates. However, price stability could not be achieved without entering into a recession in the United States economy.
Economists at UBS think that the upcoming 4Q corporate reporting season will provide a reality check. “Earnings headwinds – an aggressive Fed, a normalization in demand for goods popular during the pandemic, a stronger USD, and higher costs because of more expensive labor – have become strong enough for us to expect no growth in S&P 500 4Q earnings per share compared to the same period last year. The downside risks remain elevated, and stocks could fall 15-20% if the economy enters a full-blown recession.”
The US Dollar Index (DXY) turned sideways around 102.00 after a firmer recovery move from the fresh seven-month low at 101.36. The USD Index is likely to be guided by the release of the US Producer Price Index (PPI) data, which is scheduled for Wednesday. A meaningful decline in the US PPI might trim inflation projections further and will also weigh on wage growth ahead.
Meanwhile, investors are awaiting the commentary from global officials at World Economic Forum, happening in the Swiss Franc region. On the economic front, the absence of major triggers in the economic calendar this week will keep the focus of investors on the US economic calendar for any action.
-
22:42
AUD/JPY Price Analysis: Recovery stalls and bears to step in around 89.00
- On Wednesday, AUD/JPY seesaws around 89.20s, ahead of the Bank of Japan’s monetary policy decision.
- AUD/JPY Price Analysis: Bearish biased, and it might resume its downtrend soon.
The AUD/JPY snapped two days of consecutive losses on Monday and rebounded nearby last week’s lows of 88.62. The Australian Dollar (AUD) got bolstered by traders booking profits on Japanese Yen (JPY) longs (AUD/JPY shorts) as they get ready for the Bank of Japan’s monetary policy decision. The AUD/JPY is trading at 89.33 after hitting a daily low of 89.02 at the time of writing.
AUD/JPY Price Analysis: Technical outlook
After forming a double bottom in early 2023, the AUD/JPY shifted its bias to downwards, as it could not crack the 200-day EMA decisively. Therefore, sellers leaned to it, and the AUD/JJPY commenced a fall of almost 3% toward last week’s lows, breaking below the 20-day Exponential Moving Average (EMA) at 90.18.
Oscillators like the Relative Strength Index (RSI) and the Rate of Change (RoC) give bearish signals, opening the door for further losses.
Although the AUD/JPY had trimmed some of last Friday’s losses due to the bias of the pair, it could be viewed as an opportunity for sellers to re-engage on shorts at a better price. Therefore, the AUD/JPY first support would be the 89.00 mark, followed by the last week’s low of 88.62, followed by the YTD low of 87.41.
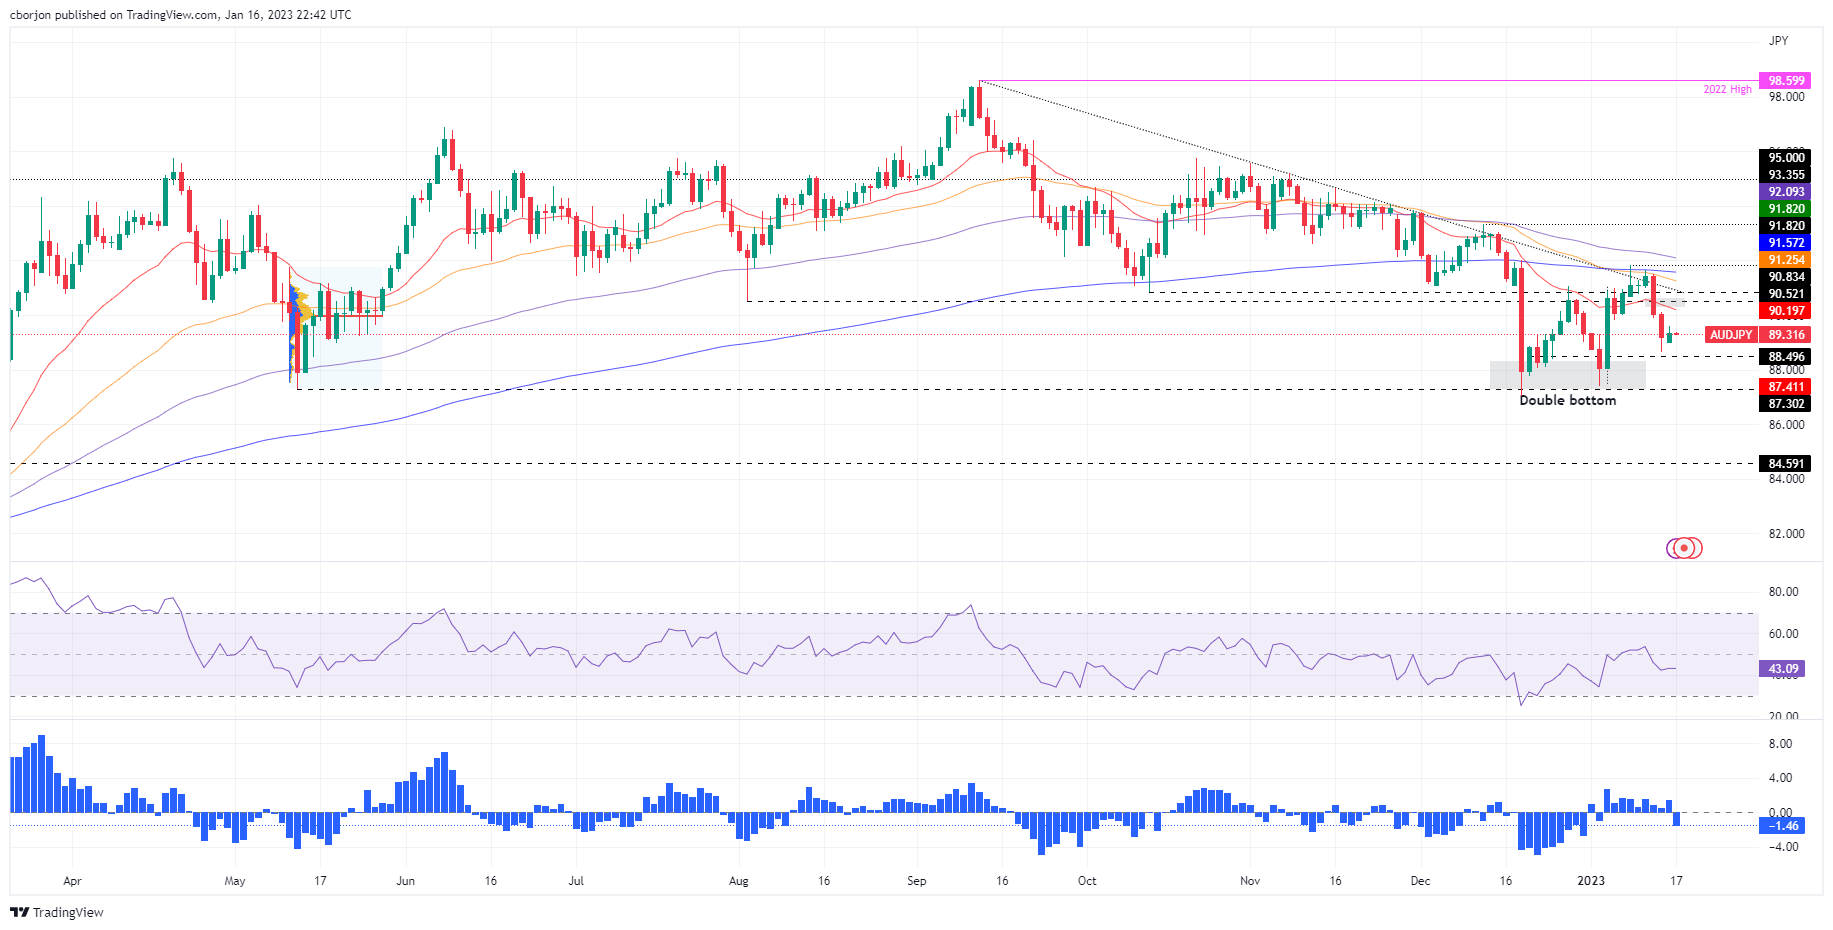
AUD/JPY Key Technical Levels
-
22:40
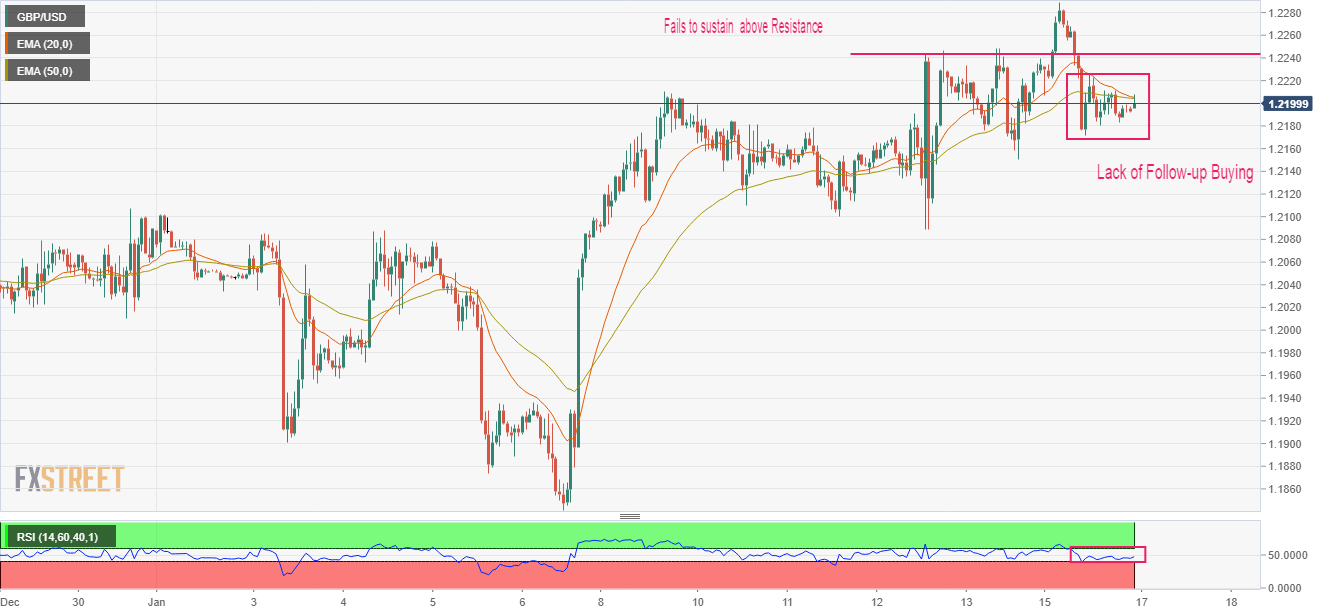
GBP/USD Price Analysis: Signs of bearish reversal solidifies as risk impulse sours
- The absence of follow-up buying after a corrective move indicates a lack of strength in the Pound Sterling.
- A recovery move in the US Dollar Index has been recorded amid a decline in investors’ risk appetite.
- The 20-and 50-period EMAs are on the verge of delivering a bear cross around 1.2200.
The GBP/USD pair is displaying a lackluster performance as the auction profile has trimmed to a narrow range of 1.2180-1.2210 in the early Tokyo session. Earlier, the Cable witnessed a steep fall after failing to hit the critical resistance of 1.2300. A sell-off in Cable was triggered due to a sheer recovery move by the US Dollar Index (DXY).
A corrective move in the S&P500 futures on Monday as caution soars in market sentiment ahead of the United States Producer Price Index (PPI) data, triggered a risk-aversion theme. Also, the speech from Bank of England (BoE) Governor Andrew Bailey citing weaker inflation projections failed to provide support to the Pound Sterling.
On an hourly scale, a failure by Pound Sterling in keeping the Cable above the horizontal resistance plotted around January 12 high at 1.2243, signaled a loss in the upside momentum. Also, chances of further weakness in the major are solid amid an absence of follow-up buying despite finding an immediate cushion at around 1.2175.
The 20-and 50-period Exponential Moving Averages (EMAs) are on the verge of delivering a bearish crossover of around 1.2205, which would be added to the downside filters.
Meanwhile, the Relative Strength Index (RSI) (14) is oscillating in a 40.00-60.00 range, which indicates that investors are awaiting a fresh trigger for a decisive move.
The Cable will display a sheer downside if it drops below Monday’s low at 1.2171 as it will drag the major toward January 11 low at 1.2100 followed by the psychological support at 1.2000.
On the flip side, a confident break above Monday’s high at 1.2285 will drive the asset toward December 5 high at 1.2344. A breach of the latter will expose the asset for to re-test a seven-month high at 1.2447.
GBP/USD hourly chart
-
22:29
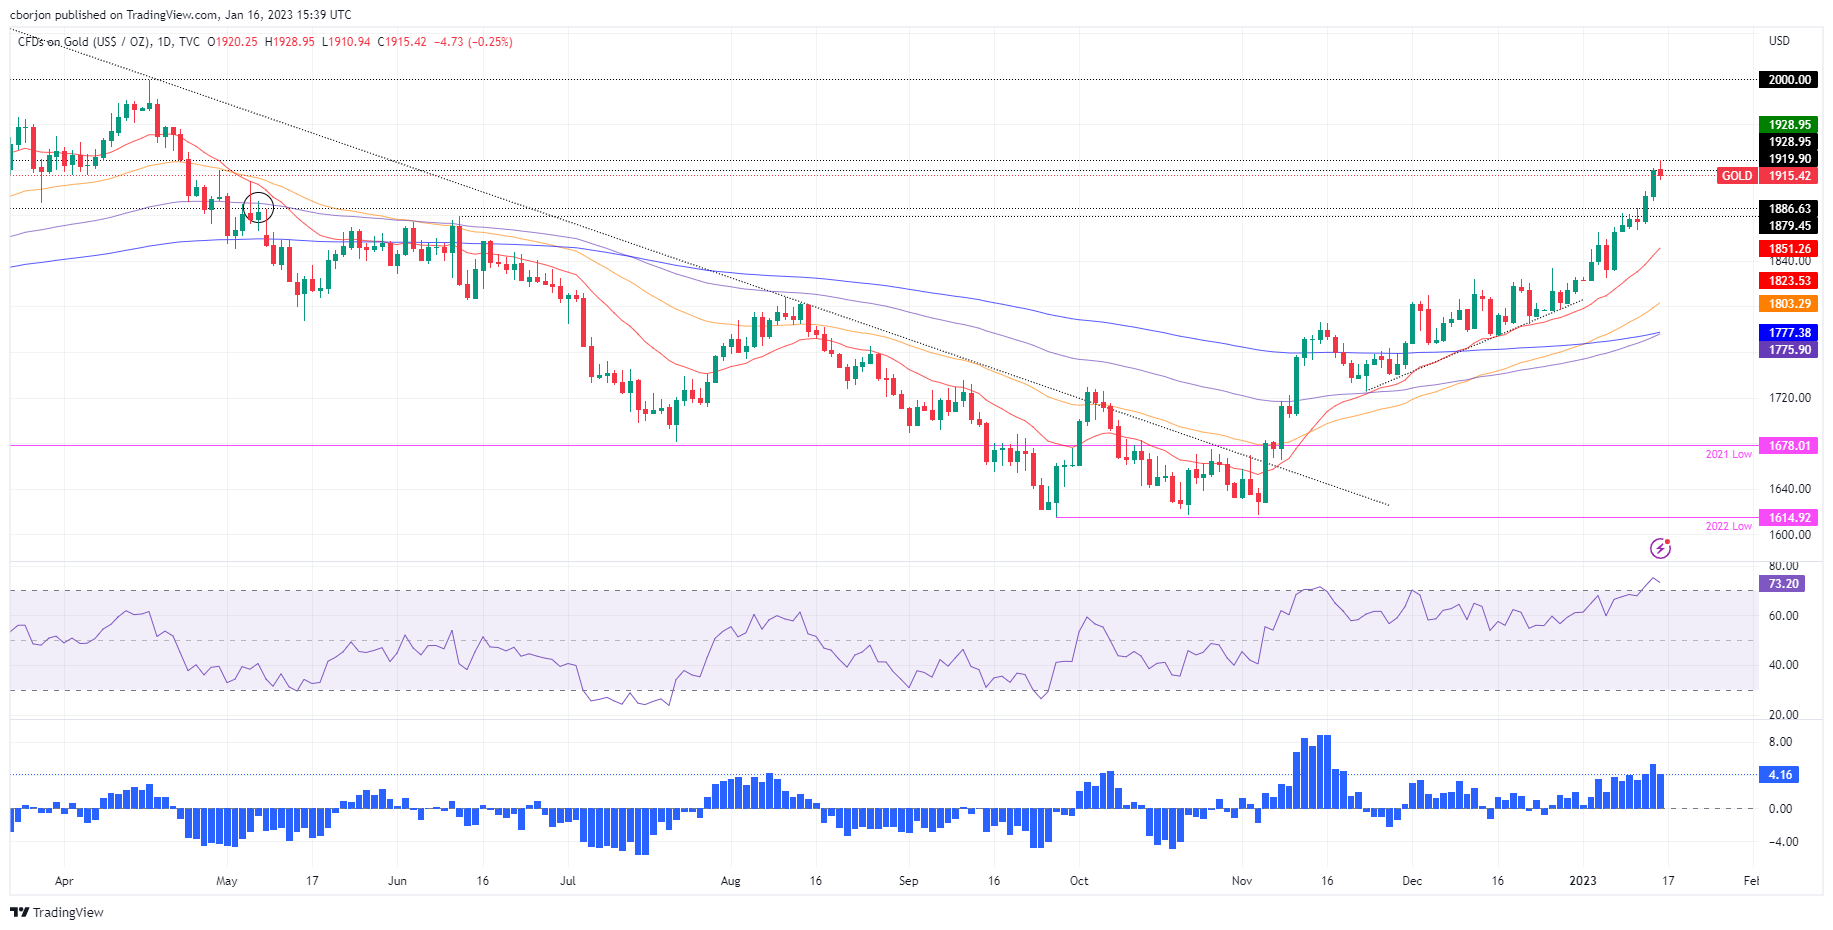
Gold Price Forecast: XAU/USD bulls run out steam as United States Treasury bond yields rebound
- Gold price retreats from multi-month high as bulls take a breather after two-day uptrend.
- United States holiday restricts XAU/USD’s downside moves ahead of a busy day.
- US 10-year Treasury bond yields, US Dollar Index recovered amid mixed clues.
- China Gross Domestic Product for Q4 will give immediate directions to Gold, clues for Federal Reserve’s next move are crucial.
Gold price (XAU/USD) marks a softer landing after rising to the highest levels since April 2022 in the last week. That said, the yellow metal printed the first daily loss in three amid a sluggish start to the week as markets in the United States were closed due to Martin Luther King’s Birthday. Even so, the US Treasury bond yields triggered the much-awaited rebound in the US Dollar and probed the XAU/USD bulls as traders have mixed feeling about the Federal Reserve’s (Fed) policy pivot.
United States Treasury bond yields drag Gold price
US 10-year Treasury bond yields defended the bounce off a five-week low marked the last Friday as traders reassess talks of the United States' “soft landing” and the Federal Reserve’s policy pivot during a slightly dull start of the week. That said, the benchmark bond coupons ended Monday’s North American trading session with mild gains of around 3.498%. On the same line, the two-year bond yields were floating around 4.22% and hence the yield curve inversion kept flashing the risk of recession. Even so, the concerns that the US could avoid a hard landing and China reopening helped the market sentiment to remain mildly positive and probed the Gold sellers.
Mixed US data probe XAU/USD bulls
The softer prints of the United States Consumer Price Index (CPI) and easing wage growth, together with downbeat services activities, allowed the Federal Reserve (Fed) doves to brace for the driver’s seat. However, Friday’s upbeat prints of the Michigan Consumer Sentiment Index (CSI) and 5-year inflation expectations allowed US Dollar bulls to remain hopeful of further rate hikes from the Fed. Other than the mixed US data, the Federal Reserve (Fed) policymakers’ rejection to praise the market’s dovish outlook also defend the US Dollar buyers, despite marking a multi-day low, which in turn probes the Gold price upside.
China optimism fades ahead of the key data
China’s reopening boosts Gold prices considering the dragon nation’s stand as the key XAU/USD consumer. However, the lack of easing in Beijing’s Covid numbers and geopolitical tensions with the US, mainly surrounding Taiwan, seems to challenge China-linked optimism in the Gold market. Also likely to probe Beijing-inspired optimism is the cautious mood ahead of today’s China Gross Domestic Product (GDP) for the fourth quarter (Q4), expected -0.8% QoQ versus 3.9% prior.
Gold price technical analysis
Gold price remains inside an eight-day-old bullish channel surrounding the highest levels since late April 2022. Even so, the looming bear crossing the Moving Average Convergence and Divergence (MACD) indicator joins the rejections of the short-term bullish trend by the Relative Strength Index (RSI) line, placed at 14, to lure short-term bears.
The nearby bearish trend, however, hinges on the quote’s successful rejection of the bullish channel, by breaking the $1,898 support.
Following that, a three-week-old ascending support line and the 100-SMA, respectively near $1,865 and $1,846, could probe Gold sellers. It’s worth mentioning that the XAU/USD weakness past $1,846 needs validation from a one-month-old horizontal support zone, close to $1,825.
On the contrary, the $1,930 round figure acts as an immediate upside hurdle for the Gold price to cross before regaining the buyer’s attention.
Even so, the aforementioned channel’s top line, near $1,936, appears the last defense for the XAU/USD bears, a break of which could propel Gold price toward the April 2022 peak surrounding $1,998.
Gold price: Four-hour chart
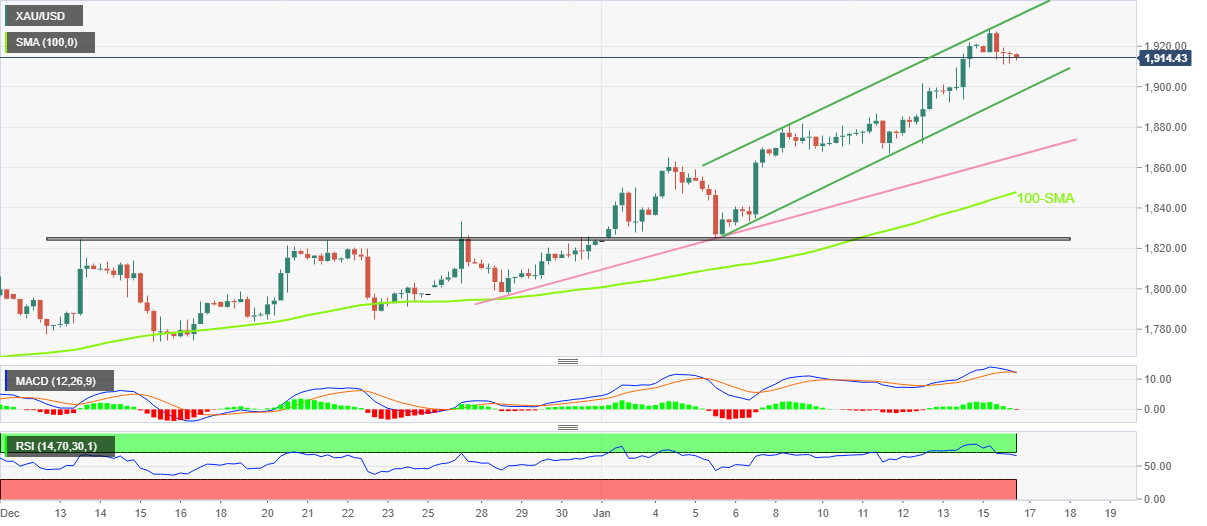
Trend: Pullback expected
-
22:16
NZIER QSBO: New Zealand business confidence at lowest since 1974
According to the latest New Zealand Institute of Economic Research (NZIER) Quarterly Survey of Business Opinion (QSBO), “New Zealand's business confidence in the fourth quarter of last year hit its lowest level since 1974 as companies grapple with higher interest rates, cost pressures and soft demand.” The survey also mentioned that business confidence is the weakest since the survey started in 1970 if adjusted seasonally.
“The survey was undertaken following the more hawkish than expected central bank meeting in November and this was weighing on sentiment,” said NZIER along with the findings.
Key finding (via Reuters)
A net 70% of firms surveyed expected general business conditions to deteriorate compared with 42% pessimism in the previous quarter.
Firms have become much more cautious and are now looking to reduce staff and investment plans.
A net 81% reported increased costs in the December quarter.
NZD/USD remains depressed
The news should have ideally weighed on the NZD/USD prices as it challenges the Reserve Bank of New Zealand’s (RBNZ) hawkish bias. However, the Kiwi pair remains pressured around 0.6380 by the press time, after a dull start to the week.
Also read: NZD/USD holds near strongest levels in a month
-
22:07
USD/CAD shifts auction profile above 1.3400 ahead of Canada Inflation
- USD/CAD has comfortably shifted its business above 1.3400 amid a recovery in the US Dollar Index.
- Caution is escalating despite overall optimism in the market ahead of US PPI data.
- The BoC will continue hiking interest rates despite softening of Canada’s inflation report.
The USD/CAD pair has shifted its auction profile above the round-level resistance of 1.3400 in the early Tokyo session. The Loonie asset has picked strength supported by the sheer recovery in the US Dollar Index (DXY). After a stellar recovery from a fresh seven-month low at 101.36, the USD Index is displaying signs of volatility contraction around 102.00.
S&P500 futures witnessed some sell-off on Monday after a four-day winning streak, however, the United States markets were closed on account of Martin Luther King Jr. Day. Growing caution for risk-perceived assets despite the fact that the Federal Reserve (Fed) is expected to slow down the pace of policy tightening may keep investors on the sidelines.
The USD Index is expected to dance to the tunes of the United States Producer Price Index (PPI) data, which will release on Wednesday. A change in the prices of goods and services at factory gates is going to provide more cues about inflation projections. The street sees a decline in headline factory gate prices of goods and services (Dec) to 6.8% from the former release of 7.4%. Also, the core PPI might trim to 5.9% from the former release of 6.2% in a similar period.
On the Loonie front, investors are awaiting the release of Canada’s inflation data, which is scheduled for Tuesday. According to the market estimates, the annual headline CPI will trim to 6.3% from the former release of 6.8%. However, the core inflation will escalate to 6.1% vs. the 5.8% released earlier. This might compel the Bank of Canada (BoC) to continue hiking interest rates as the road to 2% inflation seems far from over.
Meanwhile, the oil price has found an intermediate cushion of around $79.00 after a corrective move from above the crucial resistance of $80.00. The black gold is likely to resume its upside journey as bets for China’s economic recovery are soaring dramatically. It is worth noting that Canada is a leading exporter of oil to the United States and higher oil prices will support the Canadian Dollar.
-
21:55
Silver Price Forecast: XAG/USD holds to gain but stalls around $24.50, tumbles to $24.20s
- Silver price extended its gains to three consecutive days, remaining above the 20-day EMA.
- Last week low inflation figures in the US spurred speculations that the Fed might hike in 25 bps sizes.
- Current week’s US economic calendar to provide fresh impetus to Silver’s price action.
Silver Price is registering minimal gains on Monday amidst a dull North American session. The absence of US traders sparked by the Martin Luther King Jr day kept trading liquidity conditions dry. The US Dollar (USD) registered solid gains, capping Silver’s rally around the mid $24.00-$25.00 range. At the time of writing, XAG/USD Is trading at $24.29.
Last week's US data, sparked a repricing for a less aggressive US Federal Reserve
Spot Silver held to its gains after retracing from YTD highs of $24.54. Inflation figures released last week in the United States (US) signal the cycle of high prices has peaked. Hence, this spurred speculations that the US Federal Reserve, among other global central banks, might slow the size of rate hikes, weakening the greenback since the start of 2023.
In the meantime, the World Bank warned that the globe’s Gross Domestic Product (GDP) would jump just 1.7% in 2023, slashing its June forecast of close to 3% in June 2022.
Additional Federal Reserve speakers and a tranche of US economic data led by the Fed speaking alongside the release of earnings in Wall Street would keep traders entertained. US Retail Sales, the Producer Price Index (PPI), and Industrial Production will be released on Wednesday. US Housing Starts, Initial Jobless Claims, and the Philadelphia Fed Index would add to the update on the status of the US economy.
Silver Price Analysis: XAG/USD Technical Outlook
From a daily chart perspective, the XAG/USD remains upward biased. Oscillators like the Relative Strength Index (RSI) and the Rate of Change (RoC) suggest that Silver buyers remain in charge. If XAG/USD achieves a daily close above $24.29, that would be the third consecutive trading day with gains, and it would poise XAG/USD for a re-test of the YTD highs, followed by $25.00.
-
21:48
USD/JPY Price Analysis: Bulls on course for a 129.50 target
- USD/JPY is gathering momentum after a test of the structure around 128.80.
- The 38.2% Fibonacci is a first target near 129.50 with 131.20's eyed thereafter.
As per the prior analysis, USD/JPY bulls move in and eye a correction towards 129.50, USD/JPY has indeed corrected higher and remains in the hands of the bulls as we enter the rollover and early hours of the Asian session.
As previously explained, there were prospects of a reversion into the M-formation\s bearish impulse on the prior leg:
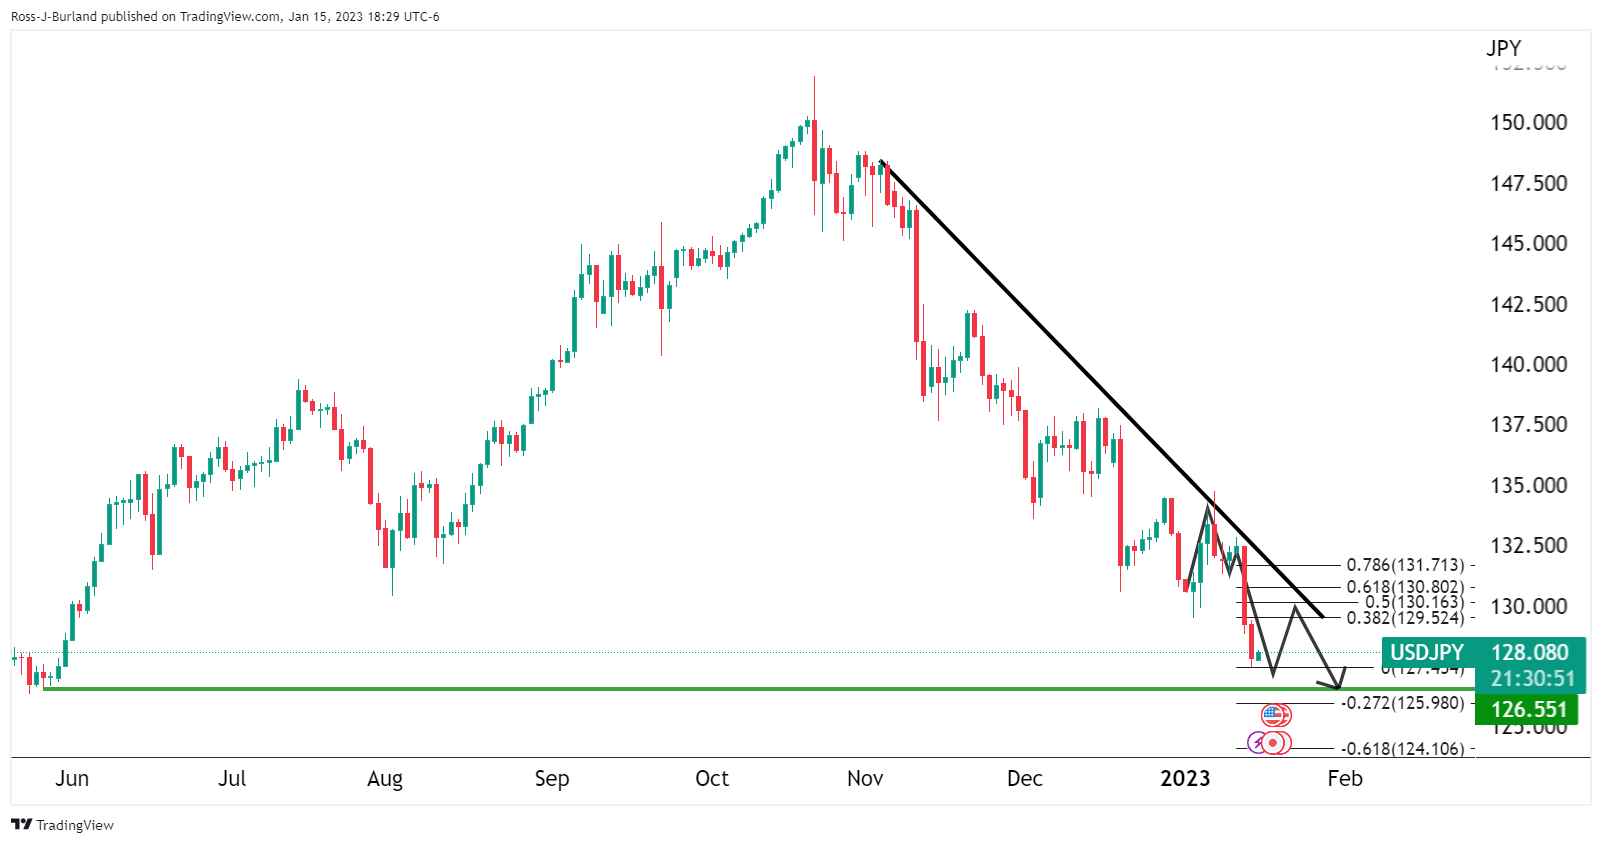
USD/JPY update
USD/JPY H1 chart
We are seeing this correction get underway and bulls will now be looking for a bullish structure to lean against in aiming for a reversion of sorts as follows:

As illustrated, the price is on the backside of the trend and a breakout to the upside is gathering momentum after a test of the structure around 128.80. The 38.2% Fibonacci is a first target near 129.50 with 131.20's eyed thereafter.
-
21:00
New Zealand NZIER Business Confidence (QoQ) fell from previous -42% to -70% in 4Q
-
20:15
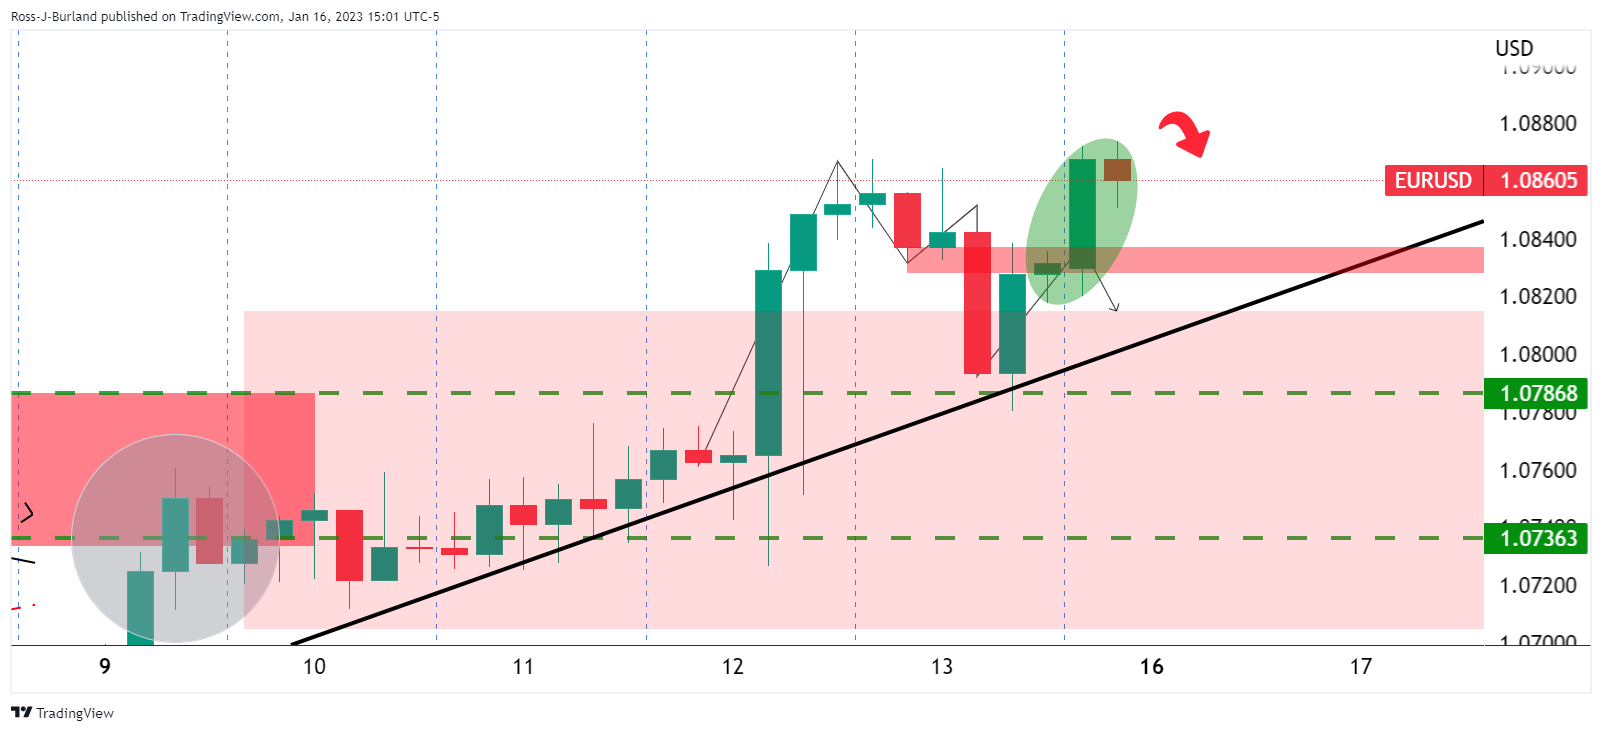
EUR/USD Price Analysis: Bears have been capped and eyes are on 1.0720
- EUR/USD's 1.0820 structure has been broken.
- Eyes are on a test below 1.0770 that guards the risk of a drop towards 1.0700/20 support.
As per the start of the week's analysis, EUR/USD Price Analysis: Bears attacking the bullish H4 trendline support, the bears needed to break trendline support on the lower time frames, such as the 4-hour chart as follows:
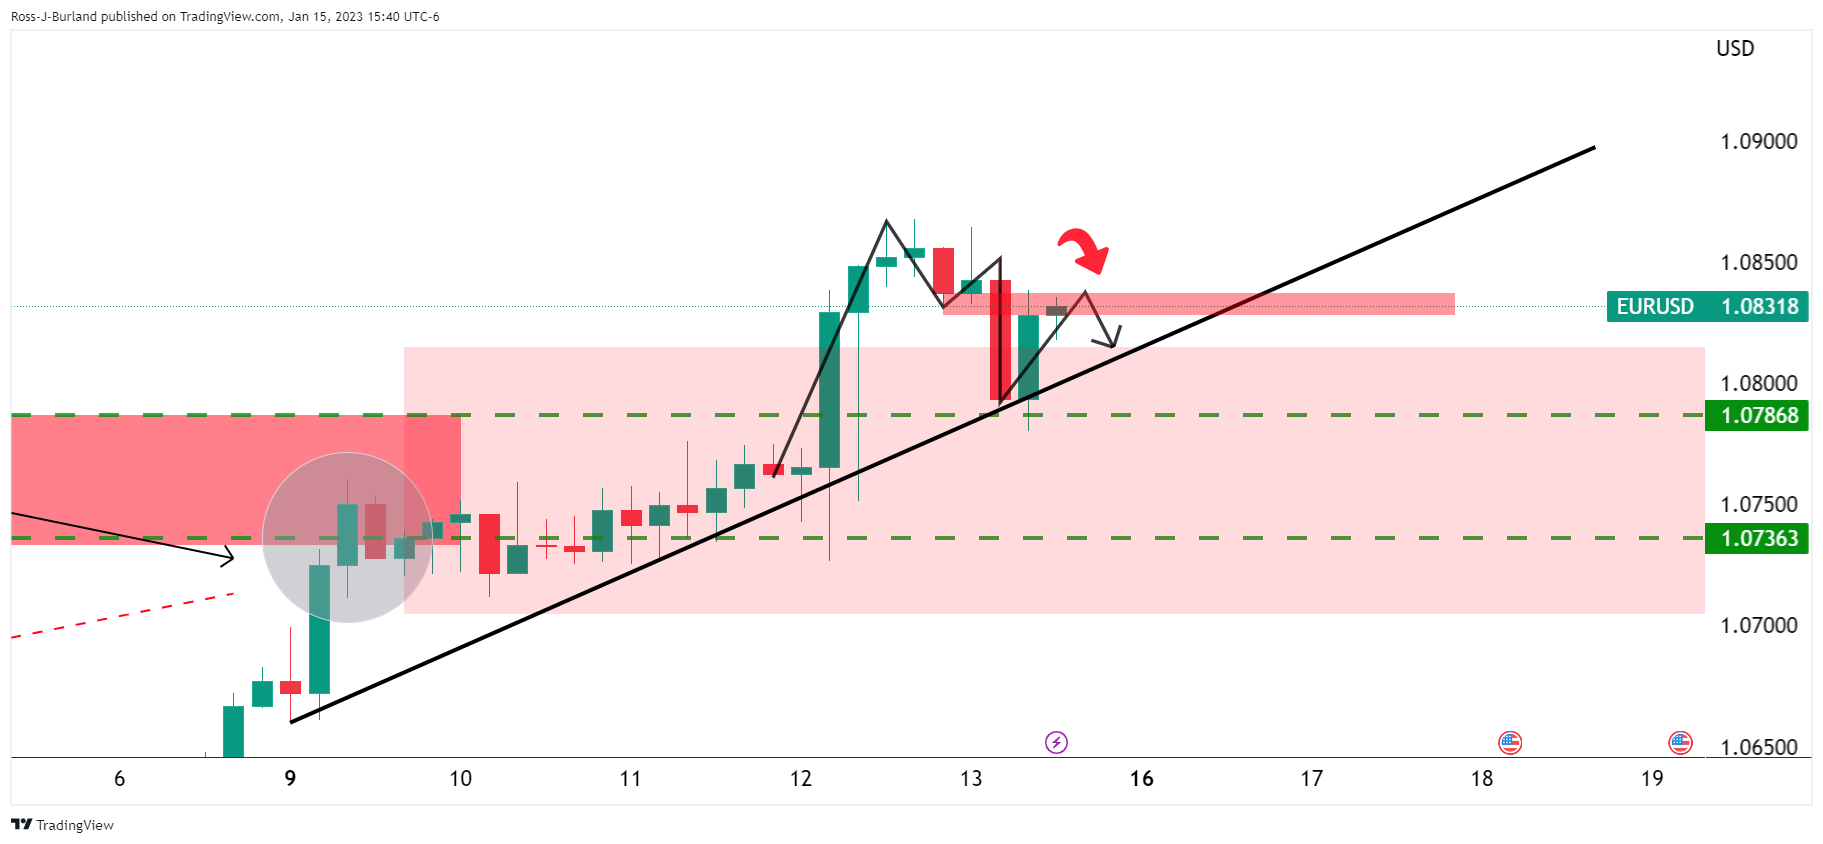
It was stated that The M-formation was compelling in this regard, but the neckline needed to hold for the open to reaffirm a bearish bias and prospects of a break of the trendline and downside potential for the week ahead.
Instead, the bulls moved in and took out the neckline as follows:
The move has been significant as it has taken out the 1.90775 horizontal resistance that could now start to act as support:
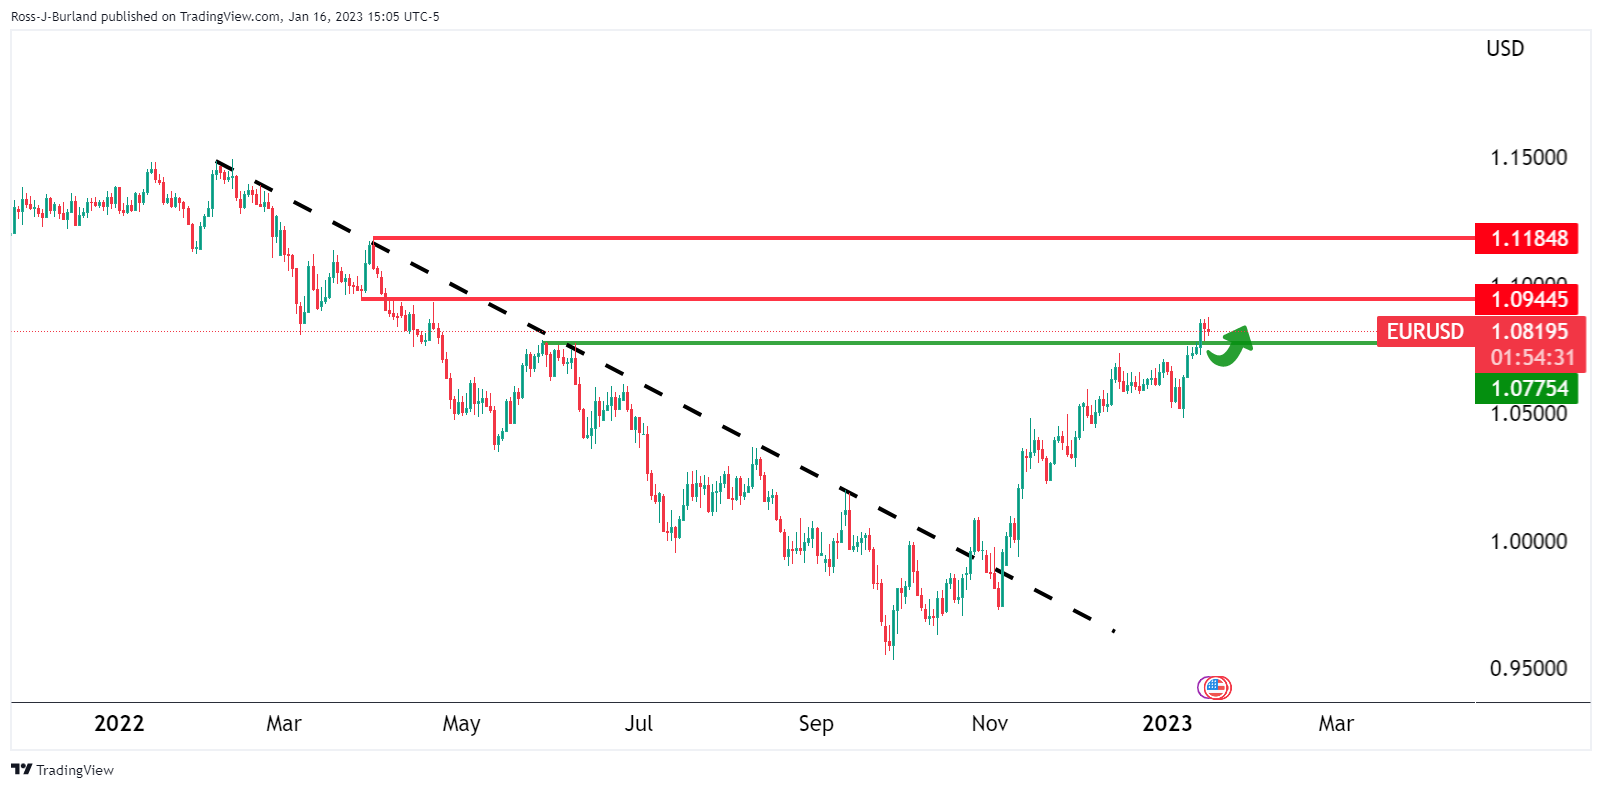
With that being said, the daily W-formation remains compelling as the price decelerates on the bid:
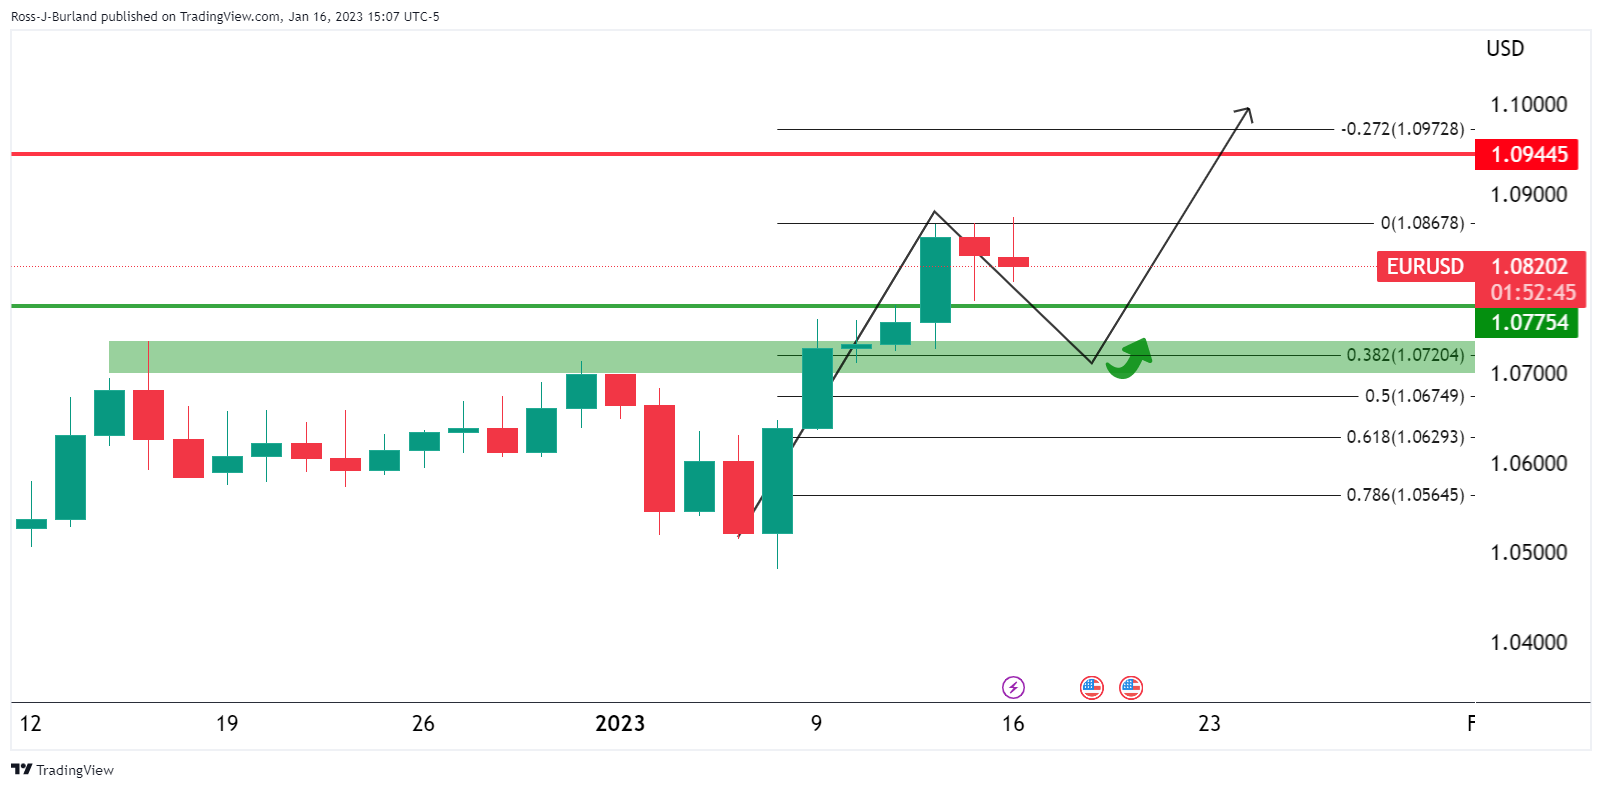
The bulls will be expected to defend the 1.0700 figure on a retest and that could lead to an onward continuation as illustrated in the chart above.
EUR/USD H1 chart
Meanwhile, the hourly trendline was broken and so to a micro horizontal structure that makes for a bearish prospect for the coming sessions:
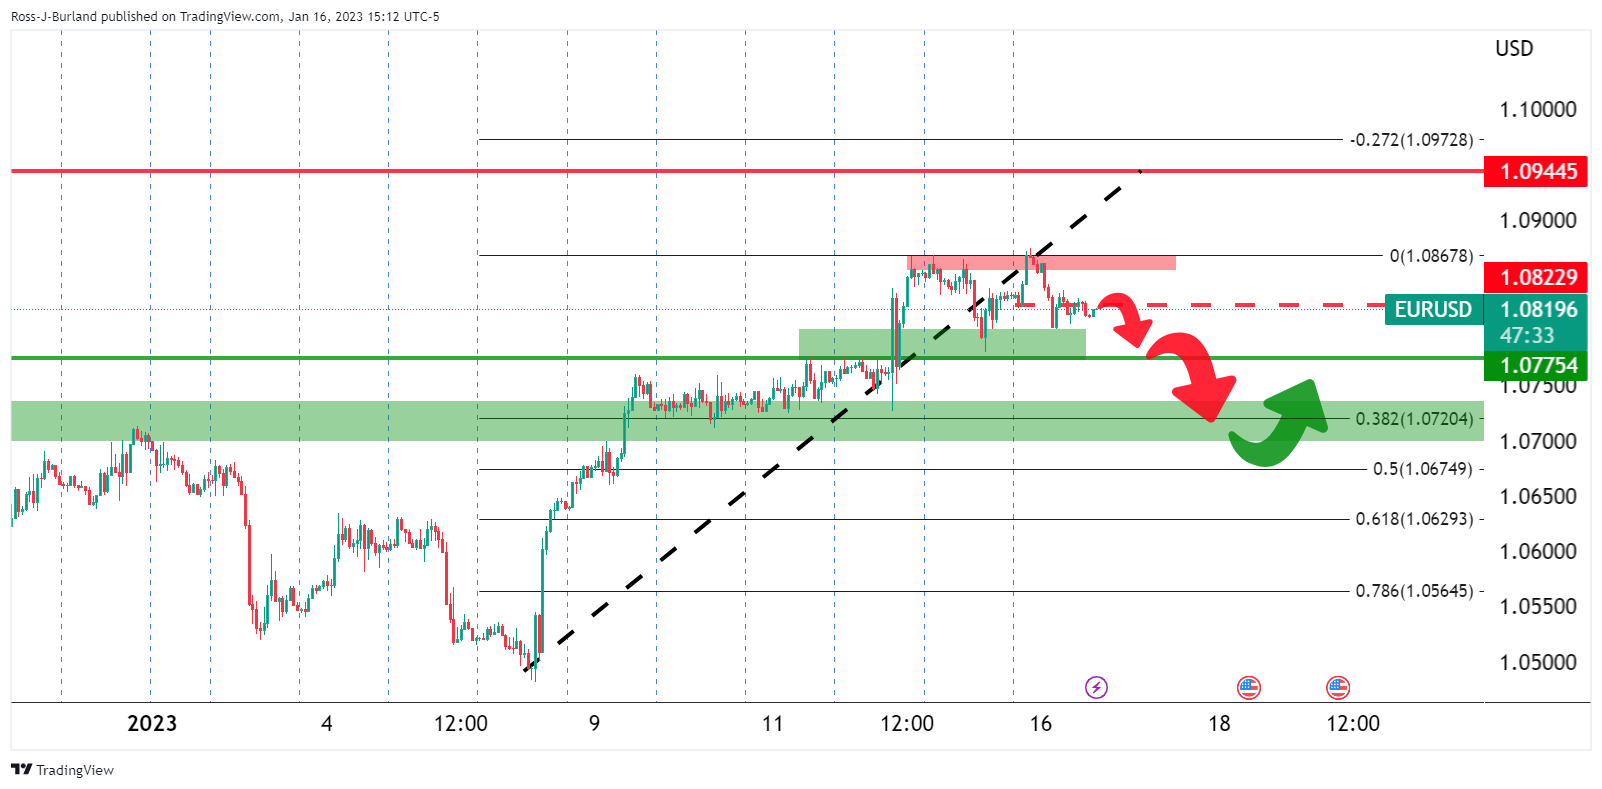
1.0820 structure has been broken and all eyes are on a test below 1.0770 that guards the risk of a drop towards 1.0700/20 support.
-
19:37
Forex Today: US Dollar takes little advantage of dull trading
What you need to take care of on Tuesday, January 17:
The American currency started the week where it left the previous one, easing across the FX board. Market participants were still cheering, easing United States price pressures and the possibility of a soon-to-come US Federal Reserve pivot on monetary policy. Optimism, however, faded at the beginning of a quiet week, with US markets closed amid the Martin L. King holiday. The Greenback managed to recover ahead of the daily close but ended the day with modest gains against most major rivals, and it is still at risk of falling.
The main focus was on Japan Government Bonds (JGBs) as the yield on the 10-year note surged to 0.52%, pushing the upper end of the BoJ’s range. The Bank of Japan is having a monetary policy meeting this week, and raising yields spurred speculation policymakers will finally introduce a shift in their monetary policy. Governor Haruhiko Kuroda’s term ends next April, and speculative interest believes he will introduce changes to the ultra-loose policy before leaving. BoJ Deputy Chief Masayoshi Amamiya is the leading candidate for the next governor.
The Bank of Canada Consumer Survey showed that expectations for 1-year ahead inflation increased to a record 7.18% from 7.11% in the third quarter, while 2-year ahead inflation expectations fell to 5.14% from 5.22% in the third quarter.
The EUR/USD pair hovers around 1.0815, while GBP/USD trades a handful of pips below the 1.2200 mark. The AUD/USD pair briefly traded above the 0.7000 mark but settled at around 0.6950, while USD/CAD seesaws around 1.3400. The USD/JPY pair recovered from a fresh multi-month low of 127.21 and currently stands at 128.50.
Gold retains the $1,900 mark, now consolidating at $1,914, while Crude Oil Prices edged lower, and WTI settled at $79.12 a barrel.
Top 3 Price Prediction Bitcoin, Ethereum, Ripple: Don’t miss the ship from fear of wet feet
Like this article? Help us with some feedback by answering this survey:
Rate this content -
19:25
NZD/USD holds near strongest levels in a month
- NZD/USD is flat into the early close on Wall Street.
- Kiwi traders will look to the Q4 NZIER QSBO survey.
NZD/USD travelled between a low of 0.6361 and a high of 0.6426, currently flat on the day albeit hovering near its strongest levels in a month. The Kiwi has benefitted in a risk-on environment since the US Dollar was sold off on the back of a switch in sentiment surrounding the Federal Reserve's interest rate path.
Easing US inflation has fueled bets for a less aggressive tightening from the Federal Reserve at the same time that China’s reopening has bolstered the outlook for the global economy. In turn, there is a demand for commodities for which the Kiwi trades as a proxy to.
However, with US markets closed for Martin Luther King Jr. Day, and liquidity even thinner than it normally is in January, the price action has been minimal on the day and week so far. The Kiwi is oscillating on either side of 0.64, although ''with upside risks coming from the fading USD and downside risks coming mostly from softening local data and the Fed’s hawkish rhetoric,'' analysts at ANZ Bank said. ''Today is likely to be all about local data, with the Q4 NZIER QSBO survey due out at 10 am. This is data the RBNZ watch, and if it ends up being as weak as our ANZBO survey was in December, it could see local short-end rates fall further yet, taking the Kiwi with them,'' the analysts said.
The Kiwi has been supported from a monetary policy standpoint after the Reserve Bank of New Zealand embarked on a historic tightening campaign, bringing the cash rate to a 14-year high of 4.25%. This has been the most aggressive policy tightening cycle since 1999 when the cash rate was first introduced. The RBNZ is the only central bank that is more hawkish than the Fed, and rate differentials are much more friendly than say compared to the Aussie, leaving the outlook bullish from a fundamental perspective. ''While the RBNZ has further to go to bring inflation under control, it will need to start thinking about when to take its foot off the brake,'' analysts at Westpac argued.
-
19:02
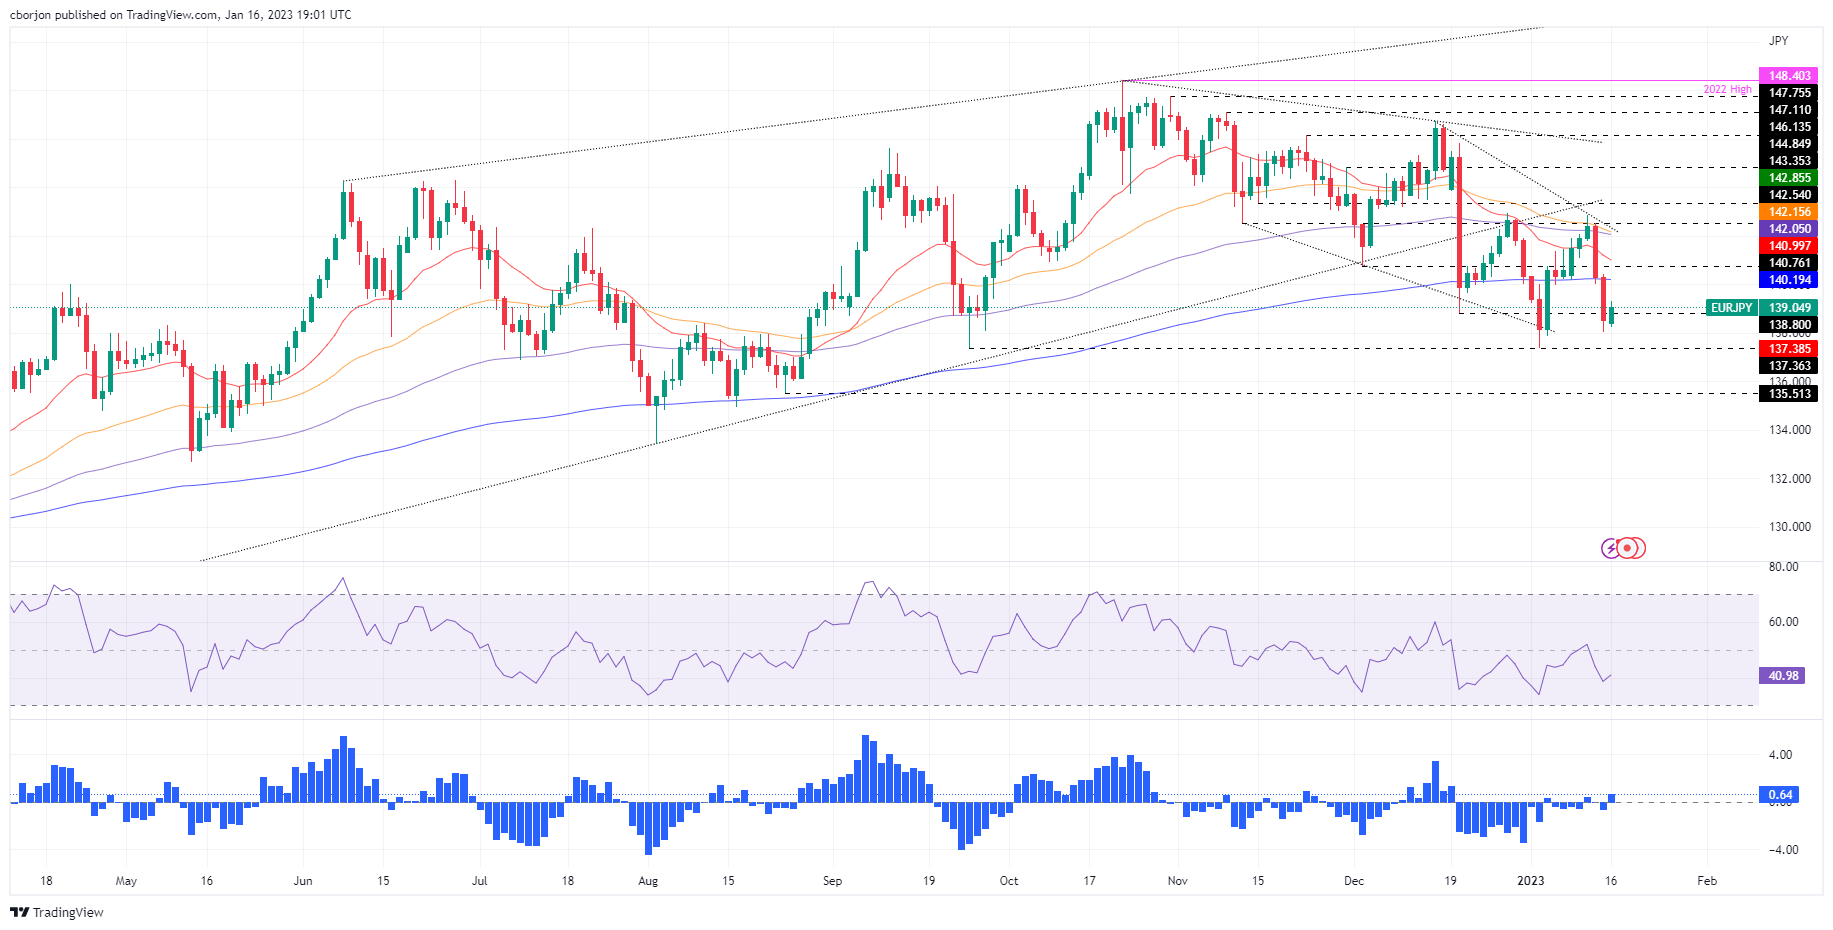
EUR/JPY Price Analysis: On a correction above 139.00 as bears take a respite
- EUR/JPY bounced off last weekly lows and reclaimed 139.00 amidst a sour market sentiment.
- EUR/JPY Price Analysis: Bearish below the 200-day EMA; otherwise, it could test 141.00.
The EUR/JPY bounces off the last week’s low of 138.01 and climbs above the 139.00 figure, despite a sour sentiment. Hence, the Euro (EUR) gained some ground against the Japanese Yen (JPY), though it would likely be influenced by the Bank of Japan’s (BoJ) Wednesday’s monetary policy decision. At the time of writing, the EUR/JPY is trading at 139.10, up by 0.43%.
EUR/JPY Price Analysis: Technical outlook
Even though the EUR/JPY is printing a leg-up, the overall trend is downwards once the cross dived below the 200-day Exponential Moving Average (EMA) at 140.19. The Relative Strength Index (RSI), although aiming up, it remains at bearish territory, suggesting that sellers remain in charge, while the Rate of Change (RoC), indicates that buyers are in charge. So, EUR/JPY might refrain from opening fresh shorts until having a clearer RSI signal, as the fundamental bias favors the JPY.
If the EUR/JPY fails to clear the 200-day EMA, that will keep the pair’s bias bearish. Therefore, the EUR/JPY first support would be the 139.00 mark. The break below will expose the 138.01 January 13 daily low, followed by the January 3 daily low of 137.38, followed by the 135.51 August 24 swing low.
On the other hand, EUR/JPY reclaiming the 200-day EMA would lif the pair towards the 20-day EMA at 140.99, followed by the 100-day EMA at 142.05, followed by the 50-day EMA at 142.15, ahead of 142.50.
EUR/JPY Key Technical Level
-
18:51
WTI Price Analysis: Bulls press against daily trendline resistance, bears are lurking
- WTI M-formation is in play in thin choppy trade on Monday.
- Daily chart parameters keep the price stuck in a range, testing daily trendline resistance.
Oil has fallen in thin trade at the start of the week with US exchanges closed for the Martin Luther King, Jr, holiday. West Texas Intermediate spot is currently trading around $79.00 and is down by 1.25%.
Technically, the M-formation on the hopurtly chart is a reversion pattern that would be expected to draw in the price into the Fibonacci scale drawn on the prior bearish impulse's range. The 38.2% Fibo aligns with a structure near 79.15 that could act as a resistance on a restest.
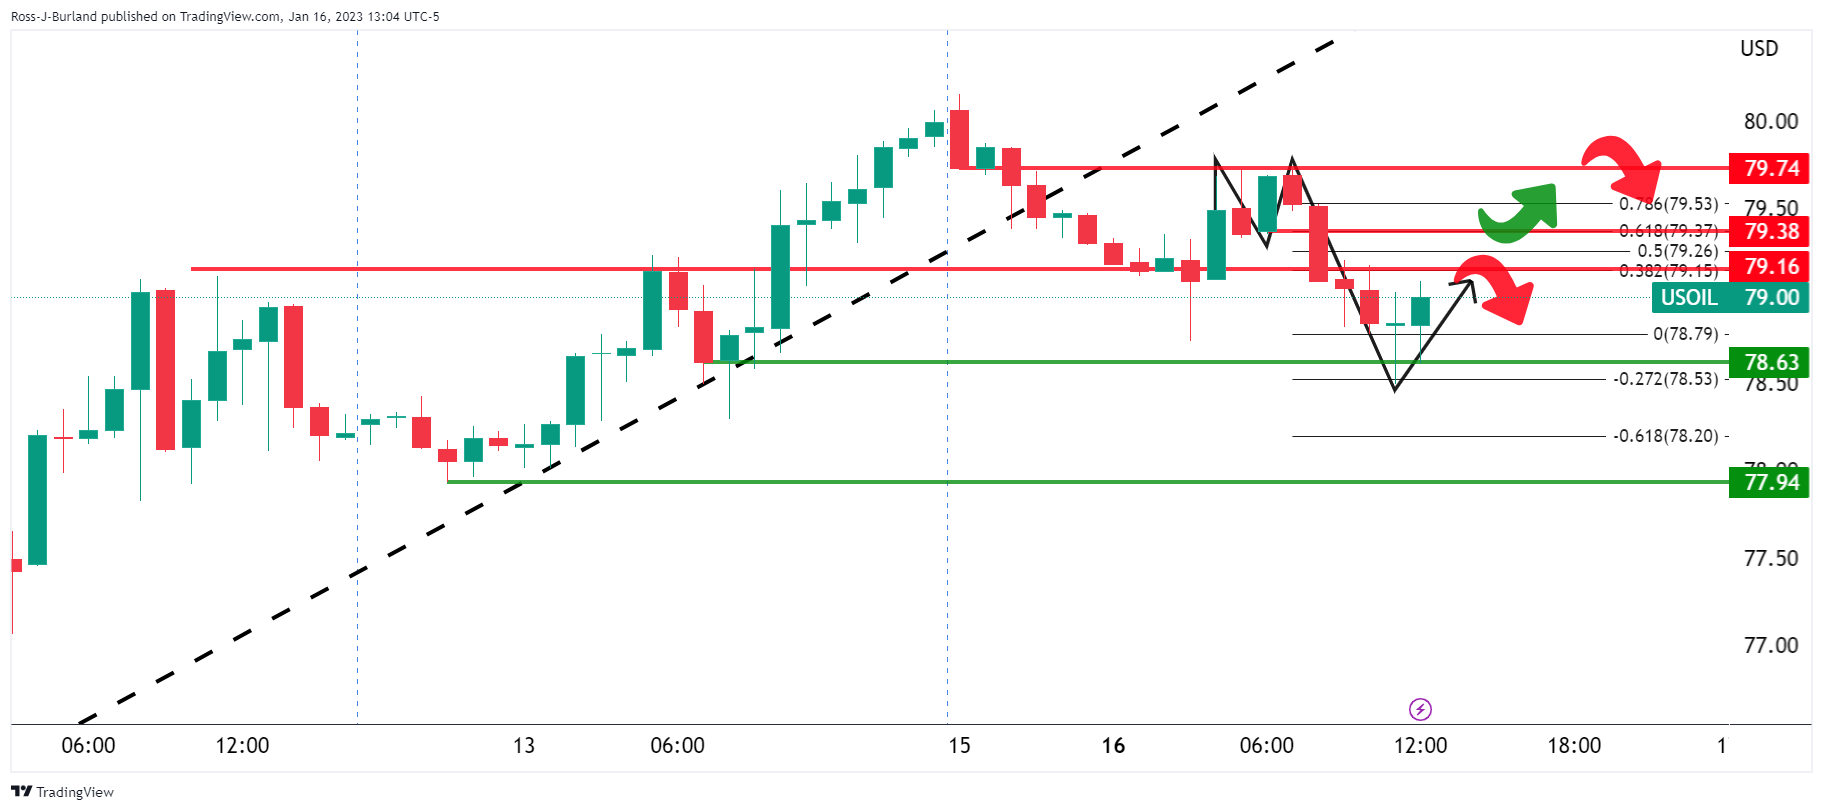
If the price were to break there, then a 50% mean reversion will be a likely scenario ahead of the 61.8% Fibonacci that meets the neckline of the M-pattern near 79.38. Above there, the double top of the M-formation comes in at around 79.75. Stops above there will be located around 80.00. However, given that the market is on the backside of the bullish trend, the downside will remain favourable until the bulls can break above 83.32 daily highs and structure:
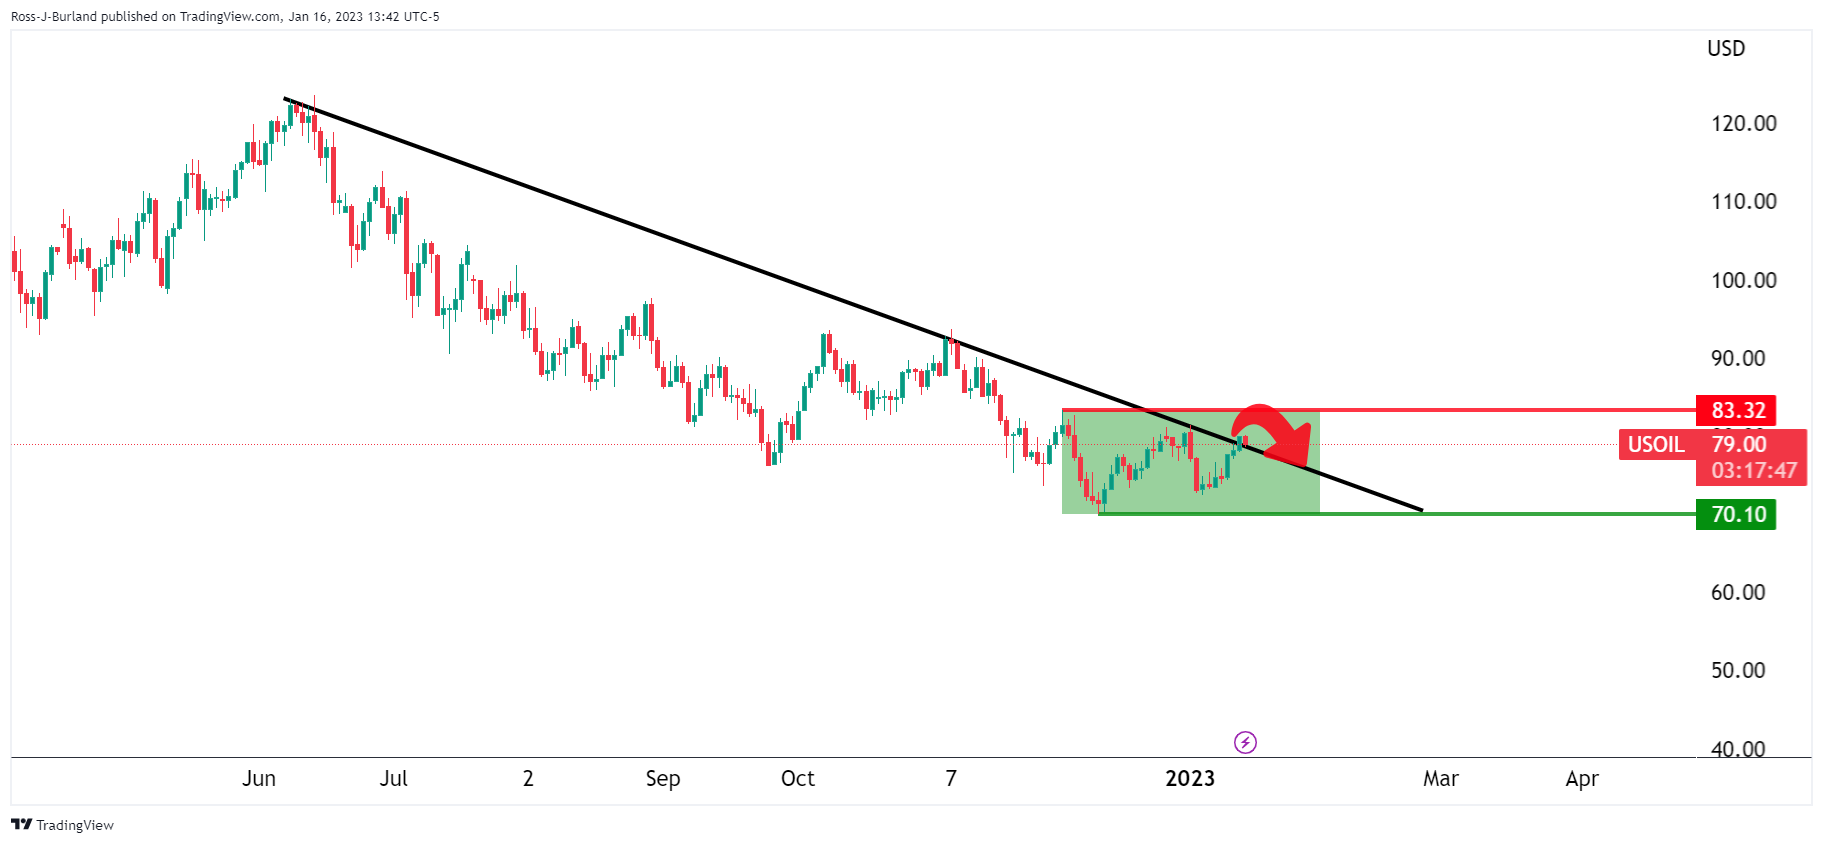
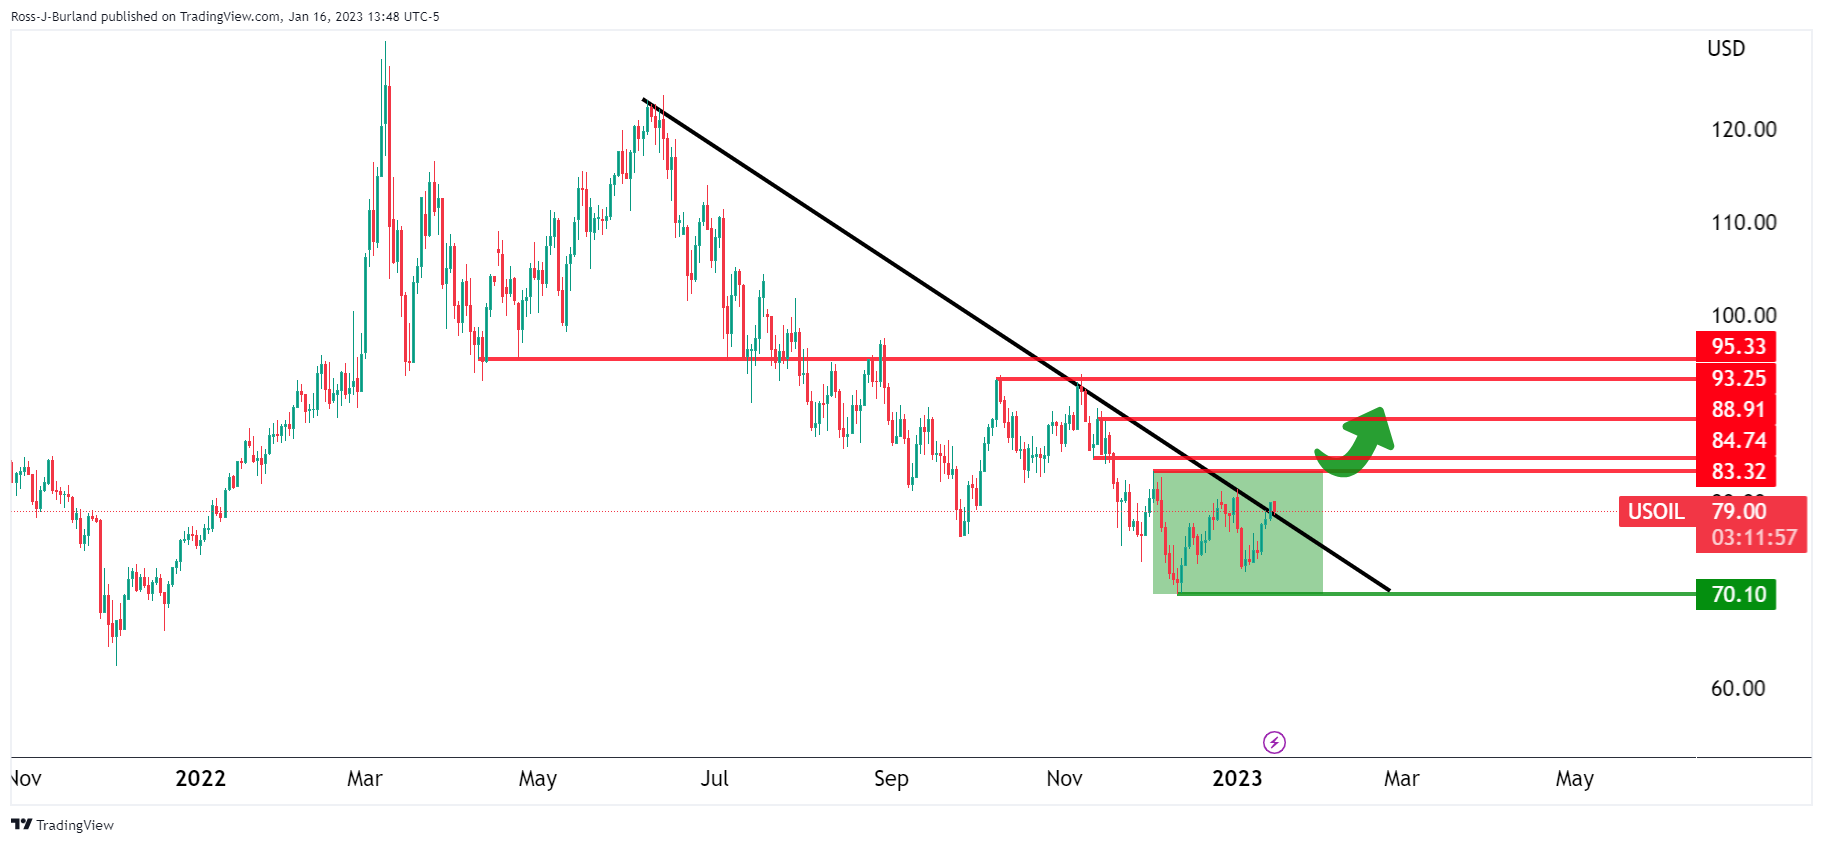
On the other hand, a break of structure opens risk to a run towards 93.25 / 95.33 and higher in a correction of the 2022 summer commencing bearish cycle:
-
18:02
AUD/USD stalls around 0.7000, on risk-off mood and buoyant US Dollar
- The US Dollar stages a recovery on Monday after plunging to seven-month lows against a basket of currencies.
- Australia’s inflation data might spur a reaction by the Reserve Bank of Australia as prices continue to elevate.
- AUD/USD Price Analysis: In a pullback, though expected to resume its uptrend, above 0.7000.
The Australian Dollar (AUD) losses momentum against the US Dollar (USD) and tumbles back below the 0.7000 figure, on low liquidity conditions, on the observance of Martin Luther King Jr. day. A risk-off impulse bolstered the US Dollar (USD), recovering some ground against most G8 currencies. Therefore, the AUD/USD is trading at 0.6952.
Although the US equities cash market is closed, the S&P 500 and Nasdaq Futures portray a dampened market sentiment. Last week’s US economic data, mainly inflation edging lower and consumer sentiment improved, as reported by the University of Michigan (UoM) poll, augmented speculations that the US Federal Reserve would tighten policy by 25 bps. Also, inflation expectations continue to drop as Americans remain optimistic that the US Central Bank could achieve a “soft landing.”
The US Dollar Index (DXY), which measures the greenback’s value against a basket of six currencies, edges up by almost 0.70%, at 128.730, despite the absence of US traders, a headwind for the AUD/USD.
On the Australian front, its economic calendar featured the Melbourne Institute Monthly Inflation gauge, which showed that inflation decelerated by 0.2%. The latest data showed signs that Australia’s inflation figures remained high, both in terms of quarterly and monthly readings. The annual inflation rate in Australia climbed to an over three-decade high of 7.3% in Q3 of 2022 from 6.1% in Q2. Meanwhile, monthly data showed Australia’s CPI rose to a record high of 7.3% YoY in November, well above the Reserve Bank of Australia’s (RBA) 2% to 3% target, fueling expectations for additional tightening by the RBA.
AUD/USD Price Analysis: Technical outlook
After rallying for three consecutive days to fresh multi-month highs at 0.7019, the AUD/USD it’s retracing to the mid-0.69-0.70 range. Although at bullish territory, the Relative Strength Index (RSI) aims down, contrarily to the Rate of Change (RoC), which shows volatility is increasing. Hence, the AUD/USD traders might refrain from opening fresh long positions until the RSI shifts upwards, though the path of least resistance is upwards.
Hence, the AUD/USD key resistance levels would be 0.7000, the new 7-month high hit on January’s 16 sessions at 0.7019, and the August 11 daily high of 0.7136.
-
17:47
GBP/USD bears stay on top in US session, taking out 1.2200
- GBP/USD pressured ahead of key data events this week.
- Bank of England Governor Andrew Bailey said inflation looks set to fall markedly this year as energy prices decrease.
GBP/USD was down 0.27% at 1.2194 after rising to its highest since mid-December to 1.2288 from a low of 1.2170 while traders await UK jobs and inflation data due later this week for clues on Bank of England (BoE) monetary policy plans.
In recent trade, the Bank of England Governor Andrew Bailey said on Monday that inflation looks set to fall markedly this year as energy prices decrease.
However, he said that a shortage of workers in the labour market poses a "major risk" to this scenario.
"I think that going forwards the major risk to inflation coming down ... is the supply side - and in this country particularly, the question of the shrinkage of the labour force," Bailey told lawmakers on parliament's Treasury Committee.
Key UK on tap
Meanwhile, Employment data will be released on Tuesday and inflation numbers on Wednesday. ''We look for another large decline in UK headline Consumer Price Index, largely due to an almost 5% m/m drop in petrol prices but also as retailers pushed through significant discounts in the month to rid themselves of high inventory levels,'' analysts at TD Securities said. ''While our forecast is quite a bit below the BoE's of 10.9% YoY, much of this gap is due to lower petrol prices rather than weaker underlying dynamics.''
As for the jobs data, the analysts say they ''look for an unchanged unemployment rate in the three months to November as the labour market continues to stay persistently tight. At the same time, we think both headline and ex-bonus wage growth accelerated yet again, despite high-frequency data softening further.''
Looking ahead to next month's meeting, a tenth consecutive hike is expected and the money markets are pricing in a 65% chance of a 50 basis point (bps) hike and a 35% chance of a 25 bps increase.
''Even if the BoE has good reason to step up a hawkish tone, there were various instances last year when this failed to boost GBP, given the backdrop of weak investment growth, low productivity and overhanging uncertainties about the UK’s post-Brexit relationship with the EU,'' analysts at Rabobank said.
-
17:18
BoE Gov. Bailey: Inflation looks set to fall markedly this year
Reuters reports that the Bank of England Governor Andrew Bailey said on Monday that inflation looks set to fall markedly this year as energy prices decrease.
However, he said that a shortage of workers in the labour market poses a "major risk" to this scenario.
"I think that going forwards the major risk to inflation coming down ... is the supply side - and in this country particularly, the question of the shrinkage of the labour force," Bailey told lawmakers on parliament's Treasury Committee.
Key quotes
We are likely to see inflation fall in the year ahead as energy prices are coming down.
Major risk to boe's central case for inflation coming down is uk labour shortage.
Likely there will be negative short-term impact from covid in china, don't expect it to be lasting.GBP/USD update
Andrew Bailey's comments are similar to those he made late last year and are having little impact on GBP/USD in the North American session. GBP/USD is down some 0.2% at 1.2202. The range on the day so far has been 1.2170 and 1.2288.
Reuters said that ''the BoE is expected to raise interest rates for a tenth time in a row early next month and the main question for investors is the scale of the increase as the central bank weighs up the risk of a recession with the need to fight inflation.''
-
16:38
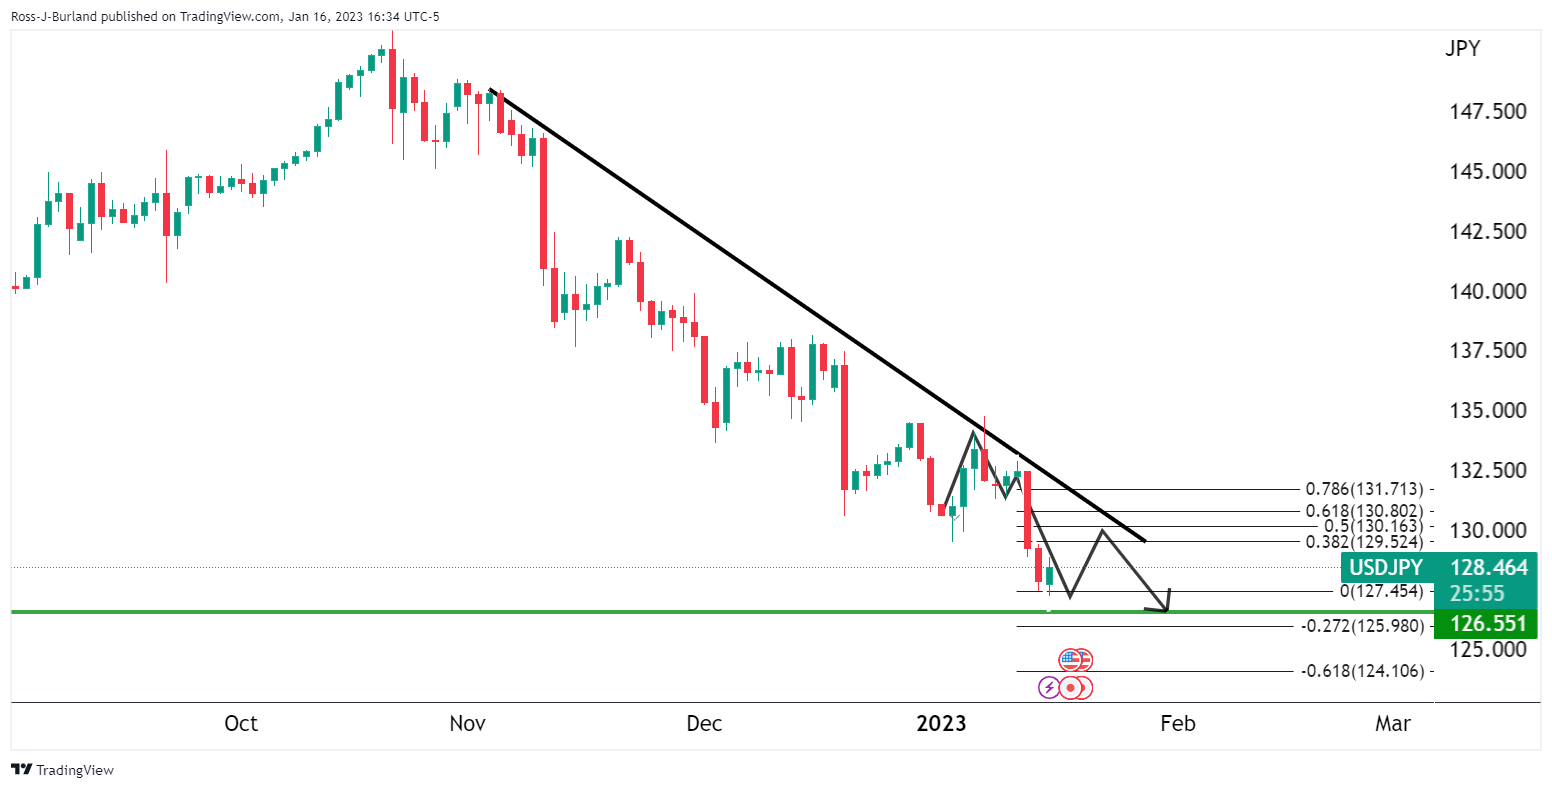
USD/JPY rises back above 128.50 on broad US Dollar strength, ahead of the BoJ’s meeting
- The USD/JPY traded below 128.00 for the first time since June 2022.
- USD/JPY traders are bracing for the Bank of Japan’s monetary policy meeting on Wednesday.
- USD/JPY Price Analysis: Downward biased; it could test 125.00 in the near term.
The USD/JPY recovered after hitting an eight-month low around 127.21, reclaiming 128.00 and advancing sharply toward 128.40 on a thin liquidity North American session. An absent US economic docket on the observance of Martin Luther King Jr. day keeps traders leaning on what the US/Japanese calendar presents ahead. At the time of writing, the USD/JPY is trading at 128.55.
US Dollar remains bid, a tailwind for the USD/JPY
US equity futures continue to trade with losses on low volumes. However, with Q4 earnings crossing newswires, equities might continue to lead global investors’ moods. Expectations around the Bank of Japan’s (BoJ) Wednesday’s monetary policy decision continue to mount after tweaking its Yield Curve Control (YCC) at December’s meeting, which expanded the band of the 10-year Japanese Government Bonds (JGBs) from 0.25% to around 0.50%. The BoJ is the only central bank that has not raised rates, though further tightening is likely in the months ahead.
Deutsche Bank (DB) analysts expect the BoJ to continue its easing stance, but they believe that the Outlook Report will update the bank’s inflation forecast to 2% for 2022-2024. Additionally and abandonment of the YCC by the end of Q2 of 2023 is expected.
A day after the BoJ’s decision, the Japanese economic docket will feature the National Consumer Price Index (CPI), with core CPI (excluding food) estimated at 3.9% YoY vs. 3.7% in November, and excluding food and energy is foreseen at 3.1%.
Elsewhere, the US economic calendar will feature the US Empire State Manufacturing Survey, alongside Fed speaking and the Beige book, as the US Central Bank prepares for the year’s first monetary policy. On Wednesday, US Retail Sales and PPI will get a look, while Initial Jobless Claims and Housing data will be revealed on Thursday.
USD/JPY Price Analysis: Technical outlook
Despite the ongoing correction, the USD/JPY daily chart portrays the pair’s downward biased, threatening to erase last Friday’s gains. As long as the exchange rates persist beneath 132.87, the last higher-high achieved for the USD/JPY, the USD/JPY should be poised to test the May 24 swing low of 126.36, followed by the 125.00 figure, ahead of the March 31 pivot low of 121.28.

-
16:35
USD/MXN Price Analysis: A correction to 19.00 is on the cards
- Mexican Peso holds bullish tone against the US Dollar.
- USD/MXN’s technical indicators point to a correction or a consolidation.
- Consolidation below 18.70 would open the doors to 18.50.
The USD/MXN is rising on Monday after hitting the lowest intraday level in almost three years at 18.73. A weaker US Dollar and a positive tone across financial markets are offering support the Mexican Peso and emerging market currencies.
The rebound on Monday was capped by the 18.85 zone, the confluence of a horizontal level, the 20-Simple Moving Average in four hours chart and a downtrend line. A break above would open the doors to a deeper bullish correction in line with some technical indicators. The next resistance is seen at 18.90 before the more important zone of 19.00/05 which should limit the upside.
In the short-term, technical indicators favor a stabilization. Momentum is well below midlines but pointing to the upside. RSI is at or near oversold levels and MACD shows some potential for a deeper correction.
The main trend for USD/MXN is bearish. The downside so far has found support at the 18.70/75 zone. A break lower would clear the way to more losses, targeting the 18.50 zone.
USD/MXN 4-hour chart
-638094836849089910.png)
Technical levels
-
16:00
Gold Price Forecast: XAU/USD to see substantial selling flow on a break below $1,865 – TDS
Strategists at TD Securities do not expect CTA trend followers to exacerbate the rally in Gold much further.
Gold prices are overbought
“Gold prices are overbought, but the demand trends underlying its strength remain unrelenting.”
“We don't expect CTA trend followers to further exacerbate buying activity as long as prices remain below the $1,990 mark. However, a close below the $1,917 range could be consistent with marginal algo liquidations, but more substantial selling flow from trend followers would only be expected if prices break below the $1,865 mark.”
-
15:49
EUR/USD to work its way back to the 1.15 area – ING
Economists at ING are revising their 2023-2024 EUR/USD profile substantially higher.
3Q and 4Q could prove trickier for EUR/USD
“Bearing in mind the importance of EUR/USD in driving FX trends globally, we no longer feel we can justify a sub-consensus profile over the coming years. Instead, we expect EUR/USD to work its way back to medium-term fair value, now around the 1.15 area.”
“In terms of a quarterly profile this year, a good proportion of the year's EUR/USD gains could come in the second quarter when we expect US core inflation to fall sharply, allowing the short end of the US yield curve to adjust lower too.”
“2Q should also be the period when China re-opening trends gain a further leg higher. However, 3Q and 4Q could prove trickier for EUR/USD: the third quarter on the basis that the extension of the US debt ceiling could become a very contentious political debate around that period and be bad for the risk environment and the fourth on the basis that higher energy prices could again hit the Euro.”
-
15:42
EUR/GBP bullish, limited while below 0.8900
- Euro remains supported by ECB official hawkish comments.
- EUR/GBP with bullish bias, moving between 0.8845 and 0.8890.
The EUR/GBP is rising on Monday after a modest slide on Friday and is moving sideways, under the 0.8900 resistance area. The bias continues to point to the upside.
In range, holding onto recent gains
The EUR/GBP found support over the last session at the 0.8845 area. As long as it holds above, more gains seem likely, but the Euro needs to break the critical 0.8900 resistance area.
The bias is bullish with vital support seen at 0.8815/20, the confluence of an uptrend line and the 20-day Simple Moving Average (SMA). A slide below would expose the next relevant support at 0.8770.
From a fundamental perspective, comments from European Central Bank board members continue to be on the hawkish side. On Monday, it was Olli Rhen, Governor of the Bank of Finland, who said that interest rates will continue to rise considerably. This contrasts with the Bank of England that is having a debate about what to do next. Concerns about the health of the UK economy adds pressure to the BoE to stop the tightening cycle. The divergence between the expectations of the central banks is offering support at the moment to the EUR/GBP.
On Tuesday, the UK will report on the labor market and Germany will release the final reading of inflation (December) and the ZEW sentiment survey.
Technical levels
-
15:40
Gold Price Forecast: XAU/USD buyers take a breather around $1910s as the USD recovers
- Gold’s rally stalled shy of reaching $1,930, though it printed a 9-month new high.
- Inflation expectations in the United States eased, though Gold’s appeal will likely continue as the US Dollar weakens.
- XAU/USD Price Analysis: Could continue its rally if it reclaims $1,955, opening the door for the $1,980 - $2,000 range.
Gold price retraces as the North American session begins, even though Wall Street would remain closed in observance of Martin Luther King Jr. day. Nevertheless, the US Dollar (USD) has recovered some ground, snapping two straight days of losses, while the 10-year US Treasury bond yield finished the week around 3.50%. At the time of writing, XAU/USD is trading at $1,915.62, with losses of 0.34%.
Gold’s trade negative on dampened sentiment and Friday’s uptick in US yields
Global equities are trading negatively. US equity futures remain dealing with losses, while last week’s inflation data in the United States (US) pressured the US dollar. The University of Michigan, Consumer sentiment poll showed that 1-year inflation expectations eased to 4% from 4.4%, while for a 5-year horizon, edged up to 3% from 2.9%. Also, a slew of US Federal Reserve (Fed) officials backed the idea of slowing the pace of interest rate hikes.
In the meantime, the US Dollar Index (DXY), which measures the buck’s value against six currencies, has recovered some ground, up 0.15% at 102.332. With the US markets closed for a holiday, US Treasury bond yields remained unchanged, but traders should be aware that US yields ended on a higher note on Friday.
Ahead of the week, the US economic docket will feature the US Empire State Manufacturing Survey, alongside Fed speaking and the Beige book, as the US Central Bank prepares for the year’s first monetary policy. On Wednesday, US Retail Sales and PPI will get a look, while Initial Jobless Claims and Housing data will be revealed on Thursday.
Gold Price Forecast: Technical outlook
From a daily chart perspective, Gold remains upward biased, even though the yellow metal spurred an uptick to overbought conditions, per the Relative Strength Index (RSI). The Rate of Change (RoC) flashes that buyers continue to gather momentum, so the current pullback seems to be used by Gold longs, which could be adding to previous positions, as the non-yielding metal printed a new 9-month high at $1,928.95.
XAU/USD resistance levels lie at $1,930, followed by April’s 22 daily high of $1955.60, followed by April 19 high of $1,981.95, ahead of the $2,000 barrier.
-
15:31
The next month provides a nice window for the USD to consolidate – TDS
In the view of analysts at TD Securities, there is likely potential for USD consolidation in the first quarter of the year.
Scope for a bit of USD consolidation in the weeks ahead
“Earnings, global data surprises, and a bumpy China reopening could stall the Goldilocks optimism in the weeks ahead.”
“The next month provides a nice window for the USD to consolidate. It screens at an extreme discount on a host of measures, though we think any rallies will be shallow, brief, and short-lived.”
-
15:15
AUD/USD: Upside pressure to stay in place towards 0.7088/7136 – Credit Suisse
AUD/USD continues to edge slowly higher. Economists at Credit Suisse stay bullish and look for upside to 0.7088/7136 next.
Notable support seen at 0.6893/75
“Near-term momentum continues to rise and with weekly MACD now also crossing into positive territory, we think the upside pressure is likely to stay in place.”
“Initial resistance moves to 0.7000/09, with the next key resistance zone located at the 50% retracement of the 2021/22 fall and the August high 0.7088/7136, which we think is likely to provide a tougher resistance. A close above here though would inject further upside momentum and clear the way to 0.7282, which is the June high.”
“More notable support is seen at the recent breakout point and the 13-Day Exponential Average at 0.6893/75 and then at the 200DMA at 0.6858, which we look to hold to keep the near-term bias higher.”
-
14:57
EUR/USD: Scope for a move back to 1.06 on a three-month view – Rabobank
The market has become very long EUR, and this exposes EUR/USD to the possibility of sharp pullbacks. Economists at Rabobank see the pair at 1.06 on a three-month view.
One-month forecast of EUR/USD 1.09
“While disappointing Eurozone data could be the trigger for pullbacks in the EUR, in view of the lower prices of energy, we would expect the market to look through this. More likely pullbacks in EUR/USD will be triggered by a continued hawkish position by Fed officials. That said, given the pace at which US headline inflation has come down from its highs recently, the market may continue to largely ignore Fed hawks for a while longer”
“We see plenty of opportunity for USD bulls to become re-engaged particularly in a three- to-six-month view. However, to reflect the change in fundamentals, we have lifted our EUR/USD forecasts from previous levels.”
“Following a one-month forecast of EUR/USD 1.09 we see scope for a move back to 1.06 on a three-month view. This assumes the Fed maintains its forecast of no rate cut until 2024.”
-
14:56
GBP/USD: Extra advance needs to clear 1.2270 – UOB
In the opinion of Markets Strategist Quek Ser Leang and Senior FX Strategist Peter Chia at UOB Group, further upside in GBP/USD needs to leave behind the 1.2270 level in the next few weeks.
Key Quotes
24-hour view: “We highlighted last Friday that ‘upward momentum has improved a tad but while GBP is likely to trade with an upward bias, it is unlikely to break 1.2270’. GBP subsequently rose to 1.2250, dropped to 1.2153 before rebounding to close at 1.2234 (+0.17%). Despite the choppy price actions, the underlying tone appears to be firm and GBP is likely to edge higher. However, a clear break of 1.2270 still appears unlikely. Support is at 1.2200, followed by 1.2170.”
Next 1-3 weeks: “Our update from last Friday (13 Jan, spot at 1.2215) is still valid. As highlighted, in order to keep the momentum going, GBP must break 1.2270 these 1-2 days or the prospect of further GBP strength would diminish quickly. Conversely, a break of 1.2125 (‘strong support’ level was 1.2100 last Friday) would indicate that GBP is not advancing further. Looking ahead, above 1.2270, there is a significant resistance level at 1.2305.”
-
14:48
EUR/USD looks indecisive and supported around 1.0800
- EUR/USD alternates gains with losses in the low-1.0800s.
- The dollar remains slightly bid around 102.30 gauged by the DXY.
- US stock/bond markets will return to normality on Tuesday.
The absence of direction remains unchanged around EUR/USD at the beginning of the week.
EUR/USD meets support around 1.0800
The sharp recovery in EUR/USD from lows near 1.0480 (January 6) seems to have met some decent resistance around the 1.0880 region, or YTD peaks, so far on Monday.
In the meantime, the inconclusive price action around the pair comes in tandem with the lacklustre bounce in the greenback, all against the backdrop of scarce volatility and reduced trade conditions in response to the holiday in the US.
Data wise in the region, Wholesale Prices in Germany contracted 1.6% MoM in December and rose 12.8% over the last twelve months.
What to look for around EUR
EUR/USD gives away some gains and returns to the negative territory following an earlier climb to new highs around 1.0880.
Price action around the European currency should continue to closely follow dollar dynamics, as well as the impact of the energy crisis on the euro bloc and the Fed-ECB divergence.
Back to the euro area, the increasing speculation of a potential recession in the bloc emerges as an important domestic headwind facing the euro in the short-term horizon.
Key events in the euro area this week: Eurogroup Meeting (Monday) – ECOFIN Meeting, Germany Final Inflation Rate / ZEW Economic Sentiment, EMU ZEW Economic Sentiment, Italy Final Inflation Rate (Tuesday) - EMU New Car Registrations / Final Inflation Rate (Wednesday) – ECB Lagarde, ECB Accounts (Thursday) - ECB Lagarde (Friday).
Eminent issues on the back boiler: Continuation of the ECB hiking cycle amidst diminishing probability of a recession in the region. Impact of the war in Ukraine and the protracted energy crisis on the bloc’s growth prospects and inflation outlook. Risks of inflation becoming entrenched.
EUR/USD levels to watch
So far, the pair is losing 0.12% at 1.0818 and the breakdown of 1.0481 (monthly low January 6) would target 1.0443 (weekly low December 7) en route to 1.0459 (55-day SMA). On the upside, the initial hurdle emerges at 1.0874 (monthly high January 16) followed by 1.0900 (round level) and finally 1.0936 (weekly high April 21 2022).
-
14:45
USD/JPY to test 2015 peak of 125.85/124 – SocGen
USD/JPY hit an eight-month low at 127.24. Next objectives are at projections of 126.80 and 2015 levels of 125.85/124.00, economists at Société Générale report.
2015 high of 125.85/124 is significant support
“The pair is expected to head lower towards projections of 126.80 and the peak of 2015 near 125.85/124.00. This could be an important support zone.”
“Daily MACD has flattened recently however signals of a meaningful bounce are not yet visible.”
“The 200DMA at 136.50 should cap upside.”
See: USD/JPY can trade down to 126.50 before BoJ’s meeting – ING
-
14:27
EUR/USD: Ongoing pressure for gains to extend to 1.1000/50 – Scotiabank
EUR/USD closed out last week strongly and will look to build on gains through the 1.0700/50 area in the coming days and weeks, economists at Scotiabank report.
Bull trend develops on the charts
“European fundamental data suggests economic resilience and out-performing European stocks remain attractive for investors.”
“Look for spot to remain well-supported on shallow dips.”
“The overall technical set up in EUR/USD remains bullish– a solid trend higher is evident on the short, medium and long-term charts, backed by solid-looking oscillators. This should mean limited scope for EUR losses (high 1.07s) and ongoing pressure for gains to extend to 1.1000/50.”
-
14:16
EUR/USD: Further consolidation likely below 1.0760 – UOB
Markets Strategist Quek Ser Leang and Senior FX Strategist Peter Chia suggest a breakdown of 1.0760 could motivate EUR/USD to attempt some consolidation.
Key Quotes
24-hour view: “We highlighted last Friday that ‘despite the relatively large gains, momentum has not improved by much’. We added, ‘the risk for EUR is still on the upside even though 1.0900 is expected to offer solid resistance’. However, EUR did not challenge 1.0900 as it dropped from 1.0867 to 1.0778 before closing at 1.0828 (-0.17%). The price actions appear to be part of a consolidation phase. Today, EUR is likely to trade sideways between 1.0780 and 1.0870.”
Next 1-3: “We highlighted last Friday (13 Jan, spot at 1.0850) that the improved upward momentum suggests further EUR strength. We did not expect the pullback to a low of 1.0778. The price actions have led to an easing in momentum and a break of 1.0760 (no change in ‘strong support’ level) would indicate that EUR could consolidate first before making another attempt to advance toward the resistance at 1.0900 later on.”
-
14:05
AUD/USD to inch higher gradually towards last August high of 0.7090/0.7130 – SocGen
AUD/USD has broken into 0.70 handle for the first time since August. Economists at Société Générale expect the pair to head toward the 0.7090/0.7130 region.
Defending 0.6830 crucial for further up move
“AUD/USD has overcome the 200DMA first time since giving it up in April last year; this affirms persistence in upward momentum.”
“Defending the Moving Average at 0.6830 would be crucial for further up move.”
“The pair is expected to inch higher gradually towards last August's high of 0.7090/0.7130. This could be the next potential resistance zone.”
-
13:51
GBP/USD remains on the defensive, hovers around 1.2200 mark ahead of BoE’s Bailey
- GBP/USD comes under some selling pressure on Monday amid a goodish USD recovery.
- Bets for smaller Fed rate hikes cap the upside for the buck and lend support to the pair.
- Traders now look to BoE Governor Andrew Bailey’s speech for some meaningful impetus.
The GBP/USD pair retreats from a one-month high touched earlier this Monday and remains on the defensive through the early North American session, though lacks follow-through. The pair is currently placed around the 1.2200 mark and is weighed down by a modest US Dollar strength.
In the absence of any relevant economic data, a softer risk tone, amid worries about a deeper global economic downturn, revives demand for the safe-haven greenback. In fact, the USD Index, which measures the greenback's performance against a basket of currencies, rebounds from a seven-month low and exerts some downward pressure on the GBP/USD pair.
The British Pound is further undermined by a bleak outlook for the UK economy, which has been fueling speculations that the Bank of England (BoE) could be nearing the end of its rate-hiking cycle. That said, expectations for a less aggressive policy tightening by the Fed cap the attempted USD recovery and act as a tailwind for the GBP/USD pair.
Investors now seem convinced that the Fed will soften its hawkish stance and have been pricing in a smaller 25 bps rate hike in February amid signs of easing inflationary pressures. The bets were lifted by the latest US CPI report released last week, which showed that consumer prices fell in December for the first time in more than 2-1/2 years.
Furthermore, a holiday in the US, in observance of Martin Luther King Jr. Day, is holding back the USD bulls from placing aggressive bets and lending support to the GBP/USD pair. That said, BoE Governor Andrew Bailey's speech might influence the British Pound and provide some impetus ahead of the monthly UK employment details on Tuesday.
Technical levels to watch
-
13:30
Canada Manufacturing Sales (MoM) came in at 0%, above forecasts (-0.1%) in November
-
13:16
USD/CAD lacks firm intraday direction, oscillates in a range around 1.3400 mark
- USD/CAD attracts some dip-buying on Monday and is supported by a combination of factors.
- Retreating oil prices undermines the Loonie and lends support amid a modest USD strength.
- Bets for smaller Fed rate hikes cap the USD recovery and act as a headwind for the major.
The USD/CAD pair seesaws between tepid gains/minor losses heading into the North American session and is currently trading around the 1.3400 mark, nearly unchanged for the day.
A combination of supporting factors did assist the USD/CAD pair to attract some buyers near the 1.3350 area, though the intraday uptick runs out of steam near the 1.3420 region. A modest pullback in crude oil prices undermines the commodity-linked Loonie and lends support to spot prices. Apart from this, a softer risk tone drives haven flows towards the US Dollar and acts as a tailwind for the major.
The attempted USD recovery from a seven-month low, meanwhile, remains capped in the wake of rising bets for a less aggressive policy tightening by the Fed. In fact, the markets now seem convinced that the US central bank will soften its hawkish stance amid signs of easing inflationary pressure. Furthermore, several FOMC members last week backed the case for a smaller 25 bps rate hike in February.
Given that the US markets are closed in observance of Martin Luther King Jr. Day, the aforementioned mixed fundamental backdrop holds back traders from placing aggressive bets around the USD/CAD pair. Traders also seem reluctant ahead of the release of Canadian consumer inflation data on Tuesday, which will be followed by the Producer Price Index and Retail Sales figures from the US on Wednesday.
In the meantime, traders on Monday will take cues from oil price dynamics. Apart from this, the Bank of Canada's Business Outlook Survey report might influence the Canadian Dollar and contribute to producing short-term opportunities around the USD/CAD pair.
Technical levels to watch
-
13:15
S&P 500 Index could fall 15-20% if the economy enters a full-blown recession – UBS
S&P 500 wrapped up the second week of 2023 with another positive performance. But economists at UBS think that the upcoming 4Q corporate reporting season will provide a reality check.
4Q earnings growth to stall
“Earnings headwinds – an aggressive Fed, a normalization in demand for goods popular during the pandemic, a stronger USD, and higher costs because of more expensive labor – have become strong enough for us to expect no growth in S&P 500 4Q earnings per share compared to the same period last year. Overall, we expect a sharp slowdown in revenue growth to the 4-5% range, and a continued normalization in profit margins from higher-than-average levels last year.”
“Our view on full-year 2023 earnings remains unchanged. Our 2023 EPS estimate is USD215, which is a 4% decline from 2022. We believe the full-year bottom-up consensus EPS estimates look at least 6 percent too high.”
“The S&P 500 forward P/E is at 17.3x compared to the 15-66x range prevailing before the 2Q and 3Q reports. It is also high by historical standards. This suggests that even if results are a bit better than investors expect, the upside market potential may be somewhat limited.”
“Even if the bottom-up EPS estimate of USD230 proves correct, we struggle to justify paying a P/E of more than 18x. That suggests upside potential to 4,140 for S&P 500, only 4% higher than current levels. At the same time, downside risks remain elevated, and stocks could fall 15-20% if the economy enters a full-blown recession.”
-
12:55
EUR/USD to extend its race higher if overcomes resistance near 1.0940 – SocGen
EUR/USD is fast approaching 1.0940 which could be next potential hurdle. Above here, the rebound could persist towards 1.1040/1.1080, economists at Société Générale report.
Next potential hurdles at 1.0940 and 1.1040/1.1080
“The pair has re-established itself beyond the 200DMA in December and is approaching 1.0940, the 50% retracement from 2021. This is an interim resistance.”
“An initial pullback is not ruled out however recent trough near 1.0480 could provide support. The MA at 1.0300/1.0220 should now be an important level in case a deeper pullback materializes.”
“If EUR/USD overcomes the resistance near 1.0940, the rebound could persist towards next projections at 1.1040/1.1080.”
-
12:29
AUD/USD flat-lines above mid-0.6900s amid modest USD strength, cautious market mood
- AUD/USD retreats from a multi-month high touched on Monday, albeit lacks follow-through.
- A softer risk tone lifts the safe-haven USD and weighs on the risk-sensitive Australian Dollar.
- Bets for smaller Fed rate hikes cap the greenback and help limit the downside for the major.
The AUD/USD pair finds some support near the 0.6940 area and stalls its intraday retracement slide from the highest level since August 17 touched earlier this Monday. The pair is currently placed around the 0.6970 area, nearly unchanged for the day, and is influenced by the US Dollar price dynamics.
The USD Index, which measured the greenback's performance against a basket of currencies, stages a goodish rebound from a seven-month low and prompts some selling around the AUD/USD pair. A softer tone risk tone, amid worries about a deeper global economic downturn, benefits the safe-haven buck and drives flows away from the risk-sensitive Aussie. That said, speculations that the Fed may be nearing the end of its rate-hiking cycle keep a lid on any meaningful upside for the USD.
Investors now seem convinced that the US central bank will soften its hawkish stance amid signs of easing inflationary pressures. In fact, the latest US CPI report released last week showed that consumer prices fell in December for the first time in more than 2-1/2 years. This, in turn, lifted bets for a smaller 25 bps Fed rate hike move in February, which continues to act as a headwind for the buck and helps limit deeper corrective pullback for the AUD/USD pair, at least for now.
The Australian Dollar, on the other hand, draws support from rising odds for a further interest rate hike by the Reserve Bank of Australia (RBA) in February, bolstered by stronger domestic inflation figures released last week. This, in turn, makes it prudent to wait for strong follow-through selling before confirming that the AUD/USD pair has topped out in the near term. Traders now look forward to important Chinese macro data, due for release on Tuesday, for a fresh impetus.
Technical levels to watch
-
12:16
USD/CAD: Near-term risks are tilted to the downside – Scotiabank
USD/CAD is consolidating between 1.3350/1.3450. Economists at Scotiabank expect to see a decline in the pair, but it will be slow to materialize.
Bear trend momentum continues to develop
“The USD undertone remains soft and bear trend momentum continues to develop; but short-term DMI signals are weak, suggesting only moderate downside pressure on spot at present. It should also mean limited upside potential for the USD intraday, however.”
“Look for better selling pressure on minor gains to the low 1.34s.”
“A break of 1.3350 targets 1.3270/75.”
-
12:06
Higher EUR/USD and good sentiment in Europe to keep CEE supported – ING
This week we are looking at a lighter calendar in the CEE region. Light calendar means stronger FX, according to economists at ING.
EUR/HUF could test lower levels below 394
“Given the lack of regional momentum, CEE FX will be driven mainly by the global story. In general, we expect higher EUR/USD and good sentiment in Europe to keep CEE supported. Moreover, gas prices are testing lower levels again, which could be positive for the Czech Koruna and Hungarian Forint.”
“Forint should still benefit from lower-than-expected inflation and could test lower levels below 394 EUR/HUF this week. On the other hand, we think the Koruna has the strongest long positioning in the region at the moment and further gains will be difficult. Thus, we expect levels around 24.00 EUR/CZK for this week.”
“The Polish Zloty, which has lagged behind the region so far, should also see slightly stronger levels and could benefit from the regional optimism and move a bit lower below to 4.68 EUR/PLN.”
-
11:49
USD/INR to challenge crucial support zone at 80.50/79.80 – SocGen
The USD/INR pair has embarked on a phase of pullback after forming a lower high at 82.95. Retest of 80.50/79.80 could follow, economists at Société Générale report.
Failure to reclaim 82.95 to trigger a continuation in phase of correction
“Break below the trend line since last February affirms a short-term down move is taking shape.”
“Failure to reclaim 82.95 would mean continuation in phase of correction.”
“A retest of November low and projection at 80.50/79.80 is expected. This could be a significant support zone.”
-
11:47
EUR/USD Price Analysis: Further gains in the pipeline near term
- EUR/USD prints a new monthly high near 1.0880 on Monday.
- The continuation of the uptrend could see 1.0900 revisited.
EUR/USD struggles to get extra upside traction after recording new YTD peaks near 1.0880 at the beginning of the week.
Despite the ongoing indecision in the price action, bulls remain well in control of the sentiment for the time being. That said, further north of the January top at 1.0874 (January 16) should turn up the round level at 1.0900 in the relatively near term.
Furthermore, while above the short-term support line near 1.0570, the pair should retain the bullish view.
In the longer run, the constructive view remains unchanged while above the 200-day SMA at 1.0308.
EUR/USD daily chart
-
11:40
USD/JPY pares intraday recovery gains, hangs near multi-month low set earlier this Monday
- USD/JPY rebounds from a nearly nine-month low touched earlier this Monday.
- A goodish USD recovery turns out to be a key factor lending support to the pair.
- The upside remains capped as traders await the BoJ decision for a fresh impetus.
The USD/JPY pair stages a goodish recovery from its lowest level since late May set earlier this Monday and snaps a two-day losing streak. The pair, however, retreats a few pips from the daily high and slips back below the mid-128.00s during the mid-European session.
The US Dollar rebounds after hitting a seven-month low, which, in turn, is seen as a key factor lending some support to the USD/JPY pair. The intraday USD uptick, meanwhile, lacks any obvious fundamental catalyst and remains capped amid firming expectations for a less aggressive policy tightening by the Fed. In fact, the markets are now pricing in a smaller 25 bps lift-off in February and expect the US central bank to pause its rate-hiking cycle, possibly after the March FOMC meeting.
The speculations were fueled by the latest US consumer inflation figures released last week, which showed that the headline CPI fell in December for the first time in more than 2-1/2 years. This should keep a lid on any meaningful upside for the Greenback. The Japanese Yen, on the other hand, continues to draw support from bets that the Bank of Japan (BoJ) will tweak its yield control policy further, which, in turn, contributes to capping the USD/JPY pair's attempted recovery.
Traders also seem reluctant and prefer to move to the sidelines ahead of the BoJ policy decision, due to be announced during the Asian session on Wednesday. Heading into the key central bank event risk, the US markets will be closed on Monday in observance of Martin Luther King Jr. Day. This further makes it prudent to wait for a strong follow-through buying before confirming that the USD/JPY pair has formed a near-term bottom and positioning for any meaningful recovery. The next key support level is the 126.45 trough low of May 2022. The pair is staeadily channelling lower and despite the recovery today bears still have the upper hand.
Technical levels to watch
-
11:22
USD/JPY will overshoot regardless of whether the BoJ makes further adjustments – SocGen
The biggest over-shooter in FX is the Yen. Kit Juckes, Chief Global FX Strategist at Société Générale, thinks USD/JPY 115 is a reasonable target.
Buying into Yen weakness
“A 20-year regression of USD/JPY against the 5-year US/Japanese yield spread would suggest ‘fair value’ is 118 now, and given the tendency to overshoot, it’s more than a little tempting to conclude USD/JPY 115 is a reasonable target. Even if the BoJ meeting on Wednesday only tells us (say) that they will announce the outcome of their review of the changes they made to yield curve control, in due course!”
“I think YCC has had its day, because it now has a target on its back. That may, before we’re done, cause an overshoot in USD/JPY to the downside. For now, though, we like buying into Yen weakness, so we’ll wait and see if the BoJ disappoints bulls enough on Wednesday to deliver attractive entry levels.”
-
11:01
EUR/USD set to head higher towards 1.15 over the course of 2023 – Deutsche Bank
The Dollar is heading lower. Economists at Deutsche Bank see EUR/USD rising to 1.15 over the course of 2023.
The pieces are falling in place for a more sustained downturn in the Dollar
“The pieces are falling into place for a more sustained downturn in the Dollar. The combination of China reopening and improvement in the European energy situation should reduce the safe-haven premium underpinning the Dollar.”
“We are still missing the bull-steepening in the US yield curve which is typically associated with clearer USD downtrends, and the USD remains a high-yielder in a global context. But as confidence grows in a peak inflation narrative, we see EUR/USD rising to 1.15 over the course of 2023.”
“Tailwinds are seen from; a) narrowing in Fed-ECB rate differentials, and structurally easier fiscal policy in Europe; b) improvement in Europe’s basic balances given lower energy imports and a drop off in bond outflows from Europe; c) beta to China re-opening and global growth cycle; and d) large cash positions in an overvalued Dollar.”
-
10:50
USD Index Price Analysis: Extra weakness not ruled out near term
- The index meets some contention near 101.80 on Monday.
- Further decline could still revisit the 101.30 zone in the short term.
The index wobbles around the 102.00 zone after bottoming out near 101.80, or multi-month lows, earlier in the session.
In case bears regain the upper hand, the loss of the January low at 101.77 (January 16) should put a potential deeper drop to the May 2022 low at 101.29 (May 30) back on the investors’ radar ahead of the psychological 100.00 yardstick.
In the meantime, while below the 200-day SMA at 106.40 the outlook for the index should remain tilted to the negative side.
DXY daily chart
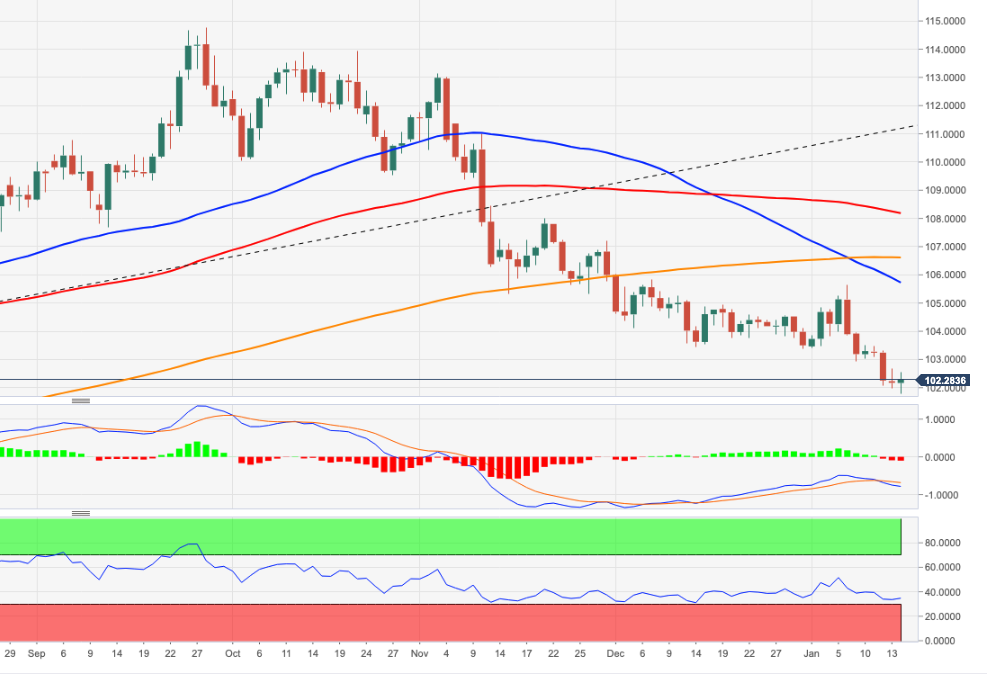
-
10:33
EUR/JPY Price Analysis: Downside pressure alleviated above the 200-day SMA
- EUR/JPY manages to grab some upside traction above 139.00.
- Next on the upside for the cross appears the 200-day SMA.
EUR/JPY gathers some much needed steam and reclaims the 139.00 hurdle and beyond at the beginning of the week.
The recent pronounced correction in the cross seems to have met some contention around the 138.00 neighbourhood. If the rebound picks up a more sustainable pace, then the next target of note turns up at the key 200-day SMA, today at 140.68.
Above the latter, the selling bias is expected to mitigate and could shift the outlook to a more constructive one.
EUR/JPY daily chart
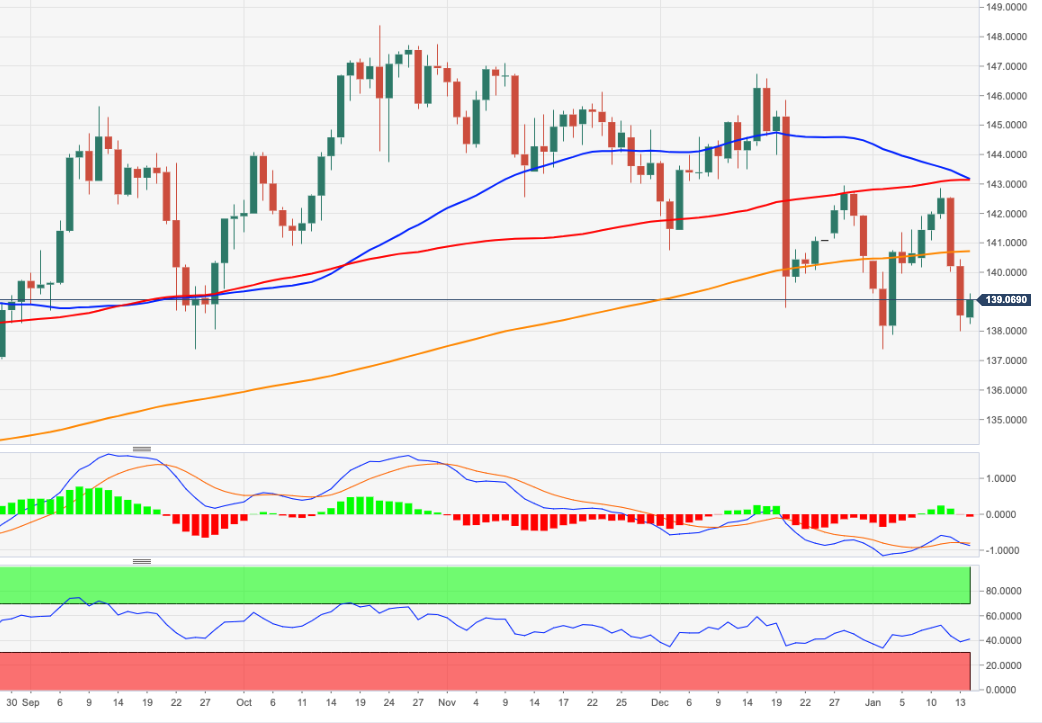
-
10:32
Japan’s Goto: Council on economic and fiscal policy special sessions to be held several more times
Japan Economy Minister Shigeyuki Goto is expected to speak at the Davos meeting, noting that the Council on economic and fiscal policy special sessions are to be held several more times and that there is no plan to compile a report on the session's outcome.
Additional comments
Economy takes priority over fiscal reform near term, trying not to lose confidence in public finances in long run.
Global economy is shifting towards new policy, as seen in Yellen's calls for modern economy policy to shift away from conventional supply-side economics.
Market reaction
USD/JPY is holding its corrective upside intact at around 128.40, still adding 0.40% on the day.
-
10:32
USD/JPY can trade down to 126.50 before BoJ’s meeting – ING
The Japanese Yen remains very much in demand ahead of Wednesday's BoJ decision. In the view of economists at ING, the USD/JPY pair could slump to 126.50.
Focus this week is the BoJ meeting on Wednesday
“Further adjustments to its JGB targets are in focus and investors are positioning for this with higher longer-dated swap rates.”
“10-year Japanese swap rates have pushed another 5 bps higher overnight to the highest levels in a decade.”
“We suspect USD/JPY can trade down to 126.50 before Wednesday.”
-
10:09
France Budget Balance fell from previous €-143.22B to €-159.3B in November
-
10:00
EUR/USD: 1.0900/1.0950 levels may be the best of the week – ING
EUR/USD continues to trade comfortably above 1.08. However, 1.0900/1.0950 may be best EUR/USD levels of the week, in the opinion of economists at ING.
EUR/USD will probably be driven by events in Asia this week
“The focus in Europe this week may be some key speakers at the World Economic Forum in Davos, where ECB President Christine Lagarde speaks on Friday. We will also see some German data in final CPI and the ZEW investor expectations survey – which is expected to have improved.”
“EUR/USD will probably be driven by events in Asia this week. However, we suspect that 1.0900/1.0950 levels may be the best of the week.”
-
09:54
Gold Price Forecast: XAU/USD retreats from nine-month peak amid modest US Dollar recovery
- Gold price corrects from a fresh multi-month top touched earlier this Monday.
- A goodish intraday US Dollar recovery drives flow away from the XAU/USD.
- The downside remains cushioned amid bets for smaller rate hikes by the Fed.
Gold price retreats from a nearly nine-month peak, around the $1,929 area touched earlier this Monday and remains depressed through the first half of the European session. The XAU/USD drops to a fresh daily low, around the $1,910 region in the last hour, though any subsequent slide could be seen as a buying opportunity and remain limited.
Intraday US Dollar recovery undermines Gold price
The US Dollar (USD) stalls its recent downtrend and stages a solid intraday recovery from a seven-month low. This, in turn, is seen as a key factor weighing on the US Dollar-denominated Gold price. That said, growing acceptance that the Federal Reserve (Fed) will soften its hawkish stance, amid signs of easing inflationary pressures, could cap any meaningful upside for the Greenback.
Smaller rate hikes by Federal Reserve should cap USD
In fact, the latest inflation figures released from the United States (US) showed that consumer prices fell in December for the first time in more than two and half years. Moreover, several Fed officials backed the case for smaller rate hikes and reaffirmed bets for a 25 lift-off in February. This, in turn, might keep the US Treasury bond yields depressed and act as a headwind for the USD.
Downside for Gold price seems limited
Furthermore, speculations that the US central bank may be nearing the end of its current rate-hiking cycle could lend some support to the non-yielding Gold price. Apart from this, a softer risk tone - as depicted by a weaker trading sentiment around the equity markets - should hold back traders from placing aggressive bearish bets around the safe-haven XAU/USD and help limit the downside.
Looming recession fears weigh on investors’ sentiment
Investors remain concerned about headwinds stemming from the worst COVID-19 outbreak in China. Adding to this, the protracted Russia-Ukraine war has been fueling worries about a deeper global economic downturn and capping any optimism in the markets. This makes it prudent to wait for strong follow-through selling before confirming that the Gold price has topped out in the near term.
Gold price technical outlook
From a technical perspective, pullback below the $1,900 round-figure mark is more likely to attract fresh buyers and remain limited near the $1,885-$1,880 region. The latter should act as a strong base for the Gold price, which if broken decisively might prompt some technical selling and pave the way for a deeper corrective decline. On the flip side, the multi-month high, around the $1,929 zone, now seems to act as an immediate resistance. Some follow-through buying has the potential to lift the XAU/USD further towards the next relevant barrier near the $1,948-$1,950 area.
Key levels to watch
-
09:36
Forint enjoys slight relief as external inflation drivers are becoming more supportive – Commerzbank
The Hungarian Forint underwent significant volatility in recent weeks, but staged a rally on Friday following encouraging CPI data. External factors are becoming more supportive, economists at Commerzbank note.
Inflation data once again encourages
“Overall, the data strengthened earlier tentative indications that inflation peaked last autumn.”
“The crucial issue remains how much inflation will slow down after having peaked. The government has used minimum wage hikes liberally to neutralise the effect of high inflation on purchasing power; this will add layers of second-round inflation over the coming year. This will come against a background of Hungary’s deeply negative real interest rate, which will not help combat second-round effects.”
“Forint is enjoying slight relief because external inflation drivers are becoming more supportive. Whether this will be enough to close the monetary policy gap or remain a structural problem, only time will tell.”
-
09:23
ECB’s Rehn: I see significant rate hikes at the next meetings
“I see significant rate hikes at the next meetings,” European Central Bank (ECB) Governing Council member Olli Rehn said on Monday.
No further comments are out on the same.
Market reaction
EUR/USD has bounced off the 1.0801 low, as the corrective downside seems to have stalled. The pair is trading at 1.0817, down 0.08% on the day.
-
09:14
USD Index may find support in the 101.30/50 region this week – ING
The week starts with the US Dollar Index (DXY) bouncing from a marginal new low at 101.80. Economists at ING expect Dollar to remain gently offered.
Trading conditions should remain quite illiquid
“Today marks a partial US market holiday to respect Martin Luther King day and could mean that trading conditions, which seemed quite illiquid last week, remain so.”
“The US data calendar is relatively light this week but Retail Sales, Industrial Production and Existing Home Sales should all fall on the soft side. In theory, then, this should not impact too much the market expectations of two 25 bps Federal Reserve hikes in February and March, both of which are expected to be reversed by year-end.”
“The factors that have pressured DXY below 102 remain in place, but DXY may find support in the 101.30/50 region this week.”
-
09:03
Japan's Matsuno: Expects BOJ to continue with appropriate monetary policy
Japan Chief Cabinet secretary, Hirokazu Matsuno said on Monday, he “expects the Bank of Japan (BoJ) to continue with appropriate monetary policy, taking into account economic, prices and the financial situation.
Matsuno said he does not want to comment on the Japanese Government Bond (JGB) yields.
Market reaction
USD/JPY is correcting further away from eight-month troughs of 127.24, trading at 128.63, adding 0.60% on the day. Wednesday’s BoJ policy decision is eagerly awaited.
-
08:57
Gold Price Forecast: XAU/USD continues to face correction risks – TDS
Gold rallied all the way up to $1,920 in the last session of the week. However, strategists at TD Securities note that the yellow metal confronts correction risks.
Precious metal space is no longer in a selling mode
“Reflecting the narrative that inflation pressures in the US economy are coming under control, following the release of the December payrolls data which showed a more benign wage growth, money managers aggressively grew their long Gold exposure. The sharp increase in prices, which was a direct reaction to lower rates along the short end of the curve and weaker Dollar, has convinced investors that the yellow metal had upside.”
“While the precious metal space is no longer in a selling mode, there continues to be correction risk as it is not all certain that inflation has been defeated and that the US central bank is ready to get less restrictive anytime soon.”
-
08:54
FX option expiries for Jan 16 NY cut
FX option expiries for Jan 16 NY cut at 10:00 Eastern Time, via DTCC, can be found below.
- EUR/USD: EUR amounts
- 1.0900 478m
- 1.0950 457m
- EUR/GBP: EUR amounts
- 0.9100 308m
-
08:31
EUR/GBP could continue to nudge up towards 0.89 – ING
Sterling has taken rather a back seat so far this year. Economists at ING believe that the EUR/GBP pair could extend its move higher toward 0.89.
UK data will be key this week
“95 bps of tightening is now priced in by August this year. It is not clear that this week's data will add to those softer expectations – wages and inflation could remain high – but we do see those BoE tightening expectations coming under pressure over coming months.
“EUR/GBP could continue to nudge up towards 0.89, which is our target for the end of this first quarter.”
-
08:21
Austria HICP (MoM) dipped from previous 0.2% to -0.3% in December
-
08:21
Austria HICP (YoY): 10.5% (December) vs previous 11.2%
-
08:07
Japan: JGB yields jumps to levels around 0.5%, two possible interpretations – Commerzbank
Economists at Commerzbank explain why JGBs are yielding around 0.50% – and what that tells us about the BoJ.
Born yesterday?
“Because the impression arises that the BoJ’s YCC is changing along the lines of a ‘leaning against the wind’, selling pressure for JGBs does increase. The BoJ has to meet this pressure with increasing levels of JGB purchases. This is the sticking point of the BoJ’s line of argument.”
“Fewer JGB purchases would have only been the result if the BoJ could have illustrated credibly that 0.50% was going to be the limit in perpetuity. As it did not do that, it has now achieved the opposite of what it stated as its motivation. That means there are only two possible interpretations: either its motivation was a different one: the beginning of the end of its ultra-expansionary monetary policy. Or the Japanese central bankers have so little understanding of the market that one has to assume they were born yesterday.”
-
08:01
Turkey Budget Balance down to -118.6B in December from previous 108.31B
-
07:53
EUR/USD recedes from fresh tops near 1.0880
- EUR/USD advances to fresh highs near 1.0880 earlier on Monday.
- The dollar gathers some traction after dropping to new lows.
- The Eurogroup meeting will be the salient event later in the session.
The European currency starts the week in a positive fashion and lifts EUR/USD to new highs near 1.0880, where some initial resistance appears to have emerged.
EUR/USD remains supported by risk-on sentiment
EUR/USD resumes the uptrend and sets aside Friday’s corrective knee-jerk on the back of the intense bias towards the risk complex on Monday.
Indeed, the selling pressure around the dollar dragged the USD Index (DXY) to fresh multi-month lows during the Asian trading hours, always against the backdrop of rising speculation of a pivot in the Fed’s normalization process.
In the German money market, the 10-year Bund yields kick in the wek marginally on the defensive below the 2.20% level so far.
In the domestic calendar, the Eurogroup meeting will be in the limelight throughout the session, while German Wholesale Prices contracted 1.6% MoM in December and rose 12.8% over the last twelve months.
The US data space will be empty on Monday.
What to look for around EUR
EUR/USD keeps the bid bias well and sound and trades closer to the round level at 1.0900 the figure on Monday.
Price action around the European currency should continue to closely follow dollar dynamics, as well as the impact of the energy crisis on the euro bloc and the Fed-ECB divergence.
Back to the euro area, the increasing speculation of a potential recession in the bloc emerges as an important domestic headwind facing the euro in the short-term horizon.
Key events in the euro area this week: Eurogroup Meeting (Monday) – ECOFIN Meeting, Germany Final Inflation Rate / ZEW Economic Sentiment, EMU ZEW Economic Sentiment, Italy Final Inflation Rate (Tuesday) - EMU New Car Registrations / Final Inflation Rate (Wednesday) – ECB Lagarde, ECB Accounts (Thursday) - ECB Lagarde (Friday).
Eminent issues on the back boiler: Continuation of the ECB hiking cycle amidst diminishing probability of a recession in the region. Impact of the war in Ukraine and the protracted energy crisis on the bloc’s growth prospects and inflation outlook. Risks of inflation becoming entrenched.
EUR/USD levels to watch
So far, the pair is gaining 0.03% at 1.0835 and faces the next up barrier at 1.0874 (monthly high January 16) followed by 1.0900 (round level) and finally 1.0936 (weekly high April 21 2022). On the flip side, the breakdown of 1.0481 (monthly low January 6) would target 1.0443 (weekly low December 7) en route to 1.0459 (55-day SMA).
-
07:52
EUR/USD: current strength might not be totally sustainable – Commerzbank
The Euro is benefitting from the general USD weakness. However, economists at Commerzbank expect weaker Eurozone data, which would trigger renewed weakness in the shared currency.
Negative Eurozone growth as early as Q1
“Even if economists expect negative growth as early as the current quarter, the data publications do not put the market into that kind of mood. If the Eurozone data then comes in well above what economists had expected their warnings of a recession have even less effect.”
“We expect negative Eurozone growth as early as Q1.”
“In the near future, the data is likely to be much less positive than is currently the case. That is why I hesitate to consider the current EUR strength totally sustainable.”
-
07:37
Natural Gas Futures: A deeper pullback looks favoured
Considering advanced prints from CME Group for natural gas futures markets, open interest prolonged the uptrend further on Friday, this time by rising by around 9.2K contracts. Volume followed suit and remained choppy after increasing more than 16K contracts.
Natural Gas now targets $3.00
Prices of the natural gas continued its march south at the end of last week amidst rising open interest and volume. Against that, the continuation of the downtrend looks the most likely scenario for the time being, with the immediate target at the key $3.00 mark per MMBtu.
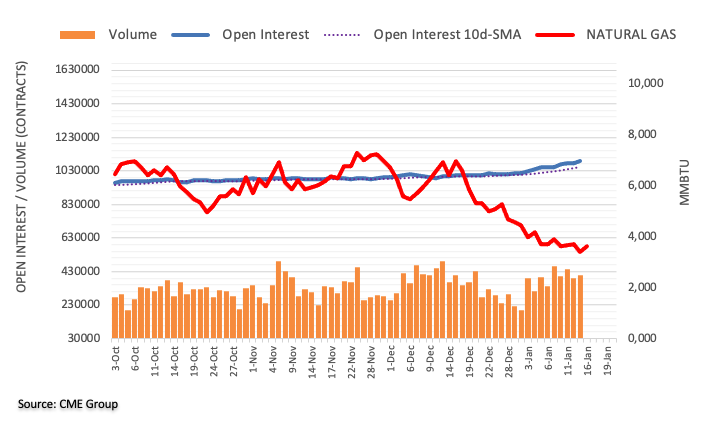
-
07:31
China’s reopening boom is very supportive for commodities – SocGen
Economists at Société Générale think that China’s reopening will be bullish for commodities.
Brent to average $100/bbl in 2023
“China reopening quickly and with greater probability for upside is very supportive for commodities generally.”
“For Oil, we see an average price of $100/bbl in 2023 with the potential to reach $110/bbl with more upside to Chinese growth.”
“China should import more LNG which would put some pressure on gas prices and positive sentiment on the Copper markets will be significant. While a wall of supply keeps a lid on the Copper price acceleration in our base case, better growth in China would send Copper above $10,000/t.”
-
07:22
Crude Oil Futures: Extra upside likely near term
CME Group’s flash data for crude oil futures markets noted traders added around 23.4K contracts to their open interest positions at the beginning of the week, resuming the uptrend following the previous drop. On the other hand, volume shrank for the second consecutive session, now by around 32.2K contracts.
WTI appears capped by $80.00 so far
The recovery in prices of the WTI finally reached the key $80.00 mark per barrel on Friday. The uptick was in tandem with rising open interest and declining volume, which leaves the door open to extra gains, although a probable corrective move or some consolidation in the short term should not be ruled out.
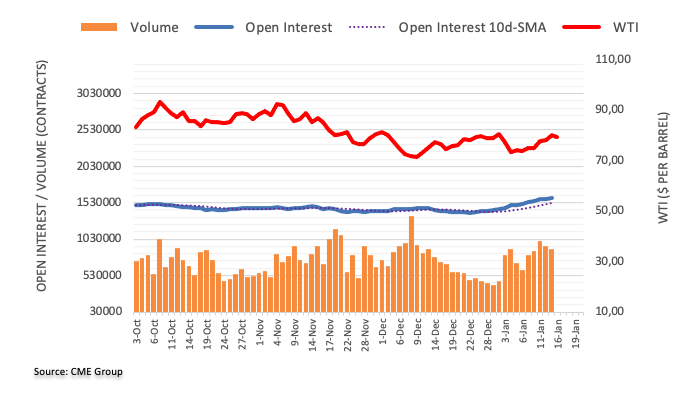
-
07:14
Japan Machine Tool Orders (YoY): 1% (December) vs -7.8%
-
07:09
India WPI Inflation came in at 4.95%, below expectations (5.6%) in December
-
07:01
Norway Trade Balance: 148.8B (December) vs 101.1B
-
07:01
Germany Wholesale Price Index (YoY) came in at 12.8% below forecasts (13%) in December
-
07:01
Germany Wholesale Price Index (MoM) came in at -1.6%, below expectations (-1.4%) in December
-
06:59
Gold Price Forecast: XAU/USD could see a pullback amid overbought conditions
Gold price hit fresh nine-month highs at $1,929 before pulling back sharply to $1,915. Overbought conditions could threaten XAU/USD bulls, FXStreet’s Dhwani Mehta reports.
RSI holds well above 70.00
“Gold price has pulled back sharply from a nine-month top of $1,929, as suggested by an overbought 14-day Relative Strength Index (RSI). The daily RSI currently stands at 75.21, well past the critical 70.00 level.”
“A sustained break below $1,917 could trigger a further correction toward the $1,900 threshold.”
“If Gold bulls manage to regain control and take out the multi-month high, then a fresh upswing toward the $1,940-$1,941 supply zone could be in the offing. The next stop for XAU/USD is seen at $1,950, the psychological level.”
-
06:56
Gold Futures: Further gains remain in store
Open interest in gold futures markets rose for yet another session on Friday, this time by around 12.6K contracts according to preliminary readings from CME Group. Volume, instead, reversed two consecutive daily builds and dropped by nearly 30K contracts.
Gold: The $2000 mark looks closer
Gold prices advanced for the second session in row last Friday. The move was amidst rising open interest, which remains supportive of further upside in the very near term. The moderate drop in volume, however, could prompt some corrective move/consolidation as well, although the broader focus remains on the key $2000 per ounce troy.
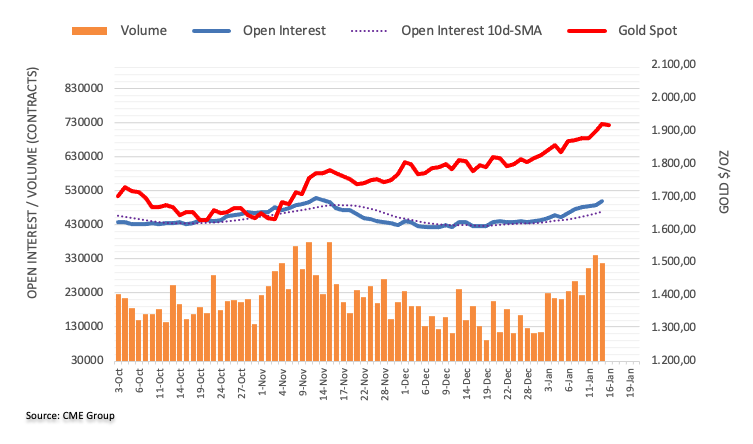
-
06:49
USD Index resumes the downside and breaks below 102.00
- The index prints fresh lows in the sub-102.00 region.
- Sentiment continues to favour the risk complex on Monday.
- Markets’ focus remains on a probable Fed’s pivot.
The greenback, in terms of the USD Index (DXY), loses further ground and trades in the area below the 102.00 support for the first time since early June.
USD Index under pressure in multi-month lows
The index starts the week in a soft note and extends the bearish mood for the fourth session in a row on Monday, this time revisiting the 101.80/75 band.
In the meantime, the dollar remains under persistent selling pressure, as investors continue to favour the risk-associated assets and the perception that the Federal Reserve could slow the pace of its future interest rate hikes keeps running high.
There will be no data releases in the US calendar on Monday, whereas the publication of the Philly Fed Manufacturing gauge, weekly Claims and Retail Sales should take centre stage later in the week.
What to look for around USD
The dollar retreats to levels last seen in June 2022 pari passu with the firmer pace in the risk complex.
The idea of a probable pivot in the Fed’s policy in the next months continues to weigh on the greenback and keeps the price action around the DXY depressed. This view, however, also comes in contrast to the hawkish message from the latest FOMC Minutes and recent comments from fed’s rate-setters, all pointing to the need to advance to a more restrictive stance and stay there for longer, at the time when rates are seen climbing above the 5.0% mark.
On the latter, the tight labour market and the resilience of the economy are also seen supportive of the firm message from the Federal Reserve and the continuation of its hiking cycle.
Key events in the US this week: NY Empire State Manufacturing Index (Tuesday) – MBA Mortgage Applications, Producer Prices, Retail Sales, Industrial Production, NAHB Index, Business Inventories, Fed’s Beige Book, Net Long-term TIC Flows (Wednesday) – Building Permits, Housing Starts, Philly Fed Manufacturing Index, Initial Jobless Claims (Thursday) – Existing Home Sales (Friday).
Eminent issues on the back boiler: Rising conviction of a soft landing of the US economy. Prospects for extra rate hikes by the Federal Reserve vs. speculation of a recession in the next months. Fed’s pivot. Geopolitical effervescence vs. Russia and China. US-China trade conflict.
USD Index relevant levels
Now, the index is losing 0.03% at 102.14 and the breach of 101.77 (monthly low January 16) would open the door to 101.29 (monthly low May 30) and finally 100.00 (psychological level). On the other hand, the next hurdle emerges at 105.63 (monthly high January 6) followed by 106.40 (200-day SMA) and then 107.19 (weekly high November 30).
-
06:44
Forex Today: US Dollar kicks off the week on wrong footing
Here is what you need to know on Monday, January 16:
The US Dollar is seeing a negative start to a fresh week, as risk sentiment remains in a sweet spot, thus far. The US Dollar is consolidating at around 102.00 against its main rivals, having refreshed seven-month lows at 101.77 earlier in the Asian session this Monday. The Asian stock markets ex-Japan enjoyed gains, tracking a rally in Wall Street on Friday. The US S&P 500 index surpassed the key 200-Daily Moving Average (DMA) and tested the 4,000 mark on Friday after earnings reports from the US banking giants, JPMorgan Chase & Co., Bank of America Corp., Citigroup Inc. and Wells Fargo & Co. Investors also appear unperturbed by expectations of weak economic data from China due for release on Tuesday.
The market optimism combined with hopes of slower Federal Reserve rate hikes and the renewed USD/JPY decline is weighing negatively on the American Dollar. Markets are pricing in roughly 80% odds of a 25 basis points (bps) Fed rate hike in March, with a 25 bps fully baked in at the start of the next month, following soft US inflation data last week. Meanwhile, investors shrugged off Friday’s upbeat University of Michigan (UoM) Consumer Sentiment and Inflation Expectations data amid growing dovish Fed bets.
The USD/JPY pair remains undermined by the ongoing rally in the Japanese yen ahead of the Bank of Japan (BoJ) policy announcements this week. Japanese exporters bore the brunt of a stronger Yen, as the Nikkei 225 index fell 1%. Expectations heightened that the BoJ could tweak its policy settings on Wednesday after it failed to defend its yield curve policy once again on Monday. The 10-year JGB yield rose 1 basis point to 0.510%, topping the 0.5% ceiling of the BOJ's policy band. The pair hit an eight-month low at 127.24, earlier on, before recovering toward 128.00.
AUD/USD climbed above the 0.7000 round figure for the first time since August 2022. Risk-on trading, US Dollar weakness and hawkish Reserve Bank of Australia (RBA) expectations keep the Aussie pair afloat near 0.7000. The NZD/USD pair also advanced in tandem and briefly recaptured the 0.6400 level while USD/CAD dropped to test 1.3350 after facing rejection at 1.3400 even though the WTI price failed to hold above the $80.00 mark. The US oil ignored upbeat comments from UAE Energy Minister Suhail al-Mazrouei delivered over the weekend.
Following Friday’s negative price action, EUR/USD renewed the best levels in nine months at 1.0874 early Monday before retreating to near 1.0850.
Risk appetite helped GBP/USD helped take out the key 1.2250 resistance to head as high as 1.2290. Pound Sterling bulls, however, failed to sustain at higher levels. The pair defending minor bids at around 1.2240, as of writing. Cable awaits Bank of England (BoE) Governor Andrew Bailey’s testimony on the Financial Stability Report (FSR) before the Treasury Select Committee at 15:00 GMT, especially after the UK Gross Domestic Product (GDP) unexpectedly expanded by 0.1% MoM in November.
Gold price hit fresh nine-month highs at $1,929 before pulling back sharply to $1,915 amid overbought conditions on the daily chart.
Bitcoin also took advantage of a better risk profile and broad US Dollar weakness, having tested $21,500 levels. Ethereum is trading close to the $1,600 mark, adding over 1% on the day.
It’s worth noting that the US financial markets are closed on Monday, in observance of Martin Luther King Jr. Day. Therefore, thin trading is likely to extend, which could trigger volatility and wild swings across the board.
In the week ahead, the BoJ policy decision, the US Retail Sales, UK inflation and Fed speeches will be closely followed.
-
06:38
Silver Price Analysis: XAG/USD bulls retain control near multi-month peak, around $24.50
- Silver edges higher for the third straight day and inches back closer to the multi-month top.
- The set-up favours bulls and supports prospects for an extension of the appreciating move.
- A convincing break below the $23.00 mark is needed to negate the near-term positive bias.
Silver prolongs the positive trend for the third straight day on Monday and steadily climbs back closer to its highest level since April 22 touched earlier this month. The white metal sticks to its intraday gains heading into the European session, with bulls now awaiting a move beyond the $24.50-$24.55 area before placing fresh bets.
From a technical perspective, last week's bounce from the vicinity of the 200-period SMA on the 4-hour chart and a sustained strength above the $24.00 mark was seen as a fresh trigger for bullish traders. Furthermore, oscillators on the daily chart are holding comfortably in the positive territory and are still far from being in the overbought zone. This, in turn, supports prospects for an extension of the appreciating move.
That said, RSI (14) on hourly charts hovers around the 70 mark (representing overbought conditions) and warrants some caution. Nevertheless, the stage still seems set for an eventual breakout through the $24.50-$24.55 region and a subsequent move towards reclaiming the $25.00 psychological mark for the first time since April 2022. Some follow-through buying has the potential to lift the XAG/USD to the $25.35-$25.40 hurdle.
On the flip side, the $24.10-$24.00 resistance breakpoint now seems to protect the immediate downside. Any further pullback is more likely to attract fresh buyers and remain limited near the 200-SMA on the 4-hour chart, currently around the $23.30-$23.25 area. This is followed by the $23.00 round figure, which if broken decisively will negate the positive outlook and shift the near-term bias in favour of bearish traders.
The XAG/USD might then accelerate the fall towards the $22.60-$22.55 region and weaken further towards the next relevant support near the $22.10-$22.00 zone.
Silver 4-hour chart
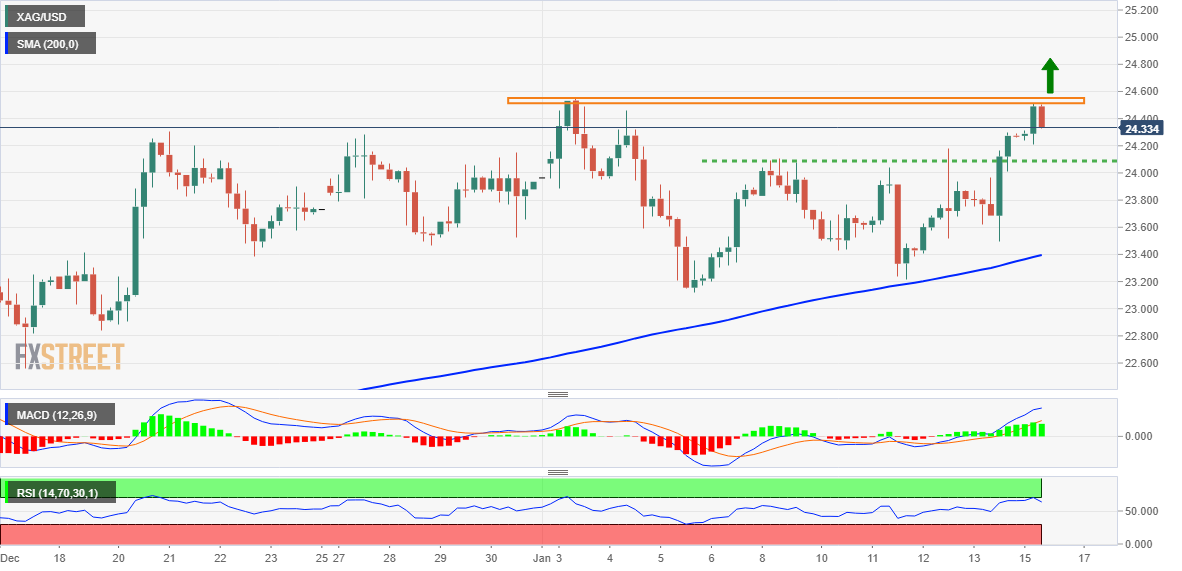
Key levels to watch
-
06:15
WTI Price Analysis: Fails to sustain above $80.00
- The oil price has corrected after failing to sustain above the crucial resistance of $80.00.
- A Symmetrical Triangle formation is indicating volatility contraction in oil price.
- A recovery move in the oil price has pushed it above the 20-and 50-EMAs firmly.
West Texas Intermediate (WTI), futures on NYMEX, have failed to sustain above the crucial resistance of $80.00 in the Asian session. The oil price has corrected and dropped to near $79.46 after a firmer rally despite an upbeat market mood.
Meanwhile, selling pressure in the oil price is also backed by a recovery in the US Dollar Index (DXY). The USD Index has recovered after dropping to near 101.40 and is struggling to extend its upside journey above 101.60.
The black gold is displaying a Symmetrical Triangle chart pattern on a daily scale that indicates volatility contraction. The upward-sloping trendline of the chart pattern is placed from December 9 low at $70.27 while the downward-sloping trendline is placed from December 5 high at $82.74. The aforementioned chart pattern is a neutral triangle and results in wider ticks and heavy volume after an explosion.
A recovery move in the oil price has pushed it above the 20-and 50-period Exponential Moving Averages (EMAs) at $77.57 and $79.00, which adds to the upside filters.
The Relative Strength Index (RSI) (14) is oscillating in a 40.00-60.00 range, which indicates that investors are awaiting the release of any potential trigger for fresh cues.
For an upside move, the oil price needs to break above the January 3 high at $81.56, which will drive the asset toward December 1 high at $83.30 followed by November 17 high around $85.00.
Alternatively, a break below January 5 low at $72.64 will drag the oil price toward December 9 low at $70.27. The asset would be exposed for more downside to near 14 December 2021 low at $69.32 after surrendering the support at December 9 low at $70.27.
WTI daily chart
-638094465097092809.png)
-
05:57
GBP/USD sticks to gains near one-month peak, just above mid-1.2200s ahead of BoE’s Bailey
- GBP/USD continues scaling higher on Monday and hits a one-month high amid a weaker USD.
- Bets for smaller Fed rate hikes and a positive risk tone weigh on the safe-haven greenback.
- Recession fears keep a lid on any further gains ahead of the BoE Governor Bailey’s speech.
The GBP/USD pair gains traction for the third successive day and climbs to the 1.2300 neighbourhood, or a one-month high during the Asian session on Monday. The pair, however, retreats a few pips from the daily top and is currently placed around the 1.2260-1.2265 region, still up over 0.30% for the day.
The US Dollar drops to a fresh seven-month low on the first day of a new week amid growing acceptance that the Fed will soften its hawkish stance. This, in turn, is seen as a key factor pushing the GBP/USD pair higher. The markets now seem convinced that the Fed may be nearing the end of its rate-hiking cycle amid signs of easing inflationary pressures.
Investors ramped up bets for smaller Fed rate hikes going forward after the US CPI report released last week showed that consumer prices fell for the first time in more than 2-1/2 years in December. Adding to this, several FOMC members backed the case for a 25 bps rate hike in February. This, along with a positive risk tone weighs on the safe-haven buck.
That said, looming recession fears - fueled by the recent COVID-19 outbreak in China and the protracted Russia-Ukraine war - keep a lid on the optimism in the markets. Traders also seem reluctant to place aggressive bets around the GBP/USD pair ahead of the Bank of England Andrew Bailey's speech later during the early North American session on Monday.
Moreover, there isn't any major market-moving economic data due for release from the UK and the US markets will be closed in observance of Martin Luther King Jr. Day. This, in turn, makes it prudent to wait for strong follow-through buying before positioning for any further appreciating move for the GBP/USD pair amid a bleak outlook for the UK economy.
Technical levels to watch
-
05:46
USD/JPY Price Analysis: Attempts recovery around 127.00 as focus shifts to BOJ policy
- USD/JPY has sensed buying interest after dropping to near 127.20.
- The USD Index has recovered to near 101.60 despite the upbeat market mood.
- Downward-sloping 20-and 50-EMAs indicate more weakness ahead.
The USD/JPY pair has retreated after sensing buying interest around 127.20 in the early European session. The asset has followed the footprints of the US Dollar Index (DXY) and has attempted a recovery. The USD Index has recovered to near 101.60 despite the upbeat market mood, which could result in a resumption of the downside journey.
Meanwhile, the Japanese Yen bulls are likely to dance to the tunes of the Bank of Japan (BOJ) monetary policy, which is scheduled to be announced on Wednesday. The commentary from BOJ Haruhiko Kuroda will be keenly watched amid soaring chatters bout an exit from a decade-long ultra-loose monetary policy.
USD/JPY is declining towards the horizontal support plotted from May 24 low at 126.36 on a daily scale. Downward-sloping 20-and 50-period Exponential Moving Averages (EMAs) at 132.10 and 135.36 respectively, add to the downside filters.
The Relative Strength Index (RSI) (14) is oscillating in the bearish range of 20.00-40.00, showing no signs of divergence and oversold, which might result in further weakness in the US Dollar.
Going ahead, USD/JPY needs to drop below Monday’s low at 127.22, which will expose the asset for more downside towards the horizontal support plotted from May 24 low at 126.36. A slippage below the latter will open room for further downside toward the psychological support at 125.00.
On the flip side, a decisive move above December 20 low at 130.57 will drive the asset toward January 9 low at 131.31 followed by January 12 high at 132.56.
USD/JPY daily chart
-638094447102537592.png)
-
05:17
AUD/USD eases from five-month high, holds steady below 0.7000 amid sustained USD selling
- AUD/USD gains some follow-through traction on Monday and climbs to a fresh five-month high.
- Bets for smaller Fed rate hikes, a positive risk tone undermines the USD and offers some support.
- Looming recession fears cap the optimism and act as a headwind for the risk-sensitive Aussie.
The AUD/USD pair kicks off the new week on a positive note and climbs to its highest level since mid-August during the Asian session. The pair, however, trim a part of its intraday gains and retreat below the 0.7000 psychological mark in the last hour.
A combination of factors drags the US Dollar to a fresh seven-month low on Monday, which, in turn, acts as a tailwind for the AUD/USD pair. The US consumer inflation figures released last week showed that the headline CPI fell for the first time in more than 2-1/2 years in December. The data fueled speculations that the Fed may be nearing the end of its rate-hiking cycle and lifted bets for smaller rate hikes in February. This, along with a generally positive tone around the equity markets, continues to weigh on the safe-haven buck and benefits the risk-sensitive Aussie.
The Australian Dollar draws additional support from rising odds for a further interest rate hike by the Reserve Bank of Australia (RBA) in February, bolstered by the upbeat domestic data released last week. In fact, the Australian Bureau of Statistics reported that the headline Consumer Price Index (CPI) re-accelerated to the 7.3% YoY rate - a 32-year-high - in November from the 6.9% in the previous month. Furthermore, Australian Retail Sales surpassed the most optimistic estimates and jumped 1.4% in November, while October's reading was also revised up to show a 0.4% growth.
Market participants, however, remain worried about the economic headwinds stemming from the COVID-19 outbreak in China. Apart from this, the protracted Russia-Ukraine war has been fueling concerns about a deeper global economic downturn, which keeps a lid on the optimism in the markets. Traders also seem reluctant to place aggressive bullish bets around the AUD/USD pair amid a holiday in the US and ahead of the Chinese economic release, including the Q3 GDP print, on Tuesday.
Technical levels to watch
-
05:16
USD/INR Price News: Finds demand below 81.20 as USD Index attempts recovery
- A recovery in the US Dollar Index has also provided support to USD/INR.
- Growing expectations for a smaller Fed’s interest rate hike have weakened the USD Index broadly.
- Upbeat oil prices and FII outflows might trigger volatility for the Indian Rupee.
The USD/INR pair has picked strength marginally below the critical support of 81.20 as the US Dollar Index (DXY) has attempted a recovery after refreshing a seven-month low at 101.45. The Indian Rupee asset has refreshed its day’s high at 81.35 amid firmer oil prices on a broader note.
The risk appetite of the market participants seems solid as risk-perceived assets like the S&P500 futures are holding on to their gains added in Asia after a four-day winning spell. The USD index has recovered firmly to near 101.60 but is required to clear more filters to claim a bullish reversal. Meanwhile, United States markets are closed on Monday on account of Martin Luther King Jr. Day.
A recovery in the USD Index could be short-lived as the risk profile is still extremely positive. Rising expectations for a smaller interest rate hike by the Federal Reserve (Fed) in its February monetary policy meeting are responsible for the weakness in the US Dollar Index (DXY). As per the CME FedWatch tool, chances of a 25 basis points (bps) interest rate hike by the Fed have scaled above 94%.
On the Indian Rupee front, investors are likely to shift their focus toward the Fiscal Budget FY2023-24, which is scheduled for the first week of February. In the meantime, rising Foreign Institutional Investment (FII) outflows are also impacting the Indian Rupee bulls.
Being one of the major importers of oil, rising oil prices are also expected to impact the Indian Rupee bulls. Strategists at TD Securities expect the global benchmark crude to trade at $100/b in the latter part of 2023 led by China’s reopening and the Fed’s lower rate hike structure, which might keep affecting the Indian Rupee.
-
04:41
Asian Stock Market: Nikkei225 plunges ahead of BOJ meeting, USD weakens as risk-on solidifies
- Japanese stocks have witnessed an intense sell-off as investors have turned anxious ahead of BOJ policy.
- Chinese equities are riding a bull run on expectations of easing policy to support reopening reforms.
- The USD Index has refreshed its seven-month low amid a significant improvement in investors’ risk appetite.
Markets in the Asian domain are delivering mixed signals on Monday. Japanese markets have witnessed a massive sell-off as investors are awaiting the announcement of the Bank of Japan (BOJ) monetary policy on Wednesday. Meanwhile, Chinese markets have picked up sheer strength.
At the press time, Japan’s Nikkei225 plunged 1.32%, SZSE Component soared 2.11%, Hang Seng jumped 0.74%, and Nifty50 added 0.12%.
The US Dollar Index (DXY) has refreshed its seven-month low at 101.45 amid the soaring risk appetite of the market participants. Escalating odds of further policy easing by the Federal Reserve (Fed) have resulted in sheer strength in the S&P500 futures. The 500-stock basket futures of the United States have continued their upside momentum after a super-bullish week. Investors should note that US markets are closed on account of Martin Luther King Jr. Day.
Japanese equities have been dumped by the market participants as investors are getting nervous ahead of the BOJ’s monetary policy announcement. BOJ officials are continuously buying bonds vigorously but simultaneously considering an exit from a decade-long ultra-loose policy. Ambiguity among actions of the BOJ has resulted in anxiety among investors.
Hiroshige Seko, Japan’s Liberal Democratic Party’s Upper House Secretary General, said in a Bloomberg interview on Friday that “it would be premature to start exiting stimulus when demand continues to lag behind supply in Japan’s economy.”
Meanwhile, Chinese stocks are rallying as optimism soars for policy easing by the People’s Bank of China (PBoC) to support bold steps of reopening and supporting weak housing demand. A sense of deflation in the Producer Price index (PPI) is likely to continue through the first half of CY2023 as expected by Ho Woei Chen, Economist at UOB Group.
He further added that “We see prospects for the 1Y LPR to fall to 3.55% and 5Y LPR to 4.20% by end1Q23. The consensus forecast is factoring in the possibility of a 5-15 bps decline in the 5Y LPR at the upcoming fixing on 20 Jan, which will reduce mortgage costs for homebuyers. Meanwhile, the 1Y LPR may stay unchanged this month given flushed domestic liquidity.”
On the oil front, the oil price has failed to sustain above the crucial resistance of $80.00 despite optimism for China’s reopening. On the sidelines of Atlantic Council's Global Energy Forum in Abu Dhabi over the weekend, UAE Energy Minister Suhail al-Mazrouei said that the oil market is ‘stable’ at the moment, unperturbed by the price caps on Russian crude oil. This might result in a resumption of the upside move in oil price ahead.
-
04:38
USD/CAD remains depressed around mid-1.3300s, hangs near multi-week low set on Friday
- USD/CAD comes under renewed selling pressure on Monday amid sustained USD weakness.
- Rising bets for smaller Fed rate hikes and a positive risk tone continue to weigh on the buck.
- A modest pullback in oil prices could undermine the Loonie and help limit any further losses.
The USD/CAD pair struggles to capitalize on Friday's bounce from the 1.3320 area, or its lowest level since November 25 and meets with a fresh supply on the first day of a new week. The pair remains on the defensive through the Asian session and is currently placed near the daily low, around mid-1.3300s.
The US Dollar extends its recent sell-off and drops to a fresh seven-month low amid speculations that the Fed may be nearing the end of its rate-hike cycle. This, in turn, is seen as a key factor exerting downward pressure on the USD/CAD pair. Investors now seem convinced that the US central bank will soften its hawkish stance and have started pricing in a smaller rate hike going forward. The bets were lifted by last week's US consumer inflation figures, which showed that the headline CPI fell for the first time in more than 2-1/2 years in December.
Adding to this, several Fed officials backed the case for a 25 bps lift-off in February. This, along with a generally positive tone around the equity markets, continues to weigh on the safe-haven buck. That said, growing worries about a deeper global economic downturn should keep a lid on the optimism and lend some support to the greenback. Apart from this, a modest pullback in crude oil prices could undermine the commodity-linked Loonie and further contribute to limiting the downside for the USD/CAD pair, at least for the time being. The mixed fundamental backdrop warrants caution for aggressive bearish traders and positioning for any further losses.
The US markets will remain closed on Monday in observance of Martin Luther King Jr. Day. Moreover, there isn't any major market-moving economic data due for release from Canada. Hence, traders will look to the Bank of Canada's Business Outlook Survey report for some impetus around the USD/CAD pair. Apart from this, oil price dynamics should influence the Canadian Dollar and allow traders to grab short-term opportunities around the major.
Technical levels to watch
-
04:34
Gold Price Forecast: XAU/USD appears ‘buy the dips’ trade en-route $1,941 – Confluence Detector
- Gold price could retest $1,917 support before running back toward $1,941.
- US Dollar weakness boosts Gold price to fresh nine-month highs near $1,930.
- US markets are closed on Monday, thin trading could exaggerate moves.
Gold price is on track for the third straight day of gains, as bulls hold fort near the highest level in nine months above $1,900 at the start of the week. The ongoing weakness in the US Dollar gathered pace following a fresh USD/JPY sell-off, triggered by hopes of a hawkish Bank of Japan (BoJ) pivot. Further, the US Dollar continues to feel the heat from increased expectations of slower US Federal Reserve (Fed) rate hikes, in the face of easing US Consumer Price Index (CPI). Going forward, heightened volatility could be expected in the Gold price amid a US market holiday and overbought technical conditions. Meanwhile, investors await speeches from the Fed official and the US Retail Sales data due later this week for fresh trading incentives in Gold price.
Also read: Gold, Chart of the Week: XAU/USD meets $1,920 resistance area, eyes on 4-hour structures to the downside
Gold Price: Key levels to watch
The Technical Confluence Detector shows that the gold price could retest Friday’s high at $1,922 on retracement from multi-month highs. A breach of the latter will put the critical support at $1,917 under threat. That level is the convergence of the pivot point one-month R3 and the previous low four-hour.
The next immediate cushion is seen at the Fibonacci 23.6% one-day $1,915. Deeper declines could challenge bullish commitments near $1,909, where the Fibonacci 23.6% one-week and the Fibonacci 38.2% one-day coincide.
Alternatively, Gold buyers need a sustained move above the intraday high at $1,929 to initiate a fresh upswing toward the pivot point one-day R1 at $1,931.
The next stop for bulls is envisioned directly at $1,941, the confluence of the pivot point one-week R1 and pivot point one-day R2.
Here is how it looks on the tool
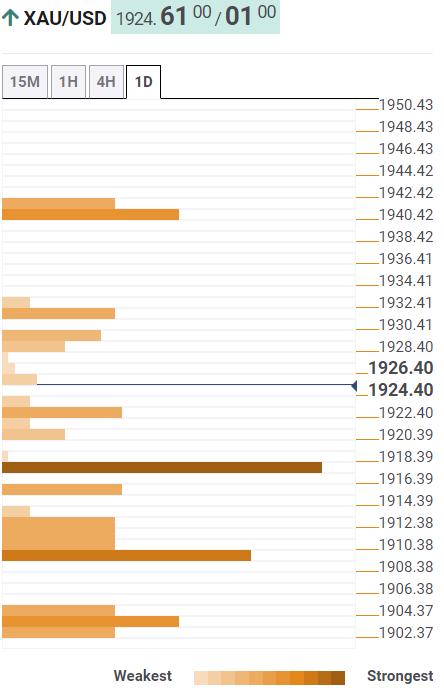
About Technical Confluences Detector
The TCD (Technical Confluences Detector) is a tool to locate and point out those price levels where there is a congestion of indicators, moving averages, Fibonacci levels, Pivot Points, etc. If you are a short-term trader, you will find entry points for counter-trend strategies and hunt a few points at a time. If you are a medium-to-long-term trader, this tool will allow you to know in advance the price levels where a medium-to-long-term trend may stop and rest, where to unwind positions, or where to increase your position size.
-
04:29
Indonesia Trade Balance below forecasts ($4.01B) in December: Actual ($3.89B)
-
04:29
Indonesia Imports above forecasts (-7.58%) in December: Actual (-6.61%)
-
04:12
Indonesia Exports came in at 6.58% below forecasts (6.65%) in December
-
03:57
EUR/USD refreshes eight-month high above 1.0870 as risk profile soars, US PPI in focus
- EUR/USD has refreshed its eight-month high above 1.0870 amid a positive risk-impulse.
- Volatility in the USD Index has escalated as the appeal for safe-haven assets has dropped.
- After slowing the extent of the interest rate hike to 50 bps, the Fed is expected to trim rate hike pace further to 25 bps.
The EUR/USD pair has displayed a decent upside after breaking above the critical resistance of 1.0840 in the Asian session. The major currency pair has refreshed its eight-month high above 1.0870 as the risk profile is soaring amid rising consensus for a less-hawkish monetary policy stance by the Federal Reserve (Fed) in its February monetary policy meeting.
S&P500 futures are extending their gains confidently after a super-bullish week, portraying an intense demand for risk-perceived assets. Also, the risk-appetite theme has expanded volatility for the US Dollar Index (DXY). The USD Index is hovering near its fresh seven-month low around 104.45, amid weaker appeal for safe-haven assets.
Meanwhile, the 10-year US Treasury yields are not being traded as the United States markets are closed on account of Martin Luther King Day.
The release of the expected decline in the United States Consumer Price Index (CPI) report for December month has accelerated the odds of further decline in the policy tightening pace by the Fed. It is worth noting that the Fed announced a less-hawkish monetary policy in December. The Fed was hiking interest rates with 75 basis points (bps) scale but shifted to 50 bps rate hike extent after observing a meaningful decline in the inflation rate.
Now that the headline inflation rate has dropped further to 6.5% led by a sheer decline in gasoline and used car prices, Fed policymakers have started considering a 25 bps rate hike. This will help the central bank to continue its fight against inflation and will also provide a cushion for deceleration in economic activities.
On the economic data front, investors will focus on the release of the United States Producer Price Index (PPI) data, which is scheduled for Wednesday. As per the consensus, a decline in headline factory gate prices of goods and services (Dec) is expected at 6.8% from the former release of 7.4%. Also, the core Producer Price Index might trim to 5.9% from the former release of 6.2% in a similar period.
On the Eurozone front, the European Central Bank (ECB) is looking to reach a terminal rate sooner. ECB's governing council member and French central bank governor Francois Villeroy de Galhau cited last week, the central bank should aim to reach the terminal rate by the summer. He further added that the ECB needs to be pragmatic about the pace of rate hikes.
-
03:26
Senior Japan’s LDP Official: Now not the time for making a major policy change
Hiroshige Seko, Japan’s Liberal Democratic Party’s Upper House Secretary General, said in a Bloomberg interview on Friday that “it would be premature to start exiting stimulus when demand continues to lag behind supply in Japan’s economy.”
Key quotes
“The BOJ should keep going in the current direction”
“Now is not the time for making a major policy change.”
Related reads
- USD/JPY slides toward 127.00 as Japanese Yen keeps rallying ahead of BoJ decision
- BoJ announces JPY 1.4 trillion worth of bond-buying on Monday
-
03:19
USD/JPY slides toward 127.00 as Japanese Yen keeps rallying ahead of BoJ decision
- USD/JPY is at fresh eight-month lows, 127.00 appears at risk.
- Japanese yen rallies on potential hawkish BoJ action, as yields policy stutters.
- US holiday-induced thin trading exaggerates moves in the USD/JPY pair.
USD/JPY is holding the latest downtick below 127.50, having renewed eight-month lows at 127.24. Bears remain in control at the start of the week on Monday, as the Japanese Yen extends its bullish momentum.
Hopes that the Bank of Japan (BoJ) could surprise markets with a hawkish pivot at its policy meeting this week are underpinning the sentiment around the Yen, especially after the Japanese central bank failed to defend its yield curve control (YCC) policy for the second day in a row. The 10-year JGB yield rose 1 basis point to 0.510%, topping the 0.5% ceiling of the BOJ's policy band.
“The BOJ bought roughly 10 trillion Yen ($78 billion) in JGBs over the past two days, with a 5 trillion Yen purchase on Friday topping the high it had just set Thursday and is preparing to purchase more Japanese government bonds on Monday,” FXStreet’s Analyst Ross Burland noted, citing the Nikkei Asian Review.
Meanwhile, the renewed sell-off in the USD/JPY pair is dragging the US Dollar broadly lower, with the US Dollar Index down 0.36% on the day at 101.84, at the press time. The US market is closed on Monday, in observance of Martin Luther King Jr. Day, and therefore low liquidity is exaggerating the moves in the major.
The key event risk for the spot this week remains the BoJ monetary policy announcements and the US Retail Sales data. In a surprise move last month, the BoJ widened the band for the 10-year bond yield to 0.5% up and down from its 0% target.
USD/JPY: Technical levels to watch
-
02:50
IMF: Fragmentation could shave up to 7.0% off of global GDP
In a new staff report published on Sunday, the International Monetary Fund (IMF) said that a severe economic fragmentation of the global could cost global Gross Domestic Output up to 7.0% but the losses could reach 8-12% in some countries if technology is also decoupled.
Additional takeaways
“Even limited fragmentation could shave 0.2% off of global GDP, but said more work was needed to assess the estimated costs to the international monetary system and the global financial safety net (GFSN).”
"The COVID-19 pandemic and Russia’s invasion of Ukraine have further tested international relations and increased skepticism about the benefits of globalization.”
The unraveling of trade links "would most adversely impact low-income countries and less well-off consumers in advanced economies.”
Market reaction
The above report has little to no impact on the market sentiment, reflective of the 0.20% gains in the US S&P 500 futures.
-
02:42
WTI drops below $80 despite UAE Energy Minister’s upbeat oil market outlook
On the sidelines of Atlantic Council's Global Energy Forum in Abu Dhabi over the weekend, UAE Energy Minister Suhail al-Mazrouei said that the oil market is ‘stable’ at the moment, unperturbed by the price caps on Russian crude oil.
Key quotes
"The market is a bit stable, and we think the decisions we took have been a good decision and an indication of the stabilization that we are seeing.”
"Now with China opening, hopefully we will see a pickup in demand and when we meet, we will analyze that as usual. We always take the decision that serves the balancing of the market."
“No comments on how Russian oil volumes going forward would be affected by the price cap and sanctions.”
These factors are external and "outside our control."
Market reaction
WTI is unable to take advantage of the encouraging comments, trading 0.45% lower at around $79.80. The US oil hit an intraday high of $80.43, earlier on.
-
02:30
Commodities. Daily history for Friday, January 13, 2023
Raw materials Closed Change, % Silver 24.282 2.22 Gold 1921.49 1.36 Palladium 1791.89 0.4 -
02:26
GBP/USD storms through key 1.2250 resistance ahead of BoE’s Bailey
- GBP/USD extends a three-day winning streak, targeting 1.2300.
- Broad US Dollar weakness, light trading underpinning Cable’s uptrend.
- Pound Sterling takes out critical resistance at 1.2250, Bailey in focus.
GBP/USD has started a new week with a bang, extending the previous week’s uptrend into the third straight day on Monday. Pound Sterling bulls benefit from a broadly weaker US Dollar, as risk sentiment remains in a firmer spot so far this session.
The Asian stocks track the Wall Street rally, in the wake of easing US inflation and expectations of a dovish Federal Reserve (Fed) policy path. Meanwhile, the latest data from the CME Group showed that hedge funds are betting on a rally in the Pound Sterling at the start of 2023, which is underpinning the sentiment around the currency pair.
Further, a US market holiday could also keep the volatility high around the GBP/USD pair amidst thin liquidity. The focus now shifts toward the Bank of England (BoE) Governor Andrew Bailey’s testimony before the UK Parliament's Treasury Select Committee, due at 15:00 GMT.
Technically, last week’s falling wedge confirmation is playing out in favor of Pound Sterling bulls, as they recapture the critical 1.2250 resistance.
Up next, buyers look to take out the 1.2300 round figure in an ultimate move toward the six-month top of 1.2446.
The 14-day Relative Strength Index (RSI) is moving northward above the midline, justifying the latest upswing. Adding credence to the move higher is the Golden Cross validated in the previous week. The 50-Daily Moving Average (DMA) pierced through the 200DMA from below on Wednesday.
Alternatively, any retracements from higher levels will retest the intraday low at 1.2205 before moving in lower to challenge Friday’s low at 1.2150.
Further down, the mildly bullish 21DMA resistance-turned-support, now at 1.2097. will remain on sellers’ radars.
GBP/USD: Daily chart
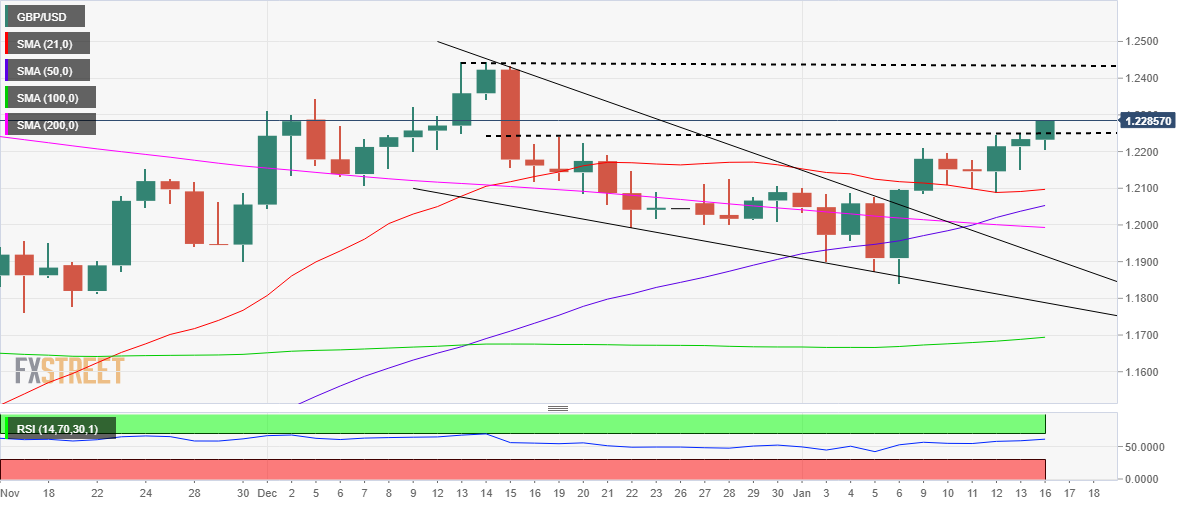
GBP/USD: Additional technical levels
-
02:12
AUD/USD surpasses 0.7000 as USD Index refreshes seven-month low, China’s GDP eyed
- AUD/USD has overstepped the psychological resistance of 0.7000 amid an upbeat market mood.
- The Fed is expected to hike interest rates further by 25 bps as inflation has shown a meaningful slowdown.
- The Australian Dollar will witness action after the release of China’s GDP data.
The AUD/USD pair has surpassed the psychological resistance of 0.7000 for the first time in the past five months in the Asian session. The Aussie asset has made a high of 0.7015 after picking up demand as the risk-appetite theme has been strengthened further.
The continuation of the upside in the S&P500 futures followed by a five-day winning spell is portraying a cheerful market mood. The risk-on impulse has triggered volatility for the US Dollar Index (DXY). The USD Index has refreshed its seven-month low at 101.44 as investors are dumping safe-haven assets amid rising expectations of a smaller interest rate hike by the Federal Reserve (Fed).
Investors should be aware of the fact that the United States markets are closed on Monday n account of Martin Luther King’s Birthday.
Advancing odds for a 25 basis point (bps) interest rate hike by the Fed in its February monetary policy meeting are responsible for an intense sell-off in the US Dollar Index. As per the CME FedWatch tool, the chances of pushing interest rates to 4.50-4.75% by hiking interest rates with a 25 bps rate hike have scaled above 94%. Odds for a smaller interest rate hike have been bolstered after Fed policymakers gained the confidence of achieving price stability post a spree of decline in the inflation rates.
On the Aussie front, the Australian Dollar will witness action after the release of China’s Gross Domestic Product (GDP) data, which is scheduled for Tuesday. As per the projections, the fourth quarter GDP may drop to 1.8% vs. the former release of 3.9% on an annual basis. On a quarterly basis, the economic data is expected to contract by 0.8% against the 3.9% expansion released earlier. It is worth noting that Australia is a leading trading partner of China and upbeat Chinese GDP might support the Australian Dollar.
-
02:03
South Korea Trade Balance fell from previous $-4.69B to $-4.692B in December
-
01:54
NZD/USD Price Analysis: Needs a breakout of inverted H&S for a fresh upside
- A bullish reversal seems likely on an Inverted H&S formation on the daily chart.
- The 20-and 50-EMAs have resumed their upside journey which adds to the upside filters.
- A shift into the bullish range of 60.00-80.00 by the RSI (14) will strengthen the New Zealand Dollar.
The NZD/USD pair is facing hurdles in surpassing the immediate resistance of 0.6400 in the Tokyo session. The Kiwi asset is expected to extend its rally to near the critical resistance of 0.615 amid optimism in market sentiment.
An improvement in the risk appetite of the market participants is further strengthening the S&P500 futures despite a four-day winning streak. Meanwhile, the US Dollar Index (DXY) is on the verge of testing a seven-month low around 101.60.
On a daily scale, NZD/USD has formed an Inverted Head and Shoulder chart pattern that indicates a bullish reversal, which is expected to strengthen the New Zealand Dollar ahead. The 20-and 50-period Exponential Moving Averages (EMAs) at 0.6352 and 0.6342 respectively have resumed their upside journey, which adds to the upside filters.
The Relative Strength Index (RSI) (14) is aiming to shift into the bullish range of 60.00-80.00, which indicates that the upside momentum is active.
For an upside move, the kiwi asset needs to surpass the previous week’s high at 0.6418, which will drive the major towards the psychological resistance at 0.6500 followed by June 6 high at 0.6538.
On the contrary, a slippage below January 12 low at 0.6314 will provide strength to the US Dollar, which will drag the asst toward December 22 low at 0.630. A slippage below the latter will expose the asst for more downside towards January 6 low at 0.6190.
NZD/USD daily chart
-638094307361425927.png)
-
01:53
Gold Price Forecast: XAU/USD bulls continue to chip away at $1,920 resistance
- Gold Price remains in the hands of the bulls at the start of the week.
- US consumer Price Index and a disinflationary economic backdrop are fueling the Gold price higher.
- US Dollar remains under pressure and is embarking on a fresh bear cycle low.
Gold price has been holding in at the bull cycle highs of $1,920 following last week's volatility that was driven by the Consumer Price Index, CPI, that fuelled a sell-off in the US Dollar, supporting risk assets and the Gold price higher.
Risk markets have been aided by expectations of slower interest rate hikes from the United States Federal Reserve. Market participants are mostly expecting a 25 basis points (bps) rate hike increase at the Federal Reserve's next policy meeting. Such an outcome would be expected to keep the bulls in play as a lower rates environment tends to be beneficial for the non-yielding Gold price. This is also supported by strong buying from central banks with China adding 30 trillion to its Gold reserves in December, according to analysts at ANZ Bank.
Federal Reserve underestimated?
However, after the Consumer Price Index, last week, analysts at Brown Brothers Harriman, BBH, stated in a note their opinion that the market is underestimating the potential for a higher for longer Federal Reserve.
''Core Personal Consumption Expenditures, PCE, has largely been in a 4.5-5.5% range since November 2021,'' they said. ''We think the Federal Reserve needs to see further improvement before even contemplating any sort of pivot.''
The analysts, at the time, noted that the WIRP, (world interest rate probabilities), suggested a 25 bp hike on February 1 was fully priced in, with nearly 30% odds of a larger 50 bp move. They also noted that another 25 bp hike on March 22 is fully priced in, while one last 25 bp hike in the second quarter is nearly 45% priced in that would take the Fed Funds rate ceiling up to 5.25%. ''However,'' they said, ''the swaps market continues to price in an easing cycle by year-end and we just don’t see that happening.''
In a more recent commentary, analysts at TD Securities argued that ''while the precious metal space is no longer in a selling mode, there continues to be correction risk as it is not all certain that inflation has been defeated and that the US central bank is ready to get less restrictive anytime soon.''
Federal Reserve officials remain hawkish
Federal Reserve's Patrick Harker said 25 bp hikes will be appropriate going forward as the days of 75 bp are “surely behind us.” However, the analysts at BBH explained while this might sound dovish, he added that he expects “a few more” rate hikes this year.
''It's often difficult to parse Fed-speak but "a few" likely means four; "several" implies three; "a couple" means two. To us, "a few" implies a Fed Funds ceiling of 5.5% vs. 4.5% currently,'' the analysts said. Elsewhere, James Bullard said the Fed should get rates above 5% as soon as possible and keep them there.
Federal Reserve speakers this week will be John Williams, Raphael Bostic, Patrick Harker, Lorie Logan Susan Collins and Lael Brainard.
For the week ahead, we also have the Federal Reserve's Beige Book report Wednesday. ''Most indicators suggest further slowing in the real economy as well as lower price and wage pressures,'' the analysts at BBH said. ''However, labour market data suggests ongoing robustness in hiring and we think that will ultimately limit the drop in average hourly earnings.''Overall, the analysts expect the Beige Book to paint a mixed picture of the economy that suggests a willingness to continue tightening if data warrant.
Gold technical analysis
In this week's pre-open Gold price analysis, Gold, Chart of the Week: XAU/USD meets $1,920 resistance area, eyes on 4-hour structures to the downside, it was explained that the Gold price bears need to get the market on the backside of the 4-hour trendline as follows:
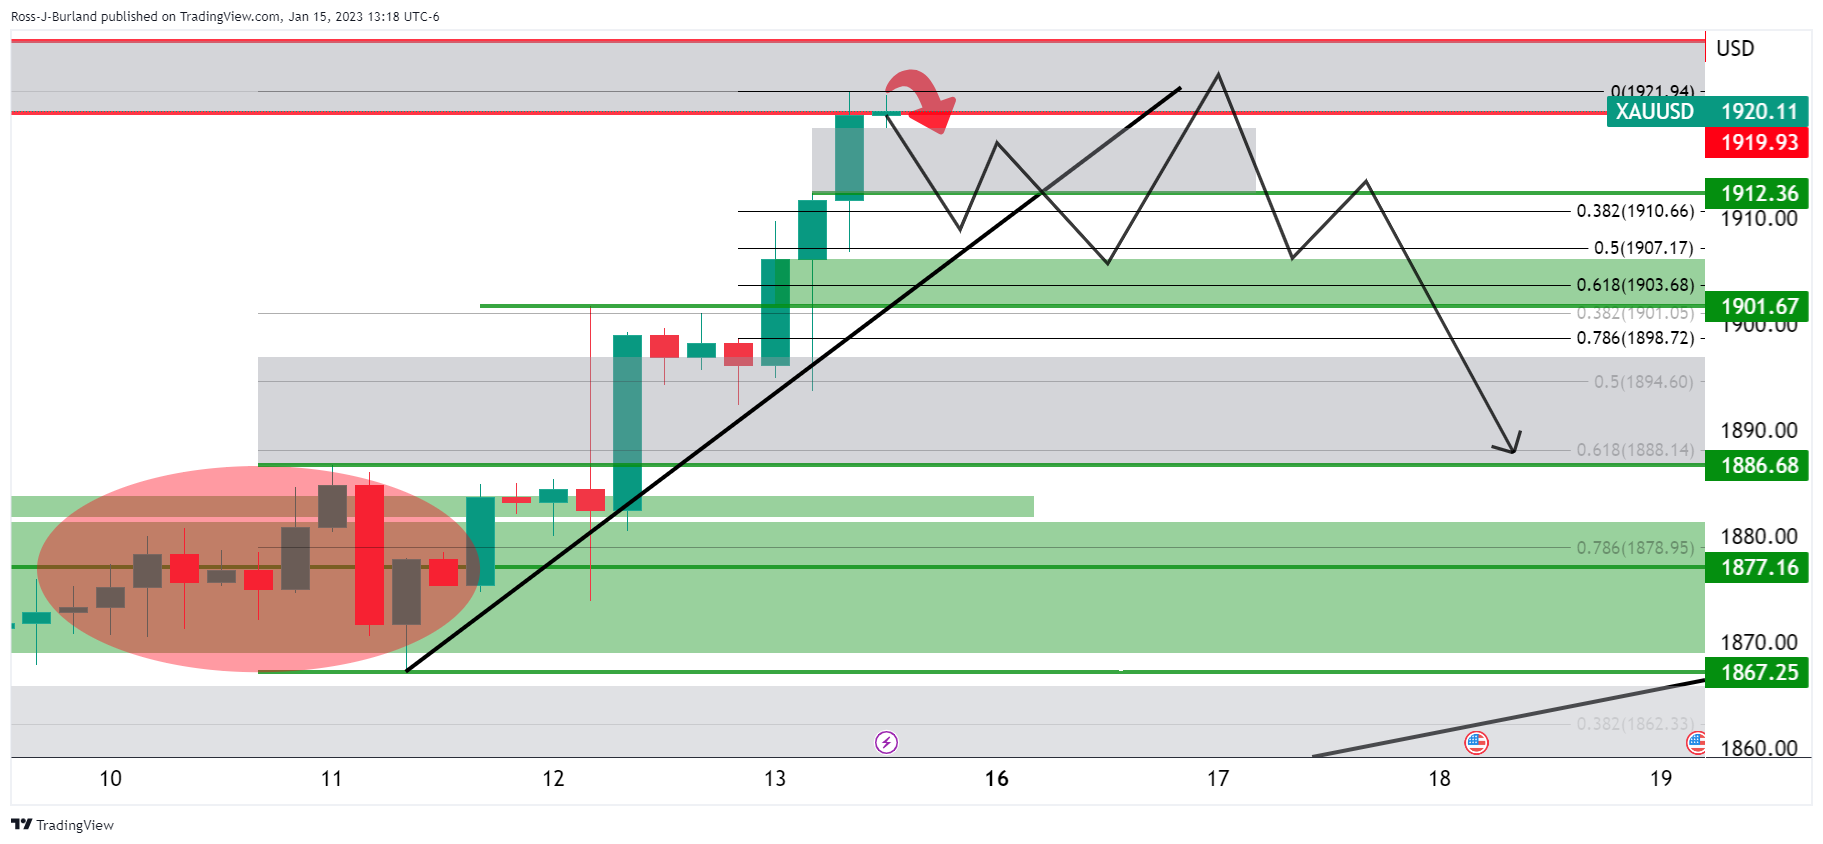
The above Gold price schematic is typical of such a breakdown and deceleration of the trend, in a) breaking the trendline, b) retesting the peak formation highs and c), eventually breaking the horizontal support structure.
-
01:52
BoJ announces JPY 1.4 trillion worth of bond-buying on Monday
The Bank of Japan (BoJ) announced on Monday that it offers to buy JPY 1.4 trillion worth of Japanese Government Bonds (JGBs) unplanned bond purchases operation on Friday.
Key details
JPY100Bln 1-3 Year
JPY500Bln 3- 5 Year
JPY500Bln 5-10 Year
JPY300Bln 10-25 Year
Market reaction
Amid a broadly weaker US Dollar, USD/JPY is trading 0.10% lower at 127.70, at the press time.
-
01:31
China House Price Index climbed from previous -1.6% to -1.5% in December
-
01:26
People's Bank of China's MLF fund injection rate is unchanged at 2.75%
The People's Bank of China's MLF fund injection rate is unchanged at 2.75%, one year.
In open market operations, the PBoC is to inject CNY82bln via 7-day reverse repos at 2.0% and CNY74bln via 14-day reverse repos at 2.15%.
MLF fund injection rate was last cut by 10bp to 2.75% in August, and markets saw the potential for a further reduction today that did not come.
There has been no reaction in the forex space in a slow start to the week.
-
01:21
USD/CNY fix: 6.7135 vs. the previous fix of 6.7292
In recent trade today, the People’s Bank of China (PBOC) set the yuan (CNY) at 6.7135 vs. the previous fix of 6.7292 vs. the previous close of 6.7000.
About the fix
China maintains strict control of the yuan’s rate on the mainland.
The onshore yuan (CNY) differs from the offshore one (CNH) in trading restrictions, this last one is not as tightly controlled.
Each morning, the People’s Bank of China (PBOC) sets a so-called daily midpoint fix, based on the yuan’s previous day's closing level and quotations taken from the inter-bank dealer.
-
01:19
US Dollar Index looks to test 101.60 as odds of less-hawkish Fed bets soar
- The USD Index is expected to decline towards a seven-month fresh low at 101.60.
- More than 94% chances are in favor of a 25 bps rate hike by the Fed to 4.50-4.75%.
- An expansion in the monthly Retail Sales might provide intermediate support to the USD Index.
The US Dollar Index (DXY) has sensed barricades whiling an attempt of sustaining above the critical resistance of 101.80 in the Asian session. This has led to a fall in the USD Index, which is set to test the fresh seven-week low at 101.60. The USD index could remain lackluster on Monday as United States markets will remain closed on account of Martin Luther King’s Birthday.
Investors’ risk appetite has extremely improved as the Federal Reserve (Fed) is set to slowdown its policy tightening pace further. Positive market sentiment has infused strength in the S&P500 futures, which have continued their four-day winning streak further. The 10-year US Treasury yields scaled higher to 3.50%.
Bets for 25 bps interest rate hike in February soar
After observing a downtrend in the United States Consumer Price Index (CPI), thanks to the decline in gasoline and used car prices, the Fed is expected to trim the pace of its policy tightening further. Fed chair Jerome Powell slashed the extent of the interest rate hike to 50 basis points (bps) in December after four consecutive 75 bps rate hikes. As the inflation rate has trimmed further, the Fed might choose a smaller rate hike to achieve price stability.
As per the CME FedWatch tool, the chances of pushing interest rates to 4.50-4.75% by hiking interest rates with a 25 bps rate hike have scaled above 94%.
US PPI and Retail Sales data- key triggers ahead
This week, the US Producer Price Index (PPI) and Retail Sales data will remain in the spotlight. As per the consensus, a decline in headline factory gate prices of goods and services (Dec) is expected at 6.8% from the former release of 7.4%. Also, the core Producer Price Index might trim to 5.9% from the former release of 6.2% in a similar period. An occurrence of the same might bolstered the case of a 25 bps interest rate hike by the Fed further.
Apart from that, the monthly Retail Sales data (Dec) is expected to expand by 0.1% vs. the former contraction of 0.6%. A recovery in the retail demand led by the upbeat labor market could provide some support to the USD Index ahead.
-
00:47
EUR/USD juggles below 1.0850 as focus shifts to US PPI and Retail Sales data
- EUR/USD is oscillating below 1.0850 amid a holiday in the United States market.
- The US Dollar Index (DXY) is looking to drop below the immediate support of 101.75 amid an upbeat market mood.
- The release of the US PPI and Retail Sales will provide decisive moves in the asset ahead.
The EUR/USD pair is struggling to find any direction as the United States markets are closed on Monday on account of Martin Luther King’s Birthday. The major currency pair is juggling below 1.0840 as investors have shifted their focus toward the release of the United States Producer Price Index (PPI) and Retail Sales data.
S&P500 futures witnessed marginal selling pressure in early Asia but have recovered their losses and have also turned positive, portraying an improvement in investors’ risk appetite. The US Dollar Index (DXY) is looking to drop below the immediate support of 101.75 amid an upbeat market mood.
Last week, the USD Index witnessed immense pressure after a slowdown in December’s Consumer Price Index (CPI) in the United States, which bolstered the case of a smaller interest rate hike announcement by the Federal Reserve (Fed) ahead. Going forward, the USD Index could continue its downside trend for a longer period as the Fed will look to pause policy tightening.
In the view of economists at Wells Fargo, an end to monetary tightening should bring the US Dollar's gains to an end by early 2023. Indeed, we believe a peak in the trade-weighted US Dollar for the current cycle has already been reached.” They forecasted a somewhat more pronounced pace of USD depreciation in 2024, once the Fed begins cutting its policy interest rate by early next year.
On Wednesday, investors will focus on the release of the US Producer Price Index (PPI) data. The street is expecting a decline amid lower gasoline prices, which has provided room to producers to trim prices at factory gates due to lower production costs. Also, a decline in retail demand will be equalized by lower prices. Apart from that, Retail Sales data will be keenly focused.
Meanwhile, Eurozone investors are cheering Germany’s preliminary Gross Domestic Product (GDP) expanded by 1.9% on an annualized basis in 2022 when compared to the +1.8% market consensus and +2.6% the prior release.
-
00:39
USD/JPY bulls move in and eye a correction towards 129.50
- USD/JPY bears depending on central bank sentiments.
- USD/JPY is pressured below trendline resistance and bears eye 126.55.
- Bulls are looking for a correction to give bears a discount to 129.50
USD/JPY is pressured due to a number of impactful macro themes, including the Bank of Japan's recent pivot, the Federal Reserve's decreasingly hawkish sentiment and the US economic disinflationary data. At the time of writing, USD/JPY is trading at 128.00 ahead of the Bank of Japan decision and after last week's headlines (Wednesday). The US Consumer Price Index (last Thursday) helped to nail down the coffin for the pair also.
USD/JPY dropped away from a trendline resistance on Wednesday before the highly anticipated Consumer Price Index event on Thursday when a headline about the Bank of Japan, as reported by Japanese media Yomiuri, circulated the wires. The news signalled that the Japanese central bank is up for reviewing the side effects of massive monetary easing in the monetary policy meeting next week. “BoJ reviews due to skewed interest rates in markets even after last month's tweak in bond yield control policy,” adds Yomiuri per Reuters. As a consequence, the yen moved higher sharply vs. the greenback and broke 130 and reached 129.60 ahead of the US CPI data which spurred the price lower to 127.45.
Meanwhile, despite prospects of a Fed pivot, there are observers that are sceptical of the Federal Reserve. Analaysts at TD Securities argued that ''while the precious metal space is no longer in a selling mode, there continues to be correction risk as it is not all certain that inflation has been defeated and that the US central bank is ready to get less restrictive anytime soon.''
Analysts at Brown Brothers Harriman argued that ''core PCE has largely been in a 4.5-5.5% range since November 2021 and we think the Fed needs to see further improvement before even contemplating any sort of pivot.''
''WIRP suggests a 25 bp hike February 1 is fully priced in, with nearly 30% odds of a larger 50 bp move. Another 25 bp hike March 22 is fully priced in, while one last 25 bp hike in Q2 is nearly 45% priced in that would take the Fed Funds rate ceiling up to 5.25%. However, the swaps market continues to price in an easing cycle by year-end and we just don’t see that happening.''
USD/JPY technical analysis
The pair has since continued lower and eyes the 126.50s. However, the daily M-formation could hold up the bears and attract a bid towards the 129.50s beforehand.
-
00:30
Stocks. Daily history for Friday, January 13, 2023
Index Change, points Closed Change, % NIKKEI 225 -330.3 26119.52 -1.25 Hang Seng 224.56 21738.66 1.04 KOSPI 20.99 2386.09 0.89 ASX 200 47.7 7328.1 0.66 FTSE 100 50.1 7844.1 0.64 DAX 28.22 15086.52 0.19 CAC 40 47.82 7023.5 0.69 Dow Jones 112.64 34302.61 0.33 S&P 500 15.92 3999.09 0.4 NASDAQ Composite 78.06 11079.16 0.71 -
00:19
USD/CAD sees consolidation around 1.3400 ahead of Canada Inflation, oil surpasses $80.00
- USD/CAD is expected to consolidate near 1.3400 as investors await Canada’s inflation release for fresh cues.
- Federal Reserve might look for a rate hike by mere 25 bps led by a slowdown in December’s inflation report.
- The Bank of Canada will continue to hike interest rates despite a likely ease in inflationary pressures.
- USD/CAD is broadly declining towards the horizontal support placed at 1.3224.
USD/CAD has rebounded to near the round-level resistance of 1.3400 in the early Asian session. The Loonie asset is likely to remain sideways as investors are shifting their focus toward the release of Canada’s inflation, which is scheduled for Tuesday. Till then, the major will dance to the tunes of the market sentiment.
S&P500 futures are displaying a marginal sell-off in early Asia, portraying a short-term caution in the overall upbeat market mood. The return on US Treasury bonds scaled to 3.50%, surprisingly in the risk-appetite market theme. This also provided a cushion to the US Dollar Index (DXY) from any further weakness below 101.76.
Investors to look closely at United States Retail Sales and PPI data
After a slowdown in December’s inflation report in the United States, investors have shifted their focus toward the Retail Sales and Producer’s Price Index (PPI) data, which will release on Wednesday. A decline in the headline Consumer Price Index (CPI) to 6.5% has already bolstered the odds of a slowdown in the pace of policy tightening by the Federal Reserve (Fed) for its February monetary policy meeting. Money market participants see a 91.6% chance that the Federal Reserve will hike interest rates further by 25 basis points (bps) in February.
As per the consensus, a decline in headline factory gate prices of goods and services (Dec) is expected at 6.8% from the former release of 7.4%. Also, the core Producer Price Index might trim to 5.9% from the former release of 6.2% in a similar period. A decline in the US PPI could be the outcome of lower gasoline prices as it might be resulting in a lower cost of production. Also, producers are aiming to find equilibrium due to a decline in retail demand.
The monthly Retail Sales (Dec) data is seen higher at 0.1% vs. the contraction of 0.6% reported earlier.
Canada’s Consumer Price Index hogs limelight
This week, the major catalyst that will bring power-pack action for the Canadian Dollar is Tuesday’s Consumer Price Index (Dec) data. According to the market estimates, the annual headline CPI will trim to 6.3% from the former release of 6.8%. However, the core inflation will escalate to 6.1% vs. 5.8% released earlier.
Analysts at RBC Economics, at Financial Post, stated that grocery price growth, which surged 11.4% year over year in November, should slow in 2023 as supply chain disruptions ease further and lower agriculture commodity prices feed through. Moreover, gas prices fell 13% in December from the month before, which could be the reason behind lower expectations for headline inflation.
The Bank of Canada (BoC) has been hiking interest rates to achieve 2% inflation by fighting against stubborn inflation. Bank of Canada Governor Tiff Macklem is set to announce the first monetary policy meeting of CY2023 next week and is likely to hike interest rates further moderately. Desjardins economists say that despite a likely easing of inflation in December’s data, they still see the Bank of Canada raising rates another 25 basis points later this month, as reported by Financial Post.
Higher oil prices to support Canadian Dollar
West Texas Intermediate (WTI) has scaled above the critical resistance of $80.00 amid optimism about economic recovery in China. The reopening of China after a long lockdown period and growing expectations for monetary easing by the People’s Bank of China (PBoC) to spurt growth and push inflation higher.
Strategists at TD Securities expect the global benchmark crude to trade at $100/b in the latter part of 2023. Once China normalizes post-COVID, the Middle Kingdom's consumption should jump by as much as one million b/d over the next six months from recent lows, with demand increasing another 0.5 million b/d by year-end.
On the supply side, the Oil and Petroleum Exporting Countries (OPEC) might look for right-sizing production to match any demand growth later as the Federal Reserve (Fed) is also looking to decelerate the pace of policy tightening after a slowdown in the United States inflationary pressures. It is worth noting that Canada is a leading exporter of oil to the United States and higher oil prices will provide strength to the Canadian Dollar.
USD/CAD technical outlook
-638094249860330776.png)
USD/CAD is declining towards the horizontal support plotted from July 14 high at 1.3224 on the daily scale. The Loonie asset has shifted below the 100-period Exponential Moving Average (EMA) at 1.3428, which indicates that the downside bias has strengthened now. Going forward, the south side move in the major is likely to find an immediate cushion around the upward-sloping trendline from June 8 low at 1.2518. Also, the 200-EMA at 1.3241 will act as a major support.
The Relative Strength Index (RSI) (14) is hovering around 40.00 and may witness a sheer fall if drops into the bearish range of 20.00-40.00.
-
00:15
Currencies. Daily history for Friday, January 13, 2023
Pare Closed Change, % AUDUSD 0.69801 0.22 EURJPY 138.57 -1.16 EURUSD 1.08348 -0.1 GBPJPY 156.516 -0.77 GBPUSD 1.22384 0.2 NZDUSD 0.63891 0 USDCAD 1.33882 0.25 USDCHF 0.92575 -0.04 USDJPY 127.891 -1 -
00:06
AUD/USD bulls eye a break of 0.6990s as domestic data underpins hawkish RBA sentiment
- AUD/USD supported on domestic recent data.
- Bulls eye a break of the inverse head and shoulders.
AUD/USD is trading at 0.6970 and in a tight 10-pip range between 0.6967 and 0.6977 on the day so far. The price has been capped below the recent 0.6990s recent highs in what has been a choppy consolidation range since the US Consumer Price Index event that showed ongoing disinflation.
AUD/USD has benefitted from a number of fundamentals in the past week or so, from domestic data, the China reopening story and the dovish sentiment building around the Federal Reserve narrative. Until this shifts more hawkish, risk assets, such as the Aussie, would be expected to continue to build on recent gains.
Domestic economic data are also showing resilience. November Retail Sales recorded a far stronger-than-expected rise of 1.4% month on month, which followed an upwardly revised October number. The monthly November Consumer Price Index also ticked higher to 7.3% YoY, with the core data also edging up. These data have strengthened expectations of another 25 bps rate hike from the RBA next month and pushed back talk that the central bank could be on the cusp of a policy pause, fuelling a bid in the Aussie.
''While the Australian economy is expected to slow overall this year, recessionary risks appear low. This should increase the resilience of the AUD and provide insulation against headwinds implied by forecasts of a slowdown in global growth,'' analysts at Rabobank explained. ''Weaker global growth is traditionally a bearish factor for the AUD given its links with commodity prices.''We view the AUD as less likely to be swayed by speculative flows given that Australia no longer had a current account deficit and given that the narrowing of interest rates spreads between Australian and US interest rates,'' the analysts added.
AUD/USD technical analysis
A bearish schematic could be drawn as follows on the four hour chart:
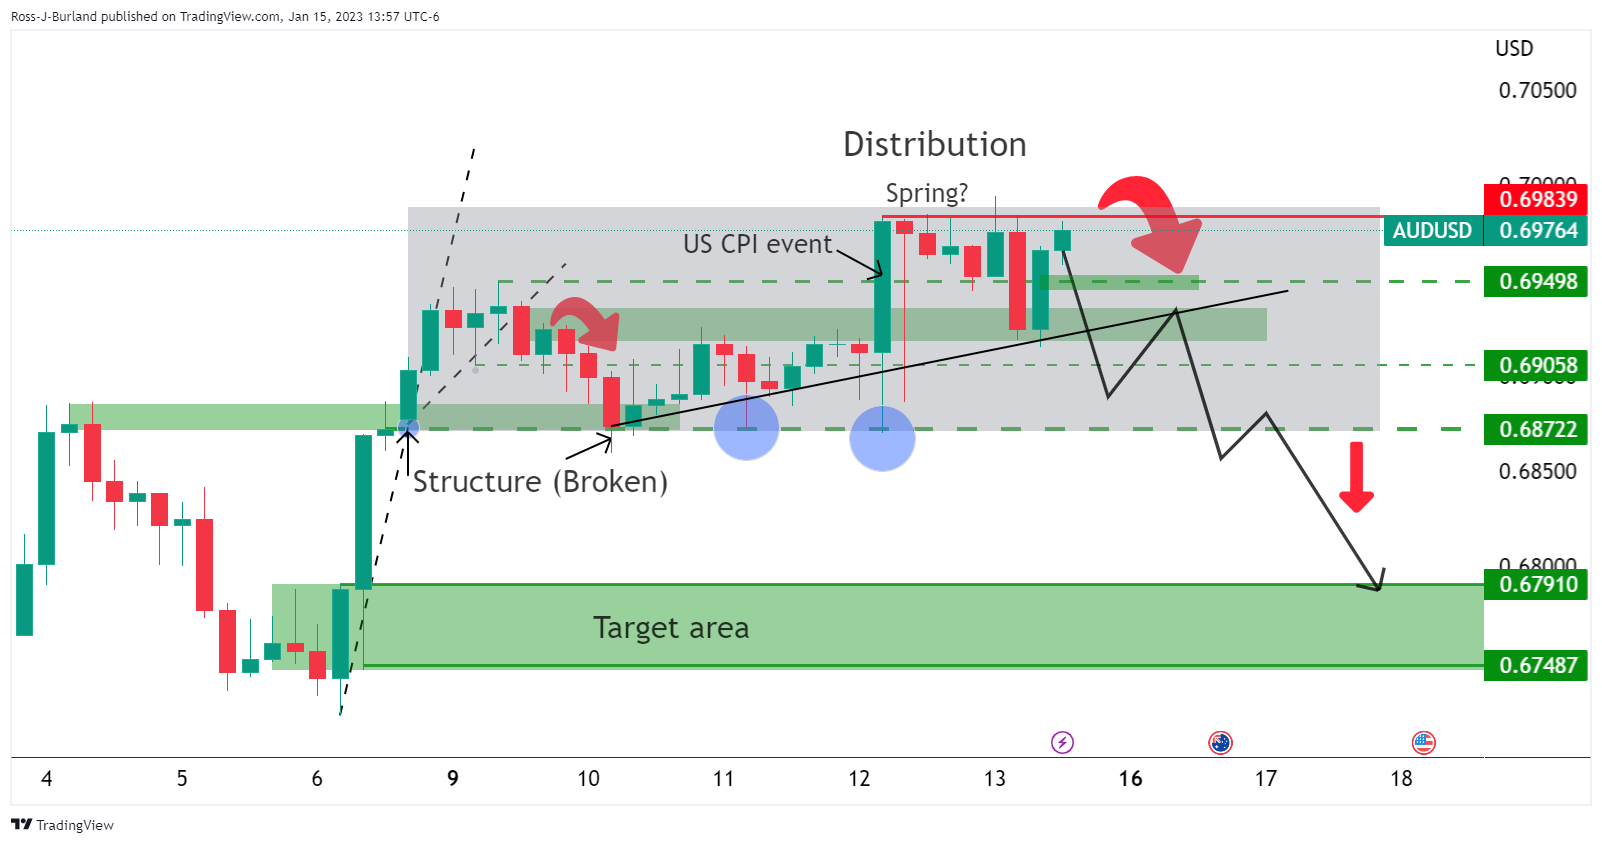
On the upside, an inverse head and shoulders could be forming:
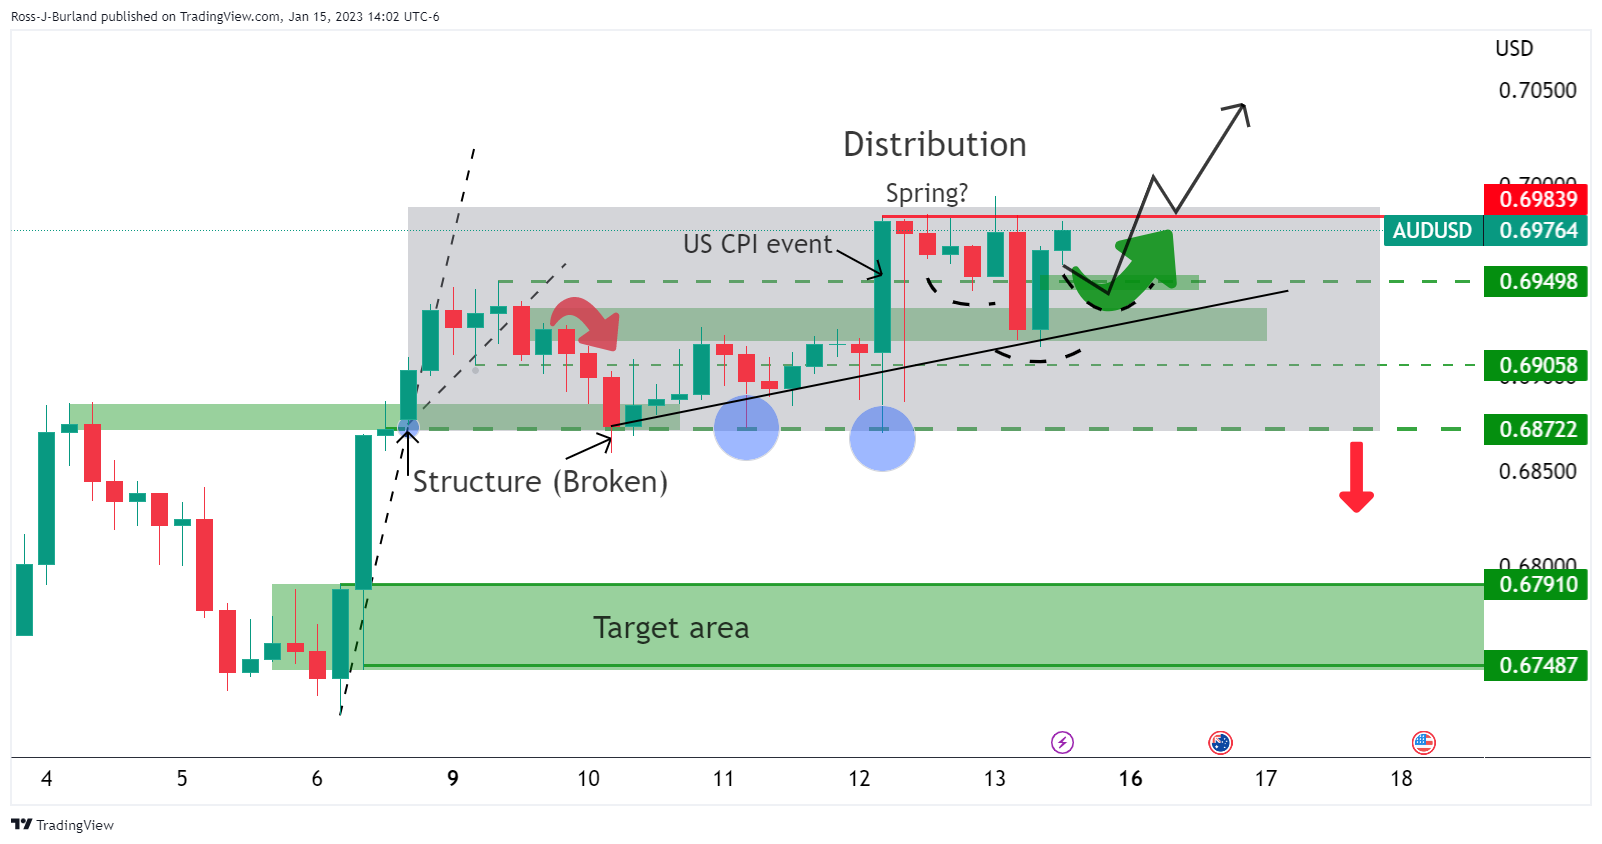
A break through the 0.6890s opens risk to 0.7050 and 0.7090 for sessions ahead, in line with the bullish trend.
AUD/USD H1 chart
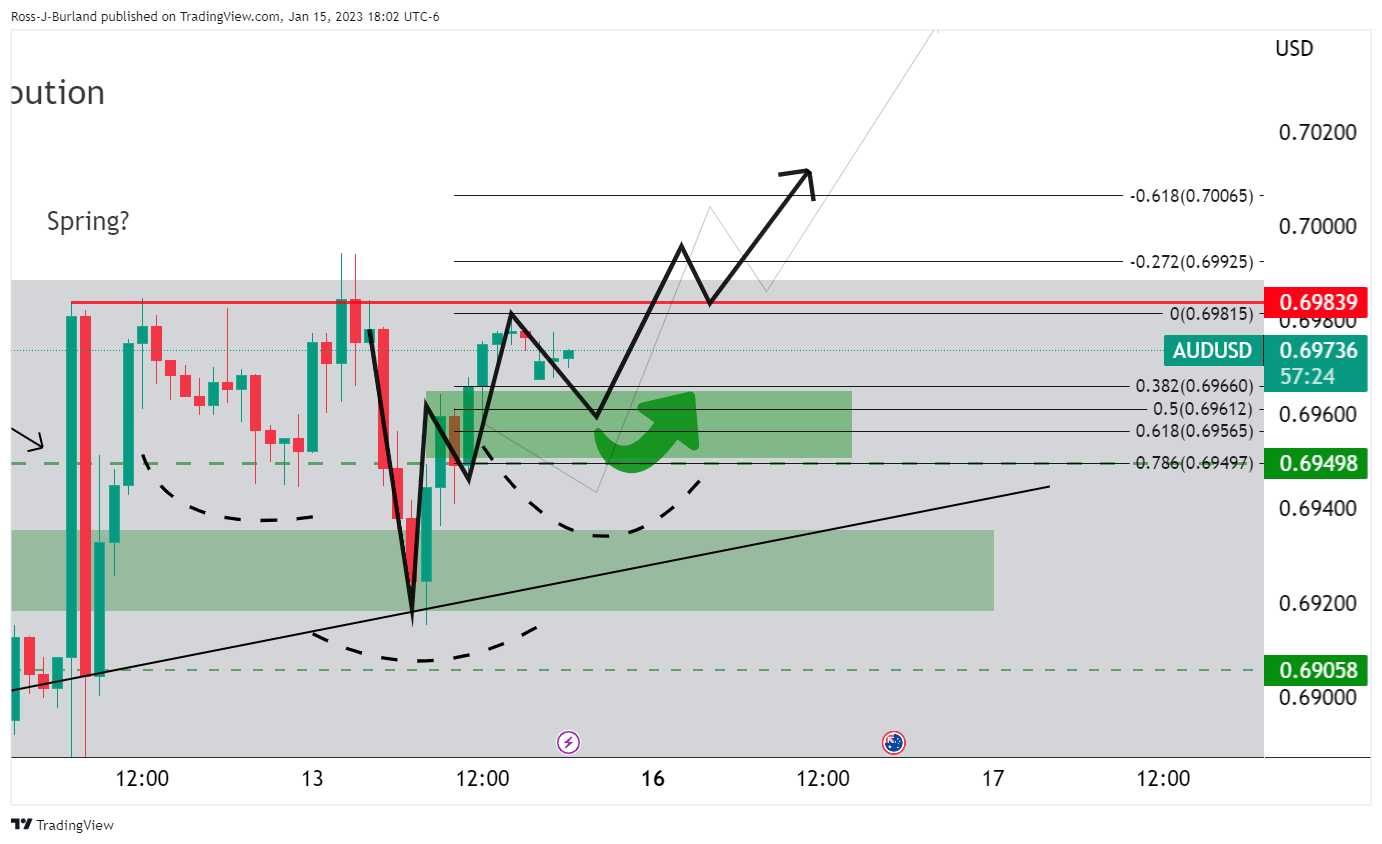
The hourly W-formation could see the price drawn into the 50% mean reversion support area prior to the next significant bullish impulse and breakout of the inverse head and shoulders neckline.
-
00:05
Australia TD Securities Inflation (YoY) unchanged at 5.9% in December
-
00:03
Australia TD Securities Inflation (MoM) down to 0.2% in December from previous 1%
-