Notícias do Mercado
-
23:45
New Zealand: CPI, q/q , Quarter I 0.5% (forecast 0.5%)
-
23:45
New Zealand: CPI, y/y, Quarter I 1.1% (forecast 1.1%)
-
23:27
Currencies. Daily history for April 18’2018:
raw materials
closing price
% change
Oil
68.75
+3.35%
Gold
1,352.40
+0.21%
-
23:26
Currencies. Daily history for April 18’2018:
index
closing price
change items
% change
Nikkei
+310.61
22158.20
+1.42%
TOPIX
+19.69
1749.67
+1.14%
Hang Seng
+221.50
30284.25
+0.74%
CSI 300
+17.64
3766.28
+0.47%
Euro Stoxx 50
+12.98
3490.89
+0.37%
FTSE 100
+91.29
7317.34
+1.26%
DAX
+5.26
12590.83
+0.04%
CAC 40
+26.63
5380.17
+0.50%
DJIA
-38.56
24748.07
-0.16%
S&P 500
+2.25
2708.64
+0.08%
NASDAQ
+14.14
7295.24
+0.19%
S&P/TSX
+176.67
15529.97
+1.15%
-
23:25
Currencies. Daily history for April 18’2018:
Pare
Closed
% change
EUR/USD
$1,2377
+0,03%
GBP/USD
$1,4204
-0,60%
USD/CHF
Chf0,96834
+0,23%
USD/JPY
Y107,20
+0,18%
EUR/JPY
Y132,70
+0,22%
GBP/JPY
Y152,288
-0,41%
AUD/USD
$0,7783
+0,19%
NZD/USD
$0,7315
-0,31%
USD/CAD
C$1,26261
+0,60%
-
23:01
Schedule for today, Thursday, April 19’2018 (GMT+3)
Time
Region
Event
Period
Previous
Forecast
01:45
New Zealand
CPI, y/y
I quarter
1.6%
1.1%
01:45
New Zealand
CPI, q/q
I quarter
0.1%
0.5%
04:30
Australia
Changing the number of employed
March
17.5
20
04:30
Australia
Unemployment rate
March
5.6%
5.5%
11:00
Eurozone
Current account, unadjusted, bln
February
12.8
11:30
United Kingdom
Retail Sales (MoM)
March
0.8%
-0.5%
11:30
United Kingdom
Retail Sales (YoY)
March
1.5%
2%
15:00
USA
FOMC Member Brainard Speaks
15:30
USA
Continuing Jobless Claims
April
1871
1848
15:30
USA
Philadelphia Fed Manufacturing Survey
April
22.3
20.1
15:30
USA
Initial Jobless Claims
April
233
230
16:30
USA
FOMC Member Quarles Speaks
17:00
USA
Leading Indicators
March
0.6%
0.3%
19:30
United Kingdom
BOE Deputy Governor for Financial Stability Jon Cunliffe speaks
-
21:08
The major US stock indexes finished trading in different directions
Major US stock indices showed mixed dynamics, as the growth of shares in the base materials sector was partially offset by negative dynamics of the conglomerate and consumer goods sector.
Oil rose more than 3% on Wednesday, reacting to a report from the US Energy Ministry, which reflected a decline in oil reserves, and sources that the top exporter Saudi Arabia wants to see the price of oil closer to $ 100 per barrel. The US Energy Ministry said that in the week of April 7-13, oil reserves fell by 1.071 million barrels to 427.6 million barrels. Analysts had expected a reduction of 1.429 million barrels. Oil reserves in the Cushing terminal fell by 1.1 million barrels, to 34.9 million barrels.
A certain influence on the dynamics of trading was provided by the Fed's Beige Book. The report reported that in all 12 zones of responsibility of the US Federal Reserve Bank in March-April there was an acceleration of economic activity and employment growth, however, the growth rates of wages for the most part remained modest. Meanwhile, companies in many regions reported high demand for labor, which makes it difficult to find qualified employees.
Components of the DOW index finished trading in different directions (17 in the red, 13 in the black). Outsider were the shares of International Business Machines Corporation (IBM, -7.55%). The growth leader was the shares of The Home Depot, Inc. (HD, + 2.90%).
Most sectors of the S & P recorded a rise. The base materials sector grew most (+ 2.0%). The consumer goods sector showed the greatest decrease (-0.4%).
At closing:
Dow 24,748.07 -38.56 -0.16%
S&P 500 2,708.64 +2.25 +0.08%
Nasdaq 100 7,295.24 +14.14 +0.19%
-
20:03
DJIA -0.03% 24,779.71 -6.92 Nasdaq +0.41% 7,310.89 +29.79 S&P +0.28% 2,713.96 +7.57
-
17:00
European stocks closed: FTSE 100 +91.29 7317.34 +1.26% DAX +5.26 12590.83 +0.04% CAC 40 +26.63 5380.17 +0.50%
-
15:34
U.S. commercial crude oil inventories decreased by 1.1 million barrels from the previous week
U.S. commercial crude oil inventories (excluding those in the Strategic Petroleum Reserve) decreased by 1.1 million barrels from the previous week. At 427.6 million barrels, U.S. crude oil inventories are in the lower half of the average range for this time of year.
Total motor gasoline inventories decreased by 3.0 million barrels last week, but are in the upper half of the average range. Both finished gasoline inventories and blending components inventories decreased last week.
Distillate fuel inventories decreased by 3.1 million barrels last week and are in the lower half of the average range for this time of year. Propane/propylene inventories remained unchanged last week, and are in the lower half of the average range. Total commercial petroleum inventories decreased by 10.6 million barrels last week.
-
15:30
U.S.: Crude Oil Inventories, April -1.071 (forecast -1.429)
-
15:20
-
15:17
BoC reiterates will be cautious with respect to future policy adjustments, guided by incoming data
-
Q1 gdp forecast to 1.3 pct from 2.5 pct, sees q2 at 2.5 pct; raises potential output growth to 1.8 pct in 2018-20, 1.9 pct in 2021
-
Q1 gdp weaker than forecast, rebound seen in q2; economy to operate above potential over next three years, helped by provincial, federal fiscal measures
-
Inflation in 2018 likely to be modestly higher than expected in jan before returning to target
-
Inflation close to 2 pct as temporary factors have dissipated; rise in core inflation consistent with economy operating with little slack
-
Some policy accommodation will still be needed to keep inflation on target; monitoring economy's sensitivity to rate movements, evolution of economic capacity
-
-
15:02
The Bank of Canada maintained its target for the overnight rate at 1.25%
"The Bank of Canada today maintained its target for the overnight rate at 1 ¼ per cent. The Bank Rate is correspondingly 1 ½ per cent and the deposit rate is 1 per cent.
Inflation in Canada is close to 2 per cent as temporary factors that have been weighing on inflation have largely dissipated, as expected. Consistent with an economy operating with little slack, core measures of inflation have continued to edge up and are all now close to 2 per cent. The transitory impact of higher gasoline prices and recent minimum wage increases will likely cause inflation in 2018 to be modestly higher than the Bank expected in its January Monetary Policy Report (MPR), returning to the 2 per cent target for the rest of the projection horizon.
The global economy is on a modestly stronger track than forecast in January, with upward revisions to growth and potential output in a number of major advanced economies. The outlook for the U.S. economy has been further boosted by new government spending plans. However, escalating geopolitical and trade conflicts risk undermining the global expansion.
In Canada, GDP growth in the first quarter was weaker than the Bank had expected, but should rebound in the second quarter, resulting in 2 per cent average growth in the first half of 2018. The economy is projected to operate slightly above its potential over the next three years, with real GDP growth of about 2 per cent in both 2018 and 2019, and 1.8 per cent in 2020. This stronger profile for GDP incorporates new provincial and federal fiscal measures announced since January. It also reflects upward revisions to estimates of potential output growth, which suggest the Canadian economy has made some progress in building capacity".
-
15:00
Canada: Bank of Canada Rate, 1.25% (forecast 1.25%)
-
14:49
OPEC, partners unlikely to change oil supply-cutting deal at june meeting even if inventory target reached - OPEC sources
-
14:32
U.S. Stocks open: Dow +0.11% Nasdaq +0.09%, S&P +0.20%
-
14:26
ECB’s Villeroy: following central course of gradual policy normalization
-
Policy to remain accommodative for extended period after qe ends, with sizeable stock of assets
-
Halting asset purchases in september or december 'not a deep existential question' for ECB
-
'High convergence of views' within governing council
-
There are risks rising around protectionism, exchange rates, financial markets
-
Monetary policy is predictable not pre-committed
-
-
14:25
ECB's Villeroy sees some economic growth moderation of late - BBG
-
14:09
Before the bell: S&P futures +0.35%, NASDAQ futures +0.30%
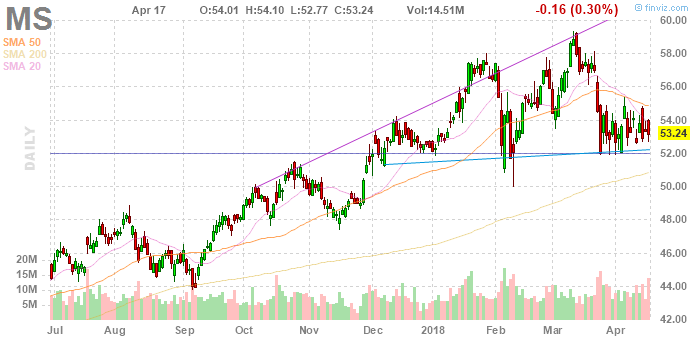
U.S. stock-index futures rose on Wednesday, as the latest slew of solid quarterly results, including Morgan Stanley (MS; +1.8%), added to optimism about the U.S. corporate earnings season.
Global Stocks:
Index/commodity
Last
Today's Change, points
Today's Change, %
Nikkei
22,158.20
+310.61
+1.42%
Hang Seng
30,284.25
+221.50
+0.74%
Shanghai
3,091.31
+24.51
+0.80%
S&P/ASX
5,861.40
+19.90
+0.34%
FTSE
7,289.81
+63.76
+0.88%
CAC
5,368.48
+14.94
+0.28%
DAX
12,568.87
-16.70
-0.13%
Crude
$67.68
+1.74%
Gold
$1,356.00
+0.48%
-
13:48
Wall Street. Stocks before the bell
(company / ticker / price / change ($/%) / volume)
3M Co
MMM
220.23
0.14(0.06%)
372
ALCOA INC.
AA
58.7
1.62(2.84%)
85297
ALTRIA GROUP INC.
MO
62.7
-1.28(-2.00%)
21287
Amazon.com Inc., NASDAQ
AMZN
1,516.33
12.50(0.83%)
89329
American Express Co
AXP
94.44
0.58(0.62%)
2462
AMERICAN INTERNATIONAL GROUP
AIG
54.28
0.02(0.04%)
490
Apple Inc.
AAPL
178.2
-0.04(-0.02%)
55629
AT&T Inc
T
35.4
0.04(0.11%)
4527
Barrick Gold Corporation, NYSE
ABX
13.18
0.11(0.84%)
25125
Boeing Co
BA
337.75
1.03(0.31%)
7841
Caterpillar Inc
CAT
154.4
1.09(0.71%)
3681
Cisco Systems Inc
CSCO
44.71
0.12(0.27%)
12799
Citigroup Inc., NYSE
C
70.14
0.40(0.57%)
24031
Exxon Mobil Corp
XOM
78.9
0.57(0.73%)
2953
Facebook, Inc.
FB
166.7
-1.96(-1.16%)
330236
Ford Motor Co.
F
11.43
0.05(0.44%)
58369
Freeport-McMoRan Copper & Gold Inc., NYSE
FCX
18.71
0.41(2.24%)
32100
General Electric Co
GE
13.85
0.06(0.44%)
119652
General Motors Company, NYSE
GM
39.39
0.17(0.43%)
2544
Goldman Sachs
GS
254.86
1.23(0.49%)
29247
Google Inc.
GOOG
1,080.39
6.23(0.58%)
9415
Hewlett-Packard Co.
HPQ
22.1
0.05(0.23%)
773
Home Depot Inc
HD
175.38
0.47(0.27%)
366
HONEYWELL INTERNATIONAL INC.
HON
150
1.30(0.87%)
664
Intel Corp
INTC
53.77
0.23(0.43%)
47397
International Business Machines Co...
IBM
151.65
-9.26(-5.75%)
236609
Johnson & Johnson
JNJ
130.4
-0.14(-0.11%)
2007
JPMorgan Chase and Co
JPM
110.6
0.39(0.35%)
24331
McDonald's Corp
MCD
162.81
0.26(0.16%)
6074
Merck & Co Inc
MRK
59.29
0.02(0.03%)
1408
Microsoft Corp
MSFT
96.45
0.38(0.40%)
28250
Nike
NKE
67.3
-0.21(-0.31%)
349
Pfizer Inc
PFE
36.46
0.13(0.36%)
679
Procter & Gamble Co
PG
78.64
0.21(0.27%)
2759
Starbucks Corporation, NASDAQ
SBUX
59.79
-0.04(-0.07%)
889
Tesla Motors, Inc., NASDAQ
TSLA
293.25
5.56(1.93%)
93054
Verizon Communications Inc
VZ
48.96
0.11(0.23%)
1763
Visa
V
124.01
0.21(0.17%)
1265
Wal-Mart Stores Inc
WMT
88.26
0.36(0.41%)
1296
Walt Disney Co
DIS
102.46
0.29(0.28%)
1415
Yandex N.V., NASDAQ
YNDX
34.17
1.14(3.45%)
158387
-
13:46
Target price changes before the market open
McDonald's (MCD) target lowered to $165 at Stifel
-
13:45
Downgrades before the market open
Altria (MO) downgraded to Neutral from Buy at Citigroup
Facebook (FB) downgraded to Mixed from Positive at OTR Global
-
12:54
Mike Pompeo met with Kim Jong Un in North Korea last week. Meeting went very smoothly and a good relationship was formed...@realDonaldTrump
Mike Pompeo met with Kim Jong Un in North Korea last week. Meeting went very smoothly and a good relationship was formed. Details of Summit are being worked out now. Denuclearization will be a great thing for World, but also for North Korea! @realDonaldTrump
-
12:09
Company News: Morgan Stanley (MS) quarterly results beat analysts’ estimates
Morgan Stanley (MS) reported Q1 FY 2018 earnings of $1.45 per share (versus $1.00 in Q1 FY 2017), beating analysts' consensus estimate of $1.25.
The company's quarterly revenues amounted to $11.077 bln (+13.7% y/y), beating analysts' consensus estimate of $10.369 bln.
MS rose to $54.20 (+1.80%) in pre-market trading.
-
12:03
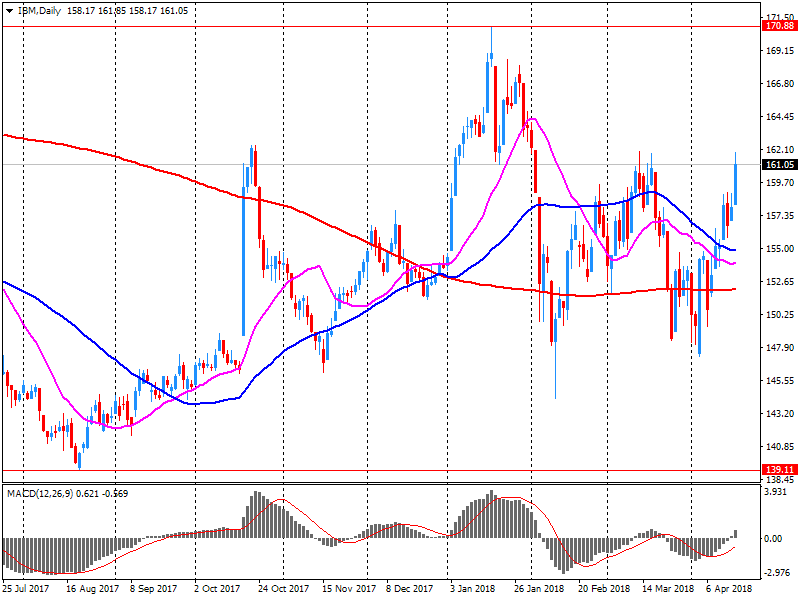
Company News: IBM (IBM) quarterly results beat analysts’ expectations
IBM (IBM) reported Q1 FY 2018 earnings of $2.45 per share (versus $2.38 in Q1 FY 2017), beating analysts' consensus estimate of $2.42.
The company's quarterly revenues amounted to $19.072 bln (+5.1% y/y), beating analysts' consensus estimate of $18.803 bln.
The company reaffirmed guidance for FY 2018, projecting EPS of at least $13.80 versus analysts' consensus estimate of $13.84.
IBM fell to $152.75 (-5.07%) in pre-market trading.
-
11:31
Russian embassy in Washington received letter from Trump administration saying USA had no immediate plans to impose new sanctions on Moscow - Interfax cites diplomatic source
-
11:29
Euro area annual inflation rate was 1.3% in March 2018, up from 1.1% in February
A year earlier, the rate was 1.5%. European Union annual inflation was 1.5% in March 2018, up from 1.4% in February. A year earlier the rate was 1.6%. These figures are published by Eurostat, the statistical office of the European Union.
The lowest annual rates were registered in Cyprus (-0.4%), Greece (0.2%) and Denmark (0.4%). The highest annual rates were recorded in Romania (4.0%), Estonia (2.9%), Slovakia and Lithuania (both 2.5%). Compared with February, annual inflation fell in six Member States, remained stable in six and rose in fifteen. In March 2018, the highest contribution to the annual euro area inflation rate came from services (+0.67 percentage point), followed by food, alcohol & tobacco (+0.41 pp), energy (0.20 pp) and non-energy industrial goods (0.07 pp).
-
10:00
Eurozone: Construction Output, y/y, February 0.4% (forecast 2.3%)
-
10:00
Eurozone: Harmonized CPI, Y/Y, March 1.3% (forecast 1.4%)
-
10:00
Eurozone: Harmonized CPI, March 1% (forecast 1%)
-
10:00
Eurozone: Harmonized CPI ex EFAT, Y/Y, March 1% (forecast 1%)
-
09:34
UK producer price index down 0.1% in March
The headline rate of inflation for goods leaving the factory gate (output prices) was 2.4% on the year to March 2018, down from 2.6% in February 2018.
Prices for materials and fuels (input prices) rose 4.2% on the year to March 2018, up from 3.8% in February 2018.
All industries provided upward contributions to output annual inflation; the largest contribution was made by food products.
The rate of input annual inflation increased for the first time in four months, despite the second consecutive decrease on the monthly rate.
-
09:33
UK CPI miss expectations in March
The Consumer Prices Index including owner occupiers' housing costs (CPIH) 12-month inflation rate was 2.3% in March 2018, down from 2.5% in February 2018.
Since reaching a recent high of 2.8% towards the end of 2017, the rate has fallen back to its lowest since March 2017.
The largest downward contribution to the change in the rate between February 2018 and March 2018 came from prices for clothing and footwear rising by less than they did a year ago, with the effect coming mainly from a range of items of women's clothing.
Price movements for alcoholic drinks and tobacco also made a downward contribution to the change in the rate; this in part reflects changes to the Budget cycle that were introduced in 2017, with tax changes for tobacco being announced in November 2017 instead of March 2018.
The Consumer Prices Index (CPI) 12-month rate was 2.5% in March 2018, down from 2.7% in February 2018.
-
09:30
United Kingdom: HICP, Y/Y, March 2.5% (forecast 2.7%)
-
09:30
United Kingdom: HICP, m/m, March 0.1% (forecast 0.3%)
-
09:30
United Kingdom: HICP ex EFAT, Y/Y, March 2.3% (forecast 2.5%)
-
09:30
United Kingdom: Producer Price Index - Output (MoM), March 0.2% (forecast 0.2%)
-
09:30
United Kingdom: Retail Price Index, m/m, March 0.1% (forecast 0.3%)
-
09:30
United Kingdom: Producer Price Index - Input (YoY) , March 4.2% (forecast 4.1%)
-
09:30
United Kingdom: Retail prices, Y/Y, March 3.3% (forecast 3.6%)
-
09:30
United Kingdom: Producer Price Index - Input (MoM), March -0.1% (forecast 0.3%)
-
09:30
United Kingdom: Producer Price Index - Output (YoY) , March 2.4% (forecast 2.3%)
-
08:28
Euro Stoxx index up 0.1 pct , Germany's DAX up 0.1 pct , Britain's FTSE 100 up 0.2 pct, France's CAC 40 up 0.1 pct, Spain's IBEX up 0.1 pct
-
07:46
Options levels on wednesday, April 18, 2017
EUR/USD
Resistance levels (open interest**, contracts)
$1.2460 (2109)
$1.2446 (1395)
$1.2425 (216)
Price at time of writing this review: $1.2369
Support levels (open interest**, contracts):
$1.2312 (3548)
$1.2276 (3696)
$1.2235 (4410)
Comments:
- Overall open interest on the CALL options and PUT options with the expiration date May, 4 is 77407 contracts (according to data from April, 17) with the maximum number of contracts with strike price $1,2250 (4410);
GBP/USD
Resistance levels (open interest**, contracts)
$1.4404 (2144)
$1.4367 (2096)
$1.4345 (2028)
Price at time of writing this review: $1.4304
Support levels (open interest**, contracts):
$1.4263 (208)
$1.4218 (462)
$1.4188 (448)
Comments:
- Overall open interest on the CALL options with the expiration date May, 4 is 22151 contracts, with the maximum number of contracts with strike price $1,4400 (3232);
- Overall open interest on the PUT options with the expiration date May, 4 is 24027 contracts, with the maximum number of contracts with strike price $1,3850 (2494);
- The ratio of PUT/CALL was 1.08 versus 1.06 from the previous trading day according to data from April, 17
* - The Chicago Mercantile Exchange bulletin (CME) is used for the calculation.
** - Open interest takes into account the total number of option contracts that are open at the moment.
-
07:14
Eurostoxx 50 futures up 0.1 pct, DAX futures up 0.1 pct, CAC 40 futures up 0.2 pct, FTSE futures up 0.1 pct
-
06:46
10-year U.S. treasury yield at 2.834 percent vs U.S. close of 2.814 percent on tuesday
-
06:45
Fed's Evans says he's optimistic inflation will reach 2 pct, doesn't see much pressure beyond that
-
Says U.S. economy firing on all cylinders
-
Fed can raise rates gradually without risk of inflation surge
-
Job market 'solid,' consumer spending fundamentals 'quite strong'
-
Global growth picking up, sees trade uncertainty
-
U.S. inflation somewhat below target, expected to improve
-
Little risk of accelerating, markedly higher inflation
-
-
06:42
Trump says U.S. has had direct talks with North Korea at extremely high levels
-
We will let you know fairly soon when and where summit with Kim will take place
-
-
06:40
U.S. Commerce Department initiates antidumping duty and countervailing duty investigations of imports of certain steel wheels from China - Statement
-
Makes preliminary finding imports of aluminum sheet from China subsidized
-
-
06:38
Trump tweets: "too many contingencies and no way to get out if it doesn’t work. Bilateral deals are far more efficient, profitable and better for our workers. Look how bad WTO is to U.S."
-
06:27
Global Stocks
European stocks logged the best close in about seven weeks, taking the lead from an upbeat session the prior day in the U.S., as attention shifted from geopolitical concerns to the earnings season. U.K. stocks erased an earlier loss and swung higher, after a mixed reading on the country's labor market sent the pound lower.
U.S. stocks rallied on Tuesday, with major indexes closing at the highest levels in about a month as the latest round of corporate earnings supported the thesis that valuations are supported by economic activity. The day's gains were broad, with all 11 S&P 500 sectors ending in solidly higher territory, although the technology and consumer-discretionary groups saw the biggest advance on the day.
Asian equities Wednesday largely built on gains in the U.S. and Europe the day before, but Chinese stocks continued to lag behind on concerns about trade and the country's economy. Equities there started higher, but the selling resumed by midmorning, led by small-caps as they extended Tuesday's selloff.
-
00:50
Japan: Trade Balance Total, bln, March 797 (forecast 498)
-
