Notícias do Mercado
-
23:01
EUR/USD holds steady around 1.0980 as upbeat US PMIs ease recession fears
- S&P Global PMI figures ease recessionary fears, boost US economy.
- Traders’ moods fluctuating to risk-on/off dominated the New York session.
- EU’s PMI results are mixed; manufacturing activity shranks, while Services and Composite Indices exceed expectations.
- Markets remain cautious amid uncertain rate outlooks from the Fed and the ECB.
The EUR/USD prepares to finish the week on a higher note, though it remains below the 1.1000 figure, albeit economic data from the United States (US) bolstered the US Dollar (USD). However, late into the Wall Street close, the greenback lost strength, US equities rose, and the Euro (EUR) recovered some ground. Hence, the EUR/USD is trading at 1.0988 after reaching a low of 1.0937.
US business activity picked up, but not so in the EU
Sentiment across the New York (NY) session fluctuated between risk-on/off. Investors’ recessionary fears about the US were pushed away by April’s S&P Global PMI figures, which showed the economy’s resilience, despite the US Federal Reserve (Fed) 475 bps of tightening. Manufacturing and Services PMIs exceeded estimates, with the former at 50.4, above 49 expectations, while the latter jumped to 53.7 from 51.5 estimates. Therefore, the Composite Index aimed higher to 53.5.
The market initially reacted to buying the US Dollar, which gained some ground vs. the Euro, as it dived to 1.0942. Nevertheless, buyers moved in and lifted the EUR/USD pair, though they failed to crack the 1.1000 mark.
This happened after Thursday’s data, namely, US unemployment claims, housing data, and the Philadelphia Fed Manufacturing Index, flashed a gloomy scenario, triggering flows towards safety, except for the US Dollar.
Aside from this, on the Eurozone (EU) side, Thursday’s calendar featured a surplus in the Balance of Trader of €4.6B, better than January’s deficit of €-31.6B, which was upward revised, alongside the Consumer Confidence, which improved a tick, to -17.5 above -18.5 estimates.
On Friday, the EU’s PMI was mixed, with the Manufacturing Index at 45.5, standing at contractionary territory missing estimates, while the Services and Composite Indices exceeded the consensus, expanding.
Fed and ECB May decisions loom
Meanwhile, central bankers from both sides of the Atlantic continued their hawkish rhetoric. For one part, Federal Reserve (Fed) officials agreed that inflation is too high, though there’s a myriad of opinions regarding how much tightening is left. On the European Central Bank (ECB), the baseline was made by its ECB Chief Economist Philip Lane, with most policymakers yet undecided about lifting rates by 50 or 25 bps.
EUR/USD Technical Analysis
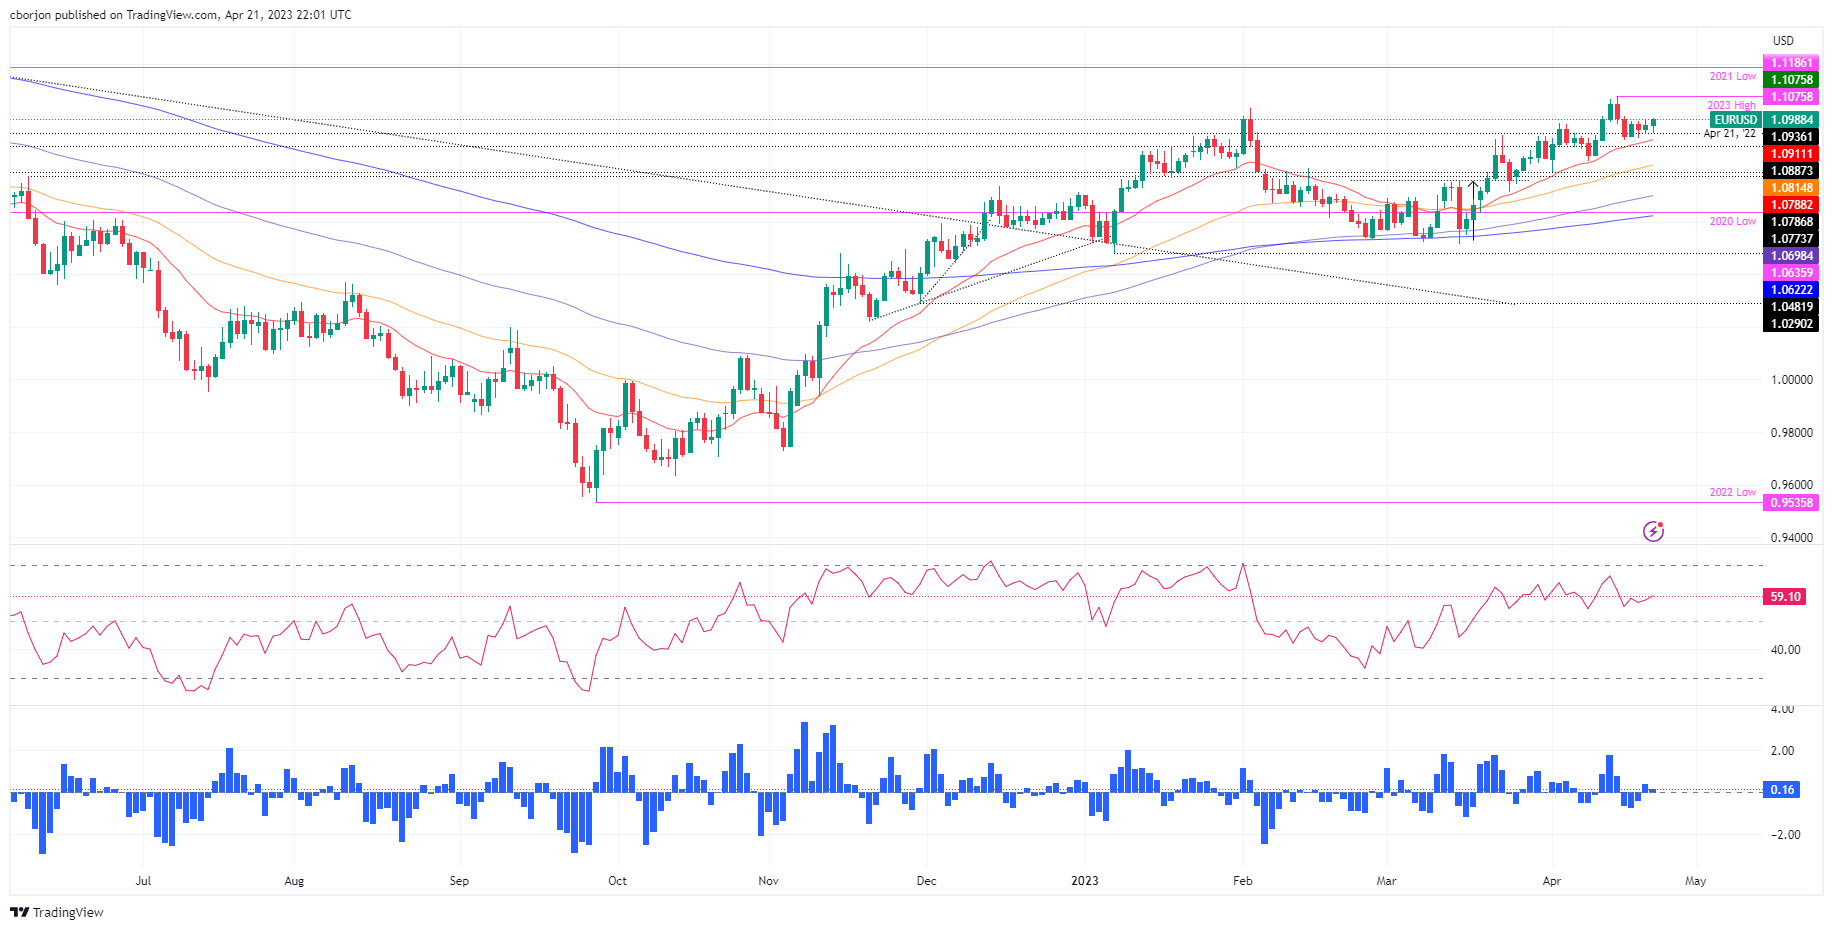
From a daily chart perspective, the EUR/USD remains supported by the 20-day EMA from March 20 until today. Yet EUR/USD tested the April 21, 2022 high-turned-support at 1.0936, bounced off, and clung to the 1.0980s area amidst the lack of an impactful catalyst that could break the EUR/USD’s trading range. Should the EUR/USD reclaim 1.1000, a test to the YTD high is on the cards, followed by 1.1100. Conversely, a fall below 1.0900 will expose the 20-day EMA at 1.0911. If EUR/USD drops below the latter, a dive to 1.0800 is likely.
-
22:04
Silver: XAG/USD drops as a doji emerge, while indicators suggest a potential pullback
- Silver price retreats after hitting daily high on upbeat US economic data.
- Upward momentum for XAG/USD remains despite recent losses.
- XAG/USD may drop unless it holds above a critical support level.
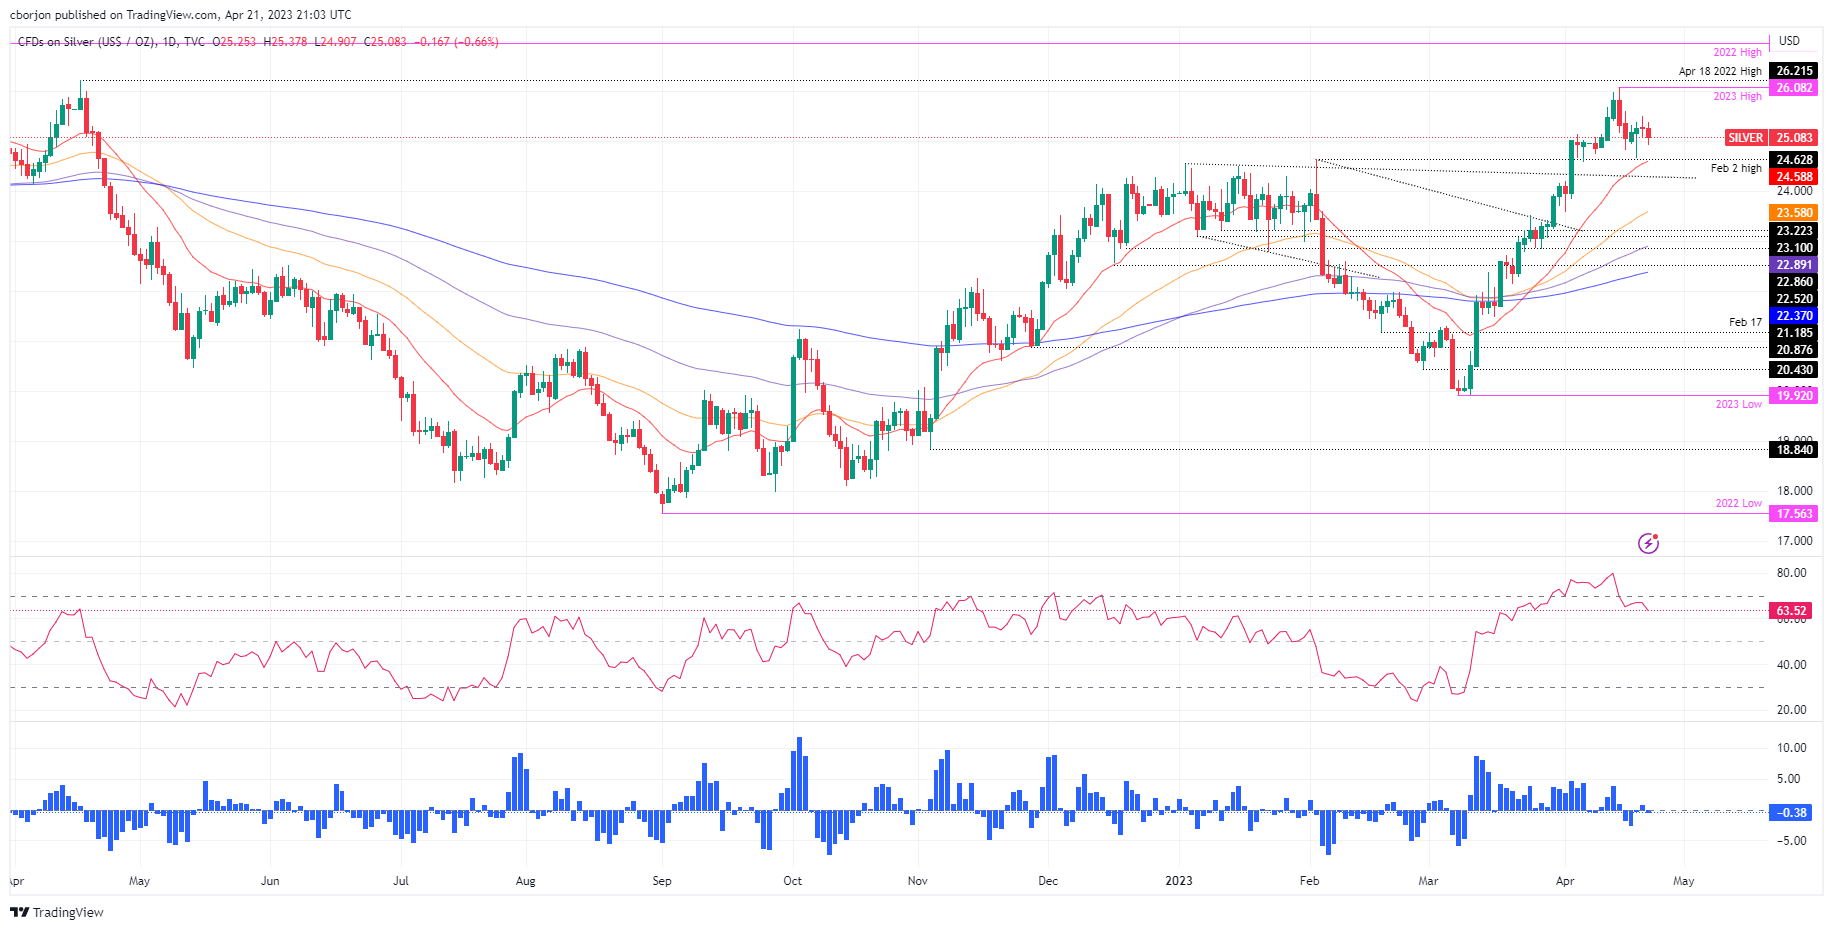
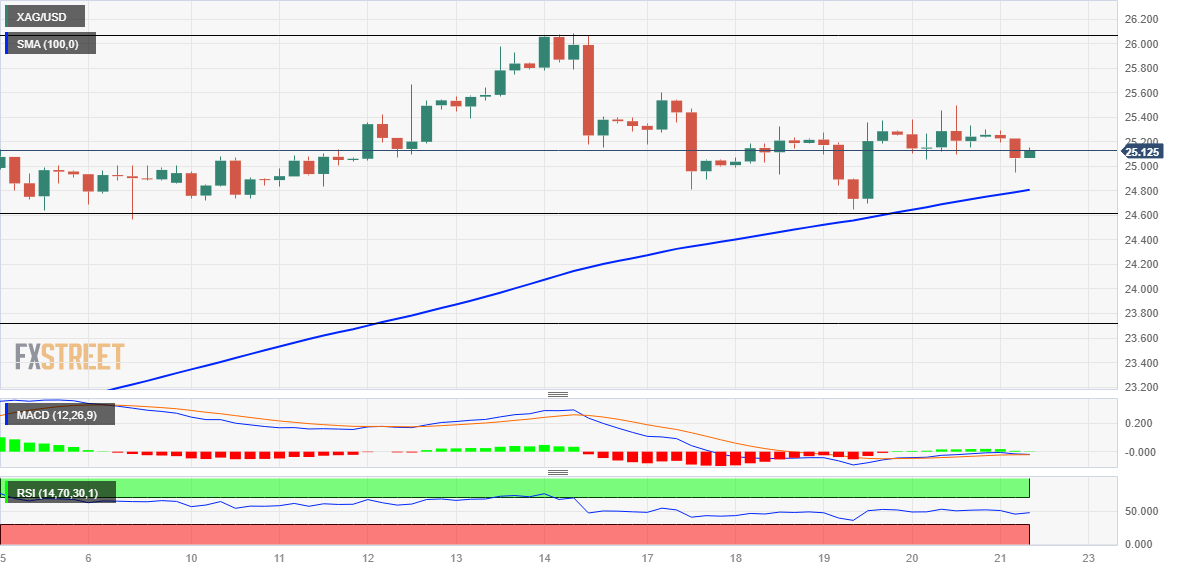
Silver price retraces after hitting a daily high of $25.37, last seen at around $25.05, as US Treasury bond yields edged up, following upbeat US economic data. At the time of writing, the XAG/USD is trading at $25.05, down 0.83%.
XAG/USD Price Analysis
XAG/USD remains upward biased, although it posted back-to-back days of losses, led by Thursday’s price action, which printed a doji, followed by a bearish candlestick, about to close below the April 20 low of $25.06. However, the uptrend remains in play unless the XAG/USD drops below the confluence of the April 19 low and the 20-day EMA around $25.58/65.
If XAG/USD clears April’s 20 high at $25.49, it could exacerbate a rally to the YTD high of $26.08. A breach of the latter will expose the last year’s high at $26.95, shy of the $27.00 figure.
Conversely, the XAG/USD could test February’s 2 high-turned-support at $24.63, immediately followed by the 20-day EMA. If the Relative Strength Index (RSI) continues to drop, as it has done since six-days ago, a test of the $24.00 figure is on the cards. Downside risks remain eyed at the 50-day EMA at
XAG/USD Daily Char
-
21:32
Australia CFTC AUD NC Net Positions fell from previous $-37.9K to $-42.4K
-
21:31
United States CFTC Oil NC Net Positions up to 244.6K from previous 235.6K
-
21:31
Japan CFTC JPY NC Net Positions climbed from previous ¥-57.2K to ¥-56.9K
-
21:31
European Monetary Union CFTC EUR NC Net Positions up to €164.4K from previous €163.3K
-
21:31
United States CFTC Gold NC Net Positions down to $189.9K from previous $192.7K
-
21:31
United States CFTC S&P 500 NC Net Positions down to $-344.3K from previous $-307.6K
-
21:31
United Kingdom CFTC GBP NC Net Positions: £1.3K vs £-2.4K
-
21:29
Canada: Signs that higher interest rates are having an impact on consumer spending – CIBC
Data released on Friday showed retail sales in Canada dropped 0.2% in February, a better-than-expected number but excluding auto fell 0.7%, more than forecast. Analysts at CIBC consider that the sluggishness in ex-auto spending is a sign that higher interest rates are having an impact. They see the Bank of Canada on hold for the rest of the year.
Key quotes:
“The start of the year surge in retail spending appears to be gradually fading, with a modest 0.2% decline in February (consensus -0.7%) estimated to be followed by a sharper 1.4% drop in March.”
“While the advance estimate for March suggests a steep 1.4% drop, that was derived from responses covering only 28% of companies normally surveyed, and as such could be heavily revised.”
“Even though the economy as a whole has performed better than expected recently, the sluggishness in ex-auto retail spending volumes is a sign that higher interest rates are indeed having an impact on consumer spending decisions, despite the excess levels of savings held by households. This sluggishness in spending should help keep goods price inflation under control (assuming supply chain issues don’t worsen again), allowing the Bank of Canada to stay on hold for the remainder of this year before gradual cuts start early in 2024.”
-
21:24
EUR/USD: Seen moving into a higher range after breaking 1.1000 – MUFG
The EUR/USD is moving with a bullish bias according to analysts at MUFG Bank. They see the pair trading in the range 1.0700 -1.1400 over the next weeks.
Key quotes:
“The EUR has continued to outperform other G10 currencies. The EUR is benefitting from the easing of last year’s negative terms of trade shock. The incoming economic data flow from the euro-zone is continuing to surprise to the upside although not as strongly as at the start of this year.”
“Fears over a sharper growth slowdown have also been eased by the quick action taken by the Swiss authorities to deal with concerns over the health of Credit Suisse that have helped reduce financial stability risks in Europe.”
“The better than expected growth outlook for the euro-zone economy is putting pressure on the ECB to raise rates further. We still expect the ECB to step down the pace of hikes at their next policy meeting on 4th May by delivering a 25bps hike but one can’t rule out another larger 50bps hike.”
“We expect EUR/USD to move up into a higher trading range after breaking above the 1.1000-level on a more sustained basis.”
-
19:49
Forex Today: Dollar rises timidly on cautious markets
Markets are on pause, awaiting catalysts. It will be the week before the central bank’s weeks. Major currency pairs are moving sideways, with a mixed US Dollar, holding on to recent losses versus EUR and GBP. The pattern could continue next week, considering that the first week of May is crucial with monetary policy decisions in Australia, the US and the Euro Zone and the US official employment report. The economic calendar is light next week, being the most relevant reports Australian and German inflation, US GDP and the monetary policy meeting in Japan. End-of-month flows could add to volatility.
Here is what you need to know for next week:
On Saturday, the Federal Reserve (Fed) blackout period begins, ahead of the May 2-3 meeting. The lack of comments from Fed officials could lead to quieter markets next week; however, there will be important economic reports. According to the CME FedWatch Tool, the odds of a 25 basis points rate hike were 88% after the US preliminary April PMI, up from 77% a week ago. It is seen as the last rate hike of the current tightening cycle.
The critical report in the US will be first-quarter GDP growth (advance estimate), with market consensus pointing to an expansion at a 3.9% annualized rate. Also important will be the Core Personal Consumption Expenditure included in the GDP report and on Friday in the Personal Income and Spending report. It is the Fed’s preferred inflation gauge.
Wall Street finished the week with modest losses, moving without a clear direction. Main indexes pulled back from monthly highs. The rally that started mid-May has run into resistance.
The US Dollar Index (DXY) rose for the first time in six weeks, but the trend is down. The DXY remains above the key 101.50 support. Since Tuesday, it has been moving sideways, as markets await the next catalysts. The Dollar benefited as market participants pared Fed rate cut bets for the third and fourth quarters.
The Japanese Yen was among the worst performers affected by higher government bond yields across the globe. The US 10-year yield settled at 3.55%, the highest weekly close since early March, but far from highs. Next week, the Bank of Japan will have its first monetary policy meeting under Kazue Ueda. No change is expected in the policy stance. Current forecasts see an adjustment to the Yield Curve Control, as early as June.
USD/JPY posted a modest weekly gain, after being rejected from above 135.00. EUR/JPY and GBP/JPY also ended with small appreciations, showing some signs of a potential reversal.
EUR/USD traded all week under 1.1000 and above 1.0900, in a modest range, ending a seven-week positive streak. The bias continues to the upside, supported by expectations of more rate hikes from the European Central Bank (ECB) and a weaker US Dollar.
Despite upbeat UK economic data (except Retail Sales) and higher-than-expected inflation numbers that boosted expectations of more tightening from the Bank of England, the Pound posted minor gains versus the Dollar. GBP/USD moved all week near 1.2400. The pair continues to move sideways. EUR/GBP pulled back a bit after surging in the previous week.
AUD/USD remains capped by the 20-week Simple Moving Average (SMA) and is unable to move away from the 0.6700 area. The relatively hawkish Reserve Bank of Australia (RBA) minutes and positive employment data from Australia failed to lift the Aussie. AUD/NZD soared for the second week in a row but was boosted by a decline in the New Zealand Dollar.
The Kiwi remained weak, affected by New Zealand Q1 inflation figures. NZD/USD posted the third weekly loss in a row, around 0.6140. The bias is to the downside, with the price looking at the 0.6100 support area. Next week, Reserve Bank of New Zealand's chief economist Paul Conway will speak about monetary policy.
USD/CAD rose more than 1% during the week climbing above 1.3500, to the 20-week SMA. The Loonie was the worst among majors, suffering from the decline in crude oil prices and the divergence between a Bank of Canada (BoC) on hold, and the rest of the central banks still raising rates.
During the week, the Brazilian Real fell the most (USD/BRL rose from 4.90 to 5.05), followed by the Colombian Peso, with USD/COP increasing 2.48%, trimming some of its recent losses.
It was a terrible week for cryptocurrencies. Bitcoin had the worst week since November; BTC/USD fell from $30,300 to $27,850. Ethereum retreated from above $2,100 to $1,880.
Gold pulled back, having the most significant weekly loss in two months, closing below $2,000. Silver also retreated and stabilized around $25.00 on Friday. Crude oil prices dropped more than 5% despite robust economic data. Uncertainty around global economic activity and interest rates weighed on the outlook for crude oil.
Like this article? Help us with some feedback by answering this survey:
Rate this content -
19:45
GBP/USD Price Analysis: Doji candlesticks around 1.2430 flashes bulls/bears’ indecision
- GBP/USD cracking 1.2400 could trigger a bearish resumption, exposing 100 and 200-day EMAs at 1.2173.
- Buyers pushing GBP/USD above 1.2400 could spark upward momentum and test YTD high at 1.2546.
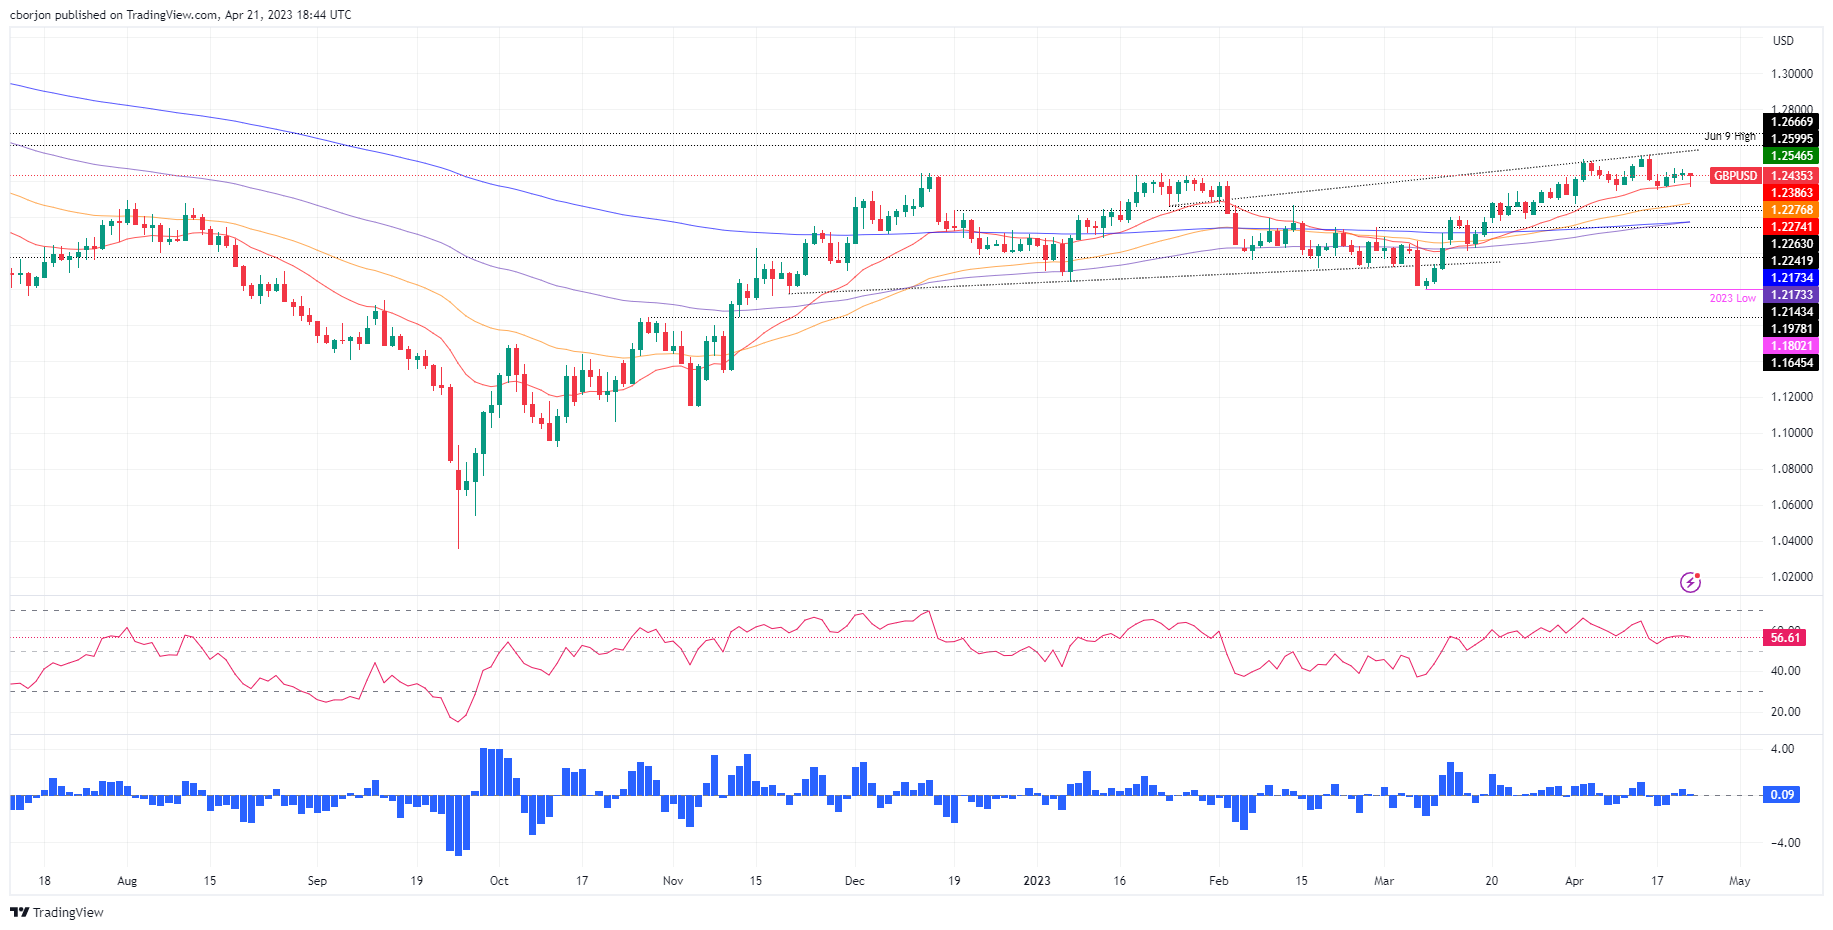
After a tranche of UK and US economic data, GBP/USD stays in sideways choppy trading, keeping the pair scrambling for direction following the last three days of uncertainty. From a technical perspective, three doji’s in a row suggests neither buyers’ nor sellers’ commitment to open fresh positions. Hence, GBP/USD is trading at 1.2439 after printing a low at 1.2367, below the 20-day Exponential Moving Average (EMA).
GBP/USD Price Action
Friday’s session was titled downwards, but since the early North American session, the GBP/USD aimed up, about to erase its earlier losses. Although the GBP/USD warrants further upside, price action in the last few days suggests buyers might be losing momentum. Indicators, like the Relative Strength Index (RSI), turned flat though tilted downwards, heading into neutral territory. At the same time, the Rate of Change (RoC) edged lower when compared to Thursday’s price action, suggesting that buying pressure is fading.
Therefore, the GBP/USD path of least resistance is downwards. The GBP/USD needs to crack the 1.2400 figure for a bearish resumption. Once cleared, the pair could dive towards the 20-day EMA at 1.2386, followed by the confluence of the April 3 low and the 50-day EMA at 1.2274/76. A breach of the latter and the GBP/USD could plunge toward the confluence of the 100 and 200-day Emas, around 1.2173.
On the flip side, if GBP/USD stays above 1.2400, it could test the April 19 cycle high at 1.2474. Buyers reclaiming the latter, upside risks will clear at 1.2500, followed by the YTD high at 1.2546.
GBP/USD Daily Chart
-
19:15
NZD/USD plunges more than 1%, hits 6-week low on improved US business activity
- US Dollar benefits from upbeat Manufacturing and Services PMIs for April.
- Fed’s Harker signals the end of rate hikes, but Mester suggests higher rates are needed.
- NZD/USD Price Analysis: Bearish biased and can test YTD lows if it dives below 0.6084.
The NZD/USD fell to six-week lows around 0.6126 as business activity in the United States (US) improved, triggering flows toward the American Dollar (USD). Therefore, the New Zealand Dollar (NZD) weakened, also undermined by lower inflation, as reported during the week. At the time of writing, the NZD/USD is trading at 0.6140, down more than 1%.
USD gains on positive PMIs, mixed signals from Fed officials; NZD/USD at risk of testing YTD lows
US equities fluctuated between gains and losses after S&P Global revealed an expansion in the US economy, bolstering the US Dollar (USD). S&P Global Manufacturing and Services PMIs for April exceed estimates above the 50 level, which usually delineates expansion/contraction in the economy. Therefore, the Composite PMI edged higher, at 53.5, above the prior reading of 52.3.
Federal Reserve officials hawkish rhetoric weighed in the NZD/USD for the third time in the week. Although the Philadelphia Fed President Patrick Harker signaled that the Fed is about to finish hiking rates, his colleague Cleveland’s Fed President Loretta Mester noted that rates should go above 5%, due to high inflationary pressures.
Given the lack of economic data from New Zealand, which reported inflation and was lower than the Reserve Bank of New Zealand (RBNZ) estimates of 1.8% QoQ, at 1.2%, could spark a pause on the RBNZ tightening cycle. The RBNZ delivered a hawkish 50 bps hike at its latest meeting.
Ahead of the week, the US economic docket will feature Fed Governor Lisa Cook as traders prepare for the weekend.
NZD/USD Technical Analysis
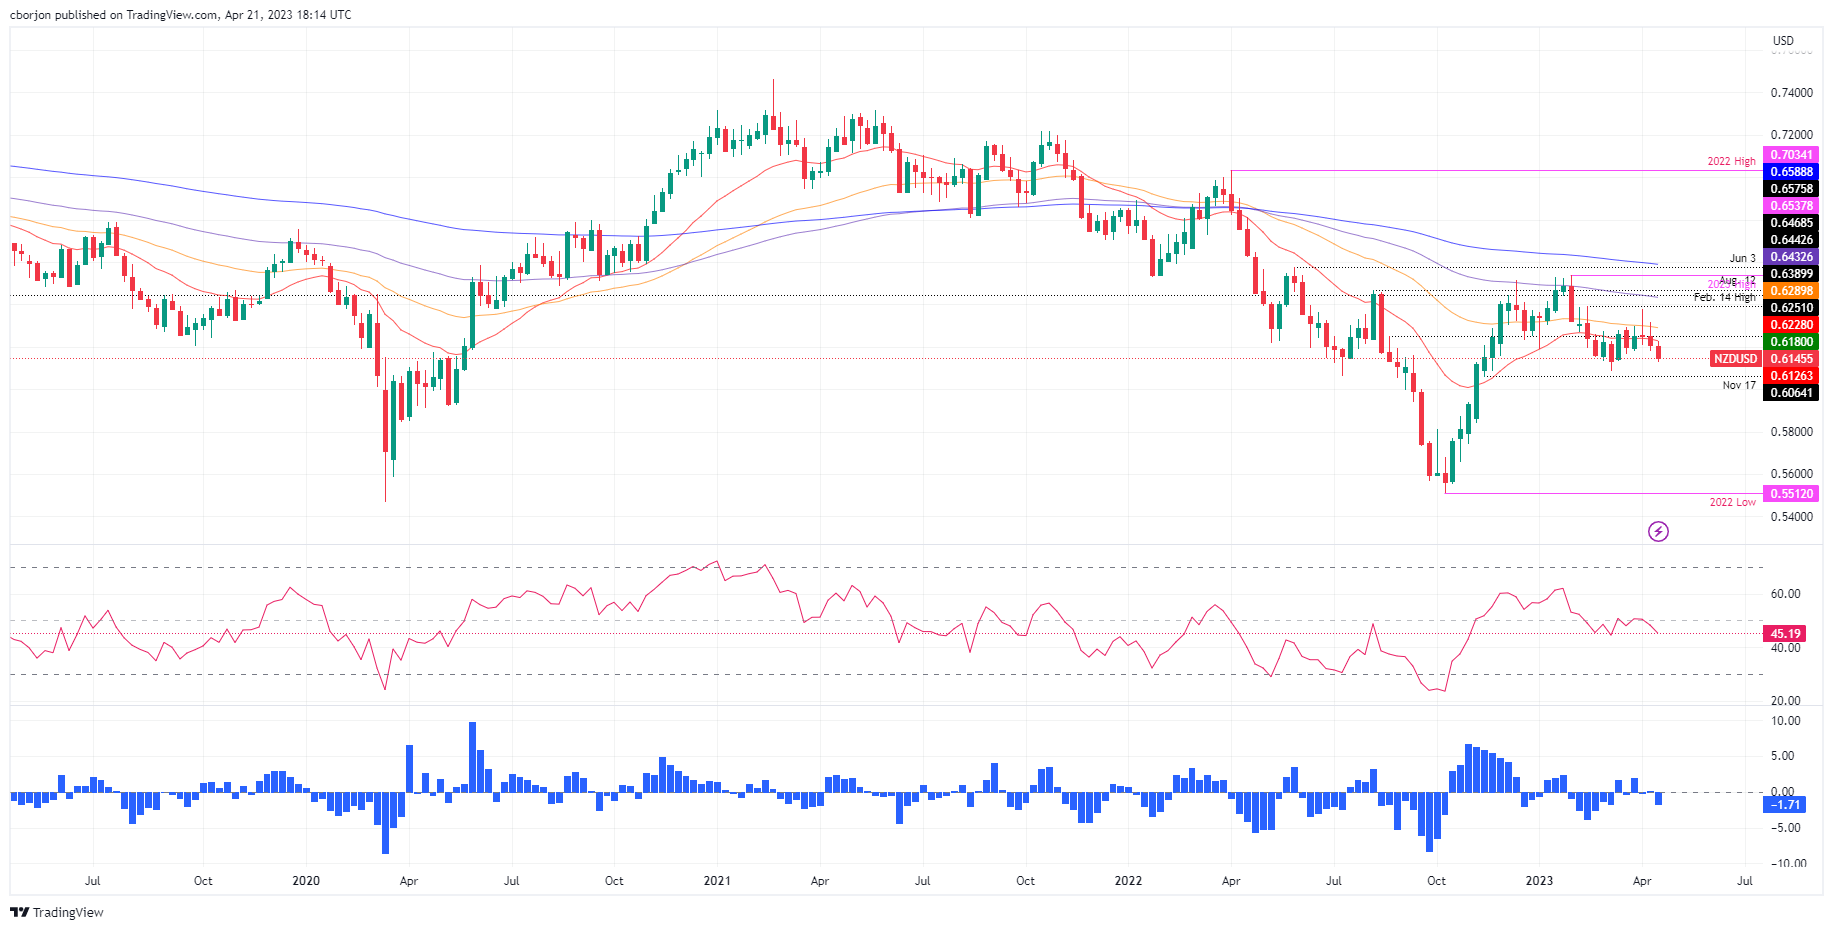
After hitting a weekly high of 0.6379, the NZD/USD formed an inverted hammer in the daily chart, suggesting that the major could be headed down. Indeed, the NZD/USD dropped below the 50 and 20-day Exponential Moving Averages (EMAs), each at 0.6289 and 0.6227, respectively. The Relative Strength Index (RSI) turned bearish while the Rate of Change (RoC) indicated that sellers were gathering momentum. Hence, the NZD/USD path of least resistance is downwards. The first support would be the 0.6100 figure, followed by March’s low of 0.6084, before testing the YTD low at 0.5912.
What to watch?
-
19:10
BoE’s Ramsden: Still signs of stubbornly high inflation – The Times
Bank of England (BoE) Deputy Governor Dave Ramsden said in an interview with The Times that the central bank must stop the risk of high inflation becoming embedded in the economy. He added there were still signs of stubbornly high inflation.
Ramsden mentioned there was a greater risk of the BoE doing too little rather than too much.
Market reaction
Ramsden comments had no impact so far on the Pound. GBP/USD is trading at a daily high late on Friday near the 1.2440 area, on its way to a modest daily gain. EUR/GBP stays flat around 0.8830.
-
18:02
United States Baker Hughes US Oil Rig Count increased to 591 from previous 588
-
17:32
USD/CAD surges above 1.3500 as US economic data trumps growth worries
- USD/CAD extended its gain in the week, bolstered by April’s PMIs reaching expansionary territory.
- The Canadian Dollar weakened as Retail Sales sank, though above estimates.
- USD/CAD Price Analysis: Bullish above 1.3520; otherwise, sellers could retest 1.3500.
The USD/CAD reclaims the 1.3500 figure, advances after optimistic economic data in the US, pushed back against worries about growth. Meanwhile, Canadian Retail Sales missed estimates, indicating a slowdown in the economy. Hence, the USD/CAD is trading at 1.3532 after traveling to a low of 1.3468.
USD/CAD underpinned by upbeat US PMIs
Wall Street continued to trade with losses after S&P Global reported that the activity of businesses in the United States (US) jumped. On its final reading, April’s S&P Global Manufacturing and Services PMIs rose above estimates at expansionary territory. Consequently, the Composite Index in the previous reading was 53.5, above 52.3.
Therefore, the USD/CAD rose sharply to the daily high above the R4 pivot point at 1.3558 before retracing to the R3 pivot at 1.3535. US bond yields edged up on growing concerns that business activity improvement could impact inflation to the upside, warranting higher interest rates.
The US Dollar Index, a gauge for the buck’s value against six currencies, erased some of its previous day losses, up 0.03%, at 101.825, a tailwind for the USD/CAD.
On Thursday, Federal Reserve policymakers continued their hawkish rhetoric. Philadelphia Fed President Patrick Harker suggested the US central bank is close to ending its campaign to control inflation. At the same time, Cleveland’s Loretta Mester believes rates should go above 5% due to high inflation. The current benchmark rate is between 4.75% and 5%.
On the Canadian front, Retail Sales for February plunged but were above forecasts of 0.6% MoM contraction, which stood at -0.2%, according to Statistics Canada. The data reinforce the Bank of Canada’s (BoC) decision to keep rates unchanged at their latest meeting.
Investors brace for further Fed tightening
The CME FedWatch Tool, which forecasts the next move of the US Federal Reserve (Fed), keeps odds at 88% for a 25 bps rate hike at the May 2-3 meeting.
The US economic docket will feature the Federal Reserve Governor Lisa Cook will cross newswires ahead of the media blackout that Fed officials would begin, ending with the Fed Chair Powell press conference on May 3.
USD/CAD Technical Analysis
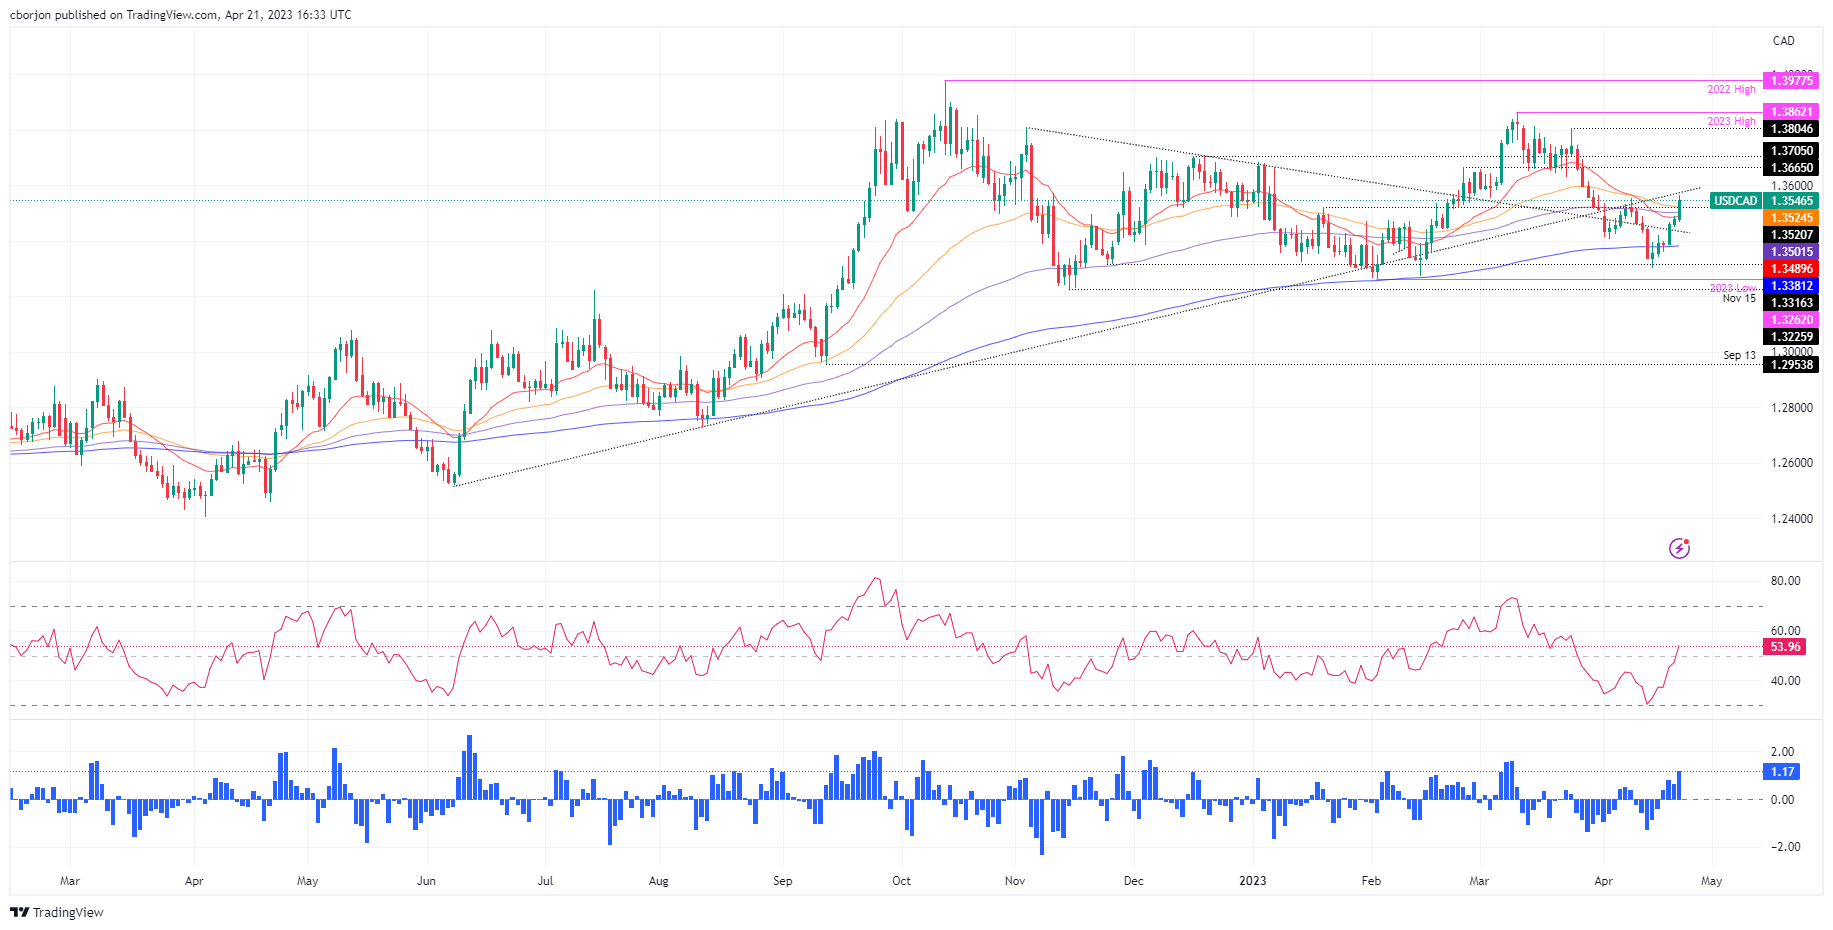
The USD/CAD extended its rally to four out of five days a week, clearing on its uptrend, the 20, 100, and 50-day Exponential Moving Averages, each at 1.3488, 1.3501, and 1.3524, respectively. The Relative Strength Index (RSI) also crossed into bullish territory, suggesting further Canadian Dollar (CAD) weakness, meaning USD/CAD upside. If USD/CAD achieves a daily close above the 50-day EMA, the pair’s next resistance would be a ten-month-old prior’s support turned resistance trendline at around 1.3560-70. Once cleared, the next resistance would be 1.3600. Conversely, the USD/CAD could dive towards the 100-day EMA at 1.3501 before extending its losses towards the 20-day EMA at 1.3488.
-
16:55
US Treasury Sec. Yellen: Banking system has stabilized in past few week
US Treasury Secretary Janet Yellen said on Friday that the US banking system has stabilized during the last few weeks. She added they continue to be vigilant and monitor conditions closely. She spoke at the Financial Stability Oversight Council Meeting, which will vote on two proposals: a framework for financial stability risk identification, assessment, and response; and a interpretive guidance on nonbank financial company designations.
Key quotes:
“Last month, the government took necessary actions to decisively manage the fallout from the failure of two regional banking institutions. Our goal was to mitigate the serious risk of contagion and protect the broader banking system and economy. The situation has stabilized in the past few weeks. And our banking system remains sound, with strong capital and liquidity positions. Of course, we continue to be vigilant and monitor conditions closely.”
“Still, these developments have reminded many of the fear and uncertainty that can accompany financial disruptions. For all in this room, I am certain that the developments underscored the importance of our work on financial stability: to continue to improve the resilience of a financial system that can support the economy through both good and bad times.”
-
16:45
Colombia Trade Balance came in at $-554.9M below forecasts ($-500M) in February
-
16:26
Colombia Trade Balance above forecasts ($-500M) in February: Actual ($-0.9M)
-
16:04
Gold Price Forecast: XAU/USD sinks below $2,000 as US PMIs improve and recession fears fade
- Gold price dives on a surprisingly positive US S&P Global PMIs.
- Improvement in business activity in the US bolstered the US Dollar.
- The US Federal Reserve is expected to hike rates by 25 bps at the May meeting – FedWatch Tool.
Gold price plunges below $2,000 and hit a daily low of $1,971.74 after the release of economic data from the United States (US) showed that the economy continues to expand, despite recent reports flashing a recession. Therefore, XAU/USD is trading at $1,982.78, losses 1.07%, at the time of writing.
US business activity picked up, Gold tumbles
S&P Global reported the final PMI readings for the US, which surprised most investors, which were caught off guard, as shown by the market’s reaction. The S&P Global Manufacturing PMI was 50.4, above 49 estimates, while the Services rose to 53.7, exceeding the consensus of 51.5. Therefore, the Composite reading was 53.5, above its previous reading.
As a result, XAU/USD spiked to $1,997.95 before tanking toward a two-day low of $1971.30, $1.5 above the S3 daily pivot point and shy of testing the weekly low of $1,968.80. Conversely, US Treasury bond yields climbed, as the report signals that inflation could rise, with 2s and 10s, gaining each three basis points, at 4.184% and 3.564%, respectively.
In the meantime, the CME FedWatch Tool, which forecasts the next move of the US Federal Reserve (Fed), keeps odds at 88% for a 25 bps rate hike at the May 2-3 meeting. Hence, the greenback is pairing some of its Thursday’s losses, as shown by the US Dollar Index (DXY), which tracks the buck’s performance vs. six peers, up at 0.14% at 101.936.
On Thursday, Federal Reserve officials crossed newswires. Philadelphia Fed President Patrick Harker suggested the US central bank is close to ending its campaign to control inflation. At the same time, Cleveland’s Loretta Mester believes rates should go above 5% due to high inflation. The current benchmark rate is between 4.75% and 5%.
Next on the agenda, the Federal Reserve Governor Lisa Cook will cross newswires ahead of the media blackout that Fed officials would begin, ending with the Fed Chair Powell press conference on May 3.
XAU/USD Technical Analysis
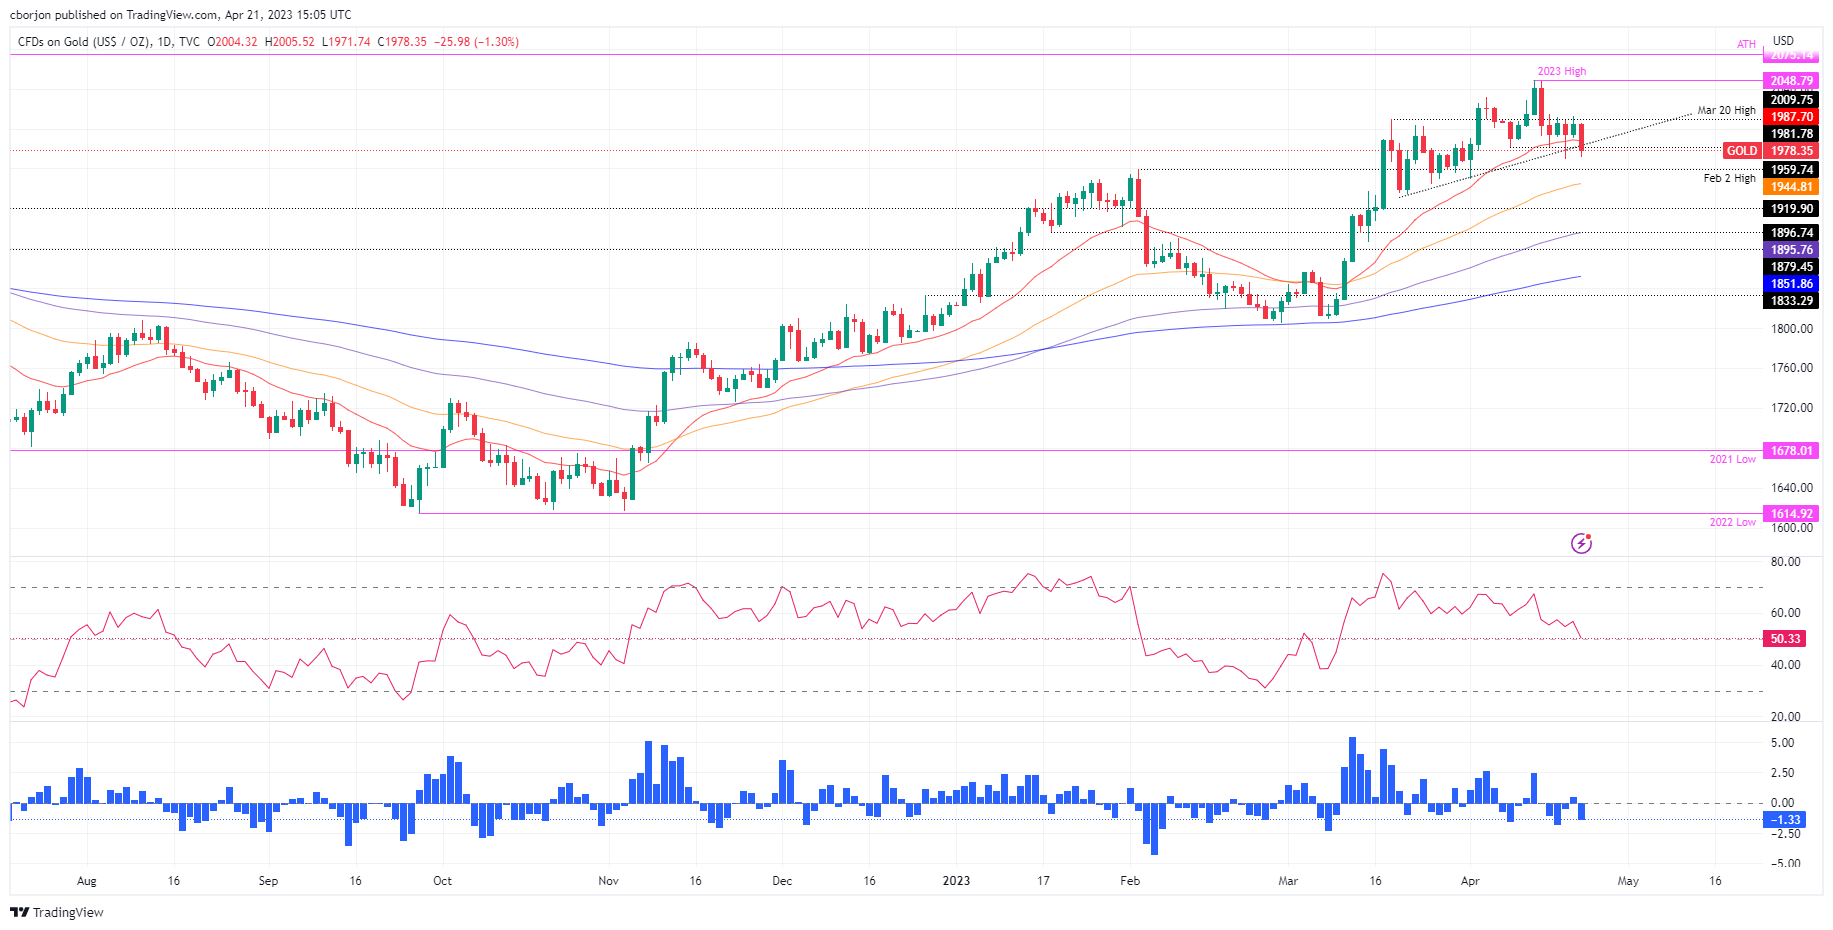
From a technical perspective, Gold finally broke below the 20-day Exponential Moving Average (EMA) at 1988.01, which could pave the way for further downside. It should be said the 20-day EMA has been dynamic support for Gold buyers, meaning that sellers must keep prices below $1,988. If XAU/USD sellers want to cement their case, a break below the weekly low of $1,969.34 could keep them on the path toward the $1,950 area before testing the 50-day EMA at $1,944.87. Otherwise, XAU’s buyers, once reclaiming $1,990, could pave the way for a retest of $2,000.
-
15:27
EUR/USD drops to 1.0940 after US PMI data
- US Dollar jumps across the board after PMI survey.
- EUR/USD retreats but holds above daily lows.
The US Dollar rose sharply across the board following the release of the S&P Global PMI, sending EUR/USD under 1.0950. The pair fell from near 1.1000 toward daily lows.
Data boosts US Dollar
“US Flash PMI data signals solid growth in private sector output as the headline figure registered an 11-month high of 53.5 in April (Mar: 52.3). Companies noted that improved demand conditions supported growth”, said S&P Global. The Composite PMI was expected at 52.8. The S&P Global Manufacturing PMI rose from 49.2 in March to 50.4 while the Service PMI from 52.6 to 53.7, both surpassing expectations.
US yields jumped to daily highs after the report. The DXY turned positive, rising toward 102.00. EUR/USD dropped from 1.0993, the highest in a week to 1.0941. The pair remained above daily lows.
Earlier on Friday, the preliminary April PMI for the Euro Zone showed mixed numbers. The Manufacturing Index dropped from 47.3 to 45.5 while the Service rose unexpectedly from 55 to 56.6. While Manufacturing hit the lowest level since May 200, the Service rose to the strongest since April 2022.
Short-term outlook
The EUR/USD weakened during the last hour but so far it stays above the 1.0920/30 area. A break lower would leave the Euro vulnerable to more losses, targeting initially the weekly low at 1.0908. The next support stands at 1.0880.
If the Euro remain above 1.0930, it would likely continue to trade sideways. The upside remains capped below 1.1000. A consolidation above 1.1000 is needed to clear the way to more gains.
Technical levels
-
15:05
USD/JPY jumps to fresh daily peak, eyes mid-134.00s on upbeat US PMI prints
- USD/JPY rebounds swiftly from the weekly low amid a fresh wave of USD buying.
- The upbeat US PMIs reaffirm bets for more Fed rate hikes and boost the Greenback.
- Spot prices remain on track to register modest gains for the second successive week.
The USD/JPY pair attracts some dip-buying in the vicinity of the 133.55 region during the early North American session and recovers its early lost ground to the weekly low. Spot prices touch a fresh daily peak, around the 134.30 region, and for now, seem to have stalled this week's retracement slide from the highest level since mid-March.
The US Dollar (USD) jumps back closer to the weekly high following the release of the US PMI prints, which, in turn, is seen as a key factor pushing the USD/JPY pair higher. In fact, S&P Global reported this Friday that business activity in the US private sector expanded at a strengthening pace in April, with the Composite PMI rising to 53.5 from 52.3 in March. Adding to this, the gauge for the manufacturing moves in the expansion territory and comes in at 50.4, while Services PMI edges higher to 53.7, also surpassing consensus estimates.
The data reaffirmed expectations that the Federal Reserve (Fed) will continue raising interest rates, which leads to a goodish intraday recovery in the US Treasury bond yields and benefits the Greenback. The Japanese Yen (JPY), however, might continue to draw support from expectations that the Bank of Japan (BoJ) could begin to phase out its massive stimulus programme later this year. The bets were lifted by the domestic consumer inflation figures released earlier this Friday, which might contribute to capping the upside for the USD/JPY pair,
Hence, it will be prudent to wait for strong follow-through buying before traders start positioning for the resumption of the recent move-up from the vicinity of mid-130.00s, or the monthly low. Nevertheless, the USD/JPY pair remains on track to end in the green for the second straight week.
Technical levels to watch
-
15:00
WTI reverses part of the weekly decline and advances past $78.00
- Prices of the WTI bounces off lows in the sub-$77.00 region.
- Crude oil snapped four consecutive weeks with gains.
- Recession fears continue to weigh on traders’ sentiment.
Prices of the barrel of the WTI manage to regain some buying interest and advance past the $78.00 mark on Friday.
WTI stronger despite USD-buying, recession risks remain
WTI prices advance for the first time this week following a sharp rejection from post-OPEC+ 2023 peaks north of the $83.00 mark (April 12). Furthermore, crude oil remains en route to close the first week with loses after four consecutive gains.
Alternating trends in the dollar seems to have lent some support to the commodity as well and despite traders remain concerned over a potential economic slowdown and its negative impact on the demand for crude oil.
The above appears equally propped up by unabated expectations of extra tightening by the Federal Reserve at the May gathering, while the positive GDP outlook in China is seen limiting the potential downside of the commodity.
Later in the session, driller Baker Hughes will publish its weekly report on US oil rig count in the week to April 21.
WTI significant levels
At the moment the barrel of WTI is up 1.18% at $78.04 and faces the next hurdle at $82.50 (200-day SMA) followed by $83.49 (2023 high April 12) and finally $92.90 (monthly high November 7 2022). On the other hand, a breach of $76.78 (wekly low April 21) would open the door to $76.30 (55-day SMA) and then $70.00 (round level).
-
14:45
United States S&P Global Services PMI came in at 53.7, above expectations (51.5) in April
-
14:45
United States S&P Global Manufacturing PMI came in at 50.4, above forecasts (49) in April
-
14:45
United States S&P Global Composite PMI above expectations (52.8) in April: Actual (53.5)
-
14:26
AUD/USD rebounds from weekly lows back above 0.6700
- US Dollar Index drops but commodity currencies are under pressure on Friday.
- Key data ahead: US S&P Global PMI
- AUD/USD is down for the day, holds above 0.6680.
The AUD/USD pair bottomed during the European session at 0.6678, the lowest level since April 12, but quickly rose above 0.6680. Recently it climbed back above 0.6700, and it continues to trim losses ahead of important US economic data.
At 13:45 GMT, the preliminary April US S&P Global PMI will be released. Those numbers will be relevant for market participants looking for clues about the economic outlook.
Ahead of the meeting, the US Dollar Index is falling 0.10%, trading at 106.80. The slide is driven by a rebound in EUR/USD and an extension of the decline in USD/JPY. The commodity currencies block is falling on Friday.
Earlier, the April PMI from Australia showed the Manufacturing Index at 48.1, below 49.1 in March, and the Service Index at 52.6, up from 48.6 in March, the highest reading since June 2022.
Short-term outlook
The pair is holding above the 0.6680 support area. If it consolidates below, the outlook would weaken for the Aussie. While above, AUD/USD is seen moving sideways.
On the upside, the Aussie needs to rise and hold above 0.6750, to strengthen the outlook. Above, the next resistance area stands at 0.6775, and the last defense to 0.6800.
Technical levels
-
14:24
GBP/USD pares intraday losses, down a little around 1.2420 ahead of US PMIs
- GBP/USD comes under some selling pressure on Friday, albeit the fall lacks bearish conviction.
- The disappointing UK Retail Sales data, mixed UK PMIs undermine the GBP and exert pressure.
- Retreating US bond yields keeps a lid on the intraday USD uptick and lends support to the pair.
The GBP/USD pair stalls its intraday decline near the 1.2375 region and recovers over 40 pips from a three-day low touched earlier this Friday. Spot prices, however, keep the red through the early North American session and currently trade around the 1.2415-1.2420 area, still down nearly 0.20% for the day.
The British Pound weakens across the board following the disappointing UK macro releases, which, along with an intraday US Dollar (USD) uptick, exert some downward pressure on the GBP/USD pair. In fact, the UK Office for National Statistics reported that domestic Retail Sales contracted by 0.9% in March and sales excluding fuel dropped by 1% during the reported month, both missing consensus estimates. Adding to this, the flash UK Manufacturing PMI delivers a negative surprise and drops further into contraction territory, to 46.6 in April, offsetting the better-than-expected Services PMI, which rose to 54.9 in April.
The USD, on the other hand, initially drew support from growing acceptance that the Federal Reserve (Fed) will continue raising interest rates. This was seen as another factor weighing on the GBP/USD pair, though the intraday downfall stalls ahead of the 1.2350 strong horizontal support. The ongoing downfall in the US Treasury bond yields, along with a modest recovery in the global risk sentiment, act as a headwind for the safe-haven Greenback. Apart from this, rising bets for an additional interest rate hike by the Bank of England (BoE) in May contribute to limiting losses for the major, at least for the time being.
The aforementioned mixed fundamental backdrop warrants some caution for aggressive traders and before positioning for a firm near-term direction. Market participants now look forward to the release of the flash US PMI prints. This, along with the US bond yields and the broader risk sentiment, will influence the USD price dynamics and allow traders to grab short-term opportunities around the GBP/USD pair.
Technical levels to watch
-
14:10
EUR/USD Price Analysis: Next on the upside emerges the 2023 peak
- EUR/USD leaves behind initial losses and approaches 1.1000.
- Further gains are seen targeting the 2023 peak near 1.1070.
EUR/USD adds to Thursday’s advance and trades at shouting distance from the key 1.1000 mark.
Further consolidation should not be ruled out for the time being. The breakout of this theme exposes a probable move to 1.1000 ahead of the 2023 high at 1.1075 (April 14). On the downside, the 1.0900 zone emerges as quite a decent contention so far.
Looking at the longer run, the constructive view remains unchanged while above the 200-day SMA, today at 1.0391.
EUR/USD daily chart
-
13:44
USD Index Price Analysis: Next on the downside comes 100.80
- DXY keeps the side-lined trading well in place on Friday.
- The breakdown of this theme exposes a drop to the YTD low.
DXY trades without clear direction below the 102.00 region at the end of the week.
The index maintains the choppy activity well in place so far this week. Occasional bouts of weakness could spark a potential decline to the 2023 lows in the 100.80/75 band (April 14) ahead of the psychological support at the 100.00 mark.
Looking at the broader picture, while below the 200-day SMA, today at 106.21, the outlook for the index is expected to remain negative.
DXY daily chart
-
13:40
When are the S&P Global's flash US PMIs and how could the data affect EUR/USD?
US PMI Overview
S&P Global will release the flash version of the US Manufacturing and Services PMIs at 13:45 GMT this Friday. The gauge for the manufacturing sector is expected to remain in contraction territory for the seventh straight month and edge lower to 49 in April from 49.2 in the previous month. The Services PMI, meanwhile, is anticipated to show a slight deceleration in growth and come in at 51.5 for the current month, down from March's final reading of 52.6. Furthermore, the composite PMI is expected to show a rise in overall business activity and rise to 52.8 from 52.3 previously.
How Could It Affect EUR/USD?
Heading into the key release, the US Dollar (USD) struggles to gain any meaningful traction amid a softer tone surrounding the US Treasury bond yields. This, in turn, assists the EUR/USD pair to edge higher for the second successive day on Friday. That said, the prospects for further policy tightening by the Federal Reserve (Fed) act as a tailwind for the buck and should keep a lid on any meaningful upside for the major. A stronger US PMI print will reaffirm expectations that the US central bank might continue raising interest rates and lend support to the Greenback.
Conversely, weaker US macro data will add to worried about economic headwinds stemming from rising borrowing costs and lift bets for an imminent pause in the Fed's rate-hiking cycle. This, in turn, could lead to a further decline in the US Treasury bond yields and prompt fresh selling around the buck. Apart from this, expectations for additional rate hikes by the European Central Bank (ECB) in the coming months could underpin the shared currency, suggesting that the path of least resistance for the EUR/USD pair is to the upside.
Eren Sengezer, European Session Lead Analyst at FXStreet, offers a brief technical outlook for the major and writes: “EUR/USD failed to return within the ascending regression channel and the Relative Strength Index (RSI) indicator on the four-hour chart dropped below 50, pointing to a bearish tilt in the short-term outlook.”
Eren also outlines important technical levels to trade the EUR/USD pair: “On the downside, the 100-period Simple Moving Average aligns as key support at 1.0930. EUR/USD is yet to make a four-hour close below that level since the beginning of the latest uptrend in mid-March. 1.0900 (psychological level, static level), 1.0870 (Fibonacci 38.2% retracement of the latest downtrend) and 1.0825 (200-period SMA) could be seen as next bearish targets if 1.0930 fails. ”
“The lower limit of the ascending channel continues to act as key resistance at 1.0970 before 1.1000 (psychological level, static level) and 1.1030 (mid-point of the ascending channel),” Eren adds further.
Key Notes
• EUR/USD Forecast: Euro could weaken further once below 1.0930
• EUR/USD faces further consolidation near term – UOB
• EUR/USD Analysis: Remains confined in a range below 1.1000 ahead of Eurozone/US PMIs
About the US Manufacturing PMI
The Manufacturing Purchasing Managers Index (PMI) released by S&P Global captures business conditions in the manufacturing sector. As the manufacturing sector dominates a large part of total GDP, the manufacturing PMI is an important indicator of business conditions and the overall economic condition in the United States. Readings above 50 imply the economy is expanding, making investors understood it as a bullish for the USD, whereas a result below 50 points for an economic contraction, and weighs negatively on the currency.
About the US ISM Services PMI
The Services Purchasing Managers Index (PMI) released by S&P Global captures business conditions in the services sector. As the services sector dominates a large part of total GDP, the services PMI is an important indicator of the overall economic condition in US. A result above 50 signals is bullish for the USD, whereas a result below 50 is seen as bearish.
-
13:35
Canada: Retail Sales decline by 0.2% in February vs. -0.6% expected
- Retail Sales in Canada fell at a stronger pace than expected in February.
- USD/CAD stays in positive territory above 1.3500 after the data.
The data published by Statistics Canada showed on Friday that Retail Sales declined by 0.2% on a monthly basis following January's 1.4% increase. This reading came in better than the market expectation for a decrease of 0.6%.
Further details of the publication revealed that Retail Sales ex-Autos fell by 0.7% in the same period.
Market reaction
This report doesn't seem to be having an impact on the Canadian Dollar's valuation. As of writing, USD/CAD was up 0.4% on the day at 1.3530.
-
13:31
Canada Retail Sales (MoM) came in at -0.2%, above expectations (-0.6%) in February
-
13:30
Canada Retail Sales ex Autos (MoM) below expectations (-0.1%) in February: Actual (-0.7%)
-
13:28
India FX Reserves, USD climbed from previous $584.76B to $586.41B in April 14
-
13:28
India Bank Loan Growth increased to 15.7% in April 10 from previous 15%
-
13:05
Malaysia: Inflation eased to multi-month lows in March – UOB
UOB Group’s Senior Economist Julia Goh and Economist Loke Siew Ting review the releases of the latest inflation figures in Malaysia.
Key Takeaways
“Headline inflation decelerated for the seventh straight month to a nine-month low of 3.4% y/y in Mar (from +3.7% in Feb). The reading came in below our estimate (+3.5%) and Bloomberg consensus (+3.6%). The slowdown mainly reflected the effects of lower energy prices, high statistical comparison base a year ago, and continued subsidies by the government as prices of most food items and services appeared to remain sticky.”
“Barring any potential changes in domestic price and subsidy policy, we believe the existing disinflationary process will persist throughout the remaining months of the year. But the pace of easing may be more moderate than previously anticipated given the stickiness of core inflation, which has surpassed headline inflation for a sixth consecutive month and implying resilience of domestic demand. We reiterate our 2023 full-year inflation projection of 2.8% (BNM est: 2.8%-3.8%, 2022: 3.3%) with the government’s gradual subsidy rationalization, international commodity price movement, exchange rate fluctuation, extreme weather conditions and stronger demand post China’s reopening serving as key wildcards for the outlook.”
“Backed by sticky core inflationary pressures, still positive domestic growth momentum and domestic financial stability, we continue to see room for Bank Negara Malaysia (BNM) to further normalize its monetary policy back to prepandemic level. Hence, we keep our view for a final interest rate hike of 25bps at the 2-3 May monetary policy meeting, which will take the Overnight Policy Rate (OPR) back to the pre-pandemic level of 3.00%. Thereafter, BNM will leave the OPR unchanged for the rest of the year, in cognizant of a softer inflation outlook globally in 2H23, an expected end to global rate hike cycle by mid2023, and rising recession risks in advanced economies.”
-
13:02
EUR/JPY Price Analysis: Tough resistance aligns around 148.00
- EUR/JPY adds to the pessimism seen in the second half of the week.
- The surpass of 148.00 could expose a move to the 2022 high.
EUR/JPY extends further the corrective decline after faltering near the 148.00 hurdle earlier in the session.
Despite the ongoing knee-jerk, further gains in the cross remain in store for the time being. That said, the continuation of the upside momentum should challenge 148.00 once again, while the breakout of this level could pave the way for a probable visit to the 2022 peak at 148.40 (October 21).
So far, further upside looks favoured while the cross trades above the 200-day SMA, today at 142.24.
EUR/JPY daily chart
-
12:56
USD/CNH: Gains expected to accelerate above 6.9350 – UOB
In the view of UOB Group’s Markets Strategist Quek Ser Leang and Senior FX Strategist Peter Chia, USD/CNH could see its upside gather extra impulse on a breakout of the 6.9350 level.
Key Quotes
24-hour view: “We highlighted yesterday that USD ‘could retest the 6.9100 level before a more sustained pullback is likely’. However, USD traded in a relatively quiet manner between 6.8745 and 6.9026. The price actions appear to be part of a consolidation and today, we expect USD to trade in a range of 6.8700/6.9000.”
Next 1-3 weeks: “Our update from yesterday (20 Apr, spot at 6.8920) still stands. As highlighted, upward momentum is beginning to improve but USD has to break and stay above 6.9350 before a sustained rise is likely. The chance of USD breaking clearly above 6.9350 is not high for now but it will remain intact as long as the ‘strong support’ level at 6.8600 is not taken out in the next few days."
-
11:53
Gold Price Forecast: XAU/USD keeps the red below $2,000 amid modest US Dollar strength
- Gold price meets with a fresh supply on Friday and drifts back closer to the $1,980 level.
- Bets for more rate hikes by Federal Reserve underpin the US Dollar and exert pressure.
- Sliding US bond yields caps gains for the USD and lends support amid a softer risk tone.
Gold price comes under renewed selling pressure on the last day of the week and maintains its heavily offered tone through the first half of the European session. The XAU currently trades just above the $1.980 level, down over 1% for the day, and remains well within the striking distance of over a two-week low touched on Wednesday.
Renewed US Dollar buying weighs on Gold price
Growing acceptance that the Federal Reserve (Fed) will continue raising interest rates assists the US Dollar (USD) to catch fresh bids on Frida, which, in turn, is seen driving flows away from the US Dollar-denominated Gold price. In fact, the current market pricing indicates over an 80% chance of a 25 bps lift-off at the next Federal Open Market Committee (FOMC) in May and a small possibility of another rate hike in June. The bets were lifted by the overnight hawkish comments by Cleveland Fed President Loretta Mester, saying that the central bank still has more rate increases ahead of it.
Recession fears could help limit losses for XAU/USD
Mester, however, noted the aggressive move to boost the borrowing cost over the last year is nearing its end amid signs of an economic slowdown in the United States (US). Data released on Thursday showed that the Philadelphia Fed Manufacturing Index sank more than expected in April, to the lowest level since May 2020. Adding to this, the US Department of Labor (DOL) reported that the number of Americans filing claims for unemployment benefits unexpectedly rose to 245K during the week ended April 15. Furthermore, US Existing Home Sales also slowed substantially in March.
The data comes amid worried about economic headwinds stemming from rising borrowing costs and tempers investors' appetite for riskier assets, which is evident from a softer tone around the equity markets and might lend support to the safe-haven Gold price. The global flight to safety, meanwhile, leads to a further decline in the US Treasury bond yields and keeps a lid on any meaningful upside for the USD. This might hold back traders from placing aggressive bearish bets around the XAU/USD and turn out to be a key factor limiting the downside, at least for the time being.
Traders eye flash PMIs from the United States for fresh impetus
Market participants now look forward to the release of the flash US PMI prints, due later during the early North American session. Traders will further take cues from the US bond yields, which might influence the USD price dynamics and provide some impetus to Gold price. Apart from this, the broader risk sentiment should further contribute to producing short-term trading opportunities around the XAU/USD on the last day of the week.
Gold price technical outlook
From a technical perspective, any subsequent slide is likely to find some support near the weekly swing low, around the $1,969 region. Some follow-through selling should pave the way for an extension of the recent retracement slide from a one-year high. The Gold price might then slide towards testing the next relevant support near the $1,956-$1,955 area before eventually dropping to the monthly low around the $1,950 region.
On the flip side, the $2,010 area now seems to have emerged as an immediate strong barrier. A sustained strength beyond might trigger a fresh bout of a short-covering and lift Gold price beyond the $2,020 intermediate hurdle, towards the $2,040 horizontal resistance en route to the YTD peak, around the $2,047-$2,049 region.
Key levels to watch
-
10:53
USD/CAD clings to gains near two-week high, above 1.3500 amid modest USD strength
- USD/CAD climbs to a nearly two-week high and draws support from a combination of factors.
- The recent slump in Crude Oil prices continues to undermine the Loonie and acts as a tailwind.
- Bets for more Fed rate hikes and a softer risk tone lift the USD back closer to the weekly high.
The USD/CAD pair gains traction for the third successive day on Friday, also marking the fifth day of a positive move in the previous six, and touches a nearly two-week high, around the 1.3535 region during the first half of the European session.
Crude Oil prices languish near the monthly low amid worries that a deeper global economic downturn will dent fuel demand and undermines the commodity-linked Loonie. Apart from this, signs of cooling consumer inflation in Canada undermine the Canadian Dollar and assist the USD/CAD pair to build on its recent bounce from the 1.3300 mark, or a two-month low touched last Friday. This, along with the emergence of fresh US Dollar (USD) buying acts as a tailwind for the major.
In fact, the USD Index, which tracks the Greenback against a basket of currencies, climbs back closer to the weekly high amid growing acceptance of further policy tightening by the Federal Reserve (Fed). In fact, the markets seem convinced that the US central bank will hike rates by 25 bps in May and have been pricing in a small chance of another rate hike in June. This, along with a generally weaker tone around the equity markets, further benefits the Greenback's safe-haven status.
Friday's follow-through move-up could further be attributed to some technical buying above the 1.3500 psychological mark. This, along with the aforementioned fundamental backdrop suggests that the path of least resistance for the USD/CAD pair is to the upside. Traders now look to the flash US PMI prints, which along with the US bond yields and the broader risk sentiment, will drive the USD demand. Apart from this, Oil price dynamics should provide some impetus to the major.
Technical levels to watch
-
10:45
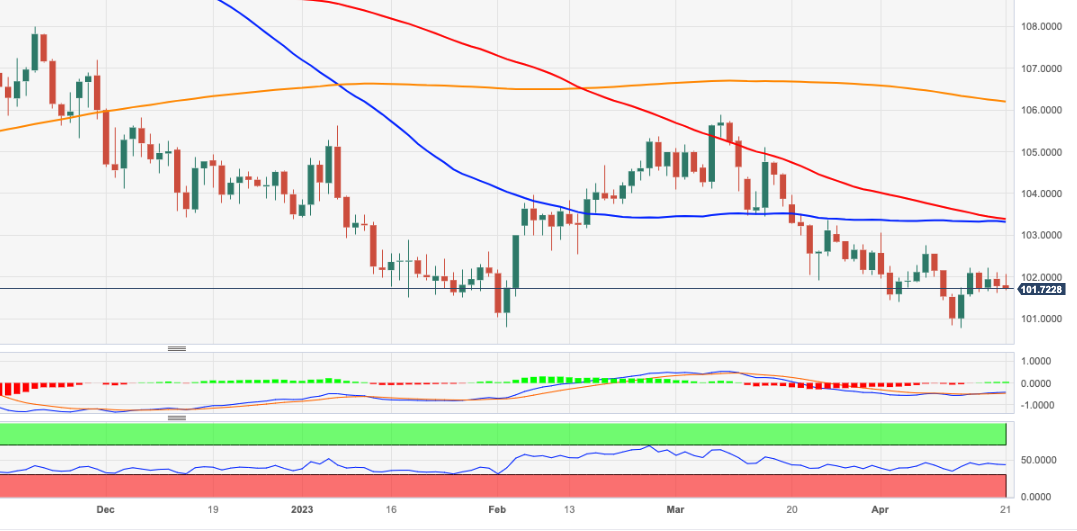
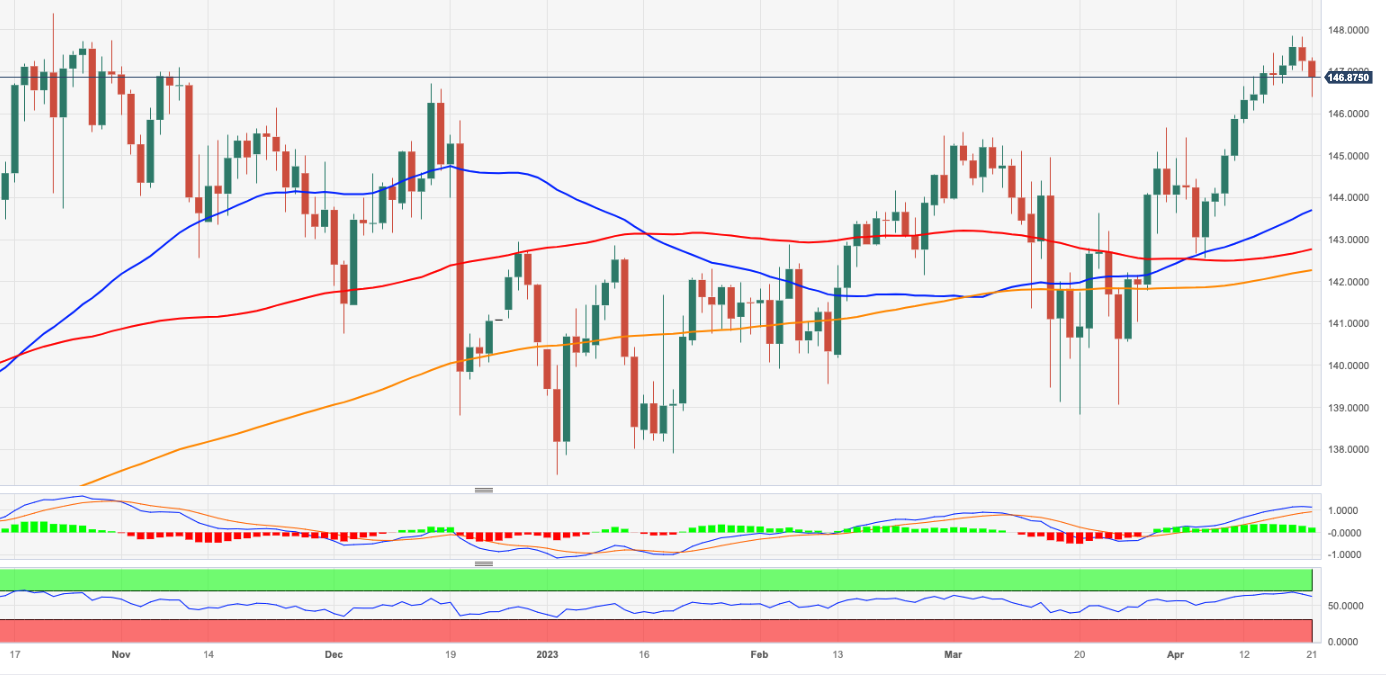
USD/JPY remains poised for extra gains near term – UOB
Further upside in USD/JPY looks likely and with the immediate target at 135.75, note UOB Group’s Markets Strategist Quek Ser Leang and Senior FX Strategist Peter Chia.
Key Quotes
24-hour view: “Yesterday, we held the view that USD ‘could test the 135.15 level before the risk of a more sustained pullback increases’. However, USD pulled back directly to a low of 134.00. The pullback in USD could extend but a break of the strong support level at 133.50 is unlikely. On the upside, a breach of 134.75 (minor resistance is at 134.40) would indicate that USD is not weakening further.”
Next 1-3 weeks: “Our update from yesterday (20 Apr, spot at 134.65) still stands. As highlighted, the bias is still towards a higher USD. The next level to aim for is a 135.75. Overall, only a break of 133.50 (no change in ‘strong support’ level) would indicate that the USD strength that started on Monday (17 Apr, spot at 133.80) has run its course.”
-
10:25
EUR/USD trades slightly on the defensive near 1.0960
- EUR/USD keeps the erratic performance well in place so far.
- Germany, EMU flash PMIs came mixed for the month of April.
- ECB’s Visco ruled out a credit crunch situation at the moment.
The single currency comes under some mild selling pressure and drags EUR/USD back to the mid-1.0900s as markets approach the European midday on Friday.
EUR/USD offered on mixed PMIs, USD-buying
EUR/USD fades Thursday’s decent advance and trades with modest losses at the end of the week against the backdrop of the persistent consolidative mood in the global markets, as catalysts for the price action remain absent.
in the meantime, the hawkish narrative from ECB’s rate setters continue to point to further tightening in May and probably June and July, as inflation – mainly de Core CPI – remains stubbornly elevated.
Still around the ECB, Board member Visco called for some prudence when it comes to price in further interest rate increases, while his colleague De Guindos showed some confidence in that core prices will eventually lose traction, at the time when he reiterated that future decisions on the interest rate will remain data dependent.
In the domestic calendar, advanced Manufacturing PMIs in Germany and the euro area are expected to drop to 44 and 45.5, respectively, in April. On the opposite side, flash Services PMIs are seen improving to 55.7 and 56.6, respectively.
Across the ocean, advanced Manufacturing and Services PMIs are also due along with the speech by FOMC’s L. Cook.
What to look for around EUR
EUR/USD keeps the range bound trade well in place always below the 1.1000 region so far on Friday.
Meanwhile, price action around the single currency should continue to closely follow dollar dynamics, as well as the incipient Fed-ECB divergence when it comes to the banks’ intentions regarding the potential next moves in interest rates.
Moving forward, hawkish ECB-speak continue to favour further rate hikes, although this view appears in contrast to some loss of momentum in economic fundamentals in the region.
Key events in the euro area this week: Advanced Manufacturing/Services PMIs (Friday).
Eminent issues on the back boiler: Continuation (or not) of the ECB hiking cycle. Impact of the Russia-Ukraine war on the growth prospects and inflation outlook in the region. Risks of inflation becoming entrenched.
EUR/USD levels to watch
So far, the pair is losing 0.05% at 1.0959 and faces the next support at 1.0831 (monthly low April 10) seconded by 1.0788 (monthly low April 3) and finally 1.0760 (55-day SMA). On the upside, a break above 1.1075 (2023 high April 14) would target 1.1100 (round level) en route to 1.1184 (weekly high March 21 2022).
-
10:10
EUR/GBP sticks to gains near multi-day top, just below mid-0.8800s post-Eurozone/UK PMIs
- EUR/GBP scales higher for the second straight day and climbs back closer to the weekly high.
- The dismal UK Retail Sales data is weighing on the GBP and acts as a tailwind for the cross.
- The mixed PMI prints from the Eurozone and the UK fail to provide any meaningful impetus.
The EUR/GBP cross gains positive traction for the second successive day on Friday and touches a four-day high, around the 0.8840-0.8845 region during the first half of the European session.
The British Pound’s relative underperformance on the last day of the week follows the disappointing release of the UK monthly Retail Sales figures and the mixed UK PMI prints. In fact, the UK Office for National Statistics reported that domestic Retail Sales contracted by 0.9% in March and sales excluding fuel dropped by 1% during the reported month, both missing consensus estimates.
Adding to this, the flash UK Manufacturing PMI delivers a negative surprise and drops further into contraction territory, to 46.6 in April. The weaker reading, to a larger extent, was offset by the better-than-expected Services PMI, which rose to 54.9 in April. This, however, fails to impress the GBP bulls or hinder the intraday positive move for the EUR/GBP cross, at least for the time being.
The shared currency, on the other hand, reacts little to the preliminary Eurozone PMI print. The data, meanwhile, indicated that the Eurozone economy is holding up fairly, which should allow the European Central Bank to push forward with its policy tightening. This, in turn, is seen as another factor pushing the EUR/GBP cross higher and remains supportive of the move up.
That said, rising bets for an additional interest rate hike by the Bank of England (BoE) might hold back traders from placing aggressive bullish bets around the EUR/GBP cross. In fact, the markets now see over a 90% chance of a 25-bps rate hike in May and the bets were lifted by the stronger UK consumer inflation figures released on Thursday. This, in turn, could cap any further gains.
Technical levels to watch
-
09:32
Hong Kong SAR Consumer Price Index came in at 1.7%, below expectations (1.8%) in March
-
09:32
UK Preliminary Services PMI unexpectedly jumps to 54.9 in April
- UK Manufacturing PMI contracts to 46.6 in April, a negative surprise.
- Services PMI in the UK comes in at 54.9 in April, a positive surprise.
- GBP/USD defends 1.2400 on divided UK business PMIs.
-
09:30
United Kingdom S&P Global/CIPS Services PMI came in at 54.9, above forecasts (52.9) in April
-
09:30
United Kingdom S&P Global/CIPS Manufacturing PMI below forecasts (48.5) in April: Actual (46.6)
-
09:30
United Kingdom S&P Global/CIPS Composite PMI came in at 53.9, above forecasts (52.5) in April
-
09:22
Euro trades in mid 1.09s, lifted slightly by PMI data
- Euro vs US Dollar trades in the mid 1.09s, rising slightly after the release of euro area S&P Global PMIs.
- Euro further supported by comments from ECB’s Lagarde that Governing Council “still has some way to go.”
- US Dollar pressured after poor labor and manufacturing data on Thursday.
The Euro (EUR) snakes along in the mid 1.09s against its biggest counterpart, the US Dollar (USD), during the early European session on Friday. With the banking crisis now seemingly in the rear-view mirror the focus is back on the fight with inflation, and both currencies are benefiting from expectations of higher interest rates. More broadly, the EUR/USD pair appears to be undergoing a correction after making new year-to-date highs of 1.1075 on April 14.
From a technical perspective, the Euro-Dollar pair is in a medium-term uptrend which is expected to continue once the correction has finished. Scoping in, the steadily diminishing volatility on intraday charts is tracing out a triangle pattern, which suggests there will be a breakout move on the horizon.
EUR/USD Market Movers
- The Euro rallies intraday after S&P Global Services PMI showed an unexpected gain, coming out at 56.6 when a fall to 54.5 had been forecast. Manufacturing still lags, however, showing a contraction to 45.5.
- The single currency gains further support after European Central Bank (ECB) President Lagarde says that there is still “some way to go” before the ECB finishes hiking interest rates.
- USD drops a touch after US data disappoints, with 5K more Initial Jobless Claims than expected and the Philadelphia Fed Manufacturing Survey hitting its lowest point for almost three years.
- Nevertheless, the most recent major US economic report, the Fed’s Beige Book, states, “Economic activity was little changed in recent weeks.” Indicating stability.
- USD continues to benefit from policymakers like St. Louis Fed’s Bullard talking up further rate hikes due to persistent inflation and overblown recession fears.
- Unexpectedly strong first quarter earnings from US megabanks draws attention away from the sector’s March crisis, further supporting the Greenback.
- The Euro remains underpinned by expectations that the ECB will continue with interest rate hikes, though their size is up for debate.
- European Central Bank’s chief economist Philip Lane has said the health of the region’s banks, as reported in the ECB Bank Lending Survey (BLS) (out on May 2), will be a key determinant of whether the ECB hikes aggressively or not.
- Lane further sees April HICP (also released May 2) inflation as likewise key to determining the next hike.
- Friday’s calendar shows a speech by ECB vice president De Guindos at 17:45.
- For USD the calendar’s highlights include are S&P Global PMI’s at 13:45 GMT.
EUR/USD technical analysis: Triangle in an uptrend
EUR/USD has been posting higher lows and higher highs since the September 2022 lows, and this medium-term uptrend is likely to continue. Following a correction in February 2023, EUR/USD recouped its losses in March and made new year-to-date highs above 1.1000 on April 13.
-638176618097210287.png)
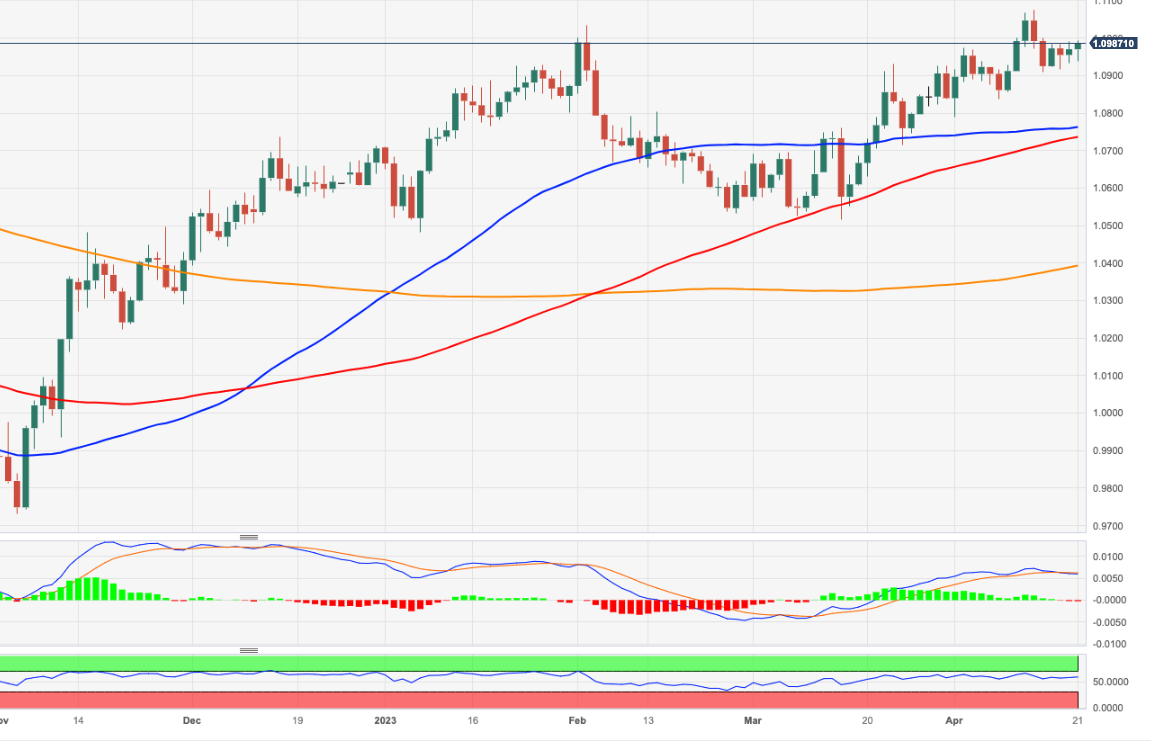
EUR/USD: Daily ChartDrilling down to the 4-hour chart (below) and price action looks to be tracing out a triangle price pattern which will eventually break out either higher or lower. Triangles are usually composed of five waves. This one now looks complete. If so, then a breakout is likely close at hand.
-638176618541744770.png)
EUR/USD: 4-hr ChartThe Chaikin Money Flow oscillator, is an indicator that is supposed to help give clues as to the eventual direction of a breakout from a range bound market, and it has kept below the zero-line during most of the evolution of the triangle, suggesting a slight bias towards expecting a downside break.
That said, the triangle has a flatter top suggesting it might be of the right-angled variety with a slight bullish bias.
Either way, if price pierces below the 1.0917 lows it will probably confirm a downside breakout, with a target at around 1.0850. Alternatively, a breach of 1.0990 high would confirm an upside breakout, which would likely retouch the 1.1075 year-to-date highs.
Taking a bigger-picture perspective, a break and daily close above the 1.1075 year-to-date highs of April 14 would indicate the overarching uptrend was kicking off again and suggest a move up to the next key resistance level at around 1.1190, where the 200-week Simple Moving Average (SMA) is situated.
For bears, a break and close below the important lower high at 1.0830 would bring into doubt the validity of the uptrend and could see losses extend down to a confluence of support at 1.0775-1.0800, and a possible reversal of the dominant trend.
Euro FAQs
What is the Euro?
The Euro is the currency for the 20 European Union countries that belong to the Eurozone. It is the second most heavily traded currency in the world behind the US Dollar. In 2022, it accounted for 31% of all foreign exchange transactions, with an average daily turnover of over $2.2 trillion a day.
EUR/USD is the most heavily traded currency pair in the world, accounting for an estimated 30% off all transactions, followed by EUR/JPY (4%), EUR/GBP (3%) and EUR/AUD (2%).What is the ECB and how does it impact the Euro?
The European Central Bank (ECB) in Frankfurt, Germany, is the reserve bank for the Eurozone. The ECB sets interest rates and manages monetary policy.
The ECB’s primary mandate is to maintain price stability, which means either controlling inflation or stimulating growth. Its primary tool is the raising or lowering of interest rates. Relatively high interest rates – or the expectation of higher rates – will usually benefit the Euro and vice versa.
The ECB Governing Council makes monetary policy decisions at meetings held eight times a year. Decisions are made by heads of the Eurozone national banks and six permanent members, including the President of the ECB, Christine Lagarde.How does inflation data impact the value of the Euro?
Eurozone inflation data, measured by the Harmonized Index of Consumer Prices (HICP), is an important econometric for the Euro. If inflation rises more than expected, especially if above the ECB’s 2% target, it obliges the ECB to raise interest rates to bring it back under control.
Relatively high interest rates compared to its counterparts will usually benefit the Euro, as it makes the region more attractive as a place for global investors to park their money.How does economic data influence the value of the Euro?
Data releases gauge the health of the economy and can impact on the Euro. Indicators such as GDP, Manufacturing and Services PMIs, employment, and consumer sentiment surveys can all influence the direction of the single currency.
A strong economy is good for the Euro. Not only does it attract more foreign investment but it may encourage the ECB to put up interest rates, which will directly strengthen the Euro. Otherwise, if economic data is weak, the Euro is likely to fall.
Economic data for the four largest economies in the euro area (Germany, France, Italy and Spain) are especially significant, as they account for 75% of the Eurozone’s economy.How does the Trade Balance impact the Euro?
Another significant data release for the Euro is the Trade Balance. This indicator measures the difference between what a country earns from its exports and what it spends on imports over a given period.
If a country produces highly sought after exports then its currency will gain in value purely from the extra demand created from foreign buyers seeking to purchase these goods. Therefore, a positive net Trade Balance strengthens a currency and vice versa for a negative balance. -
09:18
Silver Price Analysis: XAG/USD trades with modest losses around $25.00, downside seems limited
- Silver drifts lower on the last day of the week, though lacks any follow-through selling.
- The technical setup still favours bullish traders and supports prospects for further gains.
- A convincing break below the $24.40-30 area is needed to negate the positive outlook.
Silver comes under some selling pressure on the last day of the week and extends its steady intraday descent through the first half of the European session. The white metal slips below the $25.00 psychological mark, though manage to hold its neck above the 100-period Simple Moving (SMA) on the 4-hour chart.
Technical indicators on the 4-hour chart have just started gaining negative traction, though are holding comfortably in the bullish territory on the daily chart. This, in turn, supports prospects for the emergence of some dip-buying at lower levels and suggests that the path of least resistance for the XAG/USD is to the upside. Hence, any subsequent slide is more likely to find decent support near the 23.6% Fibonacci retracement level of the March-April rally, around the $24.65 zone.
This is followed by the $24.40-$24.30 strong horizontal resistance breakpoint, now turned support, which if broken might negate the positive outlook and shift the near-term bias in favour of bearish traders. The XAG/USD might then turn vulnerable to weaken further below the $24.00 mark and test the 38.2% Fibo. level. Some follow-through selling should pave the way for an extension of the recent pullback from a one-year high, around the $26.10 region touched last week.
On the flip side, the $25.50-$25.60 region now seems to have emerged as an immediate strong resistance, above which the XAG/USD is likely to make a fresh attempt to conquer the $26.00 mark. Some follow-through buying will mark a fresh bullish breakout and set the stage for a further near-term appreciating move.
Silver 4-hour chart
Key levels to watch
-
09:08
BoJ likely to maintain dovish policy guidance next week – Reuters
Citing four people familiar with the Bank of Japan’s (BoJ) thinking, Reuters reported on Friday that the Japanese central bank is likely to maintain the ultra-loose monetary policy, by making no change to interest rate targets and yield allowance band, at next week's meeting.
“The BoJ likely to maintain dovish policy guidance, may discuss tweaking reference on COVID-19 impact in coming meetings,” the sources added.
Market reaction
At the time of writing, USD/JPY is battling 134.00, having reversed losses from daily lows of 133.71. The above headlines could help the rebound in the major.
-
09:02
Eurozone Preliminary Manufacturing PMI declines to 45.5 in April vs. 48.0 expected
- Eurozone Manufacturing PMI arrives at 45.5 in April vs. 48.0 expected.
- Bloc’s Services PMI climbs to 56.6 in April vs. 54.5 expected.
- EUR/USD recovers ground above 1.0950 despite the mixed Eurozone PMIs.
The Eurozone manufacturing sector activity unexpectedly contracted further in April, the latest manufacturing activity survey from S&P Global research showed on Friday.
The Eurozone Manufacturing Purchasing Managers Index (PMI) arrived at 45.5 in April vs. 48.0 expected and 47.3 previous. The index reached a 35-month low.
The bloc’s Services PMI advanced to 56.6 in April vs. 54.5 forecasts and March’s 55.0, hitting a 12-month high.
The S&P Global Eurozone PMI Composite jumped to 54.4 in April vs. 53.7 expected and 53.7 previous. The measure recorded a new 11-month high.
FX implications
EUR/USD erases losses to trade at 1.0965 following the release of the mixed Eurozone PMIs.
-
09:00
European Monetary Union S&P Global Manufacturing PMI below forecasts (48) in April: Actual (45.5)
-
09:00
European Monetary Union S&P Global Services PMI above expectations (54.5) in April: Actual (56.6)
-
09:00
European Monetary Union S&P Global Composite PMI registered at 54.4 above expectations (53.7) in April
-
09:00
European Monetary Union S&P Global Services PMI below expectations (54.5) in April: Actual (54.4)
-
09:00
US PMIs: Analyzing April S&P Global Composite release
- April S&P Global Manufacturing and Services PMIs preliminary releases are seen declining after the previous jump.
- Big deviations to the data are likely to ramp up volatility and impact the Federal Reserve pricing.
- EUR/USD bulls stay hopeful whilst above 1.0900 ahead of the release, eyeing the 1.1000 mark.
S&P Global Purchasing Managers Index (PMI) measures private sector business activity in major economies on a monthly basis and in advance of comparable official economic data. On Friday, April 21, the company will unveil the April preliminary estimates of manufacturing PMI and services PMI for the United States (US).
Global businesses are still trying to recover from the pandemic-related setback that saw the world come to a halt three years ago. It has been a bumpy road, with back and forths in the middle, but central bank decisions to tighten their monetary policies took its toll on businesses, with activity contracting for most of 2022.
In March, however, business activity in the United States unexpectedly rebounded, as demand surged, especially in the services industry. The S&P Global preliminary US Composite PMI jumped to 53.3 in March, up from 50.1 in February. The Services PMI Index rose to 53.8 from 50.6, while the Manufacturing PMI climbed to 49.3 from 47.3.
Despite the encouraging resurgence in business activity last month, Chris Williamson, Chief Business Economist at S&P Global Market Intelligence, warned that inflation remains a nagging issue, adding that “the purchasing managers surveyed indicated that selling prices were increasing at a quicker rate despite lower costs in the manufacturing sector and that the services sector is also raising prices, mainly as a result of faster wage growth.”
What to expect in the next S&P Global PMI report?
The gauge for manufacturing PMI is expected to decline to 49.0 in April, compared with the final readout of 49.2 recorded in March.
The services PMI, meanwhile, is anticipated to slow its pace of expansion, arriving at 51.5 in April vs. the previous month’s final print of 52.6.
However, the composite PMI is expected to increase to 52.8 in the current month, as against the final March figure of 52.3.
When will be April flash US S&P Global PMIs report released and how could it affect EUR/USD?
The S&P Global PMI report is scheduled for release at 13:45 GMT, on April 21. Ahead of the key release, the US Dollar is struggling to extend its recovery momentum, keeping the sentiment around the EUR/USD pair buoyed. A stronger US PMI print will confirm a 25 basis points (bps) Federal Reserve rate hike in May while deferring rate cut expectations toward the end of this year. At the time of writing, markets are pricing an 82% probability of a quarter percentage point Fed rate hike next month, with rate cuts seen as early as July.
On the other hand, weaker US business activity data will accentuate concerns about the US economy dipping into a recession, which could fuel Fed rate cuts bets. The US Dollar is likely to show resilience in the face of the dovish Fed outlook, as it will continue to benefit the Greenback's relative safe-haven status.
The divergent monetary policy outlooks between the Federal Reserve and European Central Bank (ECB) suggest that the path of least resistance for the EUR/USD pair appears to be the upside. That said, any immediate market reaction could peter out, as the end-of-the-week flows could come into play. It is worth noting that the Fed policymakers enter their ‘blackout period’ from April 22 ahead of the May 2-3 policy meeting, and therefore, the last words from the officials could also have a significant impact on the US Dollar valuations. This, in turn, warrants some caution for aggressive traders and before positioning for a firm near-term direction.
Yohay Elam, Senior Analyst at FXStreet, explains how the US Dollar could react to the data, “If the S&P Global PMIs, and especially the Services PMI, miss expectations, concerns about a downturn could take over. When the US economy sneezes, the rest of the world catches a cold – rushing to the safety of the US Dollar,”
“Conversely, if the figures beat estimates, investors may fear a tougher stance from Fed officials. While a 25 bps hike in May is priced in, another one in June is still uncertain. Any figure that would raise the chances of another increase in borrowing costs could push expectations higher, further boosting the Greenback,” Yohay adds.
Meanwhile, Dhwani Mehta, Asian Session Lead Analyst at FXStreet, offers a brief technical outlook for the EUR/USD pair and writes: “the bull-bear tug-of-war is likely to extend, as the pair continues to waver in a tight range at around 1.0950. The 14-day Relative Strength Index (RSI) is holding above the midline, offering an edge to Euro buyers while the 1.1000 mark remains a tough nut to crack for sellers heading into the US PMIs showdown.”
Dhwani also outlines important technical levels to trade the EUR/USD pair: “On the upside, a sustained move above the psychological 1.1000 level is needed to initiate a fresh upswing toward the yearly high of 1.1076. Alternatively, immediate support awaits at the bullish 21-Day Moving Average (DMA) at 1.0912, below which the 1.0850 psychological support could be tested before the bears approach the 1.0835 static support.
S&P Global PMI-related content
- Gold Price Forecast: For how long can XAU/USD defend 21 DMA? Eyes on US S&P Global PMIs
- US S&P Global PMIs Preview: Win-win situation for the Dollar? Why investors may get spooked
- EUR/USD Analysis: Remains confined in a range below 1.1000 ahead of Eurozone/US PMIs
About the US Manufacturing PMI
The Manufacturing Purchasing Managers Index (PMI) released by S&P Global captures business conditions in the manufacturing sector. As the manufacturing sector dominates a large part of total GDP, the manufacturing PMI is an important indicator of business conditions and the overall economic condition in the United States. Readings above 50 imply the economy is expanding, making investors understood it as a bullish for the USD, whereas a result below 50 points for an economic contraction, and weighs negatively on the currency.
About the US Services PMI
The Services Purchasing Managers Index (PMI) released by S&P Global captures business conditions in the services sector. As the services sector dominates a large part of total GDP, the services PMI is an important indicator of the overall economic condition in US. A result above 50 signals is bullish for the USD, whereas a result below 50 is seen as bearish.
-
08:58
ECB’s de Guindos: ECB will stick to communicating monetary policy on meeting by meeting basis
European Central Bank (ECB) Vice President Luis de Guindos is delivering a speech at "Catedra de Economía y Sociedad" organized by Fundación La Caixa in Madrid.
Key quotes
I'm convinced that core inflation will also come down, but starting point is very high.
ECB will stick to communicating monetary policy on meeting by meeting basis, data dependency, will not shift to forward-guidance for months.
Market reaction
These comments fail to have little impact on the Euro. The EUR/USD pair is trading at 1.0952, losing 0.12% on the day, as of writing.
-
08:43
NZD/USD dives to five-week low, further below mid-0.6100s
- NZD/USD drops to a five-week low on Friday and is pressured by a combination of factors.
- Thursday’s softer domestic consumer inflation figures continue to weigh heavily on the NZD.
- Bets for more Fed rate hikes and a weaker risk tone act as a tailwind for the safe-haven USD.
The NZD/USD pair remains under heavy selling pressure for the second successive day on Friday and drops to a five-week low during the first half of the European session. The pair is currently placed around the 0.6135-0.6130 region, down over 0.60% for the day, and is pressured by a combination of factors.
The New Zealand (NZD) is undermined by the softer domestic consumer inflation figures released on Thursday, which entails a less hawkish stance by the Reserve Bank of New Zealand (RBNZ). In contrast, the Federal Reserve (Fed) is expected to continue raising interest rates, which, along with a softer risk tone, benefit the safe-haven US Dollar (USD) and drag the NZD/USD pair lower on the last day of the week.
The markets seem convinced that the Federal Reserve will raise rates by 25 bps in May and have been pricing in a small chance of another rate hike in June. The bets were reaffirmed by the recent hawkish commentary by several Fed policymakers, judging that inflation is still at problematic levels and monetary policy needs to be tightened still. This, to a larger extent, overshadows, Thursday's dismal US macro data.
Meanwhile, the prospects for further policy tightening by the US central bank fuel worries about economic headwinds stemming from rising borrowing costs. This, in turn, tempers investors' appetite for riskier assets, which further contributes to driving flows away from the risk-sensitive Kiwi. That said, a further decline in the US Treasury bond yields caps gains for the USD and might help limit losses for the NZD/USD pair.
Market participants now look forward to the release of the flash PMI prints from the US, due later during the early North American session. This, along with the US bond yields and the broader risk sentiment, will influence the USD price dynamics and produce short-term trading opportunities around NZD/USD pair on the last day of the week.
Technical levels to watch
-
08:39
Natural Gas Futures: Extra gains appears not favoured
Considering advanced figures from CME Group for natural gas futures markets, open interest dropped for the fourth consecutive session on Thursday, now by around 11.3K contracts. Volume followed suit and resumed the downtrend, now declining by around 82.3K contracts.
Natural Gas: Further consolidation in store
Thursday’s small uptick in prices of natural gas was accompanied by further decline in open interest and volume, leaving the prospects for extra gains curtailed for the time being. So far, the commodity is expected to maintain the current consolidation theme well in place in the short-term horizon.

-
08:31
German Preliminary Manufacturing PMI drops to 44.0 in April vs. 45.7 expected
- German Manufacturing PMI arrives at 44.0 in April vs. 45.7 expected.
- Services PMI in Germany jumps to 55.7 in April vs. 53.3 expected.
- EUR/USD keeps losses near 1.0950 on mixed German PMIs.
The German manufacturing sector contractions deepens in April while the services sector outperformed, the preliminary business activity report from S&P Global/BME research showed this Friday.
The Manufacturing PMI in Eurozone’s economic powerhouse came in at 44.0 this month vs. 45.7 expected and 44.7 prior. The index slumped to a 35-month low.
Meanwhile, Services PMI jumped from 53.7 in March to 55.7 in April as against the 53.3 print expected. The PMI reached yearly highs.
The S&P Global/BME Preliminary Germany Composite Output Index arrived at 53.9 in April vs. 52.7 expected and March’s 52.6. The gauge quickened its pace of expansion to 12-month highs.
FX implications
EUR/USD is off the lows but keeps the red at around 1.0950 on the mixed German data.
-
08:30
Germany S&P Global/BME Manufacturing PMI below forecasts (45.7) in April: Actual (44)
-
08:30
Germany S&P Global/BME Services PMI registered at 55.7 above expectations (53.3) in April
-
08:30
Germany S&P Global/BME Composite PMI came in at 53.9, above expectations (52.7) in April
-
08:28
AUD/USD clings to the consolidative phase – UOB
AUD/USD faces further side-lined trading in the near term, according to UOB Group’s Markets Strategist Quek Ser Leang and Senior FX Strategist Peter Chia.
Key Quotes
24-hour view: “We expected AUD to trade in a range of 0.6685/0.6735 yesterday. We did not anticipate the sharp but brief rise to 0.6772. The brief advance lacks momentum and AUD is unlikely to strengthen further. Today, AUD is more likely to trade sideways between 0.6700 and 0.6770.”
Next 1-3 weeks: “There is not much to add to our update from Monday (17 Apr, spot at 0.6710). As highlighted, after the recent sharp but short-lived swings, the outlook for AUD is mixed. For the time being, there is no clear direction and AUD could trade in a relatively broad range of 0.6620/0.6785.”
-
08:24
Crude Oil Futures: Further decline appears unlikely
CME Group’s flash data for crude oil futures markets noted traders trimmed their open interest positions for the third consecutive session on Thursday, this time by around 4.3K contracts. On the other hand, volume reversed three straight daily drops and went up by around 53.5K contracts.
WTI: Next support emerges near $76.00
Prices of the barrel of the WTI extended the weekly correction on Thursday. The third daily decline in a row, however, came amidst shrinking open interest and hints at the idea that a deeper pullback looks out of favour in the very near term. In the meantime, the commodity faces decent contention around the $76.00 region per barrel.
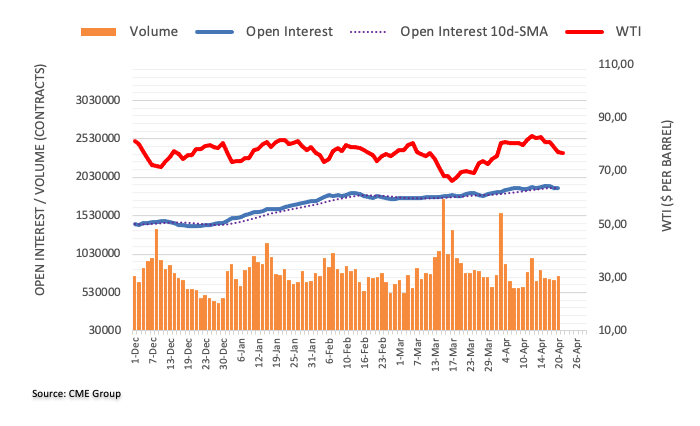
-
08:15
France S&P Global Composite PMI came in at 53.8, above forecasts (52.7) in April
-
08:15
France S&P Global Manufacturing PMI came in at 45.5 below forecasts (47.8) in April
-
08:15
France S&P Global Services PMI above forecasts (53.4) in April: Actual (56.3)
-
08:13
GBP/USD seen trading within 1.2345-1.2510 – UOB
In the opinion of UOB Group’s Markets Strategist Quek Ser Leang and Senior FX Strategist Peter Chia, GBP/USD is expected to trade within the 1.2345-1.2510 range in the next few weeks.
Key Quotes
24-hour view: “We highlighted yesterday that ‘the outlook for GBP is mixed’ and we expected it to ‘trade in a range between 1.2375 and 1.2475’. GBP subsequently traded in a relatively choppy manner between 1.2405 and 1.2468. The price actions are likely part of a consolidation and we expect GBP to trade in a range of 1.2400/1.2475 today.”
Next 1-3 weeks: “Our most recent narrative was from Monday (17 Apr, spot at 1.2405) wherein GBP ‘could edge lower but any decline is unlikely to break clearly below the major support at 1.2275’. However, GBP has not been able to make any headway on the downside. Downward pressure has faded and GBP is likely to trade sideways between 1.2345 and 1.2510 for the time being.”
-
08:07
Gold Futures: Still room for further consolidation
Open interest in gold futures markets kept the erratic performance on Thursday and rose by around 2.8K contracts according to preliminary readings from CME Group. Volume also remained erratic and shrank by nearly 2K contracts.
Gold keeps gyrating around $2000
Gold charted decent gains on Thursday amidst rising open interest and declining volume. Against that, the continuation of the consolidative trade seems well on the cards for the time being, always around the key $2000 mark per ounce troy.
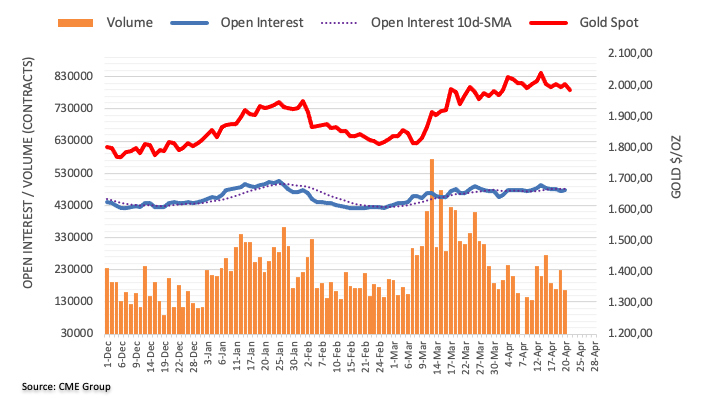
-
07:57
USD/JPY drops to four-day low, flirts with 50-day SMA around 133.70 region
- USD/JPY remains under heavy selling pressure for the second successive day on Friday.
- Stronger inflation figures from Japan and a softer risk tone benefit the safe-haven JPY.
- Bets for more Fed rate hikes act as a tailwind for the USD and could limit further losses.
The USD/JPY pair drifts lower for the second successive day on Friday and drops to a four-day low, around the 133.70 region during the early part of the European session.
A combination of factors provides a goodish lift to the Japanese Yen (JPY), which, in turn, drags the USD/JPY pair away from a multi-week high, around the 135.10-135.15 region touched on Wednesday. According to the data released earlier this Friday, Japan’s National Consumer Price Index (CPI) ticked down to a 3.2% YoY rate in March from 3.3% previous. This, however, was well above the 2.6% estimated and the Bank of Japan’s target range. Furthermore, the Core CPI, which excludes volatile oil and food prices, accelerated to a 3.8% YoY rate from 3.5% in February, surpassing expectations for a reading of 3.4%. This, in turn, indicates broadening price pressure in the world's third-largest economy and keeps alive expectations that the BoJ could begin to phase out its massive stimulus programme later this year.
Apart from this, a generally weaker tone around the equity markets benefits the JPY's relative safe-haven status and contributes to the offered tone surrounding the USD/JPY pair. Investors remain worried about economic headwinds stemming from rising borrowing costs, which, in turn, take its toll on the global risk sentiment. Meanwhile, the flight to safety leads to a further slide in the US Treasury bond yields, resulting in the narrowing of the US-Japan rate differential and lending additional support to the JPY. That said, growing acceptance that the Federal Reserve (Fed) will continue raising interest rates acts as a tailwind for the US Dollar (USD) and could help limit the downside for the major. This, in turn, warrants some caution for aggressive bearish trades and before positioning for any meaningful intraday fall.
Traders now look forward to the release of the flash PMI prints from the US, due later during the early North American session. This, along with the US bond yields, will influence the USD price dynamics and provide some impetus to the USD/JPY pair. Apart from this, the broader risk sentiment will drive demand for the safe-haven JPY and contribute to producing short-term trading opportunities on the last day of the week.
Technical levels to watch
-
07:54
EUR/USD faces further consolidation near term – UOB
UOB Group’s Markets Strategist Quek Ser Leang and Senior FX Strategist Peter Chia suggest EUR/USD could extend the consolidative mood unless it convincingly breaches the 1.0925 level.
Key Quotes
24-hour view: “Our expectations for EUR to edge lower did not materialize as it dropped briefly to 1.0931 in early NY trade, rebounded to 1.0989 and then traded sideways for the rest of the session. The price movements appear to be part of a consolidation and EUR is likely to trade sideways today, expected to be between 1.0925 and 1.0995.”
Next 1-3 weeks: “On Tuesday (18 Apr, spot at 1.0925), we noted that ‘downward momentum appears to be building, albeit tentatively’. We expected EUR to trade with a downward bias but we were of the view that any decline is expected to face solid support at 1.0830. EUR has not been able to make any headway on the downside and the build-up in momentum is beginning to fade. In order to rejuvenate the flagging momentum, EUR has to break clearly below 1.0925 in the next 1 or 2 days or it is more likely to trade sideways instead of with a downward bias. Conversely, a breach of 1.1025 (no change in ‘strong resistance’ level) would also indicate that EUR is likely to trade sideways.”
-
07:50
USD Index picks up pace and flirts with 102.00 ahead of data
- The index keeps the erratic performance around 102.00 on Friday.
- The risk-off mood prevails early in the European session.
- Flash Manufacturing/Services PMIs next of note later in the docket.
The greenback, in terms of the USD Index (DXY), sets aside Thursday’s pullback and manages to gather fresh steam and retests the 102.00 zone.
USD Index now looks at flash PMIs
The index keeps navigating choppy waters so far this week, always around the 102.00 neighbourhood and amidst alternating risk appetite trends.
The recovery in the dollar so far comes amidst another corrective pullback in US yields across the curve, while a 25 bps rate hike by the Fed at the May 3 meeting appears largely anticipated and consensus following a pause in the hiking cycle following the May event still seems quite divided.
In the US data space, advanced Manufacturing and Services PMIs will take centre stage later in the NA session.
What to look for around USD
The absence of strong catalysts leaves the price action around the dollar – and the rest of the FX space – somewhat muted around the 102.00 region so far this week.
In the meantime, the marked retracement in the buck since March has been underpinned by the pick-up in the perception that the Federal Reserve could make a pause in its current tightening cycle just after the May meeting.
In favour of a pivot in the Fed’s normalization process, however, still emerges the persevering disinflation, nascent weakness in some key fundamentals and somewhat persistent concerns surrounding the banking sector.
Key events in the US this week: Flash Manufacturing/Services PMIs (Friday).
Eminent issues on the back boiler: Persistent debate over a soft/hard landing of the US economy. Terminal Interest rate near the peak vs. speculation of rate cuts in 2024. Fed’s pivot. Geopolitical effervescence vs. Russia and China. US-China trade conflict.
USD Index relevant levels
Now, the index is gaining 0.16% at 101.95 and faces the next hurdle at 102.80 (weekly high April 10) followed by 103.05 (monthly high April 3) and then 103.31 (55-day SMA). On the flip side, the breach of 100.78 (2023 low April 14) would open the door to 100.00 (psychological level) and finally 99.81 (weekly low April 21 2022).
-
07:47
FX option expiries for Apr 21 NY cut
FX option expiries for Apr 21 NY cut at 10:00 Eastern Time, via DTCC, can be found below.
- EUR/USD: EUR amounts
- 1.0973-80 920m
- 1.1050 1.7b
- GBP/USD: GBP amounts
- 1.2350 545m
- USD/JPY: USD amounts
- 134.00-20 829m
- AUD/USD: AUD amounts
- 0.6795-00 521m
- 0.6845 1.4b
- USD/CAD: USD amounts
- 1.3520 670m
-
07:47
Forex Today: PMI surveys to bring some action back into markets
Here is what you need to know on Friday, April 21:
Markets remain indecisive to start the last trading day of the week after having struggled to make a directional move throughout the week. S&P Global's Manufacturing and Services PMI surveys for Germany, the Eurozone, the UK and the US will be watched closely by investors on Friday. Retail Sales data from Canada will be released in the NA session and several European Central Bank (ECB) policymakers will be delivering speeches.
US S&P Global PMIs Preview: Win-win situation for the Dollar? Why investors may get spooked.
Following Wednesday's rally, global yields turned south on Thursday and the benchmark 10-year US Treasury bond yield fell nearly 2%, making it difficult for the US Dollar (USD) to outperform its rivals. With Wall Street's main indexes staying under bearish pressure, however, the US Dollar Index (DXY) managed to find its footing. Early Friday, the DXY continues to move sideways in the upper half of its weekly range near 102.00. Meanwhile, US stock index futures trade virtually unchanged on the day.
The UK's Office for National Statistics reported on Friday that Retail Sales declined by 0.9% on a monthly basis in March, bringing the annual rate down to -3.2% from -3%. GBP/USD came under modest bearish pressure following the disappointing data and was last seen trading in negative territory slightly above 1.2400.
For the second straight day on Tuesday, EUR/USD closed virtually unchanged near 1.0950. The pair continues to move at around that level in the European morning on Friday. S&P Global Composite PMI in the Eurozone is forecast to hold steady at 53.7 in April's flash estimate, while the Composite PMI for Germany is expected to tick up to 52.7.
S&P Global Composite PMI in Australia improved to 52.2 from 48.5 in March with the Services PMI rising to 52.6 from 50.7. AUD/USD, however, failed to capitalize on this report and was last seen trading deep in negative territory below 0.6700.
USD/CAD extended its weekly rally on Thursday as the unabated bearish pressure surrounding crude oil prices continued to weigh on the commodity-sensitive Canadian Dollar. The pair preserves its bullish momentum early Friday and trades at its highest in over a week above 1.3500. Retail Sales in Canada are forecast to decline by 0.6% in February.
Gold price benefited from falling bond yields and closed in positive territory near $2,000 on Thursday, erasing Wednesday's losses. XAU/USD seems to be having a difficult time keeping its footing on Friday and was last seen losing nearly 1% on the day below $1,990.
USD/JPY reversed its direction after having met resistance near 135.00 and extended its slide early Friday. At the time of press, the pair was down 0.3% on the day below 134.00.
Following Wednesday's sharp decline, Bitcoin failed to stage a rebound and lost nearly 2% on Thursday. BTC/USD continues to stretch lower on Friday and was last seen testing $28,000. Ethereum tried to reclaim $2,000 on Thursday but failed to gather enough bullish momentum to do so. ETH/USD seems to have met fresh bearish pressure in the European morning, dropping toward $1,900.
-
07:15
GBP/USD remains depressed post-UK Retail Sales, holds above 1.2400 ahead of PMIs
- GBP/USD edges lower on Friday and is pressured by a combination of factors.
- Bets for more Fed rate hikes and a softer risk tone benefits the safe-haven buck.
- The dismal UK Retail Sales weigh on the GBP and contribute to the downtick.
The GBP/USD pair comes under some selling pressure on the last day of the week and maintains its offered tone through the early European session. The pair currently trades around the 1.2425-1.2420 region, down over 0.15% for the day, and reacts little to the latest UK macro data.
The UK Office for National Statistics reported this Friday that domestic Retail Sales contracted more-than-expected, by 0.9% in March and reversed a major part of the rise recorded in the previous month. Furthermore, sales excluding fuel also missed consensus estimates and dropped by 1% during the reported month as compared to the 1.4% rise reported in February. This, in turn, undermines the British Pound, which, along with a modest US Dollar (USD) uptick, acts as a headwind for the GBP/USD pair.
The prospects for further policy tightening by the Federal Reserve (Fed), along with a softer risk tone, lend some support to the safe-haven Greenback. In fact, the markets seem convinced that the Federal Reserve will raise rates by 25 bps in May and have been pricing in a small chance of another rate hike in June, bolstered by the recent hawkish remarks by FOMC officials. This raises worries about economic headwinds stemming from rising borrowing costs, which tempers investors' appetite for riskier assets.
The downside for the GBP/USD pair, however, seems cushioned, at least for the time being, amid rising bets for an additional interest rate hike by the Bank of England (BoE). Against the backdrop of stronger UK wage growth data released earlier this week, the stubbornly high inflation should keep pressure on the BoE to raise interest rates further. This makes it prudent to wait for strong follow-through selling before confirming that this week's bounce from the 1.2350 strong horizontal support has run out of steam.
Nevertheless, the GBP/USD pair remains on track to register modest weekly gains as market participants now look forward to the release of the flash PMI prints from the UK and the US for a fresh impetus. This, along with the US bond yields and the broader risk sentiment, will influence the USD price dynamics and produce short-term trading opportunities around the GBP/USD pair heading into the weekend.
Technical levels to watch
-
07:13
BoJ Financial System Report: Japan's financial system has been maintaining stability on the whole
In its semi-annual financial system report released on Friday, the Bank of Japan (BoJ) said that “Japan's financial system has been maintaining stability on the whole.”
Additional takeaways
Japanese banks have sufficient capital bases to perform financial intermediation activities appropriately, even amid the global tightening of financial conditions.
Despite heightened uncertainty about the financial sector in the united states and Europe, triggered by u.s. bank failures in March, japan’s financial system has been sound and resilient.
Vigilance against tail risks continues to be warranted.
Future developments remain highly uncertain as financial and capital markets have been nervous.
Quality of banks' domestic and foreign loan portfolios has remained high on the whole, some loans entail high credit risk.
Need to examine the risks of contraction and overheating in the financial system and address potential vulnerabilities appropriately in order to ensure the stability of Japan's financial system.
Market reaction
At the time of writing, USD/JPY is losing 0.34% on the day to trade at 133.75, as the Japanese yen remains underpinned by hot domestic inflation data. The focus shifts to the US PMIs.
-
07:12
Gold Price Forecast: XAU/USD surrenders $2,000 as USD Index recovers – Confluence Detector
- Gold price has slipped sharply below the psychological cushion of $2,000.00 after a recovery in the USD Index.
- Hawkish commentaries from Fed policymakers have infused blood into the USD Index.
- Weekly jobless claims data released on Thursday cemented signs of an easing labor market.
Gold price (XAU/USD) has delivered a breakdown of the rangebound structure formed around $2,005.00 in the early European session. The precious metal has dropped below the psychological support of $2,000.00 amid a recovery move in the US Dollar Index (DXY) after a long consolidation.
Investors are channelizing their funds into the US Dollar Index (DXY) Federal Reserve (Fed) policymakers are continuously advocating for more rate hikes and ignoring fears of a recession in the United States economy. Weekly jobless claims data released on Thursday cemented signs of an easing labor market. As per the report, weekly jobless claims increased to 245K, higher than the consensus and the former release of 240K for the week ending April 14.
Going forward, the release of the preliminary US S&P PMI data (April) will be of significant importance. As per the consensus, the Manufacturing PMI will land at 49.0, lower than the former release of 49.2. The Services PMI is also seen lower at 51.5 against the figure of 52.6 released earlier. A consecutive 25 basis point (bp) interest rate hike by the Fed in May seems expected, however, a further slowdown in US economic activities could strengthen the chances of no more rates beyond May.
Also Read: Gold Price Forecast: XAU/USD consolidates above $2,000 as investors await preliminary US S&P PMI
Gold Price: Key levels to watch
A confident move below $2,000.00 which is the confluence of psychological support and 20-period Exponential Moving Average (EMA) on a four-hour timeframe has activated bears. Gold price is preparing for further downside and is likely to find a cushion near the previous week's low at $1,986.00. An absence of a sell-off move by the market participants could send the Gold price to the previous week’s first pivot support at $1,977.50.
Chances of a bullish move for the Gold price would emerge if the Gold price manages to the hourly five-period Simple Moving Average (SMA) at $2,004.50. A sustained move above the same will expose the Gold price to the previous month's high at $2,010.82 followed by a weekly 38.2% Fibonacci retracement at $2,025.37
Here is how it looks on the tool
-638176542360265917.png)
About Technical Confluences Detector
The TCD (Technical Confluences Detector) is a tool to locate and point out those price levels where there is a congestion of indicators, moving averages, Fibonacci levels, Pivot Points, etc. If you are a short-term trader, you will find entry points for counter-trend strategies and hunt a few points at a time. If you are a medium-to-long-term trader, this tool will allow you to know in advance the price levels where a medium-to-long-term trend may stop and rest, where to unwind positions, or where to increase your position size.
-
07:02
UK Retail Sales drop by 0.9% MoM in March vs. -0.5% expected
- The UK Retail Sales came in at -0.9% MoM in March, a big miss.
- Core Retail Sales for the UK drops by 1.0% MoM in March.
- The Cable keeps the red below 1.2450 on unimpressive UK data.
The UK Retail Sales arrived at -0.9% over the month in March vs. -0.5% expected and 1.1% previous. The Core Retail Sales, stripping the auto motor fuel sales, dropped by 1.0% MoM vs. -0.7% expected and 1.4% previous.
On an annualized basis, the UK Retail Sales declined 3.1% in March versus -3.1% expected and -3.3% prior while the Core Retail Sales decreased 3.2% in the reported month versus -3.1% expectations and -3.0% previous.
Main points (via ONS)
“Non-food stores sales volumes fell by 1.3% in March 2023, following a rise of 2.4% in February, with feedback from retailers that poor weather conditions throughout most of March affected sales.”
“Food store sales volumes fell by 0.7% in March 2023, following a rise of 0.6% in February 2023.”
“Non-store retailing (predominantly online retailers) sales volumes fell by 0.8% in March 2023, following a rise of 0.3% in February 2023.”
“Automotive fuel sales volumes rose by 0.2% in March 2023, following a fall of 1.2% in February 2023; sales remain 8.5% below their pre-coronavirus (COVID-19) February 2020 levels.”
FX implications
GBP/USD is keeping its downbeat momentum intact at around 1.2430 after disappointing UK Retail Sales data. The spot was last seen trading down 0.13% on the day.
-
07:01
Denmark Industrial Outlook remains at -14 in April
-
07:01
United Kingdom Retail Sales (MoM) below expectations (-0.5%) in March: Actual (-0.9%)
-
07:01
United Kingdom Retail Sales (YoY) in line with forecasts (-3.1%) in March
-
07:01
United Kingdom Retail Sales ex-Fuel (MoM) below expectations (-0.7%) in March: Actual (-1%)
-
07:01
United Kingdom Retail Sales ex-Fuel (YoY) below expectations (-3.1%) in March: Actual (-3.2%)
-
06:46
USD/INR Price Analysis: Remains confined in a narrow trading band, holds above 82.00 mark
- USD/INR is seen oscillating in a narrow trading band above the 82.00 round figure.
- Neutral technical indicators on the daily chart hold back traders from placing bets.
- Any meaningful slide could be seen as a buying opportunity near the 200-day SMA.
The USD/INR pair struggles to gain any meaningful traction on Friday and oscillates in a narrow trading band above the 82.00 mark heading into the European session.
From a technical perspective, neutral oscillators on the daily chart haven't been supportive of any firm near-term direction. This, in turn, holds back traders from placing aggressive bets and leads to subdued price action on the last day of the week. The USD/INR pair, however, has managed to hold its neck above the 81.50 horizontal support. The said area now coincides with the very important 200-day Simple Moving Average (SMA) and should act as a pivotal point.
A convincing breakdown through the aforementioned support will be seen as a fresh trigger for bearish traders and pave the way for deeper losses. The USD/INR might then accelerate the fall towards testing the 81.00 round-figure mark. The downward trajectory could get extended further towards the next relevant support near the 81.40-81.30 region, which if broken decisively will confirm that spot prices have topped out and set the stage for a further depreciating move.
On the flip side, the monthly swing high, around the 82.50 level, might now act as an immediate hurdle, above which a bout of a short-covering move should allow the USD/INR pair to make a fresh attempt to conquer the 83.00 mark. Some follow-through buying beyond the 83.20-83.30 supply zone, or the all-time peak, will mark a fresh bullish breakout and prompt aggressive technical buying, paving the way for a move towards reclaiming the 84.00 round-figure mark.
USD/INR daily chart
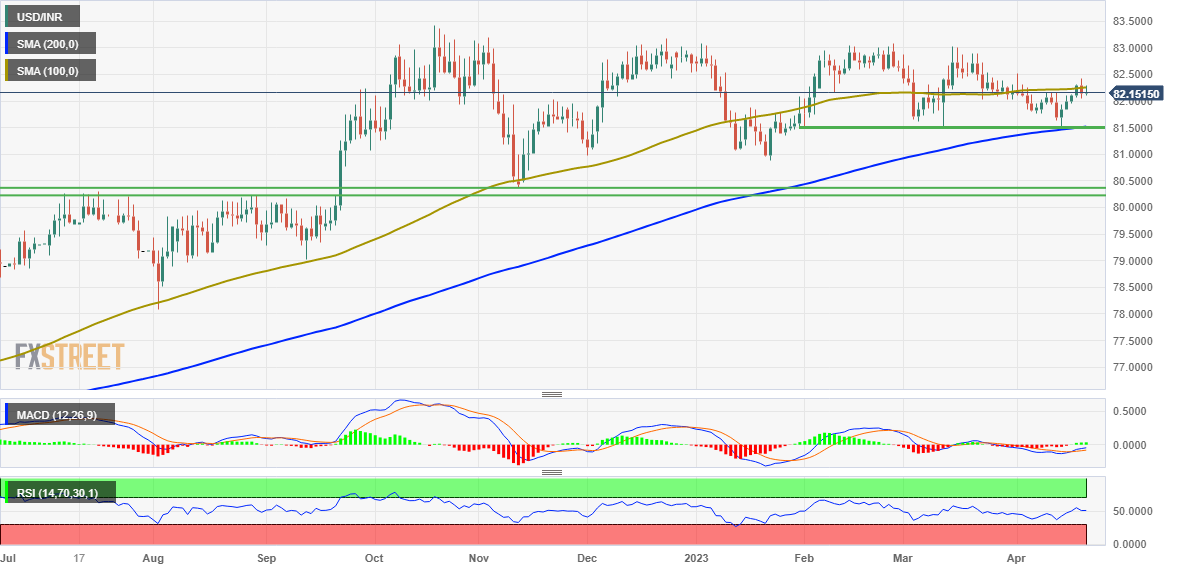
Key levels to watch
-
06:32
AUD/USD drops below 0.6710 as Fed to raise rates despite deepening slowdown fears
- AUD/USD has stretched its downside below 0.6710 amid a recovery in the USD Index.
- Fed policymakers are not ready to tone down their hawkish stance on interest rates despite slowdown fears.
- The Australian Dollar has faced immense pressure after mixed preliminary S&P PMI data.
The AUD/USD pair has extended its downside to near 0.6714 in the early London session. The Aussie asset is expected to move south further as the US Dollar Index (DXY) has shown a recovery move after building a base around 101.80.
The USD Index has scaled to near 101.86 and is expected to accelerate further. Investors are pouring funds into the USD Index amid a cautionary mood. S&P500 futures are flat in early Europe after three bearish trading sessions to dodge quarterly result season-inspired volatility. Meanwhile, the US Treasury yields are still struggling for recovery. The return provided on 10-year US Treasury yields is hovering around 3.52%.
The headline from a leaked US Intelligence report that China is building sophisticated cyber weapons to “seize control” of enemy satellites, rendering them useless for data signals or surveillance during wartime, as reported by Financial Times, has also increased appeal for the USD Index as a safe-haven.
Despite knowing the fact that United States manufacturing activities have been contracting for the past few months and labor market conditions have cool down further amid rising weekly jobless claims, Federal Reserve (Fed) policymakers are not ready to tone down their hawkish stance on interest rates.
Cleveland Federal Reserve President Loretta Mester reiterated on Thursday that the Fed has more work to do with inflation in the US staying too high, per Reuters. He further added, "Fed will need to hike policy rate to over 5% and hold there for a while."
The Australian Dollar is facing immense pressure after mixed preliminary S&P PMI (April) data. Manufacturing PMI softened heavily to 48.1 from the consensus of 48.8 and the former release of 49.1. While Services PMI jumped to 52.6 vs. the prior release of 50.7.
-
06:04
EUR/USD Price Analysis: Gets set for a volatile action
- EUR/USD is showing topsy-turvy moves, following the footprints of the subdued USD Index.
- S&P500 futures have turned negative after headlines that China is building sophisticated cyber weapons.
- EUR/USD is auctioning in a symmetrical triangle pattern near the edge of the upward-sloping trendline plotted from 1.0714.
The EUR/USD pair is displaying topsy-turvy moves around 1.0960 in the early European session. The major currency pair is failing to show any decisive move amid lackluster performance by the US Dollar Index (DXY). Investors should be prepared for a power-pack action ahead of the release of the preliminary S&P PMI data.
S&P500 futures have turned negative after headlines from a leaked US Intelligence report that China is building sophisticated cyber weapons to “seize control” of enemy satellites, rendering them useless for data signals or surveillance during wartime, as reported by Financial Times. This could further impact the risk appetite of the market participants.
EUR/USD is auctioning in a Symmetrical Triangle chart pattern near the edge of the upward-sloping trendline plotted from March 24 low at 1.0714. A Symmetrical Triangle formation indicates a sheer contraction in volatility, which is followed by a breakdown in the same.
For the time being, the 21-period Exponential Moving Average (EMA) at 1.0960 is providing a cushion to the Euro bulls.
The Relative Strength Index (RSI) (14) is oscillating in the 40.00-60.00 range, indicating a consolidation ahead.
Going forward, a break above the psychological resistance of 1.1000 will drive the asset to a fresh annual high at 1.1068, followed by the round-level resistance at 1.1100.
On the flip side, a downside move below April 12 low at 1.0915 will drag the asset toward April 10 low at 1.0837 and April 03 low at 1.0788.
EUR/USD two-hour chart
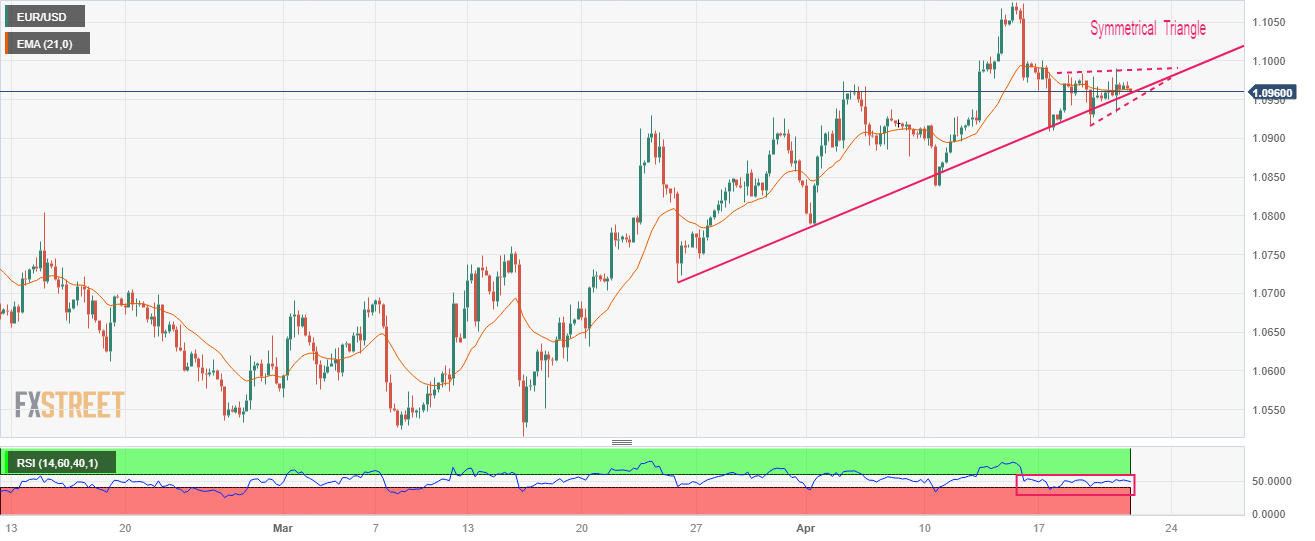
-
05:30
USD/CAD kisses 1.3500 amid weaker oil prices, US PMI and Canadian Retail Sales in focus
- USD/CAD has refreshed its weekly high at 1.3500 despite a subdued performance from the US Dollar Index.
- Declining oil prices have weighed heavily on the Canadian Dollar.
- A contraction in Canadian Retail Sales data will be a relief for the BoC.
The USD/CAD pair has printed a fresh weekly high of 1.3500 in the Asian session. The Loonie asset has continued its two-day winning spell after overstepping Thursday’s high of 1.3490. The Canadian Dollar has witnessed immense pressure amid a sheer decline in oil prices. The black gold has witnessed sheer losses as more rate hikes from global central banks will put a serious dent in global oil demand.
The US Dollar Index (DXY) has turned sideways around 101.80 ahead of the release of the preliminary United States S&P PMI data. Investors want to scrutinize the impact of higher interest rates by the Federal Reserve (Fed) on economic activities so as to prepare an executable action. As per the consensus, the Manufacturing PMI will land at 49.0, lower than the former release of 49.2. The Services PMI is also seen lower at 51.5 against the figure of 52.6 released earlier.
Meanwhile, S&P500 futures are showing mild gains in the Asian session. Investors should take a cautious approach before injecting funds into S&P500 as earnings season is picking up pace and midcap stocks would take the lead ahead. A subdued performance from the USD Index is weighing on US Treasury yields. The alpha generated on 10-year US Treasury bonds has dropped below 3.53%.
The Canadian Dollar is expected to remain in action ahead of Retail Sales data. The street is anticipating a contraction in monthly Retail Sales data (Feb) by 0.5% vs. an expansion of 1.4% recorded in January. Bank of Canada (BoC) Governor Tiff Macklem is worried that a shortage of labor and upbeat retail demand could force the central bank to raise rates further. A contraction in Retail Sales data will be a relief for the BoC.
-
05:01
Asian Stock Market: Nikkei 225 drops as Japan’s inflation accelerates, oil struggles to defend $77.00
- Asian indices are bearish after tracking negative cues from S&P500.
- Continuous hawkish commentaries from Fed policymakers are weighing heavily on market sentiment.
- Accelerating Japan’s CPI indicates that the BoJ is well on track to keeping inflation steadily above 2%.
Markets in the Asian domain have witnessed a steep after tracing Thursday’s action from S&P500. US equities fell sharply on Thursday as investor shifts their focus toward a fresh rate hike from the Federal Reserve (Fed). Continuous hawkish commentaries from Fed policymakers are weighing heavily on market sentiment.
The US Dollar Index (DXY) has turned sideways around 101.80 after wild moves influenced by the release of 11th consecutive lower-than-projected weekly jobless claims data. The number of individuals claiming due to unemployment rose to 245K from the consensus of 240K. This signals a cool down in the tight labor market but doesn’t fade the need of more rate hikes from the Fed.
At the press time, Japan’s Nikkei225 eased 0.13%, SZSE Component plunged 1.14%, Hang Seng dropped 0.67%, and Nifty50 added 0.11%.
Japanese stocks are moderately negative on Friday after higher-than-anticipated National Consumer Price Index (CPI) data. Annual national CPI (March) accelerated to 3.2% from the consensus of 2.6% and core PCI jumped to 3.8% vs. the estimates of 3.4%.
A marginal decline in headline CPI from prior figures is the outcome of declining oil prices in the international market. While, walking core inflation indicates signs of a consistent jump in retail demand, supported by the continuation of ultra-loose monetary policy by the Bank of Japan (BoJ) and stimulus for raising wages.
Chinese equities failed to capitalize on commentary from Zou Lan, head of monetary policy, at People Bank of China (PBOC) that the central bank “will continue implementing prudent monetary policy.” He further added, “He sees no basis for long-term deflation or inflation in the country.”
On the oil front, oil prices are struggling to defend their auction above $77.00 as global central banks are preparing for a fresh rate hike cycle to dial back persistent inflation.
-
04:33
WTI eyes more downside below $77.00 as global central banks prepare for a fresh rate hike cycle
- The oil price is struggling to defend the immediate support of $77.00 as fears of a global slowdown have deepened.
- Global central banks are preparing for a fresh rate hike cycle to arrest stubborn inflation.
- Investors have ignored upbeat Chinese prospects and are worried due to global recession fears.
West Texas Intermediate (WTI), futures on NYMEX, have gauged an intermediate cushion around $77.00 in the Tokyo session. The oil prices have taken a sigh of relief after a four-day bearish spell maid uncertainty over further squeeze in monetary policy by global central banks.
The black gold has surrendered the majority of gains generated after OPEC+ announced surprise production cuts. And, a further decline in the oil price will expose it to the crucial support of $75.60. Deepening fears slowdown in the global economy knowing that central banks are preparing for a fresh rate hike cycle to arrest stubborn inflation will put a big dent in the overall oil demand.
Along with the Federal Reserve (Fed), the European Central Bank (ECB), and the Bank of England (BoE) are expected to hike rates further to bring down persistent inflation in their respective economies. The Fed and BoE are highly expected to raise rates further by 25 basis points (bps) while investors are divided about the pace of rate hikes by the ECB as options of 25 and 50 bps are available.
No one could deny the fact that a more conservative approach to monetary policies by global central banks would renew fears of global recession as manufacturing activities will be beaten down significantly.
Apart from that, investors have ignored upbeat Gross Domestic Product (GDP) numbers from China, which have strengthened signs of economic recovery and eventually the oil demand in the second-largest nation. It is worth noting that China is the largest importer of oil in the world and economic recovery in China would support oil prices.
-
04:10
GBP/USD continues to juggle around 1.2440 ahead of UK Retail Sales
- GBP/USD is consolidating around 1.2440 as investors await UK Retail Sales for fresh impetus.
- The overall market mood is risk-averse, however, a stock-specific action in S&P500 is highly active.
- UK Retail Sales are expected to contract by 0.5% in March than expansion by 1.2% in February.
The GBP/USD pair is continuously oscillating in a narrow range around 1.2440 in the Tokyo session. The Cable is struggling to find a decisive move as investors are awaiting the release of the United Kingdom Retail Sales data for further guidance.
A flat-to-positive performance has been recorded for the S&P500 futures in the Asian session. US equities were beaten down on Thursday amid mixed earnings from the banking sector and weak revenue guidance from Tesla. The overall market mood is risk-averse, however, a stock-specific action is highly active.
Quarterly earnings from the US banking sector have been a mixed bag this time as JP Morgan Chase and Morgan Stanley joined with companies beating Wall Street estimates while Goldman Sachs reported poor figures. However, it conveys that the overall US banking system is resilient.
The US Dollar Index (DXY) is demonstrating a lackluster performance around 101.80, shifting its focus toward the Federal Reserve (Fed)’s monetary policy meeting, which is scheduled in the first week of May. A consecutive 25 basis point (bps) rate hike is expected from Fed chair Jerome Powell as US inflation has highly diverged from desired levels.
Cleveland Federal Reserve President Loretta Mester reiterated on Thursday that the Fed has more work to do with inflation in the US staying too high, per Reuters. He further added, "Fed will need to hike policy rate to over 5% and hold there for a while."
On the Pound Sterling front, after higher-than-projected inflationary figures and the labor cost index, investors are shifting their focus toward Retail Sales data. As per the estimates, UK Retail Sales contracted by 0.5% in March than expansion by 1.2% in February. While the contraction in annual Retail Sales will decline to 3.1% from the former pace of contraction at 3.5%.
-
03:37
China’s SAFE: Forex market stable in Q1, cross border flows more balanced
Pan Gongsheng, head of China’s State Administration of Foreign Exchange (SAFE), said on Friday, “China’s forex market stable in Q1, cross border flows more balanced.”
Additional quotes
“Will deepen forex reform, steadily pushing forward with high level opening up of capital account.”
“Will fend off risks from external market shocks.”
“Will maintain prudent operations of forex market and financial safety.”
“Market expectations remain stable and trading is reasonable.”
“Foreign investors increase holdings of onshore bonds in March.”
Market reaction
At the time of writing, AUD/USD is losing 0.22% on the day to trade at 0.6724, holding lower ground amid risk-aversion.
-
03:30
Commodities. Daily history for Thursday, April 20, 2023
Raw materials Closed Change, % Silver 25.284 0.06 Gold 2004.72 0.53 Palladium 1582.48 -1.32 -
02:58
EUR/USD moves sideways in consolidaiton with a focus on US data
- EUR/USD is flat in Tokyo as the US dollar´s sell-off pauses.
- The US Dollar was under pressure Thursday, a relief for the Euro.
EUR/USD is flat in Tokyo Friday session, so far, and has traveled within a tight range and between a low of 1.0961 and a high of 1.0973.
The driver has been in the US Dollar that has been thrown around amid US data and Federal Reserve sentiment his week, although is still on track for its first weekly gain in more than a month. At the time of writing, as measured by the DXY index, the Greenback is trading around 101.80 and up from Friday´s lows of 100.78. However, the greenback suffered a blow from a deterioration in economic data on Thursday.
Analysts at ANZ Bank dug deep:
´´The April Philadelphia Fed index slipped further to -31.3 vs -23.2. That marked the 8th consecutive negative print, reflecting the weakness also observed in the ISM survey. Inflation metrics showed further easing, consistent with the PPI. Prices received fell to -3.3 vs 7.9, and prices paid fell to 8.2 vs 23.5. Input prices and firms’ pricing power in the goods sector are waning.´´
´´US initial claims: The 245k rise in initial claims for the week ended 15 April compares with 247k in the survey week for March and hints at a solid labour market report this month within the context of decelerating hiring.´´
´´Beige Book: The Fed’s qualitative survey of business activity noted a loss in economic momentum following the banking stress in March as consumer spending was reported to be generally flat and manufacturing activity was flat to down. Those sectors together account for ~85% of economic activity.´´
Meanwhile, and more broadly, analysts at Rabobank recently explained that, ´´for now, however, it remains that the USD remains the most widely used invoicing currency.´´
´´This is the crux of the greenback’s safe-haven character,´´ the analysts said.
´´On any further signs of crisis this year the USD is likely to rally. Risk appetite has settled down in April as the market puts distance between itself and the March banking tremors.
´Signs of stronger growth in China will also likely appease market nerves. That said, we see risks of further bumps in the road and expect dips as far as EUR/USD1.06 before the end of the year,´´ the analysts argued.
-
02:37
Gold Price Forecast: XAU/USD consolidates above $2,000 as investors await preliminary US S&P PMI
- Gold price is oscillating in a narrow range around $2,000 ahead of preliminary US S&P PMI data.
- A move beyond the 100.90-102.03 boundary in the USD Index will be considered a decisive move.
- Gold price is expected to show more upside after breaking above the immediate resistance plotted from $2,011.90.
Gold price (XAU/USD) is displaying a back-and-forth action above the psychological resistance of $2,000.00 in the Asian session. The precious metal has turned sideways to near $2,005.00 after a gradual upside as investors are awaiting the release of the preliminary United States S&P PMI data for fresh impetus.
S&P500 futures have added some gains in the Asian session after three back-to-back bearish settlements. The weak revenue guidance from Tesla due to Elon Musk’s price-cutting spree dented market sentiment. The US Dollar Index (DXY) has extended its correction to near 101.77. The USD Index is inside the woods, consolidating in a range of 100.90-102.03 for the past few trading sessions. Therefore, a move beyond the aforementioned boundary will be considered a decisive move.
The subdued USD index is also weighing on US Treasury yields. The demand for US government bonds has improved amid rising weekly jobless claims. The number of individuals claiming due to unemployment rose to 245K from the consensus of 240K. This signaled a cool-off in the tight labor market and raised hopes of no more rate hikes from the Federal Reserve (Fed) beyond May’s monetary policy meeting.
Going forward, the release of the preliminary US S&P PMI data will dictate the impact on the scale of economic activities due to higher rates from the Fed. As per the estimates, Manufacturing and Services PMI will ease to 49.0 and 51.5 respectively. A weaker-than-projected preliminary PMI data could weigh heavily on the US Dollar.
Gold technical analysis
Gold price showed a stellar recovery after dropping to near the Rising Channel chart pattern formed on a two-hour scale. The precious metal is facing hurdles near the immediate resistance plotted from April 18 high at $2,011.90.
The 20-period Exponential Moving Average (EMA) at $2,000.40 is providing a cushion to the Gold bulls.
Meanwhile, the Relative Strength Index (RSI) (14) is making efforts for overstepping 60.00. An occurrence of the same will activate the bullish momentum.
Gold two-hour chart
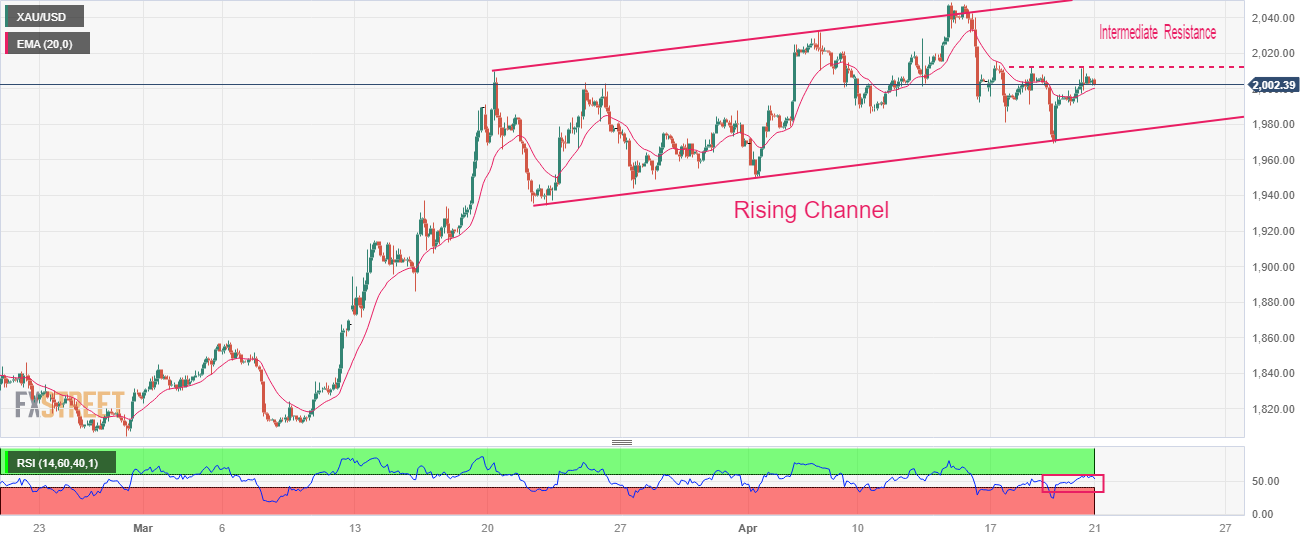
-
02:31
AUD/USD Price Analysis: Bulls have thrown in the towel
- AUD/USD bears are moving in with a focus on 0.6720.
- A break of 0.6720 opens the risk to 0.6680.
AUD/USD is flat in Tokyo after moving between a low of 0.6735 and a high of 0.6745 after a move lower in the greenback that enabled the high beta currencies to rally. However, technically, the market is turning bearish again while below 0.6750 within the recent ranges as the following will illustrate:
AUD/USD daily chart

AUD/USD has been reaching 0.6750 as it grinds along the bullish trendline support on top of the 0.6680-0.6700 structure.
AUD/USD H4 charts


Zooming down to the 4-hour chart and into the current price action, we can see a W-formation in play that is pulling the price back towards the neckline. 0.6720 will be key in this regard. A break of support could see the price dig into the trendline and if that were to give, the focus will be on a move below 0.6700 and eyes on 0.6680.

-
02:17
USD/CNY fix: 6.8752 vs. the prior fix of 6.8987
In recent trade today, the People’s Bank of China (PBOC) set the yuan at 6.8752 vs. the prior fix of 6.8987 and the previous close of 6.8740.
About the fix
China maintains strict control of the yuan’s rate on the mainland.
The onshore yuan (CNY) differs from the offshore one (CNH) in trading restrictions, this last one is not as tightly controlled.
Each morning, the People’s Bank of China (PBOC) sets a so-called daily midpoint fix, based on the yuan’s previous day's closing level and quotations taken from the inter-bank dealer.
-
02:13
Fed's Harker: Fed is not changing inflation target right now, is committed to 2%
Reuters reported that Philadelphia Federal Reserve Bank President Patrick Harker on Tuesday said he feels the US central bank may soon be done raising interest rates, a year into its most rapid monetary policy tightening since the 1980s.
"Since the full impact of monetary policy actions can take as much as 18 months to work its way through the economy, we will continue to look closely at available data to determine what, if any, additional actions we may need to take," Harker said in a speech at the Wharton Initiative on Financial Policy and Regulation.
US Dollar update
The Greenback has been traded in a range over the past week as the hawks gather again since last Friday. Federal Reserve´s Governor Christopher Waller said that despite a year of aggressive rate increases, the Fed "hasn't made much progress" in returning inflation to their 2% target and argued that rates still need to go up. As such, the likelihood of a rate cut by December has narrowed considerably this week.
Looking ahead, the Federal Open Market Committee will enter a blackout this weekend ahead of the 2/3 May meeting. The latest guidance is very much in line with market pricing. The US Dollar fell, however on Thursday, as per the DXY index, to a low of 101.632 from a high of 102.126.
-
01:49
USD/JPY rebounds from 134.00 despite Japan’s Inflation accelerates
- USD/JPY has made a recovery move from 134.00 despite an acceleration in Japan’s Inflation.
- Annual headline CPI has accelerated to 3.2% vs. 2.6% and core CPI has jumped to 3.8% against estimates of 3.4%.
- It seems that the BoJ is well on track to keep the inflation rate steadily above 2%.
The USD/JPY pair has defended the crucial support of 134.00 in the Asian session despite the release of wider-than-anticipated Japan’s National Consumer Price Index (CPI) data. Annual national CPI (March) has accelerated to 3.2% from the consensus of 2.6% but remained lower than the prior release of 3.3%.
A marginal decline in headline CPI from prior figures is the outcome of declining oil prices in the international market. The core PCI that strips off the impact of volatile oil and food prices has jumped to 3.8% vs. the estimates of 3.4% and the former release of 3.5%. This indicates a sign of a consistent jump in retail demand, supported by the continuation of ultra-loose monetary policy and stimulus for raising wages.
This indicates that the Bank of Japan (BoJ) is well on track of keeping the inflation rate steadily above 2%. Earlier, BoJ Governor Kazuo Ueda cited that the central bank is expected to attain steady consumer prices above 2% in 2025.
On Thursday, Reuters reported that the BoJ is open to mulling over the idea of making adjustments to its controversial bond yield control policy later this year. Sources familiar to the BoJ also cited “The preferred approach, for now, is to stay the course, which means the bank will make no major immediate changes to YCC and its dovish policy guidance.”
Meanwhile, the US Dollar Index (DXY) is showing topsy-turvy moves around 101.80 amid anxiety ahead of preliminary S&P PMI data. The street is anticipating Manufacturing PMI at 49.0, lower than the former release of 49.2. The Services PMI is also seen lower at 51.5 against the figure of 52.6 released earlier.
-
01:30
Japan Jibun Bank Manufacturing PMI came in at 49.5, above forecasts (48.9) in April
-
01:30
Japan Jibun Bank Services PMI down to 54.9 in April from previous 55
-
01:30
Stocks. Daily history for Thursday, April 20, 2023
Index Change, points Closed Change, % NIKKEI 225 50.81 28657.57 0.18 Hang Seng 29.21 20396.97 0.14 KOSPI -11.97 2563.11 -0.46 ASX 200 -3.3 7362.2 -0.04 FTSE 100 3.81 7902.61 0.05 DAX -99.23 15795.97 -0.62 CAC 40 -10.73 7538.71 -0.14 Dow Jones -110.39 33786.62 -0.33 S&P 500 -24.73 4129.79 -0.6 NASDAQ Composite -97.67 12059.56 -0.8 -
01:21
RBNZ's Hawkesby: New Zealand banks have systems to monitor risks
Reserve Bank of New Zealand's Chrisitan Hawkesby explained that New Zealand banks have systems to monitor risks.
More to come...
-
01:20
US Dollar Index Price Analysis: Volatility contracts around 101.80 as focus shifts to US S&P PMI
- The US Dollar Index is inside the woods ahead of preliminary US S&P PMI data.
- Wild movements were shown on Thursday after the release of 11th consecutive higher-than-anticipated jobless claims.
- US labor market conditions are softening consistently due to higher interest rates by the Fed.
The US Dollar Index (DXY) has extended its correction after slipping below the immediate support of 101.80 in the Asian session. The USD Index showed wild movements on Thursday after the release of higher-than-anticipated Initial Jobless Claims for the week ending April 14 and a weak Philadelphia Fed Manufacturing Survey (April).
US Department of Labor reported 11th consecutive higher-than-expected jobless claims against consensus. The economic data said that 245K jobless individuals applied for claims against a consensus and the prior figure of 240K.
No doubt, labor market conditions are softening consistently due to higher interest rates by the Federal Reserve (Fed). However, the street is still anticipating a consecutive 25 basis point (bp) rate hike ahead. As per the CME Fedwatch tool, almost 85% of chances are in favor of interest rates above 5%.
Meanwhile, three consecutive bearish trading sessions by S&P500 is indicating that investors have underpinned the risk aversion theme. The 10-year US Treasury yields have dropped below 3.54%.
On a two-hour scale, the USD Index is consolidating in a wide range of 101.63-102.23, indicating an absence of a critical trigger. A power-pack action is expected after the release of preliminary US S&P PMI data. As per the estimates, the Manufacturing PMI will land at 49.0, lower than the former release of 49.2. The Services PMI is also seen lower at 51.5 against the figure of 52.6 released earlier.
The 20-period Exponential Moving Average (EMA) at 101.85 is overlapping with the asset price, indicating sheer contraction in volatility.
Adding to that, the Relative Strength Index (RSI) (14) is oscillating in the 40.00-60.00 range, signaling that investors are awaiting a critical trigger for a decisive move.
Should the asset breaks decisively above April 17 high at 102.23, bulls will drive the asset toward potential resistances plotted from April 10 and March 24 at 102.76 and 103.36 respectively.
Alternatively, a breakdown of April 05 low at 101.41 will drag the asset to April 14 low at 100.78. A further breakdown will expose the asset to the psychological support of 100.00.
USD Index two-hour chart
-638176331582585640.png)
-
01:15
Currencies. Daily history for Thursday, April 20, 2023
Pare Closed Change, % AUDUSD 0.67411 0.41 EURJPY 147.261 -0.23 EURUSD 1.09697 0.12 GBPJPY 166.971 -0.33 GBPUSD 1.24402 0.03 NZDUSD 0.61765 -0.38 USDCAD 1.34741 0.11 USDCHF 0.89237 -0.53 USDJPY 134.227 -0.36 -
01:10
GBP/USD Price Analysis: Bears take on critical trendline support
- GBP/USD bears are in the market below 1.2470.
- A break below 1.2415 will cement the downside bias.
As per the prior analysis, GBP/USD Price Analysis: Bears are moving in with eyes on 1.2350s, GBP/USD is carving out a topping formation and we have seen what could be the basis of a peak formation starting to be put into place in the lower time frames.
The following illustrates a bearish bias on the daily and hourly charts:
GBP/USD prior analysis
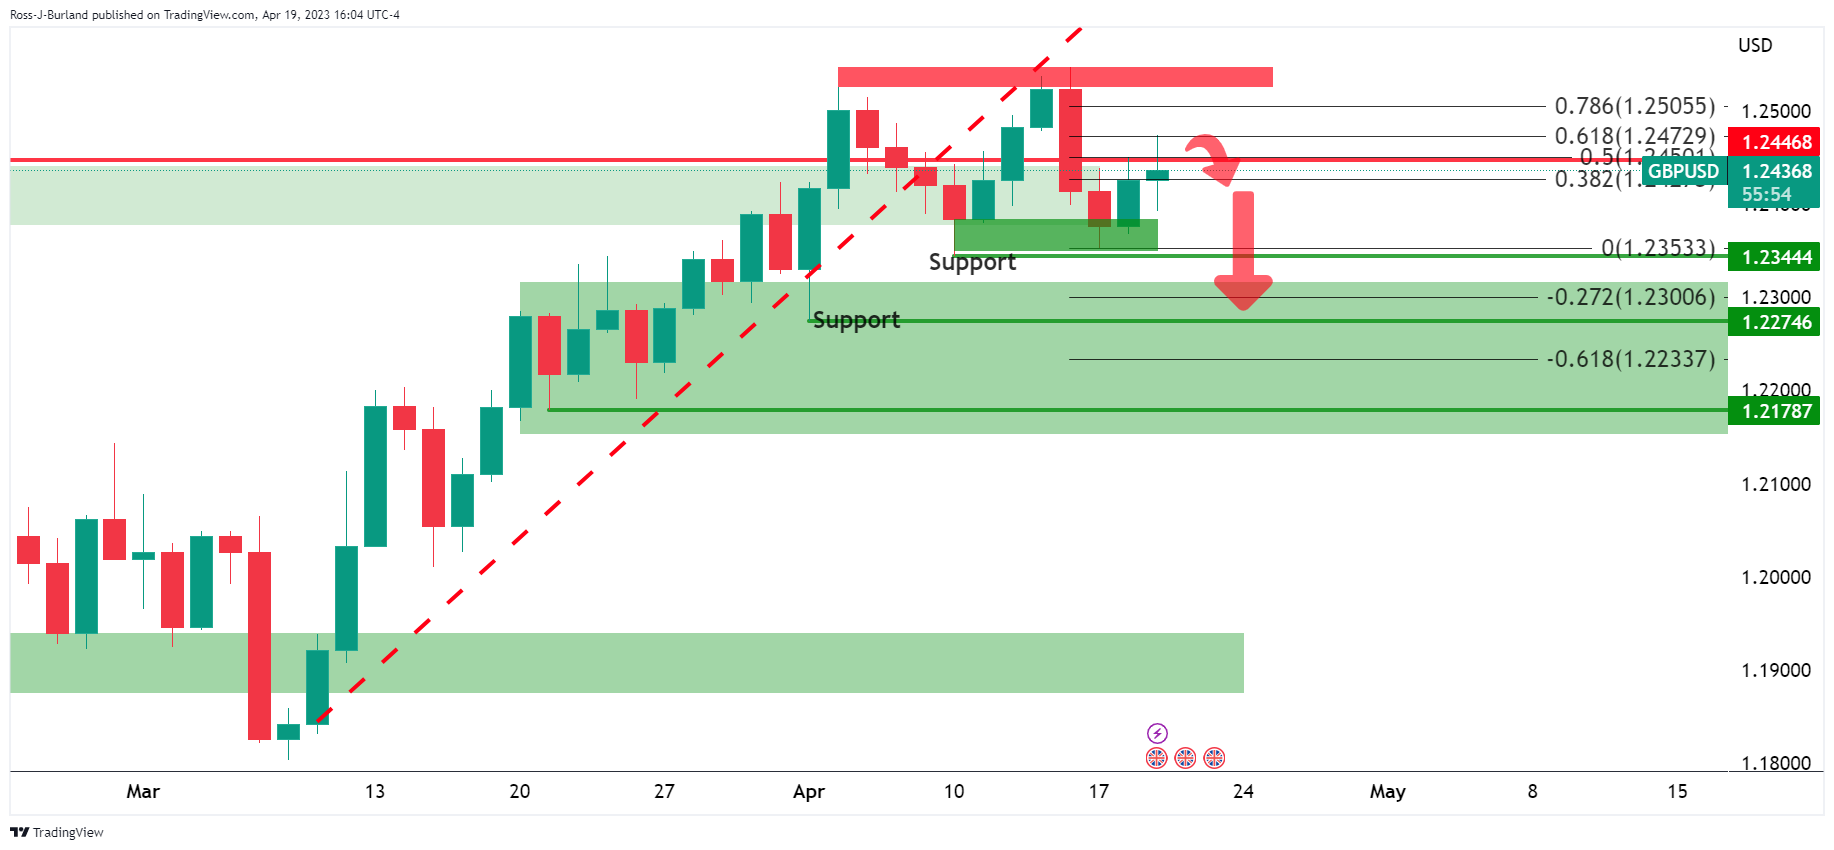
The resistance was holding up the price near 1.2550 and again at 1.2470 near a 61.8% Fibonacci retracement level.
GBP/USD daily chart
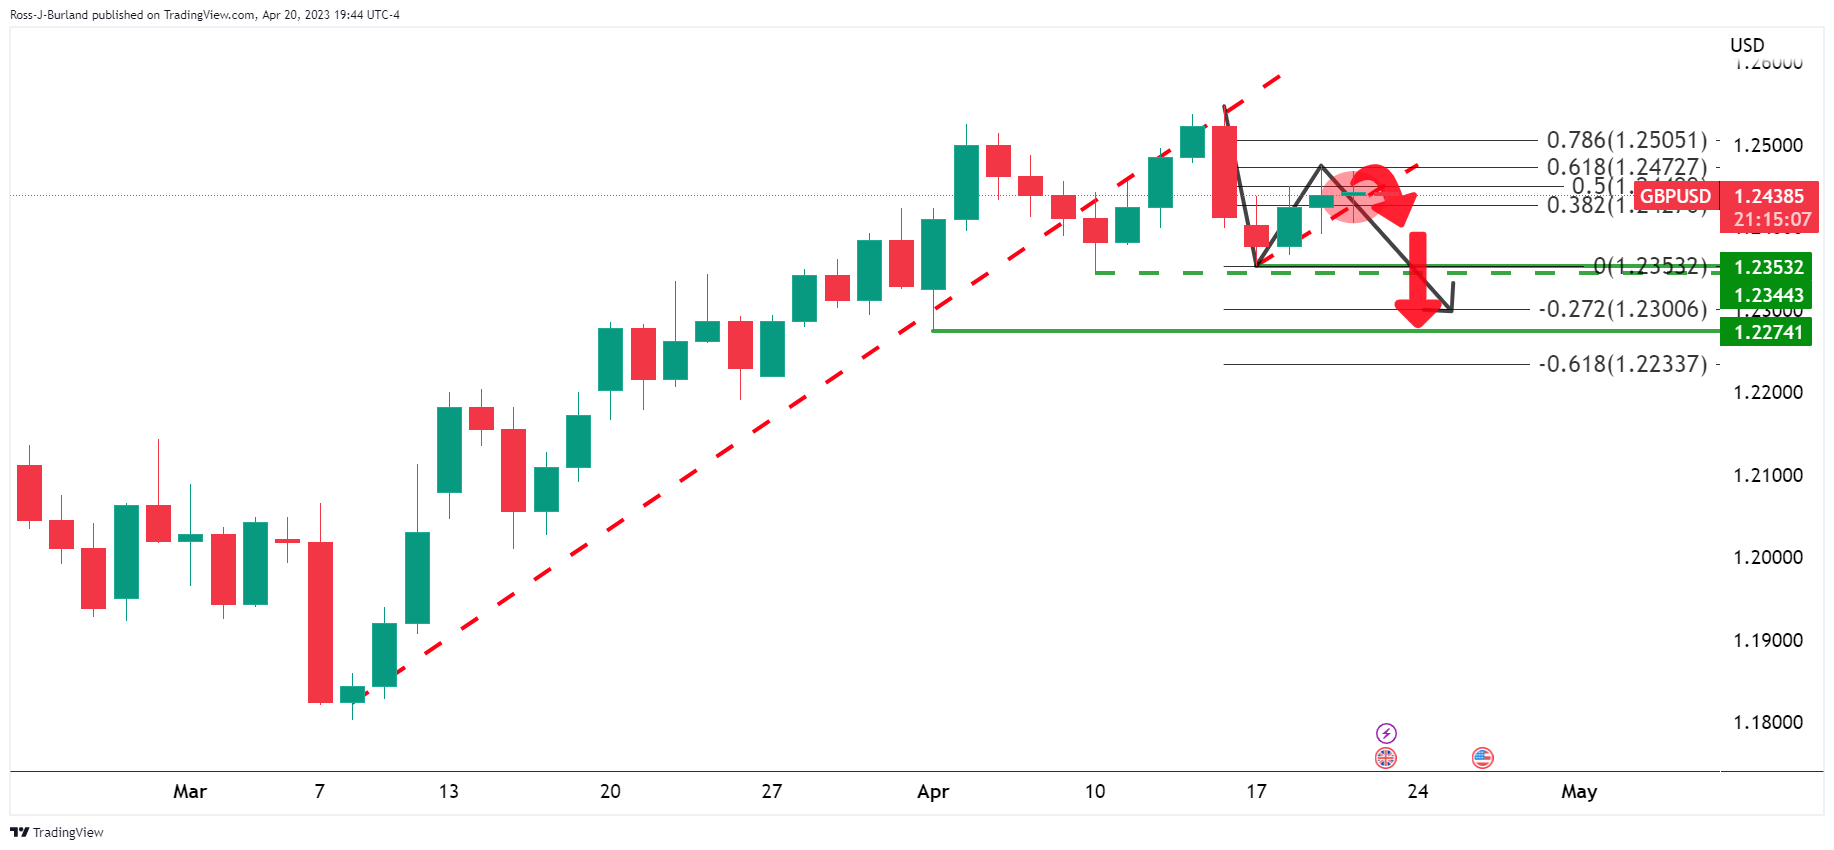
We have seen a doji on Thursday´s close and there there is now the possibility of a downside continuation.
GBP/USD H1 chart
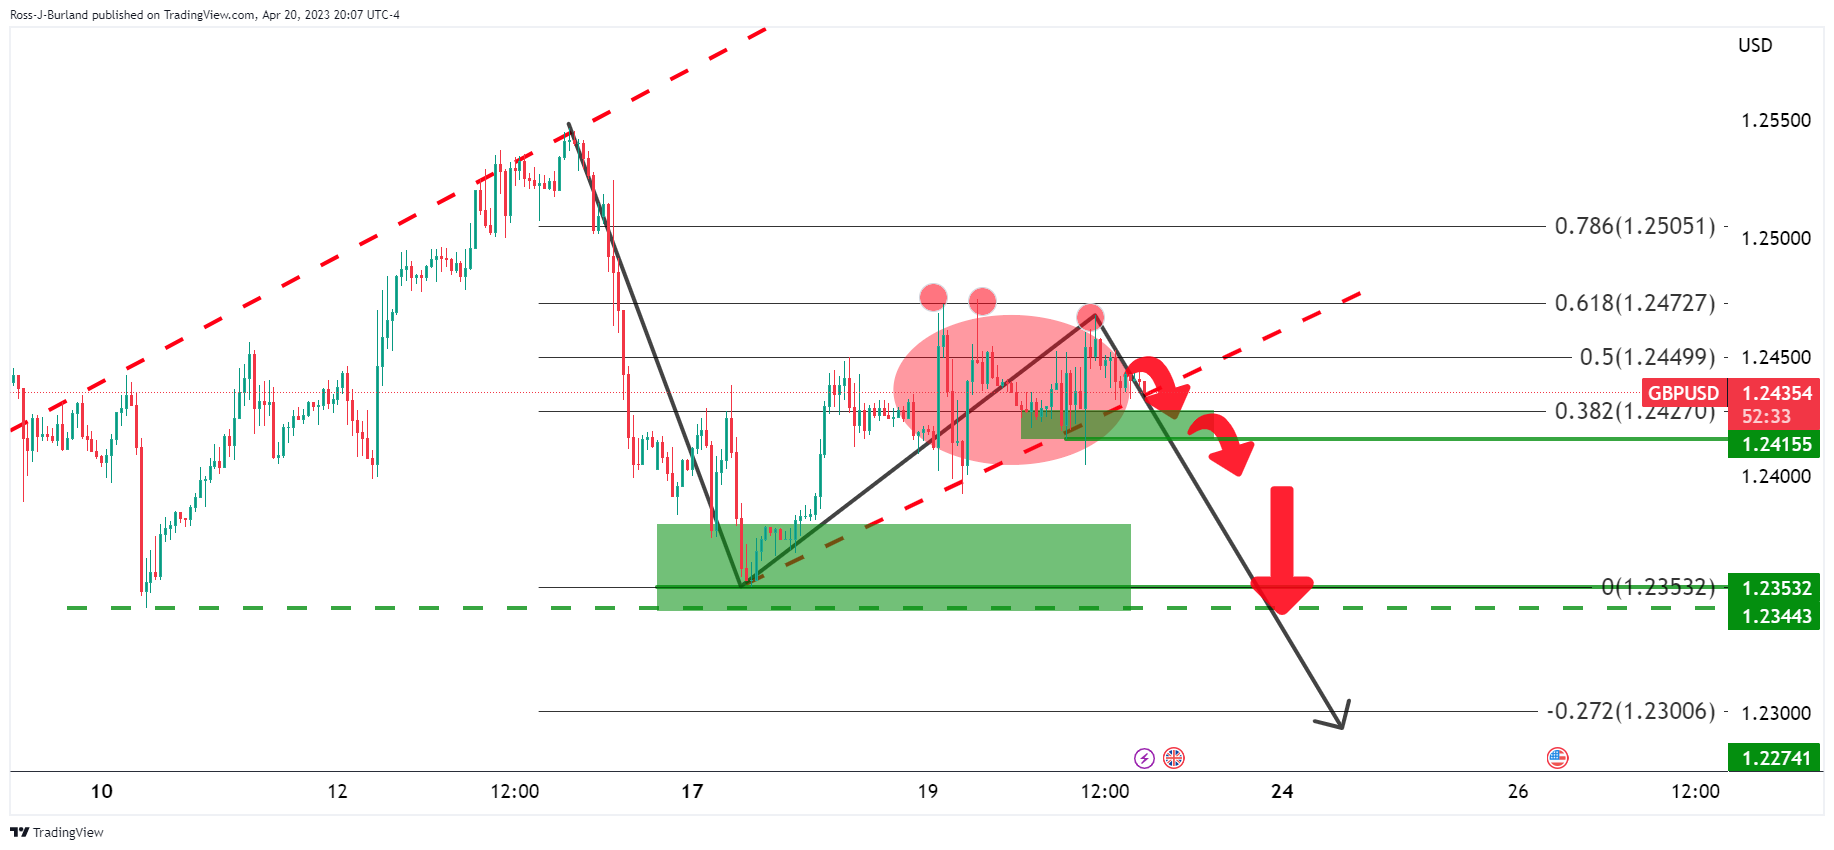
The hourly dynamic trendline support line is being tested and close below the daily chart´s 38.2% Fibonacci and then 1.2415 structure will be penetrating the support, cementing in the bearish bias for the days ahead.
-
00:39
NZD/USD looks vulnerable above 0.6170 as Fed favors more rates despite easing labor market
- NZD/USD is expected to witness a downside after the conclusion of the short-lived pullback to near 0.6170.
- Fed policymakers are supporting more conservative monetary policy despite easing US labor market conditions.
- A significant decline in NZ inflation indicates that the RBNZ is well on track of arresting sticky inflation.
The NZD/USD pair is hovering above 0.6170 in the early Asian session after a less-confident recovery move from 0.6150. The Kiwi asset is expected to resume its downside journey below 0.6150 as Federal Reserve (Fed) policymakers are supporting more conservative monetary policy from the central bank despite easing United States labor market conditions.
S&P500 futures are showing nominal gains in the Asian session after three consecutive bearish settlements, indicating that the overall market sentiment is quite negative. US equities faced extreme pressure on Thursday as investors showed dissatisfaction with the price-cutting spree by Electric Vehicle (EV) maker Tesla.
The US Dollar Index (DXY) has been muted after a volatile session on Thursday ahead of the release of the preliminary US S&P PMI data. As per the consensus, the Manufacturing PMI will land at 49.0, lower than the former release of 49.2. The Services PMI is also seen lower at 51.5 against the figure of 52.6 released earlier. A contraction in economic activities indicates a decline in the overall demand, which would cement the expectations of a slowdown ahead.
US weekly jobless claims data, released on Thursday, supported the view of easing labor market conditions. The Department of Labor showed a jump in jobless claims for the week ending April 14 at 245K higher than the consensus of 240K.
Meanwhile, Fed policymakers are still confident of one more rate hike ahead. St. Louis Fed President James Bullard advocated for the continuation of a policy-tightening spell by the central bank considering the fact that labor market data is still solid, as reported by Reuters. Fed policymaker further added that demand for labor has not softened yet and a strong labor market leads to strong consumption.
The New Zealand Dollar remained in action on Thursday after the release of lower-than-anticipated inflation data. In the first quarter, inflationary pressures accelerated by 1.2% vs. the consensus of 1.7% and the former release of 1.4%. Annual inflation softened to 6.7% while the street was anticipating a marginal deceleration to 7.1% from the prior release of 7.2%.
A significant decline in Kiwi inflation indicates that the Reserve Bank of New Zealand (RBNZ) is on the right track to arresting stick inflation. Investors should be aware of the fact that RBNZ Governor Adrian Orr raised interest rates surprisingly by 50 basis points (bps) to 5.25% in its last monetary policy meeting held on April 05.
-
00:31
Japan National Consumer Price Index (YoY) came in at 3.2%, above expectations (2.6%) in March
-
00:31
Japan National CPI ex-Fresh Food (YoY) in line with forecasts (3.1%) in March
-
00:31
Japan National CPI ex Food, Energy (YoY) came in at 3.8%, above expectations (3.4%) in March
-
00:11
Silver Price Analysis: XAG/USD buyers take a breather before challenging $26.00
- Silver price to remain range-bound around $25.00-$25.50 as oscillators neutralize.
- XAG/USD Price Analysis: Upward biased above $25.00, and it can test $27.00; otherwise, it could dive towards $23.50.
Silver price stays firm at around $25.20, consolidating for the third day in a row, as the Relative Strength Index (RSI) gets out of the overbought territory. Therefore, the XAG/USD lost traction on its way toward $26.00 a troy ounce, but the uptrend stays in play. The XAG/USD is trading at $26.26, a gain of 0.11%.
XAG/USD Price Action
The XAG/USD is trading sideways after recovering from Wednesday’s dip toward $24.65. Even though it looks like a hammer, price action on Thursday was sideways as a classic doji emerged. As the RSI exited overbought conditions, its slope is aiming lower, meaning that sellers are gathering momentum. Meanwhile, the Rate of Change (RoC) portrays bulls jumping off the boat as buying pressure fades.
If XAG/USD remains above $25.00, in the near term, it will test the YTD high at $26.08. A breach of the latter will expose the $26.50 before the XAG/USD tests the last year’s high at $26.94, ahead of reaching $27.00.
On the other hand, the XAG/USD first support would be $25.00. Once broken, the following demand zone would be the April 19 low at $24.65, followed by the $24.00 psychological price level. A dip beyond this area will tumble Silver toward the 50-day EMA at $23.58.
XAG/USD Daily Chart

-
00:10
EUR/USD recovers to near 1.0970 but is inside the woods ahead amid hawkish Fed bets
- EUR/USD is oscillating in a bounded territory amid an absence of a critical trigger.
- Accelerating US weekly jobless claims cemented fears of easing labor market conditions.
- Fed policymakers are still confident of more rate hikes despite easing labor market conditions.
The EUR/USD pair has rebounded from 1.0960 after a corrective move but is inside the woods as investors are awaiting the release of the preliminary Eurozone/United States S&P PMI data (April). The major currency pair has remained in a range of 1.0911-1.1000 from the past two trading sessions as the FX domain is preparing for the pre-anxiety move ahead of a monetary policy decision from the Federal Reserve (Fed).
S&P500 settled on a negative note consecutively for the third day amid sheer volatility inspired by quarterly result season. Weak earnings from Tesla weighed heavily on market sentiment on Thursday. Also, poor revenue guidance due to the consideration of lowering prices cautioned market participants. The impact of higher interest rates by the Fed is clearly visible in the quarterly earnings show. As per Refinitiv data, analysts have largely retained last week's expectations of a near 5% YoY fall in quarterly profits of companies in the 500-US stocks basket.
The US Dollar Index (DXY) is defending the critical support of 101.60 for the past few trading sessions. The USD Index also defended the aforementioned support on Thursday despite the release of downbeat Jobless claims data. The US Department of Labor reported a jump in the number of Initial Jobless Claims for the week ending April 04 at 245K, higher than the estimates and the former release of 240K. Accelerating jobless claims cemented fears of easing labor market conditions.
However, Fed policymakers are still confident of more rate hikes from the central bank. Cleveland Federal Reserve President Loretta Mester reiterated on Thursday that the Fed has more work to do with inflation in the US staying too high, per Reuters. He further added, "Fed will need to hike policy rate to over 5% and hold there for a while."
On the Eurozone front, preliminary Consumer Confidence (April) improved to -17.5 from the expectations of -18.5 and the former release of -19.2. This could be the outcome of a consistent decline in inflationary pressures after enormous efforts from the European Central Bank (ECB).
-
00:01
United Kingdom GfK Consumer Confidence came in at -30, above forecasts (-35) in April
-
00:00
Australia S&P Global Services PMI climbed from previous 50.7 to 52.6 in April
-
00:00
Australia S&P Global Manufacturing PMI below expectations (48.8) in April: Actual (48.1)
-
00:00
Australia S&P Global Composite PMI up to 52.2 in April from previous 48.5
-