Notícias do Mercado
-
23:38
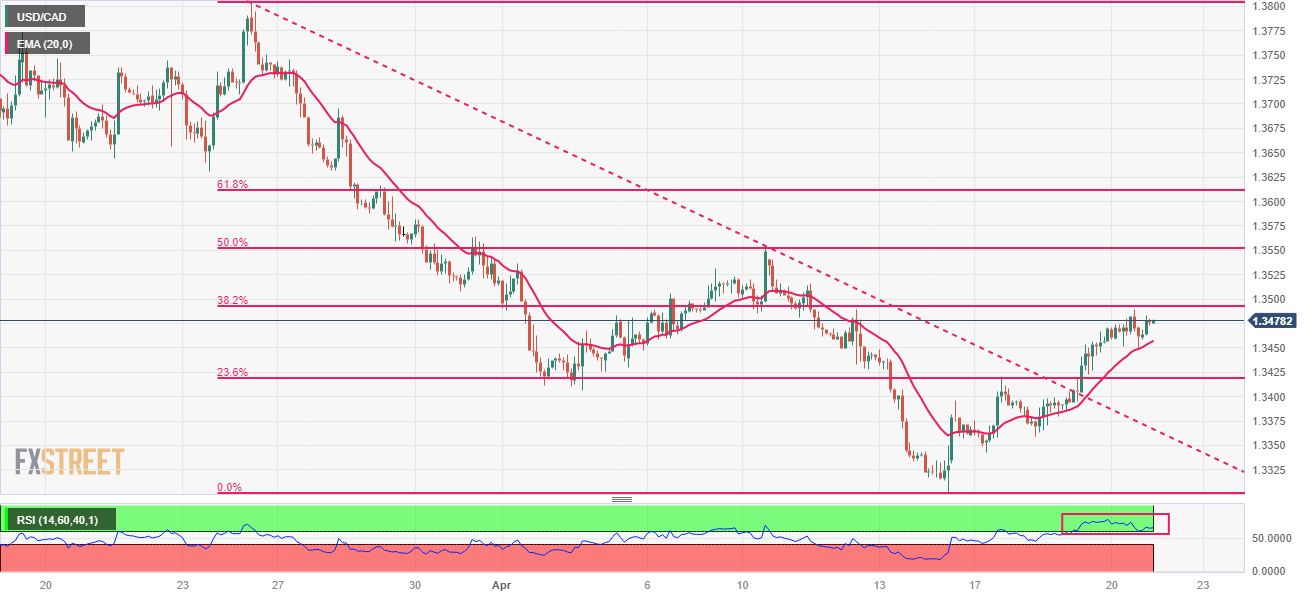
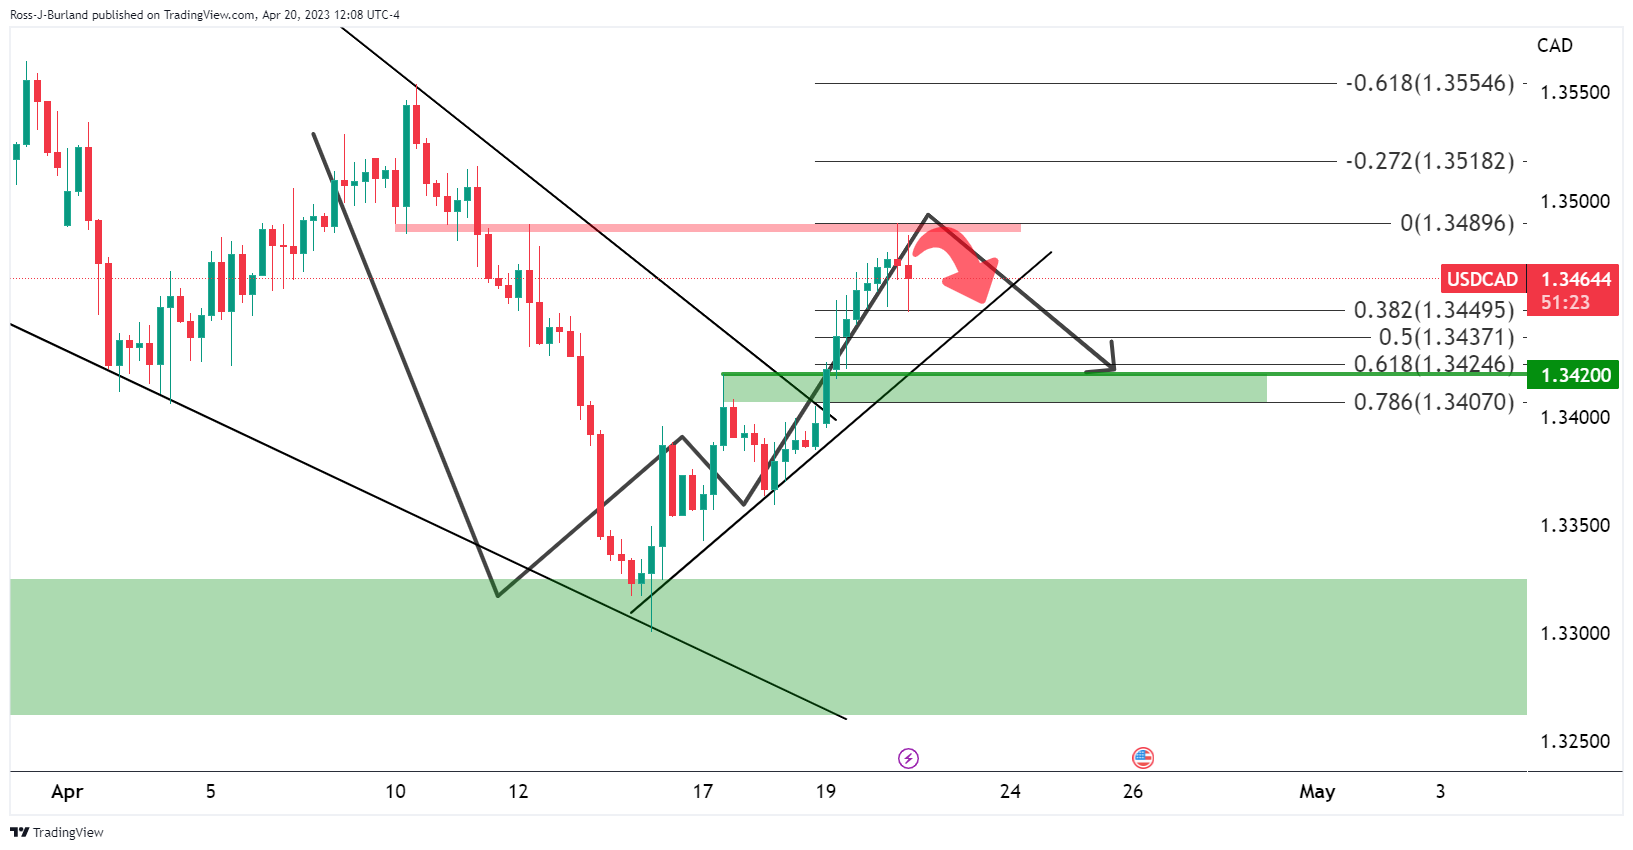
USD/CAD Price Analysis: Approaches 1.3500 amid weak oil prices, Canada Retail Sales eyed
- USD/CAD is marching towards 1.3500 as weak oil prices have impacted the Canadian Dollar.
- Monthly Retail Sales data (Feb) are expected to contract by 0.5% vs. an expansion of 1.4% recorded in January.
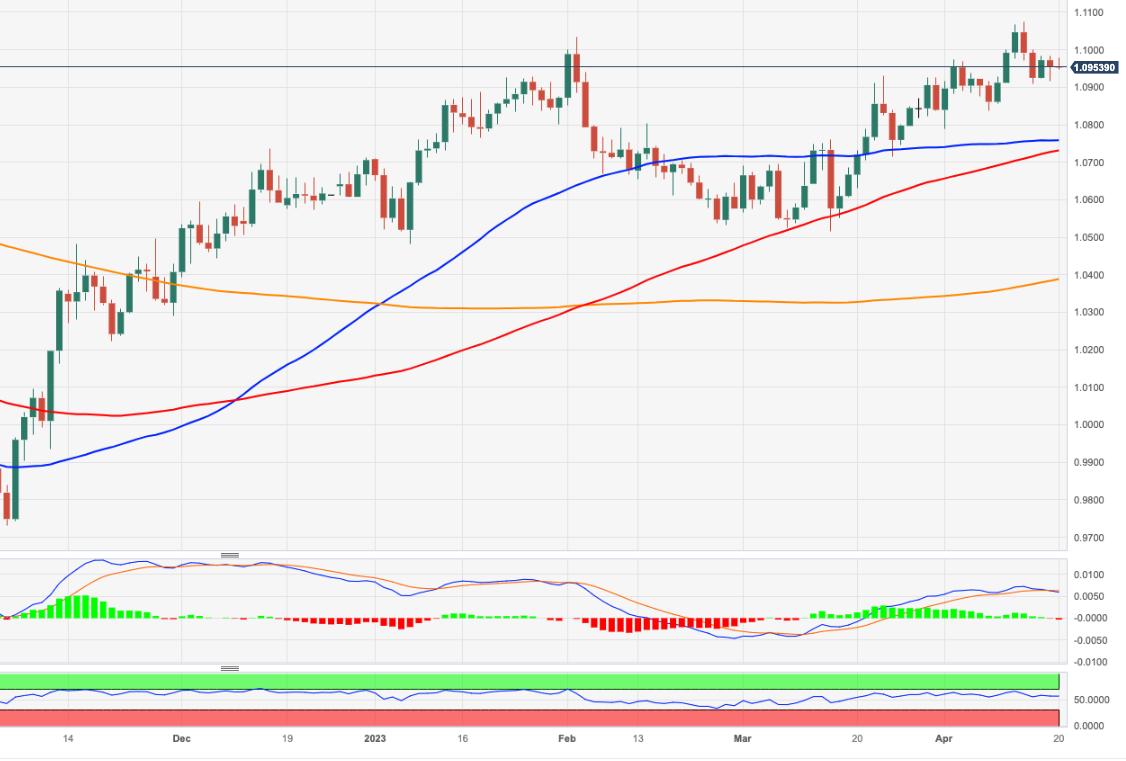
- USD/CAD is struggling in extending its upside journey after reaching near the 38.2% Fibo retracement at 1.3493.
The USD/CAD pair is gathering strength to recapture the psychological resistance of 1.3500 in the early Tokyo session. The Loonie asset is showing enormous strength despite a corrective move in the US Dollar Index (DXY). The USD Index has corrected sharply below 101.80 after failing to recapture the critical resistance of 102.00.
Therefore, the strength in the Loonie asset is coming from the weak Canadian Dollar, which is the outcome of diving oil prices. The oil price is on the verge of slipping below the immediate support of $77.00. The downside journey in the oil price is expected to find an intermediate support of around $75.65. The black gold has surrendered the majority of gains generated after the surprise announcement of production cuts by OPEC+.
Volatility is expected from the Canadian Dollar ahead of the release of Canada’s Retail Sales data. As per the consensus, monthly Retail Sales data (Feb) are expected to contract by 0.5% vs. an expansion of 1.4% recorded in January. Weak retail demand would provide some relief to the Bank of Canada (BoC) ahead.
USD/CAD witnessed a steep rise after breaking above the downward-sloping trendline plotted from March 24 high at 1.3804 on a two-hour scale. The Loonie asset is struggling in extending its upside journey after reaching near the 38.2% Fibonacci retracement (plotted from March 24 high at 1.3804 to April 14 low at 1.3300) at 1.3493.
The 20-period Exponential Moving Average (EMA) at 1.3458 is providing support to the US Dollar.
Meanwhile, the Relative Strength Index (RSI) (14) is oscillating in the bullish range of 60.00-80.00, indicating more upside ahead.
A decisive break above 38.2% Fibo retracement at around 1.3500 will drive the asset toward the April 10 high at 1.3554. A breach of the latter will expose the asset to round-level resistance at 1.3600.
On the flip side, a break below the round-level support of 1.3300 will drag the Loonie asset toward February 01 low at 1.3267, followed by 15 November 2022 low at 1.3226.
USD/CAD two-hour chart
-
23:17
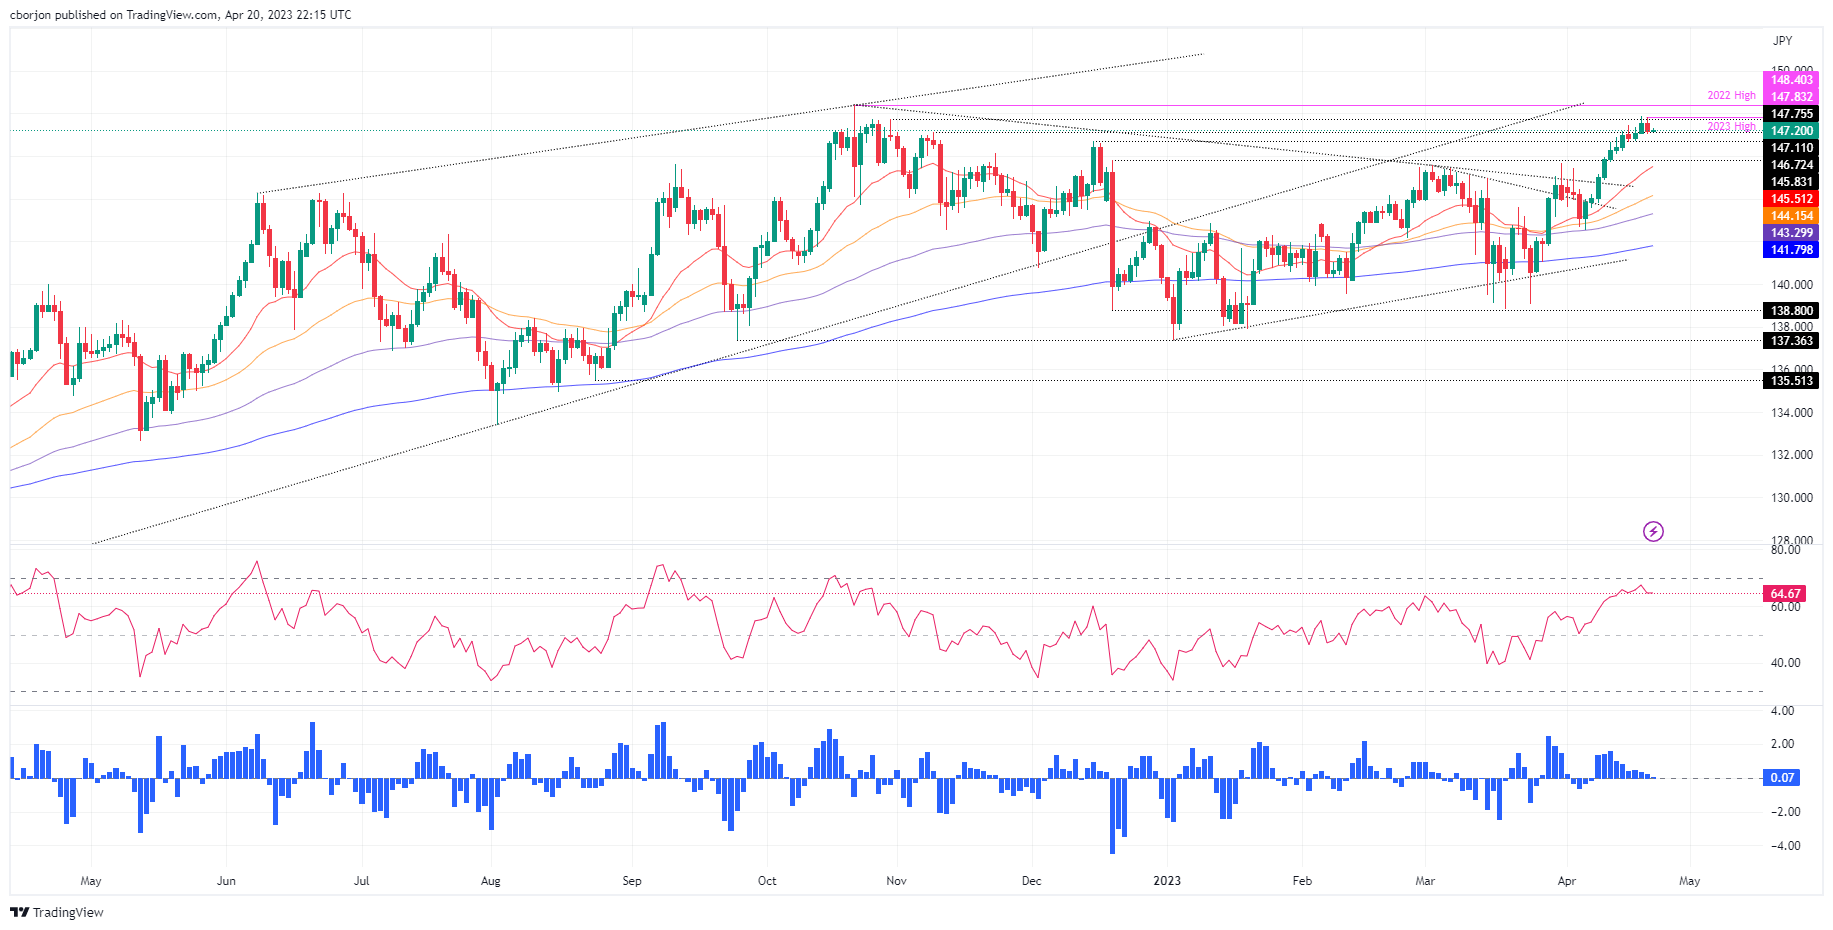
EUR/JPY Price Analysis: Dark cloud cover emerges, threatening to drag Euro’s price lower
- Dark cloud cover in the EUR/JPY daily chart suggests a pullback could be underway.
- EUR/JPY sellers are losing momentum as oscillators shifted neutral.
The EUR/JPY retraced Wednesday’s gains on Thursday, as the pair formed a dark cloud cover. The two-candlestick chart pattern suggests the pair could be headed downwards, but a daily close below 147.02 is needed to confirm the chart pattern. As Friday’s Asian session begins, the EUR/JPY is trading at 147.25, registering minuscule gains of 0.04%.
EUR/JPY Price Action
EUR/JPY has managed to extend its rally past the 147.00 area, reaching a YTD high at 147.86; it retreated to the 147.20 area as oscillators turned flat, suggesting buyers are losing momentum. In addition, a forming dark cloud cover could open the door to test 147.00, a crucial area for buyers/sellers, which, once cleared, the latter will eye the 20-day Exponential Moving Average (EMA) at 145.52 as the first support to test.
If the EUR/JPY resumes downwards after challenging 145.52, the following support should be the psychological 145.00 figure, followed by the 50-day Exponential Moving Average (EMA) at 144.15.
On the other hand, if EUR/JPY stays above 147.00, that could pave the way for further upside. The EUR/JPY key resistance areas lie at the YTD high of 147.86, followed by the 148.00 mark. Break above; the EUR/JPY will challenge the 2022 high at 148.40.
EUR/JPY Daily Chart
-
23:07
AUD/USD rebounds from 0.6730 ahead of preliminary Australian S&P PMI
- AUD/USD has shown a rebound from 0.6730 as the upside in the USD Index looks capped.
- An increase in US weekly jobless claims indicates that labor market conditions are not tight enough for now.
- The Australian Dollar has shifted into a bullish trajectory as PBoC is ready to implement a prudent monetary policy.
The AUD/USD pair has shown a decent recovery after a corrective move to near 0.6730 in the early Asian session. The Aussie asset displayed a steep rise on Thursday after Zou Lan, head of monetary policy, at People Bank of China (PBOC) reaffirmed on Thursday that the central bank “will continue implementing prudent monetary policy.”
S&P500 witnessed a steep fall on Thursday after Tesla failed to cheer market participants from its quarterly earnings. The 500-US stock basket delivered a third consecutive bearish closing, portraying a risk aversion theme. Electric Vehicle (EV) maker Tesla reported the lowest quarterly gross margins in two years as the firm is on the path of slashing rates. The firm signaled that more price declines are in pipeline.
The US Dollar Index (DXY) showed a wild gyration in the 101.63-102.13 range and went back inside the woods. The release of the weekly jobless claims confirmed that United States labor market conditions are loosening swiftly and firms are postponing their recruitment plans. As per the report, weekly jobless claims increased to 245K, higher than the consensus and the former release of 240K for the week ending April 14.
The Australian Dollar shifted into a bullish trajectory as PBoC is ready to implement a prudent monetary policy, whenever required, to support the overall demand. Earlier, the PBoC announced an unchanged policy as the Chinese economy is well on track for economic recovery. It is worth noting that Australia is a leading trading partner of China and a quick economic recovery in China will also strengthen the Australian Dollar.
Going forward, preliminary Australian S&P PMI data will be keenly watched. As per the consensus, Manufacturing PMI will drop to 48.8 from the former release of 49.1.
-
23:01
BoE's Tenreyro: UK’s inflation target is `flexible'
Bank of England´s monetary policymaker Silvana Tenreyro said on Thursday that the UK’s inflation target is`flexible'. Her comments follow up from Tuesday´s when she said that the BoE will probably need to start cutting interest rates sooner than previously thought after raising them sharply in recent months despite signs of weaker inflation pressures, monetary policymaker Silvana Tenreyro said on Tuesday.
"I expect that the high current level of Bank Rate will require an earlier and faster reversal, to avoid a significant inflation undershoot," Tenreyro said in the text of a speech she was due to make at the Royal Economic Society's annual conference in Glasgow.
GBP/USD update
GBP/USD has traveled between a low of 1.2404 and a high of 1.2467 on Thursday.
-
22:57
Fed’s Bostic: Inflation is too high, Fed must get it down to 2%
Atlanta Federal Reserve President Raphael Bostic has repeated the rate hike narrative and his comments follow those said on Tuesday when he said that he envisions the central bank approving one more interest rate increase before pausing to see how policy tightening is impacting the economy.
On CNBC, he said “one more move should be enough for us to then take a step back and see how our policy is flowing through the economy, to understand the extent to which inflation is returning back to our target.´´
-
22:17
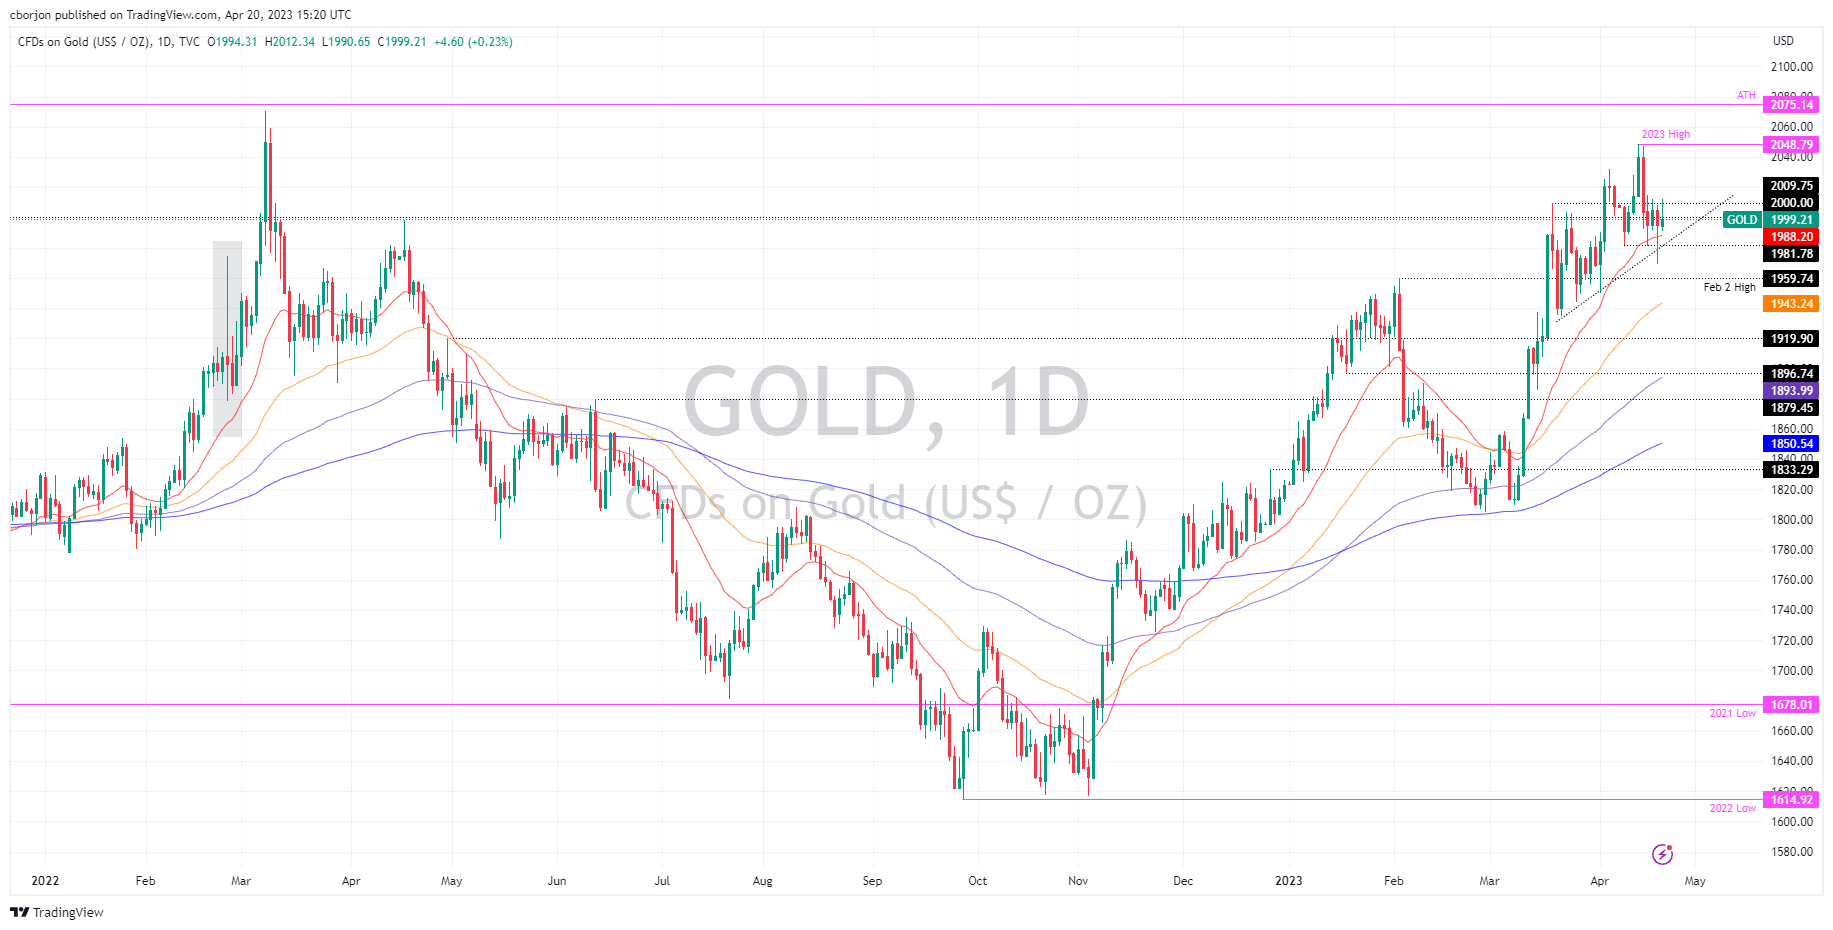
Gold Price Forecast: XAU/USD bears lurking as right shoulder forming
- Gold price forming a Head & Shoulders toppìng formation on the daily chart.
- US data, US Treasury yields, and Federal Reserve sentiment is Gold price the driving force.
The Gold price, XAU/USD, is up around 0.5% near $2,005 and has traveled between a low of $1,990.56 and a high of $2,012.44 so far on Thursday. The price is clustered in a phase of consolidation on the backside of the bullish trend as illustrated in the technical analysis below.
Gold price fundas
Meanwhile, the fundamentals that are playing in surround the state of the US economy and how that is affecting US yields. The yield on the US 10-year note dropped 4bp to 3.55% as the softer Beige Book drove a strong rally in back-month fed fund futures. The moves have supported a bullish correction in the Gold price as the US Dollar fell, as per the DXY index, to a low of 101.632 from a high of 102.126.
Meanwhile, the futures pricing has shown a 90% chance the Federal Reserve will hike rates 25 basis points when policymakers conclude a two-day meeting on May 3, according to CME's FedWatch Tool. In recent Fed speak, Federal Reserve´s Governor Christopher Waller said on Friday that despite a year of aggressive rate increases, the Fed "hasn't made much progress" in returning inflation to their 2% target and argued that rates still need to go up. As such, the likelihood of a rate cut by December has narrowed considerably this week.
Looking ahead, the Federal Open Market Committee will enter a blackout this weekend ahead of the 2/3 May meeting. The latest guidance is very much in line with market pricing and Atlanta Federal Reserve President Bostic said that he favors one more 25bp rate hike and then a pause. Bostic explained that tightening in credit conditions could do some of the Fed’s work. ´´The Atlanta Fed has historically been seen, rightly or wrongly, as a barometer of consensus on the FOMC,´´ analysts at ANZ Bank said.
Federal Reserve Bank of New York President John Williams also said on Wednesday inflation was still at problematic levels, and the US central bank would act to lower it. Looking ahead, the Federal Open Market Committee will enter a blackout this weekend ahead of the 2/3 May meeting.
Meanwhile, analysts at TD Securities explained that the Gold price managed to fend off a break below key trigger levels for CTA liquidations. ´´Retail demand has remained particularly strong following the banking liquidity crisis, but easing fears could see interest subside amid higher prices.´´
´´While slumping rates likely kept gold bulls from liquidating,´´ the analysts said, ´´discretionary traders remain broadly flat, CTAs are still effectively near max long, and Shanghai trade positioning is also near multi-year highs — leaving fewer culprits for the surprising buying activity over the last session.´´
´´In this context, central bank demand remains key to a continued rally, and has shown few signs of buyer fatigue, but 'unofficial' holdings estimates which have been particularly important over the last quarters will only be updated in May,´´ the analysts argued.
Gold price technical analysis
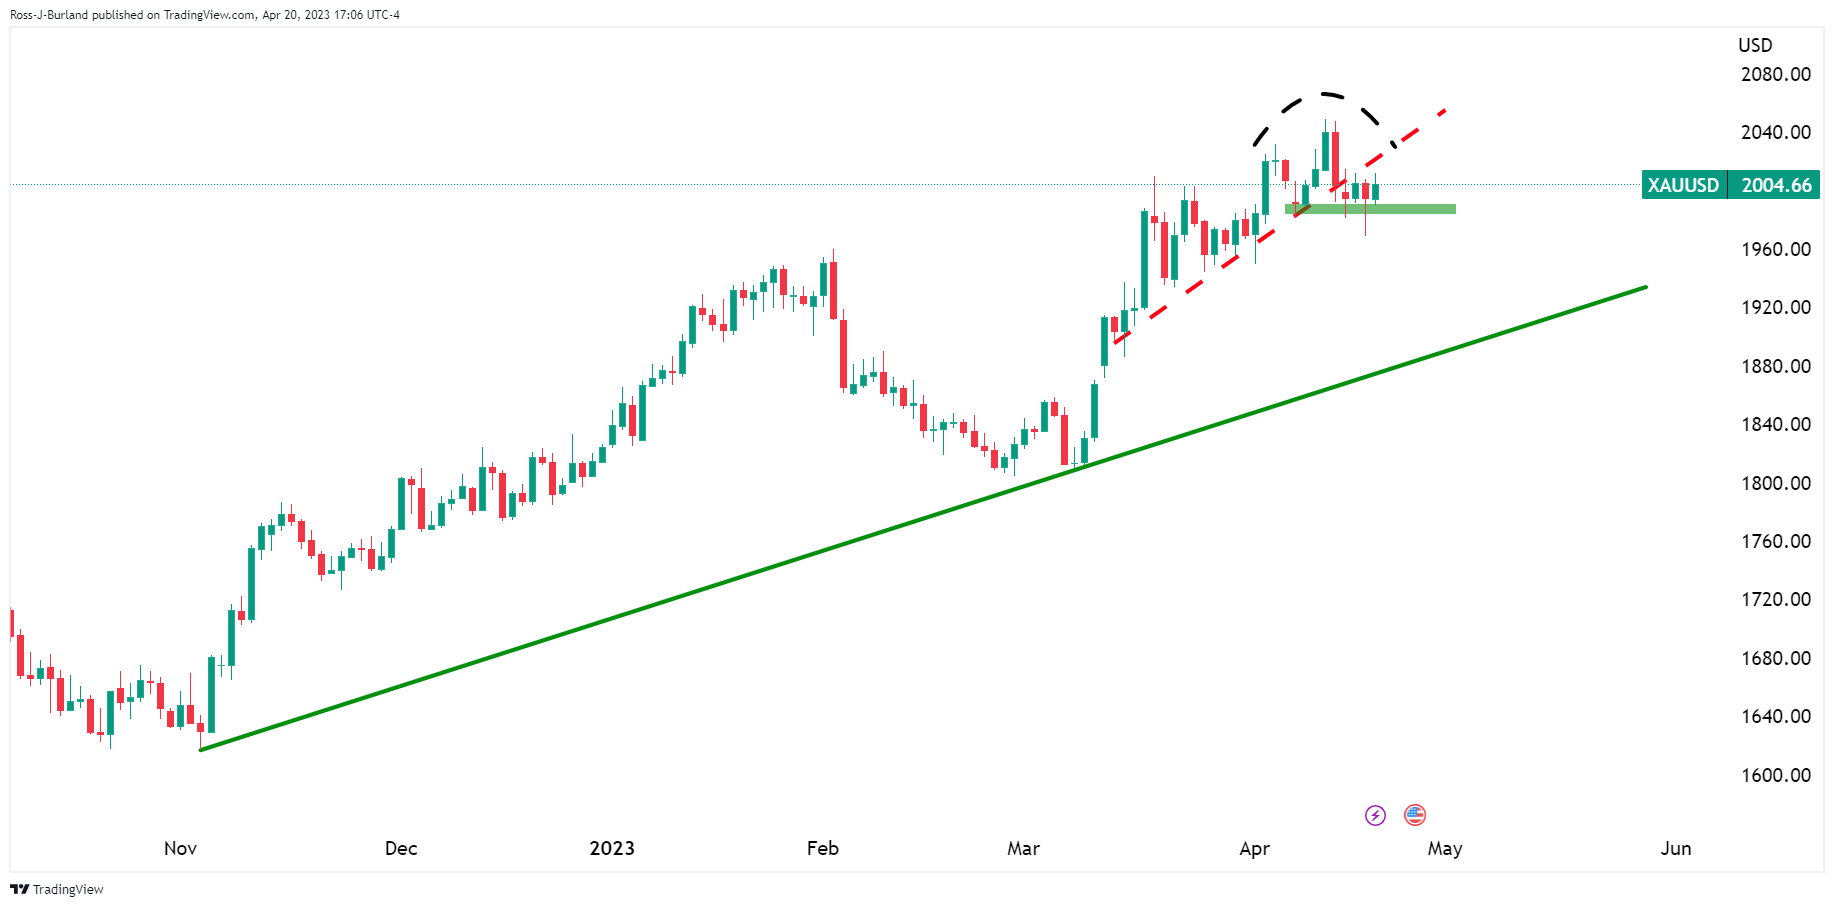
As illustrated above and below, we could have a topping pattern in place for the Gold price.
Gold price H4 chart
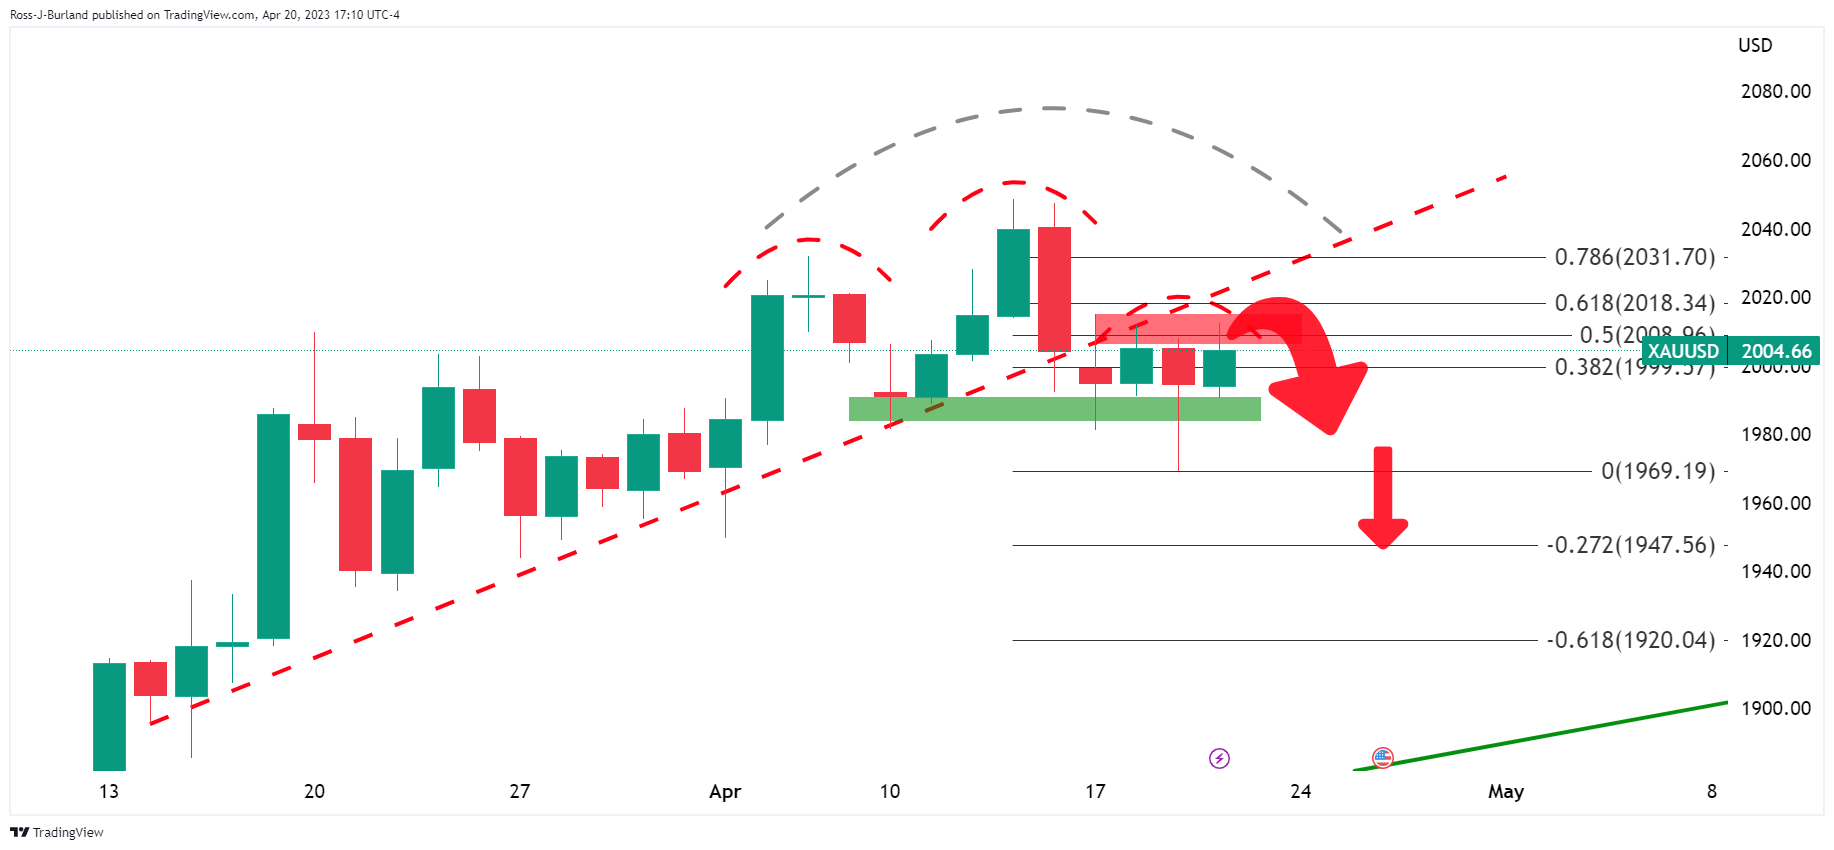
The Gold price has slid to the backside of the trendline support and a break of the neckline horizontal support of the Gold price Head & Shoulders pattern is needed to switch the bias fully negative from out of the consolidation.
-
22:02
Forex Today: Mixed markets limit Dollar’s slide, attention turns to global PMIs
Global manufacturing and services PMI data will be released Friday. The S&P Global PMIs will be watched closely by market participants and could have a considerable impact on risk sentiment. Could the US Dollar benefit from downbeat numbers?
Here is what you need to know on Friday, April 21:
The US Dollar continued to move mostly sideways. Weaker-than-expected US economic data weighed on the Greenback that later benefited from a decline in equity prices on Wall Street. The Dow Jones lost 110 points or 0.33%, and the Nasdaq fell 0.80%. US Treasury yields pulled back from weekly highs, with the 10-year yield settling at 3.53%, the lowest in three days.
US S&P Global PMIs Preview: Win-win situation for the Dollar? Why investors may get spooked
The US Labor Department informed Initial Jobless Claims rose to 245K in the week ended April 15, while Continuing Claims increased by 61K in the week ended April 8 to 1.865 million, the highest since November 2021. A different report showed that manufacturing activity in the Philadelphia area unexpectedly contracted in April. The Philly Fed dropped to -31.3 from 23.2 in March, against expectations of an increase to -19.2. Existing Home Sales dropped to 4.44 million (annual rate) against expectations of 4.5 million.
The accounts of the European Central Bank (ECB) March meeting showed that had it not been for the banking crisis, the central bank would have signaled determination to more tightening ahead. The ECB looks set to raise rates further in May, but the size remains open. EUR/USD approached 1.1000 and then pulled back to the 1.0950 zone as the pair continues to move sideways. On Friday, the critical report is the Eurozone S&P Global PMI. Many ECB officials will speak.
GBP/USD posted another daily close near 1.2440 as it remains supported by the 20-day Simple Moving Average. The pair continues to consolidate, unable to retake 1.2500. The UK will report Retail Sales on Friday.
USD/JPY traded near 135.00 but then turned to the downside, hitting 134.00 amid lower government bond yields across the globe. Next week, the Bank of Japan (BoJ) will have its first monetary policy meeting under Governor Ueda. The recent banking crisis and comments from the new governor eased expectations of changes to the monetary policy stance. Japan releases inflation data.
The Kiwi was among the worst performers on Thursday hit by New Zealand inflation data. The Consumer Price Index (CPI) grew by 6.7% in the first quarter, against expectations of 6.9%, the lowest since the fourth quarter 2021. At the last meeting, the Reserve Bank of New Zealand (RBNZ) increased the OCR rate by 50 basis points, surprising on the hawkish side.
NZD/USD bottomed at 0.6148, a one-month low, and then recovered toward 0.6200 boosted by a weaker US Dollar. EUR/NZD reached the highest level since October 2020 above 1.7800, while AUD/NZD broke above 1.0900 for the first time since February.
The Australian Dollar outperformed on Thursday. AUD/USD reached a six-day high at the 0.6770 resistance area and pulled back. The short-term bias is up, without much conviction. An improvement in risk sentiment could help the pair.
USD/CAD continued to move higher and reached weekly highs at 1.3489 before trimming gains. A bearish correction is on the table unless the pair surpasses the 20-day SMA at 1.3487 and the 1.3500 mark. Canadian Retail Sales numbers are due on Friday.
Gold rose supported by lower yields, climbing above $2,000/oz. Silver moved sideways around $25. Bitcoin tumbled more than 3% again. BTC/USD stands at $28,250, still looking under pressure. Concerns about a recession weighed further on crude oil prices, which dropped by more than 2%. WTI slid toward $77.00, hitting the lowest since late March.
Like this article? Help us with some feedback by answering this survey:
Rate this content -
22:00
South Korea Producer Price Index Growth (YoY) registered at 3.3%, below expectations (4.1%) in March
-
22:00
South Korea Producer Price Index Growth (MoM) came in at 0.1%, below expectations (0.4%) in March
-
21:01
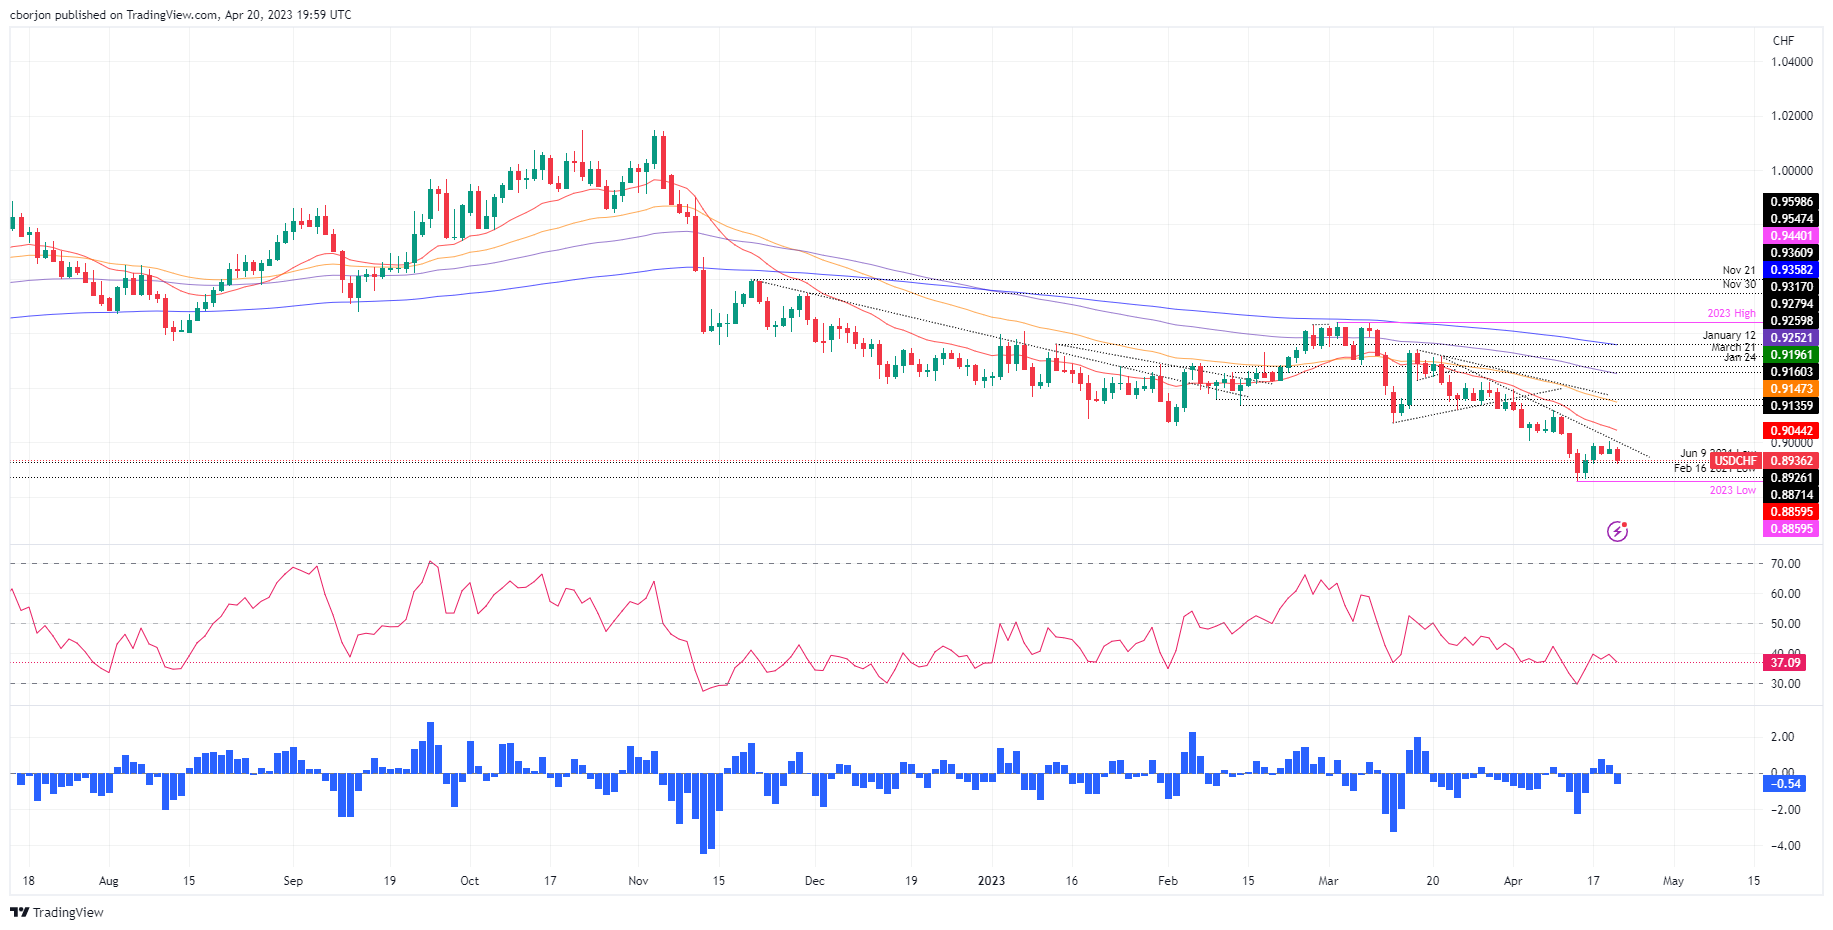
USD/CHF Price Analysis: Takes a bearish turn as sellers move in around 0.9000
- USD/CHF prepares to resume its bearish biased, confirmed by oscillators and sellers stepping in at around 0.9000.
- If USD/CHF sellers reclaim 0.8900, look for a test of the YTD low at 0.8859.
- Upside risks lie above 0.9000, with buyers eyeing the 20-day EMA.
USD/CHF reversed its course after hitting a weekly high of 0.9003 and fell, as the sellers remain committed to defending the 0.9000 figure. After consolidating for back-to-back days in the 0.8950-0.9000 range, the USD/CHF exchanges hands at 0.8933, down 0.45%.
USD/CHF Price Action
The USD/CHF posted two positive days and remained in the front foot during the week before turning negative. Sellers are gathering momentum, as shown by the Relative Strength Index (RSI), which is stills in bearish territory. In addition, the Rate of Change (RoC) also turned bearish, suggesting that the USD/CHF pair could resume its downward bias.
If USD/CHF continues lower, the next support would be the April 14 daily low at 0.8866. Once broken, up next would be the YTD low at 0.8859, followed by the 0.8800 figure.
On the other hand, the USD/CHF first resistance would be the confluence of a one-month-old downslope trendline around 0.8990, followed by the 0.9000 figure. A breach of the latter, the USD/CHF can rally towards the 20-day Exponential Moving Average (EMA) at 0.9044 before aiming towards April 10 daily high at 0.9120.
USD/CHF Daily Chart
-
21:00
USD/JPY Price Analysis: Bears lurking near 134.50 for a downside correction
- USD/JPY is carving out the prospects of a deeper correction.
- The bullish bias prevails while on the front side of the broader bullish trendline.
USD/JPY is down 0.26%, losing ground in late New York trade within the day´s range of 134.01 the earlier low and last Asian high of 134.97.
As per the prior analysis, USD/JPY Price Analysis: Bulls move in to test bears near 135.00, the price moved into the resistance and bulls threw in the towel and a break of structure leaves the focus on a fuller correction to the downside as the following illustrates:
USD/JPY, prior analysis
USD/JPY H4 charts
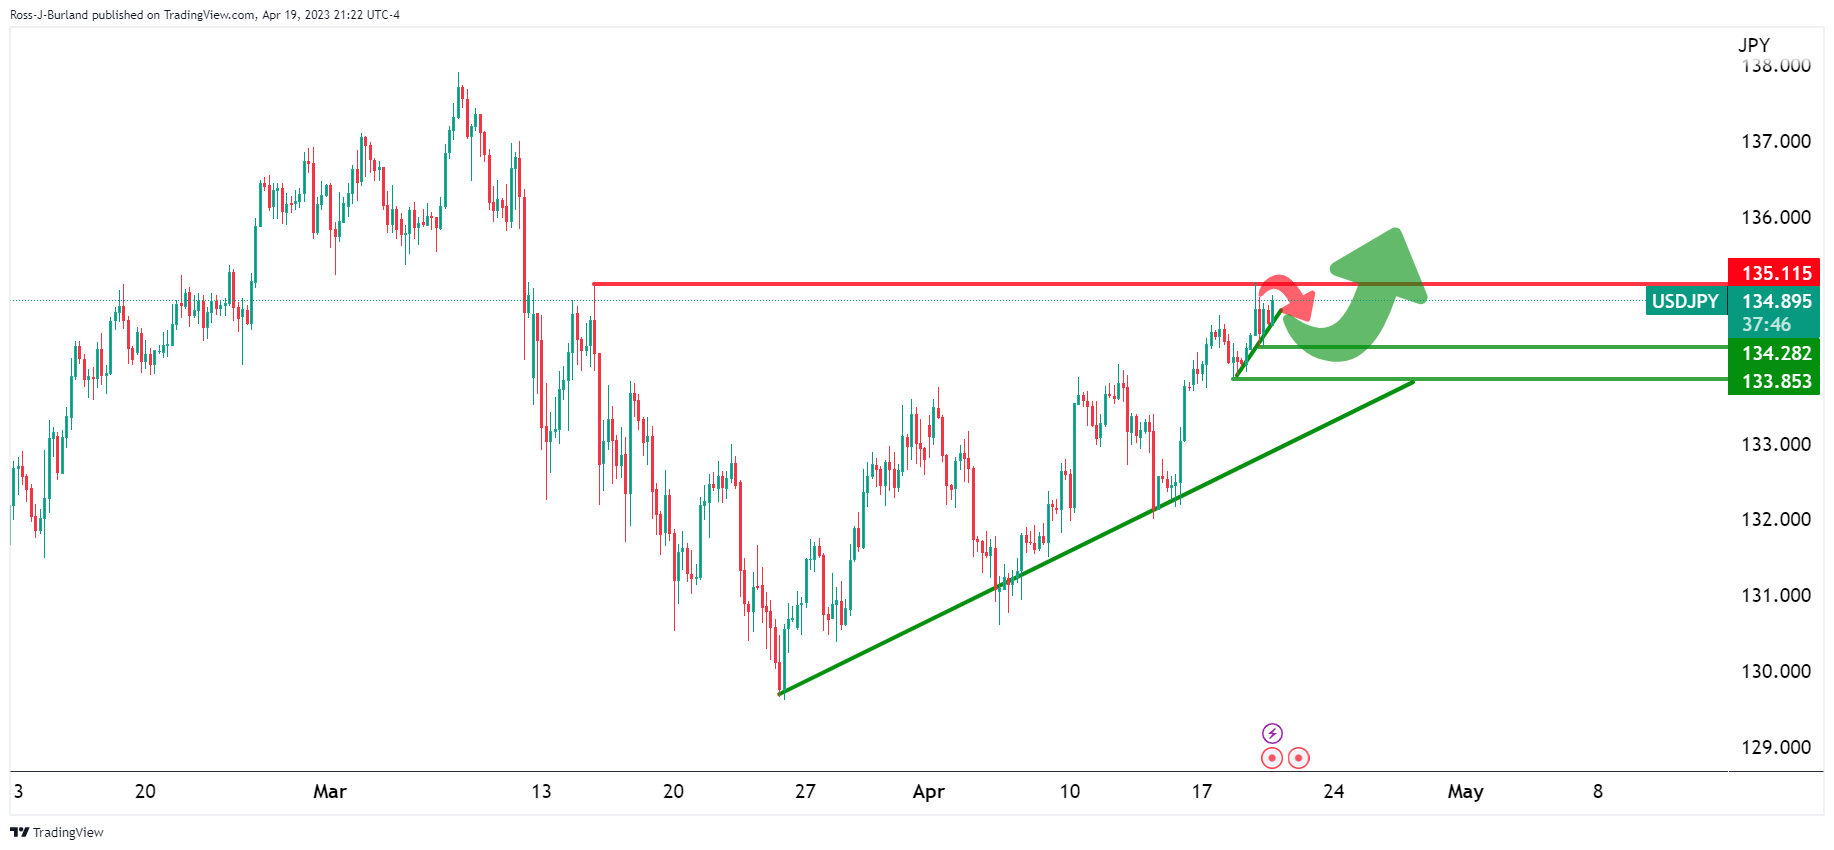
It was stated that the overall bullish scenario, above, forecasted the prospects of a break of the micro trendline and a move to test the low 134s before the bulls engaged again for the push higher, as per the weekly W-formation´s outlook explained and illustrated in the prior analysis. A more bearish scenario, below, highlighted the chances of a breakdown into the broader trendline support.
USD/JPY updates
We are seeing a break in the structure in the 134.20s which leaves the focus on the downside.
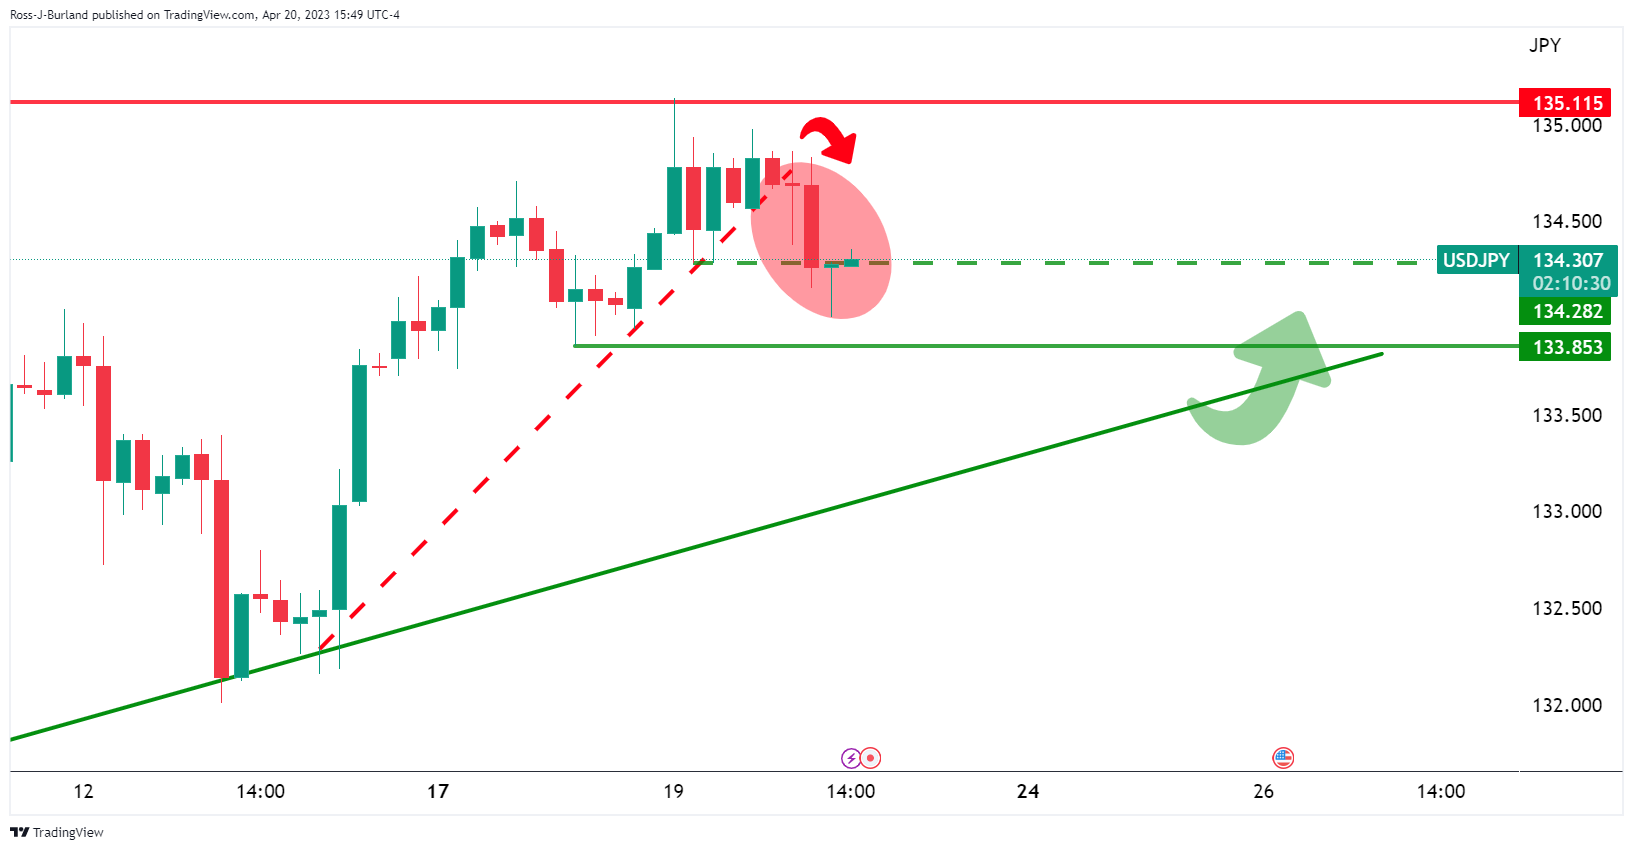
However, a bullish correction of the break in structure is underway and the following offers a potential trajectory in the price encompassing a correction and then a downside continuation:
Pulling up the Fibonacci scale, we can see that the prior support aligns with a cluster of Fibos between the 38.2% and 61.8% ratios and a 50% mean reversion in-between.
-
20:01
Argentina Trade Balance (MoM) came in at $-1059M below forecasts ($-158M) in March
-
19:55
GBP/USD bears in the market as profit taking kicks in
- GBP/USD pressured in late New York trade, trading back to flat for the day.
- UK inflation and rates are in focus following the Office for National Statistics showing price pressures everywhere.
GBP/USD is flat in late New York trade, under pressure however, and falling away from 1.2467 highs as profit taking kicks in. GBP/USD has traveled between a low of 1.2404 and a high of 1.2467 so far.
Data on Thursday revealed that the United Kingdom´s inflation is far more persistent and the highest in Western Europe. Headline inflation dropped to 10.1% in March from February's 10.4%. However, this was above expectations for the forecasted drop to 9.8%. The Office for National Statistics showed price pressures all over and has raised the prospect of the Bank of England having to raise rates more than previously expected.
´´The market reacted by repricing peak rates by 30bp from where they were at the end of last week, now suggesting we will get 3 more 25bp hikes between now and September,´´ analysts at Societe Generale said.
´´That matches the hikes expected from the ECB, and contrasts with the single 25bp hike that is priced-in for the Fed (before being reversed by the end of the year). GBP/USD has been tracking rate differentials closely since November (after the chaos of the previous weeks).´´
However, there is a concern over the impact of high prices on households and businesses which is stalling the bid in the Pound Sterling. For instance, real wages in Britain, earnings adjusted for inflation, recently showed one of the biggest drops on record in the three months to February, with a fall of 4.1% year on year. Nevertheless, money markets are pricing in rates peaking at around 5% in November this year vs. last month's expectation of around 4.00%.
´´I struggle with the idea that the UK will have higher rates than the US by the end of this year,´´ Kit Juckes, an economist at Societe Generale said.
´´The idea that the MPC will act three more times before pausing seems implausible even if they are worried that they have done too little so far. And if there is a pause, then a US-led slowdown will probably prevent the hikes re-starting (if there is no US slowdown, the Fed won’t be easing),´´ Juckes argued, adding:
´´The repricing of UK supports Sterling as long as rates, and not growth, drive FX, but I fear the positive impact of the rates outlook for GBP/USD will fade long before.´´
-
19:26
USD/MXN at two-day Low as Mexican Peso strengthens on sluggish US data
- Disappointing macroeconomic data releases from the US weigh on US Dollar.
- Fed’s Mester: Rates must peak above 5% and hold there for a while.
- Mexican Retail Sales missed estimates, according to INEGI, though
The Mexican Peso (MXN) gains ground vs. the US Dollar (USD) and hovers around the 18.0000 figure for the first time in two days. A deceleration in the US, namely the labor market, housing, and manufacturing activity, in Philadelphia, spurred concerns about the status of the economy. At the time of writing, the USD/MXN is trading at 17.9910.
USD/MXN drops as US data discouraged investors from buying US Dollars
Despite a dented market sentiment, the USD/MXN continues to dive. US Initial Jobless Claims for the latest week rose above expectations, signaling that the labor market is easing. At the same time, the Philadelphia Fed Manufacturing Index was reported, which plunged to -31.3 beneath March’s -23.3, a headwind for the American Dollar (USD).
The US housing market continues to deteriorate as Existing Home Sales dropped -2.4% MoM, from 13.8% in February, which appeared to signal that housing had bottomed.
Fed policymakers continued another round of appearances in the media, led by the Cleveland Fed President Loretta Mester. She commented that she is happy with the progress on inflation though she reiterated that it’s too high. She expects rates to be above 5%, adding that the US economy is headed for slow growth, which could turn into a recession.
Retail Sales fell far more than expected on the Mexican front, according to the national statistics agency known as INEGI. Figures on a monthly bases dropped 0.3% vs. estimates of 0.2%, while annually rose by 3.4%, beneath estimates of 4%.
USD/MXN Technical Level
-
18:59
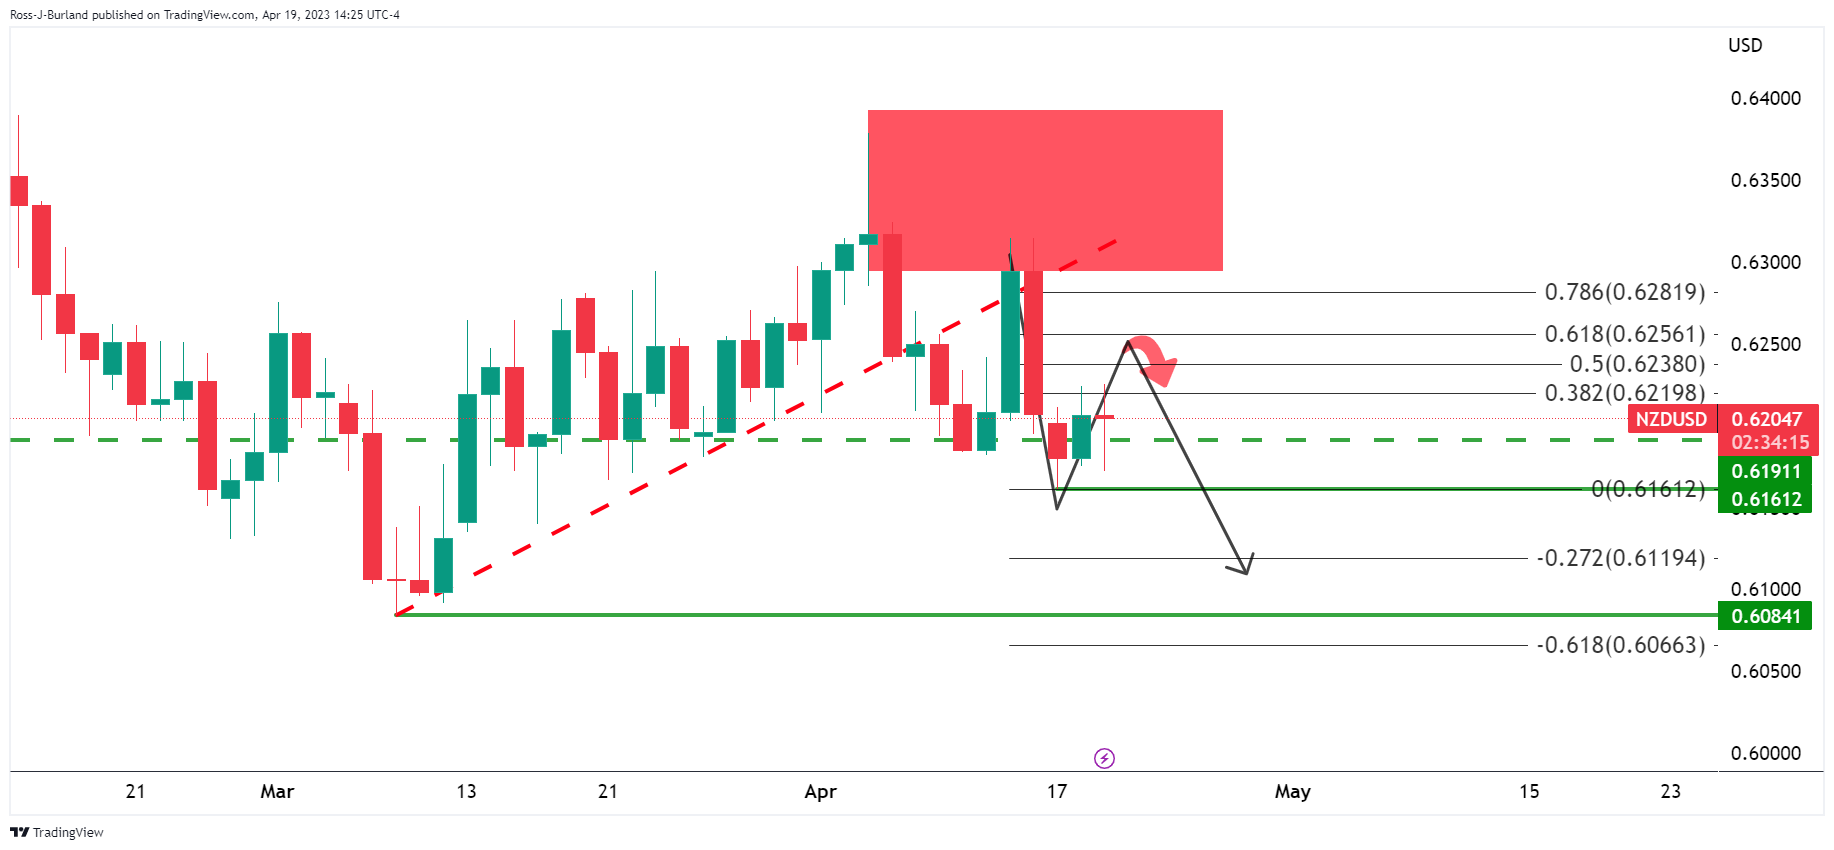
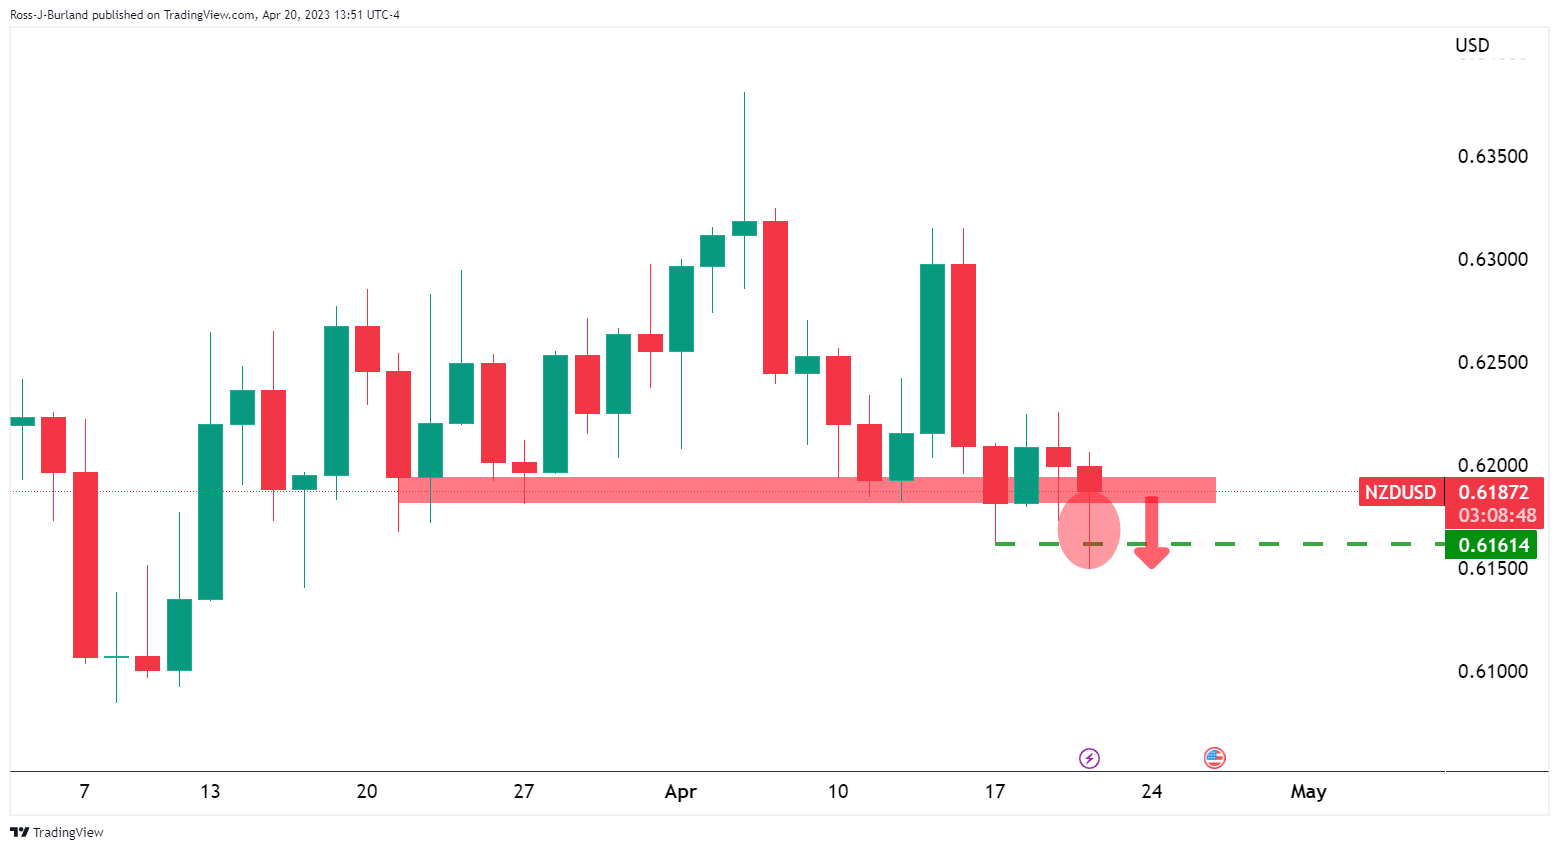
NZD/USD Price Analysis: Bears about to reengage for another push to fresh lows
- NZD/USD shows a likelihood of a continuation to the downside.
- The 0.6180 structure is the line in the sand.
As per the prior analysis, NZD/USD Price Analysis: Bears eye a continuation to 0.6120, the bias remains bearish as the following will illustrate.
NZD/USD prior analysis
NZD/USD was embarking on a run to test a 50% mean reversion level of the prior bearish impulse as follows:
There was a break in structure, however, which opened the prospects of a downside continuation:
0.6120 was eyed as the -272% Fibo in this regard while 0.6100 and 0.6080 came as the next levels of interest.
NZD/USD update
NZD/USD bears have moved in and pierced the 0.6161 structure to open the gates for further downside for the sessions ahead.
We can see the break in the structure and given the current daily wick, it can be expected to be filled in on the lower time frames as follows:
NZD/USD M15 chart
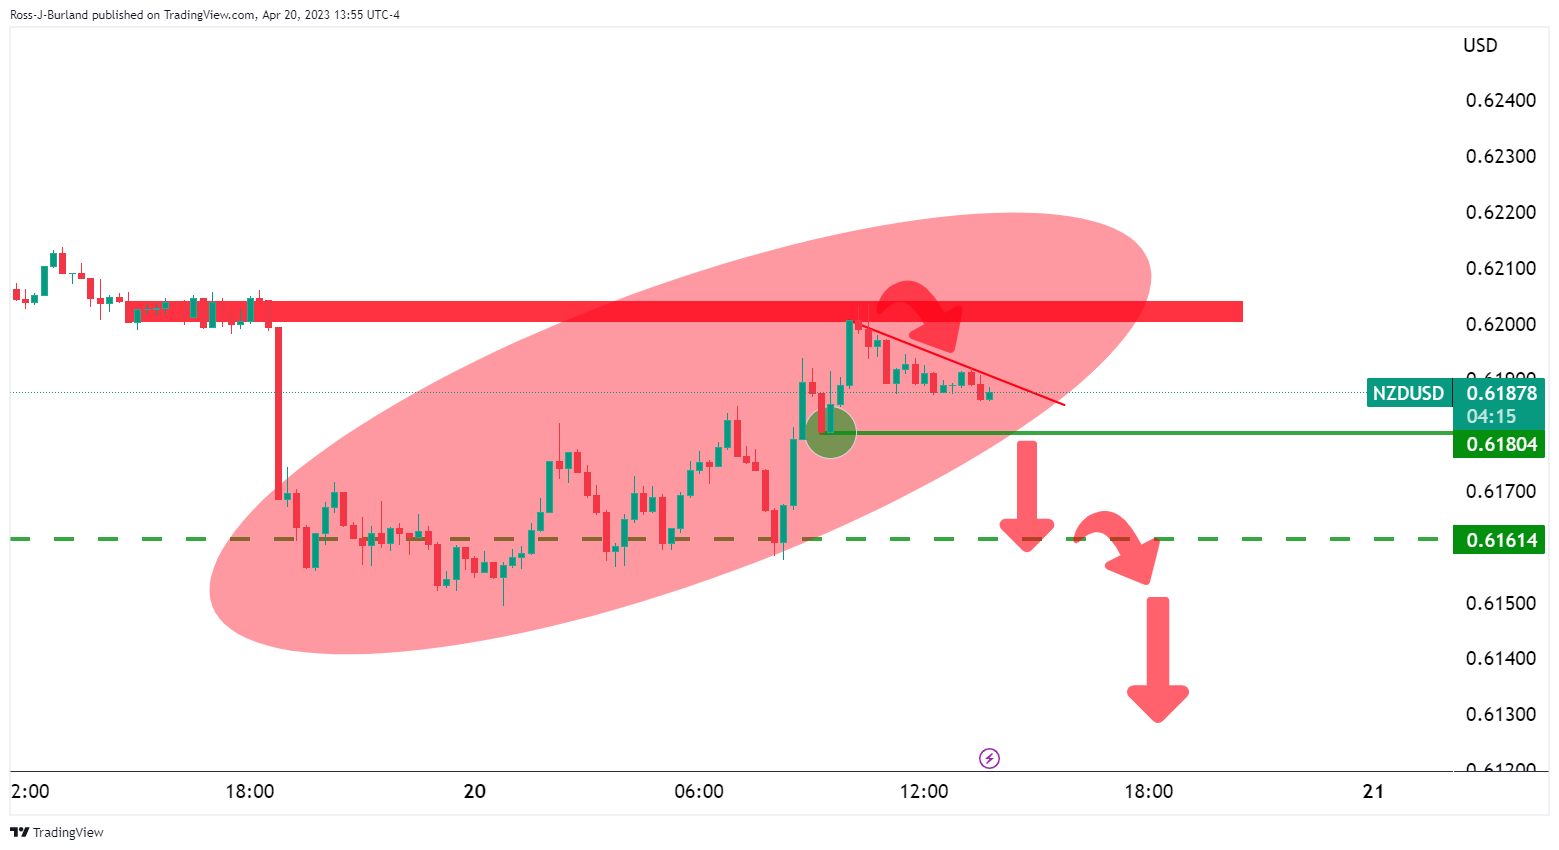
The 0.6180 structure is the line in the sand and a break of this will likely firm up the likelihood of a continuation to the downside to filling the wick and break to fresh lows.
-
18:09
EUR/USD gains ground as US data sparks recession fears
- US Initial Jobless Claims for the latest week jump, as manufacturing activity plunges as reported by the Philadelphia Fed.
- Cleveland’s Fed Loretta Mester is happy with the progress on inflation though rates need to be higher.
- EUR/USD Price Analysis: Could break towards 1.1100 once buyers reclaim 1.1000.
EUR/USD advances, trimming some of its Wednesday’s losses after data from the United States (US) displays further economic deterioration, which reignited recession fears. Hence, investors seeking safety bought the Euro (EUR) to the detriment of the US Dollar (USD). The EUR/USD trades at 1.0969, above its opening price by 0.14%.
EUR/USD boosted by a weaker US economy
Wall Street continues to trade with losses amidst growing concerns of an impending recession in the United States. The latest round of data pointed to a deceleration in the economy, though US Federal Reserve (Fed) officials had reiterated that a recession is not their base scenario.
The US economic calendar revealed that Initial Jobless Claims for the week ending on April 15 rose by 245K, exceeding estimates of 240K, as data from the Department of Labor (DoL) showed. At the same time, the Philadelphia Fed reported that manufacturing activity decelerated in the mid-Atlantic region, with the manufacturing index plunging -31.3 beneath March’s -23.3, a headwind for the American Dollar (USD).
The latest round of US data was that Existing Home Sales dropped 2.4% to a seasonally-adjusted annual rate (SAAR) of 4.44 million in March.
Despite the above, the CME FedWatch Tool still displays that the swaps markets expect a 25 bps hike at the May meeting, with odds at 88.6%, despite falling US Treasury bond yields. Consequently, the US Dollar Index, a measure of the buck’s value vs. a basket of six currencies, is down 0.20%, at 101.739.
Of late, the Cleveland Fed President Loretta Mester is crossing newswires and said she’s happy with the progress made on inflation. Still, inflation is too high and foresees higher interest rates.
On the Eurozone (EU), European Central Bank (ECB) policymakers continued their round of crossing newswires led by its President Christine Lagarde, saying that inflation is too strong, added that the central bank needs to do “all they can” to bring inflation to the 2% target. Earlier, Klass Knot said that the ECB might need to raise rates in June and July on top of a 25 bps hike in May.
EUR/USD Technical Analysis
From a daily chart perspective, the EUR/USD remains supported by the 20-day EMA from March 20 until today. As the EUR/USD dipped toward the 20-day EMA at 1.0903, the pair jumped and recorded a new cycle high. Should this be the case, the 1.1100 is up for grabs, but EUR buyers must reclaim the psychological 1.1000, followed by the YTD high at 1.1075. Conversely, a fall below 1.0900 will expose the 20-day EMA at 1.0896. If EUR/USD drops below the latter, a dive to 1.0800 is on the cards.
-
17:40
WTI Price Analysis: Bears in control, on verge to close the gap
- WTI is on the way to closing the gap.
- WTI is sliding into a prior 4-hour resistance area.
The price of oil is under pressure on Thursday, extending the losses from mid-week trade, and on the verge of closing the gap as the following will illustrate.
As per the prior analysis, WTI bears move in and eye a close of the gap at $75.65, the price of oil is closing the gap:
WTI prior analysis
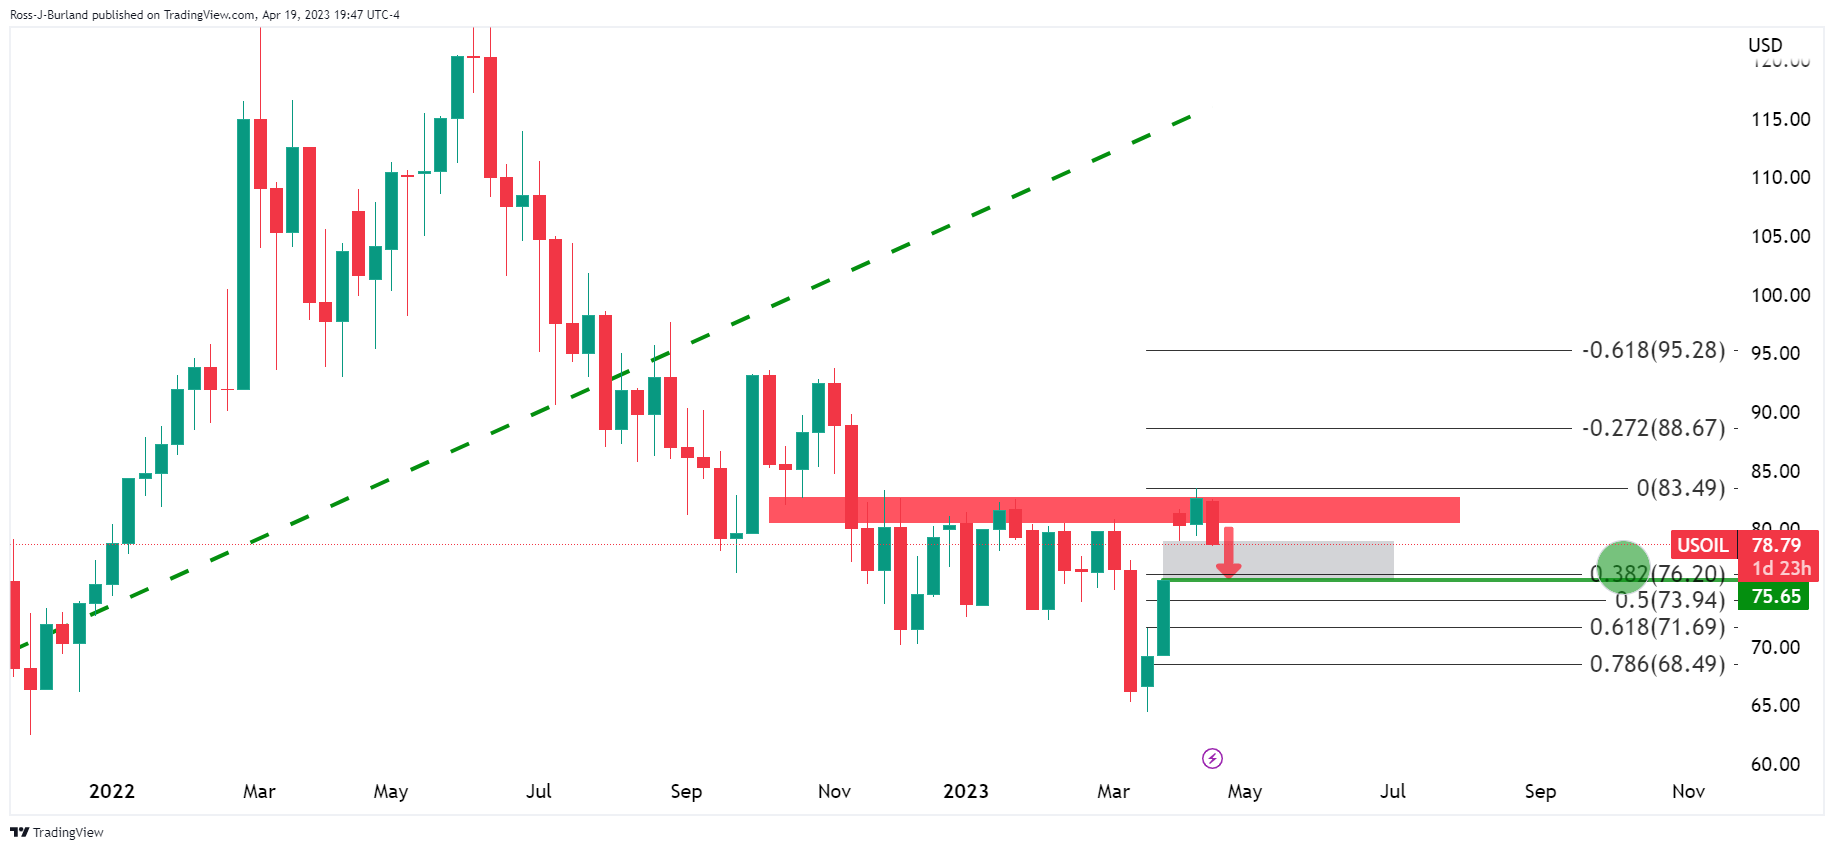
´´The bears are in and eye a 38.2%fibonacci correction towards a close of the gap at $75.65bbls.´´
WTI update
We are seeing a deterioration in price.
WTI H4 chart
On the 4-hour chart, we can see the nearest potential support structure for while the price is currently moving into. This could produce a bout of profit-taking and a move up into the sell-off:
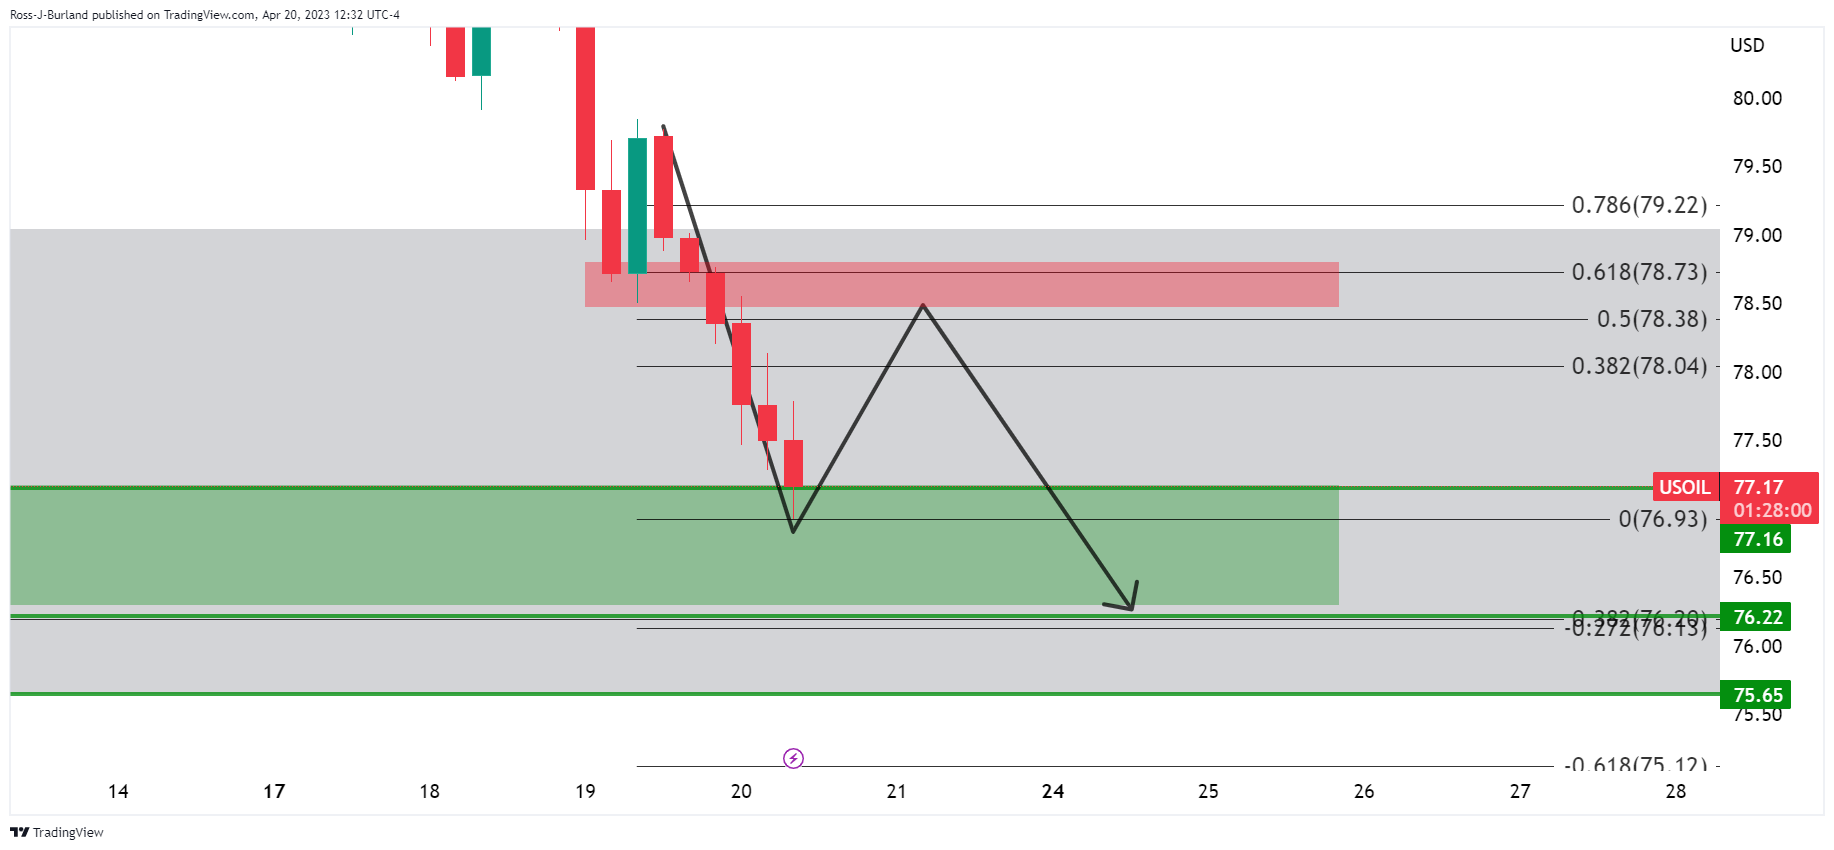
The prior support comes in at the 61.8% ratio near $78.70.
WTI H1 chart
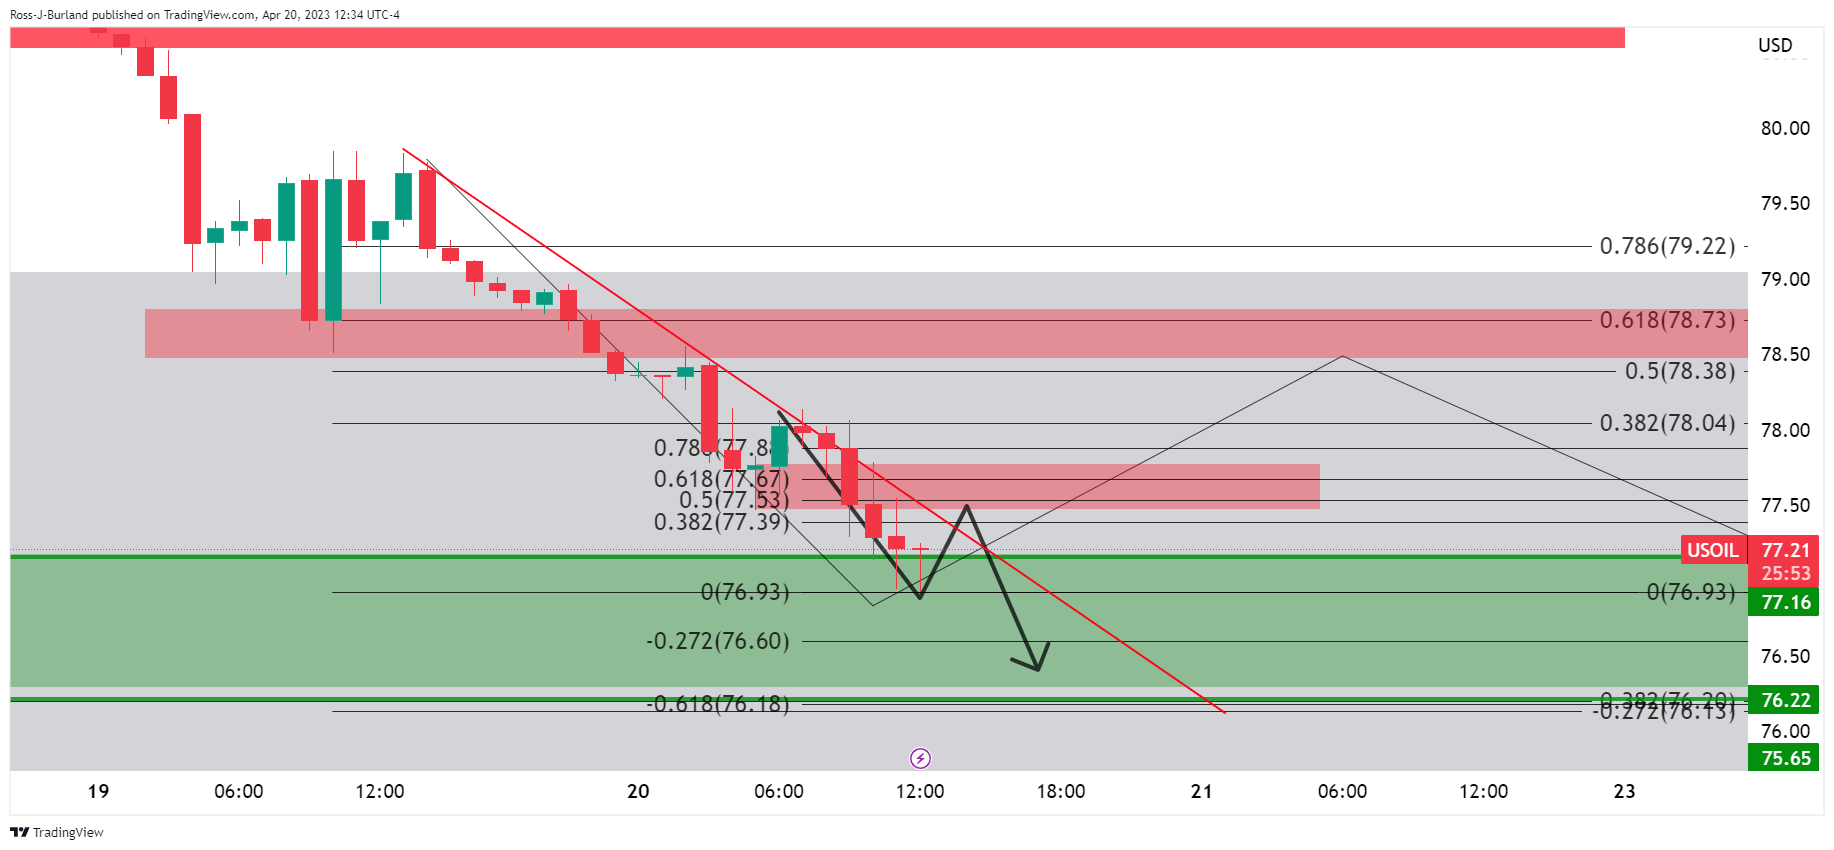
On the hourly chart, there could be a lower resistance as per the trendline resistance and the Fibonacci scale3 confluences.
-
17:33
Fed's Mester: Need to hike policy rate to over 5% and hold there for a while
Cleveland Federal Reserve President Loretta Mester reiterated on Thursday that the Fed has more work to do with inflation in the US staying too high, per Reuters.
Additional takeaways
"Fed will need to hike policy rate to over 5% and hold there for a while."
"Fed is much closer to end of rate-hike journey."
"Extent of future Fed rate rises depends on how economy performs."
"Seeing welcome progress in balancing demand and supply in economy."
"Watching to see impact of tighter financial conditions on economy."
"How financial conditions evolve could influence future rate hike view."
"Stresses in banking sector have eased but Fed will act if needed."
"Expecting to see meaningful progress in lowering inflation this year."
"Expecting inflation to ease to 3.75% this year."
"Job market is strong, expecting unemployment rate to rise to 4.50%-4.75%."
Market reaction
These comments don't seem to be having a significant impact on the USD's performance against its major rivals. As of writing, the US Dollar Index was down 0.15% on the day at 101.80.
-
17:10
USD/CAD bears moving in, significant correction eyed
- USD/CAD is starting to recede, correction-eyed.
- BoC and Fed themes are in focus, driving the price.
USD/CAD is flat on the day after moving between a low of 1.3448 and 1.3489 so far, currently trading at 1.3460 and in retreat in midday New York trade. The Canadian Dollar was initially offered on Thursday ahead of a parliamentary appearance by Bank of Canada Governor Tiff Macklem. Additionally, the price of oil has continued to deteriorate, one of Canada's major exports.
Fed hawks back in town
The hawkish theme surrounding the Federal Reserve has come back to the fore, supporting US yields, and the US Dollar, and weighing on the oil price. West Texas Intermediate crude is down 2% on Thursday.
As for the Federal Reserve, the futures pricing has shown an 85.7% chance the Fed will hike rates 25 basis points when policymakers conclude a two-day meeting on May 3, according to CME's FedWatch Tool. The hawkish sentiment was kicked off by Federal Reserve´s Governor Christopher Waller last Friday said that despite a year of aggressive rate increases, the Fed "hasn't made much progress" in returning inflation to their 2% target and argued that rates still need to go up. As such, the likelihood of a rate cut by December has narrowed considerably this week.
The latest guidance is very much in line with market pricing and Atlanta Fed President Bostic said that he favors one more 25bp rate hike and then a pause. Bostic explained that tightening credit conditions could do some of the Fed’s work. ´´The Atlanta Fed has historically been seen, rightly or wrongly, as a barometer of consensus on the FOMC,´´ analysts at ANZ Bank said.
Fed Bank of New York President John Williams also said on Wednesday inflation was still at problematic levels, and the US central bank would act to lower it. Looking ahead, the Federal Open Market Committee will enter a blackout this weekend ahead of the 2/3 May meeting.
US Dollar softer on data
Nevertheless, the US Dollar, as measured by the DXY index, fell on Thursday as weak data reinforced expectations the world's largest economy is likely headed toward a recession. DXY, which tracks the greenback's value against a basket of major currencies, eased 101.632 after sliding on Friday to its lowest level since early February as investors bet that the Federal Reserve could pause in June after another expected rate hike next month.
In the data. Thursday's data showed US Initial Claims climbed modestly to 245,000 while the week before was revised to show 1,000 more claims than previously reported. The Philadelphia Fed showed that factory activity in the mid-Atlantic region plunged to the lowest level in nearly three years in April while, elsewhere, Existing Home Sales also fell after an increase in February for the first time in a year.
US rate futures are now pricing a roughly 69% probability of a pause in June.
Eyes on BoC
Meanwhile, the focus is on the Bank of Canada´s governor Tiffany Macklem. On Tuesday, Macklem said in testimony in the House of Commons that inflation is coming down quickly but that continued strong demand and the tight labour market are putting upward pressure on many service prices, and those are expected to decline only gradually.
On Thursday, Macklem said the there has been a steady improvement in inflation and modest economic growth. He has stated that it is not a major concern' if the Fed raises rates more than BoC, ‘we have an independent monetary policy’.
Meanwhile, money markets expect the BoC to leave its policy rate on hold at 4.50%, a 15-year high, through the end of the year.
USD/CAD technical analysis
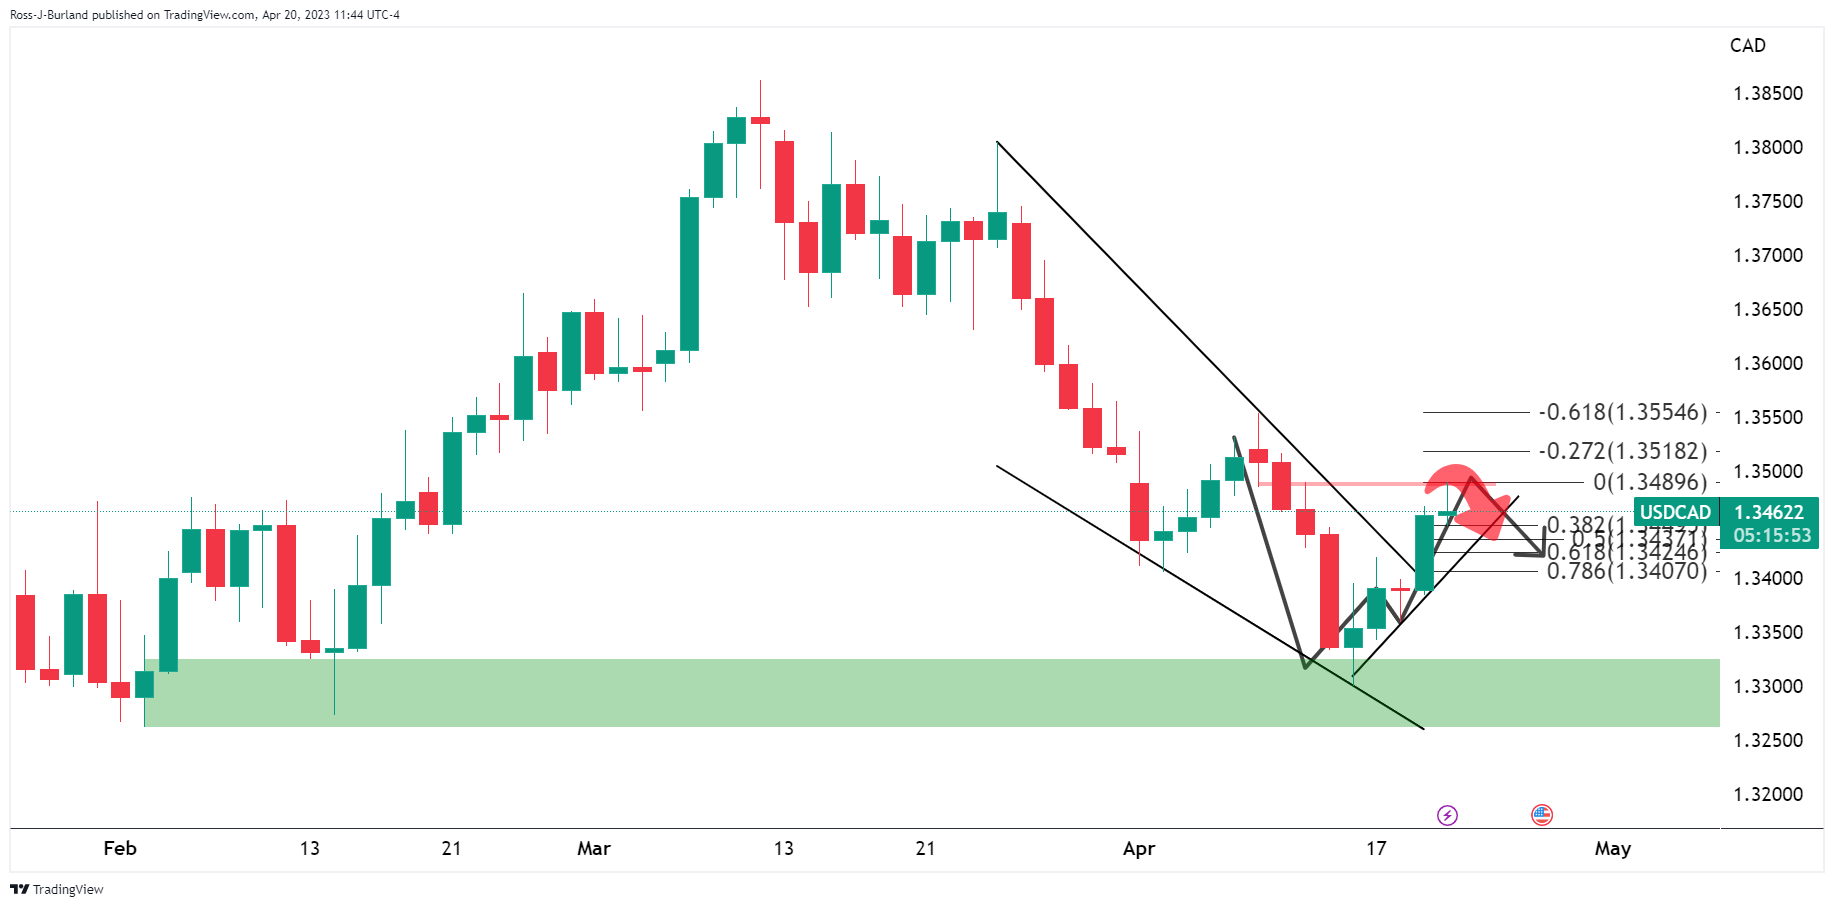
The overall bias is bullish as per the bullish pennant on the daily chart above. We also have a W-formation in the pattern that points to a meanwhile correction:
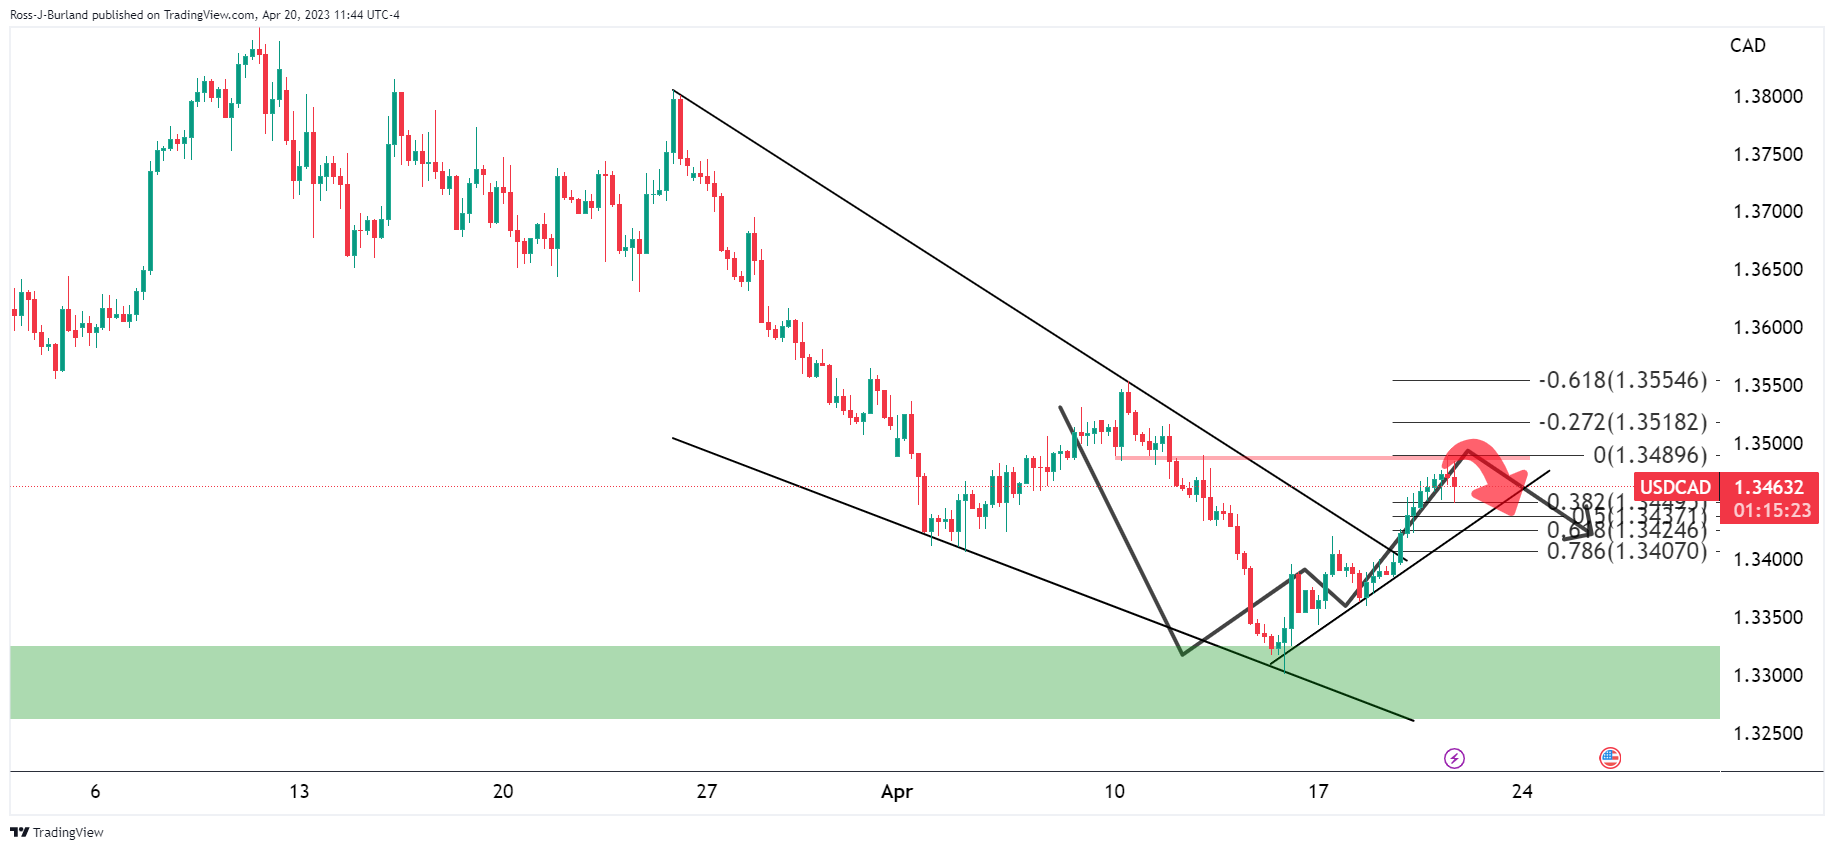
The price is being faded and the Fibonacci scale can be drawn on the prior bullish impulse:
We have the neckline meeting the 61.8% ratio near 1.3420 as a target. That is to say, if the 38.2% ratio does not hold as support near 1.3450.
-
17:10
AUD/USD hits weekly highs at 0.6770; Aussie outperforms
- Australian Dollar outperforms during the American session.
- US Dollar loses momentum after US economic data.
- AUD/USD breaks short-term resistance, tests 0.6770.
The AUD/USD broke above 0.6740/45 and jumped to 0.6771, reaching the highest level in a week. The pair then pulled ack and is hovering around 0.6755, holding firm to daily gains.
The initial boost came from a weaker US Dollar, following the release of US economic data. Jobless Claims and the Philly Fed came in below expectations. US yields are falling. The 10-year yield falls almost 2% and is at 3.52%, a four-day low. The DXY is down by 0.17% after spending most of the day in positive ground.
The Australian Dollar is outperforming during the American session. The AUD/NZD is up by a hundred pips, above 1.0900, at the highest level since late February. EUR/AUD dropped to 1.6220, the lowest level in two weeks.
Short-term outlook
The AUD/USD is above the 0.6740 area, that has become the initial support. While above, the pair could keep testing the 0.6770 zone, the last defense for 0.6800. While above 0.6740, the bias is to the upside.
Technical levels
-
16:33
United States 4-Week Bill Auction down to 3.19% from previous 4.03%
-
16:19
Gold Price Forecast: XAU/USD surges beyond $2,000 spurred by weak USD on poor jobs data
- US Initial Jobless Claims disappoint a prelude that the labor market is easing.
- The latest Federal Reserve Beige Book shows the US economy is slowing down, led by inflation, hiring, and consumption.
- Gold Price Analysis: To remain sideways within the $1,98-$2,015 range.
Gold price climbs and reclaims the $2,000 after traveling towards weekly lows on Wednesday at $1,969.34, though economic data from the United States (US) bolstered the yellow-metal. In addition, US bond yields are falling, weakening the US Dollar (USD). At the time of typing, the XAU/USD is trading at $2,006.91, above its opening price by 0.61%.
US economic data hurt the US Dollar, boost Gold higher
Risk aversion is the game’s name, even though the CBOE Volatility Index (VIX) remains below 17.00. Wall Street remains pressured after the US Bureau of Labor Statistics (BLS) revealed that unemployment claims rose. Initial Jobless Claims for the latest week rose by 245K, exceeded estimates of 240K, and weighed on US bond yields, a tailwind for Gold.
The XAU/USD was underpinned by a worse-than-expected Philadelphia Fed Manufacturing Index report, which collapsed to -31.3, down from March -23.2, a headwind for the greenback, as recessionary fears reignited following the announcement.
Furthermore, the Beige Book revealed on Wednesday that the US economy is decelerating as hiring and inflation are slowing. The book noted that access to credit is narrowing, wages are increasing, and consumer spending is contracting.
Despite the above, the CME FedWatch Tool still displays that the swaps markets expect a 25 bps hike at the May meeting, with odds at 88.6%.
Consequently, the US 2-year Treasury bond yield tumbles eight bps, down at 4.161%, while the 10-year benchmark note rate clings to the 3.538% area, down five bps. The US 10-year TIPS bond yield, a proxy for real yields, which influences XAU/USD prices, caps the advance of Gold, with gains of 4 bps, up at 1.264%.
The US Dollar Index, a measure of the buck’s value vs. a basket of six currencies, is down 0.20%, at 101.739.
What to watch?
Ahead into the week, US Federal Reserve officials will cross newswires, with six Fed policymakers speaking on Thursday, followed by Lisa C’ok’s on Friday, ahead of the media blackout. Data-wise, the US agenda on Friday, will reveal S&P Global PMIs on its final reading for April
Gold Technical Analysis
After dipping below the 20-day Exponential Moving Average (EMA) at $1,988.60, the XAU/USD resumed its uptrend, though downside risks remain. Of note, after peaking at $2,048.79, XAU/USD’s tumbled, and since April 17, the Gold price remains trading within the $1,980-$2,015 range, unable to decisively break below/above the boundaries of that area, meaning a daily close is pending below $1,980 or above $2,015. On the downside, the XAU/USD’s road is busy with immediate resistance with the $2,000 psychological level, followed by the 20-day EMA, and then the weekly low of $1,969.34. Conversely, the XAU/USD will meet resistance at $2,015, which, once cleared, it could pave the way toward the YTD high at $2,048.79.
-
15:44
NFP: Payrolls to slow to 150k in April – TDS
The next US official employment report is due on May 5. Analysts at TD Securities point out that data suggest a slowdown in payrolls to sub-200,000 levels for the first time since 2020.
Key quotes:
“High-frequency data suggest the pace of job creation is likely to take a step down in April, with payrolls set to advance at a sub-200k pace for the first time since 2020. Our interpretation of the daily Homebase series, which tracks small-business payrolls, suggests employment rose 150k.”
“This would be in sync with this week's Beige Book report which noted that employment growth moderated somewhat this period as several Districts reported a slower pace of growth than in recent Beige Book reports.”
“Jobless claims were little changed vs mid-March, but continuing claims have been rising. This story might change in coming months, though layoffs have concentrated on the information sector (tech), with no evidence of large spillovers into other sectors just yet.”
-
15:30
United States EIA Natural Gas Storage Change above expectations (69B) in April 14: Actual (75B)
-
15:02
European Monetary Union Consumer Confidence registered at -17.5 above expectations (-18.5) in April
-
15:00
United States Existing Home Sales (MoM) below forecasts (4.5M) in March: Actual (4.44M)
-
15:00
United States Existing Home Sales Change (MoM) below expectations (1.5%) in March: Actual (-2.4%)
-
14:53
Silver Price Analysis: XAG/USD consolidates around $25.30-35 area, bullish potential intact
Silver lacks any firm directional bias and oscillates in a range above the $25.00 mark.
The technical setup favours bullish traders and supports prospects for further gains.
Dips towards $24.65 confluence support might still be seen as a buying opportunity.Silver attracts some dip-buying in the vicinity of the $25.00 psychological mark and touches a three-day high on Thursday, albeit the intraday uptick lacks bullish conviction. The white metal seesaws between tepid gains/minor losses through the early North American session and is currently placed around the $25.30 region, nearly unchanged for the day.
From a technical perspective, the recent pullback from over a one-year high - levels just above the $26.00 round figure touched last week - stalled on Wednesday near the 23.6% Fibonacci retracement level of the March-April rally. The said support, around the $24.65 region, now coincides with the upward sloping 100-period Simple Moving Average (SMA) on the 4-hour chart and should act as a pivotal point.
Meanwhile, oscillators on the daily chart are holding comfortably in the bullish territory and have just started gaining positive traction on the 4-hour chart. This, in turn, favours bullish traders and supports prospects for the resumption of the recent rally witnessed over the past month or so. Hence, some follow-through strength towards the $25.80 hurdle, en route to the $26.00 mark, looks like a distinct possibility.
On the flip side, weakness below the $25.00 mark might continue to find decent support near the $24.65 confluence. This is closely followed by the $24.40-$24.30 strong horizontal resistance breakpoint, now turned support, which if broken decisively could drag the XAG/USD towards the $24.00 mark. The downward trajectory could get extended further towards the 38.2% Fibo. level, around the $23.75 area.
Silver 4-hour chart
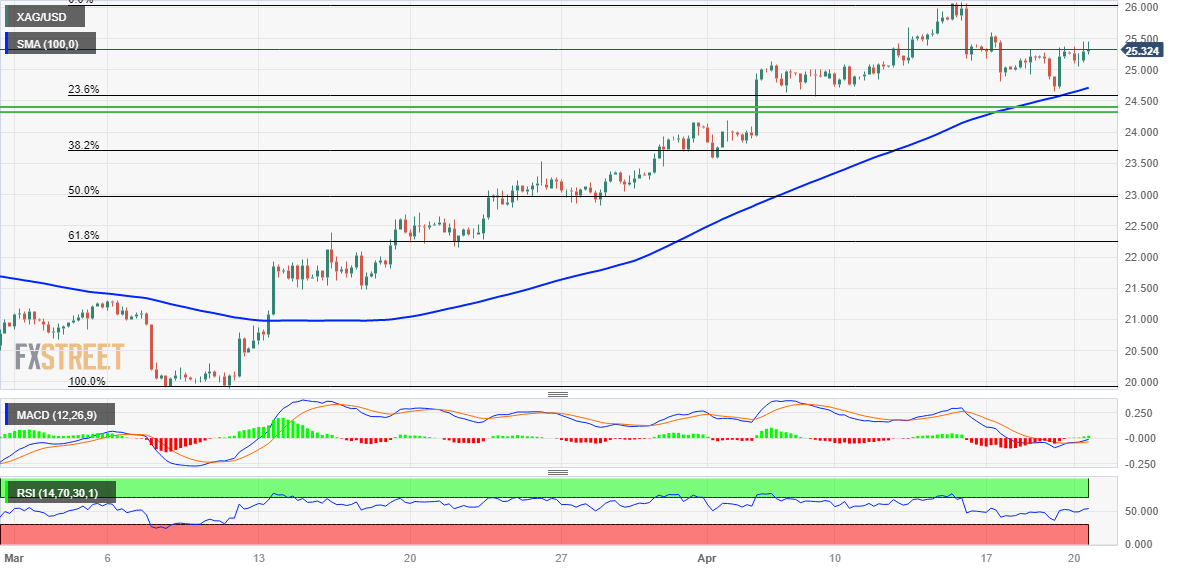
Key levels to watch
-
14:36
ECB to hike in May, size of the move remains open – Nordea
The next meeting of the Governing Council of the European Central Bank is May 4. Jan von Gerich, Chief Analysts at Nordea points out that the majority of the board remains preoccupied with upside inflation risks, and is set to push further rate hikes. He argues that the size of the May hike will largely be determined by the data released just ahead of the meeting.
Key quotes:
“The monetary policy account of the ECB March meeting confirmed that had it not been for the March banking sector worries, the central bank would have been more determined in signalling more tightening ahead. Now that the banking worries have continued to recede, the upside inflation risks evident in the account are likely to push the ECB into hiking rates several times further, subject to incoming data of course.”
“Another rate hike at the May meeting looks like a done deal, but the size of the move remains open. Market pricing is tilted towards a 25bp rate hike and that is also our baseline. However, an important data batch will be released on 2 May, just two days ahead of the ECB May meeting. On that date, the flash estimate for April inflation, the Q2 bank lending survey and the March credit numbers will all be out, and could yet tilt the scale towards a 50bp rate hike. One should thus prepare for large volatility already ahead of 4 May ECB meeting.”
-
14:34
USD/JPY: Upside falters just ahead of the 135.00 region
- USD/JPY trades on the defensive after a move to 135.00.
- Dollar’s weakness and lower US yields weigh on the pair so far.
- US weekly Claims rose more than expected during last week.
Following a failed attempt to retest/surpass the 135.00 hurdle, USD/JPY comes under pressure and retreats to the low-134.00s on Thursday.
USD/JPY weaker on yields, USD-selling
USD/JPY extends the erratic activity so far this week and comes under pressure following recent monthly peaks past the 135.00 barrier (April 19).
The renewed selling pressure in the greenback forces the USD Index (DXY) to give away earlier gains and return to the sub-102.00 region, while the corrective decline in US yields across the curve collaborate further with the daily pullback in spot.
In the Japanese docket, the trade deficit shrank to ¥754.5B in March, while Foreign Bond Investment rose to ¥500.2B in the week to April 15 and the Tertiary Industry Index rose 0.7% MoM in February.
In the US, Initial Claims went up by 245K in the week to April 15 and the Philly Fed Index worsened to -31.3 for the current month.
USD/JPY levels to consider
As of writing the pair is losing 0.28% at 134.29 and faces the next support at 132.01 (low April 13) seconded by 130.62 (monthly low April 5) and finally 129.63 (monthly low March 24). On the other hand, the surpass of 135.13 (monthly high April 19) would expose 137.07 (200-day SMA) and then 137.91 (2023 high March 8).
-
14:03
GBP/USD Price Analysis: Climbs to fresh daily high, above mid-1.2400s amid weaker USD
- GBP/USD attracts some dip-buying on Thursday and turns positive for the third straight day.
- Retreating US bond yields undermines the safe-haven USD and lends support to the major.
- Bets for a 25 bps BoE rate hike in May act as a tailwind for the GBP and remain supportive.
The GBP/USD pair reverses an intraday dip to the 1.2400 round-figure mark and turns positive for the third successive day on Thursday. The pair, however, remain below the weekly high touched on Wednesday and trades around the 1.2450-1.2455 region, just below the weekly high touched on Wednesday.
The US Treasury bond yields stall the recent strong rally to a nearly one-month high, which, along with the disappointing US macro data, exerts some pressure on the US Dollar (USD). Apart from this, rising bets for another 25 bps rate hike by the Bank of England (BoE) in May underpin the British Pound and act as a tailwind for the GBP/USD pair.
That said, the prospects for further policy tightening by the Federal Reserve (Fed) should help limit the downside for the US bond yields. Furthermore, the risk-off impulse - as depicted by a generally weaker tone around the equity markets - could revive demand for the safe-haven Greenback and keep a lid on any meaningful gains for the GBP/USD pair.
From a technical perspective, spot prices this week found a decent support near the 1.2355-1.2350 region. The said area should now act as a pivotal point, which if broken might prompt some technical selling. The GBP/USD pair could then slide to the 1.2300 mark en route to the 100-day Simple Moving Average (SMA), just below the 1.2200 round figure.
On the flip side, bulls might wait for some follow-through buying beyond the overnight swing high, around the 1.2470-1.2475 region, before placing fresh bets. The GBP/USD pair might then surpass the 1.2500 psychological mark and then aim back to retesting the monthly swing high, around the 1.2545 region touched last week.
The momentum could get extended towards the 1.2600 round figure, above which spot prices could climb to the next relevant hurdle near the 1.2660-1.2665 region.
GBP/USD 4-hour chart
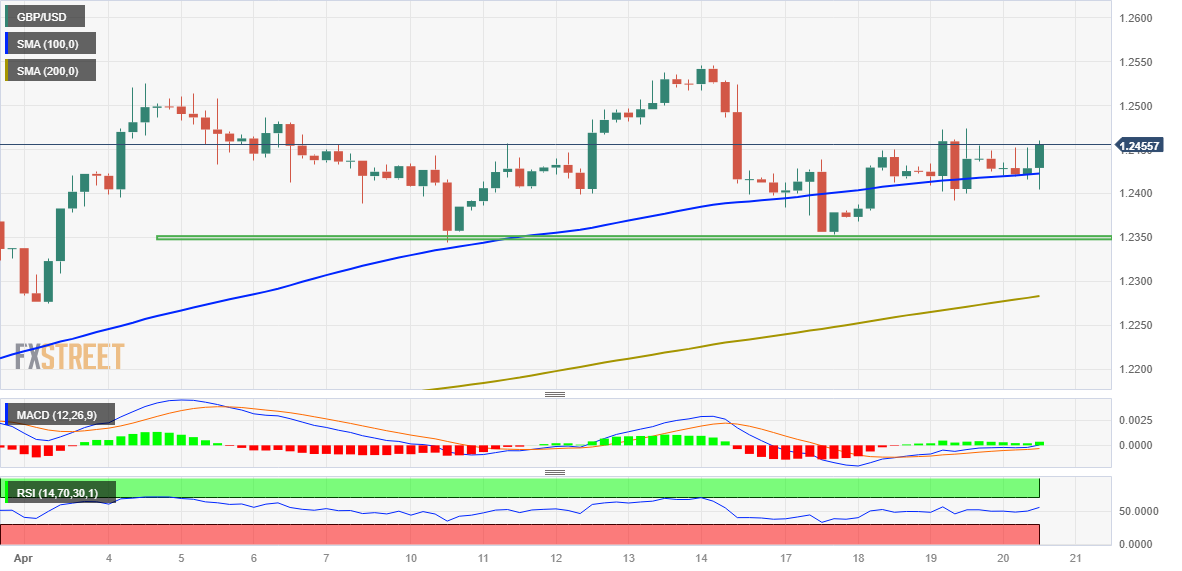
Key levels to watch
-
14:00
Russia Central Bank Reserves $ down to $600.2B from previous $600.8B
-
13:35
US: Philadelphia Fed Manufacturing Index drops to -31.3 in April vs. -19.2 expected
- Philadelphia Fed Manufacturing Index came in lower than expected in April.
- US Dollar Index struggles to hold above 102.00 on Thursday.
The diffusion index for current general activity of the Federal Reserve Bank of Philadelphia's Manufacturing Survey dropped to -31.3 in April from -23.2 in March. This marked the lowest reading since May 2020 and was below the market expectation of -19.2.
"The employment index rose 10 points to a near-zero reading," the publication further read. "The prices paid index declined for the second consecutive month, falling 15 points to 8.2. The current prices received index fell 11 points to -3.3, its third consecutive decline and first negative reading since May 2020."
Market reaction
The US Dollar Index lost its traction in the early American session and declined below 102.00. As of writing, the index was down 0.1% on the day at 101.85.
-
13:34
US: Weekly Initial Jobless Claims rise to 245K vs. 240K expected
- Initial Jobless Claims in the US increased by 5,000 in the week ending April 15.
- Continuing Jobless Claims increased by 61,000 in the week ending April 8.
- US Dollar Index turns negative for the day after economic reports.
There were 245,000 initial jobless claims in the week ending April 15, the weekly data published by the US Department of Labor (DOL) showed on Thursday. This print followed the previous week's 240,000 (revised from 239,000) and came in above the market expectation of 240,000.
“The 4-week moving average was 239,750, a decrease of 500 from the previous week's revised average.”
Continuing Claims increased by 61,000 in the week ended April 8 to 1.865 million, above the 1.82 million of market consensus. It is the highest level for insured unemployment since November 2021.
“The 4-week moving average was 1,827,250, an increase of 15,250 from the previous week's revised average. This is the highest level for this average since December 18, 2021 when it was 1,838,000.”
Market reaction
The US Dollar Index pulled back modestly after the Jobless Claims also alongside the Philly Fed report. The DXY turned negative below 102.00.
-
13:31
Canada Employment Insurance Beneficiaries Change (MoM) rose from previous -5% to 3% in February
-
13:31
Fed's Beige Book supports a 25 bp hike next month – BBH
BBH Global Currency Strategy offers a brief analysis of the Federal Reserve's (Fed) Beige Book released on Wednesday, which showed that economic conditions had somewhat cooled in recent weeks while inflation continued to run relatively hot.
Key quotes:
“On Overall Economic Activity: Nine Districts reported either no change or only a slight change in activity this period while three indicated modest growth. Lending volumes and loan demand generally declined across consumer and business loan types. On Labor Markets: Employment growth moderated somewhat this period as several Districts reported a slower pace of growth than in recent Beige Book reports. Wages have shown some moderation but remain elevated. On Prices: Overall price levels rose moderately during this reporting period, though the rate of price increases appeared to be slowing. Consumer prices generally increased due to still-elevated demand as well as higher inventory and labor costs.”
“WIRP suggests around 90% odds of 25 bp hike at the May 2-3 meeting, up from 80% at the start of this week, 70% at the start of last week, and 50% at the start of the week before that. Despite these rising odds, one cut is still priced in by year-end. While down from two cuts at the start of last week, this needs to be completely priced out. The Fed will have a lot of time and data before having to make a decision in June. Between the May 2-3 and June 13-14 meetings, the Fed will have digested two more job reports, two CPI/PPI reports, and one retail sales report. A pause in June might just be the most likely outcome but it really will depend on how all that data come in. Waller, Mester, Bowman, Logan, Bostic, and Harker all speak today. Cook speaks tomorrow. Then at midnight tomorrow, the media blackout goes into effect and there will be no Fed speakers until Chair Powell’s press conference May 3.”
-
13:31
United States Philadelphia Fed Manufacturing Survey below forecasts (-19.2) in April: Actual (-31.3)
-
13:30
United States Initial Jobless Claims registered at 245K above expectations (240K) in April 14
-
13:30
United States Continuing Jobless Claims came in at 1.865M, above forecasts (1.82M) in April 7
-
13:30
United States Initial Jobless Claims 4-week average dipped from previous 240K to 239.75K in April 14
-
13:17
AUD/USD holds steady above 0.6700, upside remains capped amid weaker risk tone
- AUD/USD attracts some dip-buying on Thursday, though the uptick lacks bullish conviction.
- Retreating US bond yields keeps the USD bulls on the defensive and offers some support.
- Bets for more Fed rate hikes limit the USD losses and caps gains amid the risk-off mood.
The AUD/USD pair reverses an intraday dip to sub-0.6700 levels and climbs to a fresh daily high heading into the North American session on Thursday. Spot prices, however, remain below a technically significant 200-day Simple Moving Average (SMA) and currently trade with only modest intraday gains, around the 0.6720 region.
A sharp intraday slide in the US Treasury bond yields exerts some downward pressure on the US Dollar (USD). The Australian Dollar (AUD), on the other hand, draws support from a hawkish tone from the Reserve Bank of Australia's (RBA) April meeting minutes released earlier this week. This, in turn, acts as a tailwind for the AUD/USD pair, though a combination of factors holds back bulls from placing aggressive bets and keeps a lid on any meaningful upside, at least for the time being.
The markets seem convinced that the Federal Reserve (Fed) will continue raising interest rates and have now fully priced in a 25 bps lift-off in May. Moreover, the Fed funds futures indicate a small chance of another rate hike at the June FOMC meeting and the bets were lifted by the recent hawkish comments by Fed officials. Furthermore, the incoming US macro data pointed to a resilient economy and fueled concerns that the Fed may have more work to do amid easing fears about a banking crisis.
Apart from this, the risk-off impulse - as depicted by a generally weaker tone around the equity markets - benefits the safe-haven Greenback and contributes to capping the risk-sensitive Aussie. This makes it prudent to wait for strong follow-through buying before positioning for any further near-term appreciating move. Market participants now look to the US economic docket, featuring the Weekly Initial Jobless Claims and the Philly Fed Manufacturing Index, for some trading impetus.
Technical levels to watch
-
13:05
EUR/USD Price Analysis: The 2023 high emerges as the big magnet for bulls
- EUR/USD struggles to advance further north of 1.0980 on Thursday.
- The next resistance level of note comes at the YTD peak near 1.1070 .
EUR/USD’s initial bullish attempt runs out of steam near 1.0980 on Thursday.
Further consolidation should not be ruled out for the time being. The breakout of this theme exposes a probable move to 1.1000 ahead of the 2023 high at 1.1075 (April 14). On the downside, the 1.0900 zone emerges as quite a decent contention so far.
Looking at the longer run, the constructive view remains unchanged while above the 200-day SMA, today at 1.0387.
EUR/USD daily chart
-
13:00
Mexico Retail Sales (MoM) below expectations (0.2%) in February: Actual (-0.3%)
-
13:00
Mexico Retail Sales (YoY) registered at 3.4%, below expectations (4%) in February
-
12:44
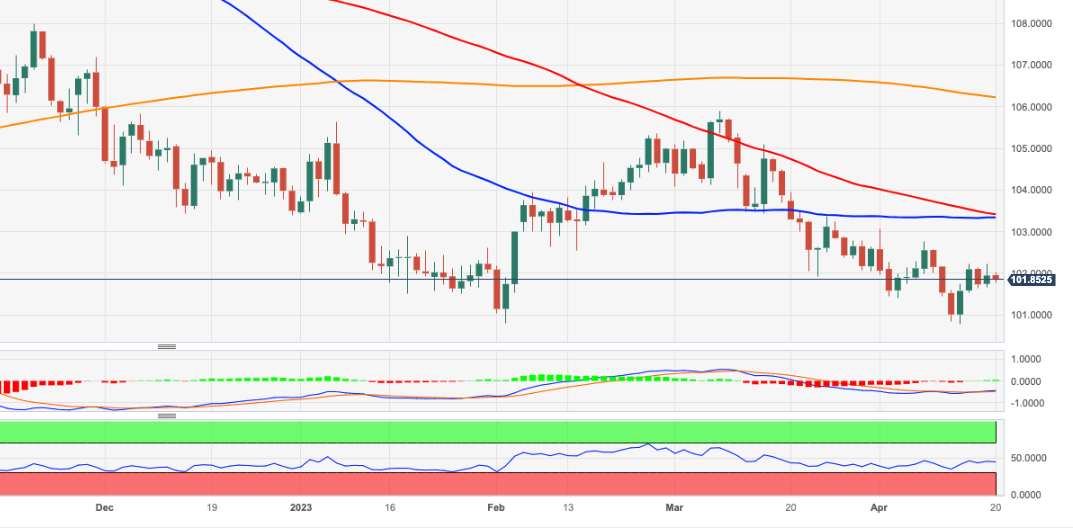
USD Index Price Analysis: No changes to the current consolidative tone
- DXY resumes the downside following Wednesday’s decent gains.
- Further side-lined trading is likely for the time being.
DXY gives away Wednesday’s gains and resumes the downside amidst the broad-based range bound theme so far this week.
The index, in the meantime, maintains the choppy activity well in place so far this week. The resumption of the uptrend should face initial hurdle at the April high just above 103.00 (April 3), while bouts of weakness remain underpinned by the sub-101.00 region.
Looking at the broader picture, while below the 200-day SMA, today at 106.24, the outlook for the index is expected to remain negative.
DXY daily chart
-
12:40
US: Existing Home Sales to register a new retreat at -2.2% in March – TDS
Analysts at TD Securities offer a brief preview of the upcoming release of the US Existing Home Sales data, due later during the early North American session this Thursday.
Key quotes:
“The demand side of the housing market is likely to continue offering signs of bottoming in the near term as suggested by nascent indications of improvement from mortgage applications and pending home sales. In the meantime, we look for existing home sales to register a new retreat at -2.2% m/m in March to 4.48mn units from 4.58mn in February (consensus: 4.50mn); however, this decline would not be enough to offset the surprising 14.5% surge in February.”
-
12:35
ECB Accounts: Large majority agreed with proposal to raise key rates by 50 bps
The accounts of the European Central Bank's (ECB) March policy meeting revealed on Thursday that a large majority of the Governing Council agreed with Chief Economist Philip Lane's proposal to raise key rates by 50 basis points (bps), per Reuters.
Key takeaways
"Members widely agreed that bank credit had become more expensive."
"More time was needed to fully assess the overall effect of the monetary policy stance on financial conditions."
"Some members would have preferred not to increase the key rates until the financial market tensions had subsided."
"Monetary policy still had some way to go to bring inflation down, including in the case that the baseline of the March ECB staff projections materialised."
"If the inflation outlook embedded in the March ECB staff projections were confirmed, the Governing Council would have further ground to cover in adjusting the monetary policy stance."
"Financial market tensions were seen as a source of significant uncertainty for the economic and inflation outlook."
"Unless the situation deteriorated significantly, the financial market tensions were unlikely to fundamentally change the Governing Council’s assessment of the inflation outlook."
"The point was made that, in the context of tighter monetary policy, pockets of financial vulnerability had to be expected."
"It had to be considered that the transmission of monetary policy impulses was likely to be stronger at times of market stress than in calmer times."
"Members assessed that there were both upside and downside risks to the inflation outlook."
"A number of members seeing risks to inflation as tilted to the upside over the entire horizon."
Market reaction
EUR/USD largely ignored this publication and was last seen trading modestly higher on the day at 1.0973.
-
12:26
USD/CHF hangs near weekly low, just below mid-0.8900s amid risk-off mood
- USD/CHF extends the overnight slide from a one-week high and drifts lower on Thursday.
- The risk-off impulse benefits the safe-haven CHF and exerts some pressure on the major.
- Retreating US bond yields weighs on the USD and contributes to the intraday selling bias.
The USD/CHF pair comes under heavy selling pressure on Thursday and extends the previous day's late pullback from a one-week high, around the 0.9000 psychological mark. The pair maintains its offered tone through the first half of the European session and is currently placed around the 0.8940 region, near the lower end of its weekly trading range.
A generally weaker tone around the equity markets - amid worries about economic headwinds stemming from rising borrowing costs - benefits the safe-haven Swiss Franc (CHF). The anti-risk flow, meanwhile, triggers a sharp intraday downfall in the US Treasury bond yields, which keeps the US Dollar (USD) bulls on the defensive and contributes to the offered tone surrounding the USD/CHF pair.
Any meaningful downside for the USD, however, seems limited amid growing acceptance that the Federal Reserve (Fed) will continue raising interest rates. In fact, the markets seem convinced that the US central bank will hike rates by 25 bps in May and have been pricing in a small chance of another lift-off in June. This should act as a tailwind for the US bond yields and help revive the USD demand.
The aforementioned fundamental backdrop, meanwhile, warrants caution before positioning for any further depreciating move. now look to the US economic docket, featuring Weekly Initial Jobless Claim, the Philly Fed Manufacturing Index and Existing Home Sales data. This, along with speeches by Fedspeaks and the US bond yields, will drive the USD demand and provide some impetus to the USD/CHF pair.
Technical levels to watch
-
12:03
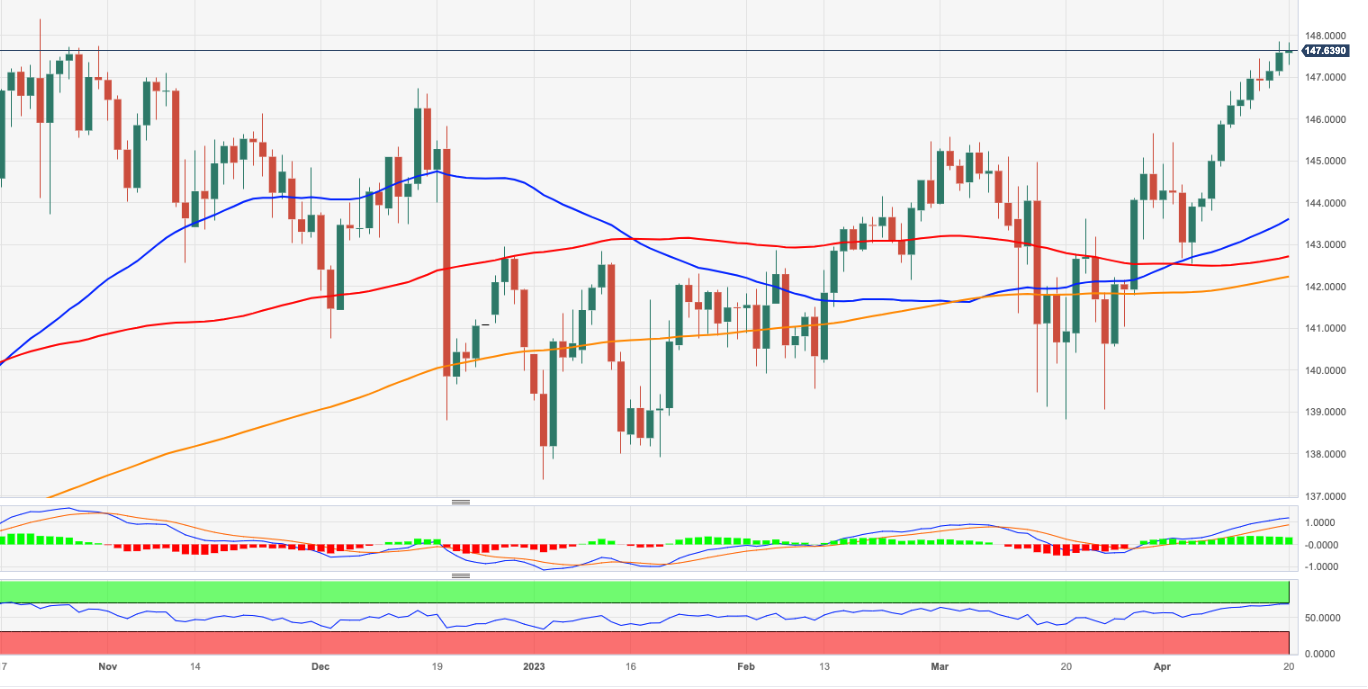
EUR/JPY Price Analysis: Further upside targets 148.00 and above
- EUR/JPY extends the rally to the boundaries of 148.00
- Further up could see the 2022 high at 148.40 revisited.
EUR/JPY keeps the upside bias well in place and trades closer to the key 148.00 mark on Thursday.
Considering the ongoing price action, further gains in the cross remain in store for the time being. That said, the continuation of the upside momentum could extend further and challenge the 2022 peak at 148.40 (October 21) sooner rather than later.
So far, further upside looks favoured while the cross trades above the 200-day SMA, today at 142.20.
EUR/JPY daily chart
-
11:51
USD/JPY consolidates its recent gains to multi-week high, flat-lines above mid-134.00s
- USD/JPY oscillates in a narrow trading band near a multi-week high touched on Wednesday.
- The risk-off impulse benefits the safe-haven JPY and acts as a headwind amid a softer USD.
- Bets for more Fed rate hikes help limit losses for the USD and lend some support to the pair.
The USD/JPY pair lacks any firm intraday directional bias on Thursday and seesaws between tepid gains/minor losses through the first half of the European session. The pair is currently placed around the 134.65 region, just below a five-week high touched on Wednesday and is influenced by a combination of diverging forces.
A fresh wave of the global risk-aversion trade boosts demand for traditional safe-haven assets and benefits the Japanese Yen (JPY). Apart from this, a modest US Dollar (USD) downtick, led by the ongoing pullback in the US Treasury bond yields from a nearly one-month high touched on Thursday, acts as a headwind for the USD/JPY pair. Meanwhile, an intraday decline in the US bond yields narrows the US-Japan rate differential and lends additional support to the JPY.
That said, the prospects for further policy tightening by the Federal Reserve (Fed) should help limit the downside for the US bond yields and favours the USD bulls. In fact, the markets seem convinced that the Fed will continue raising interest rates and have fully priced in a 25 basis point (bps) lift-off in May. Moreover, the Fed funds futures indicate a small chance of another rate hike at the June FOMC meeting in the wake of the recent hawkish comments by Fed officials.
In contrast, the new Bank of Japan (BoJ) Governor Kazuo Ueda reiterated earlier this week that there is no immediate need to review the 2013 joint statement with the government and that the central bank will maintain current monetary easing. The dovish BoJ stance might further hold back traders from placing aggressive bullish bets around the JPY. The Fed-BoJ policy divergence suggests that the path of least resistance for the USD/JPY pair remains to the upside.
Market participants now look to the US economic docket, featuring the release of the usual Weekly Initial Jobless Claim, the Philly Fed Manufacturing Index and Existing Home Sales data later during the early North American session. This, along with speeches by influential FOMC members and the US bond yields, will drive the USD demand and provide some impetus to the USD/JPY pair. Traders will further take cues from the broader risk sentiment to grab short-term opportunities.
Technical levels to watch
-
11:25
US Dollar holds its ground, oil prices slide on worsening demand outlook
- US Dollar stays resilient against its major rivals in the second half of the week.
- Crude oil prices slide on worsening demand outlook, stronger USD.
- USD could react to macroeconomic data releases from the United States in the American session.
The US Dollar (USD) keeps its footing following Wednesday’s modest rebound as investors continue to stay away from risk-sensitive assets. Meanwhile, the renewed USD strength and growing concerns over a worsening demand outlook drag crude oil prices lower. Signs of sticky inflation in major economies remind market participants that central banks could cling to tight monetary policies at the cost of a slowdown in activity.
The US Dollar Index, which tracks the USD performance against a basket of six major currencies, stays in a tight range near 102.00 on Thursday. On a weekly basis, the index stays in positive territory, looking to snap a five-week losing streak.
Daily digest market movers: US Dollar awaits macroeconomic data releases from US
- The US Department of Labor will release the weekly Initial Jobless Claims data on Thursday, which is forecast to tick up to 240,000.
- March Existing Home Sales and the Federal Reserve Bank of Philadelphia’s Manufacturing Survey will also be featured in the US economic docket.
- Stronger-than-expected Consumer Price Index (CPI) data from the UK revived fears over sticky global inflation and triggered a rally in global bond yields.
- The benchmark 10-year US Treasury bond yield turned north early Wednesday and climbed to its highest level in nearly a month above 3.6% before going into a consolidation phase slightly below that level on Thursday.
- Crude oil prices fell sharply on Wednesday and the barrel of West Texas Intermediate lost more than 2%. WTI stays under selling pressure and trades at its lowest level in over two weeks below $78.
- The Federal Reserve’s Beige Book showed late Wednesday that manufacturing activity was widely reported as flat or down even as supply chains continued to improve. “Overall price levels rose moderately during this reporting period, though the rate of price increases appeared to be slowing,” the publication further read.
- “After the failure of two large regional Fed banks last month roiled the financial sector, I’m waiting to see whether there are other credit shoes to drop,” said Chicago Federal Reserve Bank President Austan Goolsbee in an interview with American Public Media's Marketplace on Wednesday.
- NY Fed President John Williams reiterated that it was too early to assess the economic impact of tighter credit conditions and added that they need to continue to use policy tools to restore price stability.
- St. Louis Federal Reserve President James Bullard told Reuters on Tuesday that interest rates will need to continue to rise in the absence of clear progress on inflation. Bullard further noted that he is still seeing the "adequately restrictive policy rate" at 5.50%-5.75% range and added that is biased to hold rates there for longer until inflation is contained.
- Housing Starts in the US declined by 0.8% on a monthly basis in March following February's increase of 7.3% (revised from 9.8%). In the same period, Building Permits decreased by 8.8%, compared to the market expectation of +1.45%.
- The data from China showed on Tuesday that the world’s second-largest economy expanded by an annualized rate of 4.5% in the first quarter, much stronger than the 2.9% growth recorded in the last quarter of 2022. This reading also came in better than analysts' estimate for an expansion of 4%. Other data revealed that Industrial Production expanded by 3.9% and Retail Sales rose by 10.6% on a yearly basis, compared to analysts' estimate of 7.4%.
- Richmond Fed President Thomas Barkin said on Monday that he wants to see more evidence of inflation settling back to target.
Technical analysis: US Dollar Index stays below key resistance
The US Dollar Index trades slightly below the 20-day Simple Moving Average (SMA), currently located at 102.20. In case the DXY closes the day above that level, it could target 103.00 (static level, psychological level) and 103.50 (50-day SMA, 100-day SMA).
Meanwhile, the Relative Strength Index (RSI) indicator on the daily chart moves sideways near 50, suggesting that sellers refrain from committing to further USD weakness.
On the downside, 101.50 (static level) align as interim support ahead of 101.00/100.80 (psychological level, static level, multi-month low set on April 14). A daily close below that support area could open the door for an extended slide toward 100.00 (psychological level).
How does Fed’s policy impact US Dollar?
The US Federal Reserve (Fed) has two mandates: maximum employment and price stability. The Fed uses interest rates as the primary tool to reach its goals but has to find the right balance. If the Fed is concerned about inflation, it tightens its policy by raising the interest rate to increase the cost of borrowing and encourage saving. In that scenario, the US Dollar (USD) is likely to gain value due to decreasing money supply. On the other hand, the Fed could decide to loosen its policy via rate cuts if it’s concerned about a rising unemployment rate due to a slowdown in economic activity. Lower interest rates are likely to lead to a growth in investment and allow companies to hire more people. In that case, the USD is expected to lose value.
The Fed also uses quantitative tightening (QT) or quantitative easing (QE) to adjust the size of its balance sheet and steer the economy in the desired direction. QE refers to the Fed buying assets, such as government bonds, in the open market to spur growth and QT is exactly the opposite. QE is widely seen as a USD-negative central bank policy action and vice versa.
-
11:09
Malaysia: Exports unexpectedly contracted in March – UOB
UOB Group’s Senior Economist Julia Goh and Economist Loke Siew Ting review the latest trade balance figures in Malaysia.
Key Takeaways
“Gross exports posted its first month of contraction since Aug 2020 at 1.4% y/y last month (Feb: +9.8%), primarily reflecting the effects of high statistical base a year ago, dimmer world economic outlook, and global tech downcycle. The outturn came in line with our estimate (-1.5%) but better than Bloomberg consensus (-1.9%). Gross imports also reversed course and fell by 1.8% (Feb: +12.4%, UOB est: -0.5% vs Bloomberg est: -2.2%), the first y/y fall since Nov 2020. As imports dropped at a faster pace than exports, trade surplus widened to MYR26.7bn (from +MYR19.6bn in Feb).”
“In 1Q23, exports gained 2.8% y/y (4Q22: +11.8%) while imports rose 3.7% (4Q22: +18.5%), leaving a cumulative trade surplus of MYR64.4bn (4Q22: +MYR68.0bn). This is expected to translate into a current account surplus of MYR21.5bn last quarter (4Q22: +MYR25.7bn), according to our calculation. Actual 1Q23 current account data will be released on 12 May.”
“The negative turn in Malaysia’s exports last month is in line with our expectation as we have been long warning of a statistical payback after two consecutive years of high base effects, particularly from Mar onwards. Lingering global recession risks amid a tighter monetary policy environment will continue to suppress global demand this year. Expectations for a tightening of credit conditions following the recent global banking sector turmoil will further amplify the global recession risk and dent business confidence in the near term. As such, we maintain our cautious outlook for Malaysia’s exports with 1.5% growth for this year (BNM est: +1.5%, 2022: +25.0%, 2021: +26.1%).”
-
11:05
Gold Price Forecast: XAU/USD edges higher amid weaker US Dollar, lacks follow-through
- Gold price struggles to gain any meaningful traction on Thursday and oscillates in a narrow band.
- Retreating US bond yields weighs on the US Dollar and lends support amid a weaker risk tone.
- Bets for more rate hikes by Federal Reserve act as a headwind and cap gains for the XAU/USD.
Gold price struggles to capitalize on the previous day's late rebound from the $1,969 area, or over a two-week low, and seesaws between tepid gains/minor losses through the first half of the European session on Thursday. The XAU/USD is currently placed just below the $2,000 psychological mark, nearly unchanged for the day, and is influenced by a combination of diverging forces.
Modest US Dollar weakness lends support to Gold price
The US Treasury bond yields extend the overnight pullback from a nearly one-month high and exert some downward pressure on the US Dollar (USD). This, in turn, is seen as a key factor lending some support to the US Dollar-denominated Gold price. Apart from this, a fresh wave of global risk-aversion traders further benefits the safe-haven precious metal. That said, the prospects for further policy tightening by the Federal Reserve (Fed) act as a tailwind for the USD and cap the upside for the non-yielding XAU/USD.
Bets for more Fed rate hikes cap gains for XAU/USD
In fact, the markets seem convinced that the Fed will continue raising interest rates to combat high inflation and have fully priced in a 25 basis point (bps) lift-off in May. Moreover, the Fed funds futures indicate a small chance of another rate hike at the June Federal Open Market Committee (FOMC) meeting and the bets were reaffirmed by the recent hawkish comments by Fed officials. New York Fed President John Williams said on Wednesday that inflation is still at problematic levels and the US central bank will act to lower it.
Furthermore, the Fed’s Beige Book showed that inflation in the United States (US) continued to run relatively high. Adding to this, the incoming US macro data pointed to a resilient economy and further fueled concerns that the Fed may have more work to do to contain inflation amid easing fears of a full-blown banking crisis. This should help limit the downside for the US Treasury bond yields and attract fresh USD buying at lower levels, suggesting that the path of least resistance for the Gold price remains to the downside.
Traders now eye US macro data for short-term opportunities
Market participants now look to the US economic docket, featuring the release of the usual Weekly Initial Jobless Claim, the Philly Fed Manufacturing Index and Existing Home Sales data later during the early North American session. This, along with speeches by influential FOMC members and the US bond yields and the broader risk sentiment, will drive the USD demand and provide some impetus to Gold price. Traders will further take cues from the broader risk sentiment to grab short-term opportunities around the metal.
Gold price technical outlook
From a technical perspective, the overnight breakdown through the $1,980 horizontal support was seen as a fresh trigger for bearish traders. That said, the lack of follow-through selling and the subsequent recovery warrant caution before positioning for any further depreciating move. Meanwhile, any further move up might now confront resistance near the $2,012-$2,015 zone. A sustained strength beyond might trigger a fresh bout of a short-covering and lift Gold price beyond the $2,020 intermediate hurdle, towards the $2,040 horizontal resistance en route to the YTD peak, around the $2,047-$2,049 region.
On the flip side, the $1,980 area, followed by the overnight swing low, around the $1,969 region, now seems to act as immediate support. Given that oscillators on the daily chart have just started drifting in the negative territory, some follow-through selling should pave the way for an extension of the recent retracement slide from a one-year high. The Gold price might then slide towards testing the next relevant support near the $1,956-$1,955 area before eventually dropping to the monthly low around the $1,950 region.
Key levels to watch
-
10:08
US Treasury Sec. Yellen calls for 'constructive and fair' US economic ties with China
Citing excerpts released by the US Treasury, Reuters reported that Treasury Secretary Janet Yellen will say in her speech later on Thursday that the US seeks a 'constructive and fair' economic relationship with China.
Additional takeaways
“US will communicate clearly concerns about China's behavior, secure its national security interests and protect human rights.”
“US will not compromise on national security concerns, even when they force trade-offs with economic interests.”
“US targeted actions against China are driven by security concerns, not meant to gain competitive economic advantage.”
“Calls on China to follow through on promises to work with the US on the macro economy, climate and debt distress.”
Market reaction
Yellen’s staunch remarks seem to be weighing on the Chinese proxy, the Australian Dollar. The AUD/USD pair is retreating from daily highs of 0.6726 to trade at 0.6700, losing 0.19% on the day, as of writing.
-
10:03
USD/CAD sticks to gains near one-week high, around 1.3470-75 area amid tumbling Oil prices
- USD/CAD consolidates its recent strong recovery gains to over a one-week high.
- Tumbling Crude Oil prices undermines the Loonie and lends support to the pair.
- A modest USD downtick caps the upside, though the setup favours bullish traders.
The USD/CAD pair now seems to have entered a bullish consolidation phase and is seen oscillating in a narrow range around the 1.3470-1.3475 region, or over a one-week high touched this Wednesday.
Crude Oil prices tumble to a fresh monthly low amid worries that rising borrowing costs will slow economic growth and dent fuel demand. Apart from this, signs of cooling consumer inflation in Canada undermine the commodity-linked Lonie and assist the USD/CAD pair to build on the recent solid rebound from the 1.3300 mark, or a two-month low touched earlier this week. The upside, however, remains capped in the wake of a mildly softer tone surrounding the US Dollar, led by a modest downtick in the US Treasury bond yields.
That said, the prospects for further policy tightening by the Federal Reserve (Fed) should act as a tailwind for the US bond yields and limit the downside for the USD, at least for the time being. The markets now seem convinced that the US central bank will lift rates by 25 bps at the next policy meeting in May and have been pricing in a small chance of another rate hike in June. The bets were reaffirmed by the recent hawkish comments by several Fed officials and a rise in short-term inflation expectations, which, in turn, favours the USD bulls.
In fact, the Fed’s Beige Book released on Wednesday showed that US inflation continued to run relatively high. Furthermore, the incoming US macro data pointed to a resilient economy and fueled concerns that the Fed may have more work to do amid easing fears of a full-blown banking crisis. Apart from this, a generally weaker tone around the equity markets is seen as another factor benefitting the Greenback's relative safe-haven assets, reaffirming the positive outlook and suggesting that the path of least resistance for the USD/CAD pair is to the upside.
Market participants now look to the US economic docket, featuring the release of the usual Weekly Initial Jobless Claim, the Philly Fed Manufacturing Index and Existing Home Sales data later during the early North American session. This, along with speeches by influential FOMC members, the US bond yields and the broader risk sentiment, will drive the USD demand and provide some impetus to the USD/CAD pair. Traders will further take cues from Oil price dynamics and the Bank of Canada (BoC) Governor Tiff Macklem's scheduled speech.
Technical levels to watch
-
10:01
Belgium Consumer Confidence Index: -6 (April) vs -9
-
10:00
European Monetary Union Trade Balance s.a. registered at €-0.1B above expectations (€-14.7B) in February
-
10:00
European Monetary Union Trade Balance n.s.a. above forecasts (€-22.3B) in February: Actual (€4.6B)
-
09:55
Germany’s Toncar: I don't see an immediate risk to financial stability
German Deputy Finance Minister Florian Toncar is crossing the wires, via Reuters, offering some comforting remarks on the country’s financial market conditions.
Key quotes
I don't see an immediate risk to financial stability.
We need banks that are competitive, stable and profitable.
We need more cautious fiscal policy to support ECB moves.
Market reaction
As of writing, EUR/USD is keeping the higher ground intact at around 1.0975, up 0.18% on the day.
-
09:49
Spain 10-y Obligaciones Auction increased to 3.509% from previous 3.401%
-
09:40
EUR/USD regains upside impulse and retargets 1.1000
- EUR/USD so far reverses Wednesday’s losses and retests 1.0980.
- The ECB will publish its Accounts of the last monetary policy meeting.
- US Initial Claims, Philly Fed index next of note later in the NA session.
Buyers return to the single currency and push EUR/USD back to the 1.0980 region on Thursday.
EUR/USD focuses on ECB, data
In line with the rest of the FX universe, EUR/USD maintains the weekly choppy performance well in place on Thursday, with gains limited by the psychological 1.1000 neighbourhood for the time being.
In the meantime, the absence of strong drivers for the price action on both sides of the ocean leaves the attention to the potential next steps from both the ECB and the Fed regarding the ongoing normalization of the monetary conditions. On this, investors see both central banks hiking interest rates by 25 bps at their meetings in May.
Data wise in the region, the ECB will release its Accounts of the March gathering, while the EMU Balance of Trade results and the flash Consumer Confidence are also due later in the session.
In the US, usual weekly Claims are next on tap seconded by the Philly Fed Manufacturing Index.
What to look for around EUR
EUR/USD keeps the range bound trade well in place and always below the 1.1000 region so far on Thursday.
Meanwhile, price action around the single currency should continue to closely follow dollar dynamics, as well as the incipient Fed-ECB divergence when it comes to the banks’ intentions regarding the potential next moves in interest rates.
Moving forward, hawkish ECB-speak continue to favour further rate hikes, although this view appears in contrast to some loss of momentum in economic fundamentals in the region.
Key events in the euro area this week: ECB Accounts, EMU Flash Consumer Confidence (Thursday) – Advanced Manufacturing/Services PMIs (Friday).
Eminent issues on the back boiler: Continuation (or not) of the ECB hiking cycle. Impact of the Russia-Ukraine war on the growth prospects and inflation outlook in the region. Risks of inflation becoming entrenched.
EUR/USD levels to watch
So far, the pair is gaining 0.7% at 1.0972 and a break above 1.1075 (2023 high April 14) would target 1.1100 (round level) en route to 1.1184 (weekly high March 21 2022). On the opposite hand, there is initial support at 1.0831 (monthly low April 10) seconded by 1.0788 (monthly low April 3) and finally 1.0757 (55-day SMA).
-
09:28
USD/CNH: Further advance likely above 6.9350 – UOB
Economist Lee Sue Ann and Markets Strategist Quek Ser Leang at UOB Group see the likelihood of a sustained advance in USD/CNH once 6.9350 is cleared.
Key Quotes
24-hour view: “Yesterday, we expected USD to consolidate in a range of 6.8700/6.8900. USD dropped to 6.8733, soared to 6.9100 and then dropped back down to close at 6.8931 (+0.14%). Today, USD could retest the 6.9100 level before a more sustained pullback is likely. The next resistance at 6.9200 is unlikely to come under threat. Support is at 6.8780, followed by 6.8670.”
Next 1-3 weeks: “Our latest narrative was from Monday (17 Apr, spot at 6.8820) wherein there is no clear USD direction and it could trade in a relatively broad range of 6.8500/6.9200 for the time being. Yesterday, USD rose to 6.9100 and upward momentum is beginning to improve. However, USD has to break and stay above 6.9350 before a sustained rise is likely. The chance of USD breaking clearly above 6.9305 is not high for now but it will remain intact as long as the ‘strong support’ level at 6.8600 is not taken out in the next few days.”
-
09:27
PBOC’s Zou: Will continue implementing prudent monetary policy
Zou Lan, head of monetary policy at People Bank of China (PBOC) reaffirmed on Thursday that the central bank “will continue implementing prudent monetary policy.”
Additional quotes
“To consolidate financing support for the real economy as demand still needs time to pick up.”
“To maintain the trend of economic recovery amid "scarring effect" of Covid-19.”
“Expect inflation to pick up later this year.”
“But see no basis for long-term deflation or inflation in the country.”
Market reaction
At the time of writing, AUD/USD Is consolidating its rebound at around 0.6720, up 0.10% on the day.
-
09:21
Natural Gas Futures: Extra weakness looks not favoured
Open interest in natural gas futures markets shrank for the third straight session on Wednesday, now by nearly 19K contracts according to preliminary readings from CME Group. Volume, on the other hand, went up by almost 64K contracts after two daily drops in a row.
Natural Gas remains supported by $2.00
Wednesday’s downtick in prices of the natural gas was accompanied by diminishing open interest, which hints at the idea that the continuation of the downtrend appears out of favour for the time being. That said, the commodity still remains well underpinned by the $2.00 region per MMBtu.
-
09:16
GBP/USD trades with modest losses below mid-1.2400s, downside potential seems limited
- GBP/USD retreats further from the weekly low set on Wednesday, albeit lacks follow-through.
- The stronger UK CPI lifts bets for a 25 bps BoE rate hike in May and lends support to the GBP.
- Bets for more Fed rate hikes underpin the USD and should act as a headwind for the major.
The GBP/USD pair comes under some selling pressure on Wednesday and retreats further from the weekly high, around the 1.2470-1.2475 area touched the previous day. The pair remains on the defensive through the early part of the European session and is currently placed near the daily low, around the 1.2420 region.
A combination of factors continues to act as a tailwind for the US Dollar (USD), which, in turn, is seen exerting some downward pressure on the GBP/USD pair. The prospects for further policy tightening by the Federal Reserve (Fed), along with a weaker rise sentiment, lend some support to the safe-haven Greenback. That said, rising bets for an additional interest rate hike by the Bank of England (BoE) might hold back bearish traders from placing aggressive bets and help limit losses for the major.
The markets now seem convinced that the US central bank will lift rates by 25 bps at the next policy meeting in May and have been pricing in a small chance of another rate hike in June. The bets were reaffirmed by the recent hawkish comments by several Fed officials. Moreover, the incoming macro data from the US pointed to a resilient economy and fueled concerns that the Fed may have more work to do to tame stubbornly high inflation in the US amid easing fears of a full-blown banking crisis.
This further fuel worries about the economic headwinds stemming from rising borrowing costs and tempers investors' appetite for riskier assets., which is evident from a generally weaker tone around the equity markets. The anti-risk lends additional support to the safe-haven Greenback and weighs on the GBP/USD pair. That said, the stronger UK inflation figures released on Wednesday should keep pressure on the BoE to raise interest rates further and act as a tailwind for spot prices.
The aforementioned mixed fundamental backdrop makes it prudent to wait for strong follow-through selling before placing aggressive bearish bets around the GBP/USD pair in the absence of any relevant macro data from the UK. The US economic docket features the release of the usual Weekly Initial Jobless Claims, the Philly Fed Manufacturing Index and Existing Home Sales. This, along with the US bond yields and the broader risk sentiment, will drive the USD demand and provide some impetus.
Technical levels to watch
-
09:12
Sleeping Euro continues to trade in a tight range below 1.1000
- Euro vs USD traces out a triangle-like pattern, tapering to a low-vol point in mid 1.09s.
- Federal Reserve’s Beige Book reaffirms the market's mildly hawkish stance, propping up US Dollar.
- Euro awaits defining data on May 2 when ECB will release its Bank Survey and April inflation data.
The Euro (EUR) continues trading in the mid 1.09s versus the US Dollar (USD) during the early European session on Thursday. More broadly, the pair has pulled back from the recent April 14 highs of 1.1075 as the US Dollar recovers on bets the Federal Reserve (Fed) will continue raising interest rates.
From a technical perspective, the Euro-Dollar pair is in a medium-term uptrend which is biased to extend. Scoping in, price action appears to be coiling to a point, and the diminishing volatility could be the precursor for a breakout move on the horizon.EUR/USD Market Movers
- The USD remains supported after the most recent US economic report, the Fed’s Beige Book, stated, “Economic activity was little changed in recent weeks.”
- The same report mentioned credit conditions have tightened in the aftermath of the banking crisis – but that’s to be expected.
- USD continues to benefit from St. Louis Fed’s Bullard talking up further rate hikes due to persistent inflation and overblown recession fears.
- Unexpectedly strong first quarter earnings from big US banks like JP Morgan and BofA help bandage the wounds from the sector’s crisis in March, further supporting the Greenback.
- Recent US data continues to show a strong labor market putting pay to recession fears.
- The Euro remains supported by expectations that the ECB will continue with interest rate hikes, though their size will be data-dependent.
- European Central Bank’s chief economist Philip Lane has said the health of the region’s banks, as reported in the ECB Bank Lending Survey (BLS) (out on May 2), will be a key determinant of whether the ECB hikes aggressively or not.
- Lane further sees April HICP (also released May 2) inflation as likewise key to outlook on rates.
- For the Euro, the ECB’s minutes out at 11:30 GMT, a speech by ECB President Christine Lagarde at 12:00, and April Consumer Confidence out at 14:00, are the key data releases on Thursday’s docket.
- Fed commentary as well as Initial Jobless Claims and Philadelphia Fed Manufacturing are the main releases for the US Dollar.
EUR/USD technical analysis: Overall still trending up
EUR/USD has been rising in a medium-term uptrend since reversing at the September 2022 lows, and this established trend is likely to continue. After a pullback in February 2023, EUR/USD recouped its losses during March and made new year-to-date highs above 1.1000 on April 13.
-638175746568224731.png)
EUR/USD: Daily Chart
Drilling down to the 4-hour chart (below) and price action can be seen trading with steadily diminishing volatility in the mid 1.09s. It could be tracing out a triangle pattern which will eventually break out either higher or lower. Triangles are usually composed of five waves and the current wave looks like it might be the 4th wave. If so, then a breakout could be close at hand.-638175747352381836.png)
EUR/USD: 4-hr ChartThe Chaikin Money Flow oscillator, an indicator that is supposed to help give clues as to the eventual direction of a breakout from a range bound market, has been below the zero-line during most of the evolution of the triangle, suggesting a slight bias towards expecting a downside break.
If price pierces below 1.0909 it would probably confirm the triangle was breaking lower whilst a breach of the 1.0999 April 17 high that it was higher.
More broadly, a break and daily close above the 1.1075 year-to-date highs of April 14 would provide Euro bulls with added confidence to push price up to the next target at around 1.1190, where the 200-week Simple Moving Average (SMA) is situated and likely to provide pushback.
From a bearish perspective, a break and close below the lower high at 1.0830 would bring into question the strength and validity of the uptrend and could see losses extend down to a confluence of support at 1.0750.
Euro FAQs
What is the Euro?
The Euro is the currency for the 20 European Union countries that belong to the Eurozone. It is the second most heavily traded currency in the world behind the US Dollar. In 2022, it accounted for 31% of all foreign exchange transactions, with an average daily turnover of over $2.2 trillion a day.
EUR/USD is the most heavily traded currency pair in the world, accounting for an estimated 30% off all transactions, followed by EUR/JPY (4%), EUR/GBP (3%) and EUR/AUD (2%).What is the ECB and how does it impact the Euro?
The European Central Bank (ECB) in Frankfurt, Germany, is the reserve bank for the Eurozone. The ECB sets interest rates and manages monetary policy.
The ECB’s primary mandate is to maintain price stability, which means either controlling inflation or stimulating growth. Its primary tool is the raising or lowering of interest rates. Relatively high interest rates – or the expectation of higher rates – will usually benefit the Euro and vice versa.
The ECB Governing Council makes monetary policy decisions at meetings held eight times a year. Decisions are made by heads of the Eurozone national banks and six permanent members, including the President of the ECB, Christine Lagarde.How does inflation data impact the value of the Euro?
Eurozone inflation data, measured by the Harmonized Index of Consumer Prices (HICP), is an important econometric for the Euro. If inflation rises more than expected, especially if above the ECB’s 2% target, it obliges the ECB to raise interest rates to bring it back under control.
Relatively high interest rates compared to its counterparts will usually benefit the Euro, as it makes the region more attractive as a place for global investors to park their money.How does economic data influence the value of the Euro?
Data releases gauge the health of the economy and can impact on the Euro. Indicators such as GDP, Manufacturing and Services PMIs, employment, and consumer sentiment surveys can all influence the direction of the single currency.
A strong economy is good for the Euro. Not only does it attract more foreign investment but it may encourage the ECB to put up interest rates, which will directly strengthen the Euro. Otherwise, if economic data is weak, the Euro is likely to fall.
Economic data for the four largest economies in the euro area (Germany, France, Italy and Spain) are especially significant, as they account for 75% of the Eurozone’s economy.How does the Trade Balance impact the Euro?
Another significant data release for the Euro is the Trade Balance. This indicator measures the difference between what a country earns from its exports and what it spends on imports over a given period.
If a country produces highly sought after exports then its currency will gain in value purely from the extra demand created from foreign buyers seeking to purchase these goods. Therefore, a positive net Trade Balance strengthens a currency and vice versa for a negative balance. -
09:08
Greece Current Account (YoY) dipped from previous €-0.125B to €-1.325B in February
-
09:07
USD/JPY now targets the 135.75 level near term – UOB
The continuation of the upside momentum could lift USD/JPY to the 135.75 level in the short-term horizon according to Economist Lee Sue Ann and Markets Strategist Quek Ser Leang at UOB Group.
Key Quotes
24-hour view: “We expected USD to trade sideways in a range of 133.50/134.50 yesterday. We did not anticipate the choppy price actions as USD soared to a high of 135.12 and quickly pulled back from the high. Upward momentum has improved, albeit not much. Today, USD could test the 135.15 level before the risk of a more sustained pullback increases. The next resistance at 135.75 is unlikely to come under threat. On the downside, a breach of 134.15 (minor support is at 134.35) would indicate that the current upward pressure has eased.”
Next 1-3 weeks: “In our most recent narrative from three days ago (17 Apr, spot at 133.80), we highlighted that USD is likely to trade with an upward bias to 134.80. We added, ‘it has to break clearly above this level before further gains can be expected’. Yesterday, USD took out 134.80 and rose to 135.12. Despite the advance, upward momentum has not improved much. However, the bias is still towards a higher USD. The next level to aim for is 135.75. On the downside, the ‘strong support’ level has moved higher to 133.50 from 133.00. A break of the ‘strong support’ level would indicate that USD is not strengthening further.”
-
08:55
Crude Oil Futures: Diminishing bets for further downside
Considering advanced prints from CME Group for crude oil futures markets, open interest shrank for the second session in a row on Wednesday, now by around 16.6K contracts. Volume followed suit and dropped for the third consecutive day, this time by around 13.6K contracts.
WTI: Next on the downside comes $76.00
Prices of the WTI extended the corrective decline on Wednesday and seem en route to close the post-OPEC+ gap seen at the beginning of the month. The daily retracement, however, was in tandem with declining open interest and volume and is indicative that a deeper pullback is out of favour. There should be an initial support near the $76.00 mark per barrel (March 31 high).
-
08:48
NZD/USD sticks to the mixed outlook so far – UOB
In the opinion of Economist Lee Sue Ann and Markets Strategist Quek Ser Leang at UOB Group, further range bound trade in NZD/USD appears likely in the near term.
Key Quotes
24-hour view: “We expected NZD to trade in a range between 0.6185 and 0.6235 yesterday. NZD traded in a range of 0.6174/0.6225 before closing at 0.6200 (-0.10%). NZD dropped sharply in early Asian trade and downward momentum is building. While NZD is likely to weaken, a sustained drop below the major support at 0.6140 is unlikely. Resistance is at 0.6200, followed by 0.6225.”
Next 1-3 weeks: “Our latest narrative was from Monday (17 Apr, spot at 0.6210) when we highlighted that the recent choppy swings have resulted in a mixed outlook and NZD could trade in a range of 0.6140/0.6285 for now. We continue to hold the same view but downward momentum appears to be building, albeit tentatively. Looking ahead, NZD has to break and stay below 0.6120 before a sustained decline is likely.”
-
08:40
Silver Price Analysis: XAG/USD bulls have the upper hand above 23.6% Fibo./100-period SMA
- Silver lacks any firm intraday direction and oscillates in a narrow range on Thursday.
- The technical setup favours bulls and supports prospects for further near-term gains.
- A convincing break below the $24.00 mark is needed to negate the positive outlook.
Silver struggles to capitalize on the overnight goodish rebound from the $24.65 region, or a one-and-half-week low, and seesaws between tepid gains/minor losses through the early European session on Thursday. The white metal, however, manages to hold its neck above the $25.00 psychological mark and for now, seems to have stalled the recent pullback from over a one-year high, around the $26.10 area touched last week.
Technical indicators on the daily chart, meanwhile, are holding comfortably in the positive territory and have already eased from the overbought zone. Adding to this, the overnight recovery from the 23.6% Fibonacci retracement level of the recent rally from the YTD low favours bullish traders and supports prospects for additional gains. Some follow-through buying beyond the $25.20-$25.25 area will reaffirm the positive outlook and lift the XAG/USD further towards the $25.80-$25.85 hurdle en route to the $26.00 mark.
On the flip side, the 23.6% Fibo., around the $24.65 area, now coincides with the 100-period Simple Moving Average (SMA) on the daily chart and should act as a pivotal point. This is closely followed by the $24.40-$24.30 strong horizontal resistance breakpoint, now turned support, which if broken could drag the XAG/USD towards the $24.00 mark en route to the 38.2% Fibo. level, around the $23.75 area.
Silver 4-hour chart
Key levels to watch
-
08:13
Gold Futures: Further losses unlikely
CME Group’s flash data for gold futures markets noted traders reduced their open interest positions by nearly 8K contracts on Wednesday. Volume, instead, reversed two daily pullbacks in a row and went up by around 40.8K contracts.
Gold: Next on the upside comes the 2023 high
Gold prices remain side-lined so far this week. Wednesday’s downtick, however, was on the back of shrinking open interest and is suggestive that a deeper drop is not favoured in the very near term. That said, occasional bouts of strength are still seen targeting the YTD peak near $2050 per ounce troy (April 13).
-
08:01
GBP/USD: Firm support remains at 1.2275 – UOB
Further decline in GBP/USD is expected to meet solid contention around 1.2275 for the time being, note Economist Lee Sue Ann and Markets Strategist Quek Ser Leang at UOB Group.
Key Quotes
24-hour view: “Yesterday, we expected GBP to trade in a range between 1.2385 and 1.2455. We did not anticipate the elevated volatility as GBP traded in a choppy manner between 1.2393 and 1.2475. The price actions have resulted in a mixed outlook and GBP could trade in a range today, likely between 1.2375 and 1.2475.”
Next 1-3 weeks: “Our most recent narrative was from Monday (17 Apr, spot at 1.2405) wherein GBP could edge lower but any decline is unlikely to break clearly below the major support at 1.2275. Yesterday, GBP swung between 1.2393 and 1.2475. As there is no clear breach of our ‘strong resistance’ at 1.2475, we will continue to hold the same view for now.”
-
08:01
NZD/USD bounces off over one-month low, still deep in the red below 0.6200 mark
- NZD/USD dives to over one-month low in reaction to softer domestic consumer inflation figures.
- A modest downtick in the US bond yields undermines the USD and helps limit losses for the pair.
- The fundamental backdrop favours bearish traders and supports prospects for additional losses.
The NZD/USD pair comes under intense selling pressure on Thursday and drops to the 0.6150-0.6145 area, or over a one-month low
in reaction to the softer New Zealand consumer inflation figures. Spot prices, however, trim a part of heavy intraday losses and rebound to the 0.6175-0.6180 region during the early European session.The US Dollar (USD) edges lower amid a modest downtick in the US Treasury bond yields and moves further away from a one-week high touched on Wednesday, which, in turn, is seen lending some support to the NZD/USD pair. That said, the prospects for further policy tightening by the Federal Reserve (Fed) should act as a tailwind for the US bond yields and limit the downside for the USD, at least for the time being.
In fact, the markets have nearly fully priced in a 25 bps lift-off in May and the Fed funds futures indicate a small chance of another rate hike in June. The bets were lifted by the recent hawkish comments by several Fed officials. Moreover, the incoming macro data from the US pointed to a resilient economy and fueled concerns that the Fed may have more work to do amid easing fears of a full-blown banking crisis.
Furthermore, data released earlier this Thursday showed that the headline CPI decelerated from the prior quarter’s 32-year high of 7.2% to 6.7% in the three months to March. This could be seen as the first sign of cooling inflation and entails a slightly less hawkish stance by the Reserve Bank of New Zealand (RBNZ), suggesting that the path of least resistance for the NZD/USD pair is to the downside.
Market participants now look to the US economic docket, featuring the release of the usual Weekly Initial Jobless Claim, the Philly Fed Manufacturing Index and Existing Home Sales data later during the early North American session. This, along with speeches by influential FOMC members, the US bond yields and the broader risk sentiment, will drive the USD demand and provide some impetus to the NZD/USD pair.
Technical levels to watch
-
07:55
Gold Price Forecast: XAU/USD rebound appears elusive below $2,010 – Confluence Detector
- Gold price portrays bearish consolidation ahead of the key US data/events.
- Recession woes, higher Fed bets keep XAU/USD bears hopeful amid repeated failures to cross $2,010 key hurdle.
- US PMIs, last round of Fed talks ahead of May FOMC eyed for clear directions of the Gold price.
Gold price (XAU/USD) portrays a corrective rebound ahead of the key US data/events while paring the losses marked in the last two weeks. Even so, the bright metal stays within a one-month-old bullish channel, currently between $1,970 and $2,050, as traders remain cautious before the all-important May Federal Open Market Committee (FOMC) Monetary policy meeting. Even so, the XAU/USD sellers remain hopeful as the major central bankers’ “higher for longer” slogan joins recession woes below the $2,010 key resistance.
That said, the looming fears of economic recession, backed by hawkish signals from the major central banks, seem to weigh on the Gold price despite the latest corrective bounce off the aforementioned channel’s lower line. Adding strength to the rebound is the recent pullback in the yields and the US Dollar amid hopes of China’s sustained economic recovery. It’s worth noting that the incoming figures of the US preliminary PMIs for April and the last round of the Fed policymakers’ speeches before the May FOMC needs to defend the hawkish Fed bets to keep the Gold price down for the second consecutive week.
Also read: Gold Price Forecast: XAU/USD bears eye acceptance below 21 DMA after bearish wedge confirmation
Gold Price: Key levels to watch
Our Technical Confluence Indicator shows that the Gold price grinds higher towards the $2,010 resistance confluence comprising the previous monthly high and Fibonacci 61.8% on one-week. Ahead of that, a convergence of the 10-DMA and 5-DMA prods the XAU/USD bulls around $2,008.
It’s worth noting that the Gold price upside past $2,010 has a minor bump around $2,015, encompassing Pivot Point one-day R1, which can prod the XAU/USD bulls before directing them to the $2,050 resistance that includes the top line of a one-month-old bullish channel.
On the contrary, Fibonacci 61.8% on one-day and the middle band of the Bollinger on one-day together highlight $1,995 as immediate support for the Gold traders to watch during the quote’s fresh downside.
Following that, the previous weekly low of around $1,985 and the Pivot Point one-week S1 around $1,977 could act as the last defenses of the XAU/USD buyers.
Overall, the Gold price remains on the bear’s radar unless breaking $2,010.
Here is how it looks on the tool
About Technical Confluences Detector
The TCD (Technical Confluences Detector) is a tool to locate and point out those price levels where there is a congestion of indicators, moving averages, Fibonacci levels, Pivot Points, etc. If you are a short-term trader, you will find entry points for counter-trend strategies and hunt a few points at a time. If you are a medium-to-long-term trader, this tool will allow you to know in advance the price levels where a medium-to-long-term trend may stop and rest, where to unwind positions, or where to increase your position size.
-
07:47
USD Index comes under pressure below 102.00 ahead of data
- The index gives away some gains below the 102.00 mark.
- Global markets remain within a consolidative phase so far.
- Weekly Claims, Philly Fed Index next of note in the docket.
The greenback, when tracked by the USD Index (DXY), trades slightly on the defensive below the 102.-00 region on Thursday.
USD Index looks at data
The index keeps the erratic performance around the 102.00 zone well in place for yet another session on Thursday, always amidst the broad-based consolidative mood in the global markets and the absence of strong catalysts for the price action.
No changes to the expectations around the next decision by the Federal Reserve regarding interest rates, as it remains well on the cards a 25 bps rate raise to 5.00%-5.25% range at the May 3 gathering.
In the US calendar, the focus of attention is expected to remain on weekly Initial Jobless Claims along with the manufacturing gauge tracked by the Philly Fed.
What to look for around USD
The absence of strong catalysts leaves the price action around the dollar – and the rest of the FX space – somewhat muted around the 102.00 region so far this week.
In the meantime, the marked retracement in the buck since March has been underpinned by the pick-up in the perception that the Federal Reserve could make a pause in its current tightening cycle just after the May meeting.
In favour of a pivot in the Fed’s normalization process, however, still emerges the persevering disinflation, nascent weakness in some key fundamentals and somewhat persistent concerns surrounding the banking sector.
Key events in the US this week: Initial Claims, Philly Fed Index, CB Leading Index, Existing Home Sales (Thursday) - Flash Manufacturing/Services PMIs (Friday).
Eminent issues on the back boiler: Persistent debate over a soft/hard landing of the US economy. Terminal Interest rate near the peak vs. speculation of rate cuts in 2024. Fed’s pivot. Geopolitical effervescence vs. Russia and China. US-China trade conflict.
USD Index relevant levels
Now, the index is losing 0.14% at 101.80 and a breach of 100.78 (2023 low April 14) would open the door to 100.00 (psychological level) and finally 99.81 (weekly low April 21 2022). On the other hand, the immediate resistance aligns at 102.80 (weekly high April 10) followed by 103.05 (monthly high April 3) and then 103.33 (55-day SMA).
-
07:45
France Business Climate in Manufacturing registered at 101, below expectations (103) in April
-
07:44
Forex Today: Investors eye central bank speak in search of fresh catalyst
Here is what you need to know on Thursday, April 20:
Choppy market action continues this week as participants look for the next fundamental driver. The US Dollar Index extends its sideways grind following Wednesday's uninspiring rebound and the risk mood stays neutral on Thursday. The European Central Bank (ECB) will release the minutes of its last policy meeting and President Christine Lagarde will be delivering a speech. The US economic docket will feature Existing Home Sales, weekly Jobless Claims and Philadelphia Fed Manufacturing Survey. Fed Governor Waller and policymakers Waller, Mester, Bowman and Logan are scheduled to speak later in the day as well.
The cautious market stance and rising US Treasury bond yields helped the US Dollar (USD) stay resilient against its rivals on Wednesday. Early Thursday, the 10-year US T-bond yield slipped back below 3.6%. The Fed's Beige Book revealed late Wednesday that overall price levels rose moderately and the rate of price increases appeared to be slowing in the survey period ending April 10.
During the Asian trading hours, the data from New Zealand showed that the annualized Consumer Price Index (CPI) in the first quarter dropped to 6.7% from 7.2%. This reading came in below the market expectation of 7.1% and weighed on NZD/USD. The pair was last seen losing 0.4% on the day at 0.6170.
EUR/USD erased a portion of its daily gains in the American session and registered small daily losses on Wednesday. The pair stays quiet and fluctuates above 1.0950 in the European morning on Thursday.
Pound Sterling held strong against the USD on Wednesday on the back of hot inflation data from the UK. After having closed modestly higher, GBP/USD seems to have gone into a consolidation phase at around 1.2450 on Thursday.
USD/CAD rose sharply on Wednesday and gained nearly 100 pips on its way to a fresh weekly high above 1.3470. The commodity-sensitive loonie struggled to find demand as crude oil prices fell more than 2% on a daily basis. The pair seems to have stabilized near 1.3450 early Thursday.
USD/JPY benefited from rising US T-bond yields but lost its traction after facing stiff resistance near 135.00. The pair consolidates its gains at around 134.50 in the European morning.
Gold price fell to its weakest level in two weeks below $1,970 on Wednesday before retracing the majority of its daily drop in the second half of the day. Early Thursday, XAU/USD moves up and down in a narrow channel slightly below $2,000.
Bitcoin broke below $30,000 and ended up losing more than 5% on Wednesday. BTC/USD seems to have settled at around $29,000 on Thursday. Ethereum recorded its biggest one-day decline since November as it lost more than 8% on Wednesday. ETH/USD trades below key $2,000 following the latest selloff.
-
07:28
EUR/USD risks further decline near term – UOB
Economist Lee Sue Ann and Markets Strategist Quek Ser Leang at UOB Group still suggest EUR/USD could drift lower in the next few weeks.
Key Quotes
24-hour view: “We expected EUR to trade in a range of 1.0935/1.1000 yesterday. However, EUR traded between 1.0915 and 1.0983 before closing slightly lower at 1.0954 (-0.15%). The underlying tone has softened and EUR is likely to edge lower today. However, any decline is unlikely to break 1.0900. Resistance is at 1.0980, followed by 1.1000.”
Next 1-3 weeks: “Our latest narrative from two days ago (18 Apr, spot at 1.0925) is still valid. As highlighted, downward momentum appears to be building, albeit tentatively. EUR is likely to trade with a downward bias but any decline is expected to face solid support at 1.0830. Overall, only a breach of 1.1025 (no change in ‘strong resistance’ level) would indicate that the build-up in momentum has fizzled out.”
-
07:21
GBP/JPY Price Analysis: Eases towards previous resistance surrounding 167.00
- GBP/JPY retreats from four-month high, prints the first daily loss in five.
- Failures to stay beyond 168.00 joins bearish MACD signals to lure GBP/JPY bears.
- Resistance-turned-support from early April, steady RSI prods pair sellers.
- Upside break of the immediate trend line hurdle could aim for the late 2022 peak.
GBP/JPY prints mild losses around 167.50 heading into Thursday’s London open. In doing so, the cross-currency pair consolidates the four-day uptrend at the highest levels since late 2022.
That said, the bearish MACD signals join the quote’s repeated failure to stay beyond the 168.00 round figure to lure the GBP/JPY pair sellers.
However, the steady RSI (14) line and a 12-day-old descending trend line, previous resistance around 167.00, restrict the immediate downside of the quote.
Following that, multiple lows marked during mid-April, near 164.50-40, will be in the spotlight.
It should be noted that a one-week-old horizontal area of around 165.40-50 could offer an intermediate halt to the GBP/JPY pair sellers between 167.00 and 164.40.
On the flip side, a downward-sloping trend line stretched from the previous day’s peak, around 167.65 at the latest, could quickly portray the pair’s other attempt to surpass the 168.00 figure.
Also acting as a short-term key upside hurdle is the late 2022 peak of 169.27 and the 170.00 round figure, a break of which could highlight the November 2022 high of nearly 172.15.
GBP/JPY: Hourly chart
Trend: Pullback expected
-
07:06
FX option expiries for Apr 20 NY cut
FX option expiries for Apr 20 NY cut at 10:00 Eastern Time, via DTCC, can be found below.
- EUR/USD: EUR amounts
- 1.0870-85 1.6b
- 1.0895-00 1.1b
- 1.0920-25 .9b
- 1.0975-80 948m
- 1.1000-10 1.3b
- 1.1100 1.1b
- GBP/USD: GBP amounts
- 1.2350 865m
- USD/JPY: USD amounts
- 132.00-15 1.4b
- 134.30 738m
- AUD/USD: AUD amounts
- 0.6700 1.2b
- USD/CAD: USD amounts
- 1.3290 550m
- 1.3510 668m
- EUR/JPY: EUR amounts
- 142.65-75 1.1b
-
07:03
USD/JPY retreats towards 134.50 amid sluggish yields, mixed clues from BoJ, Fed
- USD/JPY eases from six-week high amid recently downbeat yields.
- Upbeat economic analysis from BoJ, Fed troubles Yen pair buyers amid sluggish markets.
- Fears of higher rates, recession keep bulls hopeful ahead of second-tier US data, Japan inflation.
USD/JPY aptly portrays the market’s inaction during early Thursday as traders await more clues to extend the latest run-up. That said, the Yen pair seesaws around 134.80, recently retreating from a six-week high marked the previous day.
Recently weighing on the Yen pair could be the headlines from the Bank of Japan (BoJ) as it maintains the overall upbeat economic assessment for seven of Japan's nine regions. Furthermore, chatters that the BoJ can tweak the Yield Curve Control (YCC) policy if wage momentum holds, favored by Reuters, weigh on the USD/JPY prices.
It should be noted that the latest Fed Beige Book said, “Overall economic activity was little changed in recent weeks.” The report also mentioned that expectations for future growth were mostly unchanged as well.
On a broader front, the looming fears of economic recession, backed by hawkish signals from the major central banks, seem to propel the US Treasury bond yields and the US Dollar the previous day. Late Wednesday, New York Fed President John Williams marked support for a 0.25% interest rate hike in May while saying, “Inflation is still too high, and we will use our monetary policy tools to restore price stability.” Just before him was Chicago Federal Reserve Bank President Austan Goolsbee who highlighted credit market strength as one of the key catalysts to watch ahead of the next Fed monetary policy meeting.
Amid these plays, CME’s FedWatch Tool suggests that the market players place higher bets on the US central bank’s 0.25% rate hike in May, almost 85% at the latest, as well as reduce the probability of witnessing a rate cut in 2023. That said, the US 10-year and two-year Treasury bond yields grind near 3.60% and 4.25% respectively after refreshing the monthly top the previous day.
Elsewhere, geopolitical concerns surrounding China, Russia and the US also put a floor under the USD/JPY prices, due to the US Dollar’s haven demand. However, the recently mixed US data and doubt about the Fed’s future rate hike trajectory prod the Yen pair buyers.
As a result, the traders may closely observe today’s second-tier US data and comments from the Fed officials during their final round of public appearances before the blackout period for clear directions. Additionally, Friday’s Japan inflation data and the US PMIs are crucial for fresh impulse.
Technical analysis
USD/JPY grinds higher between a one-month-old ascending trend line and the 200-day Exponential Moving Average (EMA), currently around 135.10 and 133.70 in that order.
-
07:00
Germany Producer Price Index (MoM) below forecasts (-0.5%) in March: Actual (-2.6%)
-
07:00
Germany Producer Price Index (YoY) registered at 7.5%, below expectations (9.8%) in March
-
07:00
Denmark Consumer Confidence climbed from previous -23.1 to -18.2 in April
-
06:58
ECB’s Knot: Too early to talk about a pause in interest rate rises
European Central Bank (ECB) Governing Council member Klaas Knot said in an interview with Irish Times on Thursday, it is “too early to talk about a pause in interest rate rises.”
Additional quotes
Not uncomfortable with current market pricing of terminal rate.
We are now in what i would call mildly restrictive territory but inflation is still much too high.
Mildly restrictive territory will not be enough to counter an underlying inflation rate that has been creeping up.
-
06:53
BoJ open to tweaking YCC this year if wage momentum holds – Reuters
Citing five sources familiar with the Bank of Japan’s (BoJ) thinking, Reuters reported on Thursday, is open to mulling over the idea of making adjustments to its controversial bond yield control policy later this year.
Key takeaways
“The preferred approach, for now, is to stay the course, which means the bank will make no major immediate changes to YCC and its dovish policy guidance.”
"Given looming overseas economic risks, it's appropriate to maintain ultra-loose monetary policy now.”
"The BOJ must avoid dampening public sentiment" by sending a message that could be interpreted as an early approach of an exit.”
"Japan's wage dynamics appear to be changing. It's possible for 2% inflation to be sustainably met.”
Related reads
- BoJ maintains assessment for seven of Japan's nine regions
-
06:50
AUD/USD shows inventory adjustment above 0.6700 as focus shifts to US/Australian S&P PMI
- AUD/USD is consolidating above 0.6700 after a mild corrective move.
- A synergic effect of further rate hikes from the Federal Reserve and tight credit conditions by US banks would weigh heavily on US inflation.
- An unchanged interest rate decision by the People’s Bank of China failed to impact the Australian Dollar.
- AUD/USD is auctioning in an Inverted Flag chart pattern which is a trend continuation pattern.
AUD/USD is displaying a sideways performance in a narrow range of the round-level resistance of 0.6700 in the early European session. The Aussie asset is consolidating after a mild correction move. The Australian Dollar didn’t show any major move as expected after the announcement of the interest rate decision by the People’s Bank of China (PBoC).
S&P500 futures are constantly adding losses in the Asian session as missed earnings from Netflix weighed on market sentiment. Meanwhile, Investors are worried that firms are coming with poor revenue guidance as interest rates by the Federal Reserve (Fed) have sky-rocketed and now United States banks are going extremely tight on loan disbursement to maintain asset quality. The events are cementing a slowdown in the US economy as firms would face a significant impact of the liquidity crisis.
The US Dollar Index (DXY) is showing a subdued performance as the upside is capped and the downside is restricted in a range of 101.93-102.04. Following the footprints of the subdued USD Index, the US Treasury yields are also displaying a lackluster performance. Yields on 10-year US Treasury bonds seem stable above 3.59%.
Fed’s Beige Book conveys consistent activities and tight credit conditions by US
Investors were gauging reasons in Federal Reserve’s (Fed) Beige Book that would be supportive to force the Federal Reserve to consider an early pause to the policy-tightening spell. Except for tight credit conditions by US commercial banks, all economic indicators were favoring more rate hikes from the Federal Reserve.
Fed Beige Book released on April 19 was the first after the collapse of US regional banks and it showed how worried banks are about their asset quality. Lending volumes and loan demand generally declined across consumer and business loan types. Several districts noted that banks tightened lending standards amid increased uncertainty and concerns about liquidity.
Going forward, a synergic effect of further rate hikes from the Federal Reserve and tight standards for credit disbursement by US banks would weigh heavily on US inflationary pressures.
On the interest rate guidance, A Reuters poll on Fed’s interest rate guidance conveys that Fed chair Jerome Powell will deliver a final 25-basis-point interest rate increase in May and then hold rates steady for the rest of 2023. The survey also supports a short and shallow recession this year.
This week, preliminary US S&P PMI data will remain in the spotlight. The street is anticipating the Manufacturing PMI at 49.0, lower than the former release of 49.2. The Services PMI is also seen lower at 51.5 against the figure of 52.6 released earlier.
Australian Dollar remains muted despite unchanged PBoC’s policy
A power-pack action was expected from the Australian Dollar amid the announcement of the interest rate decision by the People’s Bank of China (PBoC). However, the Australian Dollar remained mute despite the People’s Bank of China holding its Loan Prime Rate (LPR) steady. China’s central bank has kept its one-year and five-year Loan Prime Rate (LPR) stable at 3.65% and 4.30% respectively. An unchanged monetary policy stance by the People’s Bank of China was already expected by the market participants.
Considering the fact that the Chinese economy is well on track for economic recovery after dismantling its pandemic controls, there was no urgency of easing monetary policy further. This week, the Gross Domestic Product (GDP) released for the first quarter remained critically upbeat. In the first quarter, China’s growth rate remained in line with estimates at 2.2%. On an annual basis, the growth rate jumped by 4.5% vs. consensus of 4.0% and the former release of 2.9%.
It is worth noting that Australia is a leading trading partner of China and higher growth prospects in China would be supportive of the Australian Dollar.
Going forward, Friday’s preliminary Australian S&P PMI data will be keenly watched. As per the consensus, Manufacturing PMI will drop to 48.8 from the former release of 49.1.
AUD/USD technical outlook
AUD/USD is auctioning in an Inverted Flag chart pattern which is a trend continuation pattern in which a long consolidation is followed by a breakdown. Usually, the consolidation phase of the chart pattern serves as an inventory adjustment in which those participants initiate shorts, which prefer to enter an auction after the establishment of a bearish bias and current sellers add more positions.
The 200-period Exponential Moving Average (EMA) at 0.6806 is acting as a barricade for the Australian Dollar bulls.
Meanwhile, the Relative Strength Index (RSI) (14) is hovering in the 40.00-60.00 range, signaling an absence of a potential trigger.
-
06:35
USD/MXN Price Analysis: Mexican Peso sellers tighten grip above 18.00
- USD/MXN regains upside momentum after probing bulls the previous day.
- Sustained trading above six-week-old ascending support line, looming bull cross on MACD favor buyers.
- 21-DMA holds the key to further run-up towards monthly top, bearish trend remain intact below 18.90.
- Downside break of 18.00 could trigger fresh fall targeting YTD low.
USD/MXN picks up bids to 18.07 as it grinds near intraday high, up 0.15% on a day amid early Thursday in Europe.
That said, the Mexican Peso (MXN) pair snapped a three-day uptrend the previous day but failed to provide a daily closing beneath an important support line, which in turn joined a looming bull cross on the MACD indicator to recall the buyers.
Not only the impending price-positive signals on the MACD indicator and the pair’s sustained trading beyond a 1.5-month-old support line but steady RSI (14) also hints at the continuation of the recovery moves.
With this, the USD/MXN buyers are all set to approach the 21-DMA hurdle of around 18.15, a break of which could propel the prices toward the monthly high of 18.40.
It’s worth noting, however, that the USD/MXN run-up beyond 18.40 highlights a downward-sloping resistance line from the last September, around 18.90, which holds the key to reversing the pair’s multi-month-old bearish trend.
On the contrary, an upward-sloping trend line from early March, close to the 18.00 round figure, puts a floor under the USD/MXN prices for the short term.
Following that, the recently flashed multi-month low of 17.89 and lows marked in June 2017 around 17.80, as well as the year 2017 bottom surrounding 17.44, will be in the spotlight.
USD/MXN: Daily chart
Trend: Further recovery expected
-
06:15
BoJ maintains assessment for seven of Japan's nine regions
In a quarterly report analyzing the regional economies of Japan, the Bank of Japan (BoJ) kept up its assessment of seven of the country's nine economic regions.
Additional takeaways
“BoJ revises down assessment for one of Japan's nine regions.”
“BoJ revises up assessment for one of Japan's nine regions.“
“Four regions said their economies are picking up or picking up moderately.”
Market reaction
At the time of writing, USD/JPY is keeping its range at around 134.80, having faced rejection at 135.00. The pair is adding 0.09% on the day.
-
06:12
USD/CAD stays firmer past 1.3450 on downbeat Oil price, focus on BoC’s Macklem, yields
- USD/CAD sticks to mild gains at the highest levels in a week.
- Oil price bears the burden of recession woes amid fears of higher interest rates.
- Downbeat prints of second-tier Canada data, unimpressive BoC talks propel Loonie prices.
- Risk catalysts, comments from BoC, Fed policymakers eyed for clear directions.
USD/CAD grinds higher as it approaches the 1.3500 round figure amid early Thursday morning in Europe. In doing so, the Loonie pair defends the previous day’s gains to refresh a one-week high as bulls turn cautious ahead of the key Canadian catalysts.
USD/CAD bulls cheer the downbeat Oil price, as well as the market’s rush towards risk safety, to refresh the multi-day high. That said, WTI crude oil renews a two-week low to around $78.30 as it drops for the fourth consecutive day. The black gold’s latest weakness could be linked to the looming fears of economic recession, backed by higher interest rates at the major central banks.
On the other hand, the US Dollar Index (DXY) benefits from the risk-off mood, even as it makes rounds to 102.00 of late. Recently, New York Fed President John Williams marked support for a 0.25% interest rate hike in May while saying, “Inflation is still too high, and we will use our monetary policy tools to restore price stability.” Just before him was Chicago Federal Reserve Bank President Austan Goolsbee who highlighted credit market strength as one of the key catalysts to watch ahead of the next Fed monetary policy meeting.
Considering the same, the market players place higher bets on the US central bank’s 0.25% rate hike in May, almost 85% at the latest, as well as reduce the probability of witnessing a rate cut in 2023.
On the other hand, fears of a full-blown China versus the West tussle, backed by allegations of Beijing’s support to Russia and a secret mission in cracking down the Western infrastructure via its technological advancements, weigh on the sentiment. Additionally, fears of easing consumer spending in the US, as per the credit card data update from Reuters, also weigh on the risk profile and fuel the USD/CAD price.
It should be noted that the downbeat prints of Canada’s Housing Starts, Industrial Product Price and Raw Material Price join the upbeat statements in the Fed Beige Book to offer additional upside catalyst for the Loonie pair.
While portraying the mood, the S&P 500 Futures print the first daily loss, so far, in four around 4,168, down 0.25% intraday by the press time. However, the US 10-year and two-year Treasury bond yields grind near 3.60% and 4.25% respectively after refreshing the monthly top the previous day.
Given the market’s downbeat sentiment and softer Oil price, the USD/CAD may remain firmer. However, comments from Bank of Canada (BoC) Governor Tiff Macklem and Deputy Governor Carolyn Rogers will be crucial, even if both of them are likely to defend the latest pause in the rate hike trajectory at home, which in turn can propel the Loonie pair prices. On the other hand, second-tier US data like Weekly Initial Jobless Claims, Philadelphia Fed Manufacturing Survey and Existing Home Sales, will be in focus. Above all, risk catalysts and yields will be crucial to determine immediate USD/CAD moves.
Technical analysis
USD/CAD bulls cheer an upside break of the one-month-old descending trend line, as well as the 100-SMA on the four-hour chart, respectively near 1.3465 and 1.3390. However, the overbought RSI (14) line challenges the Loonie pair’s further upside. The same highlights the 1.3500 round figure as an immediate hurdle ahead of the April 10 swing high of around 1.3555.
-
05:56
Gold Price Forecast: XAU/USD remains sideways below $2,000 ahead of preliminary US S&P PMI data
- Gold price is in a sideways trend as the USD Index has shifted into a volatility contraction mode.
- The street is anticipating that tight credit conditions would affect the working capital management of cash-reliant firms.
- Banks have tightened conditions for disbursing credit to avoid deterioration of asset quality.
Gold price (XAU/USD) is displaying topsy-turvy moves around $1,994.00 in the early European session. The precious metal is in a directionless mode as investors are awaiting the release of preliminary United States S&P PMI data, which is scheduled for Friday.
The US Dollar Index (DXY) is demonstrating signs of volatility contraction below 102.00 after wild moves influenced by Federal Reserve’s (Fed) Beige Book. Economic activities in 12 Fed districts remained almost constant, however, the catalyst that has deepened fears of a recession in the US economy is the declining trend of advances to consumer and business loans by US commercial banks. Banks have tightened conditions for disbursing credit to avoid deterioration of asset quality.
Meanwhile, S&P futures have registered decent losses in the Asian session as investors are cautious over commentary from firms over revenue guidance. The street is anticipating that tight credit conditions would affect the working capital management of cash-reliant firms, which would impact their workflow.
Considering the event of preliminary US S&P PMI data, the street is anticipating Manufacturing PMI at 49.0, lower than the former release of 49.2. The Services PMI is also seen lower at 51.5 against the figure of 52.6 released earlier.
Gold technical analysis
Investors are divided over the further direction in the Gold price as the upward-sloping trendline from March 24 low at $1,934.34 is supporting the downside. While the lower highs structure has not vanished yet despite a firmer recovery move.
The 50-period Exponential Moving Average (EMA) at $1,996.50 is acting as a barricade for the Gold bulls.
Meanwhile, the Relative Strength Index (RSI) (14) is oscillating in the 40.00-60.00 range, indicating a lackluster performance ahead.
Gold hourly chart
-
05:41
WTI Price Analysis: Oil bears struggle to keep the reins, $78.00 is the key
- WTI crude oil remains pressured at the lowest levels in 13 days, prints four-day downtrend.
- 100-EMA, one-month-old ascending support line challenge energy bears.
- Looming bear cross on MACD, RSI retreat keeps Oil sellers hopeful.
- Oil price uptrend remains elusive below $83.30-40 resistance zone.
WTI crude oil renews a two-week low to around $78.30 as it drops for the fourth consecutive day heading into Thursday’s European session. In doing so, the energy benchmark prods the 100-day Exponential Moving Average (EMA) while also approaching an upward-sloping support line from March 20.
That said, the quote’s U-turn from $83.40, as well as a downward-sloping of the previous resistance line from early December 2022, keeps the Oil bears hopeful. Adding strength to the downside bias is the impending bear cross on the MACD and RSI (14) retreat.
Even so, the black gold needs to provide a clear downside break of the 100-day EMA and the one-month-old ascending trend line, respectively near $78.40 and $78.00, to convince the bears.
Following that, February’s low of $72.50 will gain the market’s attention, a break of which could recall the $70.00 psychological magnet to the chart.
On the flip side, the $80.00 round figure restricts the immediate upside of the Oil prices ahead of a downward-sloping-resistance line from the last December, near $81.50.
Following that, the WTI crude oil can change a horizontal area surrounding $83.30-40 that holds the key for the buyer’s conviction.
WTI: Daily chart
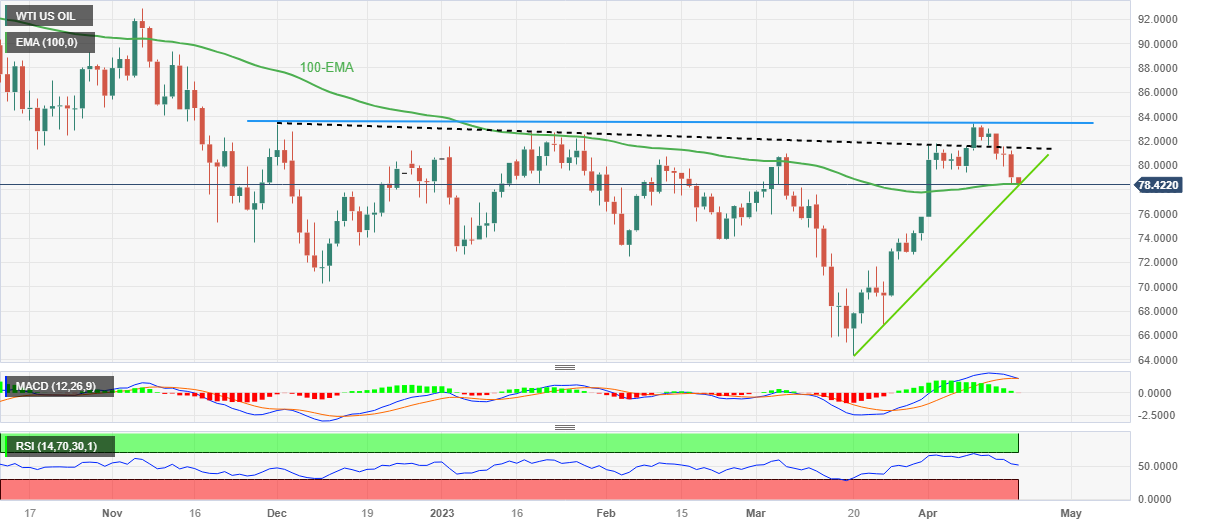
Trend: Further upside expected
-
05:31
Netherlands, The Unemployment Rate s.a (3M): 3.5% (March)
-
05:31
Japan Tertiary Industry Index (MoM) above forecasts (-0.2%) in February: Actual (0.7%)
-
05:30
Netherlands, The Consumer Confidence Adj climbed from previous -39 to -37 in April
-
05:16
EUR/USD hovers around mid-1.0900s as yields retreat, ECB clues, Eurozone Consumer Confidence eyed
- EUR/USD portrays bullish consolidation ahead of key data/events, sidelined of late.
- US Dollar, yields seek fresh clues to extend gains inspired by rate-hike jitters, geopolitical woes.
- Recession woes, cautious ECB talks highlight Eurozone Consumer Confidence for April, ECB clues.
- Risk catalysts, interest rate futures are the key for clear directions.
EUR/USD grinds higher as it consolidates the previous day’s losses around 1.0960 heading into Thursday’s European session. In doing so, the Euro pair cheers the latest retreat of the US Dollar and Treasury bond yields. However, the cautious mood ahead of the key Eurozone data/events challenges the momentum traders, especially amid sluggish markets.
EUR/USD witnessed downside pressure the previous day as the US Dollar cheered hawkish Fed bets and risk-off mood, especially driven by the comments of the Federal Reserve (Fed) officials and fears of the West versus China/Russia tussles. Also, the absence of fresh comments from the European Central Bank (ECB) officials and an unimpressive change to the bloc’s inflation data for March offered an extra burden on the Euro pair.
Among the latest policy hawks from the Fed is New York Fed President John Williams who marked support for a 0.25% interest rate hike in May while saying, “Inflation is still too high, and we will use our monetary policy tools to restore price stability.” Just before him was Chicago Federal Reserve Bank President Austan Goolsbee who highlighted credit market strength as one of the key catalysts to watch ahead of the next Fed monetary policy meeting.
That said, the market players place higher bets on the US central bank’s 0.25% rate hike in May, almost 85% at the latest, as well as reduce the probability of witnessing a rate cut in 2023.
On the other hand, the Eurozone Harmonized Index of Consumer Prices (HICP) confirmed 6.9% YoY figure for March whereas ECB policymaker Isabel Schnabel repeated her previous comments suggesting 'sticky' inflation in the bloc.
Furthermore, the UK’s allegations of China’s hidden motive to crack down on the Western infrastructure and the US House China Committee’s discussion on the Taiwan invasion scenario renew the West versus China tussle story and weigh on the sentiment. On the same line are the fears surrounding the likely drag on the US debt ceiling decision due to US President Joe Biden’s hesitance in lifting debt limits.
Amid these plays, the US Dollar Index (DXY) cheered risk-off mood, before recently making rounds to 102.00. Additionally portraying the sentiment is the S&P 500 Futures that print the first daily loss, so far, in four around 4,168, down 0.25% intraday by the press time. However, the US 10-year and two-year Treasury bond yields grind near 3.60% and 4.25% respectively after refreshing the monthly top the previous day.
Looking forward, the preliminary readings of the Eurozone Consumer Confidence for April and ECB Monetary Policy Meeting Accounts will join ECB President Christine Lagarde’s speech to entertain EUR/USD traders. On the other hand is the US Weekly Initial Jobless Claims, Philadelphia Fed Manufacturing Survey and Existing Home Sales.
Should the scheduled data/events keep highlighting the market’s rate hike fears, mainly tilting towards the Fed, the EUR/USD may return to the bear’s table.
Technical analysis
EUR/USD recovery can’t be confirmed unless witnessing a clear upside break of the 21-SMA on the four-hour chart, near 1.0965 by the press time. That said, an upward-sloping support line from late March, close to 1.0910 is a crucial challenge for the bears to tackle before taking control.
-
05:16
GBP/USD holds auction above 1.2420 amid subdued USD Index, UK Retail Sales eyed
- GBP/USD is consolidating above 1.2420, following the footprints of the USD Index.
- US firms are expected to announce mute revenue guidance due to higher rates by the Fed and tight credit conditions.
- The major driver of sticky United Kingdom inflation is the rising food prices.
The GBP/USD pair is displaying a back-and-forth action above 1.2420 in the Asian session. The Cable has turned sideways amid subdued performance by the US Dollar Index (DXY). The USD Index is struggling to find a decisive direction amid an absence of a potential trigger. However, a sheer volatility contraction in the USD Index is expected to deliver explosive moves ahead.
Market sentiment seems negative as the S&P500 futures have registered losses in the Asian session. The 500-US stock basket futures have settled on a mildly negative note in the past two trading sessions, however, a stock-specific action remained elevated due to the quarterly results season.
Investors are worried that firms are forced to squeeze their revenue guidance due to higher interest rates from the Federal Reserve (Fed). Also, declining loans and advances to consumers and businesses by United States banks after the banking turmoil are expected to put extreme pressure on the working capital requirements of firms.
On the Pound Sterling front, the synergic effect of higher Average Hourly Earnings and double-digit headline inflation would not allow the Bank of England (BoE) for consideration of pausing the policy-tightening spell. The major driver of sticky United Kingdom inflation is the rising food prices. UK’s Office for National Statistics (ONS) reported that food inflation has printed a fresh 45-year high of 19.1%.
This week, UK Retail Sales (March) data will be keenly watched. Monthly Retail Sales data is expected to contract by 0.5% vs. an acceleration of 1.2% reported in February. While annual Retail Sales would show a contraction of 3.1% against the 3.5% contraction shown earlier. A contraction in retail demand would provide some relief to the BoE policymakers.
-
04:42
USD/INR Price News: Struggles around 82.30, upside seems favored amid hawkish Fed bets
- USD/INR is facing barricades in extending its rally above 82.30.
- Investors are anticipating that Fed’s battle against stubborn US inflation will continue as it is extremely far from desired levels.
- The Indian Rupee has failed to capitalize on declining oil prices.
The USD/INR pair is struggling to surpass the immediate resistance of 82.30 in the Asian session. The major has shown a one-sided firmer rally this week in hopes that the rate-hiking cycle by the Federal Reserve (Fed) is not concluded yet. The asset would continue its four-day winning streak if it manages to sustain above Wednesday’s high at 82.30.
S&P500 futures are displaying a poor show in the Asian session. The 500-US stock basket futures have registered significant losses, discounting the impact of the late release of Netflix earnings. Entertainment stock missed revenue despite adding more subscribers and is worried about over password-sharing act. Investors are turning risk averse as major giants Goldman Sachs, Johnson & Johnson, and Netflix have failed to cheer market participants.
The US Dollar Index (DXY) is displaying a subdued performance in the Tokyo session. The USD Index is bounded in a narrow range of 101.93-102.04 amid an absence of a potential trigger. Investors are anticipating that Fed’s battle against stubborn United States inflation will continue as price pressures are extremely far from desired levels.
A Reuters poll on Fed’s interest rate guidance conveys that Fed chair Jerome Powell will deliver a final 25-basis-point interest rate increase in May and then hold rates steady for the rest of 2023.
The Fed is expected to arrest inflation sooner than previously anticipated as Fed’s Beige Book has confirmed that disbursement of loans and advances from US commercial banks to businesses and consumers have dropped due to tight conditions to maintain asset quality.
On the Indian Rupee front, investors are awaiting the release of Bank Loan Growth and FX reserves data, which will release on Friday. Meanwhile, oil prices have dropped sharply as more rate hikes from the Fed will trigger a recession ahead. The Indian Rupee has failed to capitalize on weak oil prices.
It is worth noting that India is one of the leading importers of oil in the world and lower oil prices might support the Indian Rupee.
-
04:20
RBNZ: Annualized Q1 Sectoral Factor Model Inflation softens to 5.7%
The Reserve Bank of New Zealand (RBNZ) released its Sectoral Factor Model Inflation gauge for the first quarter of 2023 this Thursday.
The gauge eased slightly to 5.7% YoY in Q1 202, compared with the 5.8% clip booked in Q4 2022.
The New Zealand Statistics (NZ Stats) released figures that showed the Consumer Price Index at 6.7%, lower than economists and the central bank had forecast.
Both measures are closely watched by the RBNZ.
FX Implications
The Kiwi dollar is hit further by the RBNZ inflation gauge. NZD/USD is falling hard to test the 0.6150 level, as of writing, losing 0.73% on the day.
About the RBNZ Sectoral Factor Model Inflation
The Reserve Bank of New Zealand has a set of models that produce core inflation estimates. The sectoral factor model estimates a measure of core inflation based on co-movements - the extent to which individual price series move together. It takes a sectoral approach, estimating core inflation based on two sets of prices: prices of tradable items, which are either imported or exposed to international competition, and prices of non-tradable items, which are those produced domestically and not facing competition from imports.
-
04:08
USTR Tai: US trade restrictions on China are narrowly targeted
United States Trade Representative (USTR) Katherine Tai said on Thursday, US trade restrictions on China are narrowly targeted.
“We have seen supply chain fragility,” Tai added.
Market reaction
AUD/USD is unimpressed by the US-China comments, keeping its range at around 0.6700, down 0.20% on the day.
-
04:03
USD/CHF Price Analysis: Retreats from 50-EMA towards 0.8955 horizontal support
- USD/CHF takes offers to extend the previous day’s pullback from one-week high.
- Multiple levels marked since previous Wednesday restrict immediate downside of Swiss Franc pair.
- Buyers have bumpy road to travel before taking control, 0.9040 is the key hurdle.
USD/CHF holds lower ground near the intraday bottom of near 0.8965 as it keeps the previous day’s U-turn from a one-week high during early Thursday. In doing so, the Swiss Franc (CHF) pair defends the U-turn from the 50-bar Exponential Moving Average (EMA).
Given the recently diminishing strength of the bullish MACD signals, as well as the quote’s repeated failures to cross the 50-EMA hurdle, the USD/CHF price is likely to decline further.
However, one-week-old horizontal support around 0.8955 restricts the immediate downside of the pair.
Following that, 0.8920 and the 0.8900 round figure may prod the USD/CHF bears before directing them to the multi-month low of around 0.8860 marked in the last week.
Should the quote remains bearish past 0.8860, it becomes vulnerable to visiting the 2021 bottom surrounding 0.8755. Though, the 0.8800 threshold may act as a buffer during the likely fall.
Meanwhile, an upside break of the 50-EMA hurdle of 0.8987 isn’t a blockbuster ticket for the USD/CHF buyers as a 13-day-old descending trend line and a downward-sloping trend line from early March, respectively near 0.8995 and 0.9030, could challenge the upside moves.
Even if the quote rises past 0.9030, the 100-SMA acts as the last defense of the USD/CHF bears before welcoming the bulls with open hands.
USD/CHF: Four-hour chart
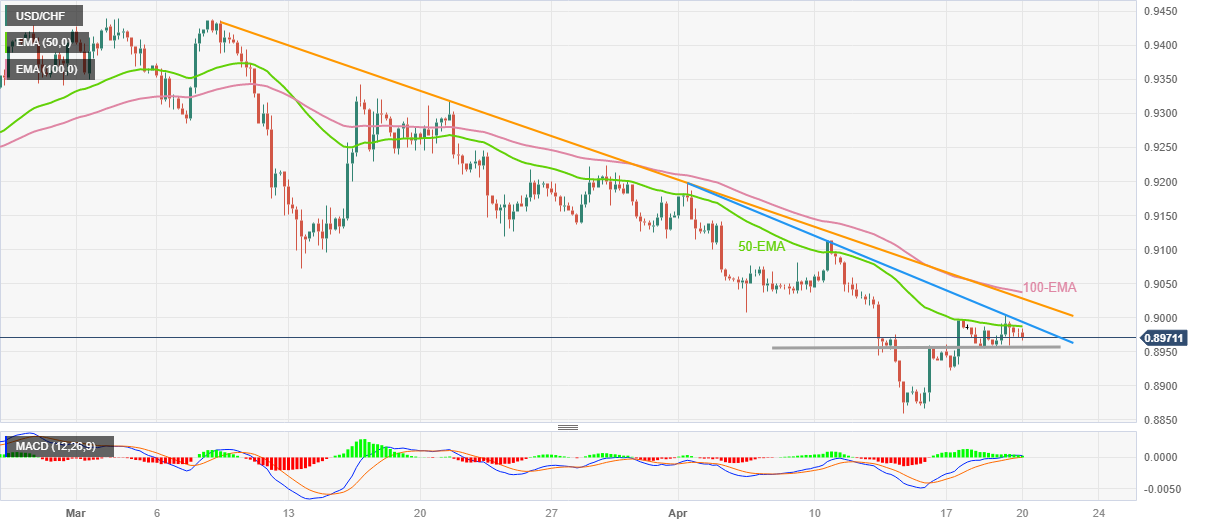
Trend: Further downside expected
-
03:44
Silver Price Forecast: XAG/USD drops towards $25.00 as supply concerns ease amid risk aversion
- Silver price snaps two-day winning streak, renews intraday low of late.
- The Silver Institute reports the record supply deficit amid new peak of global XAG/USD demand in 2022.
- Inflation, rate hike fears join geopolitical concerns to prod the Silver price.
Silver price (XAG/USD) drops to $25.20 while refreshing intraday low during early Thursday. In doing so, the bright metal prints the first daily loss in three as fears of supply crunch recede amid a risk-off mood.
On Wednesday, Reuters quoted the Silver Institute’s yearly outlook report to mention that the global demand for Silver rose by 18% last year to a record high of 1.24 billion ounces, creating a huge supply deficit. The report also adds, “The Silver market was undersupplied by 237.7 million ounces in 2022, the institute said in its latest World Silver Survey, calling this ‘possibly the most significant deficit on record’,” per the news.
On the other hand, higher inflation clues from the UK, Eurozone and the US join hawkish comments from the central bank officials of the Bank of England (BoE), European Central Bank (ECB) and the Federal Reserve (Fed) to propel odds of rate hikes and weigh on sentiment. Among the latest policy hawks from the Fed is New York Fed President John Williams who marked support for a 0.25% interest rate hike in May while saying, “Inflation is still too high, and we will use our monetary policy tools to restore price stability.” Just before him was Chicago Federal Reserve Bank President Austan Goolsbee who highlighted credit market strength as one of the key catalysts to watch ahead of the next Fed monetary policy meeting.
With this, the market players place higher bets on the central bank’s 0.25% rate hike in May almost 85% at the latest, as well as reduce the probability of witnessing a rate cut in 2023.
It should be noted that the UK’s allegations of China’s hidden motive to crack down on the Western infrastructure and the US House China Committee’s discussion on the Taiwan invasion scenario renew the West versus China tussle story and weigh on the sentiment. On the same line are the fears surrounding the likely drag on the US debt ceiling decision due to US President Joe Biden’s hesitance in lifting debt limits.
Furthermore, Reuters came out with the news suggesting that US consumers are starting to fall behind on their credit card and loan payments as the economy softens, which in turn also challenges the XAG/USD prices.
Against this backdrop, S&P 500 Futures print the first daily loss, so far, in four around 4,168, down 0.25% intraday by the press time. However, the US 10-year and two-year Treasury bond yields grind near 3.60% and 4.25% respectively after refreshing the monthly top the previous day. It should be noted that the US Dollar Index (DXY) seesaws around 102.00 after reversing the bearish bias the previous day.
Looking ahead, the recent emphasis on qualitative headlines highlights them as the key risk barometer. That said, the US Weekly Initial Jobless Claims, Philadelphia Fed Manufacturing Survey and Existing Home Sales are on the calendar to watch for fresh impulse
Technical analysis
A clear downside break of a three-week-old ascending trend line, now immediate resistance around $25.80, keeps the Silver price on the bear’s radar.
-
03:30
Commodities. Daily history for Wednesday, April 19, 2023
Raw materials Closed Change, % Silver 25.287 0.38 Gold 1995.01 -0.51 Palladium 1608.69 -0.51 -
03:21
Natural Gas Price Analysis: XNG/USD stays bearish below $2.40 key level
- Natural Gas licks its wounds after posting the biggest daily loss in a month.
- Downside break of 200-SMA, three-week-old ascending trend line joins bearish MACD signals to favor XNG/USD sellers.
- Buyers need validation from six-week-old descending resistance line to retake control.
Natural Gas (XNG/USD) consolidates the heaviest daily fall in five weeks, marked the previous day, around $2.38 during early Thursday.
Even so, the energy asset remains well below the key support confluence, now resistance, and keeps the XNG/USD bears hopeful. Adding strength to the downside bias are the bearish MACD signals, as well as the quote’s U-turn from a six-week-old descending resistance line.
That said, the Natural Gas price is currently declining towards the early-month swing high of around $2.36, a break of which will open doors for the XNG/USD’s fall towards the multiple support zone surrounding $2.30-28.
Following that, $2.15 and the monthly low of $2.11 should act as the final defenses for the XNG/USD buyers before directing the Natural Gas price towards the $2.00 psychological magnet.
On the flip side, the aforementioned support-turned-resistance guards immediate XNG/USD recovery around $2.40.
However, a five-week-old horizontal resistance area near $2.48 and the downward-sloping trend line from early March, near $2.53 at the latest, appear tough nuts to crack for the Natural Gas buyers before retaking control.
Following that, an upward trajectory toward the mid-March high of around $2.75 can’t be ruled out.
Natural Gas Price: Four-hour chart
Trend: Further downside expected
-
03:01
USD/CNH climbs above 6.9000 as PBoC keeps LPR unchanged
- USD/CNH has surpassed the crucial resistance of 6.9000 as PBoC has kept the interest rate policy stable.
- There was no urgency for the PBoC to ease policy further as the Chinese economy is well on track for economic recovery.
- The Fed is expected to raise rates by 25bps and may hold rates steady for 2023.
The USD/CNH pair has extended its recovery above the critical resistance of 6.9000 as the People’s Bank of China (PBoC) has kept its interest rate policy unchanged. China’s central bank has kept its one-year and five-year Loan Prime Rate (LPR) stable at 3.65% and 4.30% respectively. The maintenance of a status quo by the PBoC was highly expected by the market participants.
Considering the fact that the Chinese economy is well on track for economic recovery after a prolonged lockdown period, there was no urgency of easing monetary policy further. This week, the Gross Domestic Product (GDP) released for the first quarter remained critically upbeat. In the first quarter, China’s growth rate remained in line with estimates at 2.2%. On an annual basis, the growth rate jumped by 4.5% vs. consensus of 4.0% and the former release of 2.9%.
Meanwhile, the US Dollar Index (DXY) is inside the woods amid an absence of a potential trigger this week. The USD Index is oscillating in a narrow range of 101.90-102.00 despite rising bets for one more interest rate hike from the Federal Reserve (Fed).
A Reuters poll on Fed’s interest rate guidance conveys that Fed chair Jerome Powell will deliver a final 25-basis-point interest rate increase in May and then hold rates steady for the rest of 2023. The survey also supports a short and shallow recession this year. Earlier, Citigroup also pushed its expectations for the United States recession to the fourth quarter from prior anticipation of the third quarter, citing solid performance in the economy.
-
02:58
S&P 500 Futures portray market’s inflation, rate hike fears even as yields dribble
- Risk appetite remains downbeat as traders fear higher rates for longer.
- Geopolitical concerns surrounding China, Russia also weigh on sentiment.
- S&P 500 Futures snap three-day winning streak, yields grind near monthly high.
- Second-tier US data eyed for immediate directions, PMIs, Fed talks are the key.
Market sentiment remains fragile as fears of interest rate hikes, as well as geopolitical tension, regain attention amid higher inflation clues. Adding strength to the risk-off mood could be the hawkish central bank comments and the fears of aggravated tension between the West and China.
While portraying the sentiment, S&P 500 Futures print the first daily loss, so far, in four around 4,168, down 0.25% intraday by the press time. However, the US 10-year and two-year Treasury bond yields grind near 3.60% and 4.25% respectively after refreshing the monthly top the previous day.
A notable jump in the inflation numbers at the key global economies joined the hawkish comments from the top-tier central bank officials renewed fears of higher rates and recession. Adding strength to the risk aversion could be the war fears emanating from China and Russia.
In the last few days, the UK, Eurozone and the US have all been flashing upbeat signals for inflation while the central bank officials from the Bank of England (BoE), European Central Bank (ECB) and the Federal Reserve (Fed) are all favoring higher rates for longer. The same raises the fears of economic slowdown especially when the ex-inflation numbers haven’t been too impressive and the Russia-Ukraine war takes a toll on the global economy.
Among the latest policy hawks from the Fed is New York Fed President John Williams who marked support for a 0.25% interest rate hike in May while saying, “Inflation is still too high, and we will use our monetary policy tools to restore price stability.” Just before him was Chicago Federal Reserve Bank President Austan Goolsbee who highlighted credit market strength as one of the key catalysts to watch ahead of the next Fed monetary policy meeting.
Previously, St. Louis Federal Reserve President James Bullard, Richmond Fed President Thomas Barkin and Atlanta Fed President Raphael W. Bostic were the Fed speakers who rekindled the “higher for longer” scenario for rates and favored the US Dollar, as well as yields.
With this in mind, the market players place higher bets on the central bank’s 0.25% rate hike in May remain high, as well as reduce the probability of witnessing a rate cut in 2023.
On a different page, the UK warned that Russian hackers targeting Western critical infrastructure while the US House China Committee discussed the Taiwan invasion scenario. Furthermore, the likely drag on the US debt ceiling decision is due to US President Joe Biden’s hesitance in lifting debt limits. Additionally, Bloomberg released news suggesting China’s role in the Russia-Ukraine war, which in turn adds strength to the risk-off mood.
Given the recent emphasis on the qualitative headlines as the key risk barometer, today’s second-tier US data may not be as important as they seem unless surprising traders. That said, the US Weekly Initial Jobless Claims, Philadelphia Fed Manufacturing Survey and Existing Home Sales are on the calendar to watch for fresh impulse
Als oread: Forex Today: Dollar rises modestly amid range-bound markets
-
02:45
USD/JPY Price Analysis: Bulls move in to test bears near 135.00
- USD/JPY bulls are in the market eyeing a test of 135.00.
- The weekly and lower time frames offer compelling technical features on the charts.
USD/JPY is testing resistance and staying on the bid in Tokyo at 134.85, up from a low of 134.59 having printed a high of 134.97.
The following illustrates the meanwhile upside bias vs a longer-term downside bias.
USD/JPY technical analysis
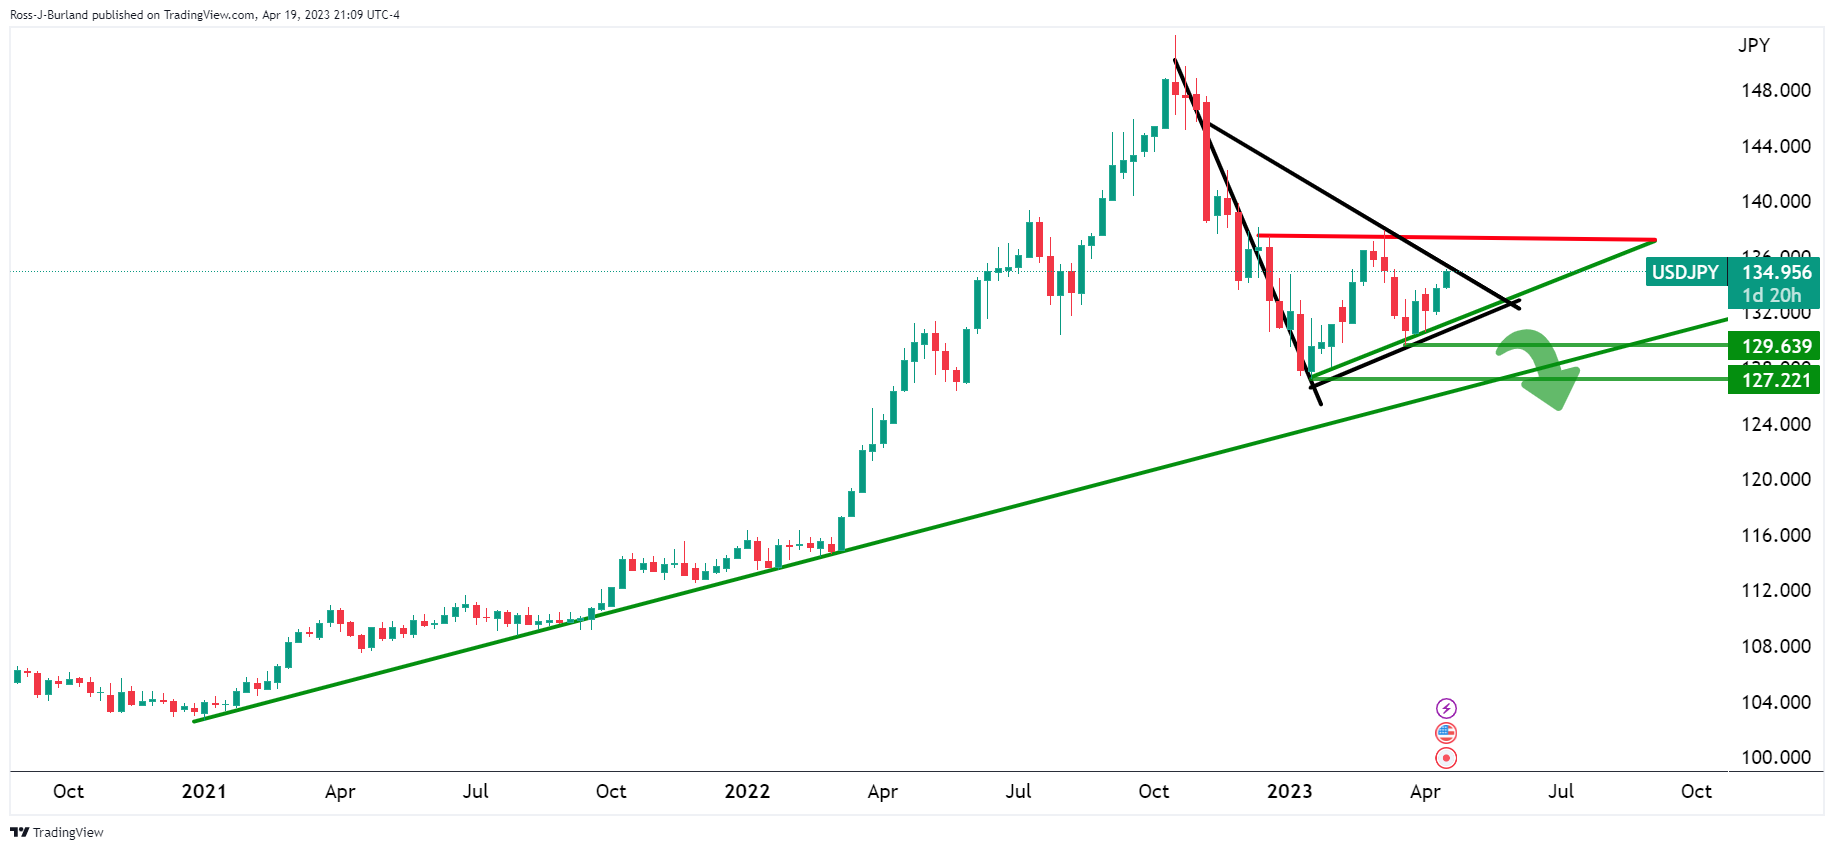
The bearish pennant and bearish ascending triangle are compelling themes on the weekly charts.
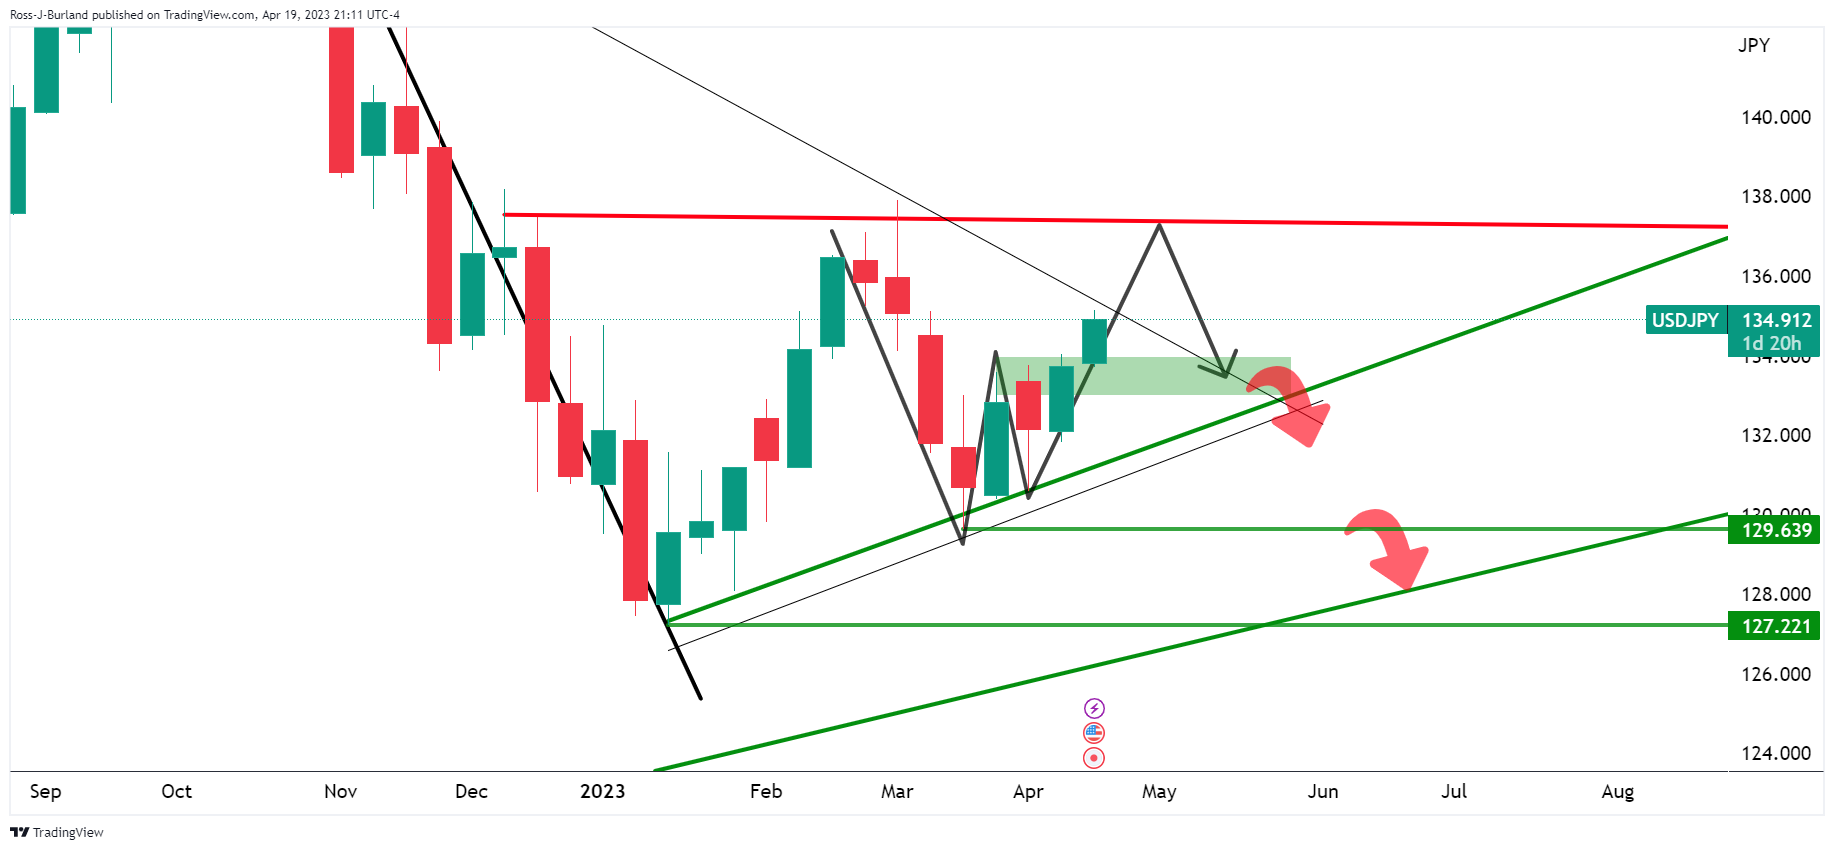
Zooming in, we can see a W-formation is taking shape and there are prospects of a move higher still before a move into the support area and neckline of the pattern.
USD/JPY H4 charts
The bullish scenario, above, sees the prospects of a break of the micro trendline and a move to test the low 134s before the bulls engage again for the push higher, as per the weekly W-formation´s outlook. The bearish scenario, below, highlights the chances of a breakdown into the broader trendline support.
-
02:33
Australia National Australia Bank's Business Confidence (QoQ) registered at -4, below expectations (2) in 1Q
-
02:33
AUD/USD stays below 0.6720 support as softer Aussie data supersedes unimpressive moves of RBA’s Lowe, PBOC
- AUD/USD takes offers to refresh intraday low, printing minor losses during two-day downtrend.
- RBA’s Lowe fails to inspire markets from central bank review, PBOC holds benchmark rate at 3.65% as expected.
- Australia’s NAB Business Confidence for Q1 plummets to -4 versus -1 prior.
- Market sentiment remains fragile amid rate hikes, geopolitical fears and weigh on Aussie pair.
AUD/USD holds lower grounds as sellers attack the 0.6700 round figure early Thursday, after breaking short-term key support the previous day. In doing so, the Aussie pair takes clues from downbeat Australian data and justifies the market’s risk-off mood while paying a little heed to the latest action from the People’s Bank of China and Reserve Bank of Australia (RBA) Governor Philip Lowe.
National Australia Bank’s (NAB) Business Confidence for the first quarter (Q1) of 2023 came in at -4 versus 2 expected and -1 prior.
Before that, the PBOC matched market forecasts of holding one-year and five-year Loan Prime Rates (LPRs) unchanged at 3.65% and 4.30% in that order.
It’s worth noting that Australian Treasurer Jim Chalmers and RBA Governor Lowe offered a fresh review of the RBA and signaled fewer numbers of meetings while allowing the Aussie central bank to ignore Treasury’s decision. The moves failed to trigger any major market reaction as traders are more interested in inflation and geopolitical headlines amid the broad risk-off mood.
While portraying the sentiment, S&P 500 Futures snap three-day winning streak at around 4,168 whereas the US 10-year and two-year bond coupons grind higher after refreshing the monthly top the previous day.
Moving on, the US Weekly Initial Jobless Claims, Philadelphia Fed Manufacturing Survey and Existing Home Sales will be important to watch for fresh impulse. However, major attention will be given to the risk catalysts for a clear guide.
Technical analysis
A clear downside break of an eight-day-old support line, now immediate resistance near 0.6720, keeps AUD/USD bears hopeful.
-
02:22
EUR/USD eyes losses below 1.0950 as street looks confident for US economic prospects
- EUR/USD is making efforts for defending its 1.0950 support as USD Index has shown recovery.
- Loans and advances to US businesses and consumers have dropped due to tight credit conditions by US banks.
- Citi Group is expecting a recession in the US economy in the fourth quarter.
The EUR/USD pair is expected to deliver a sheer downside below the immediate support of 1.0950 in the Asian session. The major currency pair is attracting offers as the US Dollar Index (DXY) has shown a recovery move and has scaled above the 102.00 resistance.
S&P500 futures have extended their downside in the Asian session in hopes that more rates from the Federal Reserve (Fed) could spoil revenue guidance.
The minutes from Federal Reserve’s (Fed) Beige Book indicate a steady performance in economic activities in the majority of districts. However, loans and advances to businesses and consumers have dropped due to tight credit conditions nominated by United States commercial banks to dodge uncertainty in a turbulent environment.
Meanwhile, Fed policymakers are still confident about economic prospects due to the tight labor market. St. Louis Fed President James Bullard advocated for the continuation of the policy-tightening spell by the central bank considering the fact that labor market data is still solid, as reported by Reuters. Fed policymaker further added that demand for labor has not softened yet and a strong labor market leads to strong consumption.
Considering the tight US labor market, Citi Group is expecting a recession in the US economy in the fourth quarter. Earlier, it anticipated that the US will declare recession in the third quarter of 2023.
On the Eurozone front, investors are awaiting the release of the Consumer Confidence data. Preliminary Consumer Confidence (April) data is expected to improve to -18.5 from the former release of -19.2. The reason could be consistently declining Eurozone inflation, which is receding the burden from households.
-
02:20
USD/CNY fix: 6.8987 vs. the previous fix of 6.8731
In recent trade today, the People’s Bank of China (PBOC) set the yuan at 6.8987 vs. the previous fix of 6.8731 and the prior close of 6.8851.
About the fix
China maintains strict control of the yuan’s rate on the mainland.
The onshore yuan (CNY) differs from the offshore one (CNH) in trading restrictions, this last one is not as tightly controlled.
Each morning, the People’s Bank of China (PBOC) sets a so-called daily midpoint fix, based on the yuan’s previous day's closing level and quotations taken from the inter-bank dealer.
-
02:18
China 1&5 year rates unchanged as expected
The PBoC Interest Rate Decision announced by the People´s Bank of China has come out as unchanged as follows:
- 1 and 5-year rates left unchanged, as widely expected.
- 3.65% for the one year.
- 4.30% for the five year.
If the PBoC is hawkish about the inflationary outlook of the economy and rises the interest rates it is positive, or bullish, for the CNY. Likewise, if the PBoC has a dovish view on the Chinese economy and keeps the ongoing interest rate, or cuts the interest rate it is negative, or bearish.
About the PBoC Interest Rate Decision
The PBoC Interest Rate Decision is announced by the People´s Bank of China. If the PBoC is hawkish about the inflationary outlook of the economy and rises the interest rates it is positive, or bullish, for the CNY. Likewise, if the PBoC has a dovish view on the Chinese economy and keeps the ongoing interest rate, or cuts the interest rate it is negative, or bearish.
-
02:16
China PBoC Interest Rate Decision meets expectations (3.65%)
-
02:11
NZD/USD Price Analysis: Defends NZ Inflation inflicted support break with eyes on 0.6140
- NZD/USD remains pressured around five-week low, keeps NZ inflation-induced fall.
- New Zealand Q1 CPI eases to the lowest level in two years with 6.7% QoQ figures.
- Downside break of one-month-old horizontal support, bearish MACD signals also keep Kiwi pair sellers hopeful.
- Any recovery remains elusive below 200-SMA, 0.6170 guards immediate upside.
NZD/USD bears keep the reins at the lowest levels in five weeks while defending New Zealand (NZ) inflation-inflicted losses around 0.6160 during the mid-Asian session on Thursday. With this, the Kiwi pair not only justifies the downbeat NZ inflation but also the recent break of one-month-old horizontal support, now immediate resistance, as well as the bearish MACD signals.
New Zealand’s (NZ) first quarter (Q1) inflation, per the Consumer Price Index (CPI), poured cold water on the face of the policy hawks at the Reserve Bank of New Zealand (RBNZ) by offering a negative surprise. That said, the NZ CPI drops to 1.2% QoQ versus the expected 1.7% and 1.4% prior.
Following the data disappointment, the Kiwi pair broke one-month-old horizontal support, now adjacent hurdle around 0.6170, which in turn joins the bearish MACD signals to direct NZD/USD bears towards a 1.5-month-old horizontal support zone near 0.6140.
Should the NZD/USD bears remain dominant past 0.6140, the odds of witnessing a fresh 2023 low, currently around 0.6085, can’t be ruled out.
Meanwhile, recovery moves can’t be appreciated on an uptick beyond the 0.6170 support-turned-resistance as the 200-SMA hurdle of 0.6220 becomes crucial for NZD/USD buyer’s return.
In a case where the NZD/USD pair remains firmer past 0.6220, the quote’s run-up towards the previous weekly high of around 0.6315 and then to the monthly peak of 0.6386 can’t be ruled out.
NZD/USD: Four-hour chart
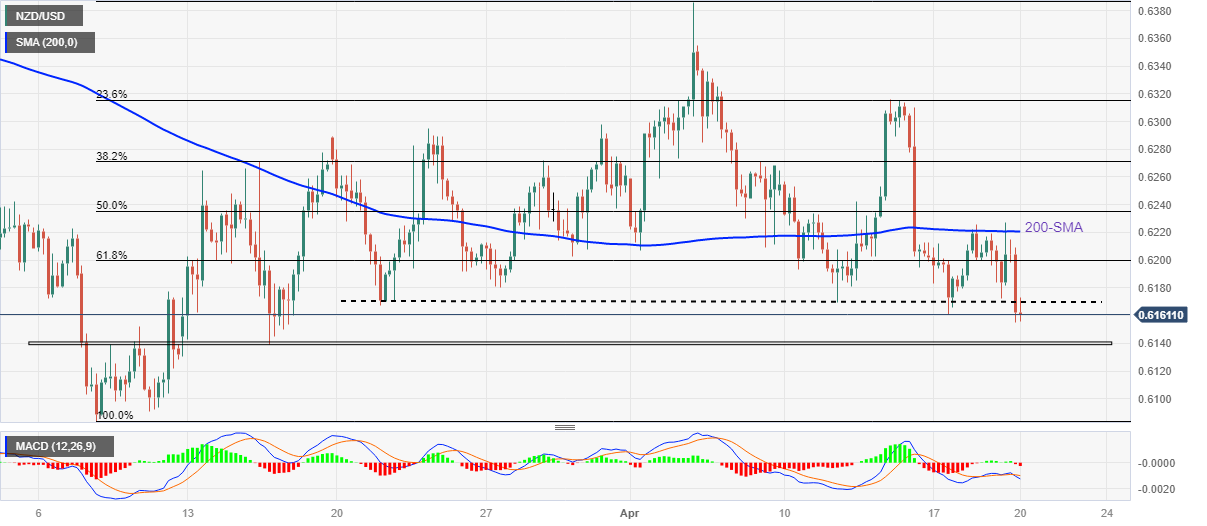
Trend: Further downside expected
-
01:52
RBA´s Lowe: RBA review will assist the central bank in dealing with a complex world
Comments are seeping through from the Reserve Bank of Australia´s governor Philip Lowe.
He states that the RBA review will assist the central bank in dealing with a complex world and that the RBA board will think about meeting frequency and communication.
The Reserve Bank of Australia says that it welcomes independent review recommendations and the review panel’s support for the current monetary policy framework.
´´The independent review of the Reserve Bank of Australia (RBA) has recommended creating a specialist board to manage monetary policy that would be chaired by the governor and have a dual mandate of price stability and full employment,´´ Reuters reported.
Key notes
´´The central bank should keep its flexible inflation target of 2-3% but aim to return inflation to the mid-point rather than average it over time. Importantly for market confidence, the RBA's Monetary Policy Board (MPB) would retain its independence from government control.´´
´´Treasurer Jim Chalmers has indicated in-principle agreement to all 51 of the recommendations made by the review which he set up last July with an eye to making the RBA "fit for the future".The review recommended the RBA's current single board be split into one for monetary policy and one for governance with an external chair that would oversee operations such as human resources, finance, risk management, and technology.´´
´´The MPB would comprise the governor and deputy governor of the RBA, the Treasury Secretary and six external members with the expertise of open-economy macroeconomics, the financial system, labor markets and the supply side of the economy.´´
´´The review recommended the MPB meet eight times a year, instead of the current 11 meetings, and an unattributable record of voting should be published in the post-meeting statement and minutes should include points of disagreement. External members would be appointed for a term of five years, with the possibility of reappointment for up to one year.´´
´´Members should be expected to discuss the Board's decisions in public from time to time, and statements released after policy meetings should be agreed by them and published in their name, the review said. The review said the RBA should better explain its policy choices through regular press conferences and increase the amount of information available about deliberations, strategy, and its forecasts.´´
´´MPB members should be more accountable for their role in setting monetary policy, the review said. The review recommended the government should legislate the changes to commence from July 1, 2024.´´
-
01:51
GBP/JPY rebounds from 167.50 as bulky UK Inflation supports hawkish BoE bets
- GBP/JPY has shown a recovery move from 167.36 as stubborn UK Inflation supports more rate hikes from the BoE.
- UK’s inflation has remained highest among G7 nations led by a shortage of labor, and energy shock.
- The BoJ is buying government debt as part of expansionary monetary policy.
The GBP/JPY pair has rebounded after printing a day’s low of 167.36 in the Asian session. The cross has shown a recovery as fears associated with the bulky United Kingdom inflation report are getting traction again. The Pound Sterling drove the cross dramatically higher on Wednesday after the release of the UK Consumer Price Index (CPI) confirmed that the rate-hiking spell by the Bank of England (BoE) would continue further.
The release of the UK inflation showed that headline CPI has trimmed marginally to 10.1% from the prior release of 10.4% led by a decline in energy prices used for heating and electricity. However, investors are not satisfied with the decline in the inflationary pressures as the figure failed to ditch the double-digit territory again. Meanwhile, food price inflation has soared to a fresh 45-year high at 19.1%.
UK’s inflation has remained highest against other Group of Seven (G7) nations led by a shortage of labor due to the Brexit event and election of an early-retirement plan, and energy shock. The International Monetary Fund (IMF) has forecasted UK Inflation at an average of 6.8% for 2023, the highest among major advanced economies.
Analysts at Standard Chartered see the Bank of England raising the key interest rate by 25 basis points in May. They further added, “Beyond May, we see the potential for additional hikes, but we think the MPC will take a meeting-by-meeting approach and decisions will be heavily dependent on how economic data evolve month-to-month.”
On the Japanese Yen front, to augment the expansion of stimulus in the economy, novel Bank of Japan (BoJ) Governor Kazuo Ueda said in the Japanese parliament on Tuesday, “The BoJ is buying government debt as part of monetary policy.” He further added the intention of bond purchase is not of monetizing government debt.
-
01:49
Gold Price Forecast: XAU/USD struggles even as geopolitical, inflation fears propel US Dollar, yields
- Gold price fades upside momentum within one-month-old bullish channel, pares losses of late.
- Geopolitical concerns about China, Russia weigh on XAU/USD price.
- Inflation woes propel United States Treasury bond yields, US Dollar and provide headwind to Gold Price.
- Central bankers, risk catalysts eyed for fresh impetus ahead of Friday’s Purchasing Managers Indexes.
Gold price (XAU/USD) remains on the way to a consecutive second weekly loss despite being inactive at around $2,000 of late, licking its wounds near $1,995 amid early Thursday. In doing so, the bullion price bears the burden of the market’s pessimism, as well as the firmer US Dollar and Treasury bond yields. However, a light calendar in the United States and a cautious mood seem to restrict the XAU/USD’s downside of late.
Gold price drops on geopolitical, inflation fears
Gold price braces for the second consecutive weekly fall amid fresh geopolitical and inflation concerns. That said, chatters about China and Russia gain major attention when it comes to war fears while the latest data from major economies and comments from the central bankers renew inflation, as well as recession fears of late.
A notable jump in the inflation numbers at the key global economies joined the hawkish comments from the top-tier central bank officials renewed fears of higher rates and recession, which in turn renewed the US Dollar’s haven demand on Wednesday. Adding strength to the risk aversion could be the war fears emanating from China and Russia.
In the last few days, the UK, Eurozone and the US have all been flashing upbeat signals for inflation while the central bank officials from the Bank of England (BoE), European Central Bank (ECB) and the Federal Reserve (Fed) are all favoring higher rates for longer. The same raises the fears of economic slowdown especially when the ex-inflation numbers haven’t been too impressive and the Russia-Ukraine war takes a toll on the global economy.
Recently, New York Fed President John Williams marked support for a 0.25% interest rate hike in May while saying, “Inflation is still too high, and we will use our monetary policy tools to restore price stability.” Just before him was Chicago Federal Reserve Bank President Austan Goolsbee who highlighted credit market strength as one of the key catalysts to watch ahead of the next Fed monetary policy meeting.
Previously, St. Louis Federal Reserve President James Bullard, Richmond Fed President Thomas Barkin and Atlanta Fed President Raphael W. Bostic were the Fed speakers who rekindled the “higher for longer” scenario for rates and favored the US Dollar, as well as yields.
It should be noted that the recently firmer US data and hawkish Fed talks favor the market’s bets on the central bank’s 0.25% rate hike in May, as well as reduce the probability of witnessing a rate cut in 2023. The same joins the inflation and rate hike fears from the other major central banks to propel the US Dollar’s haven demand, which in turn exert downside pressure on the Gold price.
Talking about geopolitical fears, the UK warned that Russian hackers targeting Western critical infrastructure while the US House China Committee discussed the Taiwan invasion scenario. Furthermore, the likely drag on the US debt ceiling decision is due to US President Joe Biden’s hesitance in lifting debt limits. Additionally, Bloomberg released news suggesting China’s role in the Russia-Ukraine war, which in turn adds strength to the risk-off mood.
Apart from what’s already mentioned above, Reuters came out with the news suggesting that US consumers are starting to fall behind on their credit card and loan payments as the economy softens, which in turn also challenges the XAU/USD bulls.
On the contrary, China’s National Development and Reform Commission (NDRC), the state planner, said on Wednesday, the country is formulating plans to boost the recovery and expansion of consumption. The same join the market’s indecision amid a light calendar and puts a floor under the Gold price.
Hence, multiple challenges to the sentiment and the Gold price keep the XAU/USD bears hopeful.
United States Treasury bond yields, US Dollar recovery weigh on XAU/USD
With the multiple negatives to the risk profile, mentioned above, the market players rush toward selling the United States Treasury bonds, which in turn propel the yields and the US Dollar, as well as provide a headwind to the Gold price. That said, the US 10-year and two-year Treasury bond yields refreshed monthly high the previous day before retreating to 3.60% and 4.26% at the latest. Even so, the US Dollar Index (DXY) grinds higher around 102.00 at the latest.
Qualitative factors are the key for intraday Gold traders to watch
Although a slew of catalysts keeps weighing on the Gold price, the XAU/USD floats higher of late amid a light calendar in the United States, which in turn highlights the risk catalysts. Even so, the Weekly Initial Jobless Claims, Philadelphia Fed Manufacturing Survey and Existing Home Sales will be important to watch for fresh impulse.
Gold price technical analysis
Gold price bounces off the bottom line of a one-month-old ascending trend channel while defending the previous week’s retreat from the Year-To-Date (YTD) high.
Adding strength to the downside bias is the XAU/USD bear’s repeated attack on the 21-DMA, as well as bearish signals from the Moving Average Convergence and Divergence (MACD) indicators.
It’s worth noting that the Relative Strength Index (RSI) line, placed at 14, retreats from the overbought territory and drops towards the normal level of 50, which in turn challenges the Gold sellers.
Hence, the Gold price needs to break the $1,971 immediate support to convince intraday sellers. Even so, February’s high of around $1,960 and the 50-DMA level of near $1,914 can challenge the XAU/USD bears.
Above all, an upward-sloping trend line from November 2022, close to $1,873, acts as the last defense of the Gold buyers.
On the flip side, recovery moves need to sustain the $2,000 breakout on a daily closing basis before approaching the latest peak of $2,048. However, the stated channel’s top line, around $2,051, can check the Gold buyers before directing them toward the previous yearly high of $2,070, as well as the record high marked in 2020 of around $2,075.
Overall, XAU/USD teases sellers but the downside bias remains elusive.
Gold price: Daily chart
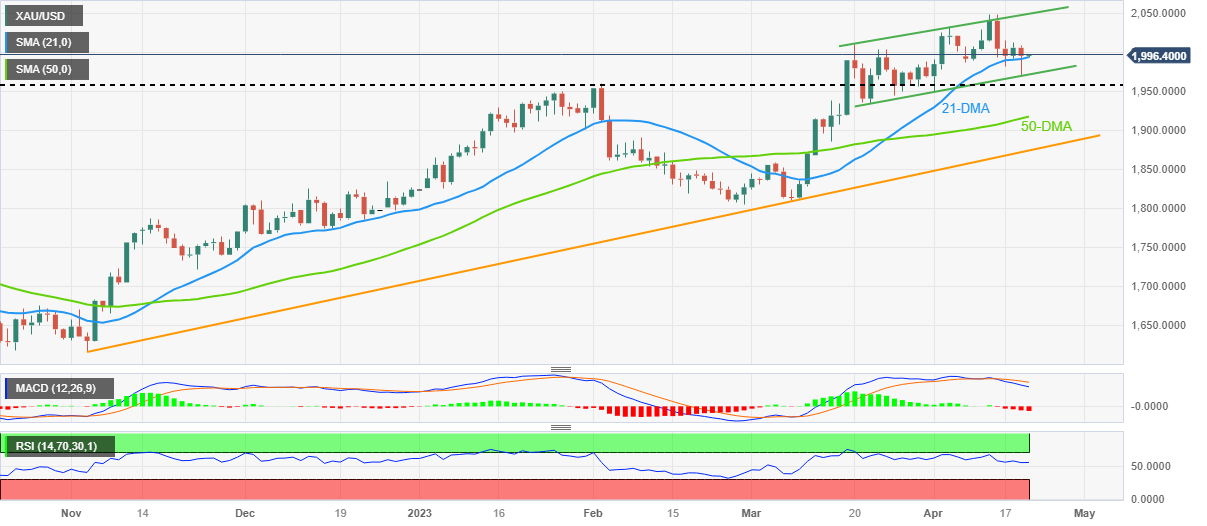
Trend: Limited downside expected
-
01:30
Stocks. Daily history for Wednesday, April 19, 2023
Index Change, points Closed Change, % NIKKEI 225 -52.07 28606.76 -0.18 Hang Seng -282.75 20367.76 -1.37 KOSPI 3.99 2575.08 0.16 ASX 200 5.3 7365.5 0.07 FTSE 100 -10.63 7898.77 -0.13 DAX 12.53 15895.2 0.08 CAC 40 15.81 7549.44 0.21 Dow Jones -79.62 33897.01 -0.23 S&P 500 -0.35 4154.52 -0.01 NASDAQ Composite 3.82 12157.23 0.03 -
01:22
Fed to deliver 25-basis-point hike in May, stay on hold rest of year – Reuters poll
“The US Federal Reserve (Fed) will deliver a final 25-basis-point interest rate increase in May and then hold rates steady for the rest of 2023,” per the latest Reuters poll of 105 economists published early Thursday in Asia. The survey details also showed a short and shallow recession this year was likely.
Additional findings
Nearly 90% - 94 of 105 - of the economists predicted the U.S. central bank would hike its key policy rate by 25 basis points to the 5.00%-5.25% range at a May 2-3 meeting, in line with market pricing.
59 of 100 economists expected the Fed to keep its policy rate unchanged through at least this year.
Only 26 respondents with an end-2023 view forecast a cut, similar to market expectations.
Thirty-seven of 47 respondents to an additional question said there would be a U.S. recession in 2023, of which 31 said it would be short and shallow.
Four said it would be long and shallow and two characterized it as deep.
The poll found a median 70% probability of a U.S. recession in the coming two years - a slight upgrade from the 65% last month, and forecast growth of only 1.1% and 0.8% this year and in 2024, respectively.
EUR/USD struggles for clear directions
As the latest polls fail to provide any fresh insights than widely discussed in the markets, the EUR/USD pair remains sidelined around 1.0950 after falling the previous day.
Also read: EUR/USD Price Analysis: Bears flex muscles but 1.0910 is the key support
-
01:22
EUR/GBP climbs confidently above 0.8800 as UK inflation cements more rate hikes from BoE
- EUR/GBP has crossed 0.8800 after a gradual recovery, however, the downside bias has not faded yet.
- The double-digit UK inflation has cemented the need for one more rate hike from the BoE.
- The street is anticipating that ECB Lagarde will slow down the pace of the rate hike to 25 bps.
The EUR/GBP pair has scaled above the round-level resistance of 0.8800 firmly in the Asian session. The cross has crawled above the aforementioned resistance after a recovery move from 0.8790. The Pound Sterling went sharply higher on Wednesday after the release of the United Kingdom inflation report for March month.
UK’s Office for National Statistics reported the annual headline Consumer Price Index (CPI) at 10.1%, higher than the consensus of 9.8% but lower than the former release of 10.4%. It seems that UK’s headline inflation is still not ready to ditch the double-digit figure territory. On a monthly basis, inflationary pressures accelerated by 0.8%, higher than the consensus of 0.5% but lower than the former pace of 1.1%.
Scrutiny of the UK inflation report showed that headline inflation has softened from its former release due to lower natural gas prices used for electricity and heating purpose. Food inflation has reached a fresh 45-year high at 19.1% and has been a major driver in keeping UK inflation steady.
Meanwhile, UK’s Producer Price Index (PPI) for input and output products has softened sharply despite steady employment bills. It indicates that firms have passed on the impact of lower input costs due to declining gasoline prices or are worried about forward demand by households.
This has cemented the case of one more 25 basis points (bps) rate hike from the Bank of England (BoE) as a higher restrictive monetary policy is required to tame gigantic inflation.
On the Eurozone front, March’s headline Harmonized Index of Consumer Prices (HICP) has been settled at 6.9%. Eurozone inflation is softening consistently but it doesn’t weak the case of one more rate hike from the European Central Bank (ECB). The street is anticipating that ECB President Christine Lagarde will slow down the pace of the rate hike to 25 basis points (bps).
-
01:15
Currencies. Daily history for Wednesday, April 19, 2023
Pare Closed Change, % AUDUSD 0.67142 -0.21 EURJPY 147.448 0.23 EURUSD 1.09546 -0.18 GBPJPY 167.381 0.47 GBPUSD 1.24352 0.06 NZDUSD 0.62016 -0.11 USDCAD 1.34549 0.5 USDCHF 0.8973 0.14 USDJPY 134.597 0.4 -
01:13
GBP/USD Price Analysis: Cable buyers remain cautious below tested 1.2470 resistance
- GBP/USD struggles to defend latest gains, prints mild losses while snapping two-day uptrend.
- Clear downside break of one-month-old previous support line joins sluggish MACD signals, steady RSI to tease sellers.
- 100-EMA, ascending support line from early April challenge Cable bears.
GBP/USD remains pressured around 1.2430, printing minor losses amid Thursday’s Asian session after a two-day uptrend. In doing so, the Cable pair stays on the bear’s radar amid multiple failures to cross the previous support line stretched from late March.
Adding strength to the downside bias could be the sluggish MACD signals and steady RSI (14) line.
However, the 100-SMA and a one-month-old resistance line, respectively near 1.2400 and 1.2370, restrict the GBP/USD pair’s short-term downside.
It’s worth noting that a short-term horizontal line around 1.2350 holds the key to the GBP/USD pair’s slump toward the monthly low of 1.2275.
Following that, the late March swing low near 1.2190 and the 1.2000 round figure will gain the market’s attention.
On the flip side, a clear upside break of the 1.2470 support-turned-resistance will be enough for the GBP/USD buyers to retake control.
In that case, the 1.2500 round figure and the monthly high of near 1.2550 should gain major attention before directing the Cable pair buyers towards the May 2022 high of near 1.2665.
Overall, GBP/USD is likely to remain downbeat unless crossing 1.2470.
GBP/USD: Four-hour chart
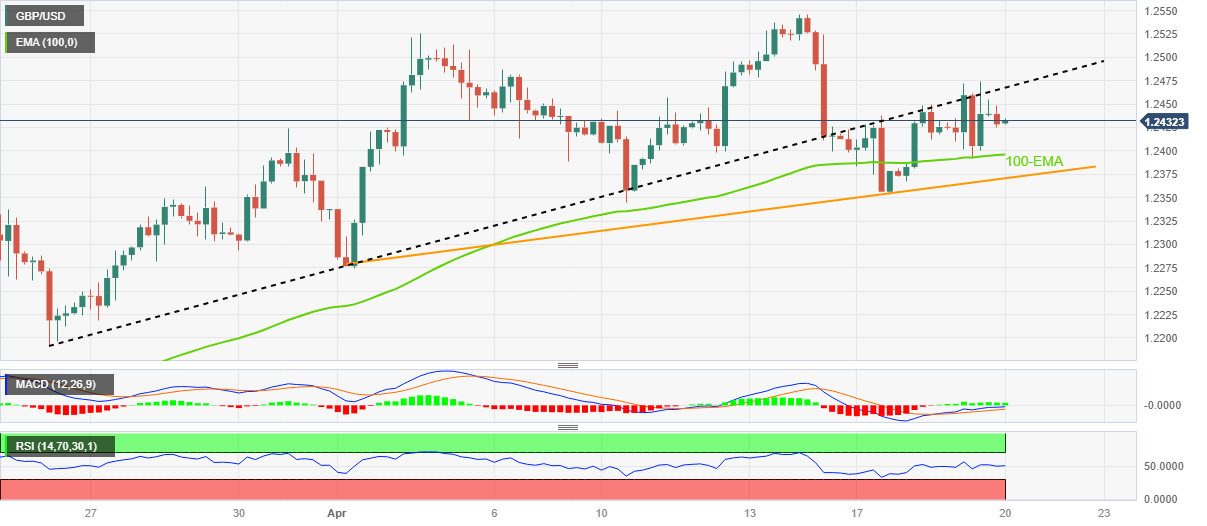
Trend: Further downside expected
-
00:56
Japan Adjusted Merchandise Trade Balance above forecasts (¥-1514.5B) in March: Actual (¥1.21B)
-
00:56
USD/CAD Price Analysis: Bulls cross 100-SMA with eyes on 1.3500
- USD/CAD takes the bids to renew one-week high on crossing short-term key hurdles, now immediate supports.
- 100-SMA, one-month-old descending trend line restrict immediate downside amid bullish MACD signals.
- Overbought RSI conditions suggest pullback from the 1.3500 round figure.
- 200-SMA acts as additional upside filters, bears need validation from 1.3320.
USD/CAD marches towards the 1.3500 threshold after crossing the short-term key resistances, around 1.3470 during Thursday’s Asian session.
In doing so, the Loonie pair cheers upside break of the one-month-old descending trend line, as well as the 100-SMA, respectively near 1.3465 and 1.3390.
It should be noted that the bullish MACD signals join the resistance breaks to keep USD/CAD buyers hopeful. However, the overbought RSI (14) restricts the quote’s further upside.
As a result, the USD/CAD bulls appear to have a limited upside room, which in turn highlights the 1.3500 round figure as an immediate hurdle ahead of the April 10 swing high of around 1.3555.
Following that, the 200-SMA hurdle of around 1.3595 and the 1.3600 round figure act as the final defense of the USD/CAD bears.
Meanwhile, a downside break of the 1.3390 resistance-turned-support isn’t an open welcome to the USD/CAD bears as an upward-sloping support line from February, close to 1.3320, becomes crucial to conquer for the Loonie pair sellers to retake control.
To sum up, USD/CAD remains on the bull’s radar but the road toward the north is long and bumpy.
USD/CAD: Four-hour chart
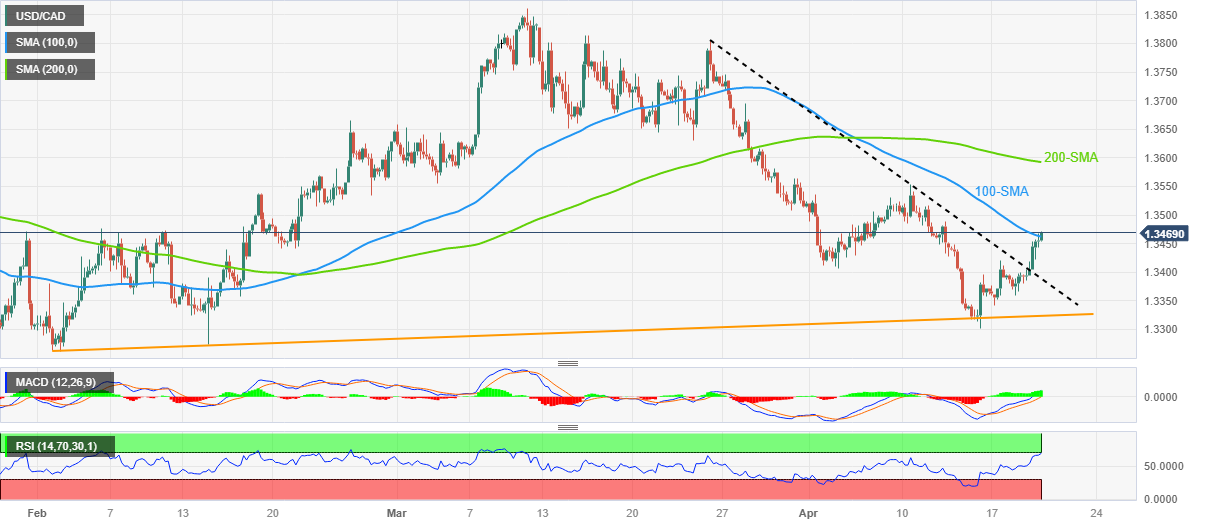
Trend: Limited upside expected
-
00:51
Japan Foreign Bond Investment increased to ¥500.2B in April 14 from previous ¥-788.8B
-
00:51
Japan Exports (YoY) above forecasts (2.6%) in March: Actual (4.3%)
-
00:51
Japan Foreign Investment in Japan Stocks fell from previous ¥2368.9B to ¥1876.4B in April 14
-
00:51
Japan Imports (YoY) below expectations (11.4%) in March: Actual (7.3%)
-
00:50
Japan Merchandise Trade Balance Total above forecasts (¥-1294.8B) in March: Actual (¥-754.5B)
-
00:49
WTI bears move in and eye a close of the gap at $75.65
- WTI bears are in the market despite OPEC production cut.
- US data unsettled markets, US Dollar rises.
West Texas Intermediate, WTI, crude oil was down some 0.2% at the time of writing but closed at the lowest point this month on Wednesday. WTI fell from a high of $81.15 and met a low of $78.58, slightly lower than the current spot price of $78.83.
The US Dollar was a driver mid-week as concerns that growth is slowing amid rising interest rates come back to the fore amid a hawkish Federal Reserve sentiment. An economic survey from the Federal Reserve showed the US economy stalled in recent weeks amid slower hiring and tighter credit. Meanwhile, the Federal Reserve is anticipated to continue pushing interest rates higher when its policy committee meets next month, with another 25-basis point hike seen as likely. WTI was sharply lower on fears of weaker demand increased.
Analysts at ANZ Bank referring to the US data explained that the data ´´unsettled markets, magnifying recent concerns that monetary tightening has weakened demand for oil.´´
Meanwhile, the analysts noted that the market shrugged off a relatively bullish EIA inventory report. ´´US commercial inventories of crude oil fell 4,581kbbl last week. However, a rise in gasoline inventories (+1,299kbbl) played to the concerns of weaker consumer demand. This could all dissipate as the impact of OPEC’s new production agreement starts to bite. The group’s cut of 1.1mb/d will not commence until 1 May. In the meantime, the market is likely to remain fixated on the demand outlook.´´
Oil was also lower despite OPEC+'s decision earlier this month to cut production to counter rising global inventories.
´´The significant short squeeze orchestrated by the announcement of OPEC+ production cuts appears to be running out of steam, leaving price action vulnerable to an oversupplied physical market in the very near-term,´´ analysts at TD Securities explained. ´´Still, time spreads continue to suggest that crude markets should tighten in coming months, suggesting physical markets will soon support price action.´´USD/JPY technical analysis
The bears are in and eye a 38.2%fibonacci correction towards a close of the gap at $75.65bbls.
-
00:43
USD/CHF rebounds from 0.8970 as chances for more rate hikes from Fed remain solid
- USD/CHF has rebounded to near 0.8980 despite subdued performance by the USD Index.
- S&P500 futures have generated significant losses in early Tokyo, showing a cautionary approach.
- Fed Williams believes that the 2% inflation objective will be achieved in at least two years
The USD/CHF pair has shown a recovery move from 0.8970 in the early Asian session. The Swiss Franc asset has managed to defend further downside and has rebounded despite the subdued performance of the US Dollar Index (DXY).
The USD Index is oscillating in a narrow range of 101.90-102.00 after a sheer volatility move. The USD Index went through wild moves after the release of the Federal Reserve’s (Fed) Beige Book.
Meanwhile, S&P500 futures have generated significant losses in the early Tokyo session as investors are discounting the release of quarterly results by various firms in the late New York session. Netflix missed earnings marginally despite significant additions of new subscribers but is worried about the password-sharing act.
The overall market mood is cautionary as investors are worried that tight credit conditions by United States commercial banks could impact guidance delivered by firms.
Also, Fed Beige Book reported that several districts have shown a decline in consumer and business-type advances. US banks have tightened conditions for availing credit by businesses amid a turbulent environment. Contrary to that, New York Fed President John Williams believes it is too early to assess the economic impact of tighter credit. On inflation guidance, the Fed policymaker is of the view that the 2% inflation objective will be achieved in at least two years. Also, he anticipates that inflation will fall to 3.25% in 2023.
On the Swiss Franc front, Swiss National Bank (SNB) policymaker, Andréa Maechler, said on Wednesday, “March rate hike serves to only slow inflation towards the 2% mark.” SNB policymaker further added that Swiss inflation is slowing but is still a worry and the central bank is ready to sell foreign currencies.
-
00:39
US Dollar Index: DXY bulls prod 102.00 amid hawkish Fed concerns, upbeat Treasury bond yields
- US Dollar Index picks up bids to refresh intraday high, defends the previous day’s recovery.
- Fed policymakers defend “higher for longer” rate bias and propel yields.
- Geopolitical fears underpin US Dollar’s haven demand and propel DXY.
- Second-tier US data, risk catalysts eyed amid jittery markets.
US Dollar Index (DXY) picks up bids to reverse the late Wednesday’s pullback moves, as well as renew intraday high around 102.00, amid the early hours of Thursday’s Asian session. In doing so, the greenback’s gauge versus the six major currencies cheers hawkish concerns about the Federal Reserve (Fed), as well as geopolitical fears, after a volatile day.
Recently, New York Fed President John Williams marked support for 0.25% interest rate hike in May while saying, “Inflation is still too high, and we will use our monetary policy tools to restore price stability.”
Just before him was Chicago Federal Reserve Bank President Austan Goolsbee who highlighted credit market strength as one of the key catalysts to watch ahead of the next Fed monetary policy meeting.
Previously, St. Louis Federal Reserve President James Bullard, Richmond Fed President Thomas Barkin and Atlanta Fed President Raphael W. Bostic were the Fed speakers who rekindled the “higher for longer” scenario for rates and favored the US Dollar, as well as yields.
It should be noted that the recently firmer US data and hawkish Fed talks favor the market’s bets on the central bank’s 0.25% rate hike in May, as well as reduce the probability of witnessing a rate cut in 2023. The same joins the inflation and rate hike fears from the other major central banks to propel the US Dollar’s haven demand.
On the same line could be the war fears emanating from China and Russia, not to forget the fears of recession.
On Wednesday, Reuters came out with the news suggesting that US consumers are starting to fall behind on their credit card and loan payments as the economy softens.
Elsewhere, UK’s warned Russian hackers targeting Western critical infrastructure while the US House China Committee discussed the Taiwan invasion scenario. Furthermore, the likely drag on the US debt ceiling decision is due to US President Joe Biden’s hesitance in lifting debt limits. Additionally, Bloomberg released news suggesting China’s role in the Russia-Ukraine war, which in turn adds strength to the risk-off mood.
Against this backdrop, Wall Street closed mixed but the top-tier US Treasury bond yields refreshed monthly high and allowed the US Dollar to remain firmer.
Moving ahead, risk catalysts are key to watch for clear directions but central bankers’ speeches and second-tier US data should also not be ignored for fresh impulse.
Technical analysis
Despite the US Dollar Index’s corrective bounce off 100.80 double bottoms, the 21-DMA and a one-month-old resistance line, respectively near 102.15 and 102.35, challenge the DXY recovery before welcoming bulls.
-
00:22
CAD/JPY Price Analysis: Struggles at 100.60s and retraces towards the 100.00 figure
- The CAD/JPY remained downward pressured by falling oil prices and a risk-off impulse.
- From a daily chart perspective, the CAD/JPY is consolidating at around the 100.00-101.00 range.
- The CAD/JPY could shift downwards if buyers fail to hold prices above the 200-DMA.
The CAD/JPY faced solid resistance around 100.60 and retraced after posting a staggering 7.60% rally from March 24, when the pair printed its YTD low at 94.06. At the time of writing, the CAD/JPY is trading at 100.07, threatening to break below the 100.00 thresholds for the first time since April 14.
CAD/JPY Price Action
From a daily chart perspective, the CAD/JPY is neutral to upward biased, even though the pair broke above the 200-day EMA, lying at 99.90. Some fundamental news, like crude oil prices edging lower, weighed on the Canadian Dollar (CAD). In addition to the Relative Strength Index (RSI), turning flat and back-to-back bearish candlesticks could pave the way for a pullback.
If CAD/JPY breaks below the 200-day EMA, the 100-day EMA would be next at 99.26. If the pullback extends past the latter, a cluster of support lies at the 98.55/88 price level, the confluence of the 50 and 20-day EMAs, respectively., followed by April’s 5 cycle low at 97.09.
On the flip side, If CAD/JPY stays above 100.00, a test of the YTD high at 100.87 is on the cards. Once cleared, buyers could pose a threat to crack the 101.00 psychological level, followed by the next resistance, the November 30 high at 103.47.
CAD/JPY Daily Chart
-
00:12
Fed's Williams: It is too early to assess the economic impact of tighter credit
Federal Reserve Bank of New York President John Williams said Wednesday that inflation is still at problematic levels and the US central bank will act to lower it, in comments that noted recent stress in the banking sector will likely weigh on economic activity.
“Inflation is still too high, and we will use our monetary policy tools to restore price stability,” Williams said in prepared remarks for delivery before a gathering held by the Money Marketeers of New York University.
Key comments
- I am seeing signs of cooling in a still-strong job market.
- I expect a gradual rise in the unemployment rate to 4%-4.5% over the following year.
US Dollar update
The US Dollar is up on the day targeting the 102.20 resistance correcting from the counter trendline support.
-
00:07
AUD/NZD renews six-week high below 1.0900 as New Zealand Q1 CPI plummets
- AUD/NZD jumps 50 pips as New Zealand inflation pours cold water on the face of RBNZ hawks.
- RBA’s efforts to push back dovish bias, optimism ahead of key Aussie data/events also favor AUD/NZD bulls.
- PBOC Interest Rate Decision may not entertain with status quo but will be important to watch for clear directions.
AUD/NZD takes the bids to refresh a 1.5-month high after downbeat New Zealand (NZ) inflation numbers, released early Thursday in Asia.
In doing so, the exotic pair also justifies the Australian Dollar’s (AUD) comparative strength amid the Reserve Bank of Australia’s (RBA) recent defense of the hawkish monetary policy stance and the confirmation of upbeat economic conditions.
The first quarter (Q1) 2023’s print of New Zealand’s (NZ) headline inflation, per the Consumer Price Index (CPI), released by Statistics New Zealand poured cold water on the face of the policy hawks at the Reserve Bank of New Zealand (RBNZ) by offering a negative surprise. That said, the NZ CPI drops to 1.2% QoQ versus the expected 1.7% and 1.4% prior.
Also read: Breaking: New Zealand Q1 CPI slides to 1.2% QoQ while driving down NZD/USD to 0.6175
The inflation numbers came in well below the RBNZ’s February forecast of 7.3% and prods the latest hawkish move of New Zealand’s central bank, suggesting a negative surprise in the next meeting, which in turn drowns the New Zealand Dollar (NZD).
It’s worth noting that the optimism surrounding China, as per the latest comments from the National Development and Reform Commission (NDRC), also underpins the AUD’s strength and allows the AUD/NZD pair to remain firmer. On Wednesday, China’s NDRC, the state planner, said that the country is formulating plans to boost the recovery and expansion of consumption.
On the contrary, a notable jump in the inflation numbers at the other key global economies joined the hawkish comments from the top-tier central bank officials to renew fears of higher rates and recession, which in turn tame the AUD/NZD pair’s upside moves. On the same line could be the war fears emanating from China and Russia.
Looking forward, National Australia Bank’s (NAB) Business Confidence for the first quarter (Q1), expected 2 versus -1 expected, will precede Reserve Bank of Australia (RBA) Governor Philip Lowe’s independent review of the central bank to guide intraday moves of the AUD/NZD pair. Also important to watch will be the monetary policy meeting of the People’s Bank of China, (PBOC), even if it is unexpected to announce any change in the current benchmark rate of 3.65%.
Technical analysis
A clear upside break of March’s high of around 1.0895 becomes necessary for the AUD/NZD bulls to keep the reins.
-
00:00
NZD/USD drops sharply to near 0.6170 as NZ Q1 Inflation softens
- NZD/USD has slipped sharply to near 0.6170 as NZ CPI has softened more than anticipated.
- Quarterly CPI has accelerated by 1.2% vs. 1.7% as expected while annual CPI has dropped to 6.7% against 7.1% as estimated.
- The PBoC is expected to keep its LPR steady ahead.
The NZD/USD pair has slipped heavily to near 0.6170 as Statz New Zealand has reported lower-than-anticipated Consumer Price Index (CPI) data for the first quarter of CY2023. In the first quarter, inflationary pressures accelerated by 1.2% vs. the consensus of 1.7% and the former release of 1.4%. Annual inflation has softened to 6.7% while the street was anticipating a marginal deceleration to 7.1% from the prior release of 7.2%.
A significant decline in Kiwi inflation indicates that the Reserve Bank of New Zealand (RBNZ) is on the right track to arresting stick inflation. Investors should be aware of the fact that RBNZ Governor Adrian Orr raised interest rates surprisingly by 50 basis points (bps) to 5.25% in its last monetary policy meeting held on April 05.
Going forward, the interest rate decision by the People’s Bank of China (PBoC) will remain in the spotlight. A Reuters survey showed the PBoC is expected to keep its Loan Prime Rate (LPR) steady as economic recovery in China has been well on track. China’s Gross Domestic Product (GDP) for the first quarter landed matched upward revised estimates. Also, annual GDP figures remained better than projected, indicating prosperity after dismantling pandemic curbs.
It is worth noting that New Zealand is one of the leading trading partners of China and a stellar economic recovery in China will support the New Zealand Dollar.
Meanwhile, S&P futures are showing significant losses in the early Asian session amid discounting the impact of lighter corporate earnings by Netflix. This indicates that households are reluctant to pay for entertainment and are preferring spending on necessities due to the burden of higher inflation. The overall market mood is quite risk-averse.
The US Dollar Index (DXY) is struggling to recapture the critical resistance of 102.00. The upside in the USD Index looks capped after Federal Reserve’s (Fed) Beige Book showed that United States commercial banks have tightened credit conditions, which has resulted in lower disbursement of loans and advances to businesses and consumers.
-