Notícias do Mercado
-
23:47
Breaking: New Zealand Q1 CPI slides to 1.2% QoQ while driving down NZD/USD to 0.6175
The quarterly print of New Zealand’s (NZ) headline inflation, per the Consumer Price Index (CPI), released by Statistics New Zealand is out for the first quarter (Q1) of 2023 and is as follows:
- New Zealand Q1 CPI 1.2% QoQ versus the expected 1.7% and 1.4% prior.
- NZ CPI eased to 6.7% YoY compared to 7.1% market forecasts and 7.2% YoY prior.
NZD/USD plummets
With the NZ CPI being well-behind the Reserve Bank of New Zealand’s (RBNZ) 7.3% target, as well as the downbeat of late, the dovish odds surrounding the RBNZ weigh on the NZD/USD price.
As a result, the Kiwi pair dropped near 25 pips on the data release, down 0.35% intraday near 0.6175 by the press time of early Thursday morning in Asia.
Also read: NZD/USD Price Analysis: Bears eye a continution to 0.6120
About NZ CPI
With the Reserve Bank of New Zealand's (RBNZ) inflation target being around the midpoint of 2%, Statistics New Zealand’s quarterly Consumer Price Index (CPI) publication is of high significance. The trend in consumer prices tends to influence RBNZ’s interest rates decision, which in turn, heavily impacts the NZD valuation. Acceleration in inflation could lead to faster tightening of the rates by the RBNZ and vice-versa. Actual figures beating forecasts render NZD bullish.
-
23:45
New Zealand Consumer Price Index (YoY) came in at 6.7% below forecasts (7.1%) in 1Q
-
23:45
New Zealand Consumer Price Index (QoQ) below forecasts (1.7%) in 1Q: Actual (1.2%)
-
23:43
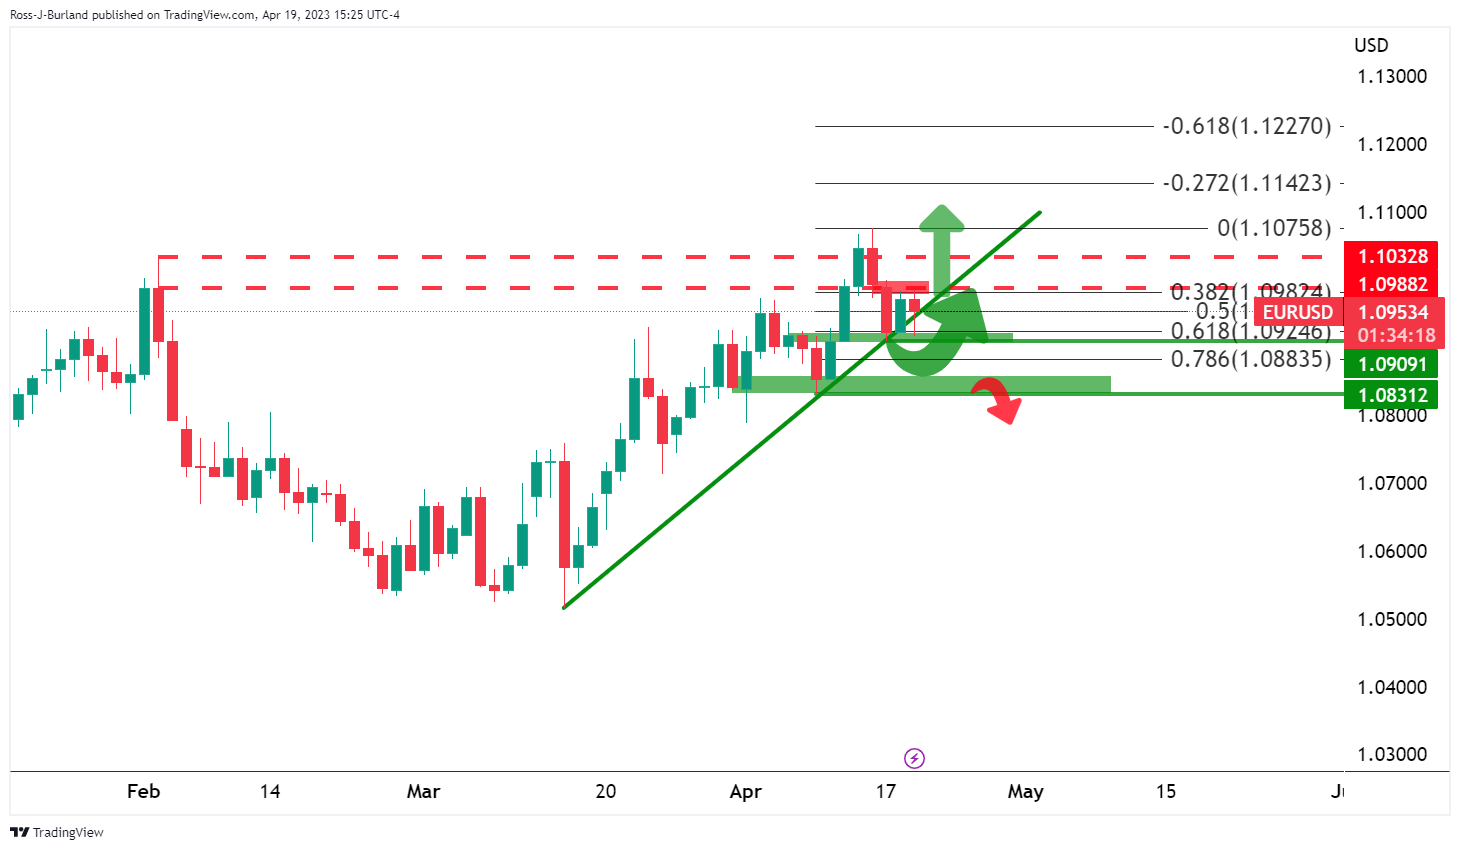
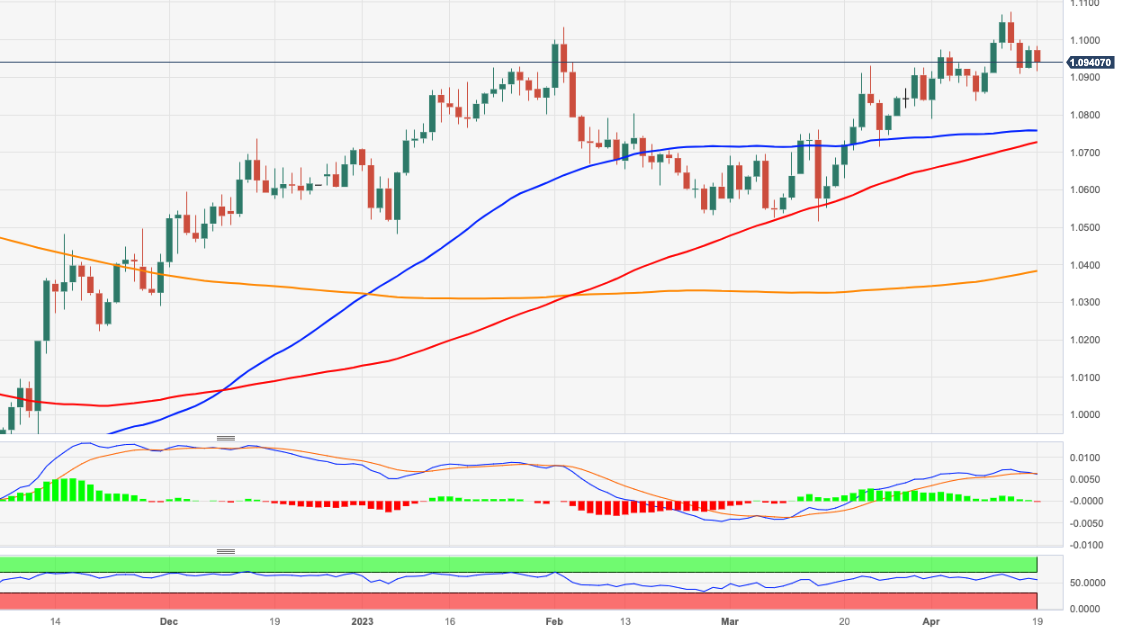
EUR/USD Price Analysis: Bears flex muscles but 1.0910 is the key support
- EUR/USD fades bounce off 100-SMA while retreating from 21-SMA, sidelined of late.
- Sluggish MACD, steady RSI advocates further volatility ahead.
- One-month-old ascending support line holds the gate for Euro bear’s entry.
- Repeated failures to cross short-term key hurdle lure sellers, bulls need validation from one-week-old horizontal resistance area.
EUR/USD treads water around 1.0950 amid the early hours of Thursday’s Asian session. In doing so, the Euro pair fades the corrective bounce off the 100-bar SMA marked a few hours back while retreating from the 21-SMA.
With this, the Euro pair marked repeated failures in crossing the 21-SMA in the current week, which in turn joins the steady RSI (14) line and sluggish MACD signals, mostly bearish, to keep the sellers hopeful.
However, the 100-SMA support of 1.0920 isn’t the key to the EUR/USD pair’s south run as an upward-sloping support line from late March, close to 1.0910 is a crucial challenge for the bears to tackle before taking control.
Following that, a slump toward the April 10 swing low of around 1.0835 can’t be ruled out.
However, the monthly low of 1.0788 and the 61.8% Fibonacci retracement level of the pair’s March-April upside, near 1.0730 could challenge the pair’s further downside afterward.
Meanwhile, recovery moves can’t be confirmed on an upside break of the 21-SMA hurdle of near 1.0965 as a one-week-old horizontal resistance area, close to the 1.1000 psychological magnet, will be crucial for EUR/USD buyers to cross for fresh power.
In a case where the EUR/USD bulls remain in control past 1.1000, the latest peak surrounding 1.1075 will be in the spotlight.
EUR/USD: Four-hour chart

Trend: Further downside expected
-
23:27
Gold Price Forecast: XAU/USD oscillates below $2,000 after a V-shape recovery inspired by Fed Beige Book
- Gold price is hovering below $2,0000 after a V-shape recovery move.
- The 10-year US Treasury yields jumped above 3.59% as one more rate hike by the Fed is in the pipeline.
- Several Fed districts noted that banks tightened lending standards amid increased uncertainty and concerns about liquidity.
Gold price (XAU/USD) is facing hurdles in extending its recovery above the immediate resistance of $1,997.00 in the early Asian session. The precious metal is struggling to recapture the psychological resistance of $2,000.00 after a V-shape recovery. A confident recovery in the Gold price from the cushion of $1,970.00 was inspired by the release of the Federal Reserve’s (Fed) Beige Book.
S&P500 futures are showing further losses in early Tokyo after back-to-back subdued trading sessions, indicating a cautious approach by market participants due to the quarterly result season. Broadly, the US Dollar Index (DXY) is showing signs of volatility contraction below 102.00 as Fed’s Beige Book failed to infuse blood into the former. Meanwhile, the 10-year US Treasury yields jumped above 3.59% as one more rate hike by the Fed is in the pipeline.
The release of the Fed’s Beige Book first after the banking turmoil confirmed that the ghost of tight credit conditions by US commercial banks, as a safety measure amid a turbulent environment, is for real.
Several districts noted that banks tightened lending standards amid increased uncertainty and concerns about liquidity, which has triggered the risk of declining economic prospects as lower advances to firms won’t let them work at the current pace. Auto sales remained moderate, confirming no further jump in retail demand ahead.
Gold technical analysis
Gold price has shown a stellar recovery after dropping to near the lower portion of the Rising Channel chart pattern formed on a two-hour scale. The V-shape recovery shown by the Gold price indicates the presence of responsive buyers at lower levels, making the area value bet for the market participants. The precious metal is making efforts to shift above the 20-period Exponential Moving Average (EMA) at $1,995.40, which will make the short-term trend bullish.
Meanwhile, the Relative Strength Index (RSI) (14) has managed to get back into the 40.00-60.00 range from the bearish range of 20.00-40.00.
Gold two-hour chart

-
23:22
Fed's Goolsbee: Things to watch over next 2 weeks until Fed's next meeting are prices and credit
“After the failure of two large regional Fed banks last month roiled the financial sector, I’m waiting to see whether there are other credit shoes to drop,” said Chicago Federal Reserve Bank President Austan Goolsbee In an interview with American Public Media's Marketplace.
Additional comments
Not in the crisis sense, but in the how much squeezing is going to be coming up from the bank side.
I think it’s going to matter for whether this economy is going to slow down.
My message is, be prudent, be patient.
EUR/USD retreats
EUR/USD fades the late Wednesday’s corrective bounce while retreating to 1.0955 during the early hours of Thursday’s Asian session.
Also read: EUR/USD bulls holding in the 1.09s front side of bullish trend
-
23:13
AUD/USD retreats towards 0.6700 amid jittery markets, Australia NAB Sentiment, RBA’s Lowe eyed
- AUD/USD fades late Wednesday’s corrective bounce amid mixed markets.
- Fears of higher inflation in major economies leading to more rate hikes and recession weigh on sentiment.
- Geopolitical woes, mixed headlines from China also contributed to Aussie pair’s volatile moves.
- NAB’s quarterly Business Confidence will be crucial for clear directions, RBA’s Lowe eyed too.
AUD/USD eases back towards 0.6700, around 0.6715 by the press time, as cautious markets weigh on the risk barometer pair ahead of the top-tier data/events on Thursday. That said, the mostly downbeat sentiment and firmer US Treasury bond yields weighed on the Aussie pair the previous day amid fears of inflation and geopolitical tensions.
A notable jump in the inflation numbers at the key global economies joined the hawkish comments from the top-tier central bank officials renewed fears of higher rates and recession, which in turn renewed the US Dollar’s haven demand on Wednesday. Adding strength to the risk aversion could be the war fears emanating from China and Russia. However, upbeat headlines from the Dragon Nation and an absence of any impressive US data tamed the AUD/USD pair’s run-up afterward.
Recently, the UK, Eurozone and the US have all been flashing upbeat signals for inflation while the central bank officials from the Bank of England (BoE), European Central Bank (ECB) and the Federal Reserve (Fed) are all favoring higher rates for longer. The same raises the fears of economic slowdown especially when the ex-inflation numbers haven’t been too impressive and the Russia-Ukraine war takes a toll on the global economy.
On the same line could be the Reuters’ news suggesting that US consumers are starting to fall behind on their credit card and loan payments as the economy softens.
St. Louis Federal Reserve President James Bullard, Richmond Fed President Thomas Barkin and Atlanta Fed President Raphael W. Bostic were the latest hawkish Fed speakers who rekindled the “higher for longer” scenario for rates and favored the US Dollar, as well as yields.
Talking about geopolitics, UK’s warned Russian hackers targeting Western critical infrastructure while the US House China Committee discussed the Taiwan invasion scenario. Furthermore, the likely drag on the US debt ceiling decision is due to US President Joe Biden’s hesitance in lifting debt limits. Additionally, Bloomberg released news suggesting China’s role in the Russia-Ukraine war, which in turn adds strength to the risk-off mood.
On the contrary, China’s National Development and Reform Commission (NDRC), the state planner, said on Wednesday, the country is formulating plans to boost the recovery and expansion of consumption.
Amid these plays, Wall Street closed mixed but the top-tier US Treasury bond yields refreshed monthly high and allowed the US Dollar to remain firmer.
Moving on, National Australia Bank’s (NAB) Business Confidence for the first quarter (Q1), expected 2 versus -1 expected, will precede Reserve Bank of Australia (RBA) Governor Philip Lowe’s independent review of the central bank to guide intraday moves of the AUD/USD pair. Above all, risk catalysts are the key.
Technical analysis
Repeated failures to break the 21-DMA support joins steady RSI (14) line to keep AUD/USD buyers hopeful.
-
23:09
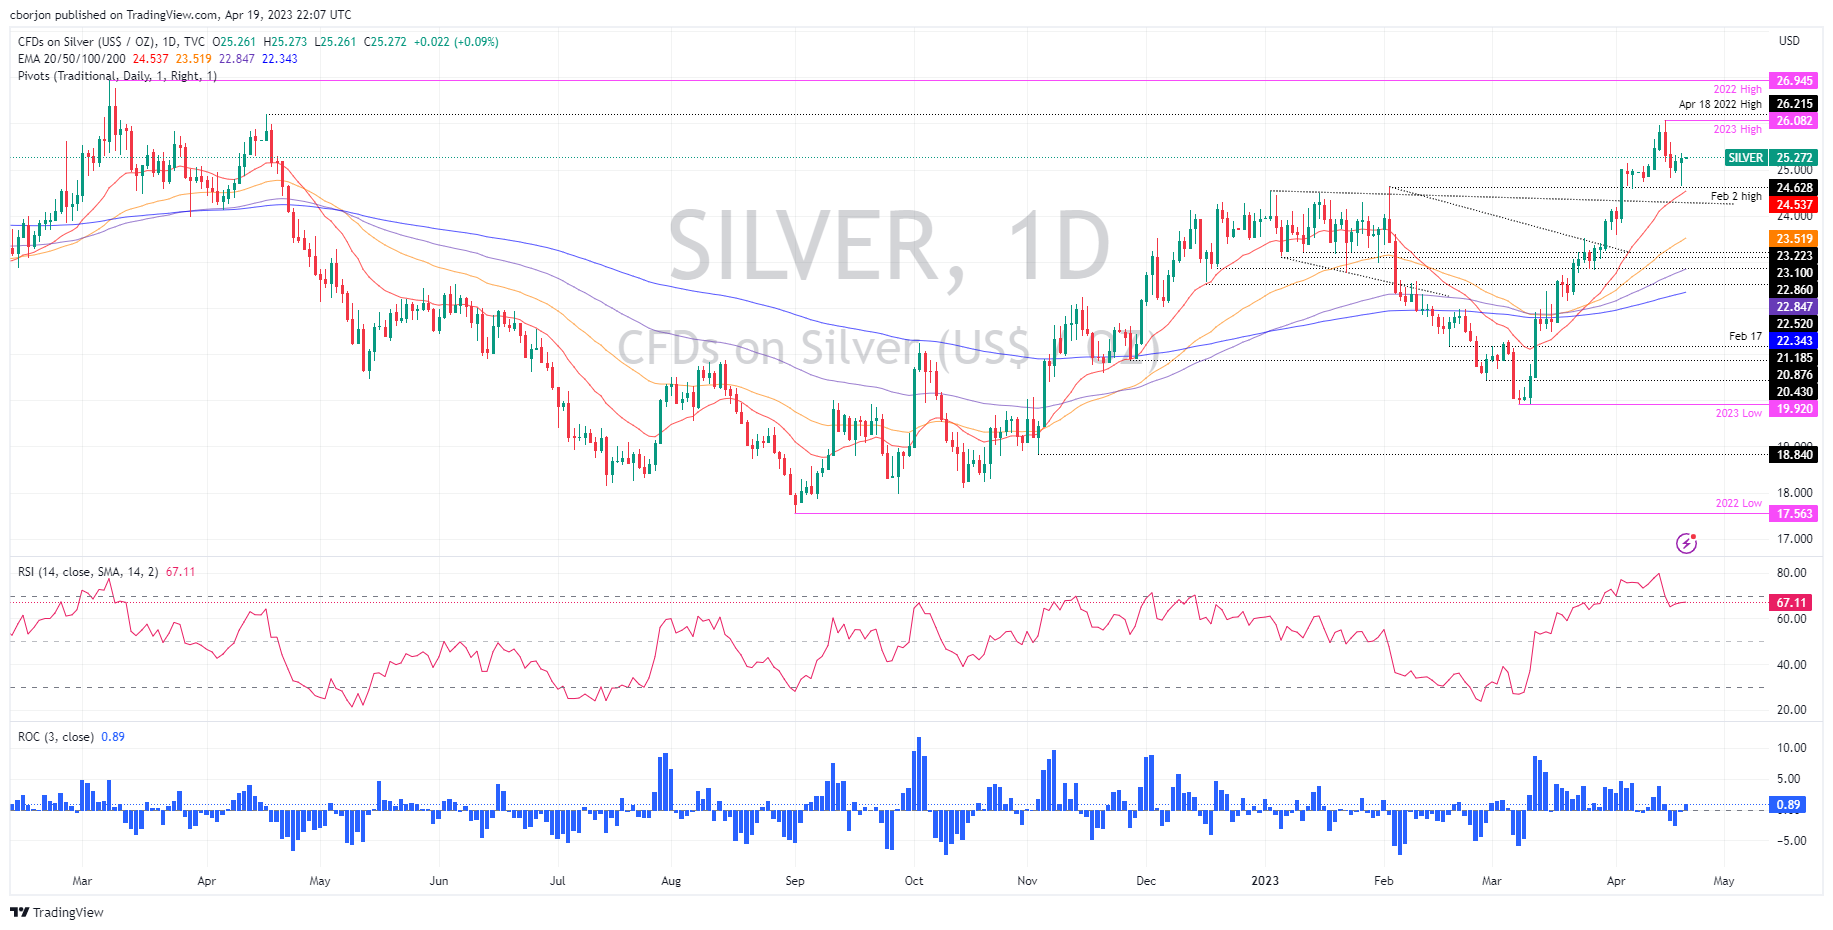
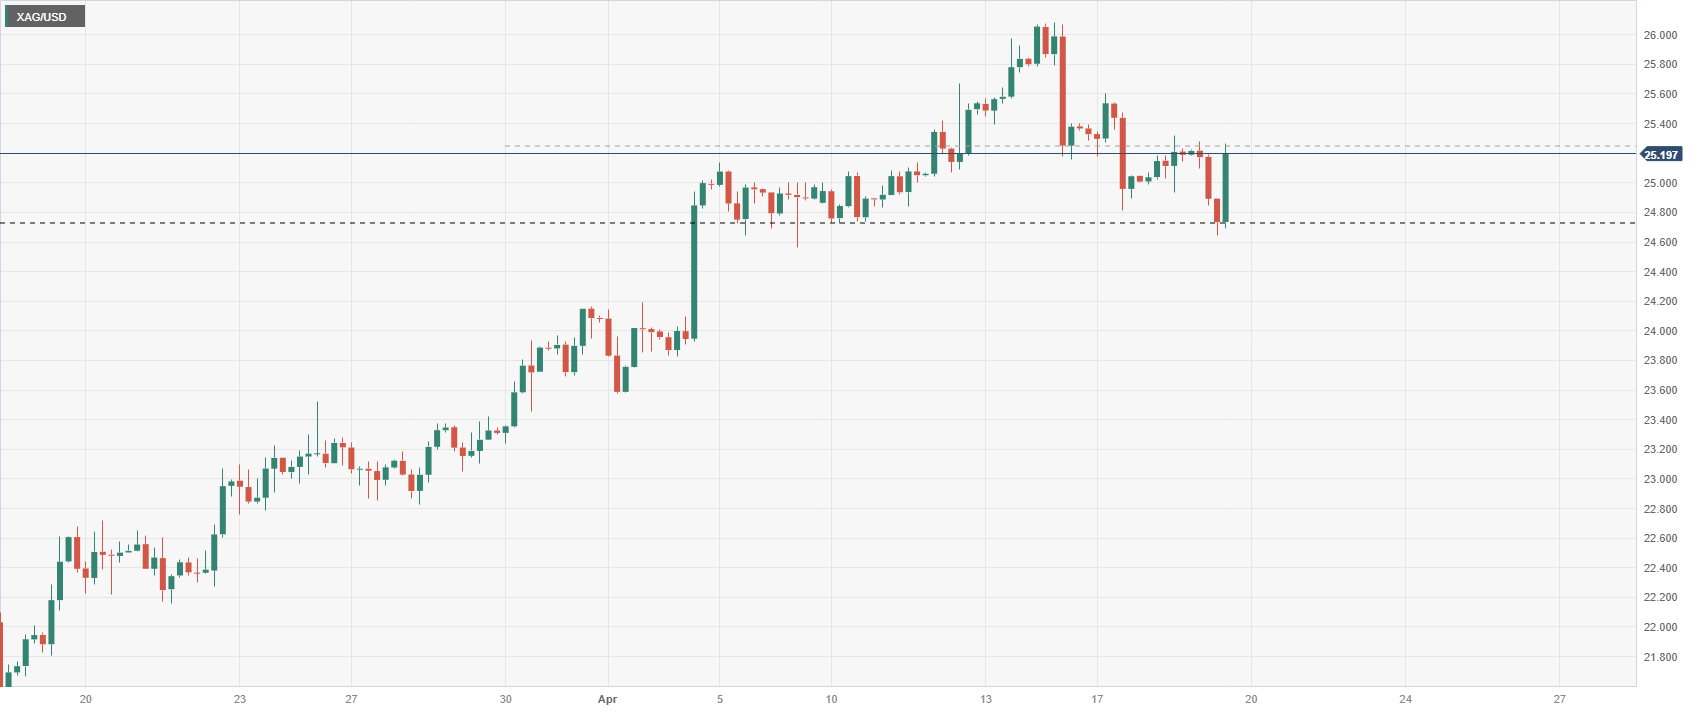
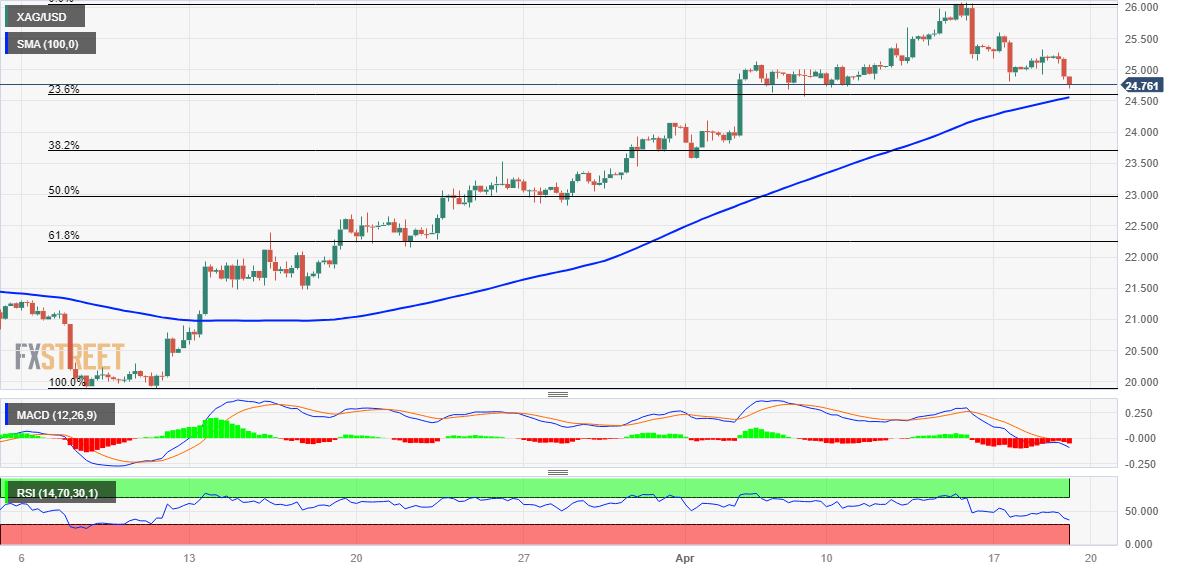
Silver Price Analysis: XAG/USD surges amidst high US bond yields, strong USD
- Silver is still bullish but could test a four-month-old resistance-turned-support trendline nearby $24.20-40.
- XAG/USD Price Analysis: It’s upward biased, though downside risks remain below $25.00.
Silver price erased its earlier losses that dragged the white metal towards testing February 2 highs at $24.63 per ounce and rallied back above the $25.00 psychological figure. Although the US Dollar (USD) remained underpinned by high US Treasury bond yields, the XAG/USD is trading at $25.25, about to finish Wednesday’s session with gains of 0.28%.
XAG/USD Price Action
Since hitting YTD high at 26.08, the XAG/USD dropped sharply due to the overbought Relative Strength Index (RSI). Therefore, traders moved quickly to book profits, weakening Silver, which tumbled more than 5%. However, as oscillators turned neutral, the XAG/USD bottomed around $24.61, some 20-pips above the 20-day EMA.
For a bullish continuation, the XAG/USD must crack Wednesday’s high at $25.36. Once cleared, the XAG/USD next stop will be the April 17 daily high at $25.60 before posing a threat to $26.00, ahead of the YTD high at $26.08.
Conversely, the XAG/USD first support would be the psychological $25.00 level. A breakout to the downside will expose the 20-day EMA At $24.46, followed by a previously broken resistance-turned-support level at $24.20, as sellers brace towards $24,00. Once cleared, sellers will eye a test of the 50-day EMA at $23.45.
XAG/USD Daily Chart
-
22:52
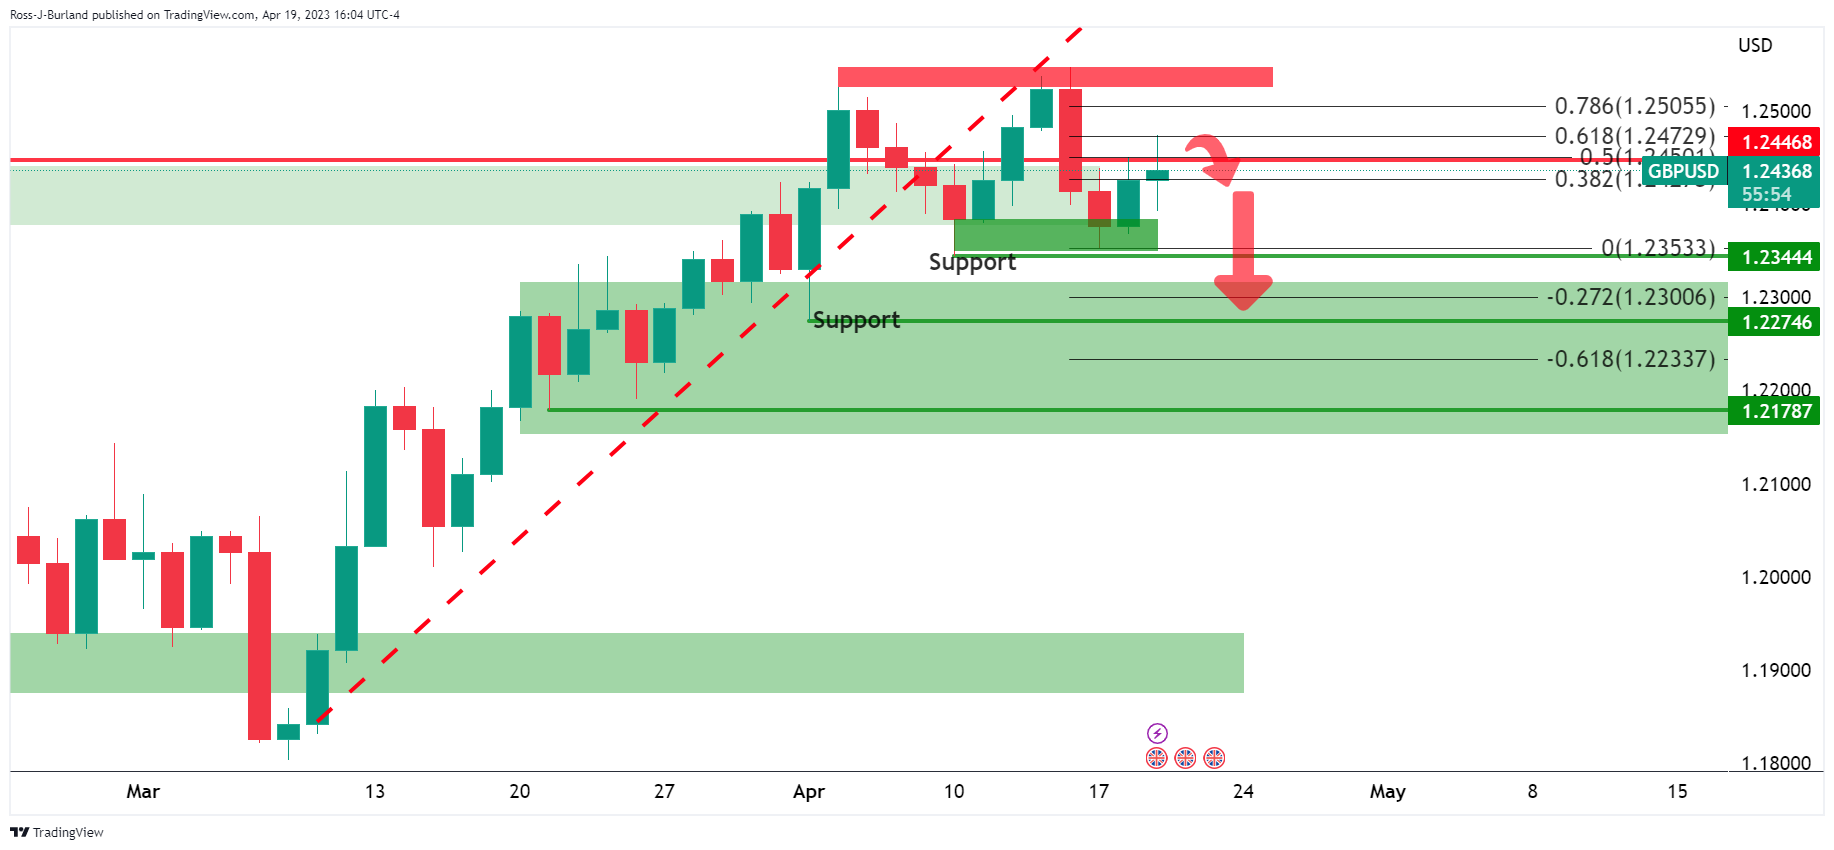
GBP/USD turns sideways around 1.2440 as Fed-BoE eyes one more rate hike
- GBP/USD is consolidating around 1.2440 after sheer volatility inspired by UK Inflation data.
- The Fed and the BoE are expected to raise rates further by 25 bps to tame sticky inflation.
- UK’s Food price inflation has been registered as highest in the 45 years at 19.1%.
The GBP/USD pair is oscillating in a narrow range of around 1.2440 in the Asian session. Investors are divided on supporting the Pound Sterling or the US Dollar as the Federal Reserve and the Bank of England (BoE), both are expected to announce one more rate hike to continue weighing pressure on persistent inflation in respective economies.
S&P500 settled Wednesday’s session with nominal losses after Tesla missed margins due to price cuts, however, production guidance remains steady, portraying a caution in the overall market mood. The US Dollar Index (DXY) is facing barricades while reclaiming the immediate resistance of 102.00. The USD Index saw a heavy correction after testing a weekly high of 102.20 as the release of the Fed’s Beige Book failed in fueling fresh blood in the former.
Data collected in the Fed’s Beige Book were limited to April 10, which showed that stagnant or nominal growth has been registered in the majority of districts. Lending volumes and loan demand generally declined across consumer and business loan types. Several Districts noted that banks tightened lending standards amid increased uncertainty and concerns about liquidity.
This has restricted the upside in the USD Index as the absence of growth and lower advances could impact overall economic activities ahead.
On the United Kingdom front, the inflation report released on Wednesday showed that UK’s inflation is extremely persistent and is not ready to surrender space above a double-digit figure. Food price inflation has been registered as highest in the 45 years at 19.1%. Shortages of labor and energy crisis have been major drivers of heavily stubborn inflation.
Following the latest UK inflation reading, analysts at Standard Chartered see the Bank of England raising the key interest rate by 25 basis points in May. They further added, “Beyond May, we see the potential for additional hikes, but we think the MPC will take a meeting-by-meeting approach and decisions will be heavily dependent on how economic data evolve month-to-month.”
-
22:49
USD/CAD bulls are in town taking on the 1.3450s
- USD/CAD is firm in early Asia near 1.3450 as the US Dollar hardens.
- Fed sentiment is driving US yields and the US Dollar up.
USD/CAD rallied to a one-week high on Wednesday as US bond yields rose and domestic data showed housing starts fell more than expected in March. At the time of writing, USD/CAD is trading around 1.3455 in early Asia.
Mortgage applications in the US fell sharply in the week to 14 April. The MBA measure fell 8.8% WoW as higher interest rates impact demand, particularly from first-time homebuyers, analysts at ANZ Bank explained. Additionally, the oil price settled 2.1% lower at $79.16 a barrel as the US Dollar bounced back against a basket of major currencies.
The US Dollar index, DXY, which tracks the currency against a basket of its peers, was up 0.206% as markets turn more skeptical that the Federal Reserve will cut rates later this year. It currently sits at 101.90 and has moved between a low of 101.656 and 102.228. Meanwhile, the yield on two-year Treasury notes were hitting a one-month high of 4.286%.
In this regard, the futures pricing has show an 85.7% chance the Fed will hike rates 25 basis points when policymakers conclude a two-day meeting on May 3, according to CME's FedWatch Tool. However, the US dollar is getting a boost on hawkish themes coming through again. Federal Reserve´s Governor Christopher Waller said that despite a year of aggressive rate increases, the Fed "hasn't made much progress" in returning inflation to their 2% target and argued that rates still need to go up. As such, the likelihood of a rate cut by December has narrowed considerably this week.
Looking ahead, the Federal Open Market Committee will enter a blackout this weekend ahead of the 2/3 May meeting. The latest guidance is very much in line with market pricing and Atlanta Fed President Bostic said that he favors one more 25bp rate hike and then a pause. Bostic explained that tightening in credit conditions could do some of the Fed’s work. ´´The Atlanta Fed has historically been seen, rightly or wrongly, as a barometer of consensus on the FOMC,´´ analysts at ANZ Bank said.
Domestically, Canadian Housing Starts for March dropped 11% contributing to a slower trend in recent months that follows a rapid increase in borrowing costs. Also, Canadian producer prices rose by 0.1% in March from February.
´´A lower Canadian dollar, especially against the greenback, has sparked fears that import prices will rise—lighting up inflation just as it’s finally settling down,´´ Assistant Chief Economist, Royal Bank of Canada wrote.
´´But with domestic services dominating more of what we buy and Canada importing more from countries outside the US, these currency fluctuations matter less to prices than they once did,´´ he added and continued:
´´A weak CAD won’t derail inflation trends that are now heading in the right direction. In an increasingly services-dominant economy, demand, not currency, will decide where prices go.´´
-
21:57
USD/MXN retreats from weekly highs as the US economy decelerates, Fed's Beige Book showed
- The US Federal Reserve Beige Book flashes that the economy in the US is slowing down, led by inflation, hiring, and consumption.
- Money market swaps suggest that the Federal Reserve will hike 25 bps hike and then pause, with investors eyeing a November cut.
- USD/MXN Price Analysis: Resumed its downtrend, with sellers eyeing a crack of 18.0000.
The USD/MXN retreats from weekly highs and the 20-day EMA, even though the market sentiment shifted sour, as shown by Wall Street closing mixed. Ebbs and flows stayed at the emerging market currency, although the US Dollar (USD) appreciated against most G7 currencies. At the time of writing, the USD/MXN is trading at 18.0440, sliding a tiny 0.04%.
The US Fed’s Beige Book showcased that the economy is slowing down
Investors’ mood remained mixed throughout Wednesday’s session. The US Federal Reserve (Fed) revealed the Beige Book, which showed that the economy in the United States (US) is slowing while access to credit is narrowing. Delving into the book, hiring and inflation is slowing, price levels rose moderately, wages increased, and consumer spending “was generally seen as flat to down slightly.”
Given the backdrop, odds for a 25 bps rate hike, shown by the CME FedWatch Tool, remained at 86.7%, for the upcoming meeting, with traders expecting the Fed to stay put. Nevertheless, market players still expect the first rate cut by the November meeting.
Meanwhile, the greenback continued to rise, as shown by the US Dollar Index advancing 0.23%, up at 101.958, underpinned by high US bond yields. The 2-year note is yielding 4.248%, four and a half basis points higher than Tuesday’s close.
Even though some Federal Reserve officials have pushed back against a recession, the Beige Book put it on the table. However, inflation remains high, and before the May meeting, the US central bank would need to digest its preferred measure of inflation, the Core PCE for March.
On Tuesday, two Federal Reserve policymakers commented that inflation remains too high and the labor market too tight, namely St. Louis Fed President James Bullard and Atlanta’s Raphael Bostic. Regarding monetary policy, their views diverged, as Bostic favors one more hike and hold rates put, while Bullard expects an additional 50 bps of tightening to lift rates to the 5.50%-5.75% range.
There are growing speculations on the Mexican side of things that the Bank of Mexico (Banxico’s) may pause the tightening cycle. That has gained adepts as the latest inflation report showed a deceleration, putting Banxico at risk of overtightening conditions.
USD/MXN Technical Analysis
From a technical analysis perspective, the USD/MXN is still downward biased. However, the recent leg-up tested the 20-day Exponential Moving Average (EMA) at 18.1635 but failed to hold its ground and dropped towards the 18.0500 area. That said, the USD/MXN next support would be 18.0000, followed by the YTD low at 147.8968. Conversely, for a reversal, USD/MXN buyers must reclaim the 20-day EMA, with upside risks at the 50-day EMAT at 18.3749. Once cleared, the USD/MXN can rally towards the 100-day EMA At 18.6999.
-
21:18
GBP/USD Price Analysis: Bears are moving in with eyes on 1.2350s
- GBP/USD is meeting resistance near 1.2470 and testing trendline support.
- A break below trendline support opens the 1.2350s.
GBP/USD was last trading at 1.2435, up 0.10% on the day, after moving up from a low of 1.2392 to a high of 1.2474 although is running into resistance as the following technical analysis will illustrate. The hawkish sentiment is coming back into the market which is supporting the US Dollar.
Futures pricing shows an 85.7% chance the Fed will hike rates 25 basis points when policymakers conclude a two-day meeting on May 3, although the likelihood of a rate cut by December has narrowed considerably.
GBP/USD daily chart

The resistance is holding up the price near 1.2550 and again at 1.2470 near a 61.8% Fibonacci retracement level.
GBP/USD H1 chart

The bears are in the market and are testing the short-term trendline support as illustrated above with eyes on the 1.2350s.
-
21:06
Forex Today: Dollar rises modestly amid range-bound markets
Early on Thursday, New Zealand will report Q1 consumer inflation. No change is expected in Chinese benchmark lending rates. The National Australia Bank Business Confidence survey will be released, with consensus expecting a bounce back into positive territory in the first quarter. Japan trade figures are due. RBA Governor Lowe will present the independent review of the central bank.
Here is what you need to know on Thursday, April 20:
A quiet Tuesday was followed by a volatile Wednesday across financial markets, with sharp bounces in currencies and metals. US equities wavered between gains and losses while the US Dollar rose modestly but retreated during the American session.
The US Dollar Index gained 0.25% and settled near 102.00. It continues to move sideways as market participants see more rate hikes in May from the Federal Reserve (Fed), the European Central Bank (ECB) and the Bank of England (BoE). China is expected to keep its benchmark lending rates unchanged on Thursday at 3.65%.
“Economic activity was little changed in recent weeks,” according to the Beige Book. US data due on Thursday includes the weekly Jobless Claims, the Philly Fed and Existing Home Sales.
EUR/USD dropped toward 1.0900 and then bounced to test key short-term resistance at 1.0980. The trend is up, but in the short term, the pair continues to consolidate, awaiting the next catalysts. On Thursday, the European Central Bank will release the minutes of its latest meeting.
The Pound outperformed on Wednesday following inflation data from the United Kingdom, which boosted expectations of another rate hike from the Bank of England in May and potentially in June. The Consumer Price Index came in at 10.1% YoY in March, above the 9.8% of market consensus, while wholesale inflation also showed figures above estimates. As a result, GBP/USD jumped to 1.2473 and then plummeted to sub-1.2400 levels to close the day marginally higher at 1.2440.
USD/JPY peaked above 135.00 and trimmed gains. However, it continues to move to the upside, above key daily moving averages, accompanying US yields. On Thursday, Japan will release trade data.
NZD/USD is flat around 0.6200, supported by the 200-day SMA and capped by 0.6240, the confluence of the 20 and 55 SMAs. New Zealand Q1 inflation data is due on Thursday and will be relevant for expectations regarding the Reserve Bank of New Zealand (RBNZ).
After rising on Tuesday following Canadian CPI data, the Loonie lagged on Wednesday. USD/CAD resumed the upside, climbing above 1.3450 to weekly highs. Bank of Canada (BoC) Governor Macklem offered nothing new in his Parliamentary testimony on Wednesday; he will return on Thursday.
AUD/USD continued to move sideways around 0.6700. Reserve Bank of Australia (RBA) Governor Lowe will hold a press conference to discuss a review of the central bank’s structure; he is not expected to speak about the outlook of monetary policy.
Gold finished lower but far from the daily low; it bottomed at $1,967 and then rebounded to $1,995 amid a retreat of the Dollar. Silver rose more than 2.5% from the bottom, retaking $25.00. Bitcoin erased Tuesday’s gains and tumbled more than 3% to $29,300.
Like this article? Help us with some feedback by answering this survey:
Rate this content -
20:49
USD/JPY Price Analysis: Bulls move in on 135 the figure
- USD/JPY is on the front side of the bullish trend and testing key resistance.
- Bulls eye a break of 135.11 while bears eye 132.80.
USD/JPY rallied by 0.5% on the day and traveled between a low of 133.95 and a high of 135.13. The US Dollar strengthened on Wednesday, lifted by rising Treasury yields with the yield on two-year Treasury notes, which are sensitive to expectations for the US central bank's monetary policy, added hit a one-month high of 4.286%. This is seeing USD/JPY rally towards 135.11 on the front side of the bullish trend as the following illustrates:
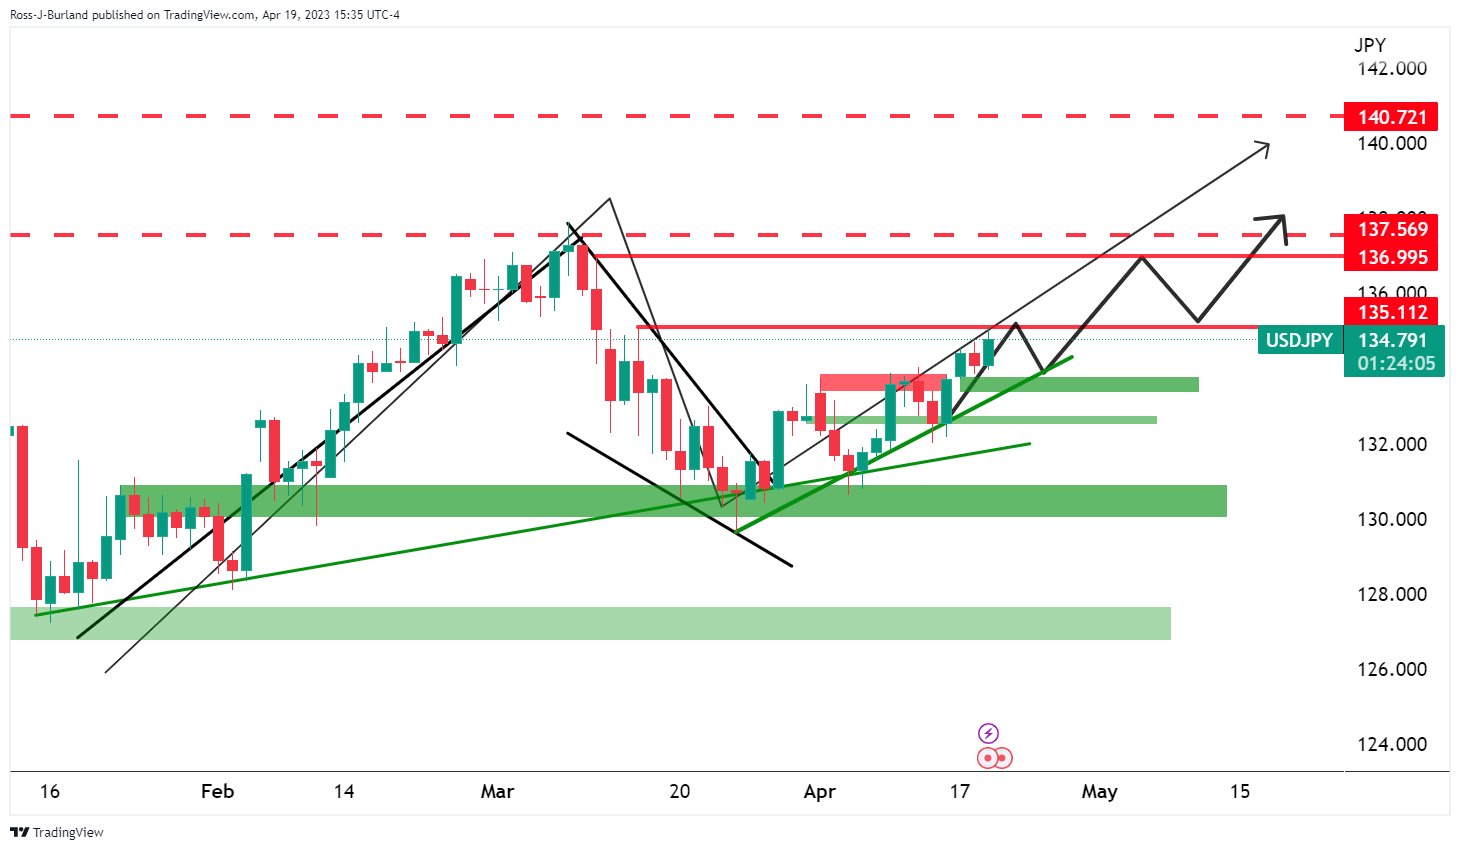
The market has been carving out a bullish bias for the best part of April so far and a break of the 135.11s opens risk to the 137s.
USD/JPY H4 chart
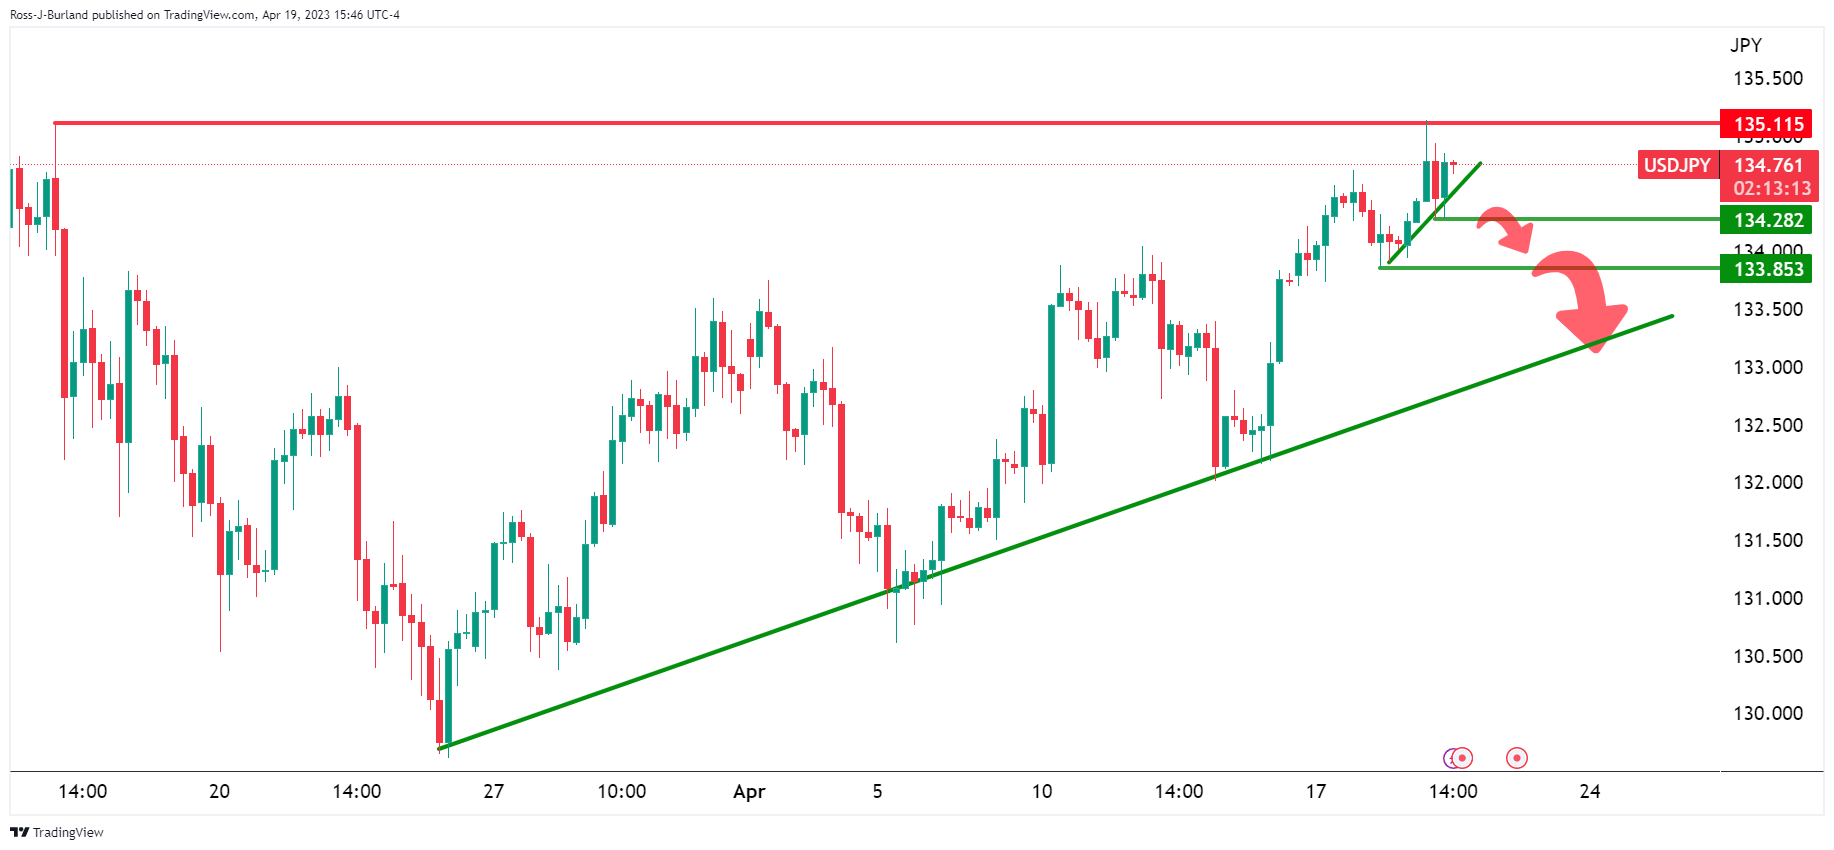
A break below 134.28 and 133.83 opens the risk thereafter towards the 133.20s.
-
20:30
EUR/USD bulls holding in the 1.09s front side of bullish trend
- EUR/USD has found its footing in the daily trendline support.
- Bears eye a break below 1.0910 that will open risk to 1.0830 structure.
EUR/USD is down some 0.16% after falling from a high of 1.0984 and reaching as low as 1.0917 as the US Dollar strengthened on Wednesday, lifted by rising Treasury yields.
Meanwhile, the US Dollar index, DXY, which tracks the currency against a basket of its peers, was up 0.24% but at 101.96 currently, it is off the highs of the day that were printed at 102.228. DXY rallied from a low of 101.656 with investors dialing down on the consensus that the Federal Reserve will cut rates later this year. Consequently, the yield on two-year Treasury notes, which are sensitive to expectations for the US central bank's monetary policy was hitting a one-month high of 4.286% on Wednesday.
Going forward, the Federal Open Market Committee will enter a blackout this weekend ahead of the 2/3 May meeting. The latest guidance is very much in line with market pricing and Atlanta Fed President Bostic said that he favors one more 25bp rate hike and then a pause. Bostic explained that tightening credit conditions could do some of the Fed’s work. ´´The Atlanta Fed has historically been seen, rightly or wrongly, as a barometer of consensus on the FOMC,´´ analysts at ANZ Bank said.
´´ The Atlanta Fed’s GDPNow indicator was little changed following the data at 2.5% saar for the first quarter. The advance estimate of Q1 GDP will be released next week. The early median estimate is for a 0.5% QoQ gain, 2.0% saar,´´ the analysts added.
EUR/USD technical analysis
EUR/USD has found its footing in the daily trendline support and there is a focus on an upside continuation through 1.0990 and beyond 1.1032. However, a break below 1.0910 will open risk to 1.0830 structure.
-
19:49
NZD/USD Price Analysis: Bears eye a continution to 0.6120
- NZD/USD is correcting the bearish impulse with a 50% mean reversion eyed.
- 0.6120 is eyed as the -272% Fibo in this regard while 0.6100 and 0.6080 come as the next levels of interest.
NZD/USD is flat on the day and has traveled between a low of 0.6172 and a high of 0.6225 thus far. Domestically, the Kiwi has been trying to move up amid bets that the Reserve Bank of New Zealand will stay hawkish and deliver a 25bps hike in May or July following the surprise cash rate lift by 50bps to 5.25% in early April. In the minutes of the prior meeting, it was stated that inflation in the nation remained too high, with employment beyond its sustainable level which is supporting the hawkish consensus.
Meanwhile, from a technical standpoint, NZD/USD is embarking on a run to test a 50% mean reversion level of the prior bearish impulse as follows:
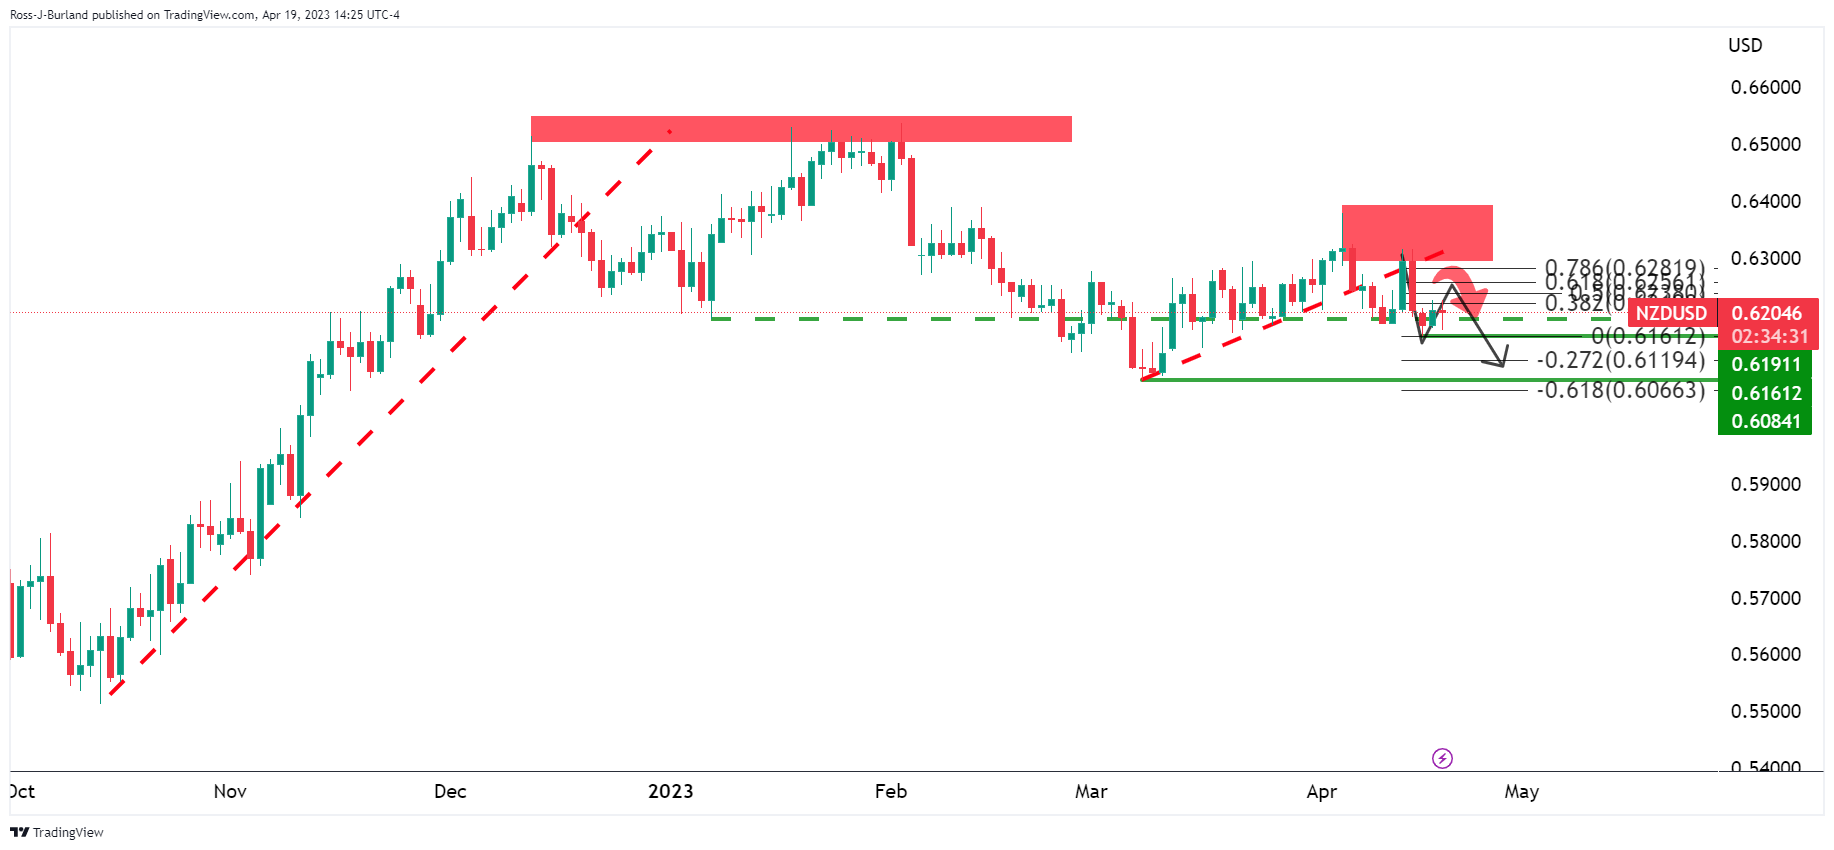
There was a break in structure, however, which opens the prospects of a downside continuation:
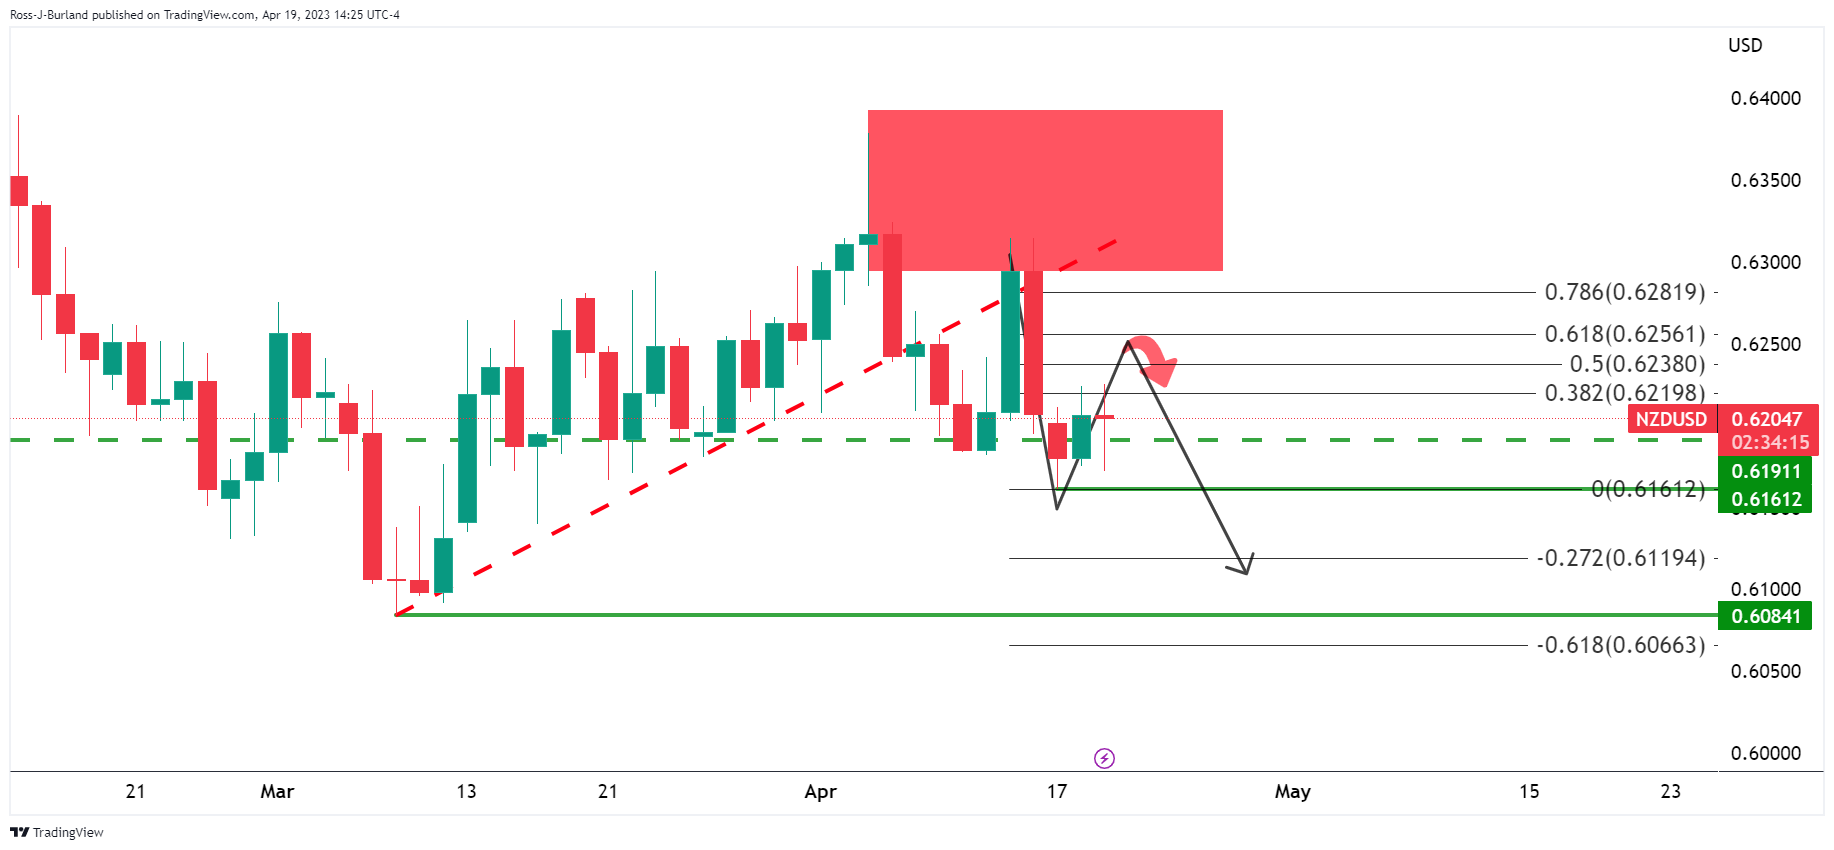
0.6120 is eyed as the -272% Fibo in this regard while 0.6100 and 0.6080 come as the next levels of interest.
-
19:27
WTI slides past the $80.00 barrier as USD strengthens amidst Fed hike concerns
- WTI is falling as the American Dollar remains bolstered by expectations for a Fed hike.
- US EIA’s 600k barrel increase had no impact on WTI price.
- WTI Price Analysis: Downside risks remain below $80.00; otherwise, oil prices will stay sideways.
Western Texas Intermediate (WTI), the US crude oil benchmark, falls as the US Dollar (USD) strengthens due to speculations that the Fed will raise rates as it tries to tackle sticky inflation. Therefore, WTI is trading at $79.65 PB, down more than 1.50%.
The greenback continued to trade higher during the New York session. Federal Reserve hawkish commentary on Tuesday spurred a jump in US Treasury bond yields, which underpinned the US Dollar. Market participants getting ready for a 25 bps rate hike by the Fed pushed the American Dollar (USD) higher, as shown by the US Dollar Index gaining 0.22%, at 101.942.
The CME FedWatch Tool shows odds for a lift toward the 5.00%-5.25% threshold at an 85.4% chance for the Fed’s May meeting.
Consequently, the US 2-year Treasury bond yield, the most sensitive to short-term interest rate adjustments, is up six and a half bps at 4.267%, increasing demand for the US Dollar, thus making dollar-denominated commodities more expensive for foreign buyers.
Another reason for oil’s fall was the latest US Energy Information Administration report. The data revealed an inventory draw of 4.6 million barrels for April 14, a modest increase of 600,000 barrels compared to the last week’s 3.7 million builds.
Aside from this, China, the world’s biggest crude oil importer, reported uneven economic data, indicating a challenging economic recovery after the country dropped its COVID-19 policy.
WTI Technical Analysis
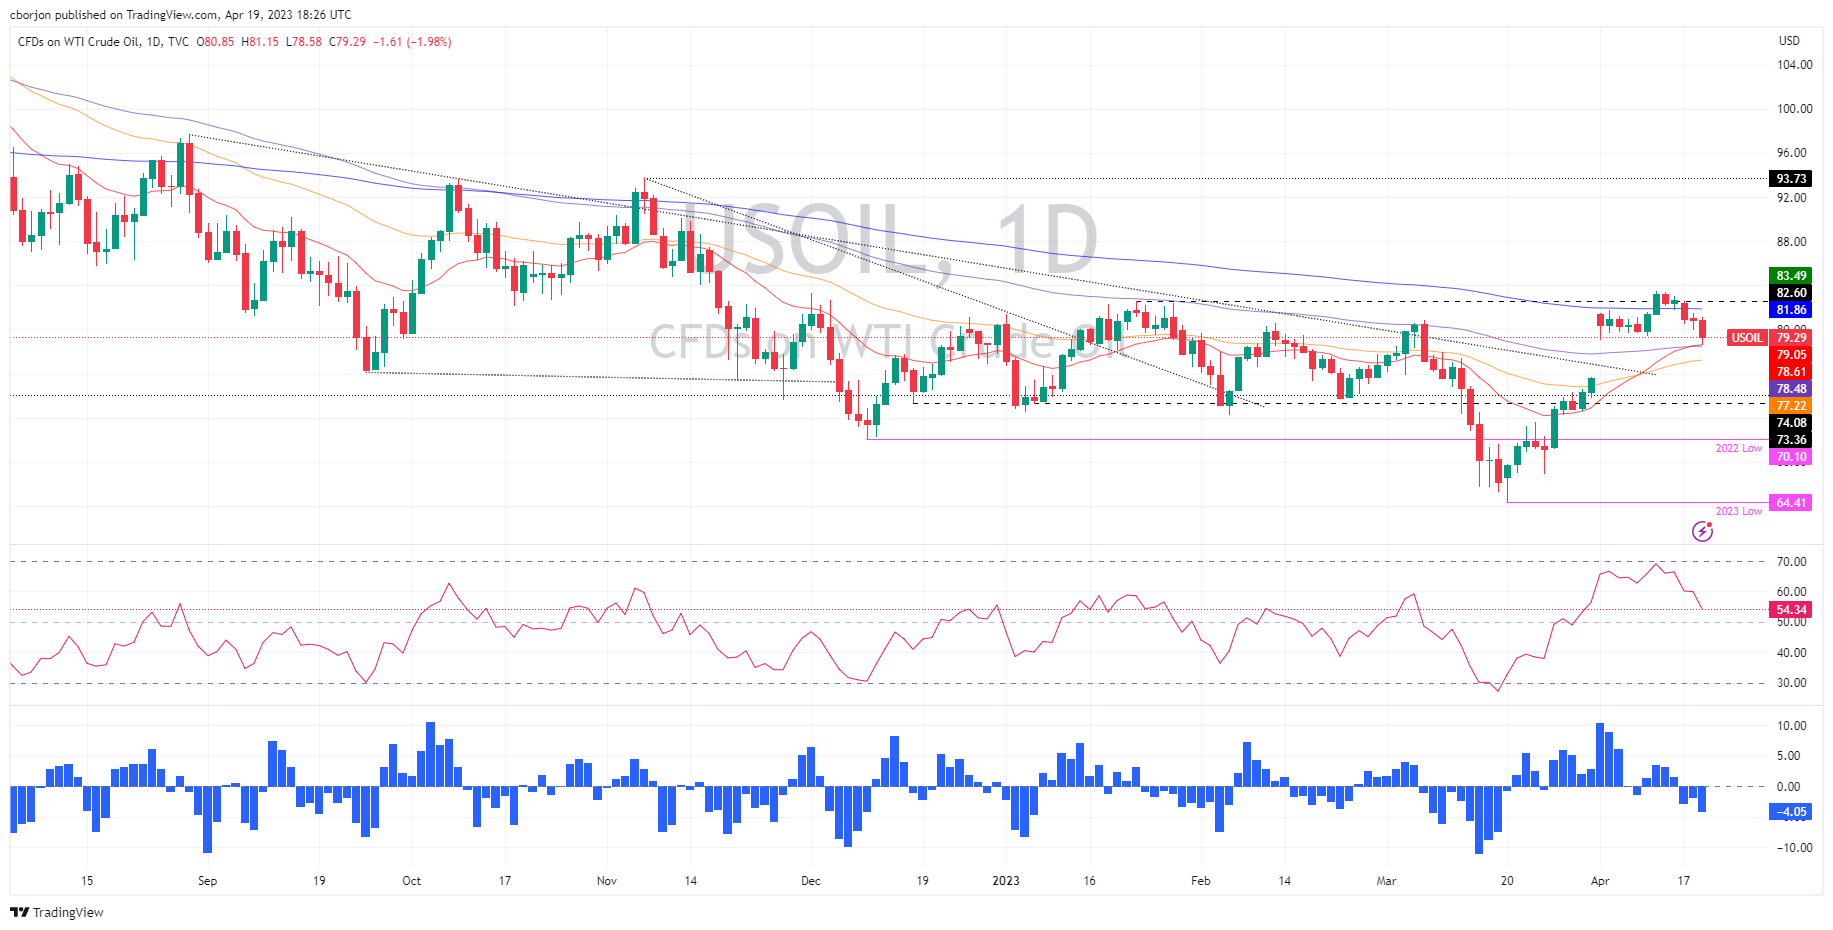
WTI remains neutral to downward biased after trimming some of its gains generated by OPEC’s announcement of cutting its crude oil output by 1 million barrels around the beginning of April. Furthermore, WTI fell below the 200-day Exponential Moving Average (EMA) at $81.86, exacerbating a fall below the $80.00 PB barrier. For a bearish continuation, WTI must crack the $79.00 figure. Once done, the next demand area would be the confluence of the 20 and 100-day, around $78.48/62, followed by the $78.00 barrier. Conversely, WTI’s could continue to trade sideways if bulls reclaim $80.00.
-
19:08
Fed’s Beige Book: Overall economic activity was little changed in recent weeks
According to Federal Reserve’s Beige Book, the overall economic activity was little change in recent weeks. The report includes information collected until April 10 and is the first since the banking crisis. “Lending volumes and loan demand generally declined across consumer and business loan types” and “several Districts noted that banks tightened lending standards amid increased uncertainty and concerns about liquidity.”
The US Dollar remained in positive ground for the day after the Beige Book and US equities continued to waver. The DXY is up by 0.20%, slightly below 102.00.
Key notes:
“Overall economic activity was little changed in recent weeks. Nine Districts reported either no change or only a slight change in activity this period while three indicated modest growth. Expectations for future growth were mostly unchanged as well; however, two Districts saw outlooks deteriorate.”
“Consumer spending was generally seen as flat to down slightly amid continued reports of moderate price growth. Auto sales remained steady overall, with only a couple of Districts reporting improved sales and inventory levels.”
“Manufacturing activity was widely reported as flat or down even as supply chains continued to improve.”
“Lending volumes and loan demand generally declined across consumer and business loan types. Several Districts noted that banks tightened lending standards amid increased uncertainty and concerns about liquidity.”
“Employment growth moderated somewhat this period as several Districts reported a slower pace of growth than in recent Beige Book reports.”
“Wages have shown some moderation but remain elevated.”
“Overall price levels rose moderately during this reporting period, though the rate of price increases appeared to be slowing.”
“Producer prices for finished goods rose modestly this period, albeit at a slightly slower pace.”
“Consumer prices generally increased due to still-elevated demand as well as higher inventory and labor costs. Prices for homes and rents leveled out in most Districts but remained at near record highs.”
-
18:51
AUD/USD: Outlook remains modestly negative – Danske Bank
Analysts at Danske Bank forecast the AUD/USD pair at 0.68 in a month, at 0.68 in three months and at 0.67 in a six months period.
Key quotes:
“The Reserve Bank of Australia (RBA) paused its hiking cycle in March following the banking sector uncertainty. After the strong March employment data, markets now price in around 70% probability of one more hike over the summer, which we consider fair.”
“With the global growth backdrop remaining weak and central banks broadly still on a tightening bias, the outlook for AUD/USD remains modestly negative. If April macro data shows, that the negative impact from the banking sector worries has been limited, then recovering risk sentiment could give the cross a short-term lift. But over the 6-12M horizon, we stick to a downward-sloping forecast profile.”
-
18:50
Bank of England: Recent data cemented the case for a 25 bps hike in May – Standard
Following the latest UK inflation reading, analysts at Standard Chartered see the Bank of England raising the key interest rate by 25 basis points in May.
Key quotes:
“UK labour-market and inflation data released this week have presented upside surprises for Bank of England (BoE) policy makers to reflect on.”
“As the case for another 25bps hike in May has been cemented this week, we adjust our view accordingly; we now see the base rate rising to 4.50% on 11 May, having previously seen rates on hold. We also raise our end-year base rate expectation to 4.50% (4.25%).”
“Beyond May, we see the potential for additional hikes, but we think the MPC will take a meeting-by-meeting approach and decisions will be heavily dependent on how economic data evolve month-to-month.”
“We therefore do not yet subscribe to the market’s current view that another 75bps of hikes are likely by the end of the year.”
-
18:27
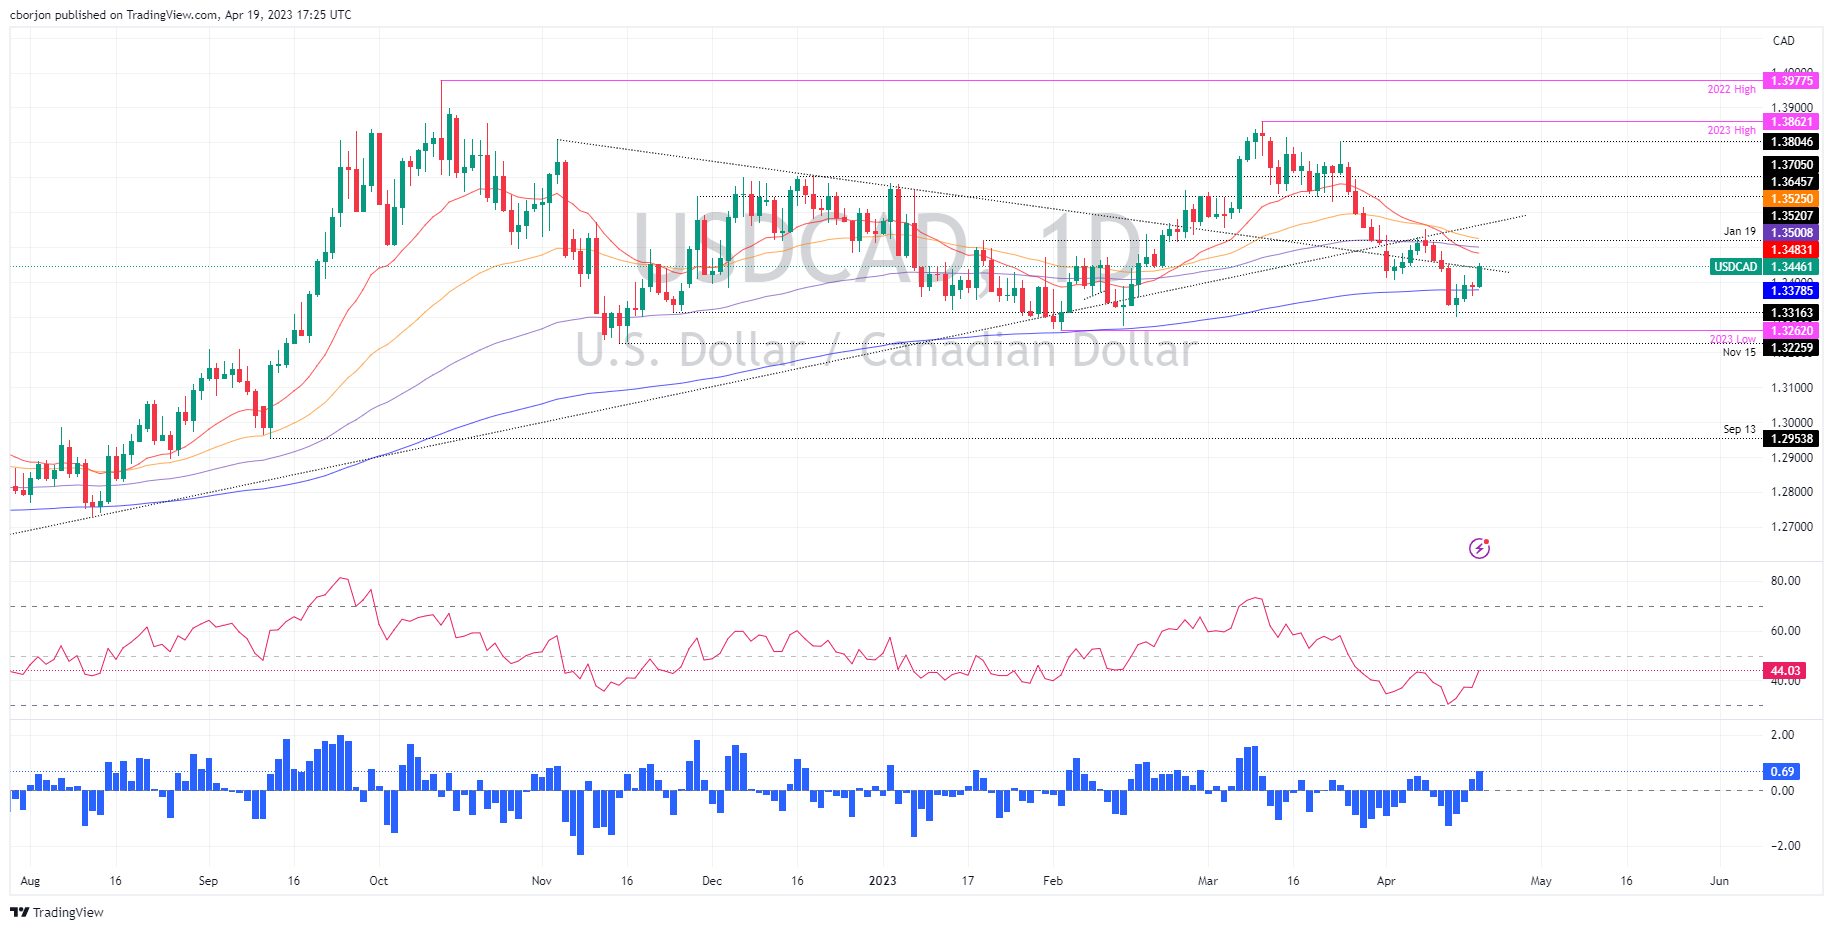
USD/CAD Price Analysis: Bulls pierce multi-month resistance, setting their sights on 1.3500
- USD/CAD climbs, bolstered by elevated US Treasury bond yields, aiming for a daily close above 1.3450.
- The USD/CAD bearish bias will resume below 1.3400, as sellers would eye the 200-DMA.
USD/CAD climbs in the mid-North American session and tests a six-month-old resistance trendline that passes at around 1.3440. Though the USD/CAD bias remains neutral-to-downward biased, it could shift neutral if the pair reclaims the 100-day Exponential Moving Average (EMA). At the time of writing, the USD/CAD is trading at 1.3444 after reaching a low of 1.3384.
USD/CAD Price Action
Given the backdrop, the USD/CAD could continue to rally and test the 20-day EMA at 1.3483 in the near term, which will immediately expose the 100-day EMA at 1.3500. Once that psychological resistance level is cleared, the bias shifts to neutral. A breach of the latter and the USD/CAD can test the 50-day EMA at 1.3525 before aiming for the 1.3600 figure.
Conversely, a USD/CAD bearish resumption will happen if the latest leg-up struggles to crack 1.3450. If that scenario plays out, coupled with the Relative Strength Index (RSI) staying in bearish territory, the USD/CAD could re-test 1.3400, followed by the 200-day EMA at 1.3378. A break below will turn the USD/CAD pair bearish and open the door to test the YTD low at 1.3262.
USD/CAD Daily Chart
-
18:16
Gold Price Forecast: XAU/USD bears move in to test key support
- Gold price sits in the consolidative territory after two-way price action.
- Federal Reserve sentiment is the driving force with eyes on key support.
The Gold price is down some 0.5% on the day, sliding below the $2,000 mark as the US Dollar perks up again. US Treasury yields are moving higher towards a one-month peak, with markets now pricing in an 85% chance of a 25-basis-points rate hike at the Federal Reserve's May 2-3 meeting.
Hawkish tones have crept their way back in this week following, initially, Friday´s comments from Federal Reserve Governor Christopher Waller said that despite a year of aggressive rate increases, the Fed "hasn't made much progress" in returning inflation to their 2% target and argued that rates still need to go up. Today, we have heard from St. Louis Federal Reserve chief James Bullard who said on Tuesday that the Fed should continue raising interest rates as recent data shows inflation remains persistent while the broader economy seems poised to continue growing, even if slowly. There has also been a series of data including hot consumer spending for the past quarter and the April survey of business activity in New York state that was rising for the first time in five months. Consequently to all of this, the US Dollar rose from a low of 101.656 and was reaching a high of 102.228, making the greenback bullion less attractive to overseas buyers as higher rates blunt non-yielding bullion's appeal.
Meanwhile, the Federal Reserve blackout period ´´starts on April 22 before the central bank's May 2-3 meeting. Analysts at Brown Brothers Harriman have explained that WIRP suggests 90% odds of 25 bp hike May 3, up from 70% at the start of last week and 50% at the start of the week before that. After that, odds of a hike June 14 sit near 20%. More importantly, a rate cut by year-end is no longer priced in.´´
As the broad US Dollar creeps higher, analysts at TD Securities explained that ´´the Gold price is flirting with key trigger levels that could catalyze the next round of large-scale algo liquidations, in line with our view of elevated risks of a tactical retreat. A break below the $1,975 range should see CTAs shed -4% of their max size in the yellow metal, with even more substantial liquidations expected below the $1,945 range.´´
Gold price technical analysis
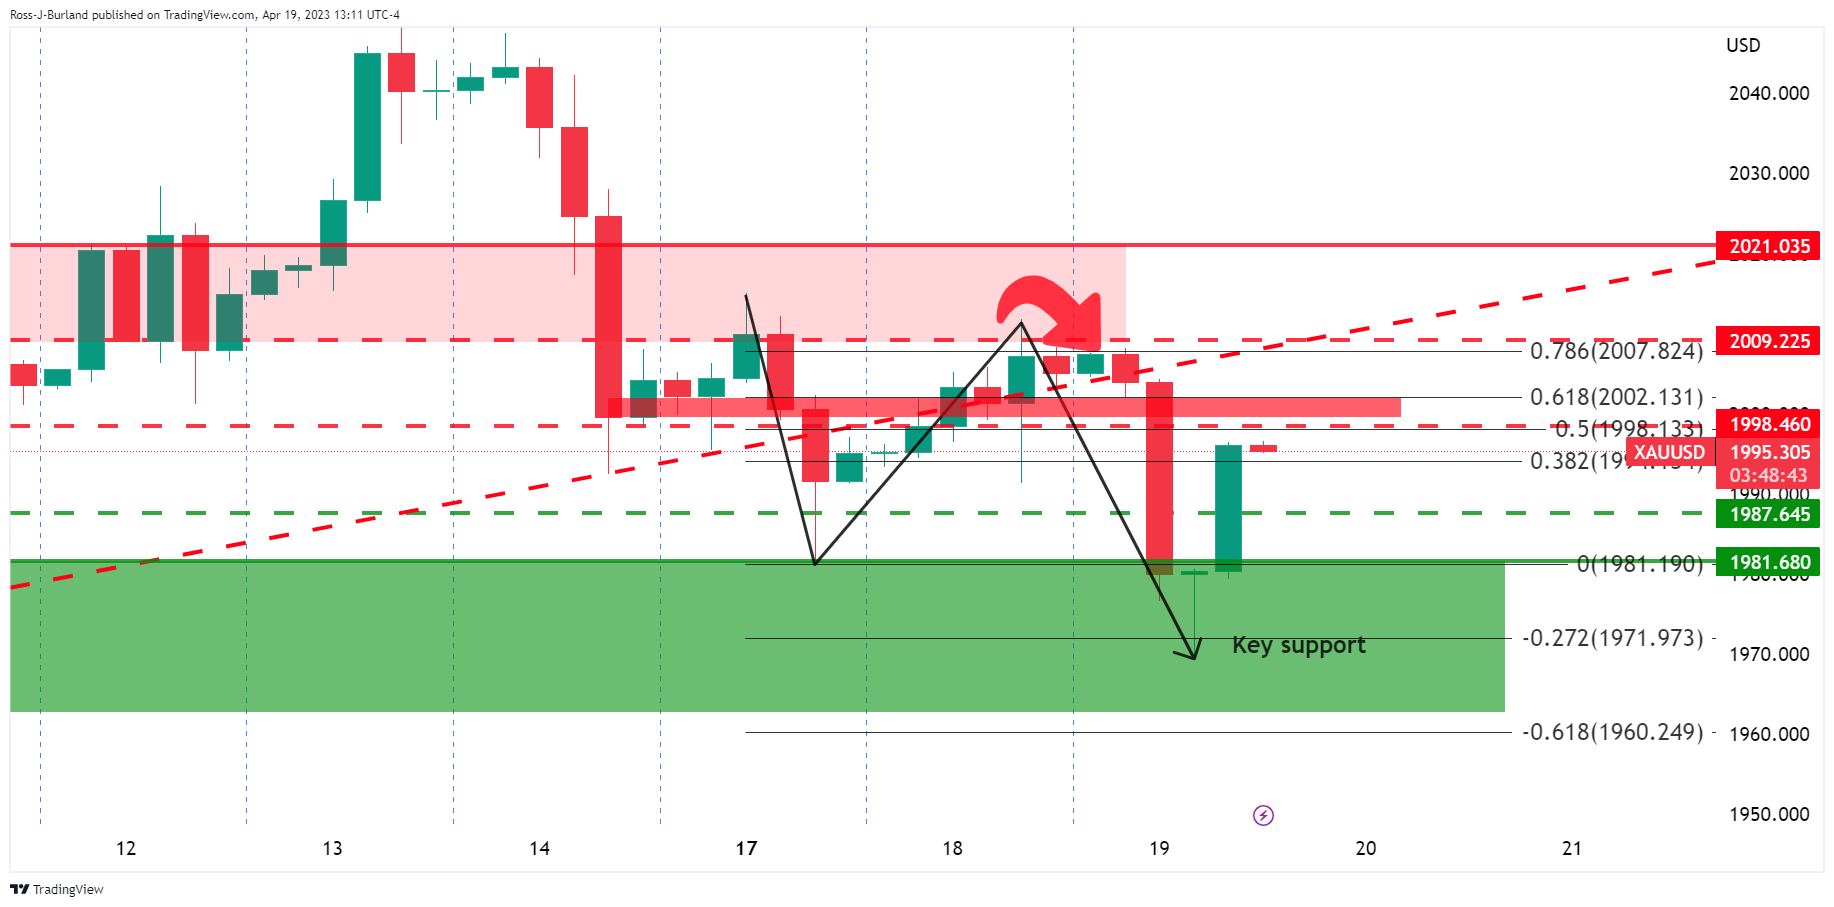
After a bullish correction into the 78.6% Fibonacci, bears guarding $2,000 moved in, and a subsequent downside continuation into key support played out. The price has been firmly rejected from there and a period of consolidation could be on the cards.
-
18:04
USD/CAD to rise above 1.35 amid a stronger USD – Danske Bank
USD/CAD has moved lower over the last month driven by the broad-based setback to the US Dollar and the rebound in oil supporting the Loonie, explained analysts at Danske Bank. They forecast USD/CAD at 1.35 in a one-month period and at 1.37 in six months.
Key quotes:
“We pencil in a higher cross driven both by a rebound in the broad dollar but also on the notion of relative monetary policy. Bank of Canada has turned to an “on-hold”-stance while we expect the Fed to deliver an additional 25bp hike. Also markets price a more aggressive cutting cycle from the Fed in H2 which we think is overdone.”
“While we pencil in broader-based USD strength for the year ahead we also think CAD is in a relatively strong position compared to peers which limits the topside potential in USD/CAD. While the Canadian housing market remains a threat we still think the growth back-drop and the energy-reliance make for a much better cocktail than found in most other asset markets.”
-
18:03
United States 20-Year Bond Auction climbed from previous 3.909% to 3920%
-
17:44
AUD/USD falls from recent highs on risk-off impulse due to Fed tightening estimates
- The US Dollar got bolstered on elevated US T-bond yields as traders brace for a Fed hike in May.
- The Australian Dollar benefits from positive China growth report; RBA’s hawkish minutes.
- AUD/USD Price Analysis: Neutral-downwards, which might test YTD lows below 0.6700.
AUD/USD retreats after testing the 100-day Exponential Moving Average (EMA), due to sentiment shifting sour on expectations that the Federal Reserve (Fed) can continue to tighten monetary conditions. Hence, US Treasury bond yields remain climbing. The AUD/USD is trading at 0.6717 after hitting a high of 0.6741.
Sentiment shifting sour, a tailwind for the US Dollar
The US Dollar (USD) is underpinned by elevated US T-bond yields. Compared to Tuesday’s close, the US 2-year Treasury note is yielding 4.265%, gains six and a half basis points. For the upcoming May meeting, traders expect a 25 bps rate hike, as the CME FedWatch Tool shows, with odds at 82.8%. A slew of Federal Reserve officials pushed back against a possible recession in the United States (US) and commented that inflation remains hot and the labor market is too tight. However, they diverged on the peak for the Federal Funds Rate.
Regarding monetary policy, Bostic favors one more hike and a pause, while Bullard expects an additional 50 bps of tightening to lift rates to the 5.50%-5.75% range.
Meanwhile, the US Dollar Index (DXY), a measure of the buck’s value against its peers, climbs 0.22%, at 101.941.
On the Australian front, a light economic calendar kept AUD/USD traders leaning on recent data. The latest growth report about China’s economy maintained the Australian Dollar (AUD) from falling further against the US Dollar. The RBA’s latest monetary policy minutes also revealed that the board discussed a 25 bps rate hike, but rates were held steady at 3.60%. Notably, the minutes indicated concerns about high inflation and a tight labor market, leaving the possibility of further tightening on the table.
AUD/USD Technical Analysis
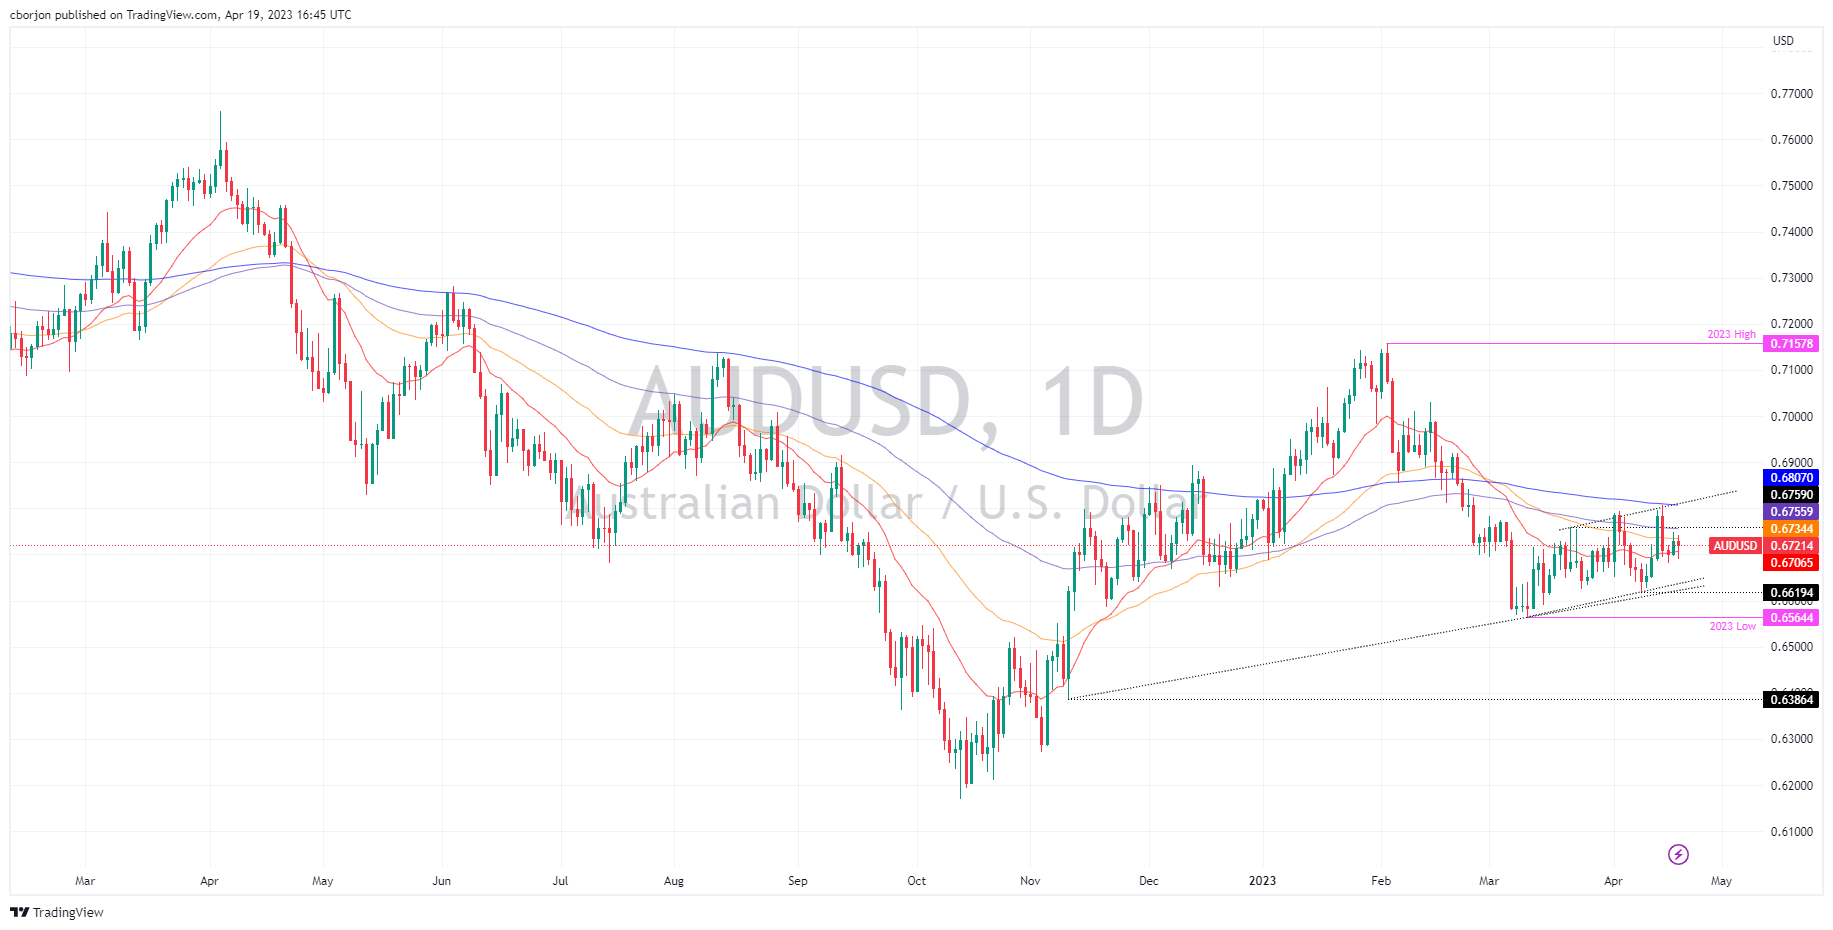
Even though the AUD/USD fall was capped at the 20-day EMA at 0.6706, the pair remains neutral to downward biased. For a bullish resumption, the AUD/USD must break the 50-day EMA at 0.6734, which will pave the way toward the 100-day EMA at 0.6756. Break above, and the 0.6800 psychological level would be up for grabs. On the other hand, if AUD/USD drops below 0.6700, expect a bearish continuation. The first support to be tested would be the weekly low of 0.6681, followed by a one-and-a-half-month upslope support trendline at 0.6630. Break below, and 0.6600 will be next.
-
17:11
GBP/USD holds in bullish grounds with BoE sentiment dominating
- GBP/USD is consolidating the UK data-driven spike.
- US Dollar is firming up as yields rally, Fed and BoE in focus.
GBP/USD is up 0.13% at the time of writing and has traveled between a low of 1.2392 and 1.2475 while data today confirmed that Britain has the highest inflation in Western Europe, solidifying the consensus that the Bank of England's meeting in May will result in a rate hike.
Data on Wednesday showed consumer prices rose by an annual 10.1%, the Office for National Statistics said, down from 10.4% in February but higher than the 9.8% forecast by economists polled by Reuters.
´´For the second month in a row, headline UK CPI inflation has failed to match the consensus expectation of a below 10% YoY reading. As in various other G10 economies the UK core rate is showing signs of stickiness, remaining in line with the previous month’s rate at 6.2% YoY and only slightly below the rates registered in the final months of last year,´´ analysts at Rabobank explained. ´´Indeed, there has been very little change in the value of core UK CPI inflation over the past 12 months.´´
Looking back to yesterday, data showed British wages rose faster than anticipated last month, further supporting more hikes by the BoE. In this regard, the market is currently pricing in a 99% chance of a 25 bp rate hike from the Bank of England at its next meeting.
However, the greenback has tamed the rally due to rising Treasury yields. The US Dollar index, which tracks the currency against a basket of its peers, was up 0.24% as markets turn more skeptical that the Federal Reserve will cut rates later this year. The yield on the two-year Treasury notes which are sensitive to Fed expectations has run to a high of 4.286%.
´´ Indeed, based on our view that further bouts of USD strength are likely this year, we see risk of dips to GBP/USD1.20,´´ analysts at Rabobank said.
-
17:00
Russia Producer Price Index (YoY) down to -10.7% in March from previous -7.5%
-
17:00
Russia Producer Price Index (MoM) increased to 2.6% in March from previous 0.9%
-
16:22
EUR/USD slides on US bond yield strength despite higher core inflation in the EU
- EUR/USD retraces, pressured by Fed’s hawkish comments and risk-off mood.
- US T-bond yield edge higher, bolstering the US Dollar.
- EU’s core inflation remains stickier, which could spur a reaction by the ECB.
EUR/USD creeps lower in the mid-North American session as the financial markets are in a risk-off mode, expecting the next round of data that could rock the boat and give a clear direction to the pair. Inflation data in the Eurozone (EU) maintained the Euro (EUR) afloat, but high US Treasury bond yields cap the pair from reaching 1.1000. At the time of writing, the EUR/USD is trading at 1.0954, below its opening price by 0.15%.
EUR/USD turns negative as sentiment deteriorates
Wall Street is trading with losses. US Treasury bond yields continued to edge higher, with the 2-year, the most sensitive to shifts in monetary policy, up six bps at 4.267%. The CME FedWatch Tool shows a chance of 84% for a 25 bps rate hike by the Fed at the upcoming May meeting, weighing on investors’ mood. The latest round of US Federal Reserve (Fed) officials led by St. Louis Fed President James Bullard and Atlanta’s Raphael Bostic commented that inflation is too high, the labor market too tight, and the economy is solid. Both said that a recession is not their base case scenario.
Regarding monetary policy, Bostic favors one more hike and a pause, while Bullard expects an additional 50 bps of tightening to lift rates to the 5.50%-5.75% range.
In the meantime, the US Dollar Index (DXY), which measures the performance of six currencies against the American Dollar (USD), roses 0.17%, at 101.881. Of note, the DXY has tested the 20-day EMA at 102.21 three times, meaning that demand has not been as strong to clear the latter, which could open the way toward 102.900.
On the EU front, March’s inflation in the bloc edged from 8.5% to 6.9% YoY as energy prices continued their downtrend. However, core inflation remains stubbornly stickier, following the global trend. The Core Harmonised Index of Consumer Prices (HICP) rose by 5.7% YoY, unchanged from the latest reading and the consensus, as European Central Bank (ECB) policymakers worried that high energy costs passed to the broader economy.
Given the backdrop, the EUR/USD could re-test the 1.1000 figure in the near term. ECB policymakers remained hawkish, as the Chief Economist Philip Lane commented that their baseline is to increase rates by 25 or 50 bps, which would depend on data.
EUR/USD Technical Analysis
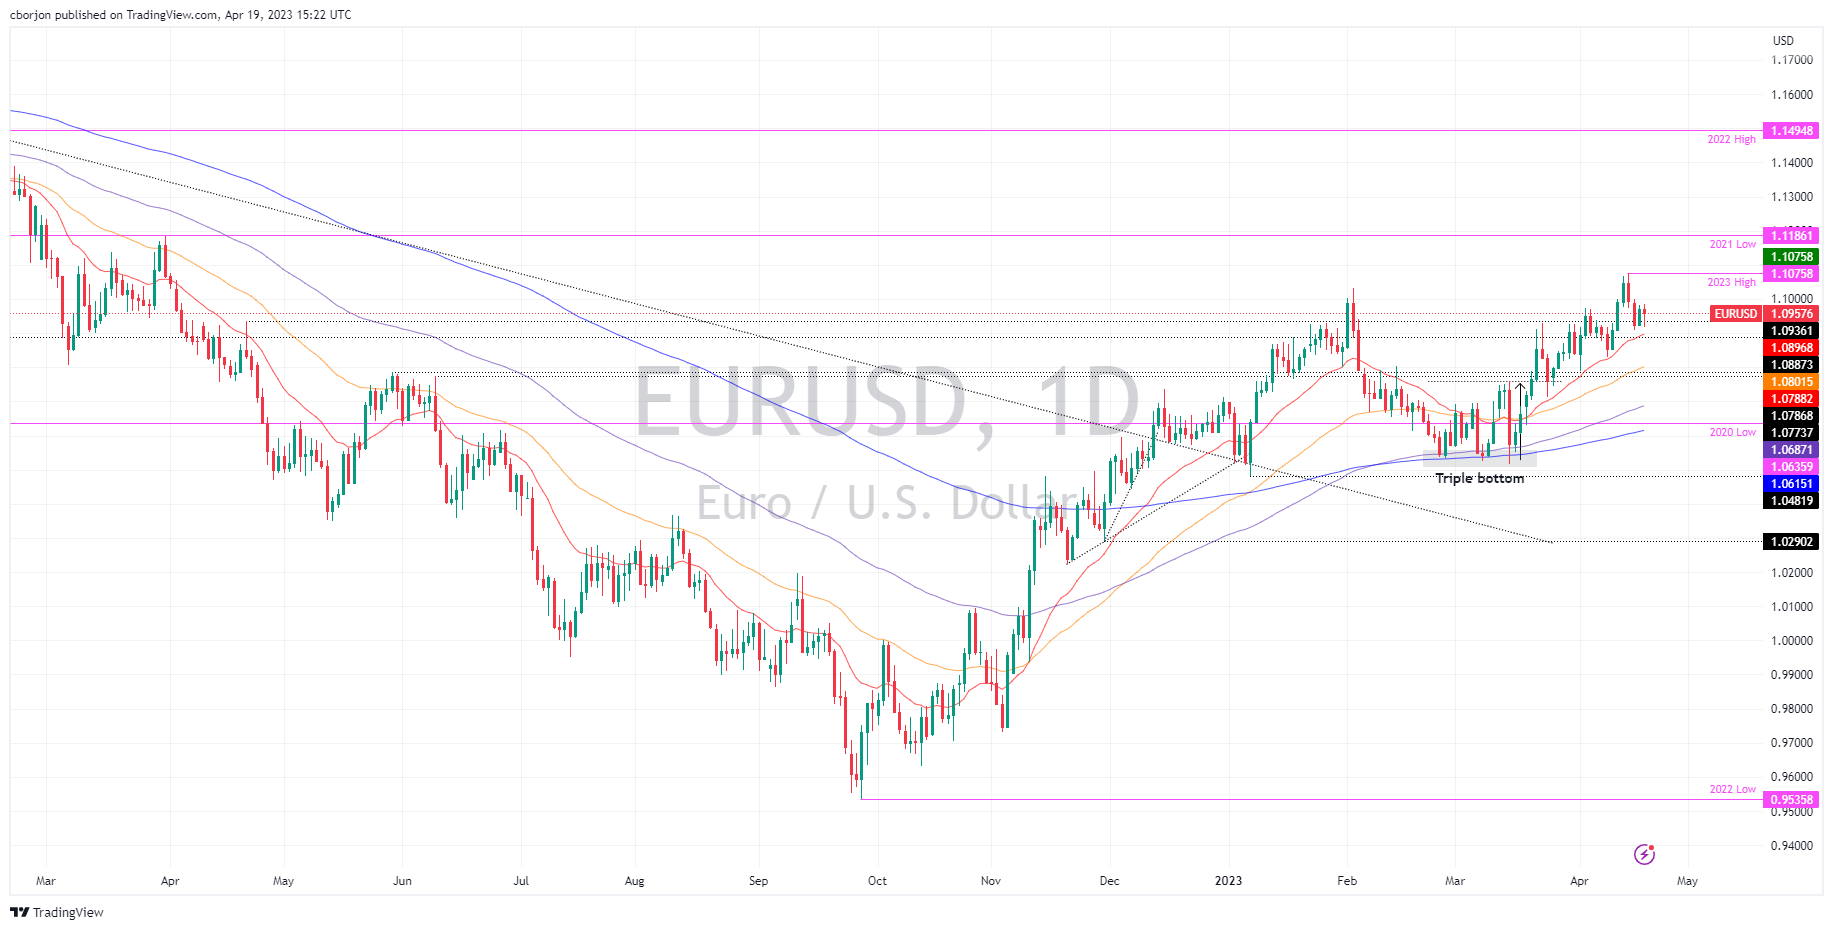
From a daily chart perspective, the EUR/USD remains supported by the 20-day EMA from March 20 until today. As of writing, the 20-day EMA sits at 1.0896, and once the EUR/USD pair edged toward the moving average, it jumped and recorded a new cycle high. Should this be the case, the 1.1100 is up for grabs, but EUR buyers must reclaim the YTD high at 1.1075. Conversely, a fall below 1.0900 will expose the 20-day EMA at 1.0896. If EUR/USD drops below the latter, a dive to 1.0800 is on the cards.
-
15:48
USD/JPY seems fundamentally overvalued – Danske Bank
Analysts at Danske Bank see the USD/JPY as overvalued and expected it to drop to 127.00 in a three-month period.
Key quotes:
“USD/JPY seems fundamentally overvalued, and together with our base case of monetary policy tightening during summer; we expect the cross to drop to 127 in 3M. In the near-term, however, we could see some topside risks to the cross on the back of a relatively hawkish Fed and a dovish BoJ.”
“A rally in global commodity prices is an upside risk to the USD/JPY, as Japan is a net energy importer. Generally, upward moves in US yields for whatever reason continue to be a tailwind for the USD/JPY.”
-
15:43
EUR/GBP to remain range bound around 0.8800 – Danske
The EUR/GBP pair dropped momentarily below 0.8800 on Wednesday after higher-than-expected inflation data from the United Kingdom. Analysts at Danske Bank see the cross hovering around 0.8800 over the next months, limited by opposing forces.
Key quotes:
“The past month, EUR/GBP has returned to trading above the 0.88 mark after systemic risk fears have broadly subsided. Further out, EUR/GBP is, in our view, stuck between opposing forces. On the one hand, we expect relative rates and near-term broad EUR optimism to act as a tailwind for the cross."
“On the other hand, we see the global growth slowdown and the relative appeal of UK assets acts as a headwind. At present, we do not see the relative growth outlook or global investment environment to create significant divergence between EUR and GBP. We thus expect the cross to remain range bound around 0.88.”
“The key risk to seeing EUR/GBP substantially above our projection is a sharp sell-off in risk where capital inflows dry out and liquidity becomes scares. Other risks are the outlook for the UK economy deteriorating sharply compared to the Euro Area.”
-
15:30
United States EIA Crude Oil Stocks Change below forecasts (-1.088M) in April 14: Actual (-4.581M)
-
14:53
Silver Price Analysis: XAG/USD erases 2.20% loss and turns positive
- Sharp bounce in metals, boosted by a reversal of the US Dollar.
- XAG/USD bottomed at $24.63, lowest in two weeks, and is at $25.20.
- Next resistance for Silver is seen around $25.20/25.
Silver reversed sharply rising 2.50% from the daily low. XAG/USD has turned positive and is testing daily highs near the $25.20/25 area. Just one hour ago, the price bottomed at $24.63, the lowest since April 6.
The rally in metals is gaining speed even as US yields rise and despite a negative opening in Wall Street. A decline of the US Dollar helped the intraday reversal in metals.
Gold also rose sharply during the last hours, gaining more than $20. XAU/USD is still down for the day, but off lows and back above $1,990/oz.
Testing again $25.20/25
After the jump, XAG/USD tests a key short-term resistance around $25.20/25 again. A consolidation above would point to more gains, initially targeting the $25.60 zone. On the flip side, now $25.00 is again a support level. The downside seems limited as long as Silver stays above $24.75. A consolidation below should trigger more losses, with the next support at $24.20.
XAG/USD 4-hour chart
-
14:38
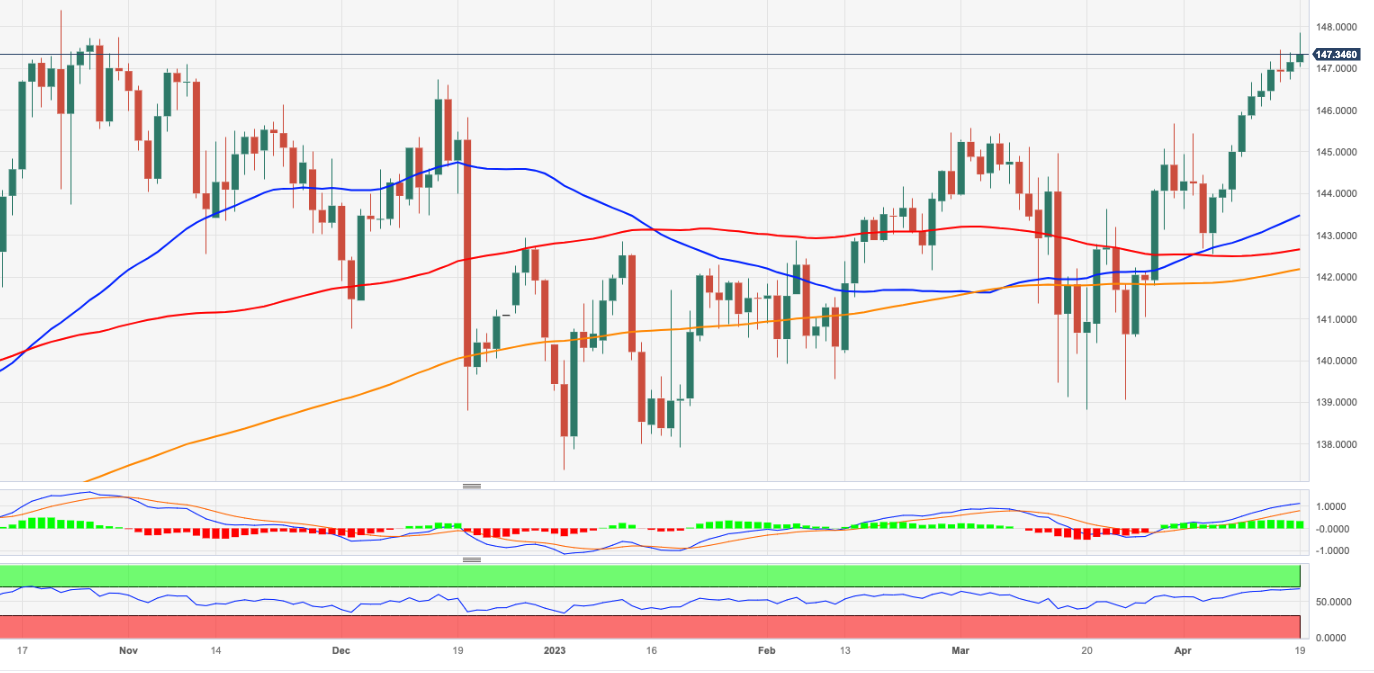
USD/JPY retreats from tops above 135.00, remains firm on dollar, yields
- USD/JPY climbs to multi-week highs beyond 135.00.
- Higher US yields, USD-buying bolster the upside in the pair.
- The Fed’s Beige Book comes next in the US docket.
USD/JPY resumes the monthly rebound and advances to new highs past the 135.00 mark on Wednesday.
USD/JPY up on dollar, yields
USD/JPY sets aside Tuesday’s retracement and clinches new multi-week tops in the area north of 135.00 the figure on the back of the ongoing bounce in the greenback and further upside in US yields across the curve.
Indeed, the USD Index (DXY) trades close to the 102.00 region, while yields extend the upside to levels last seen in mid-March. In Japan, the JGBP 10-year yields remain side-lined below the ley 0.50% region.
Earlier in the Asian trading hours, Industrial Production in Japan contracted at an annualized 0.5% in February, while the Reuters Tankan Index held steady at -3 in April. In the US, MBA Mortgage Applications shrank 8.8% in the week to April 14 ahead of the release of the Fed’s Beige Book later in the NA session.
USD/JPY levels to consider
As of writing the pair is gaining 0.17% at 134.31 and the break above 135.13 (monthly high April 19) would expose 137.09 (200-day SMA) and then 137.91 (2023 high March 8). On the flip side, the initial support emerges at 133.37 (55-day SMA) seconded by 130.62 (monthly low April 5) and finally 129.63 (monthly low March 24).
-
13:30
Canada Raw Material Price Index came in at -1.7% below forecasts (0%) in March
-
13:30
Canada Industrial Product Price (MoM) came in at 0.1%, below expectations (1.6%) in March
-
13:29
EUR/USD Price Analysis: The 1.0900 region holds the downside so far
- EUR/USD erodes Tuesday’s gains and revisits the 1.0920/15 band.
- There is still decent contention around the 1.0900 neighbourhood.
EUR/USD extends the choppy performance this week in line with the rest of the global markets.
Further consolidation should not be ruled out for the time being. The breakout of this theme exposes a probable move to 1.1000 ahead of the 2023 high at 1.1075 (April 14). On the downside, the 1.0900 zone emerges as quite a decent contention so far.
Looking at the longer run, the constructive view remains unchanged while above the 200-day SMA, today at 1.0382.
EUR/USD daily chart
-
13:16
Canada Housing Starts s.a (YoY) registered at 214K, below expectations (237.8K) in March
-
13:14
Dollar firm as yields rise ahead of Beige Book – BBH
Analysts at BBH, in their latest note, maintain a bullish outlook for the US Dollar (USD) amid a further rise in the US Treasury bond yields ahead of the Fed Beige Book, due for release later during the US session this Wednesday.
Key quotes:
“DXY is trading higher just above 102 as rising U.S. yields lend some support. Break above 102.036 sets up a test of the April 10 high near 102.807.”
“The 2-year yield traded near 4.28% today, the highest since March 15. While it is well off the 3.55% low from March 24, it is still well below the March 8 high near 5.08%. Elsewhere, the 10-year yield traded near 3.63% today, the highest since March 22. Similarly, it is well off the 3.25% low from April 6 but it is still well below the March 2 high near 4.09%. As markets normalize and Fed rate cuts get priced out, U.S. yields should continue to edge higher. In turn, this should help the dollar.”
“Since the March 21-22 meeting, the data suggest that activity is slowing, the labor market is softening, and price pressures are easing. Notably, supply chains continue to improve. We believe the Beige Book will highlight these trends that could support a pause after what is widely expected to be another 25 bp hike. However, we believe it will also leave the door open for further tightening if needed. Between the May 2-3 and June 13-14 meetings, the Fed will have digested two more job reports, two CPI/PPI reports, and one retail sales report. At this point, a pause in June might just be the most likely outcome but it really will depend on how all that data come in. Goolsbee and Williams speak today.”
-
13:00
Brazil Industrial Output (MoM) came in at -0.2% below forecasts (-0.1%) in February
-
13:00
Brazil Industrial Output (YoY) registered at -2.4%, below expectations (-1.9%) in February
-
12:58
UK wage and inflation data justify more hikes – TDS
According to analysts at TD Securities (TDS), the stronger UK wage growth data released on Wednesday, along with Thursday's stronger UK CPI report, support prospects for more rate hikes by the Bank of England.
Key quotes:
“This week's strong wage and CPI data show that underlying inflation pressures are more persistent than previously expected.”
“We revise our expected path for Bank Rate, and expect a final 25bps hike in June, bringing the BoE's terminal rate to 4.75% (was 4.50%).”
“Strong inflation data continues to weigh on GBP rates. We believe the hawkish price action supports entering longs in GBP on a cross-market basis.”
-
12:54
Indonesia: BI keeps rates unchanged, as expected – UOB
UOB Group’s Economist Enrico Tanuwidjaja and Junior Economist Agus Santoso comment on the latest interest rate decision by the Bank Indonesia (BI).
Key Takeaways
“Bank Indonesia (BI) kept its benchmark policy rate (7-Day Reverse Repo) unchanged at 5.75% in Apr’s MPC meeting, in line with consensus expectation.”
“BI remains of the view that inflation expectations are anchored and lower than previous expectations, and that rupiah stability will continue. Specifically, BI expects that headline and core inflation rates have returned to BI's target range of 2-4% from its highest levels in Sep last year.”
“In line with IMF forecast, outlook for Indonesia’s economy and financial markets and rupiah stability has improved. We are keeping BI rate to stay at current level of 5.75%, with the possibility of a 25bps rate cut in early 2024.”
-
12:51
Gold Price Forecast: XAU/USD plummets to over two-week low amid resurgent US Dollar demand
- Gold price meets with heavy supply on Wednesday and dives to over a two-week low.
- Rising US bond yields boost the US Dollar and contribute to the steep intraday slide.
- A weaker risk tone fails to impress bulls or lend support to the safe-haven XAU/USD.
Gold price comes under intense selling pressure on Wednesday and tumbles to over a two-week low during the mid-European session. The XAU/USD is currently placed near the $1,970 area, down around 1.75% for the day, and seems poised to extend its recent pullback from over a one-year high touched last week.
Resurgent US Dollar demand weighs heavily on Gold price
The US Dollar (USD) makes a solid comeback following the previous day's modest decline and climbs back closer to the weekly high, which, in turn, is seen weighing heavily on Gold price. The messages from Federal Reserve (Fed) officials have been very hawkish lately, supporting prospects for further policy tightening by the US central bank. Fed Governor Christopher Waller said on Friday that a year of aggressive rate hikes "haven't made much progress" in returning inflation to their 2% target and the central bank still needs to move rates higher.
Bets for more rate hikes by Federal Reserve contribute to the fall
Adding to this, St. Louis Fed President James Bullard, during an interview on Tuesday, backed the case for additional 75 basis points of tightening versus market expectations for one more 25 bp hike next month and the potential for cuts later this year. Adding to this, impressive bank earnings eased fears about a full-blown banking crisis that unfolded in March following the collapse of Silicon Valley Bank. Moreover, the incoming macro data from the United States (US) pointed to a resilient economy and fueled concerns that the Fed may have more work to do.
The risk-off mood fails to lend any support to the safe-haven XAU/USD
Expectations that the US central bank will continue raising interest rates remain supportive of the recent rally in the US Treasury bond yields. In fact, the benchmark 10-year US government bond and the rate-sensitive two-year Treasury note jumps to a near one-month high, lifting the USD away from a one-year low set last week. This further contributes to driving flows away from the non-yielding Gold price. Bulls, meanwhile, seem rather unaffected by a generally weaker tone around the equity markets, which tends to benefit traditional safe-haven assets, including the XAU/USD.
The global risk sentiment takes a hit amid growing fears about economic headwinds stemming from rising borrowing costs. This, to a larger extent, overshadows stronger-than-expected Chinese economic growth figures released on Tuesday, which eased fears about a deeper global economic downturn, and tempers investors' appetite for perceived riskier assets. This, however, fails to lend any support to Gold price, suggesting that the path of least resistance for the metal is to the downside and validating the near-term bearish outlook.
Traders now eye Fed’s Beige Book for some impetus
In the absence of any relevant market-moving economic data from the US on Wednesday, investors will focus on the release of the Fed’s Beige Book for the central bank’s take on the state of the US economy. This, along with the US bond yields, will influence the USD and provide some impetus to the Gold price. Traders will further take cues from the broader risk sentiment to grab short-term opportunities ahead of speeches by FOMC members - Chicago Fed President Austan Goolsbee, Fed Governors Christopher Waller and Lisa Cook - on Thursday.
Gold price technical outlook
From a technical perspective, a sustained break below the $1,980 horizontal support could be seen as a fresh trigger for bearish traders. Moreover, oscillators on the daily chart have just started drifting in the negative territory and support prospects for an extension of the ongoing downfall. Hence, a subsequent slide towards testing the next relevant support near the $1,956-$1,955 area, en route to the monthly low around the $1,950 region, looks like a distinct possibility.
On the flip side, attempted recovery back above the $1,980 support breakpoint might now confront stiff resistance near the $2,000 psychological mark. This is followed by the $2,010 barrier, which if cleared decisively might negate the negative outlook and prompt some short-covering move. The Gold price might then aim to surpass the $2,020 intermediate hurdle and climb back to the $2,040 horizontal resistance en route to the YTD peak, around the $2,047-$2,049 region.
Key levels to watch
-
12:29
US Dollar regathers strength on rising US Treasury bond yields
- US Dollar has regained its traction following Tuesday’s decline.
- The sharp increase seen in US Treasury bond yields provides a boost to USD.
- USD could continue to find demand with investors moving away from risk-sensitive assets.
The US Dollar (USD) has managed to shake off the selling pressure mid-week after having weakened against its major rivals on Tuesday. In the absence of high-impact macroeconomic data releases from the United States (US), rising US Treasury bond yields seem to be helping the USD outperform its major rivals. Furthermore, the USD, as a safe-haven asset, further benefits from the souring market mood.
The US Dollar Index, which tracks the USD performance against a basket of six major currencies, advanced beyond 102.00 and retraced Tuesday’s pullback.
Daily digest market movers: US Dollar capitalizes on rising US yields
- Stronger-than-expected Consumer Price Index (CPI) data from the UK revived fears over sticky global inflation and triggered a rally in global bond yields.
- The benchmark 10-year US Treasury bond yield turned north early Wednesday and climbed to its highest level in nearly a month above 3.6%.
- Wall Street’s main indexes closed virtually unchanged on Tuesday. US stock index futures trade in negative territory ahead of the opening bell on Wednesday.
- St. Louis Federal Reserve President James Bullard told Reuters on Tuesday that interest rates will need to continue to rise in the absence of clear progress on inflation. Bullard further noted that he is still seeing the "adequately restrictive policy rate" at 5.50%-5.75% range and added that is biased to hold rates there for longer until inflation is contained.
- Housing Starts in the US declined by 0.8% on a monthly basis in March following February's increase of 7.3% (revised from 9.8%). In the same period, Building Permits decreased by 8.8%, compared to the market expectation of +1.45%.
- The data from China showed on Tuesday that the world’s second-largest economy expanded by an annualized rate of 4.5% in the first quarter, much stronger than the 2.9% growth recorded in the last quarter of 2022. This reading also came in better than analysts' estimate for an expansion of 4%. Other data revealed that Industrial Production expanded by 3.9% and Retail Sales rose by 10.6% on a yearly basis, compared to analysts' estimate of 7.4%.
- On Wednesday, the Fed will release the Beige Book. Existing Home Sales and Initial Jobless Claims data will be featured in the US economic docket on Thursday ahead of S&P Global’s Manufacturing and Services PMI surveys on Friday.
- Previewing the Fed’s publication, “since the March 21-22 meeting, the data suggest that activity is slowing, the labor market is softening, and price pressures are easing,” said analysts at BBH. “Notably, supply chains continue to improve. We believe the Beige Book will highlight these trends that support a pause after what is widely expected to be another 25 bps hike whilst leaving the door open for further tightening if needed.”
- Richmond Fed President Thomas Barkin said on Monday that he wants to see more evidence of inflation settling back to target.
- The data published by the US Census Bureau revealed on Friday that Retail Sales declined by 1% on a monthly basis in March. On a positive note, March’s reading of -0.4% got revised higher to -0.2%.
- The University of Michigan’s (UoM) Consumer Confidence Index edged higher to 63.5 in April’s flash estimate from 62 in March.
- The one-year consumer inflation expectation component of the UoM’s survey climbed to 4.6% from 3.6% in March, providing a boost to the USD.
- "Monetary policy will need to remain tight for a substantial period and longer than markets anticipate,” Federal Reserve Governor Christopher Waller said on Friday. Waller further argued that the recent data show that the Fed hasn't made much progress on its inflation goal.
- In an interview with Reuters on Friday, Atlanta Fed President Raphael Bostic noted that recent developments in the US economy were consistent with one more rate hike.
- According to the CME Group’s FedWatch Tool, markets are currently pricing in a more-than-80% probability of a 25 basis points (bps) Fed rate hike in May.
Technical analysis: US Dollar Index eyes an extended rebound
The US Dollar Index trades near the 20-day Simple Moving Average (SMA) currently located at 102.20. In case the DXY closes the day above that level, it could target 103.00 (static level, psychological level) and 103.50 (50-day SMA, 100-day SMA).
Meanwhile, the Relative Strength Index (RSI) indicator on the daily chart stays near 50, suggesting that sellers refrain from committing to further USD weakness.
On the downside, 101.50 (static level) align as interim support ahead of 101.00/100.80 (psychological level, static level, multi-month low set on April 14). A daily close below that support area could open the door for an extended slide toward 100.00 (psychological level).
How does Fed’s policy impact US Dollar?
The US Federal Reserve (Fed) has two mandates: maximum employment and price stability. The Fed uses interest rates as the primary tool to reach its goals but has to find the right balance. If the Fed is concerned about inflation, it tightens its policy by raising the interest rate to increase the cost of borrowing and encourage saving. In that scenario, the US Dollar (USD) is likely to gain value due to decreasing money supply. On the other hand, the Fed could decide to loosen its policy via rate cuts if it’s concerned about a rising unemployment rate due to a slowdown in economic activity. Lower interest rates are likely to lead to a growth in investment and allow companies to hire more people. In that case, the USD is expected to lose value.
The Fed also uses quantitative tightening (QT) or quantitative easing (QE) to adjust the size of its balance sheet and steer the economy in the desired direction. QE refers to the Fed buying assets, such as government bonds, in the open market to spur growth and QT is exactly the opposite. QE is widely seen as a USD-negative central bank policy action and vice versa.
-
12:14
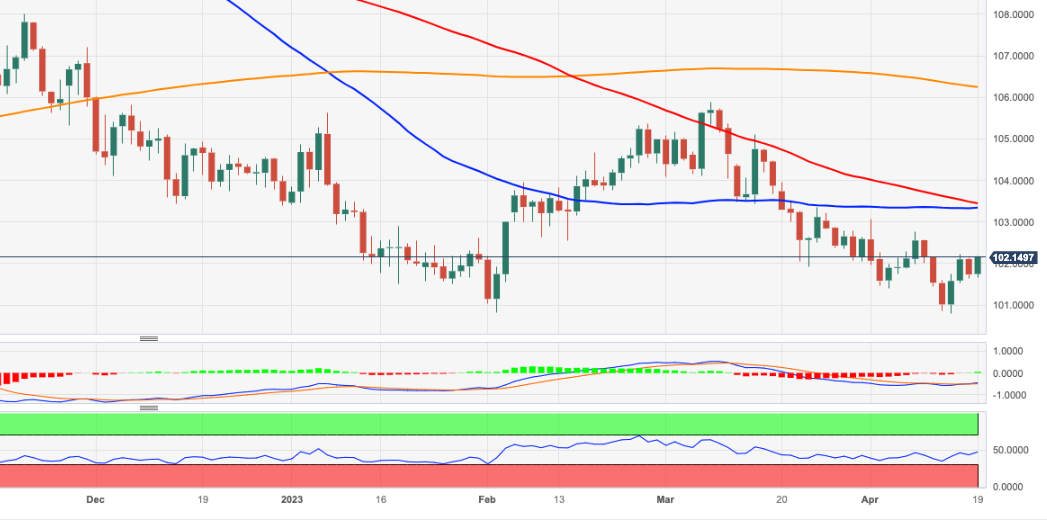
USD Index Price Analysis: Further range bound appears in store near term
- DXY regains the upside and advances past the 102.00 yardstick.
- Extra consolidation around 102.00 seems likely in the short term.
DXY fades Tuesday’s downtick and reclaims the area above the 102.00 mark on Wednesday.
The index so far keeps the erratic performance this week. The resumption of the uptrend should face initial hurdle at the April high just above 103.00 (April 3), while bouts of weakness remain underpinned by the sub-101.00 region.
Looking at the broader picture, while below the 200-day SMA, today at 106.27, the outlook for the index is expected to remain negative.
DXY daily chart
-
12:02
China: GDP could expand more than expected this year – UOB
UOB Group’s Economist Ho Woei Chen assesses the latest GDP figures in China.
Key Takeaways
“China’s economy rebounded by a stronger-than-expected pace in 1Q23 following the lifting of its Covid-19 restrictions. The key beneficiary of China’s reopening was the services sector while manufacturing sector was weighed by softer external demand even as the reopening improved the logistics and activities in the supply chains.”
“China’s Mar economic data was mixed with industrial production (IP) and fixed asset investment (FAI) below expectations while retail sales surged and the labour market solidified its gains.”
“Taking into consideration of the latest data and factoring in further stabilisation in the property market, we think China’s full-year 2023 GDP growth could now potentially come in stronger at 5.6% (previous forecast 5.2%) compared to the official target of 5.0%.”
“The recovery in China’s economy meant that there is less need for the People’s Bank of China (PBOC) to further ease monetary policy despite the muted inflation. However, another RRR reduction later this year cannot be ruled out should credit expansion shows signs of a sharper slowdown.”
-
12:00
South Africa Retail Sales (YoY) below expectations (-0.3%) in February: Actual (-0.5%)
-
12:00
United States MBA Mortgage Applications down to -8.8% in April 14 from previous 5.3%
-
11:27
New Zealand CPI inflation is expected to rise to 1.7% in Q1 – TDS
Strategists at TD Securities (TDS) offer a brief preview of the upcoming release of the quarterly consumer inflation figures from New Zealand, due during the Asian session on Thursday.
Key quotes:
“We expect Q1'23 CPI inflation to rise to 1.7% q/q (Q4'22: 1.4%), slightly below the RBNZ's 1.8% q/q forecast but above market consensus at 1.6% q/q. This translates to an annual forecast of 7.1% y/y in between cons +7.0% and RBNZ at 7.3%. We see upside risks to our forecasts from higher food prices and homebuilding costs following weather related incidents.”
“For Q1, housing costs and food are likely to be the major drivers of inflation while the annual increase in tobacco excise is another contributor. Lower fuel prices should help to provide some offset though this is likely to be a temporary relief given the recent OPEC production cuts. Overall, our forecasts suggest that inflation is too persistently high for the RBNZ's liking and warrants another 25bps hike at the May meeting, bringing the OCR to a terminal rate of 5.5%.”
-
11:27
EUR/JPY Price Analysis: Strong momentum points to extra gains
- EUR/JPY clinches fresh tops near the 148.00 mark
- Immediately to the upside emerges the 2022 high at 148.40.
EUR/JPY adds to Tuesday’s advance and approaches the key 148.00 region on Wednesday.
Considering the ongoing price action, further gains in the cross remain in store for the time being. That said, the continuation of the upside momentum could extend further and challenge the 2022 peak at 148.40 (October 21) sooner rather than later.
So far, further upside looks favoured while the cross trades above the 200-day SMA, today at 142.16.
EUR/JPY daily chart
-
11:18
Silver Price Analysis: XAG/USD slides further below $25.00, bears flirt with 23.6% Fibo.
- Silver dives to a nearly two-week low on Wednesday and tests the 23.6% Fibo. level support.
- Weakness below the 200-period SMA on the 4-hour charts will pave the way for further losses.
- A sustained move back above the $25.20-$5.25 region will negate any near-term negative bias.
Silver comes under heavy selling following the previous day's modest bounce and drops to a one-and-half-week low during the first half of the European session on Wednesday. The white metal currently trades around the $24.70 area and flirts with the 23.6% Fibonacci retracement level of the recent rally from the YTD low - levels just below the $20.00 psychological mark touched in March.
The Relative Strength Index (RSI) on the 1-hour chart, meanwhile, is already flashing oversold conditions and is on the verge of breaking below the 30 mark on the 4-hour chart. Hence, any subsequent slide is more likely to find some support near the 100-period Simple Moving Average (SMA) on the 4-hour chart, which if broken decisively will be seen as a fresh trigger for bearish traders.
This, in turn, will set the stage for an extension of the recent pullback from a one-year high, around the $26.10 area touched last week. The XAG/USD might then fall to the $24.40-$24.30 strong horizontal resistance breakpoint, now turned support, before eventually dropping below the $24.00 mark, towards testing the next relevant support near the 38.2% Fibo. level, around the $23.75 area.
On the flip side, the $25.00 psychological mark seems to act as an immediate hurdle ahead of the $25.20-$25.25 supply zone. A sustained strength beyond will suggest that the corrective decline has run its course and lift the XAG/USD further towards the $25.80-$25.85 resistance en route to the $26.00 mark. Some follow-through buying will mark a fresh bullish breakout and pave the way for further gains.
Silver 4-hour chart
Key levels to watch
-
11:13
Portugal Current Account Balance fell from previous €0.286B to €-0.064B in February
-
10:39
Germany 10-y Bond Auction: 2.51% vs 2.32%
-
10:31
USD/CAD climbs to multi-day peak amid tumbling Oil prices, resurgent USD demand
- A combination of supporting factors lifts USD/CAD to a four-day high on Wednesday.
- Tumbling Oil prices undermines the Loonie and acts as a tailwind amid a stronger USD.
- Acceptance above the 200-day SMA supports prospects for additional intraday gains.
The USD/CAD pair catches fresh bids on Wednesday and climbs to a four-day high, around the 1.3425 region during the first half of the European session. Spot prices, for now, seem to have found acceptance above a technically significant 200-day Simple Moving Average (SMA) and draw support from a combination of factors.
A combination of factors weighs heavily on the Canadian Dollar, which, along with a modest US Dollar (USD) uptick act as a tailwind for the USD/CAD pair. Despite falling US inventories and strong Chinese economic data, Oil prices dive to a fresh monthly low amid worries that rising borrowing costs will slow economic growth and dampen fuel demand. Apart from this, signs of cooling consumer inflation in Canada undermine the commodity-linked Lonie.
The USD, on the other hand, draws support from a further rise in the US Treasury bond yields, bolstered by the prospects for further policy tightening by the Federal Reserve (Fed). In fact, the markets have nearly fully priced in a 25 bps lift-off in May and the Fed funds futures indicate a small chance of another rate hike in June. This, in turn, pushes the yield on the benchmark 10-year US government bond and the rate-sensitive two-year Treasury note to a multi-week high.
The latest leg up, meanwhile, confirms a breakout through the 200-day SMA, which, along with the aforementioned supportive
fundamental backdrop suggests that the path of least resistance for the USD/CAD pair is to the upside. In the absence of any relevant market-moving economic data on Wednesday, either from the US or Canada, investors will focus on the release of the Fed’s Beige Book, due later during the US session, for the central bank’s take on the state of the US economy.This, along with the US bond yields, will drive the USD demand and provide some impetus to the USD/CAD pair. Traders will further take cues from the official US Crude inventory report by the Energy Information Administration (EIA), which should influence Oil price dynamics and contribute to producing short-term opportunities around the major.
Technical levels to watch
-
10:00
European Monetary Union Construction Output w.d.a (YoY) registered at 2.3%, below expectations (2.4%) in February
-
10:00
European Monetary Union Harmonized Index of Consumer Prices (MoM) meets forecasts (0.9%) in March
-
10:00
European Monetary Union Harmonized Index of Consumer Prices (YoY) in line with expectations (6.9%) in March
-
10:00
European Monetary Union Core Harmonized Index of Consumer Prices (MoM) registered at 1.3% above expectations (1.2%) in March
-
10:00
European Monetary Union Core Harmonized Index of Consumer Prices (YoY) in line with expectations (5.7%) in March
-
10:00
European Monetary Union Construction Output s.a (MoM) came in at 2.3%, above forecasts (0%) in February
-
09:59
Indonesia: Trade surplus shrank in March – UOB
Economist at UOB Group Enrico Tanuwidjaja and Junior Economist Agus Santoso review the latest trade balance figures in Indonesia.
Key Takeaways
“Trade surplus in Mar narrowed significantly to USD2.9bn from USD5.5bn in Feb and USD4.5bn in previous year. Cumulatively in 1Q23, trade surplus recorded a growth of 31.3% y/y to USD12.3bn from the same period last year of USD9.3bn.”
“Oil and gas (OG) exports contracted by 4.8% y/y from 19.3% in Feb, following non-oil and gas (non-OG) exports which declined by double digits since its lowest level in 2020 due to lockdowns in most countries.”
“OG imports contracted by 13.7% y/y lower than previous month's contraction of 17.1%, while non-OG imports contracted by 4.9% in Mar, larger than Feb’s contraction at 1.6%, driven by decline in consumer goods and raw materials."
-
09:45
GBP/USD sticks to stronger UK CPI-led gains, modest USD strength caps the upside
- GBP/USD turns positive for the second straight day and touches a fresh weekly high on Wednesday.
- The stronger UK CPI print lifts bets for a 25 bps BoE rate hike in May and boosts the British Pound.
- Rising US bond yields help revive the USD demand and keep a lid on any further gains for the major.
The GBP/USD pair reverses an early European session dip to the 1.2400 mark and turns positive for the second successive day on Wednesday. Spot prices, however, retreat a few pips from a fresh weekly high touched in the last hour and currently trade near the mid-1.2400s, still up around 0.20% for the day.
The British Pound strengthens across the board following the release of stronger UK consumer inflation figures and turns out to be a key factor pushing the GBP/USD pair higher. In fact, the UK Office for National Statistics (ONS) reported that the headline UK CPI eased less than expected, to the 10.1% YoY rate in March from 10.4% in the previous month. Furthermore, the Core CPI, which excludes volatile food and energy items, held steady at 6.2% YoY during the reported month against expectations for a slide to 6.0%.
The stubbornly high inflation comes on the back of the stronger UK wage growth data on Tuesday and should keep pressure on the Bank of England (BoE) to raise interest rates further. In fact, the markets now see over a 90% chance of a 25-bps rate hike in May, which, in turn, is seen benefitting the Sterling Pound. That said, the emergence of some US Dollar (USD) buying is holding back traders from placing aggressive bullish bets around the GBP/USD pair and keeping a lid on any further gains, at least for the time being.
The messages from several Federal Reserve (Fed) policymakers have been very hawkish lately and support prospects for further tightening by the US central bank. This allows the US Treasury bond yields to prolong the recent upward trajectory and touch a fresh multi-week high, which, in turn, helps revive the USD demand. Apart from this, a generally weaker tone around the equity markets further seems to benefit the Greenback's relative safe-haven status and contributes to capping the upside for the GBP/USD pair.
In the absence of any relevant market-moving economic data from the US on Wednesday, investors will focus on the release of the Fed’s Beige Book, due later during the US session, for the central bank’s take on the state of the US economy. This, along with the US bond yields and the broader risk sentiment, will influence the USD and provide some impetus to the GBP/USD pair. Nevertheless, the aforementioned mixed fundamental backdrop warrants some caution before placing aggressive directional bets.
Technical levels to watch
-
09:32
SNB's Maechler: March rate hike serves to only slow inflation towards 2% mark
Swiss National Bank (SNB) policymaker, Andréa Maechler, said on Wednesday, “March rate hike serves to only slow inflation towards the 2% mark.”
Additional quotes
“Swiss inflation is slowing but still a worry.”
“We are ready to sell foreign currencies.”
Market reaction
USD/CHF was last seen trading at 0.8976, up 0.15% on the day, supported by the rebound in the US Dollar across the board.
-
09:30
United Kingdom DCLG House Price Index (YoY) came in at 5.5% below forecasts (9.3%) in February
-
09:00
European Monetary Union Current Account n.s.a dipped from previous €28.9B to €21.27B in February
-
09:00
South Africa Consumer Price Index (MoM) above expectations (0.9%) in March: Actual (1%)
-
09:00
South Africa Consumer Price Index (YoY) came in at 7.1%, above forecasts (6.9%) in March
-
09:00
European Monetary Union Current Account s.a above expectations (€6.7B) in February: Actual (€24.32B)
-
08:51
AUD/USD lacks firm intraday direction, flat-lines above 0.6700 amid modest USD strength
- AUD/USD lacks any firm intraday direction on Wednesday, albeit the downside seems cushioned.
- Rising US bond yields help revive the USD demand and seem to act as a headwind for the major.
- The optimism over Chinese economic recovery lends some support to the Aussie and limits losses.
The AUD/USD pair struggles to capitalize on the previous day's positive move and seesaws between tepid gains/minor losses through the early European session. The pair is currently placed just above the 0.6700 round-figure mark, nearly unchanged for the day, and remains below a technically significant 200-day Simple Moving Average (SMA).
A combination of factors assists the US Dollar (USD) to attract some intraday buying, which, in turn, is acting as a headwind for the AUD/USD pair. Speculations that the Federal Reserve (Fed) will continue raising interest rates remain supportive of the recent rally in the US Treasury bond yields. In fact, the yield on the benchmark 10-year US government bond and the rate-sensitive two-year US Treasury note climb to over a four-week high. This, along with a generally weaker tone around the equity markets, helps revive demand for the safe-haven Greenback and contributes to capping the upside for the perceived riskier Aussie.
That said, the uncertainty over the Fed's rate-hike path holds back the USD bulls from placing aggressive bets and lends some support to the AUD/USD pair. It is worth mentioning that several Fed officials called for more hikes and the markets have nearly priced in a 25 bps lift-off in May. The Fed funds futures, however, indicate only a small chance of another rate hike in June. Apart from this, a lower probability of a recession in Australia, along with the hawkish tone from the Reserve Bank of Australia's (RBA) April meeting minutes and the upbeat China macro data, should limit the downside for the Australian Dollar.
The aforementioned mixed fundamental backdrop, meanwhile, warrants caution for aggressive traders and before positioning for a firm near-term direction for the AUD/USD pair. In the absence of any relevant market-moving economic data from the US on Wednesday, investors will focus on the release of the Fed’s Beige Book, due later during the US session, for the central bank’s take on the state of the US economy. This, along with the US bond yields and the broader risk sentiment, should influence the USD price dynamics and allow traders to grab short-term opportunities around the AUD/USD pair.
Technical levels to watch
-
08:50
Euro continues to feel the pressure, 1.1000 remains just out of reach
- Euro trades lower versus US Dollar as Federal Reserve rate hike bets solidify.
- Strong US banking results, persistent inflation and Fed commentary suggest at least another hike in May.
- Upside for Euro dependent on April inflation data and ECB Bank Lending Survey.
The Euro (EUR) trades at 1.0960 against the US Dollar (USD) during the early European session on Wednesday. The pair has pulled back slightly from the recent April 14 highs of 1.1075 as the US Dollar recovered on bets the Federal Reserve (Fed) will continue raising interest rates.
From a technical perspective the pair is broadly in a medium-term uptrend which is biased to extend.
EUR/USD Market Movers
- USD gains a boost from St. Louis Fed President James Bullard’s comments that the Fed should continue raising rates due to persistent inflation and overblown recession fears.
- Unexpectedly strong first quarter earnings from the likes of JP Morgan and Bank of America indicate resilience in the crisis-hit US banking sector, further supporting the Greenback.
- Data showing a sharp rise in inflation expectations in Friday’s Michigan Consumer Confidence Survey resuscitate the inflation narrative.
- Recent US employment data continues to show a strong labor market further putting pay to recession fears.
- Euro remains supported by expectations that the ECB will continue with interest rate hikes, though their size will be data-dependent.
- European Central Bank’s chief economist Philip Lane has said the health of the region’s banks, as reported in the ECB Bank Lending Survey (BLS), will be a key determinant of whether the ECB hikes aggressively or not.
- Lane is scheduled to deliver a speech at 10:35 GMT on Wednesday – sees April HICP inflation as also key to outlook on rates.
- From the US, the main data release is the Fed’s Beige Book out at 18:00 GMT.
EUR/USD technical analysis: Uptrend intact and likely to extend
EUR/USD is in a medium-term uptrend since recovering from the September 2022 lows and the established trend is expected to continue. After a pullback in February 2023, EUR/USD recouped its losses during March and made new year-to-date highs above 1.10 on April 13.
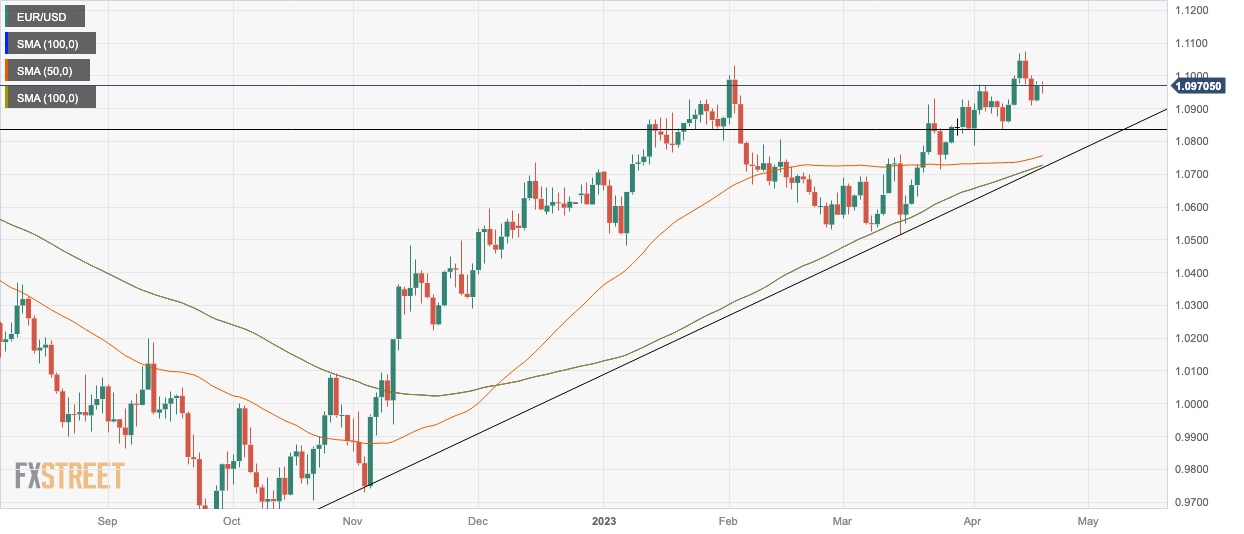
EUR/USD: Daily Chart
During this week the pair has pulled back down into the mid 1.09s, however, where it currently trades at the time of writing. Given the strength of the overall uptrend, however, it is expected to recover and continue extending higher.A break and daily close above the 1.1075 year-to-date highs of April 14 would provide bulls with fresh confidence to push higher and the pair could rise up to the next target at around 1.1190 where the 200-week Simple Moving Average (SMA) is situated and likely to provide pushback.
A break and close below the lower high at 1.0830, on the other hand, would bring into the question the strength and validity of the uptrend and could see losses extend down to a confluence of support at 1.0750.
Euro F.A.Q.
What is the Euro?
The Euro is the currency for the 20 European Union countries that belong to the Eurozone. It is the second most heavily traded currency in the world behind the US Dollar. In 2022, it accounted for 31% of all foreign exchange transactions, with an average daily turnover of over $2.2 trillion a day.
EUR/USD is the most heavily traded currency pair in the world, accounting for an estimated 30% off all transactions, followed by EUR/JPY (4%), EUR/GBP (3%) and EUR/AUD (2%).What is the ECB and how does it impact the Euro?
The European Central Bank (ECB) in Frankfurt, Germany, is the reserve bank for the Eurozone. The ECB sets interest rates and manages monetary policy.
The ECB’s primary mandate is to maintain price stability, which means either controlling inflation or stimulating growth. Its primary tool is the raising or lowering of interest rates. Relatively high interest rates – or the expectation of higher rates – will usually benefit the Euro and vice versa.
The ECB Governing Council makes monetary policy decisions at meetings held eight times a year. Decisions are made by heads of the Eurozone national banks and six permanent members, including the President of the ECB, Christine Lagarde.How does inflation data impact the value of the Euro?
Eurozone inflation data, measured by the Harmonized Index of Consumer Prices (HICP), is an important econometric for the Euro. If inflation rises more than expected, especially if above the ECB’s 2% target, it obliges the ECB to raise interest rates to bring it back under control.
Relatively high interest rates compared to its counterparts will usually benefit the Euro, as it makes the region more attractive as a place for global investors to park their money.How does economic data influence the value of the Euro?
Data releases gauge the health of the economy and can impact on the Euro. Indicators such as GDP, Manufacturing and Services PMIs, employment, and consumer sentiment surveys can all influence the direction of the single currency.
A strong economy is good for the Euro. Not only does it attract more foreign investment but it may encourage the ECB to put up interest rates, which will directly strengthen the Euro. Otherwise, if economic data is weak, the Euro is likely to fall.
Economic data for the four largest economies in the euro area (Germany, France, Italy and Spain) are especially significant, as they account for 75% of the Eurozone’s economy.How does the Trade Balance impact the Euro?
Another significant data release for the Euro is the Trade Balance. This indicator measures the difference between what a country earns from its exports and what it spends on imports over a given period.
If a country produces highly sought after exports then its currency will gain in value purely from the extra demand created from foreign buyers seeking to purchase these goods. Therefore, a positive net Trade Balance strengthens a currency and vice versa for a negative balance. -
08:33
USD/CNH remains within the consolidative phase – UOB
USD/CNH remains stuck within the 6.8500-6.9200 range for the time being, note UOB Group’s Economist Lee Sue Ann and Markets Strategist Quek Ser Leang.
Key Quotes
24-hour view: “We noted yesterday that ‘the price actions appear to be part of a consolidation phase’ and we expected USD to trade between 6.8600 and 6.8900. Our view for USD to consolidate was not wrong even though it traded in a narrower range than expected (6.8650/6.8851) before closing little changed at 6.8838 (+0.05%). The quiet price movements offer no fresh clues and we continue to expect USD to consolidate, likely in a range of 6.8700/6.8900.”
Next 1-3 weeks: “There is not much to add to our update from Monday (17 Apr, spot at 6.8820). As highlighted, there is no clear USD direction. For the time being, USD could trade in a relatively broad range of 6.8500/6.9250.”
-
08:26
Forex Today: Choppy market action continues mid-week
Here is what you need to know on Wednesday, April 19:
Major currency pairs are struggling to make a decisive move in either direction in the first half of the week as investors continue to search for the next catalyst. Nevertheless, the cautious market mood early Wednesday seems to be helping the US Dollar stage a rebound. Eurostat will publish the revisions to March Harmonized Index of Consumer Prices (HICP) data later in the session. In the late American trading hours, the Federal Reserve will release its Beige Book.
The US Dollar Index (DXY) closed in negative territory on Tuesday despite hawkish comments from Federal Reserve officials. Early Wednesday, the DXY clings to small gains as US stock index futures are down between 0.2% and 0.5%. In the meantime, the benchmark 10-year US Treasury bond yield is back near 3.6% following the technical correction witnessed in the previous day.
The UK's Office for National Statistics reported on Tuesday that inflation, as measured by the Consumer Price Index (CPI), edged lower to 10.1% on a yearly basis in March from 10.4% in February. This reading came in above the market expectation 9.8%. The annual Core CPI, which strips volatile food and energy prices, stayed unchanged at 6.2% in the same period, compared to analysts' estimate of 6%. Supported by these data, GBP/USD has gained traction early Wednesday and was last seen trading above 1.2450.
EUR/GBP cross came under renewed bearish pressure and dropped below 0.8800 after UK inflation figures.
EUR/USD is struggling to build on Tuesday's recovery gains but manages to hold steady slightly above 1.0950. European Central Bank (ECB) Chief Economist Philip Lane and Governing Council member Isabel Schnabel will be delivering speeches later in the day.
USD/JPY has gathered bullish momentum on rising US Treasury bond yields and advanced toward mid-134.00s. Bank of Japan (BoJ) Executive Director Tokiko Shimizu said on Wednesday that it is appropriate to continue easing policy for time being.
Gold lost its traction following Tuesday's rebound and dropped below $2,000. Rising global yields after UK inflation data seem to be weighing on XAU/USD mid-week.
Bitcoin gained more than 3% on Tuesday and seems to have gone into a consolidation phase slightly above $30,000 early Wednesday. Ethereum is having a hard time finding direction as it continues to move up and down above $2,000.
-
08:17
USD/JPY hits fresh multi-week high, lacks follow-through amid softer risk tone
- USD/JPY regains positive traction on Wednesday amid the emergence of fresh USD buying.
- Bets for more Fed rate hikes push the US bond yields higher and help revive the USD demand.
- A weaker risk tone could undermine the safe-haven JPY and cap any further gains for the pair.
The USD/JPY pair once again shows some resilience below the 134.00 round-figure mark for the second straight day and attracts fresh buyers on Wednesday. The intraday positive move picks up pace during the early European session and lifts spot prices to a nearly three-week high, around the 134.75 region in the last hour, though lacks follow-through.
A further rise in the US Treasury bond yields helps revive the US Dollar (USD) demand, which, in turn, is seen as a key factor acting as a tailwind for the USD/JPY pair. In fact, the yield on the two-year US Treasury note and the benchmark 10-year US government bond climb to over a four-week high amid speculations that the Federal Reserve (Fed) will continue raising interest rates. The bets were lifted by the hawkish remarks by Fed officials.
In fact, Fed Governor Christopher Waller said on Friday that a year of aggressive rate hikes "haven't made much progress" in returning inflation to their 2% target and the central bank still needs to move rates higher. Adding to this, St. Louis Fed President James Bullard, in an interview on Tuesday, backed the case for additional 75 bps of tightening against the market consensus for one more 25 bp hike next month and then the potential for cuts later this year.
Adding to this, the incoming positive US macro data pointed to a resilient economy and fueled concerns that the Fed may have more work to do, which, in turn, remains supportive of elevated US Treasury bond yields. This results in the widening of the US-Japan rate differential. Apart from this, the Bank of Japan's (BoJ) dovish stance undermines the Japanese Yen (JPY) and pushes the USD/JPY pair higher, though the risk-off impulse could cap gains.
The prospects for further policy tightening by the Fed fuel worries about economic headwinds stemming from rising borrowing costs. This, in turn, tempers investors' appetite for riskier assets, which is evident from a fresh leg down in the equity markets and tends to benefit traditional safe-haven currencies, including the JPY. Hence, it will be prudent to wait for some follow-through buying before positioning for any further appreciating move.
Technical levels to watch
-
08:09
EUR/USD fades part of the recent advance amidst USD recovery
- EUR/USD loses the grip and recedes to the 1.0950 region.
- EMU final inflation figures next of note in the domestic docket.
- Fed’s Beige Book next of note across the pond on Wednesday.
Sellers seem to have returned to the single currency and drags EUR/USD back to the mid-1.0900s on Wednesday.
EUR/USD looks at data, USD
EUR/USD extends the choppy trading so far this week and now partially fades Tuesday’s uptick on the back of a decent rebound in the dollar and the continuation of the march north in the German 10-year Bund yields.
In the absence of strong drivers, price action around the pair keeps looking to the upcoming interest rate decision by the ECB and the Fed, with both central banks expected to raise rates by 25 bps in May.
The latter appears well underpinned by recent hawkish comments from policy makers on both sides of the ocean, who kept advocating for a tighter-for-longer stance amidst the still elevated inflation.
In the euro calendar, final inflation figures in the broader Euroland will be the sole release on Wednesday. In the US, weekly Mortgage Applications tracked by MBA are due along with the publication of the Fed’s Beige Book.
What to look for around EUR
EUR/USD comes under downside pressure following a failed attempt to retest/surpass the ley 1.1000 neighbourhood.
Meanwhile, price action around the single currency should continue to closely follow dollar dynamics, as well as the incipient Fed-ECB divergence when it comes to the banks’ intentions regarding the potential next moves in interest rates.
Moving forward, hawkish ECB-speak continue to favour further rate hikes, although this view appears in contrast to some loss of momentum in economic fundamentals in the region.
Key events in the euro area this week: EMU Final Inflation Rate (Wednesday) – ECB Accounts, EMU Flash Consumer Confidence (Thursday) – Advanced Manufacturing/Services PMIs (Friday).
Eminent issues on the back boiler: Continuation (or not) of the ECB hiking cycle. Impact of the Russia-Ukraine war on the growth prospects and inflation outlook in the region. Risks of inflation becoming entrenched.
EUR/USD levels to watch
So far, the pair is losing 0.05% at 1.0966 and faces the next support at 1.0831 (monthly low April 10) seconded by 1.0788 (monthly low April 3) and finally 1.0756 (55-day SMA). On the flip side, a break above 1.1075 (2023 high April 14) would target 1.1100 (round level) en route to 1.1184 (weekly high March 21 2022).
-
08:04
Austria HICP (MoM) dipped from previous 0.8% to 0.6% in March
-
08:04
Austria HICP (YoY) fell from previous 11% to 9.2% in March
-
08:00
Turkey Consumer Confidence up to 87.5 in April from previous 80.1
-
07:56
USD/JPY keeps targeting the 134.80 region near term – UOB
Further upward bias in USD/JPY remains focused on the 134.80 region for the time being, comment UOB Group’s Economist Lee Sue Ann and Markets Strategist Quek Ser Leang.
Key Quotes
24-hour view: “Yesterday, we held the view that USD ‘is unlikely to advance much further’ and we expected it to trade sideways between 133.80 and 134.80. Our view of sideways trading was not wrong even though USD traded in a narrower range than expected (133.85/133.70). Further sideways trading appears likely but the slightly softened underlying tone suggests a lower range of 133.50/134.50.”
Next 1-3 weeks: “We continue to hold the same view as from Monday (17 Apr, spot at 133.80) wherein while it is too early to expect the start of a sustained advance in USD, it is likely to trade with an upward bias to 134.80. Looking ahead, it has to break clearly above this level before further gains can be expected. The next resistance above 134.80 is at 135.50. Overall, only a breach of 133.00 (no change in ‘strong support’ level from yesterday) would suggest that the upward bias has eased.”
-
07:55
Gold Price Forecast: XAU/USD drops towards $1,980 as hawkish Fed bias, sour sentiment favors US Dollar
- Gold price takes offers to reverses the previous day’s corrective bounce.
- Geopolitical fears surrounding China, Russia joins hawkish Fed bets and fears of US government default to roil the risk appetite.
- Risk-aversion underpins US Dollar and yields while weighing on XAU/USD ahead Fed Beige Book.
Gold price (XAU/USD) bears the burden of the US Dollar rebound as it drops back below $2,000, around $1,990 after renewing its intraday low with $1,987 mark during early Wednesday in Europe.
In doing so, the bright metal takes clues from the risk-off mood, mainly linked to Russia and China, as well as the US debt payment default fears. Furthermore, upbeat US Treasury bond yields and hawkish Federal Reserve (Fed) talks also underpin US Dollar’s rebound and weigh on the XAU/USD price.
UK’s warning that Russian hackers targeting Western critical infrastructure and the fears surrounding the US-China tension about Taiwan, due to the US House China Committee’s discussion about the Taiwan invasion scenario, weigh on the risk profile. On the same line could be the Reuters’ news suggesting that US consumers are starting to fall behind on their credit card and loan payments as the economy softens.
Furthermore, the likely drag on the US debt ceiling decision due to US President Joe Biden’s hesitance in lifting debt limits. Additionally, Bloomberg released news suggesting China’s role in the Russia-Ukraine war, which in turn adds strength to the risk-off mood and propels the US Dollar, which in turn drowns the Gold price.
On a different page, the markets are almost certain of 0.25% Fed rate hike in May and the same joins the recently easing odds favoring the rate cut in 2023 to portray the hawkish bias about the US central bank. Behind the moves are Friday’s US Consumer-centric figures and Monday’s US activity data, as well as the latest upbeat comments from St. Louis Federal Reserve President James Bullard, Richmond Fed President Thomas Barkin and Atlanta Fed President Raphael W. Bostic. However, recently downbeat US housing data prod the Fed hawks and put a floor under the Gold price.
Amid these plays, the S&P 500 Futures dropped 0.30% intraday while reversing from the highest levels since early February whereas the US two-year Treasury bond yields jump to a fresh high in one month. Further, the US 10-year bond coupons also rise to 3.61% and allow the US Dollar Index (DXY) to print 0.20% intraday gains while poking 102.00 level.
Moving on, Gold traders should rely on the risk catalysts, mainly surrounding geopolitics and the US debt ceiling, for immediate directions as today’s economic calendar appears mostly empty with only Fed Beige Book on the watch. That said, the likely increase in the risk-aversion and hawkish Fed bets could weigh on the XAU/USD prices.
Technical analysis
With the Gold price’s latest weakness, it marks another U-turn from the 200-Hour Moving Average (HMA), which in turn joins the bearish MACD signals to direct the XAU/USD bears toward a two-week-old ascending support line near $1,980.
However, the RSI (14) line is oversold and hence the quote’s further downside past $1,980 appears less likely, which if happens could direct the XAU/USD price in the direction of the monthly low of around $1,949.
Meanwhile, a two-day-old ascending trend line, previous support near $1,999, restrict the immediate rebound of the Gold price.
Following that, the 200-HMA level of around $2,010 can challenge the XAU/USD buyers.
Above all, the Gold price remains on the bear’s radar unless the quote stays below the previous support line from April 03, close to $2,040 at the latest.
Gold price: Hourly chart
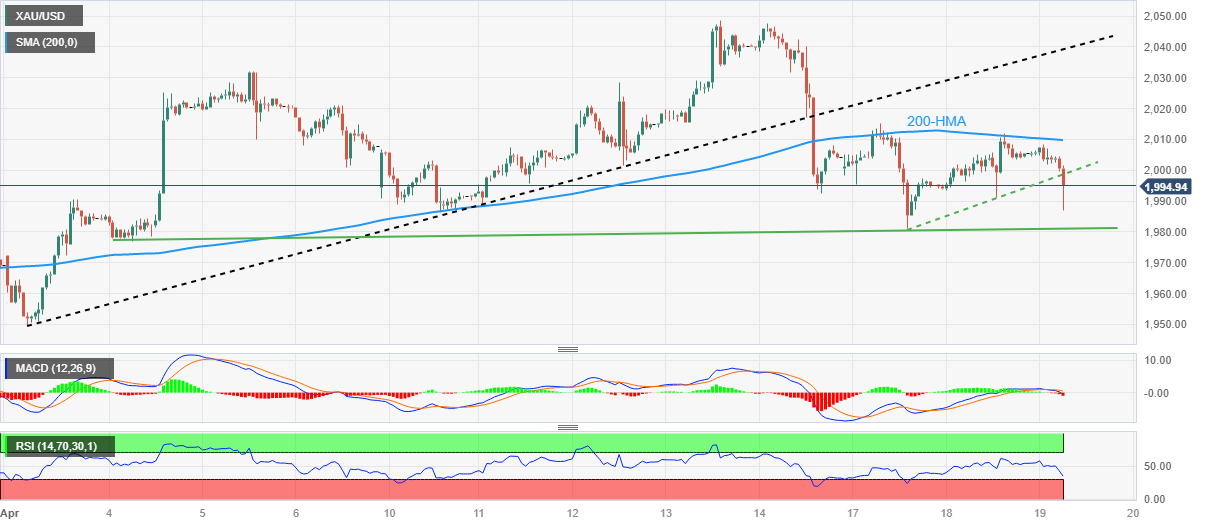
Trend: Further downside expected
-
07:53
Natural Gas Futures: Further gains not favoured
Considering advanced prints from CME Group for natural gas futures markets, open interest dropped for the second straight session on Tuesday, this time by around 2.8K contracts. In the same line, volume went down markedly by around 167.5K contracts, the largest single-day pullback since late January.
Natural Gas remains capped by the 55-day SMA
Prices of the natural gas rose for the third session in a row on Tuesday. This move was on the back of declining open interest and volume and exposes a corrective decline in the very near term, all framed within the broader multi-week consolidation theme. On the upside, the 55-day SMA around $2.38 per MMBtu emerges as the immediate hurdle for occasional bullish intentions.
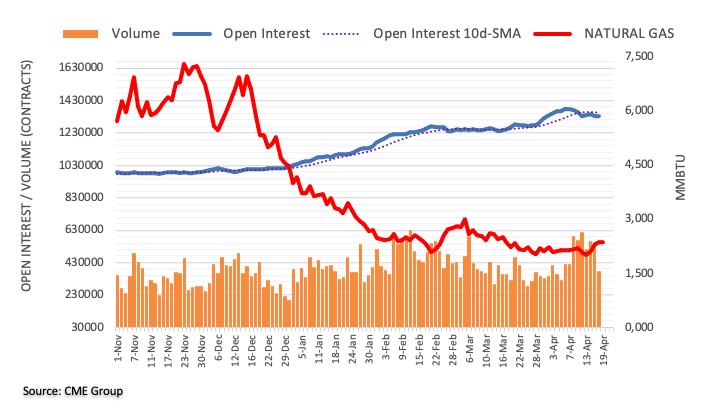
-
07:44
AUD/USD clings to the side-lined trading near term – UOB
In the opinion of UOB Group’s Economist Lee Sue Ann and Markets Strategist Quek Ser Leang, AUD/USD is expected to navigate within the 0.6620-0.6785 range in the next few weeks.
Key Quotes
24-hour view: “We expected AUD to consolidate in a range of 0.6680/0.6725 yesterday. However, AUD traded in a higher range between 0.6698 and 0.6747. The underlying tone has improved somewhat and AUD is likely to edge higher today, but any advance is not expected to challenge the major resistance at 0.6785 (minor resistance is at 0.6760). On the downside, a breach of 0.6700 (minor support is at 0.6715) would suggest the current mild upward pressure has eased.”
Next 1-3 weeks: “There is not much to add to our update from Monday (17 Apr, spot at 0.6710). As highlighted, after the recent sharp but short-lived swings, the outlook for AUD is mixed. For the time being, there is no clear direction and AUD could trade in a relatively broad range of 0.6620/0.6785.”
-
07:41
Crude Oil Futures: Further decline looks unlikely
CME Group’s flash data for crude oil futures markets noted traders trimmed their open interest positions by around 5.7K contracts on Tuesday following two daily builds in a row. Volume followed suit and dropped for the second consecutive session, this time by around 19.5K contracts.
WTI remains supported by $80.00
Prices of the barrel of the WTI extended the corrective decline on Tuesday. The bearish move was on the back of shrinking open interest and volume and removes strength from potential future retracements. In the meantime, the $80.00 mark per barrel continues to hold the downside in the commodity for the time being.
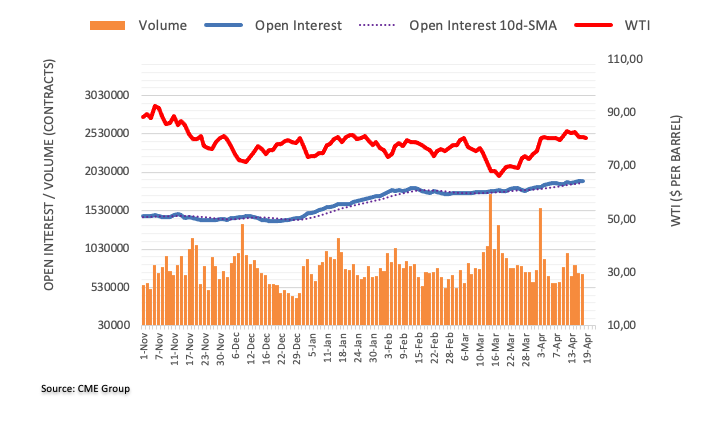
-
07:40
EUR/GBP flirts with weekly low, around 0.8800 mark on stronger UK CPI report
- EUR/GBP comes under some selling pressure following the release of the UK inflation figures.
- The stronger UK CPI print reaffirms bets for more BoE rate hikes and boosts the British Pound.
- Bets for a smaller ECB rate hike contribute to the Euro's underperformance and exert pressure.
The EUR/GBP cross meets with some supply during the early European session on Wednesday and drops to a fresh weekly low, around the 0.8810 region in reaction to stronger UK consumer inflation figures.
The British Pound strengthens a bit after the UK Office for National Statistics (ONS) reported that the headline UK CPI eased less than expected, to a 10.1% YoY rate in March from the 10.4% recorded in the previous month. Furthermore, the Core CPI, which excludes volatile food and energy items, held steady at 6.2% YoY during the reported month, beating expectations for a slide to 6.0%. This comes on the back of the stronger UK wage growth data on Tuesday and should keep pressure on the Bank of England (BoE) to raise interest rates further, which, in turn, is seen dragging the EUR/GBP cross lower.
The shared currency's relative underperformance could further be attributed to the fact that the European Central Bank (ECB) policymakers have left the door open to a downshift in the pace of interest rate hikes. In fact, ECB member Martins Kazaks said on Monday that the central bank might opt for a 25 bps hike at the next meeting in May. This further contributes to a mildly softer tone surrounding the EUR/GBP cross. That said, the lack of any strong follow-through selling warrants some caution for aggressive bearish traders and before positioning for any further intraday depreciating move, at least for now.
Market participants now look forward to the release of the final Eurozone CPI print, which might influence the Euro and provide some impetus to the EUR/GBP cross. Apart from this, traders will take cues from the BoE's Quarterly Bulletin for the central bank’s view on the state of the UK economy. This might further contribute to producing short-term trading opportunities ahead of BoE MPC Member Catherine Mann's scheduled speech.
Technical levels to watch
-
07:32
GBP/USD faces strong contention around 1.2275 – UOB
Extra weakness in GBP/USD should meet a tough support level at 1.2275, according to UOB Group’s Economist Lee Sue Ann and Markets Strategist Quek Ser Leang.
Key Quotes
24-hour view: “After GBP dropped to 1.2353 on Monday, we noted yesterday that ‘despite the decline, downward momentum has not improved much’. However, we were of the view that ‘there is scope for GBP to dip below 1.2345 before stabilization is likely’. GBP did not dip below 1.2345 but instead, rebounded to a high of 1.2449. The rapid bounce appears to be overdone and GBP is unlikely to advance much further. Today, GBP is more likely to trade in a range, expected to be between 1.2385 and 1.2455.”
Next 1-3 weeks: “Two days ago (17 Apr, spot at 1.2405), we highlighted that GBP could edge lower but any decline is unlikely to break clearly below the major support at 1.2275. We continue to hold the same view even though after the rebound yesterday, the odds for GBP to decline have diminished. All in all, only a breach of 1.2475 (no change in ‘strong resistance’ level) would indicate that the downside bias has faded.”
-
07:29
USD Index regains some upside traction and approaches 102.00
- The index picks up some pace and trades close to 102.00.
- US yields remain firm in multi-week levels so far on Wednesday.
- Weekly Mortgage Applications next on tap in the docket.
The USD Index (DXY), which tracks the greenback vs. a bundle of its main competitors, manages to reverse Tuesday’s weakness and advances to the proximity of the 102.00 region on Wednesday.
USD Index looks to risk trends
The index extends the range bound theme this week near the 102.00 region on the back of alternating risk appetite trends.
In the meantime, US yields keep navigating the upper end of the curve and remain propped up by firmer conviction of a 25 bps rate hike by the Fed at the May event. On this, CME Group’s FedWatch Tool sees the probability of such a scenario at around 85%.
Data wise in the US calendar, usual MBA Mortgage Applications are due in the first turn seconded by the EIA’s weekly report on US crude oil inventories and the release of the Fed’s Beige Book will close the session.
What to look for around USD
The absence of strong catalysts leaves the price action around the dollar – and the rest of the FX space – somewhat muted so far this week.
In the meantime, the marked retracement in the buck since March has been underpinned by the pick-up in the perception that the Federal Reserve could make a pause in its current tightening cycle just after the May meeting.
In favour of a pivot in the Fed’s normalization process, however, still emerges the persevering disinflation, nascent weakness in some key fundamentals and somewhat persistent concerns surrounding the banking sector.
Key events in the US this week: MBA Mortgage Applications, Fed’s Beige Book (Wednesday) – Initial Claims, Philly Fed Index, CB Leading Index, Existing Home Sales (Thursday) - Flash Manufacturing/Services PMIs (Friday).
Eminent issues on the back boiler: Persistent debate over a soft/hard landing of the US economy. Terminal Interest rate near the peak vs. speculation of rate cuts in 2024. Fed’s pivot. Geopolitical effervescence vs. Russia and China. US-China trade conflict.
USD Index relevant levels
Now, the index is gaining 0.27% at 101.99 and faces the immediate resistance at 102.80 (weekly high April 10) followed by 103.05 (monthly high April 3) and then 103.33 (55-day SMA). On the other hand, a breach of 100.78 (2023 low April 14) would open the door to 100.00 (psychological level) and finally 99.81 (weekly low April 21 2022).
-
07:17
Gold Futures: Extra rebound on the cards
Open interest in gold futures markets rose by just 300 contracts on Tuesday after two daily drops in a row according to preliminary readings from CME Group. Volume, instead, shrank for the second straight session, now by more than 105K contracts.
Gold faces some consolidation near term
Tuesday’s uptick in gold prices was on the back of a small increase in open interest and a sharp drop in volume, opening the door to some consolidation in the very near term. So far, the $2050 region keeps limiting occasional bullish attempts, while the $1980 zone holds the downside.
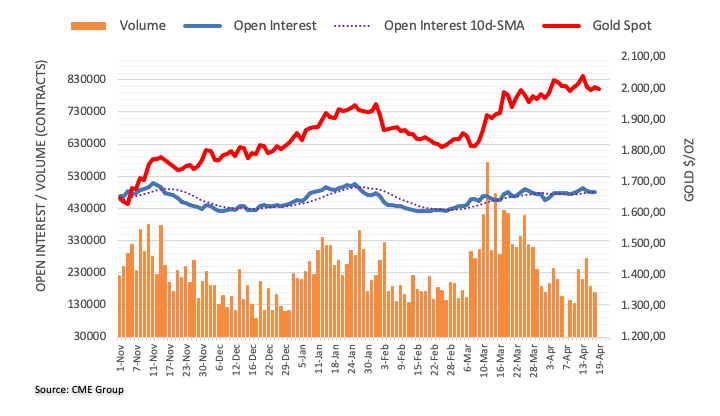
-
07:16
BoJ’s Shimizu: Appropriate to continue easing policy for time being
Bank of Japan (BoJ) Executive Director Tokiko Shimizu said on Wednesday, it is “appropriate to continue easing policy for time being.”
Additional quotes
“CPI growth likely to slow below 2% in the middle of FY2023.”
“Will conduct appropriate policy with eyes on 2% inflation target.”
Market reaction
USD/JPY is jumping toward 135.00 on the above comments. The US Dollar is also gaining the upside traction amid a dent to risk sentiment, following hot UK inflation data. The spot is trading at 134.68, up 0.44% on the day, as of writing.
-
07:14
GBP/JPY rises above 167.30 on higher-than-anticipated UK Inflation report
- GBP/JPY has climbed above 167.35 as UK headline inflation remained above a double-digit figure vs. consensus of 9.8%.
- The collaborative impact of surprise upside in the UK labor cost index and accelerated inflation would force BoE to raise rates further.
- BoJ Ueda has supported buying government debt as part of monetary policy
The GBP/JPY pair has jumped sharply to near 167.37 as United Kingdom’s Office for National Statistics (ONS) has reported higher-than-anticipated inflation data. Headline Consumer Price Index (CPI) has landed at 10.1%, higher than the consensus of 9.8% but lower than the former release of 10.4%. It looks like UK inflation is shy of coming below the double-digit figure.
Core CPI that excludes oil and food prices remained steady at 6.2% and higher than the consensus of 6.0%. Meanwhile, Producer Price Index (PPI) report has softened on a broader note indicating that producers have trimmed prices of goods and services at factory gates due to a fall in gasoline prices.
This has faded the worthiness of Bank of England (BoE) policymakers, which were confident that inflation will quickly decelerate from next month, and February’s upbeat inflation is a one-time thing.
On Tuesday, Three month Labor cost index (excluding bonuses) landed higher at 6.6% than the consensus of 6.2% but in line with the prior release. Employment data remained downbeat as the Unemployment Rate jumped to 3.8% from the consensus and the former release of 3.7%. Also, Claimant Count Change was more than 28K while the street was anticipating a decline of 11.8K.
The collaborative impact of surprise upside labor cost index and accelerated inflation data would force BoE Governor Andrew Bailey to raise rates further.
On the Japanese Yen front, to augment the expansion of stimulus in the economy, novel Bank of Japan (BoJ) Governor Kazuo Ueda said in the Japanese parliament on Tuesday, “The BoJ is buying government debt as part of monetary policy.” He further added the intention of bond purchase is not of monetizing government debt.
-
07:08
GBP/USD rises 25+ pips as bulls approach 1.2450 on strong UK inflation
- GBP/USD takes the bids to refresh intraday high as UK inflation rises in March.
- UK CPI came in 10.1% YoY in March versus 9.8% expected and 10.4% prior.
- EU’s Brexit incentive, hawkish Fed/BoE rhetoric join geopolitical fears to prod CAble bears.
- US PMI, UK Retail Sales and Fed Beige Book are the key catalysts to watch for clear directions.
GBP/USD prints a 27 pip worth of jump as the UK’s headlines inflation data offered a positive surprise in March. That said, the Cable pair renews its intraday high near 1.2440 during early Wednesday morning in London.
UK inflation as per the Consumer Price Index (CPI) rise to 10.1% YoY in March versus 9.8% expected and 10.4% prior while the Core CPI reprints 6.2% YoY figure compared to 6.0% market forecasts.
Also read: Breaking: UK annualized CPI inflation softens to 10.1% in March vs. 9.8% expected
With the upbeat UK inflation data, optimism surrounding the Bank of England’s (BoE) rate hike accelerates, previously fuelled by the previous day’s British employment figures. On the same line could be the talks that the European Union (EU) braces for fewer border checks and allow Brexit incentives to the GBP/USD pair.
However, chatters surrounding UK PM Rishi Sunak’s political struggle and plummeting housing prices in London lure the Cable pair sellers.
Furthermore, the UK’s warning that Russian hackers targeting Western critical infrastructure and the fears surrounding the US-China tension about Taiwan, due to the US House China Committee’s discussion about the Taiwan invasion scenario, weigh on the risk profile.
Additionally, the likely drag on the US debt ceiling decision due to US President Joe Biden’s hesitance in lifting limits. Additionally, Bloomberg released news suggesting China’s role in the Russia-Ukraine war, which in turn adds strength to the risk-off mood and challenges the GBP/USD price.
It should be noted that the markets are almost certain of 0.25% Fed rate hike in May and the same joins the recently easing odds favoring the rate cut in 2023 to portray the hawkish bias about the US central bank. Behind the moves are Friday’s US Consumer-centric figures and Monday’s US activity data, as well as the latest upbeat comments from St. Louis Federal Reserve President James Bullard, Richmond Fed President Thomas Barkin and Atlanta Fed President Raphael W. Bostic. However, recently downbeat US housing data prod the Fed hawks and put a floor under the GBP/USD price.
Against this backdrop, US stock futures are mildly offered and the equities in the Asia-Pacific region also grind lower. Further, US Treasury bond yields pause the previous day’s downbeat performance and allow the US Dollar bears to take a breather.
Having witnessed the initial market reaction to the key UK data, GBP/USD traders should rely on the interest rate futures suggesting the moves of the Bank of England (BoE) and the Federal Reserve (Fed). In that case, the Fed’s Beige Book and Friday’s UK Retail Sales, as well as the US S&P Global PMIs, will also be important to watch for clear directions.
Technical analysis
The GBP/USD pair fades bounce off the bottom line of the two-week-old rising wedge bearish chart formation, around 1.2365 by the press time. However, the steady RSI (14) and repeated failures to decline much suggest further recovery of the quote. That said, the 21-SMA surrounding 1.2435 restricts the immediate upside of the GBP/USD price.
-
07:03
EUR/USD risks further weakness near term – UOB
UOB Group’s Economist Lee Sue Ann and Markets Strategist Quek Ser Leang suggest EUR/USD could face some downside pressure in the next few weeks.
Key Quotes
24-hour view: “Our view for EUR to decline further yesterday was incorrect as it rebounded to a high of 1.0982. Despite the advance, there is no marked improvement in momentum. While EUR could edge higher today, we view any advance as part of a 1.0935/1.1000 range. In other words, we do not expect a sustained drop below 1.0935 or above 1.1000.”
Next 1-3 weeks: “Yesterday (18 Apr, spot at 1.0925), we noted that ‘downward momentum appears to be building, albeit tentatively’. We held the view that EUR ‘is likely to trade with a downward bias but any decline is expected to face solid support at 1.0830’. While we continue to hold the same, short-term price actions suggest EUR is likely to consolidate for 1-2 days first. Overall, only a breach of 1.1025 (no change in ‘strong resistance’ level) would indicate that the build-up in momentum has fizzled out.”
-
07:02
United Kingdom Producer Price Index - Output (MoM) n.s.a above expectations (-0.1%) in March: Actual (0.1%)
-
07:02
United Kingdom PPI Core Output (YoY) n.s.a came in at 8.5% below forecasts (9.2%) in March
-
07:02
United Kingdom Consumer Price Index (MoM) came in at 0.8%, above expectations (0.5%) in March
-
07:02
United Kingdom Producer Price Index - Input (YoY) n.s.a below forecasts (9.8%) in March: Actual (7.6%)
-
07:02
United Kingdom Producer Price Index - Output (YoY) n.s.a above expectations (8.6%) in March: Actual (8.7%)
-
07:01
United Kingdom Retail Price Index (YoY) came in at 13.5%, above expectations (13.3%) in March
-
07:01
United Kingdom PPI Core Output (MoM) n.s.a registered at 0.3% above expectations (0.2%) in March
-
07:01
United Kingdom Producer Price Index - Input (MoM) n.s.a came in at 0.2%, above forecasts (-0.4%) in March
-
07:01
Breaking: UK annualized CPI inflation softens to 10.1% in March vs. 9.8% expected
- UK CPI drops to 10.1% YoY in March vs. 9.8% expected.
- Monthly UK CPI arrives at 0.8% in March vs. 0.5% expected.
- GBP/USD rises toward 1.2450 on upbeat UK CPIs.
The latest data published by the UK Office for National Statistics (ONS) showed on Wednesday that the British annualized Consumer Price Index (CPI) declined to 10.1% in March against the 10.4% jump recorded in February while beating estimates of a 9.8% print.
Meanwhile, the Core CPI gauge (excluding volatile food and energy items) steadied at 6.2% YoY last month versus 6.2% seen in February. The market expectations are for a 6.0% clip.
The monthly figures showed that the UK consumer prices eased to 0.8% in February vs. 0.5% estimates and 1.1% previous.
The UK Retail Price Index for March stood at 0.7% MoM and 13.5% YoY, beating expectations across the time horizon.
UK Finance Minister, Jeremy Hunt, said that “figures reaffirm exactly why we must continue with our efforts to drive down inflation.”
Additional takeaways (via ONS)
“The largest downward contributions to the monthly change in both the CPIH and CPI annual rates came from motor fuels, and housing and household services (particularly liquid fuels), partially offset by upward contributions from food, and recreation and culture.”
“Core CPIH (excluding energy, food, alcohol and tobacco) rose by 5.7% in the 12 months to March 2023, unchanged from February; the CPIH goods annual rate eased from 13.4% to 12.7% over the two months, while the CPIH services annual rate rose slightly from 5.6% to 5.7%.”
FX implications
In an initial reaction to the UK CPI numbers, the GBP/USD pair jumped to hit fresh session highs at 1.2439 before reversing quickly to near 1.2430, where it now wavers. The pair is up 0.06% on the day.
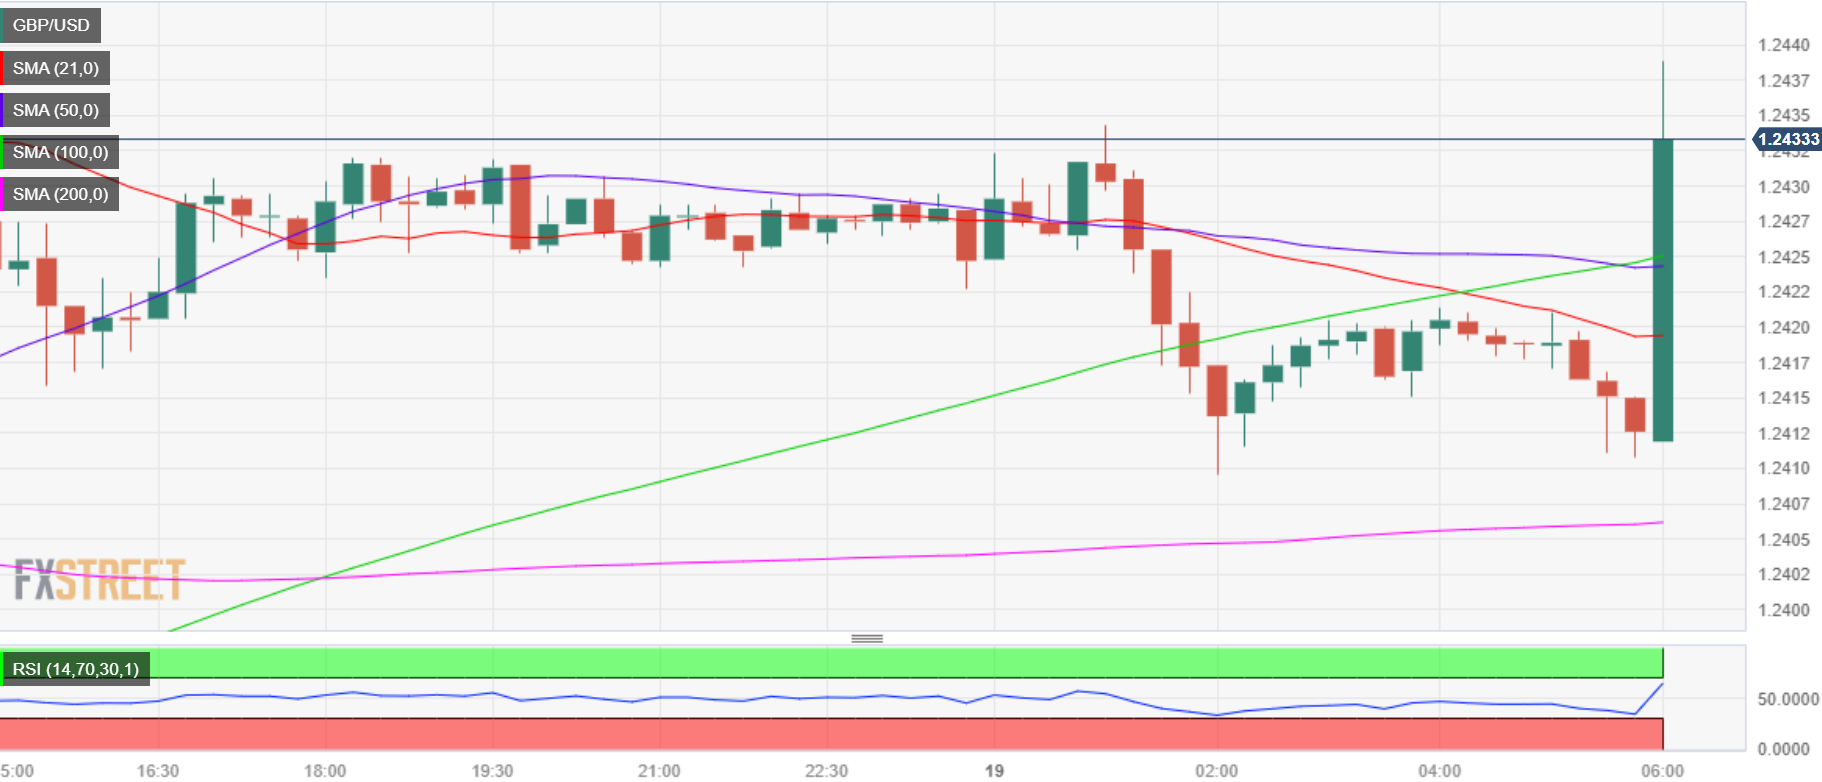
GBP/USD: 15-minutes chart
Why does UK inflation matter to traders?
The Bank of England (BOE) is tasked with keeping inflation, as measured by the headline Consumer Price Index (CPI) at around 2%, giving the monthly release its importance. An increase in inflation implies a quicker and sooner increase in interest rates or the reduction of bond-buying by the BOE, which means squeezing the supply of pounds. Conversely, a drop in the pace of price rises indicates looser monetary policy. A higher-than-expected result tends to be GBP bullish.
-
07:00
United Kingdom Consumer Price Index (YoY) registered at 10.1% above expectations (9.8%) in March
-
07:00
United Kingdom Core Consumer Price Index (YoY) came in at 6.2%, above forecasts (6%) in March
-
06:48
FX option expiries for Apr 19 NY cut
FX option expiries for Apr 19 NY cut at 10:00 Eastern Time, via DTCC, can be found below.
- EUR/USD: EUR amounts
- 1.0850 912m
- 1.0900-15 623m
- 1.0930-40 956m
- 1.1000 705m
- 1.1015-30 943m
- 1.1049-50 1.5b
- GBP/USD: GBP amounts
- 1.2450 803m
- USD/JPY: USD amounts
- 132.90-00 522m
- 133.35-45 929m
- 135.00-10 616m
- USD/CAD: USD amounts
- 1.3300 565m
- 1.3450 1b
- NZD/USD: NZD amounts
- 0.6230 805m
-
06:31
USD/CAD aims to sustain decisively above 1.3400 amid upbeat Fed rate hike bets
- USD/CAD is looking to shift its auction above 1.3400 as hawkish Fed bets are steady.
- Tuesday’s release of Canada’s CPI confirmed that the BoC will continue to keep interest rates steady at 4.5%.
- Investors’ risk appetite is deteriorating amid caution due to the quarterly result season in the US economy.
The USD/CAD pair is gathering strength to shift its auction above the round-level resistance of 1.3400 in the Asian session. The Loonie asset has shown a decent run after a gradual correction to near 1.3360. The upside in the major looks favored as Canada’s inflation has softened further and chances of one more rate hike from the Federal Reserve (Fed) are skyrocketing.
Tuesday’s release of Canada’s Consumer Price Index (CPI) confirmed that the Bank of Canada (BoC) will continue to keep interest rates steady at 4.5%. Monthly headline CPI accelerated by 0.5% as expected by the street. Also, annual headline inflation softened to 4.3% in line with the market consensus. Core CPI that excludes oil and food prices softened to 4.3% from the former release of 4.7% but remained higher than expectations of 4.2%.
A continuous decline in Canada’s inflation indicates that the current monetary policy by BOC Governor Tiff Macklem is restrictive enough to curtail inflationary pressures. BoC Governor strongly supported the need of keeping rates higher for a longer period to return inflation to 2% target in an opening statement before the House of Commons Standing Committee on Finance on Tuesday.
The US Dollar Index (DXY) is approaching 102.00 as investors are confident about a consecutive 25 basis point (bp) rate hike from the Fed. Meanwhile, investors’ risk appetite is deteriorating amid caution due to the quarterly result season in the United States economy. S&P500 futures are gradually declining as more rate hikes could dent corporate profits further.
-
06:31
USD/MXN Price Analysis: Mexican Peso buyers again aim for 13-day-old support
- USD/MXN braces for the first daily loss in four.
- U-turn from key SMAs, steady RSI (14) keeps Mexican Peso buyers hopeful.
- Clear downside break of fortnight-old support becomes necessary for pair bears to aim for 2017 low.
USD/MXN prints mild losses around 18.04 heading into Wednesday’s European session. In doing so, Mexican Peso (MXN) pair prints the first daily loss in four while justifying the pair’s repeated failures to cross the 50-SMA and the 100-SMA.
Not only the inability to cross the key SMAs but mostly steady RSI (14) and the lower high bearish formation, prevailing since early April, also seem to weigh on the USD/MXN price.
As a result, the pair is likely declining towards the key support line stretched from April 03, around 17.97.
However, the pair’s further downside appears limited as the lows marked in April and March, respectively near 17.93 and 17.89, can challenge the USD/MXN bears.
Should the quote remains bearish past 17.89, lows marked in June 2017 around 17.80 and the year 2017 bottom surrounding 17.44 will be in the spotlight.
On the contrary, the 50-SMA and the 100-SMA restrict the immediate upside of the USD/MXN pair to around 18.08 and 18.12 in that order.
Following that, the weekly high of 18.15 and 18.28 may act as extra checks for the Mexican Peso (MXN) sellers before directing them to the monthly peak surrounding 18.40.
If at all, the USD/MXN remains firmer past 18.40, the expectations of witnessing a run-up towards 19.00 and then to the previous monthly high near 19.23 can’t be ruled out.
USD/MXN: Four-hour chart

Trend: Further downside expected
-
06:08
China’s NDRC: Outlining plans to boost recovery, expansion of consumption
China’s National Development and Reform Commission (NDRC), the state planner, said on Wednesday, the country is formulating plans to boost the recovery and expansion of consumption.
Key takeaways
"Currently, we are working on drafting documents on the recovery and expansion of consumption, mainly focusing on key areas such as stabilizing big-ticket consumption, enhancing service consumption and expanding rural consumption.”
“Stabilizing of automobile consumption, which was a "big part" of supporting consumption, by promoting new energy vehicles to rural areas.”
Related reads
- USD/CNH steadies around 6.8800 amid mixed concerns about PBOC, Fed and geopolitics
- US House China Committee to war-game Taiwan invasion scenario
-
05:58
When is the UK inflation data and how could it affect GBP/USD?
The UK CPIs Overview
The cost of living in the UK as represented by the Consumer Price Index (CPI) for March month is due early on Wednesday at 06:00 GMT.
Given the recently released upbeat UK employment data, coupled with the firmer economic activity numbers and the doubts about the Bank of England’s (BOE) next moves, today’s British inflation numbers will be the key for the GBP/USD traders. Also increasing the importance of the UK CPI is the looming banking crisis and the policymakers’ push for measures that could help the market ward off the risks.
That said, the headline CPI inflation is expected to decline further from the 41-year high marked in late 2022 while easing to 9.8% YoY in March, versus 10.4% prior. Further, the Core CPI, which excludes volatile food and energy items, is likely to drop to 6.0% from 6.2% in previous readings. Talking about the monthly figures, the CPI could ease to 0.5% versus 1.1% prior.
Also important to watch is the Retail Price Index (RPI) figures for March, expected to mark a reduction to 0.6% MoM and 13.3% YoY versus 1.2% and 13.8% priors in that order.
Deviation impact on GBP/USD
Readers can find FXStreet's proprietary deviation impact map of the event below. As observed, the reaction is likely to remain confined around 20-pips in deviations up to + or -3, although in some cases, if notable enough, a deviation can fuel movements over 50-60 pips.
How could it affect GBP/USD?
GBP/USD stays defensive above 1.2400 as it lacks follow-through amid the cautious mood in the market and the US Dollar’s corrective bounce. Also challenging the Cable pair buyers are the latest doubts on the UK banking sector’s health, as well as the geopolitical pressure on UK PM Rishi Sunak. However, upbeat UK employment numbers and the Bank of England (BoE) policymakers’ push for higher rates keep the Cable buyers hopeful ahead of the key British inflation data.
That said, considering the recent improvement in the British data and expectations of overcoming the labor problems, the softer UK inflation data may help the GBP/USD bears to retake control. It’s worth noting that a positive surprise from the UK CPI or Core CPI should be traded with a pinch of salt amid hawkish Fed bets.
Technically, the Cable pair recently bounced off the bottom line of the stated rising wedge, which in turn joins the steady RSI (14) to suggest further recovery of the quote. However, the 21-SMA surrounding 1.2435 restricts the immediate upside of the GBP/USD price.
Key notes
GBP/USD traders sit tight ahead of UK CPI
GBP/USD Price Analysis: Retreats towards 1.2400 within rising wedge, UK inflation eyed
About the UK CPIs
The Consumer Price Index released by the Office for National Statistics is a measure of price movements by the comparison between the retail prices of a representative shopping basket of goods and services. The purchasing power of the GBP is dragged down by inflation. The CPI is a key indicator to measure inflation and changes in purchasing trends. Generally, a high reading is seen as positive (or bullish) for the GBP, while a low reading is seen as negative (or Bearish).
-
05:57
EUR/USD struggles around 1.0980 as USD Index looks set for a recovery, Fed’s Beige Book in focus
- EUR/USD is facing hurdles while stretching its recovery above 1.0980 as USD Index has rebounded
- S&P500 futures are adding losses as investors have turned more cautious after disappointing quarterly results.
- The commentary from Fed Bullard curtailed the risk of recession in the second half of 2023.
The EUR/USD pair is facing barricades in extending its recovery above the immediate resistance of 1.0980 in the early European session. The upside in the major currency pair looks capped as US Dollar Index (DXY) has shown strength after a correction to near 101.65. The USD Index is making efforts to extend its recovery above 101.80 as one more rate hike by the Federal Reserve (Fed) is widely anticipated.
S&P500 futures are adding losses in the Asian session as investors have turned more cautious after disappointing corporate profits. Goldman Sachs, Johnson & Johnson (J&J), and Netflix delivered a poor earnings show and forced the 500-US stock basket to surrender entire gains.
Meanwhile, US Treasury yields are showing resilience as the Fed is highly expected to raise rates further. St. Louis Fed President James Bullard advocated for the continuation of the policy-tightening spell by the central bank considering the fact that labor market data is still solid, as reported by Reuters. Fed policymaker further added that demand for labor has not softened yet and a strong labor market leads to strong consumption, which fades the context of having a recession in the second half of 2023.
This week, the release of the Fed’s Beige Book will be the key catalyst. Detailed information of 12 Fed districts about their economic condition will convey the ground situation of the US economy and will help in understanding further prospects.
On the Eurozone front, persistent inflation due to a shortage of labor and an expected recovery in oil prices would accelerate the odds of a bigger rate hike from the European Central Bank (ECB). ECB President Christine Lagarde is expected to raise interest rates by 25 basis points (bps) to weigh on inflationary pressures.
-
05:43
Asian Stock Market: Grinds lower amid fresh fears from China, Fed, Oil eases on DXY rebound
- Asian equities remain downbeat while tracking global counterpart, lacks follow-through amid light calendar.
- Geopolitical concerns surrounding China, hawkish Fedspeak prod optimists.
- Yields pause previous fall and allow US Dollar Index (DXY) to recover.
- Risk catalysts will be in focus ahead of Fed’s Beige Book.
Risk profile remains downbeat in Asia as headlines surrounding China and the Federal Reserve (Fed) weigh on sentiment amid sluggish trading hours on Wednesday. While portraying the mood, the MSCI’s Index of Asia-Pacific shares outside Japan drop 0.40% intraday whereas Japan’s Nikkei 225 copies the moves with 0.35% intraday loss near 28,552 by the press time.
It’s worth noting that concerns about the Bank of Japan’s (BoJ) exit from the easy-money policy regain market attention even as policymakers try to defend the current policy. The reason could be linked to the recently firmer Japan data.
That said, upbeat prints of Australia Westpac Leading Index for March and upbeat China data, coupled with the International Monetary Fund’s (IMF) optimism about the dragon nation allow stocks in Canberra and Auckland to buck the trend with mild gains at the latest.
Elsewhere, fears surrounding the US-China tension about Taiwan, due to the US House China Committee’s discussion about the Taiwan invasion scenario, weigh on the risk profile and stocks in Beijing and Hong Kong. On the same line could be the likely drag on the US debt ceiling decision due to US President Joe Biden’s hesitance in lifting limits. Additionally, Bloomberg released news suggesting China’s role in the Russia-Ukraine war, which in turn adds strength to the risk-off mood.
Furthermore, the Indian equities print mild losses whereas stocks in South Korea and Indonesia print minor gains by the press time.
On a broader front, downbeat US housing numbers failed to stop the Federal Reserve (Fed) policymakers from favoring the need for higher rates, which in turn joins a pause in the US Treasury bond yields to trigger the US Dollar Index (DXY) rebound. With this, the prices of Gold and Crude Oil print mild losses as we write.
Moving on, a light calendar may restrict immediate moves of the market but hawkish concerns about the Fed and geopolitical fears may prod the optimists ahead of Thursday’s New Zealand inflation and key PMIs.
Also read: S&P 500 Futures retreat amid geopolitical fears, sluggish yields, Fedspeak, China eyed
-
05:33
Japan Industrial Production (MoM) above expectations (4.5%) in February: Actual (4.6%)
-
05:33
Japan Industrial Production (YoY) above forecasts (-0.6%) in February: Actual (-0.5%)
-
05:32
Japan Capacity Utilization came in at 3.9%, above forecasts (0.5%) in February
-
05:20
AUD/USD: Mildly bid below 0.6750 on mixed concerns about Fed, China
- AUD/USD lack follow-through while keeping the previous day’s recovery moves.
- Australia’s Westpac Leading Index improved to -0.01% in March.
- Challenges to sentiment from China, hawkish Fed bets and contrast with downbeat US data to check Aussie pair traders.
- Fed’s Beige Book, risk catalysts will be important for fresh impulse amid a light calendar.
AUD/USD picks up bids to print mild gains around 0.6730 heading into Wednesday’s European session. Even so, the Aussie pair struggles to extend the previous day’s recovery as challenges to sentiment and hawkish Fed talks contrast with the downbeat US data and firmer Aussie statistics during sluggish hours of trading.
That said, Australia’s Westpac Leading Index rose to -0.01% in March versus -0.06% prior The same justifies the economic optimism showed during the previous day’s Reserve Bank of Australia (RBA) Monetary Policy Meeting Minutes. Also positive for the Aussie pair is the downbeat stream of US housing numbers, published on Tuesday.
However, the recent geopolitical fears emanating from China and Russia, as well as the hawkish Federal Reserve (Fed) bias ahead of the blackout period, starting from Saturday, prod the AUD/USD buyers.
That said, US stock futures are mildly offered and the equities in the Asia-Pacific region also grind lower amid fears surrounding the US-China tension about Taiwan, due to the US House China Committee’s discussion about the Taiwan invasion scenario. On the same line could be the likely drag on the US debt ceiling decision due to US President Joe Biden’s hesitance in lifting limits. Additionally, Bloomberg released news suggesting China’s role in the Russia-Ukraine war, which in turn adds strength to the risk-off mood and allows the US Dollar bears to take a breather.
It’s worth noting that the markets are almost certain of 0.25% Fed rate hike in May and the same joins the recently easing odds favoring the rate cut in 2023 to portray the hawkish bias about the US central bank. Behind the moves are Friday’s US Consumer-centric figures and Monday’s US activity data, as well as the latest upbeat comments from St. Louis Federal Reserve President James Bullard, Richmond Fed President Thomas Barkin and Atlanta Fed President Raphael W. Bostic.
On the contrary, upbeat China GDP, Retail Sales and Industrial Production data join the International Monetary Fund’s (IMF) optimism about the dragon nation to propel the AUD/USD prices.
Moving on, AUD/USD may remain lackluster amid a light calendar ahead of the monthly release of the Fed Beige Book.
Technical analysis
Although Monday’s Doji candlestick joins bullish MACD signals and firmer RSI signals to keep AUD/USD buyers, the 200-DMA hurdle of around 0.6745, followed by a seven-week-old rising trend line near 0.6800, restrict the Aussie pair’s further upside.
-
05:20
USD/INR Price News: Sets for a smooth ride as one more Fed rate hike is in pipeline
- USD/INR has printed a fresh weekly high at 82.11 amid a recovery in the USD Index.
- The Fed is not expected to pause rate hikes sooner despite a deceleration in inflation and easing labor market conditions.
- The Indian Rupee is failing to show resilience despite the buying spree from FIIs.
The USD/INR pair has printed a fresh weekly high at 82.11 in the opening session. The major has been fueled by a recovery move in the US Dollar Index (DXY) on expectations that one more rate hike by the Federal Reserve (Fed) is in pipeline to arrest sticky United States inflation swiftly.
The USD Index has rebounded after a correction to near 101.65. Also, US Treasury yields have been lifted by a recovery in the USD Index. Investors seem reluctant to invest in US government bonds as the Fed is not expected to pause its policy-tightening spell sooner despite a deceleration in inflationary pressures and easing labor market conditions. The 10-year US Treasury yields have climbed above 3.58%.
Meanwhile, S&P500 futures have extended losses as investors are cautious after poor quarterly earnings show from investment-banking firm Goldman Sachs and pharma-giant Johnson and Johnson (J&J), portraying a decline in the risk appetite of the market participants.
A power-pack action would be shown by the USD Index amid the release of the Fed’s Beige Book, which will provide the current economic prospects of 12 Fed districts. Any sort of improvement in economic activities, labor demand, and other economic indicators will cement the need for further rate hikes by the Fed to keep pressure on persistent inflation.
Meanwhile, Indian Rupee is failing to show resilience despite the buying spree from Foreign Institutional Investors (FIIs). The catalyst that is weighing pressure on the Indian rupee is the healthy demand forecast for oil. The street is confident that the Chinese economy is well on track for economic recovery after the release of upbeat Gross Domestic Product (GDP) and Retail Sales figures.
It is worth noting that India is one of the leading importers of oil in the world and an upward revision of oil demand will increase its prices and will impact the Indian rupee.
-
04:47
Gold Price Forecast: XAU/USD to resume its downside journey amid hawkish Fed bets - Confluence Detector
- Gold price is showing a sheer volatility contraction after a recovery move.
- The upside in the Gold price looks capped amid a solid recovery in the USD Index.
- Investors have channelized their funds into the USD Index as the Fed is expected to raise rates.
Gold price (XAU/USD) is demonstrating a sheer contraction in volatility after a recovery move from $1,980.00. The yellow metal is struggling to extend its recovery as the US Dollar Index (DXY) has rebounded firmly after defending the critical support of 101.65.
Investors have channelized their funds into the USD Index considering its safe-haven appeal as the Federal Reserve (Fed) is expected to raise rates to weigh more pressure on stubborn inflation. The demand for USD Index looks feasible for the short term as United States inflation has softened dramatically and labor market conditions have loosened further.
Meanwhile, retail demand by households has also dropped amid higher costs of financing and tight credit conditions by US commercial banks. The wholesome scenario indicates that the Fed won’t extend rates further vigorously and will consider a pause in the same to avoid indulgence of the economy into recession. But, in the current scenario, more rate hikes cannot be ruled out.
Considering the recovery in the USD Index, the demand for US government bonds has dented again, which has resumed the upside journey of US Treasury yields. The yields offered on 10-year US Treasury bonds have jumped above 3.58%.
Also Read: Gold Price Forecast: XAU/USD juggles above $2,000, US Dollar softens despite hawkish Fed bets
Gold Price: Key levels to watch
Gold price could get attracted to bears if it drops below the daily 20-period Exponential Moving Average (EMA) at $1,990.00. A downside move below the previous day's low would expose the yellow metal to weekly Pivot 1 support at $1,980.00. More downside will be exposed on the further breakdown to monthly 23.6% Fibonacci retracement support at $1,964.62.
On the contrary, The Technical Confluence Indicator conveys that the Gold price would reclaim the ultimate resistance of $2,052.00, which is the previous week’s high and first monthly pivot resistance. For that, the Gold price needs to climb above the previous month's high of $2,010.50 with sheer momentum, which will direct it to the resistance of the weekly 23.6% Fibonacci retracement at $2,035.50.
Here is how it looks on the tool
-638174727831557972.png)
About Technical Confluences Detector
The TCD (Technical Confluences Detector) is a tool to locate and point out those price levels where there is a congestion of indicators, moving averages, Fibonacci levels, Pivot Points, etc. If you are a short-term trader, you will find entry points for counter-trend strategies and hunt a few points at a time. If you are a medium-to-long-term trader, this tool will allow you to know in advance the price levels where a medium-to-long-term trend may stop and rest, where to unwind positions, or where to increase your position size.
-
04:16
USD/CNH steadies around 6.8800 amid mixed concerns about PBOC, Fed and geopolitics
- USD/CNH treads water around 6.8800 for the second consecutive day amid mixed catalysts.
- PBOC is likely to defend current monetary policy even if easy measures are preferable in China.
- Hawkish Fed bets, upbeat China data and geopolitical tension surrounding Taiwan, Russia also prod offshore Chinese Yuan traders.
USD/CNH portrays a cautious mood ahead of the People’s Bank of China’s (PBOC) Interest Rate Decision, up for publishing on Thursday, as the offshore Chinese Yuan (CNH) pair dribbles near 6.8800 for the second consecutive day amid early Wednesday. Also challenging the key Chinese currency pair are the mixed catalysts surrounding the Dragon nation and the recent risk-off mood.
Although the PBOC is all set for another status quo on Thursday, by holding the benchmark Loan Prime Rates (LPR) unchanged, the recently positive China data jostles with the nation’s dovish bias about the monetary policy to challenge the watchers.
China reported an upbeat print of the first quarter (Q1) Gross Domestic Product (GDP) the previous day while also marking welcome prints of the Industrial Production and Retail Sales for March. That said, China’s Q1 GDP grows 2.2% QoQ versus 2.2% expected and 0.0% prior. Further, Retail Sales growth jumps 10.9% YoY in March versus 7.4% expected and 3.5% prior whereas Industrial Production eased below 4.0% expected growth figures to 3.9%, versus 2.4% previous readings.
Apart from the data, the International Monetary Fund’s (IMF) optimism about the dragon nation also favors the CNH bulls. The IMF’s latest report on Tuesday said that China will be the top contributor to global growth over the next five years, with its share set to be doubled that of the US, per Bloomberg.
On the other hand, news surrounding the US House China Committee’s discussion about the Taiwan invasion scenario and a likely drag on the US debt ceiling decision seem to roil the risk profile of late, which in turn favors the US Dollar rebound. On the same line could be the recently downbeat US data and hawkish Fed bets. It should be observed that a mixed earnings season also prods the sentiment and the Natural Gas price. Furthermore, Bloomberg released news suggesting China’s role in the Russia-Ukraine war, which in turn joins US President Joe Biden’s resistance in negotiating debt limit to also weigh on the sentiment.
It’s worth observing that recently downbeat US data contrasted with the hawkish Fed bets to weigh on the US Dollar on Tuesday.
US Housing Starts and Building Permits roiled the mood with downbeat prints for March on Tuesday. That said, the Housing Starts eased to 1.42M versus 1.432M prior and 1.40M market forecasts whereas the Building Permits dropped to 1.413M from 1.55M previous readings and analysts’ estimations of 2.2M.
Talking about the Fedspeak, St. Louis Federal Reserve President James Bullard said on Tuesday, in an interview with Reuters, “Interest rates will need to continue to rise in the absence of clear progress on inflation.” On Monday, Richmond Fed President Thomas Barkin said that he wants to see more evidence of inflation settling back to target. Recently, Atlanta Fed President Raphael W. Bostic who recently mentioned that the economy is still gaining momentum, but inflation is too high.
Moving on, Thursday’s PBOC may fail to offer a clear guide to the USD/CNH pair watchers until surprising the markets. As a result, the risk catalysts and the Fed Beige Book should be observed for clear directions.
Technical analysis
A three-week-old resistance line joins 50-DMA to restrict short-term USD/CNH advances near 6.8870-80 at the latest.
-
03:56
USD/CAD Price Analysis: 1.3400 appears a tough nut to crack for bulls
- USD/CAD prints mild gains to reverse the previous day’s losses, grinds higher around the key upside hurdle.
- 200-DMA, three-week-old descending trend line and 23.6% Fibonacci retracement together highlight 1.3400 as the key resistance.
- Upward sloping trend line from early February restricts immediate downside amid nearly oversold RSI (14).
USD/CAD bulls jostle with the key upside hurdle around 1.3400 as they reverse the previous day’s pullback moves during sluggish Wednesday morning in Europe. In doing so, the Loonie pair stays on the way to posting the weekly gains after falling heavily in the last week.
That said, a convergence of the 200-DMA, downward-sloping trend line from March 24 and 23.6% Fibonacci retracement level of the USD/CAD pair’s fall during October-November 2022 together highlight 1.3400 as the key upside hurdle.
Also challenging the bulls is the downbeat conditions of the RSI (14) even if the line’s nearness to the oversold territory prods bears.
Should the quote manages to successfully cross the 1.3400 hurdle, the odds of witnessing a fresh monthly high, currently around 1.3555, can’t be ruled out.
However, the 50% and 61.8% Fibonacci retracement levels, respectively near 1.3600 and 1.3695, will precede March’s peak of near 1.3865 to lure the USD/CAD buyers afterward.
Alternatively, pullback moves remain elusive unless the Loonie pair stays beyond an ascending suppot line from early February, close to 1.3330 by the press time.
Following that, a slump to the yearly low marked in February around 1.3260 can’t be ruled out.
USD/CAD: Daily chart
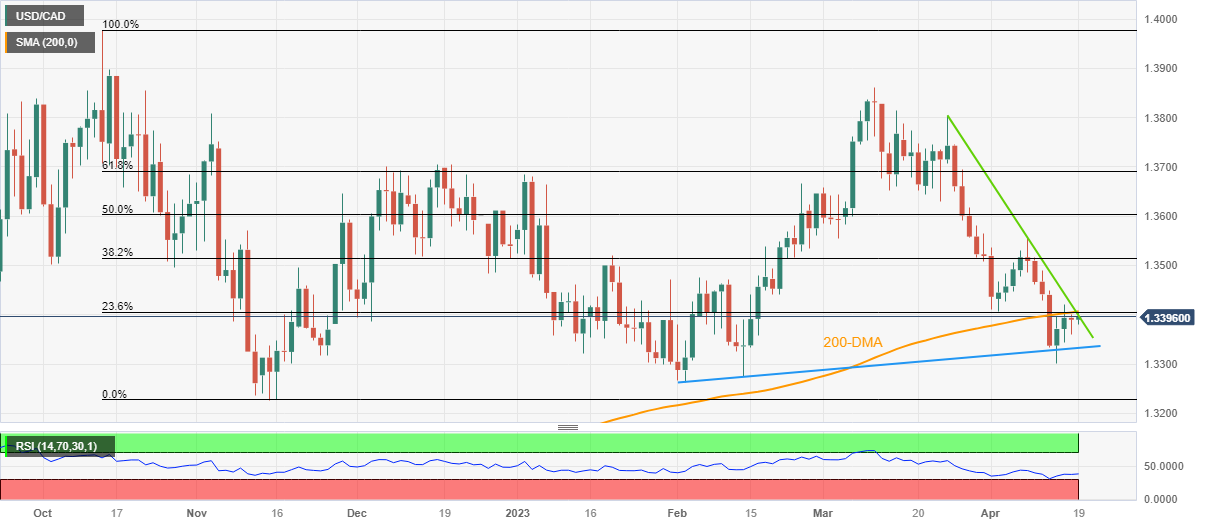
Trend: Further upside expected
-
03:39
Natural Gas Price News: XNG/USD prods three-day recovery at monthly peak near $2.50 on US Dollar rebound
- Natural Gas price retreat from the highest levels in one month to print the first daily loss in three.
- US Dollar recovery, talks of enough gas supplies in UK and warmer weather in the West also prod XNG/USD bulls.
- Geopolitical fears, hawkish Fed bets underpin USD rebound amid sluggish session.
Natural Gas (XNG/USD) price takes a U-turn from the highest levels in one month to print mild losses of around $2.51 during early Wednesday morning in Europe. In doing so, the energy instrument snaps a three-day winning streak amid sour sentiment and the latest rebound in the US Dollar.
Headlines surrounding the US House China Committee’s discussion about the Taiwan invasion scenario and a likely drag on the US debt ceiling decision seem to roil the risk profile of late. On the same line could be the recently downbeat US data and hawkish Fed bets. It should be observed that a mixed earnings season also prods the sentiment and the Natural Gas price.
Furthermore, Bloomberg released news suggesting China’s role in the Russia-Ukraine war, which in turn joins US President Joe Biden’s resistance in negotiating debt limit to also weigh on the sentiment.
Elsewhere, news that the UK has enough gas supplies to survive through the winter and concerns of likely warmer weather in the West seems to have joined the forces with the US Dollar rebound to weigh on the XNG/USD price of late.
That said, the US Dollar Index (DXY) reverses the previous rebound from a one-year low while picking up bids to 101.80 at the latest.
The greenback’s gauge versus six major currencies tracked downbeat yields to take a U-turn the previous day. That said, the US 10-year and two-year Treasury bond coupons dropped for the first time in four days by the end of Tuesday, sluggish around 3.59% and 4.21% by the press time.
Amid these plays, S&P 500 Futures retreated from the highest levels since early February, marked the previous day, as it prints mild losses near 4,178. It’s worth noting that the US stock futures snap a two-day winning streak with the latest inaction.
Moving on, headlines surrounding China and the US Federal Reserve (Fed), as well as the Fed Beige Book, can entertain Natural Gas traders ahead of the weekly inventory data from the US Energy Information Administration (EIA), up for publishing on Thursday.
Technical analysis
Despite the latest pullback, the Natural Gas price remains firmer beyond the 50-DMA level of $2.46 for the first time since late 2022, which in turn keeps the XNG/USD bulls hopeful amid price-positive oscillators.
-
03:30
Commodities. Daily history for Tuesday, April 18, 2023
Raw materials Closed Change, % Silver 25.179 0.66 Gold 2004.79 0.5 Palladium 1607.29 3.2 -
03:24
NZD/USD Price Analysis: Fades bounce off 200-DMA as sellers attack 0.6200
- NZD/USD takes offers to refresh intraday high while reversing below 50-DMA.
- Steady RSI, 200-DMA can challenge short-term Kiwi bears.
- Buyers need validation from previous support line from early March.
NZD/USD reverses the previous day’s recovery by renewing the intraday low to 0.6190 during early Wednesday. In doing so, the Kiwi pair takes a U-turn from slightly below the 50-DMA hurdle, as well as fades the early week’s bounce off the 200-DMA.
It’s worth noting that the steady RSI (14) line joins the Kiwi pair’s inability to cross the DMA band to suggest further sideways performance of the NZD/USD price between the 50-DMA and 200-DMA, respectively near 0.6230 and 0.6160.
Given the quote’s latest U-turn from the 50-DMA, the quote is likely to drop towards the 200-DMA support of 0.6160.
However, the quote’s weakness past 0.6160 could make NZD/USD vulnerable to test the yearly low marked in March around 0.6080.
Following that, the 50% and 61.8% Fibonacci retracement levels of the Kiwi pair’s run-up from October 2022 to February 2023, around 0.6025 and 0.5900 in that order, could lure the bears.
On the flip side, recovery moves not only need to stay beyond the 50-DMA hurdle of 0.6230 but should also mark a successful break of the previous support line stretched from early March, close to 0.6315, to convince the NZD/USD bulls.
Should that happen, the Kiwi pair buyers could easily refresh the monthly high, currently around 0.6385.
NZD/USD: Daily chart
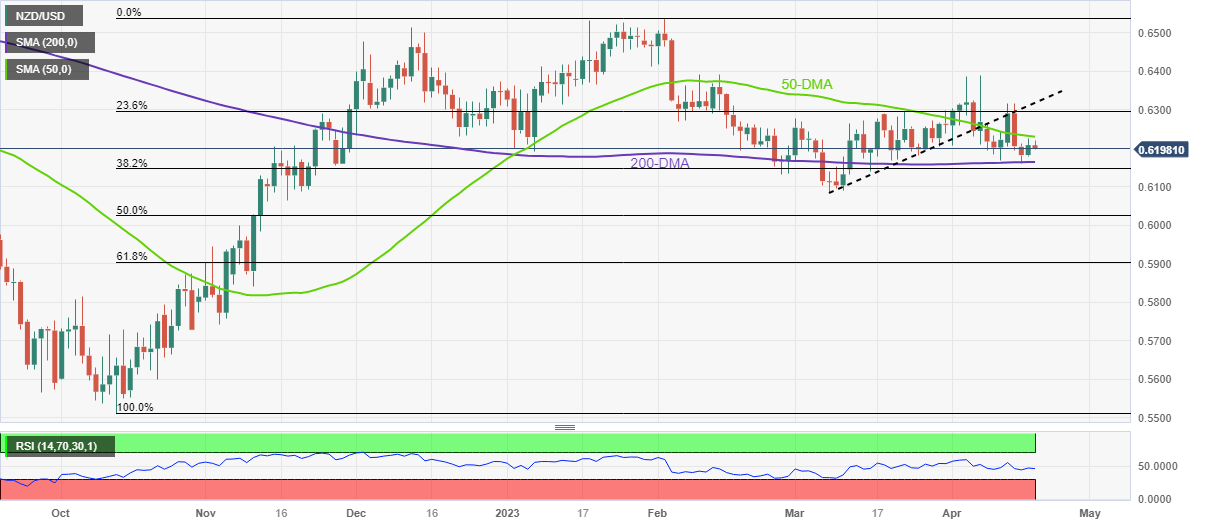
Trend: Limited downside expected
-
03:09
USD/JPY Price Analysis: Bulls move in ahead of a 38.2% correction
- USD/JPY bulls are moving in again as the US Dollar perks up.
- A geometrical H1 chart pattern is starting to form.
As per the prior analysis, USD/JPY Price Analysis: Bears move into the in-the-money longs, front side of bull trend, whereby the price had been drifting toward a 38.2% Fibonacci retracement of the prior bullish impulse. The bulls are making a move that could start to dissolve the downside corrective extension bias as the following will illustrate,
USD/JPY H4 chart
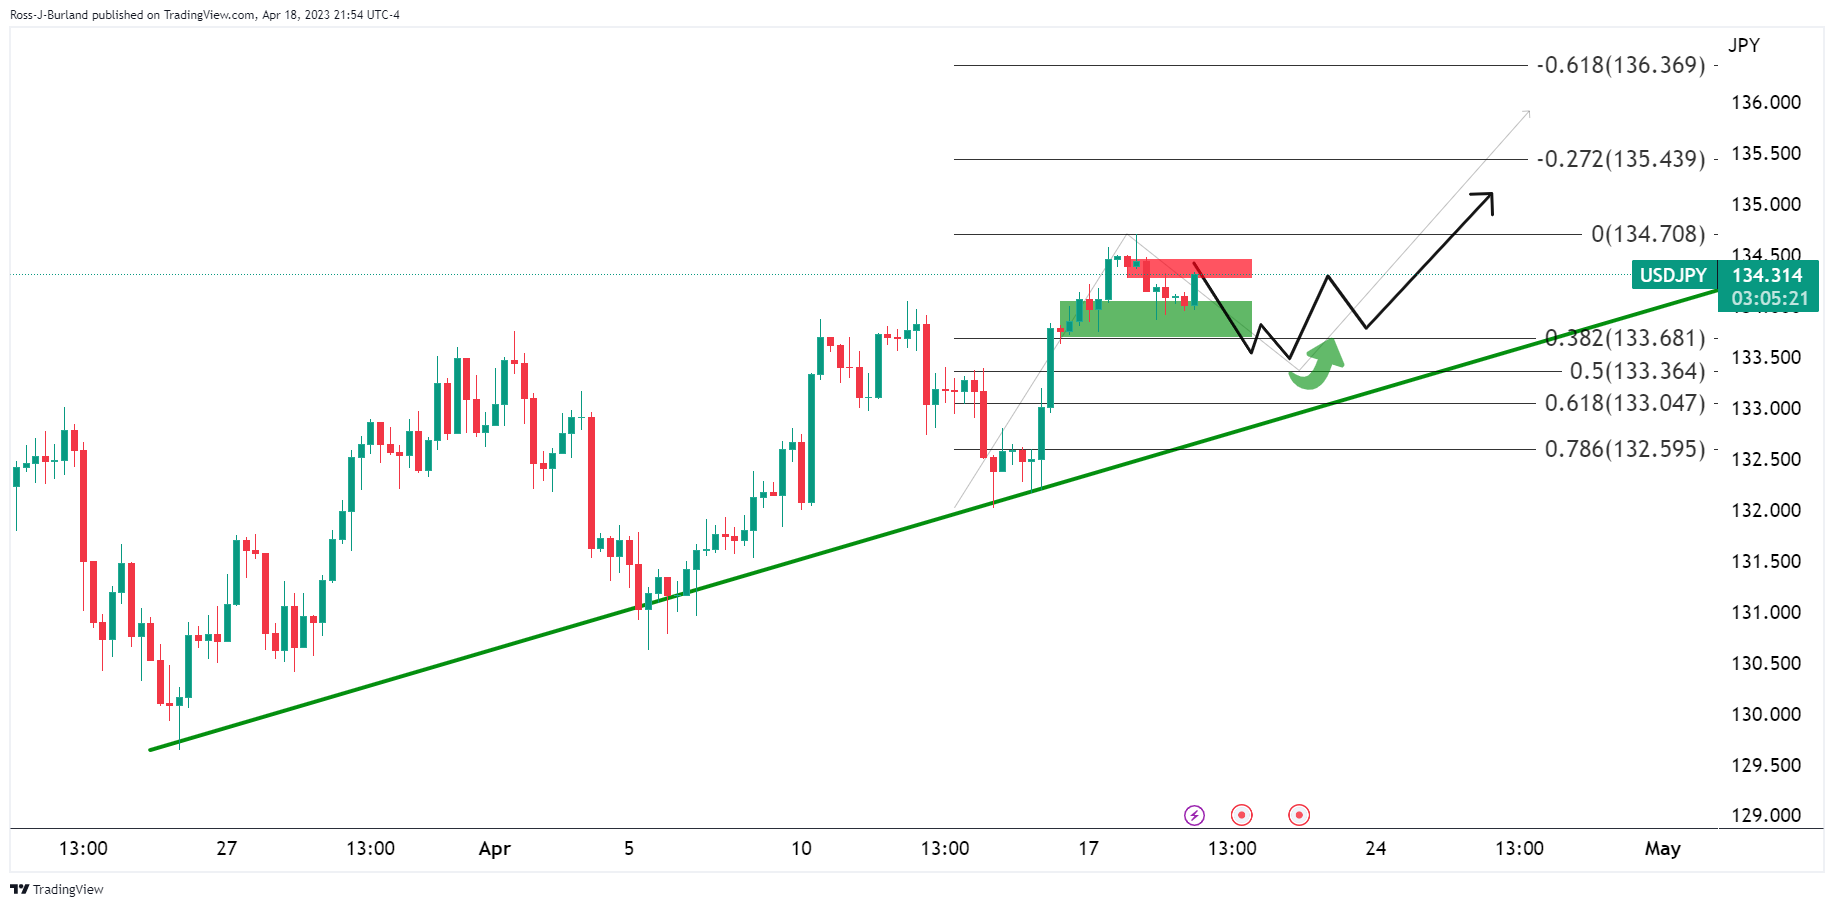
USD/JPY is holding onto the 134 area and bulls are moving in, testing resistance in what could otherwise be a correction underway aiming for the trendline support and lower territory in the 133s.
USD/JPY H1 chart
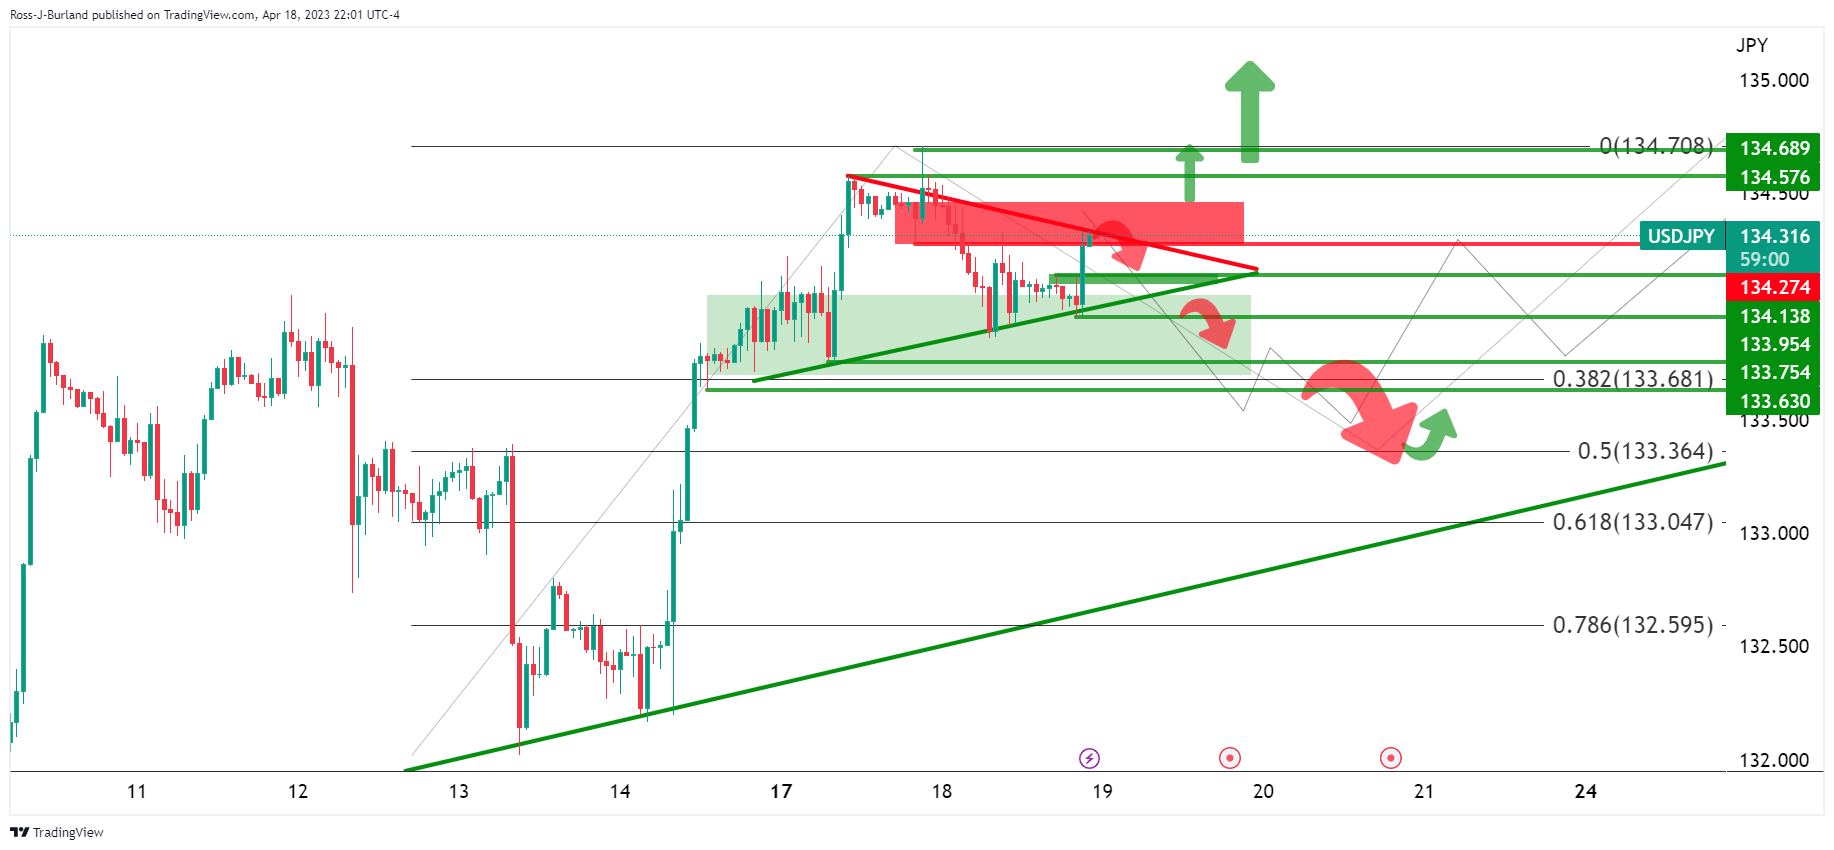
However, the triangle is forming and the coil could see a break out on either side of the geometrical pattern. The 134.50s are key on the upside when the 133.75s guard risk of a deeper correction below a 38.2% Fibonacci retracement. Either way, the bias is bullish while on the front side of the bullish trendline.
-
03:04
EUR/USD retreats towards 1.0950 as ECB, Fed hawks jostle amid sour sentiment
- EUR/USD reverses from intraday high, fades the previous day’s bounce off one-week low.
- Fed, ECB policymakers remain hawkish but divergence between US and European data, yields weigh on greenback.
- Geopolitical fears, cautious mood ahead of US debt ceiling plan prod Euro pair buyers.
- Final readings of Eurozone inflation, Fed Beige Book eyed for fresh impulse.
EUR/USD takes offers to reverse the previous day’s gains, down 0.05% near 1.0965 amid very early Wednesday morning in Europe. In doing so, the Euro pair struggles to justify hawkish comments from the European Central Bank (ECB) and the Federal Reserve (Fed) officials amid sour sentiment and anxious mood ahead of the key catalysts.
That said, the recent chatters surrounding the US House China Committee’s discussion about the Taiwan invasion scenario and a likely drag on the US debt ceiling decision seem to exert downside pressure on the risk profile of late. On the same line could be the recently downbeat US data and hawkish Fed bets. It should be observed that mixed earnings also prod the risk profile and underpin the US Dollar’s corrective bounce.
Furthermore, Bloomberg released news suggesting China’s role in the Russia-Ukraine war, which in turn joins US President Joe Biden’s resistance in negotiating debt limit to also weigh on the sentiment.
Elsewhere, St. Louis Federal Reserve President James Bullard said on Tuesday, in an interview with Reuters, “Interest rates will need to continue to rise in the absence of clear progress on inflation.” On Monday, Richmond Fed President Thomas Barkin said that he wants to see more evidence of inflation settling back to target. Recently, Atlanta Fed President Raphael W. Bostic who recently mentioned that the economy is still gaining momentum, but inflation is too high.
On the other hand, ECB Chief Economist Philip Lane stated Tuesday that the Euro Area economy will not go into recession while also adding that some of the banking tensions have receded and that negative supply shocks are receding.
It should be noted that the mostly upbeat EU data contrasts with the downbeat US housing figures to prod the EUR/USD bears. That said, the latest ZEW Survey data signals that Germany’s headline Economic Sentiment Index worsened in April to 4.1 from 13.0 in March, versus the market expectation of 15.1. However, the Current Situation Index improved to -32.5 from -46.5, compared to analysts’ estimation of -40.0. On a broader front, Eurozone ZEW Economic Sentiment Index dropped to 6.4 for April compared to 10.0 prior and 19.8 market forecasts.
In case of the US data, the US Housing Starts and Building Permits roiled the mood with downbeat prints for March on Tuesday. That said, the Housing Starts eased to 1.42M versus 1.432M prior and 1.40M market forecasts whereas the Building Permits dropped to 1.413M from 1.55M previous readings and analysts’ estimations of 2.2M. It’s worth noting that the NY Empire State Manufacturing Index and the US National Association of Home Builders (NAHB) housing market index marked upbeat prints on Monday and allowed the US Dollar buyers to remain firmer.
Against this backdrop, S&P 500 Futures retreated from the highest levels since early February, marked the previous day, as it prints mild losses near 4,178. It’s worth noting that the US stock futures snap a two-day winning streak with the latest inaction. Also, the US 10-year and two-year Treasury bond coupons dropped for the first time in four days by the end of Tuesday, sluggish around 3.59% and 4.21% by the press time.
Looking ahead, EUR/USD traders may witness further consolidation of the previous day’s gains amid a mildly offbeat mood. However, the final readings of the bloc’s inflation numbers, per the Harmonized Index of Consumer Prices (HICP) gauge for March, will precede the monthly print of the Fed’s Beige Book to entertain the pair traders.
Technical analysis
A one-month-old ascending trend channel keeps EUR/USD buyers hopeful unless the quote breaks the 1.0925-1105 channel area.
-
02:53
USD/CHF Price Analysis: Defends downside near 0.8960 ahead of Fed’s Beige Book release
- USD/CHF is making efforts for recovery after defending the critical support of 0.8960.
- S&P500 futures have shown nominal losses in Asia amid anxiety over earnings data.
- Fed Bostic favored one more rate hike and then holding them above 5% for some time.
The USD/CHF pair is eyeing a recovery after building a base around 0.8960 in the Asian session. The Swiss Franc asset has been defending the aforementioned support for the past two trading sessions. An attempt of recovery by the US Dollar Index (DXY) after correcting to near 101.65 has infused some strength in the Swiss Franc asset.
S&P500 futures have shown nominal losses in Asia amid anxiety over earnings data, portraying a cautionary market mood. The USD Index has rebounded above 101.70 and is expected to add gains ahead amid deepening hawkish Federal Reserve (Fed) bets.
Atlanta Fed Bank President Raphael Bostic said he favors raising interest rates one more time and then holding them above 5% for some time to curb inflation that remains too high, as reported by Bloomberg.
For further guidance, investors are awaiting the release of the Fed’s Beige Book, which will convey the current economic situation of 12 Fed districts.
USD/CHF has sensed barricades at 23.6% Fibonacci retracement (placed from March 08 high at 0.9439 to April 13 low at 0.8860) around 0.9000 on a two-hour scale. The recovery move by the Swiss Franc asset will get strengthened if it manages to climb above the 23.6% Fibo retracement.
The 20-and 50-period Exponential Moving Averages (EMAs) are on the verge of delivering a bullish crossover around 0.8966.
Meanwhile, the Relative Strength Index (RSI) (14) is making efforts for shifting its oscillation in the bullish range of 60.00-80.00.
Should the asset decisively breaks above the 23.6% Fibo retracement around 0.9000, US Dollar bulls will drive the asset towards April 07 low at 0.9034 followed by 38.6% Fibo retracement plotted at 0.9082.
Alternatively, a downside move below April 17 low at 0.8922 will drag the asset toward April 13 low at 0.8860. A slippage below the latter will expose the asset to the round-level support at 0.8800.
USD/CHF two-hour chart
-638174659540738476.png)
-
02:38
S&P 500 Futures retreat amid geopolitical fears, sluggish yields, Fedspeak, China eyed
- S&P 500 Futures ease from 11-week high, snaps two-day winning streak.
- US 10-year, two-year Treasury bond yields remain sluggish after the first daily loss in four.
- Fears of Taiwan invasion, hawkish Fed talks and anxiety surrounding US debt ceiling weigh on sentiment.
- Light calendar prods momentum traders; UK inflation, Fed Beige Book will be the key to watch afterward.
Market sentiment remains dicey while tracing Wall Street’s mixed close amid geopolitical fears emanating from China and Russia. Adding strength to the cautious mood are the chatters surrounding the US debt ceiling and hawkish Federal Reserve (Fed) talks.
While portraying the mood, S&P 500 Futures retreated from the highest levels since early February, marked the previous day, as it prints mild losses near 4,178 during early Wednesday. It’s worth noting that the US stock futures snap a two-day winning streak with the latest inaction.
On the other hand, the US 10-year and two-year Treasury bond coupons dropped for the first time in four days by the end of Tuesday, sluggish around 3.59% and 4.21% by the press time.
The recent chatters surrounding the US House China Committee’s discussion about the Taiwan invasion scenario and a likely drag on the US debt ceiling decision seem to exert downside pressure on the risk profile of late. On the same line could be the recently downbeat US data and hawkish Fed bets. It should be observed that mixed earnings also prod the equity buyers of late.
Recently, Netflix slumped during the aftermarket trading as earnings missed expectations.
On the other hand, the US Housing Starts and Building Permits roiled the mood with downbeat prints for March on Tuesday. That said, the Housing Starts eased to 1.42M versus 1.432M prior and 1.40M market forecasts whereas the Building Permits dropped to 1.413M from 1.55M previous readings and analysts’ estimations of 2.2M.
Furthermore, St. Louis Federal Reserve President James Bullard said on Tuesday, in an interview with Reuters, “Interest rates will need to continue to rise in the absence of clear progress on inflation.” On Monday, Richmond Fed President Thomas Barkin said that he wants to see more evidence of inflation settling back to target. Recently, Atlanta Fed President Raphael W. Bostic who recently mentioned that the economy is still gaining momentum, but inflation is too high.
Elsewhere, Bloomberg released news suggesting China’s role in the Russia-Ukraine war joins US President Joe Biden’s resistance in negotiating debt limit to also weigh on the sentiment.
Amid these plays, WTI crude oil picks up bids to print mild gains above $81.00 while the Gold price struggles around $2,005 amid the inactive US Dollar Index.
Moving on, the monthly release of the Fed’s Beige Book and the UK inflation may entertain traders while the last week of Federal Reserve (Fed) officials' comments before the blackout period, starting from this Saturday, as well as the China talks, will be key to watch for fresh impetus.
Also read: Forex Today: Dollar slides amid quiet market conditions
-
02:29
GBP/USD traders sit tight ahead of UK CPI
- GBP/USD traders await UK inflation data in CPI.
- The markets are pricing in a 25bp hike from the BoE at May 11 meeting.
GBP/USD was last trading at 1.2425, flat on the day, and had traveled from a low of 1.2366 to a high of 1.2449 overnight as the markets digest UK data and look to the next set of ammunition in today´s inflation report.
On Tuesday, there was an unexpected rise in the Unemployment Rate in the three months to February. This had been expected to remain steady at 3.7% and instead rose a tick to 3.8%. However, average hourly earnings came in at 5.9% YoY vs. the 5.1% expected and a revised 5.9% (was 5.7%) previously. The data leaves the focus on a rate hike from the Bank of England at next month´s meeting.
In this regard, analysts at Rabobank noted that net short GBP speculators’ positions have dropped to their lowest level since March 2022 reflecting an improvement in sentiment linked to a slew of less bad UK economic data. ´´The May BoE policy meeting is in view. The market is fully priced for another 25-bps rate hike and sees risk of additional tightening in the coming months.´´
Analysts at Brown Brothers Harriman explained that the WIRP suggests around 90% odds of a 25 bp hike, with another 25 bp hike priced in for August 3. ´´The odds of one last hike in September or November top out near 20%. As a result, the peak policy rate is seen near 4.75% vs. between 4.50-4.75% at the start of last week.´´
All eyes on UK CPI
The headline Consumer Price Index is expected at 9.8% YoY vs. 10.4% in February, while the core is expected at 6.0% YoY vs. 62% in February, and CPIH is expected at 8.7% YoY vs. 9.2% in February.
Analysts at TD Securities explained that ´´inflation is proving stickier than the MPC expected in its February projections.´´ The analysts note that ´´both core goods and services prices are proving persistent. March's inflation data is likely to be boosted by rail fares and food.´´ The analysts argue that ´´the risks to our forecast lie around the latter: we assume that despite some improvement in supplies, prices remained moderately high through March, as seen elsewhere in Europe in other March inflation data.´´
-
02:19
USD/CNY fix: 6.8731 vs. the previous fix of 6.8814
In recent trade today, the People’s Bank of China (PBOC) set the yuan at 6.8731 vs. the previous fix of 6.8814 and the prior close of 6.8766.
About the fix
China maintains strict control of the yuan’s rate on the mainland.
The onshore yuan (CNY) differs from the offshore one (CNH) in trading restrictions, this last one is not as tightly controlled.
Each morning, the People’s Bank of China (PBOC) sets a so-called daily midpoint fix, based on the yuan’s previous day's closing level and quotations taken from the inter-bank dealer.
-
02:10
WTI Price Analysis: Tuesday’s Doji teases Oil buyers around $81.00
- WTI crude oil remains sidelined after posting a price-reversal suggesting candlestick the previous day.
- U-turn from 10-day EMA, firmer RSI (14) also keeps WTI buyers hopeful.
- 200-day EMA, easing bullish bias of MACD prods upside expectations.
- Double tops around $83.30-40 appear a tough nut to crack for Oil bulls to retake control.
WTI crude oil rises to $81.10 early Wednesday, after a sluggish performance on Tuesday.
In doing so, the back gold justifies the previous day’s Doji candlestick which generally suggests a reversal of the previous trend. Herein, it suggests the reversal of the previous week’s pullback from multi-day-old horizontal resistance.
Not only the Doji candlestick but a U-turn from the 10-day Exponential Moving Average (EMA), around $80.60 by the press time, also keeps the Oil buyers hopeful, especially amid a firmer but not overbought RSI (14) line.
However, the 200-day EMA challenges the WTI bulls around $81.70, together with the receding bullish bias of the MACD signals.
Following that, a horizontal area comprising tops marked since December 2022, around $83.30-40, becomes crucial to watch for the Oil buyers as a break that could push back the bearish bias about the commodity.
Alternatively, a downside break of the 10-day EMA level of around $80.60 needs validation from the $80.00 psychological magnet, as well as the previous weekly low of around $79.35, to convince the Oil bears.
Even so, multiple stops around $77.50 may challenge the WTI crude oil bears afterward.
WTI crude oil: Daily chart
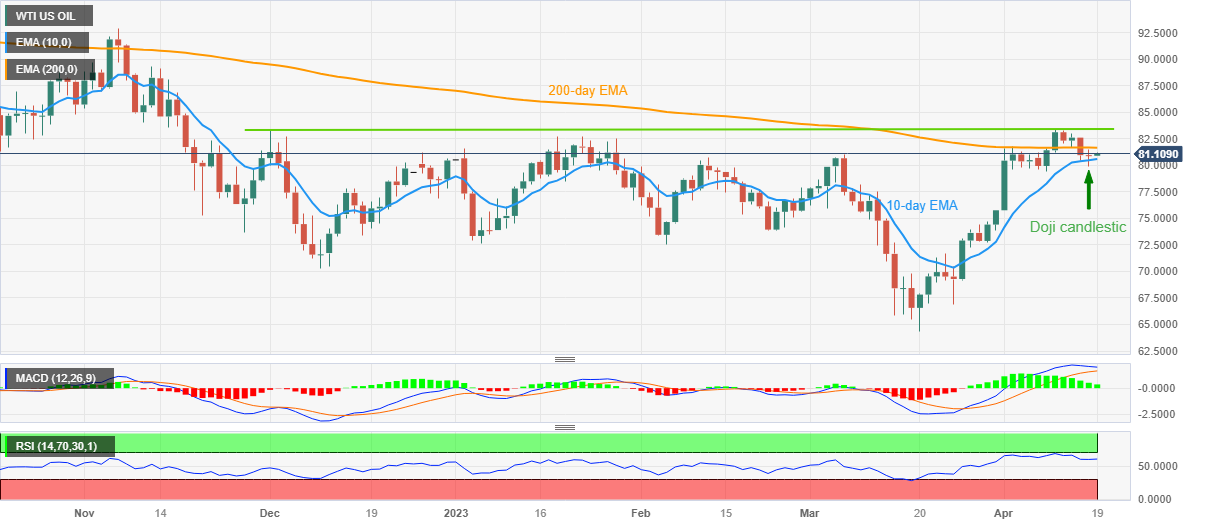
Trend: Further recovery expected
-
02:09
EUR/GBP refreshes day’s high above 0.8830, investors await UK Inflation
- EUR/GBP has printed a fresh day's high at 0.8836 amid hawkish ECB bets.
- Eurozone’s inflation is extremely persistent amid labor shortage so favors a big rate hike ahead.
- March’s UK inflation data holds significant importance as it will be the last before BoE’s May policy meeting.
The EUR/GBP pair has printed a fresh day high after climbing above the critical resistance of 0.8830 in the Tokyo session. The cross is eyeing more upside as the street is anticipating a continuation of the rate hike spell by the European Central Bank (ECB).
Eurozone’s inflation is extremely persistent amid the labor shortage, which is resulting in higher employment bills from firms. Apart from that, supply chain disruptions after the Russia-Ukraine war have not cleared, which have been fueling inflationary pressures for a long period.
European Central Bank (ECB) President Christine Lagarde is expected to face the issue of deciding the pace of rate hikes as the continuation of bigger rate hikes could trigger recession fears. Bloomberg reported that a majority is expecting the European Central Bank (ECB) to hike rates by 25 basis points (bps) at its May, June, and July policy meetings before pausing its tightening cycle, after a survey from economists. “That would take the deposit rate to 3.75%, where it would stay through the rest of the year.”
On the Pound Sterling front, higher Average Earnings data cemented the need for further rate hikes from the Bank of England (BoE). Three month Labor cost index (excluding bonuses) has landed higher at 6.6% than the consensus of 6.2% but in line with the prior release. Higher earnings are expected to keep inflationary pressures elevated, which will force BoE Governor Andrew Bailey to raise rates further.
Further, UK’s Consumer Price Index (CPI) data will be keenly watched. As per the consensus, monthly UK inflation has accelerated by 0.5% against a 1.1% elevation recorded in February. Annual CPI is expected to soften to 9.85 from the former release of 10.4%. Core CPI that excludes oil and food prices is expected to decelerate to 6.0% from the former release of 6.2%. March’s inflation data holds significant importance as it will be the last before May’s monetary policy meeting.
-
02:08
Australia Westpac Leading Index (MoM): -0.01% (March) vs -0.06%
-
01:48
Gold Price Forecast: XAU/USD grinds within bullish channel despite easy United States Treasury yields, Dollar
- Gold price grinds higher after snapping two-day losing streak the previous day.
- Softer United States data contrasts with upbeat China statistics to underpin XAU/USD rebound.
- US Treasury bond yields, US Dollar bear the burden of downbeat data, anxiety ahead of United States debt ceiling plan.
- Gold buyers need support of risk-on mood to refresh YTD high.
Gold price (XAU/USD) stays defensive around $2,005 amid sluggish Wednesday morning in Asia. In doing so, the XAU/USD bulls reassess the latest catalysts that helped the Gold price snap a two-day downtrend as market sentiment dwindles due to mixed signals and a cautious mood ahead of an important event. Even so, downbeat US Dollar and United States Treasury bond yields put a floor under the commodity’s price.
Gold price cheers softer United States Treasury bond yields, US Dollar
Gold price managed to post the first daily gains in three as downbeat United States Treasury bond yields joined the US Dollar weakness amid softer US data. That said, the US Dollar Index (DXY) reverses the previous rebound from a one-year low while printing the second daily loss in four. The greenback’s gauge versus six major currencies tracks downbeat yields to take a U-turn the previous day. That said, the US 10-year and two-year Treasury bond coupons dropped for the first time in four days by the end of Tuesday, sluggish around 3.59% and 4.21% by the press time.
Softer US data supersede hawkish Federal Reserve talks to propel XAU/USD price
Talking about the United States data, the US Housing Starts and Building Permits roiled the mood with downbeat prints for March on Tuesday. That said, the Housing Starts eased to 1.42M versus 1.432M prior and 1.40M market forecasts whereas the Building Permits dropped to 1.413M from 1.55M previous readings and analysts’ estimations of 2.2M. It’s worth noting that the NY Empire State Manufacturing Index and the US National Association of Home Builders (NAHB) housing market index marked upbeat prints on Monday and allowed the US Dollar buyers to remain firmer.
On the contrary, comments from the Federal Reserve (Fed) Officials have been hawkish of late. On Tuesday, St. Louis Federal Reserve President James Bullard said, in an interview with Reuters, “Interest rates will need to continue to rise in the absence of clear progress on inflation.” On Monday, Richmond Fed President Thomas Barkin said that he wants to see more evidence of inflation settling back to target. Recently, Atlanta Fed President Raphael W. Bostic who recently mentioned that the economy is still gaining momentum, but inflation is too high.
Hence, the downbeat US data supersedes the hawkish Fed talks and propel the Gold price.
Upbeat China statistics, market’s indecision keeps Gold buyers hopeful
Talking about the United States data, the US Housing Starts and Building Permits roiled the mood with downbeat prints for March on Tuesday. That said, the Housing Starts eased to 1.42M versus 1.432M prior and 1.40M market forecasts whereas the Building Permits dropped to 1.413M from 1.55M previous readings and analysts’ estimations of 2.2M. It’s worth noting that the NY Empire State Manufacturing Index and the US National Association of Home Builders (NAHB) housing market index marked upbeat prints on Monday and allowed the US Dollar buyers to remain firmer.
On the contrary, comments from the Federal Reserve (Fed) Officials have been hawkish of late. On Tuesday, St. Louis Federal Reserve President James Bullard said, in an interview with Reuters, “Interest rates will need to continue to rise in the absence of clear progress on inflation.” On Monday, Richmond Fed President Thomas Barkin said that he wants to see more evidence of inflation settling back to target. Recently, Atlanta Fed President Raphael W. Bostic who recently mentioned that the economy is still gaining momentum, but inflation is too high.
Hence, the downbeat US data supersedes the hawkish Fed talks and propel the Gold price.
Gold price technical analysis
Gold price remains firmer inside a one-month-old ascending trend channel, recently bouncing off the 100-bar Simple Moving Average (SMA).
In addition to the bullish chart formation, the looming bull cross on the Moving Average Convergence and Divergence (MACD) indicator, as well as the upward-sloping Relative Strength Index (RSI) line, placed at 14, also keeps XAU/USD buyers hopeful.
However, multiple hurdles around $2,030 and the aforementioned channel’s top line, close to $2,053 by the press time, could challenge the Gold price upside ahead of directing the bulls towards the previous yearly top of $2,070.
Following that, the record top of $2,075, marked in 2020, will be in the spotlight.
Meanwhile, the 100-SMA and bottom line of the stated channel, close to $1,993 and $1,982 in that order, restrict short-term Gold price downside ahead of the 200-SMA support of near $1,947.
It should be noted that the XAU/USD’s weakness past 200-SMA makes it vulnerable to drop toward the previous monthly low, around $1,809.
Gold price: Four-hour chart
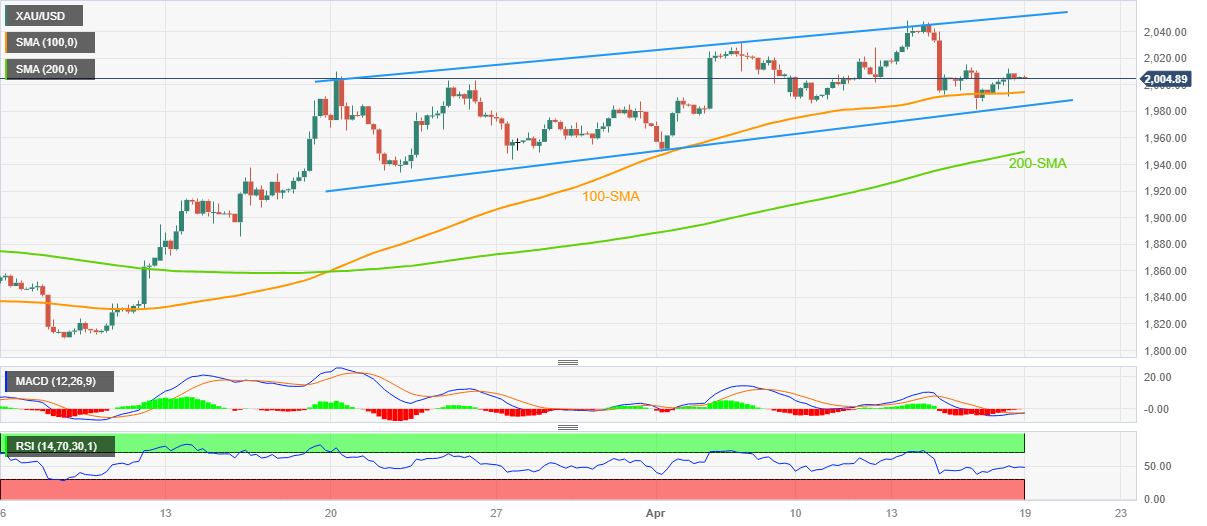
Trend: Further upside expected
-
01:42
AUD/USD Price Analysis: Stretches recovery to near 0.6740 ahead of PBoC’s decision
- AUD/USD has shown a recovery move amid a soft performance by the USD Index.
- The RBA minutes showed that policymakers were actively discussing a rate hike but concluded the meeting with steady interest rates.
- AUD/USD is auctioning in an Inverted Flag that displays a long consolidation and is followed by a breakdown.
The AUD/USD pair has rebounded firmly to near 0.6740 after a gradual correction. The Aussie asset witnessed stellar buying interest amid the soft US Dollar and an upside revision in forecast for China’s growth rate. The US Dollar Index (DXY) is showing a quiet action ahead of the release of the Federal Reserve’s (Fed) Beige Book.
The Australian Dollar remained in action on Tuesday after the release of the Reserve Bank of Australia (RBA) minutes. The RBA minutes showed that policymakers were actively discussing a rate hike but concluded the meeting with a decision of keeping rates steady at 3.6%. RBA Governor Philip Lowe cited that the central bank needs some time to gather information for further action.
Forecasting agencies were gung ho for raising China’s Gross Domestic Product (GDP) forecast after an upbeat quarterly performance. Going forward, the interest rate decision by the People’s Bank of China (PBoC) will be the key highlight. It is worth noting that Australia is the leading trading partner of China and upbeat Chinese prospects would support the Australian Dollar.
AUD/USD is auctioning in an Inverted Flag chart pattern on an hourly scale. An Inverted Flag is a trend-following pattern which displays a long consolidation that is followed by a breakdown. Usually, the consolidation phase of the chart pattern serves as an inventory adjustment in which those participants initiate shorts, which prefer to enter an auction after the establishment of a bearish bias and current sellers add more positions.
The 20-period Exponential Moving Average (EMA) at 0.6720 is overlapping the asset price, indicating a lackluster performance.
Meanwhile, the Relative Strength Index (RSI) (14) is hovering in the 40.00-60.00 range, signaling an absence of a potential trigger.
Going forward, a break above March 22 high at 0.6759 will drive the asset toward April 03 high at 0.6693. A breach above the latter would further drive the asset to February 06 low at 0.6855.
In an alternative scenario, more weakness will be observed on a breakdown of April 10 low at 0.6620, which will expose the Aussie asset to March 10 low at 0.6564 followed by the round-level support at 0.6500.
AUD/USD four-hour chart
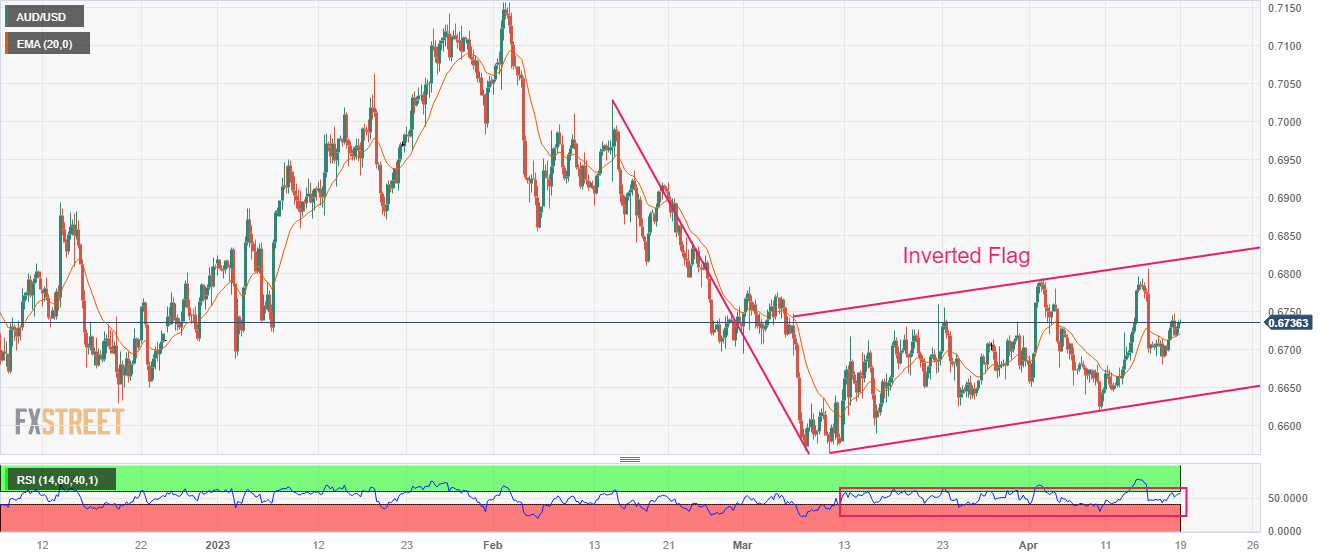
-
01:35
US House China Committee to war-game Taiwan invasion scenario
Axios has reported that the House China Select Committee this week will be war-gaming a scenario in which China invades Taiwan.
The article says, ´´it's a unique opportunity that will allow bipartisan members of Congress to walk through the potential challenges and identify the best legislative responses to deter and combat an invasion.´´
Axios reports that ´´on Wednesday evening, bipartisan members of the House panel on China, led by Chair Mike Gallagher (R-Wis.), will step into the shoes of US officials in a war-game simulation conducted by the Center for a New American Security, a Washington-based think tank focused on national security.´´
Indeed, the geopolitics is piping up and it is generally acknowledged that a Chinese invasion of Taiwan, drawing in the US and possibly Japan, Australia, and Britain, could dwarf the Ukraine crisis both in scale and danger. The US has been beating the war drum saying that an attack is probable and feasible.
-
01:30
Stocks. Daily history for Tuesday, April 18, 2023
Index Change, points Closed Change, % NIKKEI 225 144.05 28658.83 0.51 Hang Seng -131.94 20650.51 -0.63 KOSPI -4.82 2571.09 -0.19 ASX 200 -21.3 7360.2 -0.29 FTSE 100 29.94 7909.44 0.38 DAX 93.14 15882.67 0.59 CAC 40 35.45 7533.63 0.47 Dow Jones -10.55 33976.63 -0.03 S&P 500 3.55 4154.87 0.09 NASDAQ Composite -4.31 12153.41 -0.04 -
01:25
USD/JPY grinds near 134.00 as US Dollar, yields fail to cheer hawkish Fed bets
- USD/JPY seeks fresh direction after reversing from the highest levels in five weeks.
- Downbeat US data surpsede hawkish Fed talks and weigh on US Dollar, Treasury bond yields.
- Japan’s Reuters Tankan survey flashes unimpressive figures while BoJ officials defend easy-money policy.
- Risk catalysts eyed for clear directions, yields, central bank talks are the key for fresh impulse.
USD/JPY picks up bids to pare the previous day’s U-turn from a five-week high around 134.00 as Tokyo opens for Wednesday. In doing so, the Yen pair fails to cheer the downbeat US Dollar and the Treasury bond yields amid a sluggish start to the day. Also likely to have prod the Yen pair could be the latest Reuters Tankan Survey data.
That said, Japan’s Reuters Tankan Survey for April reprints -3.0 figure for Large Manufacturers whereas the Non-Manufacturers’ April index rose to 24 versus 21 in March.
Apart from the overall upbeat Japan data, the Bank of Japan (BoJ) Official’s defense of the ultra-easy monetary policy renews concerns about the BoJ’s exit from easy money and weighs on the USD/JPY price. That said, New Bank of Japan (BoJ) Governor Kazuo Ueda said that BoJ bond purchases are not aimed at monetizing government debt while adding, “Interest rates are determined by various factors.” The policymaker also stated that there is no immediate need to review the 2013 joint statement with the government. Before BoJ’s Ueda, the newly appoint BoJ Deputy Governor Shinichi Uchida also tried to defend the current monetary policy as he said, “Fiscal constraints won't undermine the ability to carry out monetary policy.”
It’s worth noting that the US Housing Starts and Building Permits roiled the mood with downbeat prints for March on Tuesday. That said, the Housing Starts eased to 1.42M versus 1.432M prior and 1.40M market forecasts whereas the Building Permits dropped to 1.413M from 1.55M previous readings and analysts’ estimations of 2.2M.
Also weighing on the US Dollar and yields, as well as the USD/JPY pair could be the Fed policymakers’ failed attempt to convince markets of the US central bank’s hawkish ability. That said, US Housing Starts and Building Permits roiled the mood with downbeat prints for March on Tuesday. That said, the Housing Starts eased to 1.42M versus 1.432M prior and 1.40M market forecasts whereas the Building Permits dropped to 1.413M from 1.55M previous readings and analysts’ estimations of 2.2M.
Against this backdrop, S&P 500 Futures print mild losses and Wall Street closed mixed. Further, the US 10-year and two-year Treasury bond coupons dropped for the first time in four days by the end of Tuesday, sluggish around 3.59% and 4.21% by the press time.
Looking forward, Japan’s Industrial Production for February will precede the Fed Beige book to direct short-term USD/JPY moves. It should be noted that the recent challenges to the sentiment, emanating from China, seem to also exert downside pressure on the Yen pair amid a light calendar and a sluggish day.
Technical analysis
Despite reversing from a one-month-old ascending resistance line, around 134.80 by the press time, the USD/JPY bears need validation from the 21-DMA and a three-week-old ascending support line, respectively near 132.50 and 131.85, to convince sellers.
-
01:15
Currencies. Daily history for Tuesday, April 18, 2023
Pare Closed Change, % AUDUSD 0.6725 0.34 EURJPY 147.091 0.1 EURUSD 1.09711 0.4 GBPJPY 166.573 0.1 GBPUSD 1.24251 0.4 NZDUSD 0.62073 0.37 USDCAD 1.33912 -0.02 USDCHF 0.89637 -0.23 USDJPY 134.066 -0.3 -
00:59
NZD/USD approaches 0.6220 gently amid subdued US Dollar, NZ Inflation eyed
- NZD/USD is gently marching towards 0.6220 amid a subdued performance in the USD Index.
- S&P500 futures have extended their losses as investors are worried about further performance from equities.
- NZ inflation is expected to get stubborn further despite higher rates by the RBNZ.
The NZD/USD pair is showing a lethargic action in the Asian session after defending the round-level support of 0.6200. The Kiwi asset is approaching the 0.6220 resistance amid a subdued performance by the US Dollar Index (DXY).
S&P500 futures have extended their losses as investors are worried about further performance from equities, portraying a cautious performance. A mixed performance has been observed from US commercial banks yet. Earlier, investors were anxious over the quarterly performance of banking stocks after turmoil in March and tight credit conditions by them.
The US Dollar Index (DXY) is hovering above 101.78 after a steep correction. The USD Index failed to show a power-pack action despite hawkish commentaries from Federal Reserve (Fed) policymakers. St. Louis Fed President James Bullard advocated for the continuation of the policy-tightening spell by the central bank considering the fact that labor market data is still solid, as reported by Reuters.
Fed policymaker believes that overall consumption gets fueled by strong labor demand, which fades the chances of a recession in the second half of 2023.
On the New Zealand Dollar front, investors are awaiting the release of the quarterly inflation data, which is scheduled for Thursday. According to the consensus, NZ Consumer Price Index (CPI) has accelerated by 2.0% in the first quarter of CY2023, higher than the former pace of 1.4%. Annual NZ inflation data has scaled to 7.5% from the former release of 7.2%. Households in the NZ economy are expected to face an extreme burden as NZ inflation is getting stubborn dramatically despite higher rates by the Reserve Bank of New Zealand (RBNZ).
This also conveys that RBNZ Governor Adrian Orr would continue hiking rates further to put a lid on galloping inflation.
-
00:58
USD/CAD looks to regain 1.3400 as softer Canada inflation, unimpressive BoC’s Macklem join sluggish Oil price
- USD/CAD picks up bids to pare recent losses, defends the previous week’s rebound from two-month low.
- Canada inflation softens in March, BoC Governor Tiff Macklem fails to convince markets of hawkish bias.
- Oil price fails to cheer softer US Dollar, upbeat China data and API inventory draw.
- Second-tier Canada, US data and Fed’s Beige Book will be in focus for intraday directions, risk catalysts are the key.
USD/CAD regains upside momentum, despite being slow of late, as it grinds higher towards the 1.3400 round figure following the previous day’s failed attempt to recall bears. In doing so, the Loonie pair buyers ignore the downbeat US Dollar and sluggish Oil price amid softer Canada inflation data and unimpressive comments from Bank of Canada (BoC) Governor Tiff Macklem. That said, the Loonie pair prods a three-week-old descending resistance line around 1.3395 by the press time of the early Asian session on Wednesday.
On Tuesday, Canadian inflation, as measured by the Consumer Price Index (CPI), matches market forecasts of 4.3% YoY and 0.5% MoM for March versus 5.2% YoY and 0.4% MoM printed for February. More importantly, the Bank of Canada's (BoC) Core CPI, which excludes volatile food and energy prices, dropped to 4.3% YoY compared to 4.2% analysts’ estimations and 4.7% prior.
Following the downbeat inflation numbers, BoC’s Macklem appeared before the House of Commons Standing Committee on Finance while stating that the central bank considered the need for rates to stay higher longer to return inflation to 2% target. "Annual CPI inflation was down to 4.3% in March, led by falling goods price inflation, and we see further declines ahead. That's good news," added BoC’s Macklem while speaking in front of a parliamentary committee.
On the other hand, the US Housing Starts and Building Permits roiled the mood with downbeat prints for March on Tuesday. That said, the Housing Starts eased to 1.42M versus 1.432M prior and 1.40M market forecasts whereas the Building Permits dropped to 1.413M from 1.55M previous readings and analysts’ estimations of 2.2M. It’s worth noting that the NY Empire State Manufacturing Index and the US National Association of Home Builders (NAHB) housing market index marked upbeat prints on Monday and allowed the US Dollar buyers to remain firmer.
With the downbeat US data, the hawkish Fed talks failed to impress the US Dollar bulls and hence the US Dollar Index (DXY) reverses the latest rebound from a one-year low while printing the second daily loss in four. The greenback’s gauge versus six major currencies tracks downside yields to take a U-turn the previous day, not to forget the softer data. That said, the US 10-year and two-year Treasury bond coupons dropped for the first time in four days by the end of Tuesday.
That said, St. Louis Federal Reserve President James Bullard said, in an interview with Reuters, “Interest rates will need to continue to rise in the absence of clear progress on inflation.” On Monday, Richmond Fed President Thomas Barkin said that he wants to see more evidence of inflation settling back to target. Following him was Atlanta Fed President Raphael W. Bostic who recently mentioned that the economy is still gaining momentum, but inflation is too high.
Against this backdrop, S&P 500 Futures print mild losses and Wall Street closed mixed. It’s worth noting that WTI crude oil, Canada’s key export item, remains sluggish around $81.00 despite the downbeat US Dollar, firmer China data and price-positive inventory numbers from the American Petroleum Institute (API).
Moving on, Canada Housing Starts, Industrial Product Price and Raw Material Price for March will join Fed’s monthly Beige Book to direct immediate USD/CAD moves. However, the dovish bias surrounding BoC can keep the Loonie pair buyers hopeful.
Technical analysis
A daily closing beyond the 200-DMA hurdle of around 1.3410 becomes necessary for the USD/CAD to convince even short-term buyers.
-
00:43
EUR/USD Price Analysis: Wishes to recapture 1.1000 despite hawkish Fed commentaries
- EUR/USD is expected to show a steep bullish momentum after breaking above the 1.1000 resistance.
- The Euro is struggling to find any direction as investors are divided about the pace of hiking rates by the ECB.
- EUR/USD showed a confident reversal after dropping to near the upward-sloping trendline plotted from 1.0714.
The EUR/USD pair is displaying a sideways auction below 1.0980 in the early Tokyo session. The major currency pair displayed a sharp rebound on Tuesday but failed to extend further. The sideways performance in the shared currency pair was the outcome of the lackluster US Dollar Index (DXY). The USD Index got rangebound after a corrective move below 101.80.
S&P500 futures are showing mild losses in early Asia after a volatile session. A stock-specific action was observed in US equities as giants like Goldman Sachs and Johnson & Johnson failed to match forecasted earnings.
The Euro is struggling to find any direction as investors are divided about the pace of hiking rates by the European Central Bank (ECB) in its May monetary policy meeting. One school of thought is still not convinced that ECB President Christine Lagarde will trim the pace of policy-tightening to 25 basis points (bps) in times when Eurozone inflation seems critically persistent.
On a two-hour scale, EUR/USD showed a confident reversal after dropping to near the upward-sloping trendline plotted from March 24 low at 1.0714 on a two-hour scale. The major currency pair is approaching the horizontal resistance plotted from April 14 high at 1.1075.
The Euro has pushed the asset above the 20-period Exponential Moving Average (EMA) at 1.0964, which indicates that the short-term trend has turned bullish.
Also, the Relative Strength Index (RSI) (14) has shifted into the 40.00-60.00 range from the bearish range of 20.00-40.00, which indicates that the shared continent currency is not bearish anymore.
A break above the psychological resistance of 1.1000 will drive the asset to a fresh annual high at 1.1068, followed by the round-level resistance at 1.1100.
On the flip side, a decisive break below April 12 low at 1.0915 will drag the asset towards April 10 low at 1.0837 and April 03 low at 1.0788.
EUR/USD two-hour chart

-
00:23
Silver Price Analysis: XAG/USD bounces off one-month-old support to prod 50-SMA above $25.00
- Silver price grinds higher after snapping two-day downtrend, taking a U-turn from one-month-old ascending trend line.
- Receding bearish bias of the MACD, steady RSI (14) allow XAG/USD buyers to extend latest rebound past 50-SMA.
- Support-turned-resistance line from early March appears crucial for Silver buyers to tackle.
- XAG/USD bears have a bumpy road on their return unless breaking 200-SMA.
Silver price (XAG/USD) seesaws around $25.20 after bouncing off short-term key support to defy the two-day losing streak the previous day. Even so, the bright metal struggles with the 50-SMA to justify the recent improvement in the bullish bias.
That said, the receding strength of the bearish MACD signals and steady RSI (14) can offer a tailwind to the recent recovery moves of the XAG/USD and allow it to cross the immediate hurdle, namely the 50-SMA level surrounding $25.25.
However, the previous support line stretched from March 10, around $25.95 by the press time, quickly followed by the $26.00 round figure, will challenge the Silver buyers afterward.
Also acting as an upside filter is the latest swing high of $26.06, also the highest level since April 2022.
Should the XAG/USD price remains firmer past $26.06, the odds of witnessing a run-up towards crossing the April 2022 peak of near $26.25 and then a rally targeting the previous yearly peak of $26.95 can’t be ruled out.
On the flip side, the downside break of the aforementioned one-month-old upward-sloping support line, around $25.00 by the press time, restricts the immediate downside of the Silver price.
Following that, a horizontal area comprising multiple lows marked since April 05, around $24.80-70, could challenge the XAG/USD sellers.
It should be noted, however, that the Silver bears should remain cautious unless witnessing a clear downside break of the 200-SMA support level surrounding $23.05 at the latest.
Silver price: Four-hour chart

Trend: Further recovery expected
-
00:20
US Dollar Price Analysis: Bulls eye a run to test 102.80 structure
- US Dollar bulls are lurking above 101.50.
- Inverse Head and shoulders on the cards for a move to test 102.80 key resistance structure.
The US Dollar was pulled into a bearish correction on Tuesday after better-than-forecast growth data from China which is throwing the technicals into what could be a bullish chart pattern at the bottom of the micro bear trend:
US Dollar daily chart
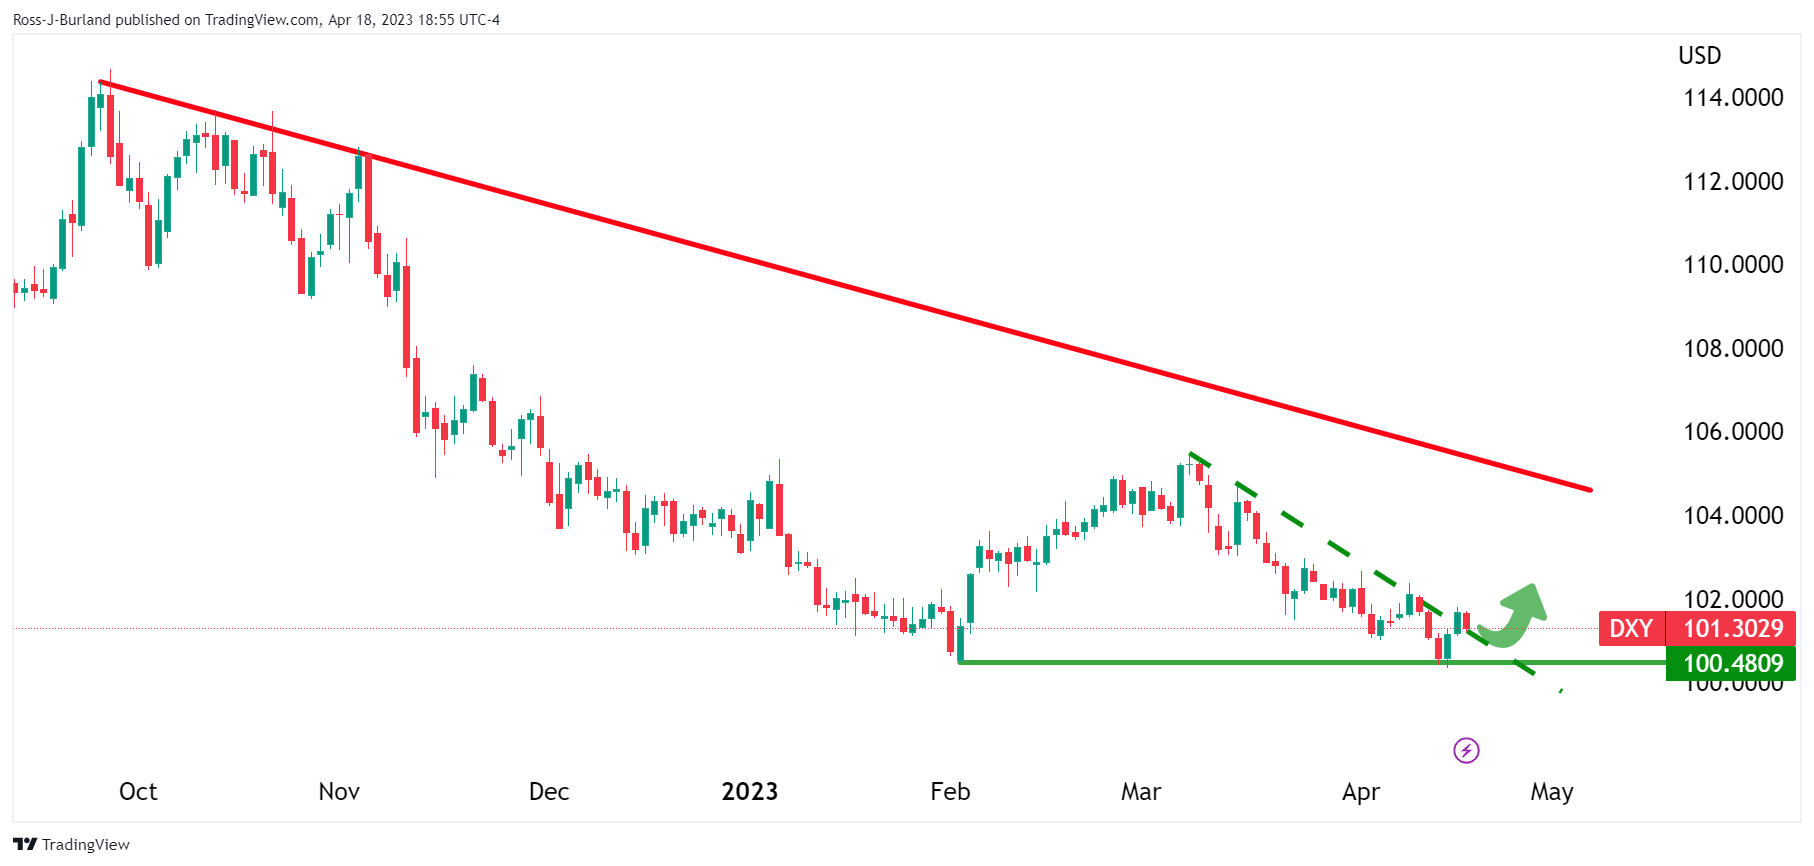
The bulls managed to pierce the trendline resistance but there has been no follow-through. However, a bullish schematic could be playing out in the form of an inverse head and shoulders:

US Dollar H4 charts
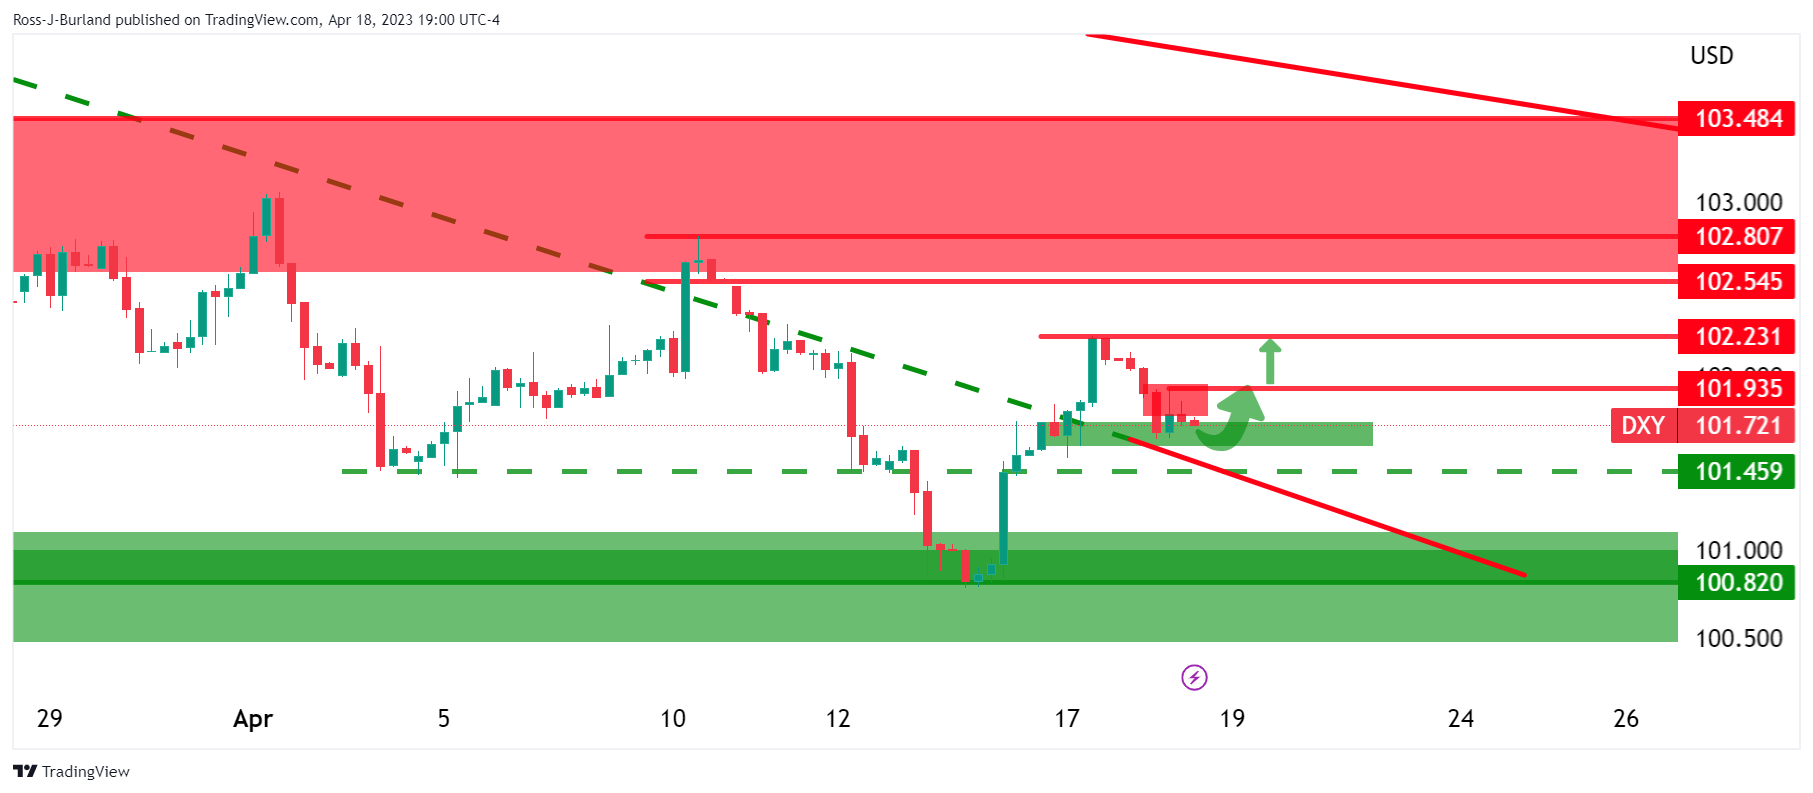
The bullish scenario could look something like the above as the bulls seek to move in on the 102.20s and then the key 102.80 structure while the bearish scenario, which is so far playing out, could look as follows:

The 101.50s will be key in this regard as this protects the countertrend. A break back onto the front side of the bearish trend would not only invalidate the inverse head and shoulders thesis, but it could subsequently lead to a significant downside continuation and a lower low if 100.80 is broken.
-
00:12
GBP/JPY Price Analysis: Bulls take a respite after printing a YTD high at 167.00
- GBP/JPY uptrend is still active but facing tough resistance at around 167.00.
- Downside risks in the GBP/JPY lie below 166.16, followed by 166.00.
The GBP/JPY stalls at around 166.60s, unable to crack the YTD high at 167.00, printed on Tuesday, as Wednesday’s Asian session commence. Nevertheless, the GBP/JPY uptrend remains intact unless the quote tumbles below the last week’s low of 165.40, which could pave the way for further losses.
GBP/JPY Price Action
Given the backdrop, the GBP/JPY recent trend stays in play, though it’s facing a wall of resistance. However, if it clears 167.00, a leg up toward the December 16 high at 168.00 might be on the cards. The move could be denied if the Relative Strength Index (RSI) enters the oversold territory, which it’s about to happen.
The Rate of Change (RoC) suggests that the pair is peaking near the 167.00 area, with volatility shrinking towards neutral levels. Therefore, don’t discount that sellers could step in should traders’ sentiment deteriorates, which could open the door for a pullback.
If GBP/JPY drops below the April 18 daily low of 166.16, that could pave the way to test the 166.00 round number. Once cleared, a dip toward the 20-day Exponential Moving Average (EMA at 164.69 is on the cards. But some hurdles on the way south must be surpassed, like the April 14 low at 165.40, followed by the 165.00 figure.
GBP/JPY Daily Chart
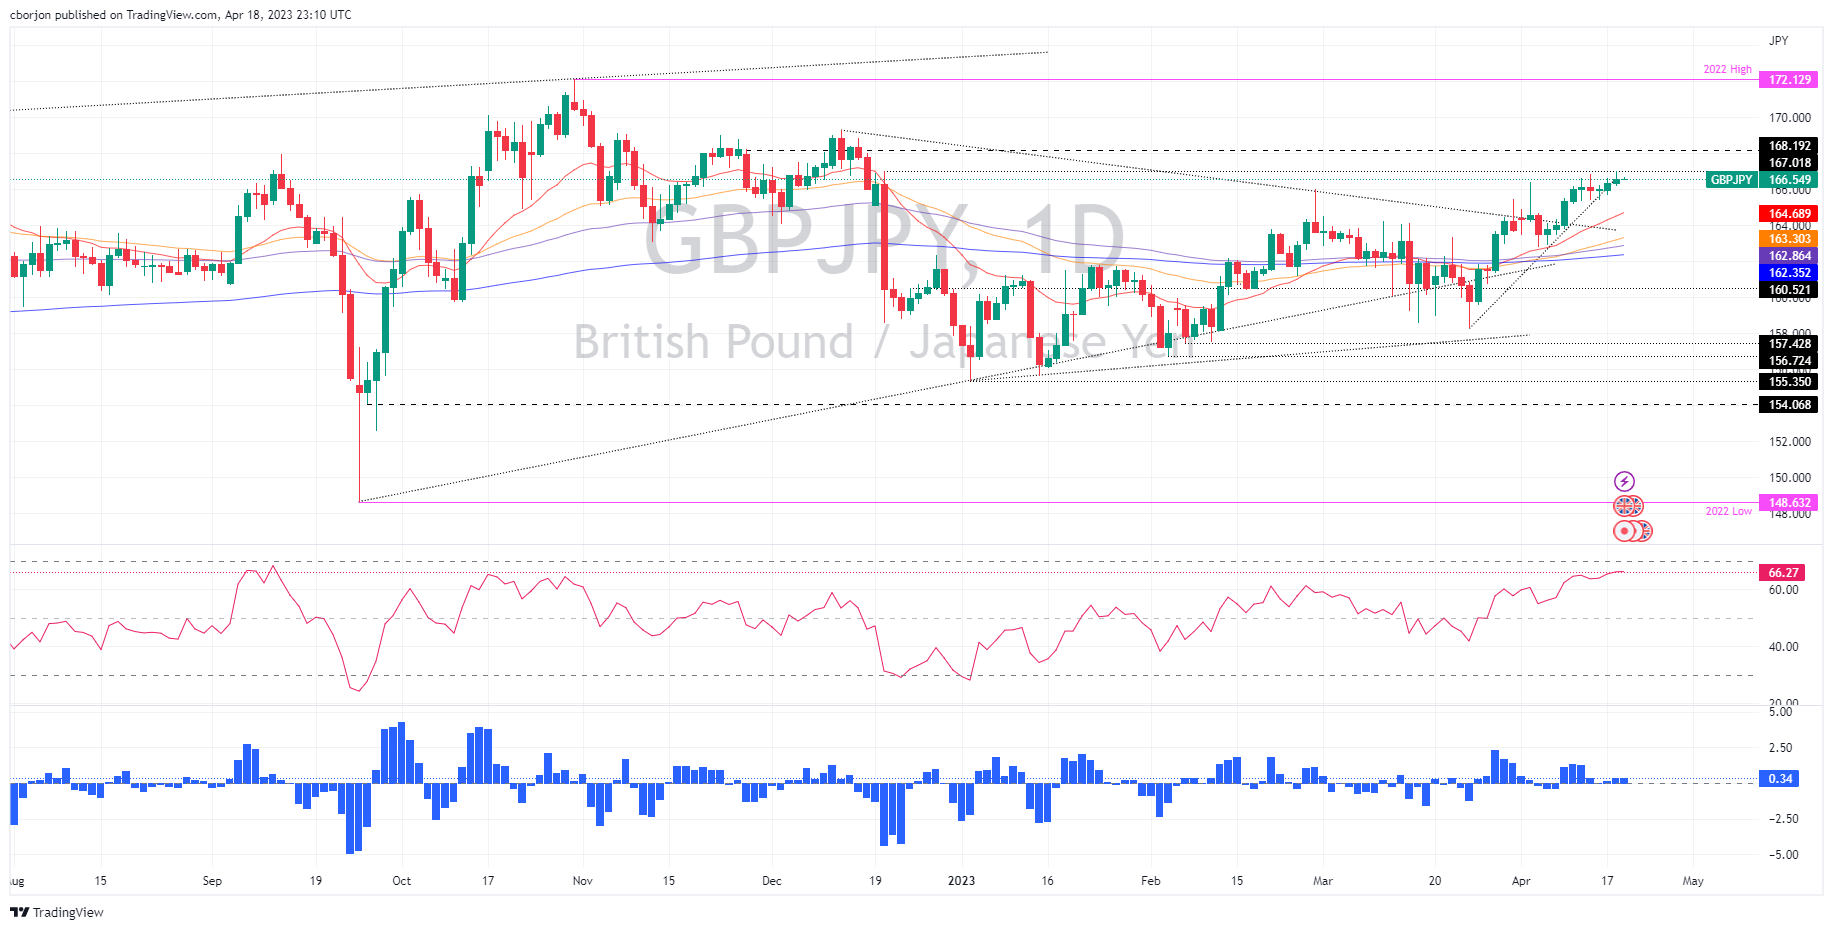
-
00:05
USD/CHF stays pressured below 0.9000 as Fed hawks lack support from US data
- USD/CHF holds lower grounds after printing the first daily loss in three.
- US Dollar fails to justify hawkish Fed talks amid downbeat data, cautious optimism.
- Upbeat statistics elsewhere, cautious mood ahead of debt ceiling plan also weigh on USD.
- Light calendar can restrict Swiss Franc pair’s immediate moves.
USD/CHF seeks fresh directions while keeping sellers hopeful around 0.8960, fading the bounce off the 27-month low marked the last week. That said, the Swiss Franc (CHF) pair snapped a two-day winning streak the previous day amid a broad US Dollar retreat.
US Dollar Index (DXY) reverses the latest rebound from a one-year low while printing the second daily loss in four. The greenback’s gauge versus six major currencies tracked downside yields to take a U-turn the previous day. That said, the US 10-year and two-year Treasury bond coupons dropped for the first time in four days by the end of Tuesday.
US Treasury bond yields and the US dollar bear the burden of downbeat US housing data while paying little heed to the hawkish Fed talks.
After witnessing upbeat prints of the NY Empire State Manufacturing Index and the US National Association of Home Builders (NAHB) housing market index on Monday, the US Housing Starts and Building Permits roiled the mood with downbeat prints for March on Tuesday. That said, the Housing Starts eased to 1.42M versus 1.432M prior and 1.40M market forecasts whereas the Building Permits dropped to 1.413M from 1.55M previous readings and analysts’ estimations of 2.2M.
On the other hand, St. Louis Federal Reserve President James Bullard said, in an interview with Reuters, “Interest rates will need to continue to rise in the absence of clear progress on inflation.” On Monday, Richmond Fed President Thomas Barkin said that he wants to see more evidence of inflation settling back to target.
Recently, Atlanta Fed President Raphael W. Bostic mentioned that the economy is still gaining momentum, but inflation is too high.
Contrary to the US data, firmer prints of China statistics and the UK jobs report, as well as mixed Eurozone economics, also weighed on the US Dollar and the USD/CHF prices. Amid these plays, the Wall Street closed mixed.
Moving on, a light calendar may allow the USD/CHF to continue with the latest pullback. However, risk catalysts surrounding the US debt ceiling plan and China can entertain intraday traders during the early hours.
Technical analysis
A convergence of the 10-DMA and a two-week-old descending trend line, around 0.8995, quickly followed by the 0.9000 round figure, restricts the short-term upside of the USD/CHF pair.
-