Notícias do Mercado
-
23:45
GBP/USD Price Analysis: Renews one-week high around 1.2500 within bullish channel
- GBP/USD extends Friday’s U-turn from three-week-old rising channel’s support.
- Cable buyers cheer upside break of weekly resistance line, bullish MACD signals.
- Previous support from mid-March, channel’s top line to prod bulls.
- Immediate trend lines highlight 1.2440 as short-term key support ahead of stated channel’s bottom, 200-SMA.
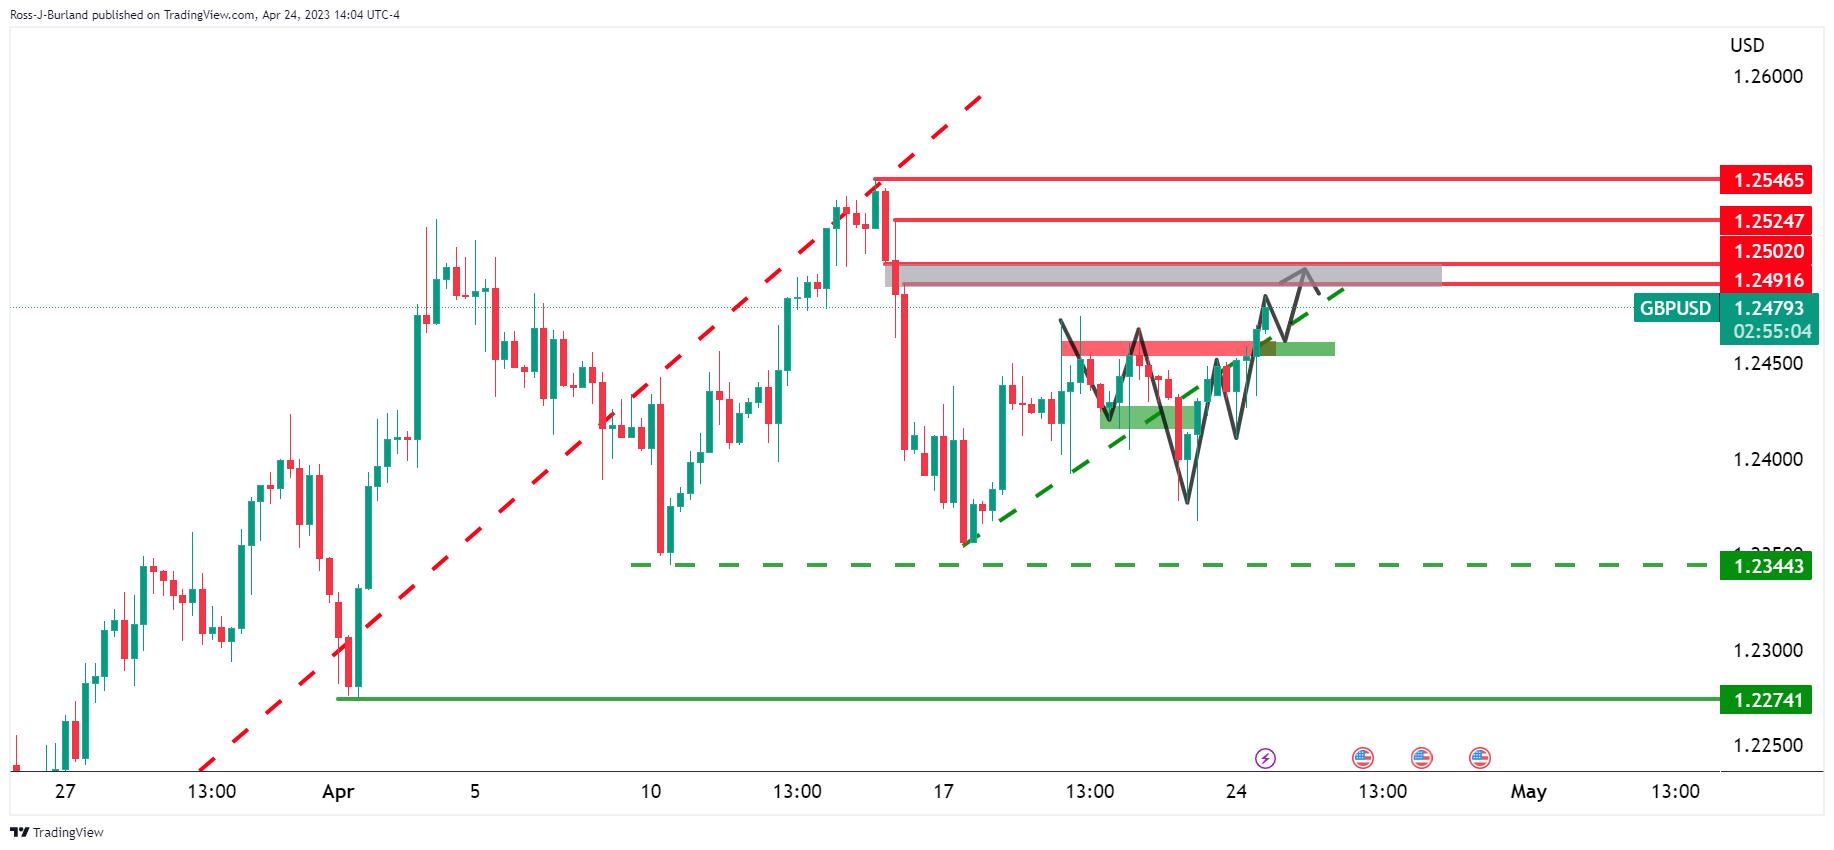
GBP/USD marches to the highest levels in seven days as bulls attack the 1.2500 threshold during Tuesday’s Asian session. In doing so, the Cable pair justifies the late Monday’s upside break of a one-week-old previous resistance line, as well as the bullish MACD signals, while staying within a three-week-long ascending trend channel.
With this, GBP/USD appears all set to extend the latest run-up towards the previous support line from March 15, around 1.2540. However, the aforementioned channel’s top line, close to 1.2560 by the press time, could challenge the pair buyers afterward.
It’s worth noting, however, that the RSI (14) is approaching the overbought territory and hence the GBP/USD pair’s upside past 1.2560 appears difficult.
In a case where the quote rises past 1.2560, the 1.2600 round figure and the May 2022 peak of around 1.2665 will be in the spotlight.
On the flip side, a convergence of the one-week-old previous resistance line and an upward-sloping trend line from Friday, close to 1.2440, puts a floor under the GBP/USD prices.
Following that, the stated channel’s bottom line and the 200-SMA, respectively near 1.2370 and 1.2325, could challenge the Cable bears before giving them control.
Even so, the monthly bottom around 1.2275 can act as an extra filter towards the south.
GBP/USD: Four-hour chart

Trend: Further upside expected
-
23:33
EUR/USD eyes YTD high as US Dollar weakens on lower US Treasury yields
- Mixed manufacturing US economic data and falling US T-bond yields, a tailwind for the EUR/USD.
- Investors have almost entirely priced in a 25 bps rate hike by the Fed, as shown by the CME FedWatch Tool.
- ECB policymakers call for further tightening, considering a 25 or 50 bps hike at the May meeting.
The Euro (EUR) finished Monday’s session positive, as the US Dollar (USD) weakened across the FX board, influenced by lower US Treasury bond yields. Manufacturing activity in the United States (US) showed mixed signs. Wall Street finished with losses as investors brace for next week’s US Federal Reserve Open Market Committee (FOMC) decision. The EUR/USD is trading at 1.1044, about to test the YTD high at around 1.1075.
EUR/USD steady as US economic data disappoints, ECB hints at tightening
As the Asian session begins, the EUR/USD is almost flat. The US economic docket featured the March Chicago Fed National Activity Index (CFNAI), which plummeted to -0.19, above estimates of -20, unchanged from February’s reading. The three-month moving average ticked up to 0.01%, indicating that the economy continues to expand slowly. Later, the April Dallas Fed Manufacturing Business Index slid to -23.4, well below the -11.00 estimated, as the survey showed that perceptions of broader business conditions worsened.
In the meantime, the CME FedWatch Tool foresees a 95.4% chance that the US Federal Reserve will hike rates to the 5.00%-5.25% range the following week.
US Treasury bond yields dropped, a headwind for the greenback, as shown by the US Dollar Index (DXY). The DXY is dropping 0.40%, down at 101.322, bolstering the Euro’s rally past the 1.1040 area.
Across the pond, European Central Bank (ECB) policymakers continued to cross newswires, with most expressing that further tightening is needed due to high inflation pressures. The ECB Governing Council member Isabel Schnabel commented that an increase of 50 bps at the May meeting is not off the table.
Data-wise, Germany’s IFO Business Climate Conditions and Expectations improved compared to March’s figures, spurring a jump in the EUR/USD pair towards the 1.1000 area.
EUR/USD Key Technical Levels
-
23:27
USD/CAD juggles around 1.3540 despite a sell-off in USD Index and a recovery in oil price
- USD/CAD is demonstrating evidence of volatility contraction despite a perpendicular fall in the USD Index.
- The Fed is expected to pause the policy-tightening spell after a 25bp rate hike in May.
- BoC Macklem seems not interested in raising interest rates further as inflation is consistently declining.
The USD/CAD pair is showing signs of volatility contraction around 1.3540 in the early Tokyo session. The Loonie asset has failed to show a power-pack action despite a breakdown move in the US Dollar Index (DXY) and a solid recovery in the oil price.
S&P500 futures ended Monday’s session on a flat-to-positive note after recovering overnight losses, indicating a cautionary approach in the overall positive market mood. Investors have decided to remain on the sidelines till the release of quarterly earnings from giant tech companies. The US Dollar Index (DXY) showed a perpendicular decline after surrendering the crucial support of 101.63.
A sell-off move in the USD Index also weighed on US Treasury yields. The demand for US government bonds rebounded as rising odds of only one more rate hike left by the Federal Reserve (Fed) eased cautious market sentiment. The yields offered on 10-year US Treasury bonds dropped below 3.50%.
Analysts at Wells Fargo see the Federal Open Market Committee (FOMC) raising rates by 25 basis points, on what they believe will most likely be the last rate hike in this tightening cycle. They point out that incoming data indicate that inflationary pressures remain acute. They further added, “We do not think the statement will fully close the door on further rate hikes, given that inflation remains well above target. Rather, the statement likely will include an acknowledgment that further adjustments in rates are possible.
Meanwhile, the Canadian Dollar is facing immense pressure as Bank of Canada (BoC) Governor Tiff Macklem seems not interested in raising interest rates further as inflationary pressures are consistently declining. However, BoC Governor has left room open for more rates if inflation continues to remain persistent.
On the oil front, oil prices showed a decent recovery backed by a sell-off in the USD Index and growing optimism that China’s May Day holiday will increase travel and fuel demand. It is worth noting that Canada is the leading exporter of oil to the United States and higher oil prices will support the Canadian Dollar.
-
23:17
AUD/USD bulls attack 0.6700 amid holiday in Australia, mixed sentiment
- AUD/USD picks up bids to extend late Monday’s recovery amid sluggish session.
- AZNAC holidays in Australia, New Zealand to restrict market moves in Asia-Pacific, especially amid light calendar elsewhere.
- Market sentiment dwindles amid cautious mood ahead of key data/events, geopolitical fears and rate hike concerns.
- US Dollar drops despite flat S&P 500, softer yields amid Fed blackout.
AUD/USD stretches the latest rebound towards poking the 0.6700 round figure as it consolidates the previous weekly loss amid Tuesday’s holidays in Australia and New Zealand, amid a light calendar elsewhere.
The Aussie pair’s recent recovery could be linked to the U-turn in equities during Monday’s American session and downbeat US Treasury bond yields. However, challenges to sentiment and cautious mood ahead of this week’s crucial US and Australia statistics prod the Aussie pair buyers. That said, the pre-Fed blackout seems to help the markets in paring the previous weekly gains of the US Dollar.
US Dollar failed to cheer Friday’s upbeat activity data amid hopes of no more than a 0.25% rate hike and nearness to the policy pivot. Also weighing on the greenback could be the drama surrounding the US debt ceiling, which is scheduled for expiration in June. Additionally weighing the greenback could be the comparatively less hawkish Fed speak, as well as upbeat Wall Street. That said, S&P 500 Futures remained mostly flat on Tuesday.
On the other hand, the Financial Times (FT) came out with the news suggesting that allies resist the US plan to ban all G7 exports to Russia, which in turn supports a mild risk-on mood. On the other hand, Eurozone plans to ban exports from Russia.
Amid these plays, Wall Street benchmarks closed mixed while the US 10-year and two-year Treasury bond yields remain mostly downbeat, around 3.50% and 4.12% respectively.
Moving on, a light calendar and off in Australia can restrict AUD/USD moves ahead of this week’s US Q1 2023 GDP, US Core PCE inflation and Australia inflation data. Above all, next week’s RBA and Fed meeting are crucial for markets to watch for clear directions.
Technical analysis
Unless successfully crossing the 21-DMA hurdle of around 0.6705, the AUD/USD pair is well set to visit an upward-sloping support line from early March, close to 0.6650 at the latest.
-
23:08
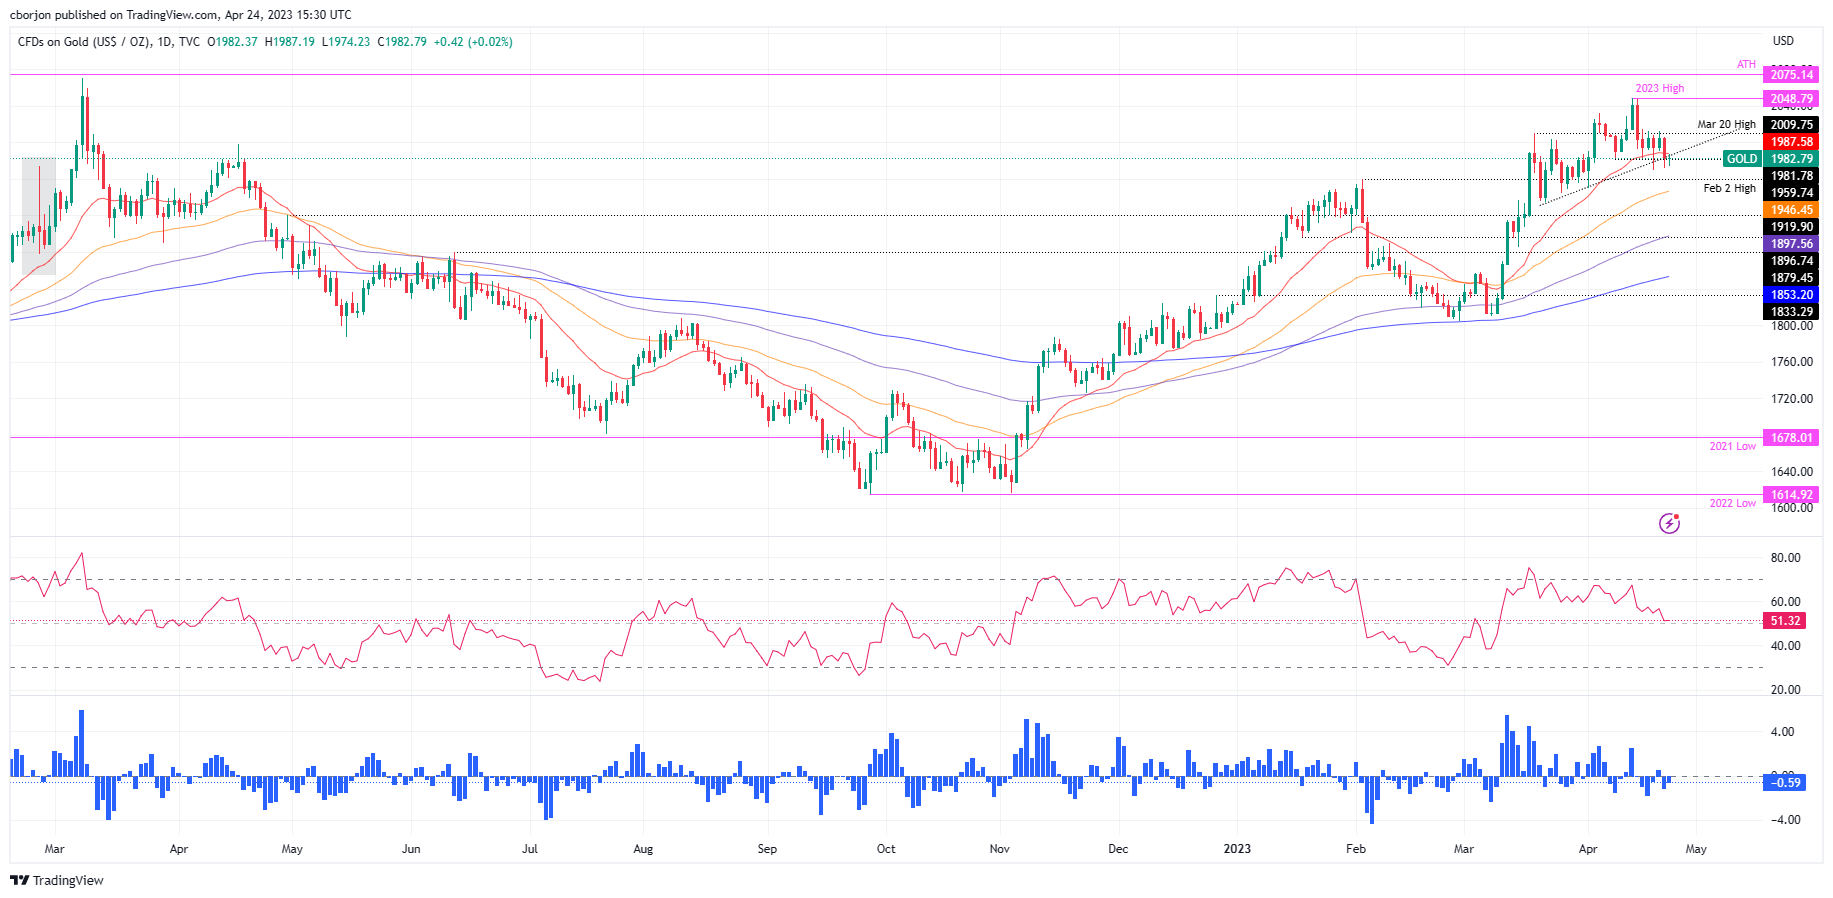
Gold Price Forecast: XAU/USD 50% mean reversion resistance eyed
- Gold price bulls are in the market and there is a scope for a move higher to $2,000.
- If Gold price bears commit, then we could see a 50% mean reversion area hold the fort around $1,992 and a subsequent sell-off from there.
Gold price is robust on Monday as the US Dollar and US Treasury bonds yields fell. Precious metals on Monday recovered from early losses and posted moderate gains. A drop in the US Dollar index printed a 1-week low due to a larger-than-expected increase in the German Apr IFO business climate index and hawkish comments Monday from European Central Bank Governing Council member Pierre Wunsch set off a rally in EUR/USD.
The German Apr IFO business climate index rose +0.4 to a 14-month high of 93.6, stronger than expectations of 93.4. Wunsch said we are "not seeing" inflation going in the right direction yet, and the ECB will only agree to halt interest rate increases once wage growth starts to fall. "We are waiting for wage growth and core inflation to go down, along with headline inflation, before we can arrive at the point where we can pause," the official said.
Meanwhile, the weaker dollar, making the precious metal more affordable for international buyers, offered support. DXY, an index that measures the currency vs. a basket of others was down 0.37/ and fell from a high of 101.9090 to a low of 101.330. Bond yields, bullish for gold since it offers no interest were lower with the US two-year note was paying as low as 4.097% on the day.
Gold technical analysis
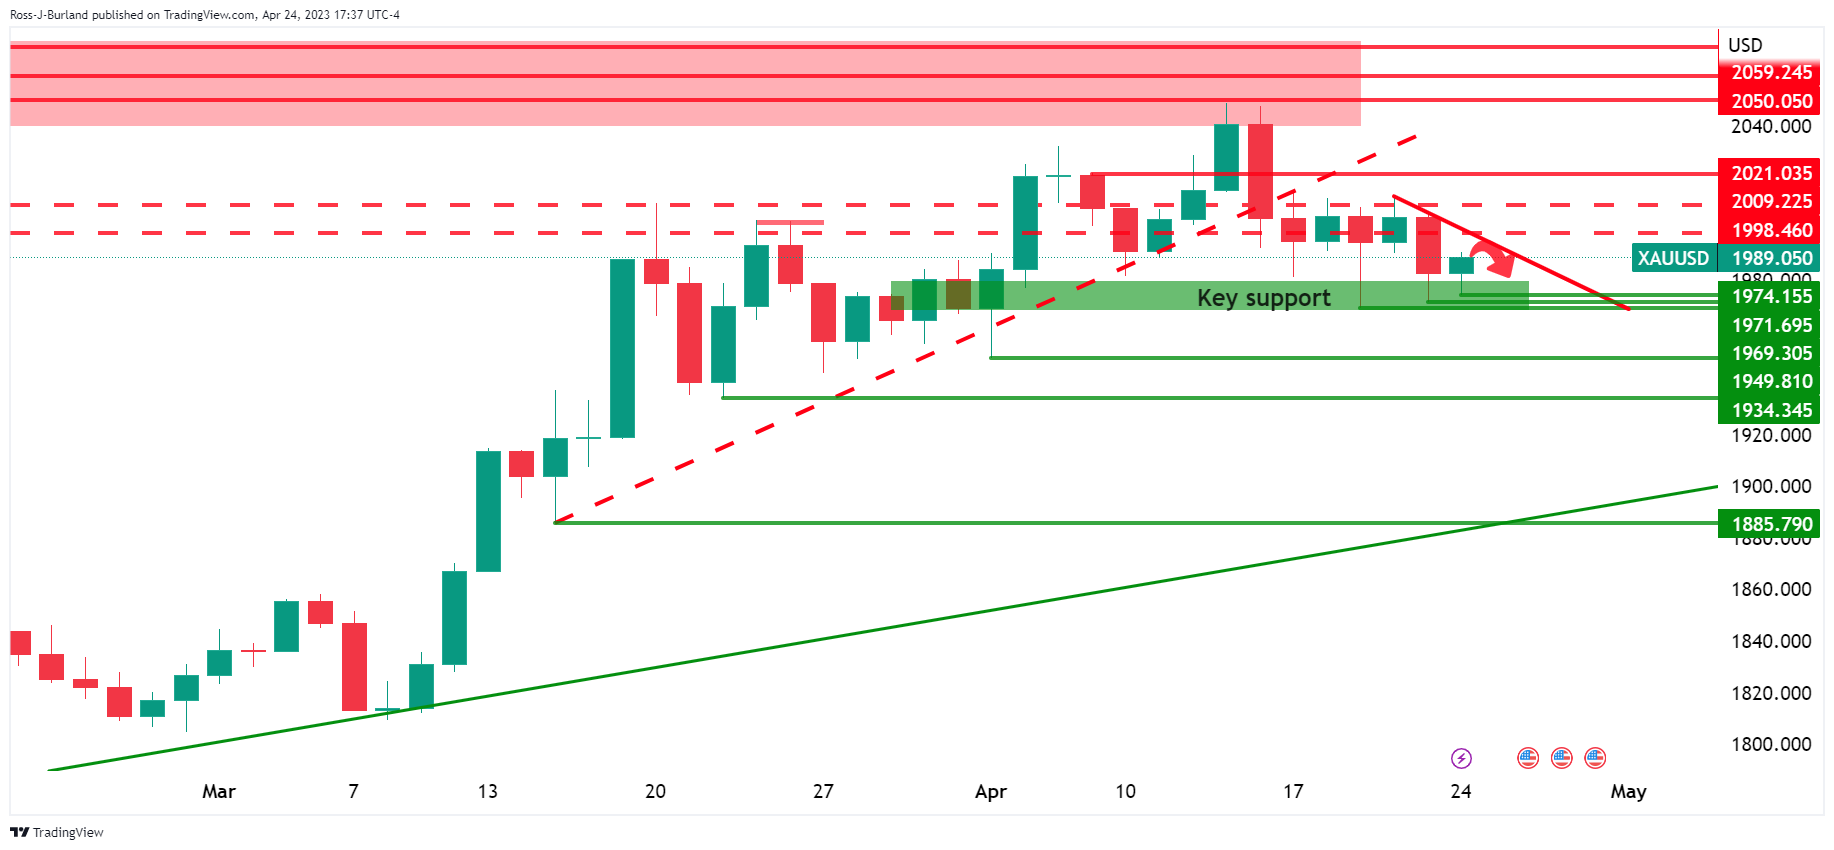
That is a daily head and shoulders, a topping pattern forming at the end of the bullish cycle.
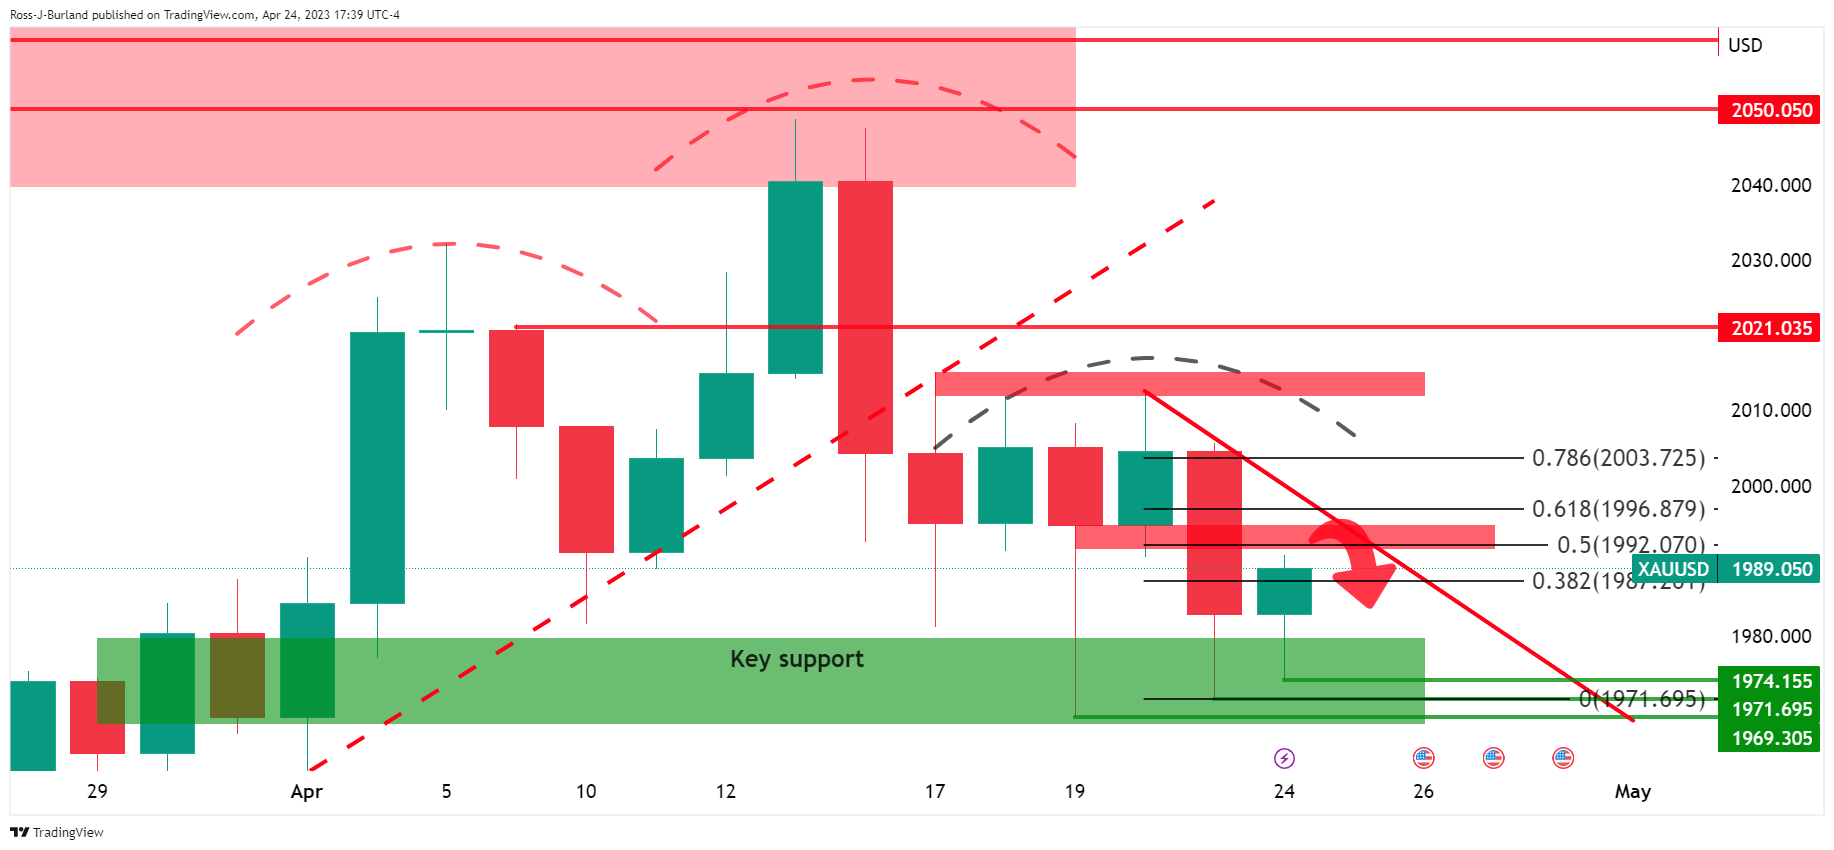
Zoomed in, we can see how things could play out.
While below the Fibonacci scale´s 78.6%, the bias is bearish, especially while being on the front side of the trendline resistance.
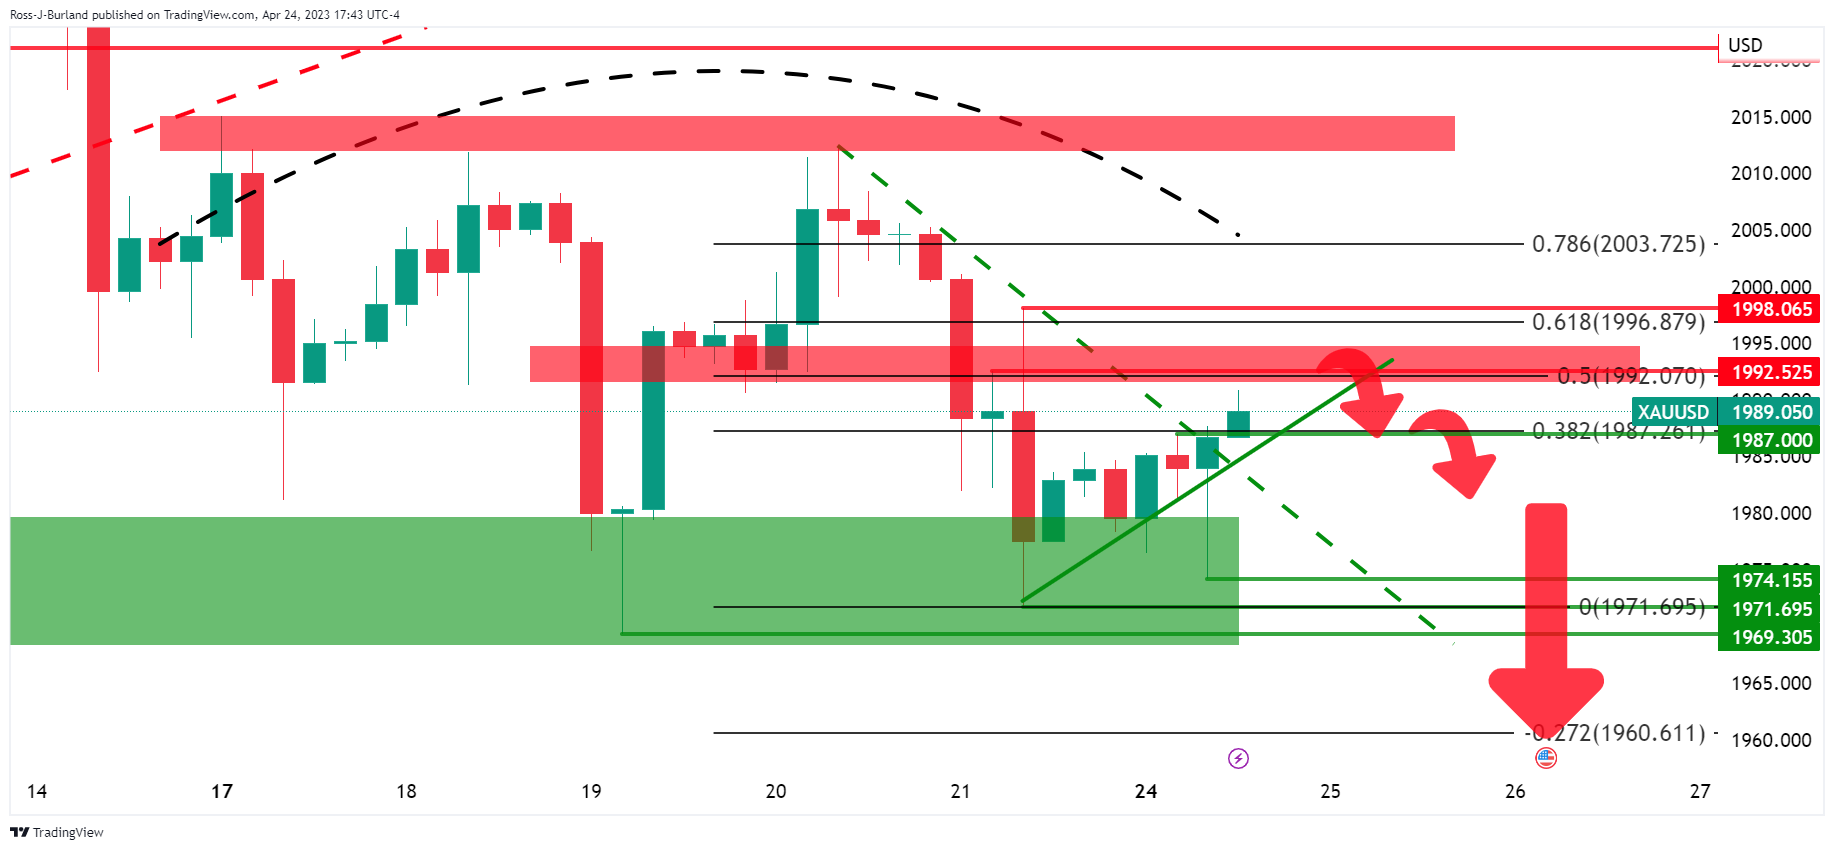
A deeper look into the right-hand shoulder, on the 4-hour time frame, we can see that the price has broken the micro trendline resistance that would now be expected to act as a counter-trendline. This leaves scope for as move higher into the bearish impulse to target towards $2,000. However, if bears commit, then we could see a 50% mean reversion area hold the fort around $1,992 and a subsequent sell-off from there.
-
22:57
NZD/USD struggles to reclaim 0.6170, upside seems favored amid correction in USD Index
- NZD/USD is facing barricades in extending its rally further, upside remains favored.
- S&P500 settled Monday’s session on a flat note, portraying a cautionary mood.
- Investors have digested the fact that the Fed is going to hike interest rates one more time by 25bps.
The NZD/USD pair is struggling in recapturing the immediate resistance of 0.6170 in the early Asian session. The Kiwi asset displayed a stellar upside move on Monday after delivering a breakout of the consolidation formed in a range of 0.6125-0.6154. A stellar run in the Kiwi asset is being supported by a decline in the US Dollar Index (DXY).
S&P500 settled Monday’s session with nominal gains as investors are anxious ahead of quarterly results from big technology giants such as Google, Meta Platforms, and Microsoft this week. Therefore, investors have underpinned a cautious approach as missed earnings or weaker revenue guidance from these companies could spoil the market mood.
The USD Index displayed a sheer sell-off after a breakdown of the consolidation formed in a 101.64-102.22 range. Investors have digested the fact that the Federal Reserve (Fed) is going to hike interest rates one more time by 25 basis points (bps) as labor market conditions have not softened meaningfully, and economic activities are recovering.
Preliminary United States S&P PMI data released on Friday confirmed a solid economic recovery as Manufacturing PMI landed above 50.0 for the first time in the past few months, indicating an expansion. This solidified the need for further policy-tightening by the Fed.
On the New Zealand Dollar front, investors pumped funds into the antipodean despite easing inflationary pressures in New Zealand. The quarterly Consumer Price Index (CPI) accelerated by 1.2% vs. the consensus of 1.7% and the former release of 1.4%. Annual inflation softened to 6.7% while the street was anticipating a marginal deceleration to 7.1% from the prior release of 7.2%.
It is likely that RBNZ Governor Adrian Orr would consider a pause in the policy-tightening spell as the inflation rate has made an intermediate peak.
-
22:00
Forex Today: US Dollar loses momentum as Treasury yields slide
No economic reports are due during the Asian session on Tuesday. After a quiet beginning of the week, investors will focus on earnings reports while preparing for crucial economic events later in the week, including Australian inflation, US and Eurozone GDP, US Core PCE and the Bank of Japan meeting.
Here is what you need to know on Tuesday, April 25:
On a quiet American session, the US Dollar weakened further as Wall Street indexes rebounded. The Dow Jones gained 0.20%, the S&P 500 rose 0.09% and the Nasdaq lost 0.29%. US bond yields dropped with the 10-year falling to 3.50% and the 2-year to 4.12%. Volatility in the US Treasury market is set to remain elevated amid the debt-ceiling drama and key data and events ahead. The divergence across the curve shows that the difference between the one-month and the three-month bill yields it at record highs.
Tuesday will be a busy day with earnings from Microsoft, Alphabet, Visa, PepsiCo, Novartis, McDonald's, UPS, Verizon, Texas Instruments, General Electric, UBS, Halliburton and Spotify. Economic data due from the US include the S&P/Case-Shiller Home Price and New Home Sales. The focus is on Thursday's GDP reading which includes key consumer inflation numbers. Next week is the FOMC meeting. The Federal Reserve (Fed) is expected to raise rates by 25 basis points and signal a pause.
The US Dollar Index fell to 101.35 reaching weekly lows. It is pointing south, looking vulnerable. USD/CHF posted the lowest daily close since January 2021, below 0.8900.
EUR/USD rose to the 1.1050 zone, approaching year-to-date highs supported by hawkish comments from European Central Bank (ECB) officials ahead of the May 4 meeting.
GBP/USD benefited from a weaker Dollar approaching 1.2500. The trend is up. The UK will inform Public Sector Net Borrowing on Tuesday. EUR/GBP rose for the third day, boosted by higher Eurozone bond yields and is near April highs.
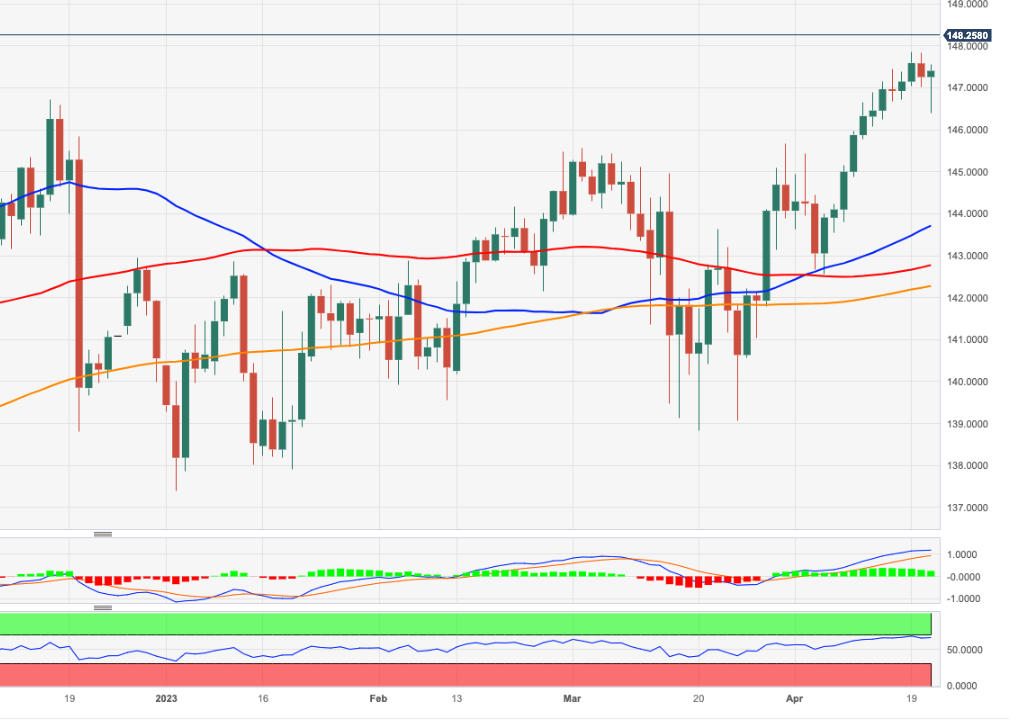
USD/JPY finished a quiet Monday higher but far from the highs and trending lower, below 134.30. The pair remains sensitive to US yields. On Friday, the Bank of Japan will announce its monetary policy decision on Ueda's first meeting as governor.
AUD/USD rebounded after hitting weekly lows at 0.6665 and climbed toward 0.6700. Australia will report inflation on Wednesday and next week it's the Reserve Bank of Australia meeting.
The Kiwi outperformed among commodity currencies. NZD/USD recovered from monthly lows, rising above 0.6150 and AUD/NZD pulled back further to the 1.0850 area.
USD/CAD finished flat at 1.3540. The rally is facing strong resistance at 1.3565 and a correction seems likely.
Gold rose modestly after holding above last week's lows, and reached $1,990$. Silver retook $25.00 after bottoming at $24.75.
Cryptocurrencies performed mixed. Bitcoin gave signs of reaching an interim bottom after rebounding from monthly lows below $27,000 to $27,500. An improvement in market sentiment helped crude oil prices. WTI rose 1%, moving closer to $80.00.
Like this article? Help us with some feedback by answering this survey:
Rate this content -
21:58
USD/JPY Price Analysis: Clustered market, front side of bull trend but bears engaged
- USD/JPY bulls need to show up ion the front side of the trendline.
- Bears target a break of structures, 133.50 and then 133.20.
U/SD/JPY is up on the day, higher by some 0.13% after popping from a low of 133.89 and rising to 134.73 so far. The bulls have been guarding the trendline support and territories above 133.50.
The following illustrates the bullish bias along the trendline and prospects of a move higher for the forthcoming week:
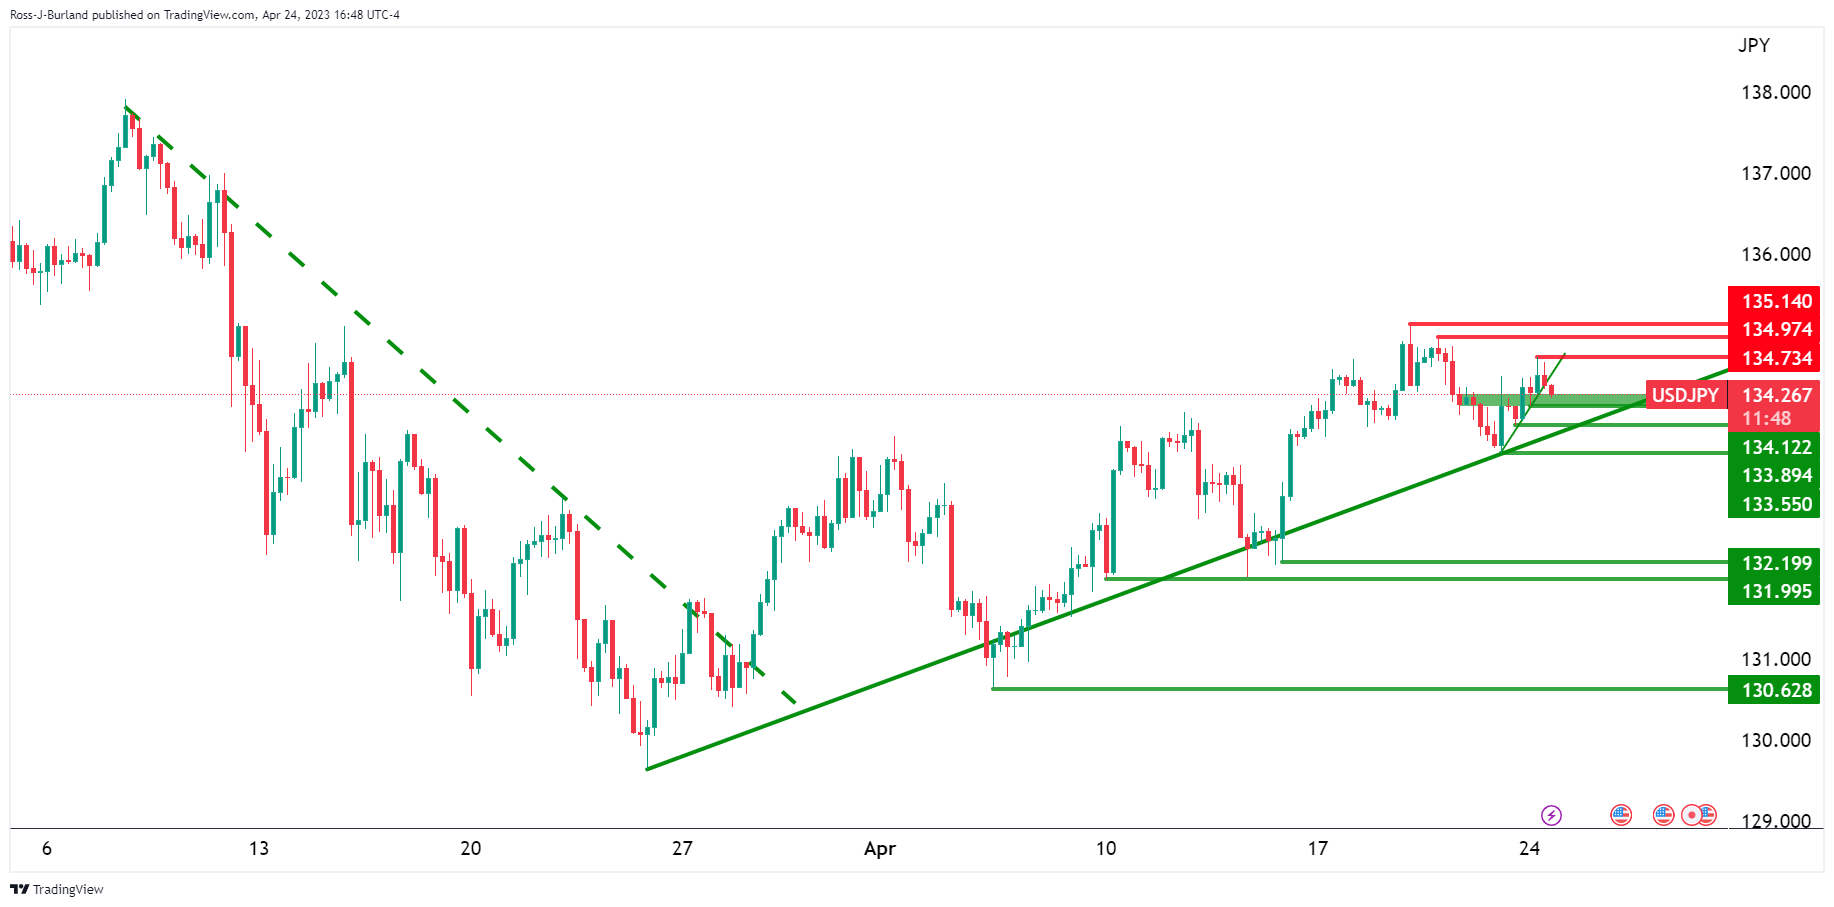
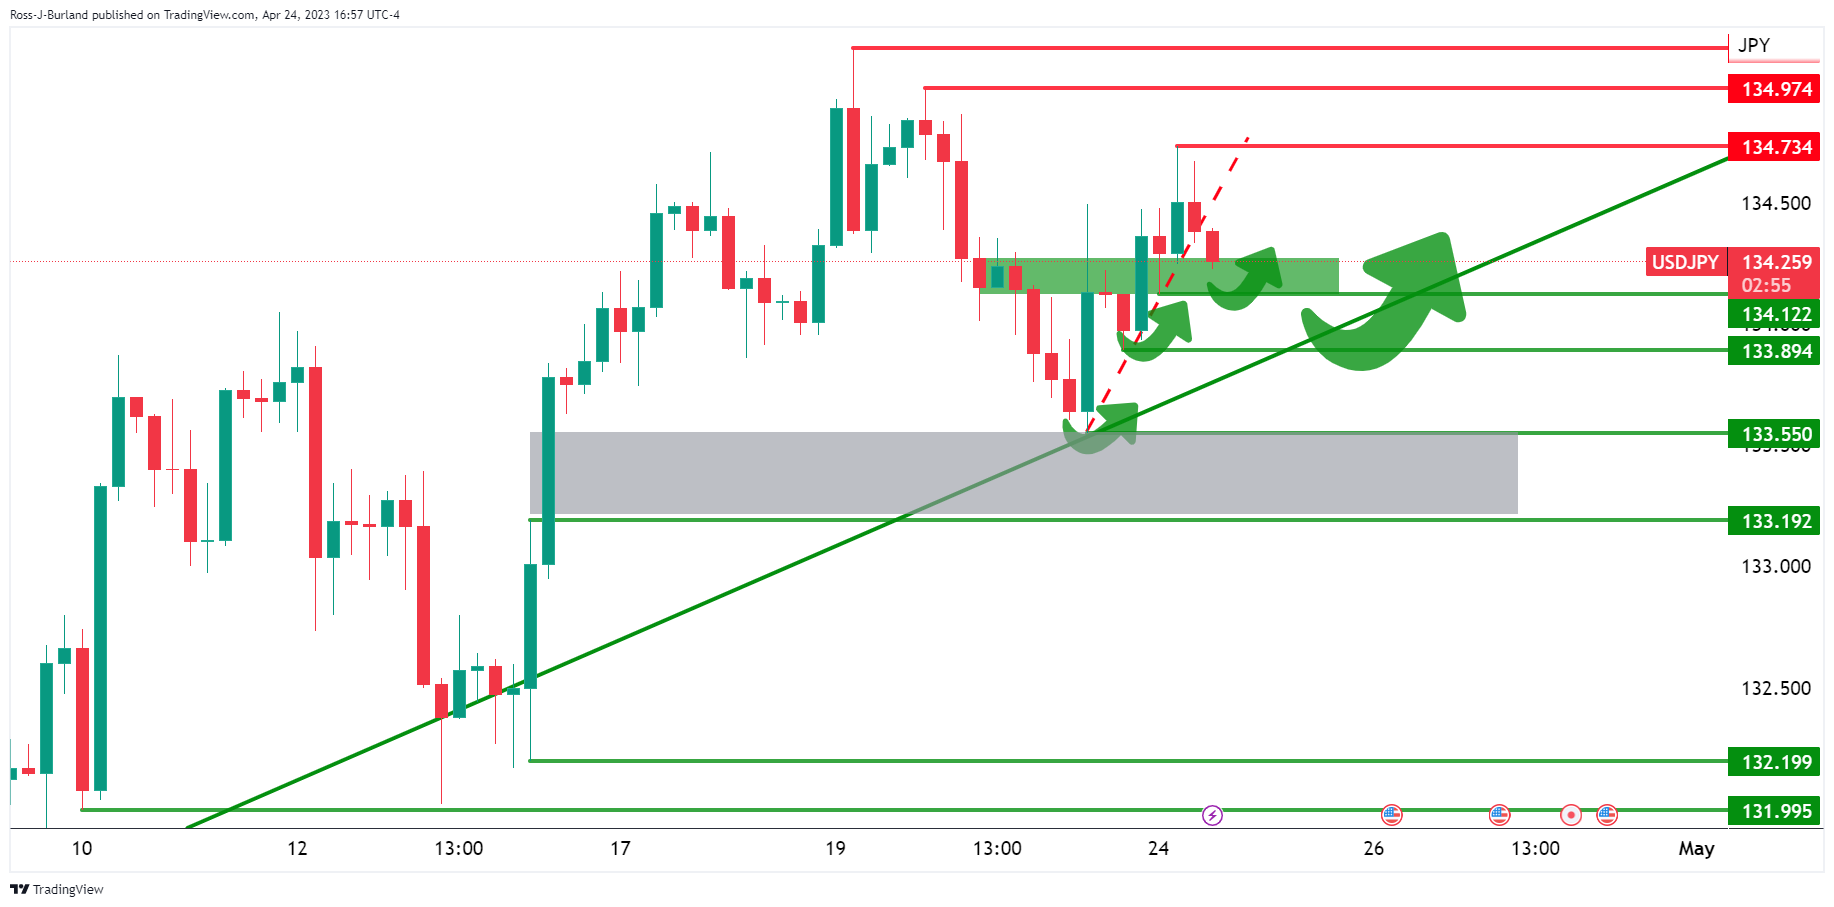
The 4-hour price action is seeing a test of potential support across the 134s. However, so long as the trendline holds up, the bias is bullish above the 133.50s. The greyed area is an area of price imbalance in the market that could otherwise be mitigated should the bears take back control. Below there, 133.20, the bias will flip firmly bearish.
-
20:55
NZD/USD Price Analysis: Bulls breaking structures left, right and center
- NZD/USD bulls are on the front side of the micro bull trend.
- NZD/USD bulls are moving in and eye a run to the 0.6180s.
NZD/USD has rallied at the start of the week on a softer US Dollar. The pair is 0.45% higher and has rallied from a low of 0.6125 to a high of 0.6166 so far.
The bulls have accumulated the market down low near 0.6120 and the price has subsequently burst through the prior channel´s highs at 0.6161 as the following illustrates:
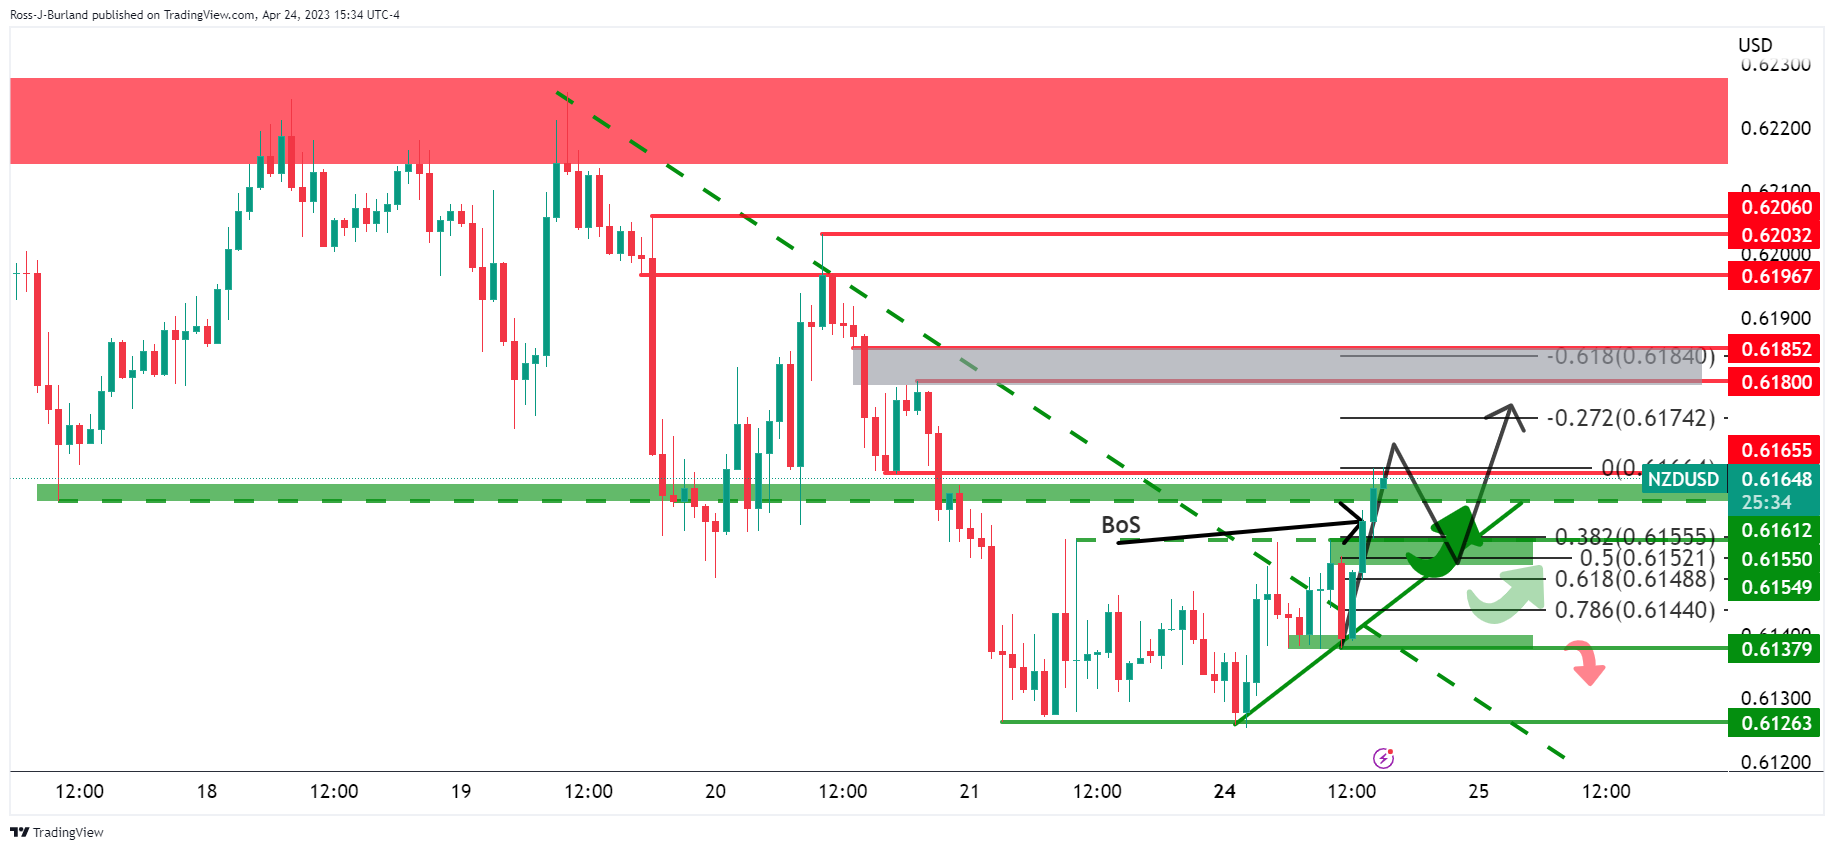

Zooming in, we can see that the price moved beyond a prior cluster of support but has hit a brick wall just above it at the next layer of old support in the 0.6160s. A pullback into the trendline support is a possibility where buying interest could emerge again somewhere within the Fibonacci scale, in and around trendline support.
-
20:37
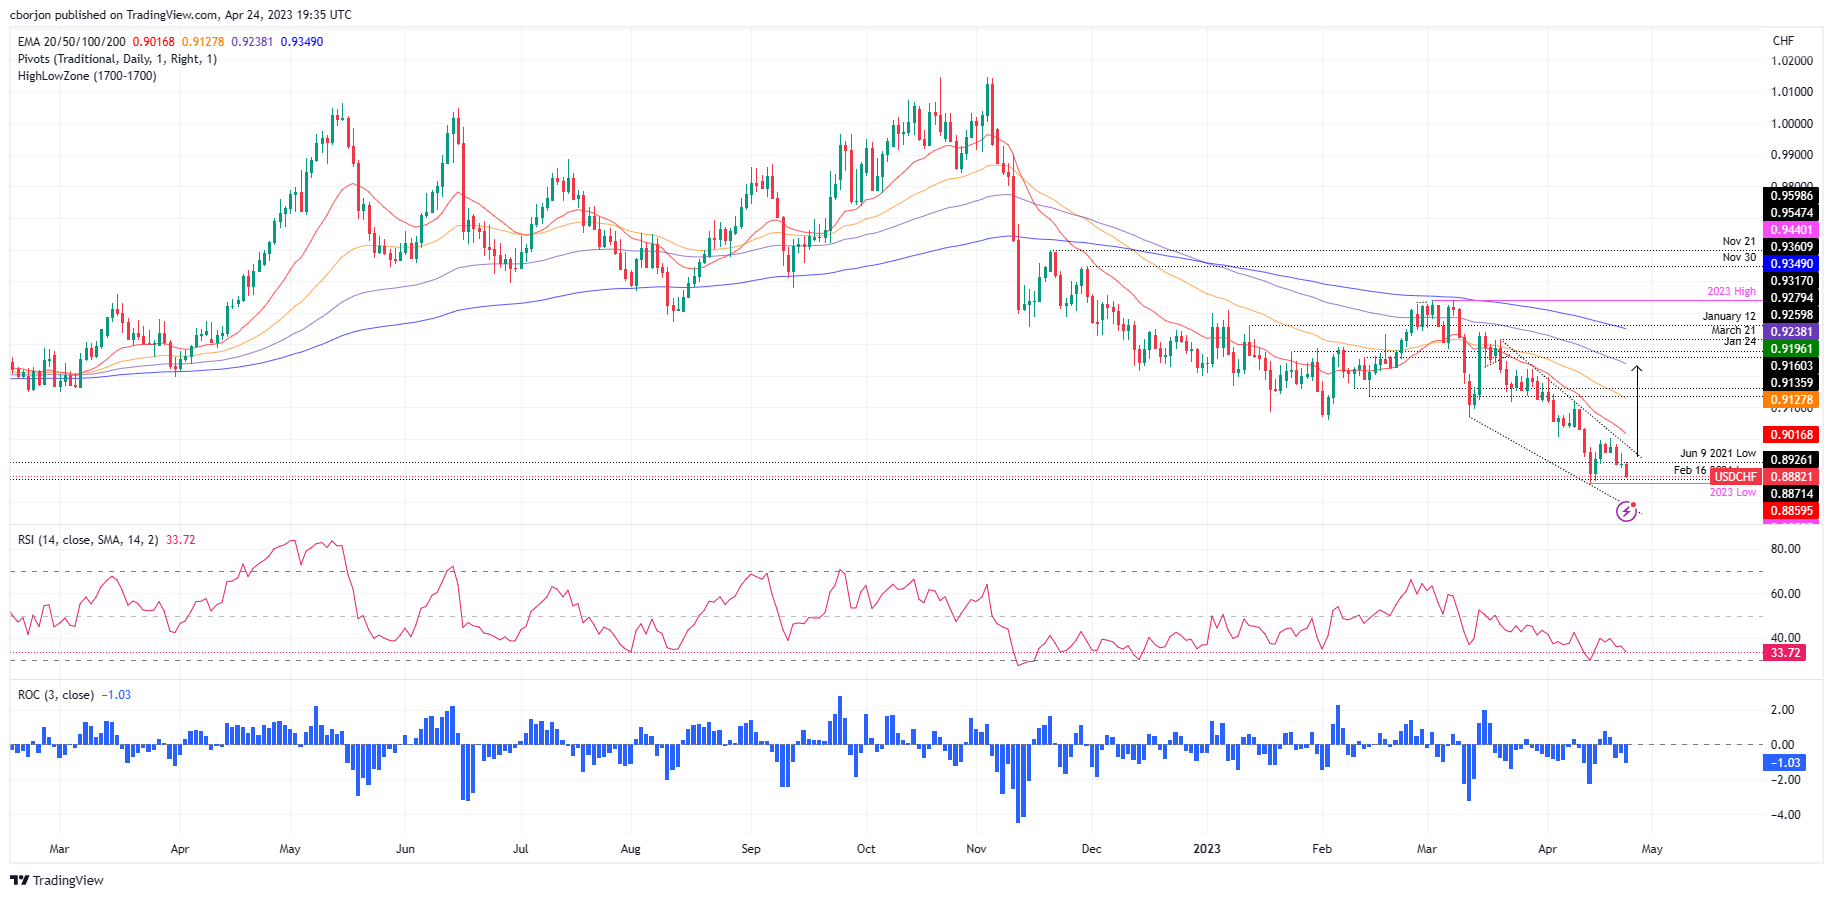
USD/CHF Price Analysis: Tumbles further below 0.8900, with sellers eyeing the YTD low
- USD/CHF drops almost 0.50% on Monday on a weak US Dollar.
- USD/CHF: Is a falling-wedge pattern setting the stage for a reversal?
The USD/CHF continues its downward trajectory, extending its losses after last Friday’s doji, suggesting that a bottom was reached at 0.8907. Nevertheless, late in the New York session, the USD/CHF pair is trading at 0.8879, below its opening price by 0.46%, after hitting a high of 0.8928.
USD/CHF Price Action
Even though last week’s high pierced the 0.9000 figure, and buyers could not decisively crack the latter and test the 20-day Exponential Moving Average (EMA), it cemented that the USD/CHF is bearishly biased. However, it appears that a falling wedge, preceded by a downtrend, is forming, which sometimes can act as a reversal pattern. That suggests that the USD/CHF could be poised for an upward correction before falling past the actual YTD low at 0.8859.
If the USD/CHF breaks above the falling-wedge top trendline, the pair could rally initially, towards the measured objective, at around the 100-day EMA at 0.9240. But on the USD/CHF’s way up, buyers need to reclaim key resistance levels. First, the 0.9000 figure, followed by the April 10 high at 0.9120. A breach of the latter will expose the 0.9200 figure.
Conversely, a continuation past the YTD low of 0.8859 is on the cards, based on the Relative Strength Index (RSI) staying at bearish territory, followed by the Rate of Change (RoC) of three periods, indicating a fall of -1.04 in USD/CHF prices.
USD/CHF Daily Chart
-
19:52
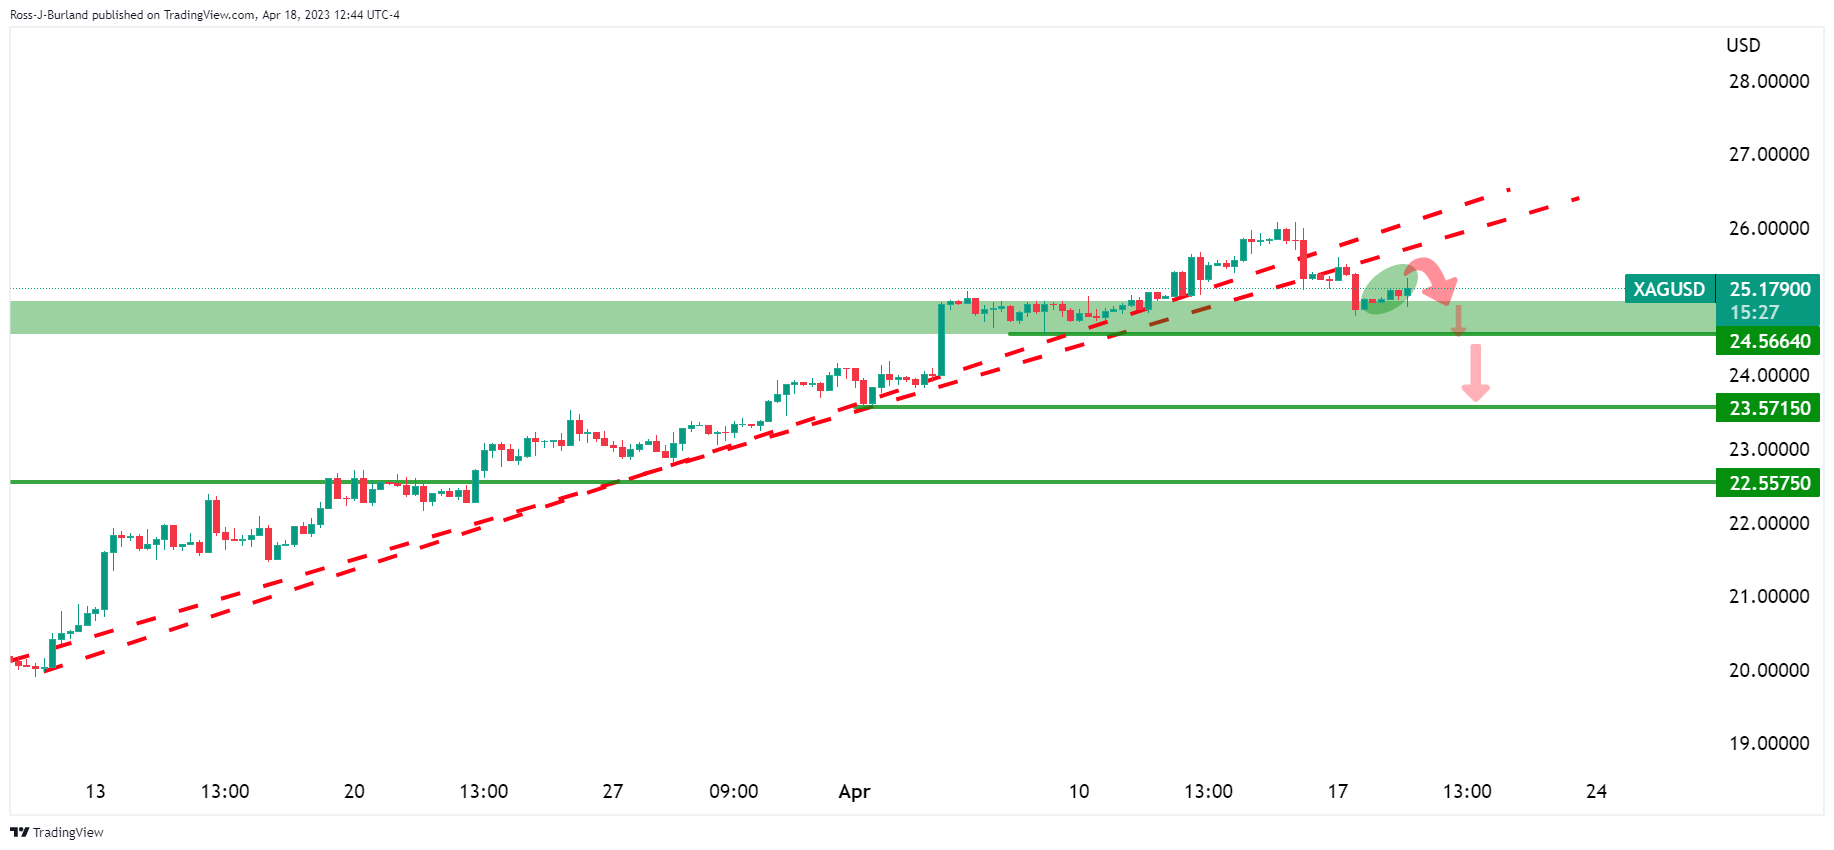
Silver Price Analysis: Bulls take back control within channel
- Silver is higher and bulls are taking over control within the channel.
- A breakout of structure is occurring, bid above $25.00.
As per the prior analysis, Silver Price Analysis: US Dollar´s bearish correction could still support, but bears are moving in, a downside bias was forecasted while being on the backside of the bearish trend:
Silver, prior analysis
Zooming in:
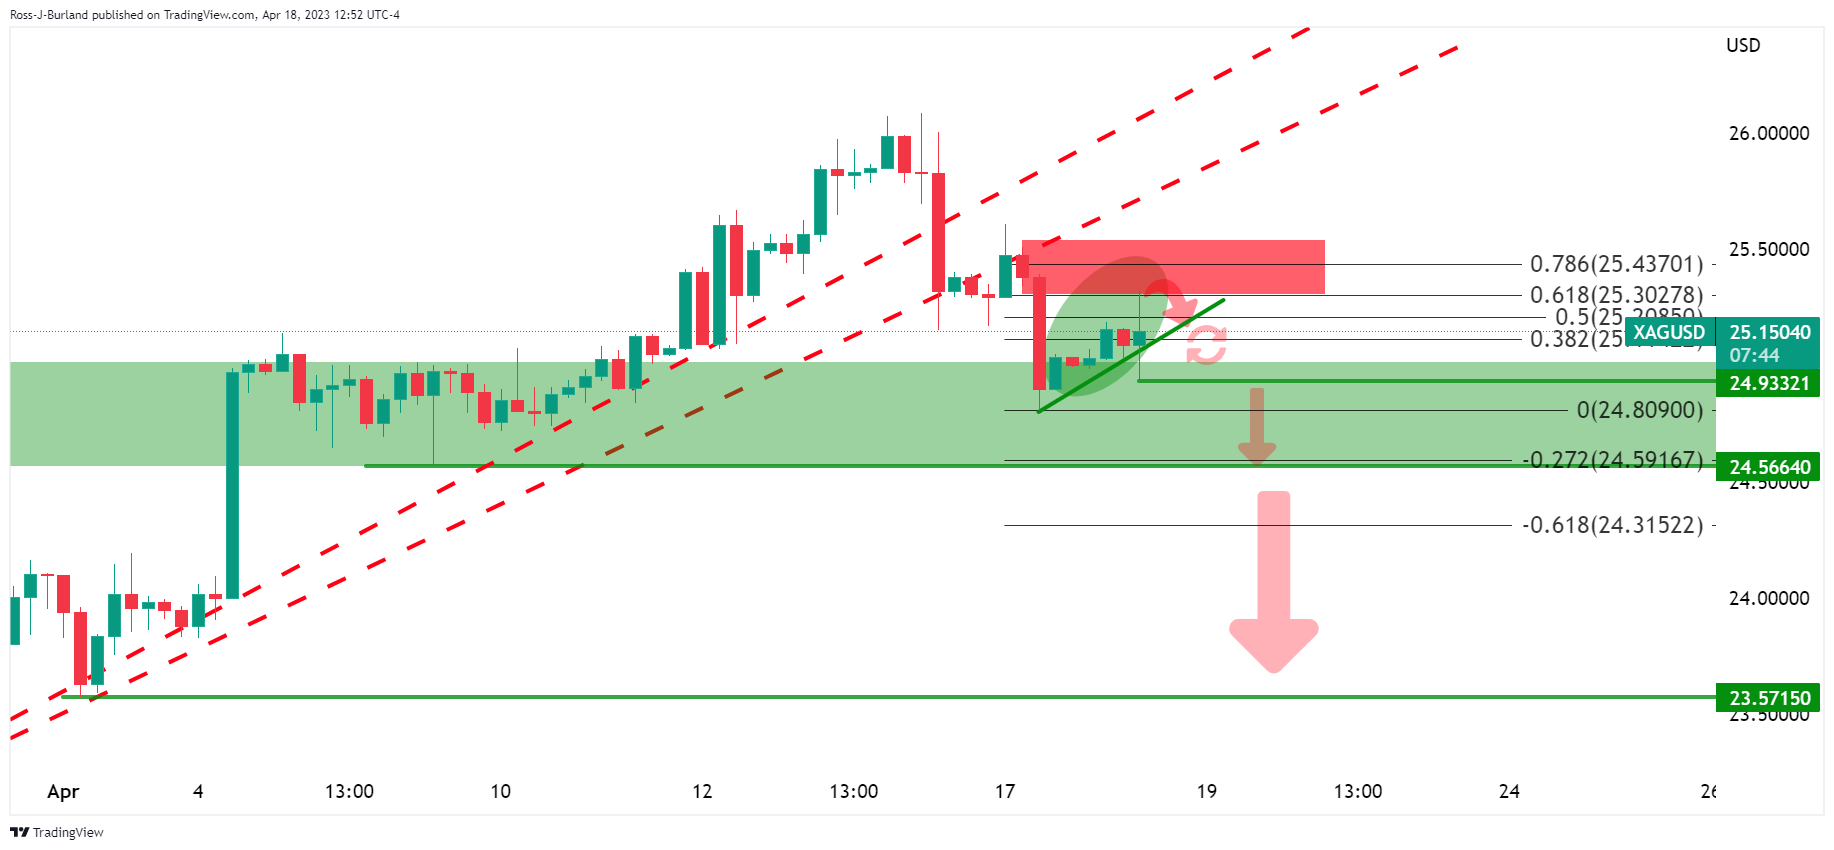
Silver had corrected into a 61.8% Fibonacci area and was being rejected toward trendline support. However, the confirming break-of-structure-point was not until $24.9332 to confirm the downside bias.
Silver H1 chart, prior analysis
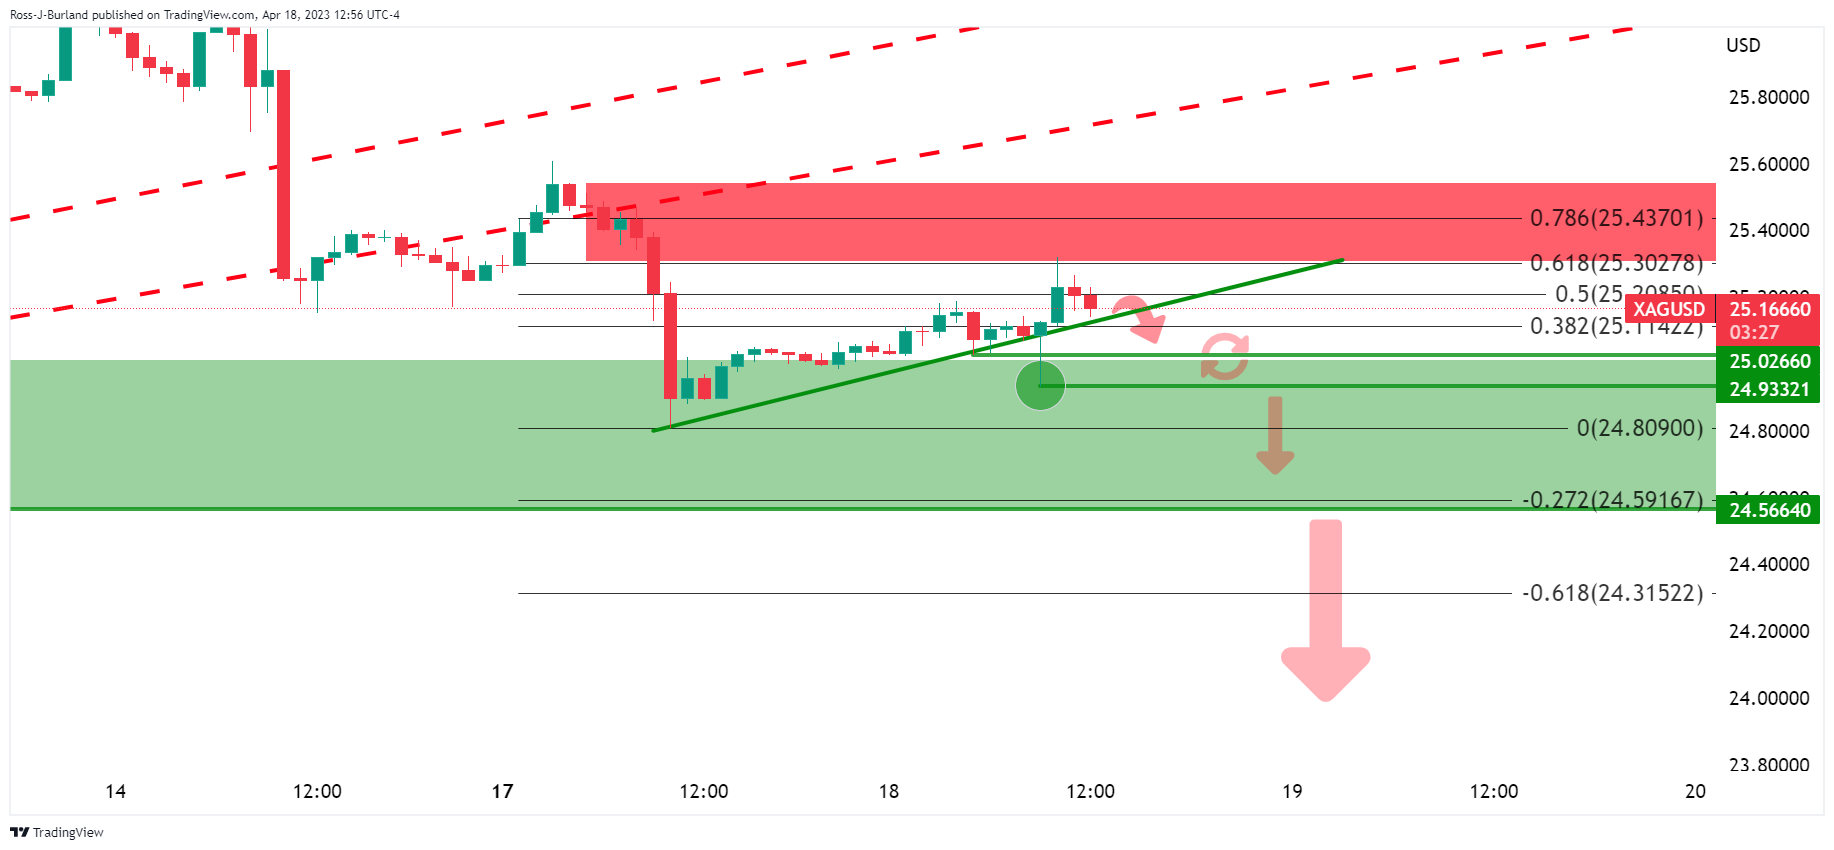
Silver, live updates
The telegraphed move came eventually. However:
The price moved right back into the shorts and has traded within a channel. A current break in the structure to the upside is unfolding and there are prospects of a move to the upside again as illustrated above.
-
19:18
WTI crude oil prices rise more than 1% on growing optimism in China market
- WTI increased due to optimism for higher fuel demand during China’s holiday travel season.
- OPEC+ producer group’s planned supply cuts may tighten the oil market.
- WTI Price Analysis: Neutral to downward bias remains as oil dips below crucial EMAs.
In the mid-Monday North American session, WTI crude oil prices continued to climb, trading at $78.78 per barrel, marking a gain of 1.13%. The price has pierced the 20 and 50-day Exponential Moving Averages (EMAs), indicating bullish momentum, with buyers now setting their sights on the $80.00 per barrel mark.
Growing optimism that China’s May Day holiday will increase travel and fuel demand boosted the market. Booking for overseas trips for the May Day holiday continued to recover, but numbers remain far from reaching pre-Covid levels. Although oil prices jumped, the uneven economic recovery in China from the Covid-19 pandemic keeps oil prices fluctuating.
In addition to the anticipated boost in demand from China’s holiday season, OPEC+ production cuts have also contributed to the rise of WTI crude oil prices. The group plans to continue shrinking output as they meet again in May 2023.
Another factor underpinning WTI’s rise is that Iraq’s northern oil exports are showing few signs of restarting after a month of standstill, as an agreement between Baghdad and the Kurdistan Regional Government (KRG) has not yet been fully resolved, according to four sources.
WTI Technical Analysis
WTI remains neutral to downward biased after falling below the 200-day Exponential Moving Average (EMA). The recent dip below $80.00 a barrel exacerbated a drop beneath the crucial EMAs, at around the $77.29-$78.44 area. But, overall US Dollar (USD) weakness, China’s holiday lifted oil prices higher. Upside risks lie at $80.00, followed by the 200-day EMA at $81.75. Conversely, it could extend its losses beneath the 50-day EMA at $77.29.
-
19:07
GBP/USD rallies on soft US Dollar, eyes on 1.2500
- GBP/USD pops higher as the US Dollar comes under pressure.
- US debt ceiling risks and Treasury yields falling are weighing on the greenback.
GBP/USD is 0.29% higher on the day after rallying from a low of 1.2410 and reaching a high of 1.2478. The US Dollar has been sold off as US yields sink at the start of the week.
The US Dollar, as measured by the DXY index, has fallen from a high of 101.909 and has reached a low of 101.369 in recent trade. US Treasury yields are down, with the 2-year losing 1.12% and the 10-year down 1.7%. Further in, the yield of the 1-month Treasury, which started the month near 4.7%, fell to 3.30% as investors appeared to grow increasingly concerned about a potential standoff over the US debt ceiling.
The House of Representatives is expected to vote on a Republican-led debt and spending bill this week. Additionally, until rate cuts this year are finally priced out, the US Dollar is likely to remain vulnerable. Also, a closely watched part of the US Treasury yield curve measuring the gap between yields on two- and 10-year Treasury notes, seen as an indicator of economic expectations, was at -62.9 basis points.
All eyes on the US data ahead of the FOMC
Meanwhile, we have entered the quiet period for the Fed ahead of the May 2-3 Federal Open Market Commmittee meeting and all eyes are on the data between now and then. ´´Recent resilience in the US economy helped push US Treasury yields higher and we look for that process to continue,´´ analysts at Brown Brothers Harriman explained. ´´If so, the dollar should continue to gain as well,´´ they said.
In the data at the start of the week, the Chicago Fed National Activity Index fell 0.19 in March, beating market expectations for a 0.20 decline. The April reading of the Dallas Fed Manufacturing Index, however, was -23.4, way worse than the -12.0 economists were predicting, down from -15.7 in March.
´´The continued resilience in the economy is noteworthy and suggests the Fed still has a lot more work to do in getting to the desired sub-trend growth,´´ analysts at Brown Brothers Harriman said.
Between now and next Wednesday’s Fed decision, we will have the first quarter Gross Domestic Product this week and then Personal Consumption Expenditure. The following week, ISM manufacturing PMI, then next Tuesday brings JOLTS data and next Wednesday brings ADP private sector jobs. The Nonfarm Payrolls will come after the Fed.
´´ To us, a hike next week is a done deal,´´ the analysts at BBH said. ´´There are about 15% odds of another 25 bp hike in June. At this point, a pause in June might just be the most likely outcome but it really will depend on how all that data come in. After all that, one cut is still priced in by year-end vs. two at the start of last week. In that regard, Powell has said that Fed officials “just don’t see” any rate cuts this year. We concur.´´
GBP/SD technical analysis
GBP/USD bulls are in the market, eyeing a run to test 1.2500 within the breakout of the inverse head and shoulders pattern on the 4-hour chart.
-
18:10
USD/MXN falls below 18.0000 as Mexican inflation cools amid a soft US Dollar
- USD/MXN reached a daily high above 18.0000 before tumbling toward the 17.90s area.
- Fed’s Cook expects inflation to slow down as measured by headline inflation, but core PCE is foreseen to stay sticky.
- USD/MXN Price AnalysisL Downward pressured below 18.00; otherwise, expect upside towards the 20-day EMA.
The USD/MXN loses its appeal and drops below 18.0000, even though buyers eyed higher ceilings at around the 20-day EMA. A risk-off impulse keeps the emerging market currency fluctuating, although the US Dollar (USD) weakened. At the time of writing, the USD/MXN is exchanging hands at 17.9762.
USD/MXN seesaws as sentiment fluctuated: while US and Mexican central bank divergence could weigh on the MXN
After bottoming around the 17.9000 area in the last week, the USD/MXN pierced the 18.00 area before retracing and turning negative on Monday. That after the latest round of mixed US economic data and Mexican inflation slowing in the first half of April suggested that central bank divergence could weigh on the MXN.
Last Friday, the US Federal Reserve Governor, Lisa Cook, expressed that monetary policy is entering an uncertain phase and suggested that headwinds from the banking sector could impact the outlook for rising interest rates. She also anticipates a deceleration in March PCE inflation, though she added that core inflation remains sticky.
The agenda of US economic releases featured the March Chicago Fed National Activity Index (CFNAI), with figures plummeting to -0.19, above estimates of -20, unchanged from February’s reading. Despite the previously mentioned, the three-month moving average ticked up to 0.01%, signaling that the US economy continues to grow slower.
Of late, the Dallas Fed Manufacturing Business Index in April plummeted to -23.4, well below the -11.00 estimated, as the survey showed that perceptions of broader business conditions worsened, according to the poll.
On the Mexican front, annual headline inflation rose 6.24% through mid-April, its lowest level since October 2021. Core inflation stood at 7.75% for the same period. Even though the Bank of Mexico’s (Banxico) target is 3%, expectations that the central bank completed its tightening cycle have arisen.
Aside from this, investors’ odds that the Federal Reserve will hike rates by 25 bps are at 90%, according to the CME FedWatch Tool. However, traders estimate that the US central bank “could” cut rates by the September meeting, followed by another one in December.
USD/MXN Technical Analysis
The USD/MXN continues to track the 20-day EMA as its dynamic resistance for the latest couple of weeks. Although the USD/MXN printed a daily high at around 18.0480 shies of testing 18.0500, it retreated back below the 18.00 mark as it headed for testing the YTD lows at 17.8968. Downside risks emerged below 18.0000, with key support levels at 17.9142, before the abovementioned YTD low. Conversely, buyers reclaiming 18.0000 will pave the way for the USD/MXN to test the 20-day EMA at around 18.1200 before rallying to the 50-day EMA at 18.3310.
-
17:12
AUD/USD holds below 0.6700, at weekly lows
- US Dollar mixed on a relatively quiet Monday.
- Key events ahead: Australia CPI on Wednesday and US Q1 GDP on Thursday.
- AUD/USD weakens, but losses are limited on low volume.
The AUD/USD is falling on Monday for the second day in a row, consolidating below 0.6700. In a quiet session, the US Dollar is mixed and equity prices in Wall Street are falling modestly.
Sideways, looking south
Data released on Monday showed the important Chicago Fed National Activity Index remained unchanged in March at -0.19, and the Dallas Fed Manufacturing Index came in at -23.4 well below the -15.7 of market consensus. The numbers had no significant impact on subdued markets. US yields are falling modestly weighing on the Greenback.
The key event in the US will be on Thursday with growth numbers from the first quarter. No Federal Reserve officials will speak this week ahead of the FOMC May 2-3 meeting.
In Australia, the critical report will be on Wednesday, with Q1 and March Consumer Price Index, the last crucial report ahead of next week’s Reserve Bank of Australia (RBA) meeting. At the moment, the odds favor a new pause from the RBA.
Short-term outlook
Technically the outlook for the Aussie has worsened after the AUD/USD dropped below the 20-day Simple Moving Average (SMA). The pair bottomed on Monday at 0.6665 and then rebounded modestly. The key support is the 0.6630 area, ahead of the March low at 0.6618. A recovery above 0.6700 should strengthen the Aussie, with the next resistance at 0.6740.
Technical levels
-
16:30
Gold Price Forecast: XAU/USD trading flat, poised for potential gains amid light US economic agenda
- Fed Cook: Monetary policy enters uncertain phase, though expect PCE to slow down
- The Chicago Fed National Activity Index improved, but the Dallas Fed manufacturing index deteriorated.
- XAU/USD Price Analysis: Likely to remain sideways, between the 20 and 50-day EMAs.
Gold price is trading sideways amidst the lack of a catalyst during Monday’s North American session, though likely to remain underpinned by US Dollar (USD) weakness and falling US Treasury bond yields. A risk-on impulse keeps the greenback pressured during a week of a light US economic agenda. At the time of writing, the XAU/USD is trading at $1983.50, almost flat.
Gold traders eye uncertain Fed policy as US bond yields tumble
US stocks fluctuate between gainers and losers as the week begins. With US Federal Reserve (Fed) officials getting into the blackout period, Gold traders are leaning to last Friday’s Lisa Cook, Fed Governor words. She said that monetary policy is moving into an uncertain phase and added that banking sector headwinds could weigh on the rate-rising outlook. Cook expects March PCE inflation to decelerate and refrained from asserting the same to core PCE.
US Treasury bond yields, across the board, continue to tumble, a headwind for the greenback. The US Dollar Index (DXY), a measure of the buck’s value against a basket of peers, lost traction, sliding 0.22%, and was last seen at 101.507, a tailwind for XAU/USD.
Expectations of the US Federal Reserve hiking rates by 25 bps in the next week lie at 90%, as shown by the CME FedWatch Tool. Nevertheless, traders estimate that the US central bank “could” cut rates by the September meeting, followed by another one in December.
Over the weekend, reports via the Financial Times reported that central bankers are buying gold, spurred by increased geopolitical tensions, as the World Gould Council said. The reports showed that central banks increased by 152% YoY in 2022.
Data-wise, the US economic docket featured the Chicago Fed National Activity Index (CFNAI) for March, which plunged to -0.19, above estimates of -20, unchanged from February’s reading. The three-month moving average ticked up to 0.01%, which jumped from -0.09 in February, a sign that the economy continues to expand at a slower pace.
Of late, the Dallas Fed Manufacturing Business Index in April plummeted to -23.4, well below the -11.00 estimated, as the survey showed that perceptions of broader business conditions worsened, according to the poll. The rate of change of orders and shipments improved, but both readings remained in negative territory.
XAU/USD Technical Analysis
From a technical perspective, XAU/USD is wavering around the 20-day Exponential Moving Average (EMA) at $1987.64, suggesting that the Gold price will likely remain sideways. On the downside, risks lie at $1950 before dropping and testing the 50-day EMA at $1946.45. A breach of the latter will expose the $1900 figure, ahead of the 100-day EMA at $1897.58. Conversely, upside risks are at the 20-day EMA, followed by the $2000 mark.
-
15:58
Fed likely to signal May’s hike may be the last one – Wells Fargo
Next week, the Federal Reserve will decide on monetary policy. In line with market consensus, analysts at Wells Fargo see the FOMC raising rates by 25 basis points, on what they believe will most likely be the last rate hike in this tightening cycle. They point out that incoming data indicate that inflationary pressures remain acute.
Key quotes:
“We expect the FOMC to raise the target range for the fed funds rate by 25 bps on May 3, bringing it up to 5.00%-5.25% from 0.00%-0.25% only 14 months ago. We also anticipate that the Committee will continue quantitative tightening (QT) at its current pace.”
“We believe the statement and press conference likely will signal that May's hike may very well be the last of this tightening cycle. In March, the so-called "dot plot" showed that 11 of the Committee's 18 participants viewed a fed funds rate of 5.00%-5.25% or lower at year-end 2023 as the most likely outcome, a view that has not seemed to have been swayed by the latest data.”
“If most officials see the May meeting as likely to be the final hike this cycle, then we would expect the statement to no longer include the phrase that "some additional policy firming may be appropriate."
“We do not think the statement will fully close the door on further rate hikes, given that inflation remains well above target. Rather, the statement likely will include an acknowledgement that further adjustments in rates are possible. The outlook will be based on the Committee's assessment of cumulative tightening of monetary policy, the lags of policy on economic activity and inflation, and economic and financial developments.”
-
15:30
United States Dallas Fed Manufacturing Business Index came in at -23.4 below forecasts (-14.6) in April
-
14:54
USD/JPY climbs to fresh daily high, further beyond mid-134.00s despite weaker USD
- USD/JPY gains strong positive traction in reaction to dovish remarks by BoJ’s Ueda.
- Sliding US bond yields continues to weigh on the USD and might act as a headwind.
- The cautious market mood could benefit the JPY and contribute to capping the pair.
The USD/JPY pair kicks off the new week on a positive note and builds on its steady intraday ascent through the early North American session. The momentum lifts spot prices to a fresh daily high, around the 134.70-134.75 region in the last hour and is sponsored by the heavily offered tone surrounding the Japanese Yen (JPY).
The Bank of Japan (BoJ) Kazuo Ueda sounded dovish this Monday and said that the central bank must maintain monetary easing as trend inflation is still below 2%. Ueda added that inflation forecasts must be quite strong and close to 2% in the coming year to consider tweaking yield curve control. This marks a big divergence in comparison to the recent hawkish remarks by several Federal Reserve (Fed) officials, indicating that the US central bank will continue raising interest rates, and turns out to be a key factor pushing the USD/JPY pair higher.
Meanwhile, the prospects for further policy tightening by the Fed fuel worries about economic headwinds stemming from rising borrowing costs and boosting demand for traditional safe-haven assets. This leads to a further decline in the US Treasury bond yields, which drags the US Dollar (USD) to a one-week low and might hold back traders from placing aggressive bullish bets around the USD/JPY pair. Apart from this, the global flight to safety could benefit the JPY and further contribute to capping the upside for the major, at least for the time being.
Traders might also prefer to wait on the sidelines ahead of this week's important US macro releases, starting with the Conference Board's Consumer Confidence Index on Tuesday. This will be followed by the US Durable Goods Orders data on Wednesday, the Advance Q1 GDP prints on Thursday and the US Core PCE Price Index - the Fed's preferred inflation gauge on Friday. Apart from this, traders will take cues from the highly-anticipated BoJ monetary policy meeting on the last day of the week should determine the near-term trajectory for the USD/JPY pair.
Technical levels to watch
-
14:51
EUR/USD in multi-day highs past 1.1000 as European markets draw to a close
- EUR/USD climbs to multi-session peaks near 1.1030.
- Germany’s Business Climate surprised to the downside in April.
- US Chicago Fed Index held steady in March.
EUR/USD manages to reverse the initial pessimism and advances to fresh peaks past the psychological 1.1000 the figure in an auspicious beginning of the week.
EUR/USD stronger on USD-selling
EUR/USD clinches the third consecutive daily gain on the back of the continuation of the downward bias in the dollar and the generalized upbeat sentiment in the global markets.
Furthermore, the underlying uptrend that prevails in spot since mid-March remains propped up by expectations of further tightening by the ECB at its upcoming meetings. On this, a 25 bps rate hike appears already largely priced in in May, while speculation of extra raises at the June and July gatherings also remains on the rise.
In the data universe, Germany’s Business Climate tracked by the IFO institute came in below consensus despite improving marginally to 93.6 for the month of April. In the US, the Chicago Fed National Activity Index disappointed expectations after remaining unchanged at -0.19 in March. Later in the session, the Dallas Fed Manufacturing Index will close the daily docket.
What to look for around EUR
EUR/USD picks up pace and manages to clear the key hurdle at the 1.1000 yardstick at the beginning of the week.
Meanwhile, price action around the single currency should continue to closely follow dollar dynamics, as well as the incipient Fed-ECB divergence when it comes to the banks’ intentions regarding the potential next moves in interest rates.
Moving forward, hawkish ECB-speak continue to favour further rate hikes, although this view appears in contrast to some loss of momentum in economic fundamentals in the region.
Key events in the euro area this week: Germany IFO Business Climate (Monday) – Germany GfK Consumer Confidence (Wednesday) – EMU Final Consumer Confidence, Economic Sentiment (Thursday) – Euro group Meeting, Germany labour market report/ Advanced Inflation Rate/Flash Q1 GDP Growth Rate, EMU Flash Q1 GDP Growth Rate (Friday).
Eminent issues on the back boiler: Continuation (or not) of the ECB hiking cycle. Impact of the Russia-Ukraine war on the growth prospects and inflation outlook in the region. Risks of inflation becoming entrenched.
EUR/USD levels to watch
So far, the pair is gaining 0.29% at 1.1020 and a break above 1.1031 (weekly high April 24) would target 1.1075 (2023 high April 14) en route to 1.1184 (weekly high March 21 2022). On the downside, initial contention emerges at 1.0831 (monthly low April 10) seconded by 1.0788 (monthly low April 3) and finally 1.0766 (55-day SMA).
-
14:20
GBP/USD sticks to modest intraday gains around mid-1.2400s, lacks follow-through
- GBP/USD regains some positive traction on Monday amid the emergence of fresh USD selling.
- A further decline in the US Treasury bond yields is seen as a key factor weighing on the buck.
- Bets for more Fed rate hikes, a weaker risk tone could limit the USD losses and cap the major.
The GBP/USD pair attracts some dip-buying in the vicinity of the 1.2400 mark on Monday and touches a fresh daily high during the early North American session. The pair is currently placed around the 1.2450 region, up nearly 0.20% for the day, though the intraday uptick lacks bullish conviction.
The US Dollar (USD) remains under some selling pressure for the third successive day and drops to a one-week low amid the ongoing downfall in the US Treasury bond yields. This, in turn, is seen as a key factor lending some support to the GBP/USD pair amid rising bets for an additional interest rate hike by the Bank of England (BoE) in May. In fact, the markets now see over a 90% chance of a 25-bps rate hike in May. The bets were lifted by last week's release of stronger UK wage growth data and the stubbornly high inflation figures.
The Federal Reserve (Fed), meanwhile, is also expected to continue raising interest rates to curb inflation. Moreover, the markets have fully priced in a 25 bps lift-off at the next FOMC policy meeting in May and the Fed funds future indicates another rate hike in June. The expectations were reaffirmed by the recent hawkish comments by several Fed officials and the incoming positive US macro data, which suggested that the world's largest economy remained resilient and supports prospects for further policy tightening by the US central bank.
In the absence of any relevant market-moving economic releases on Monday, the aforementioned mixed fundamental backdrop might hold back traders from placing aggressive bullish bets around the GBP/USD pair. Traders also seem reluctant ahead of this week's important US macro data, starting with the Conference Board's Consumer Confidence Index on Tuesday. This will be followed by the US Durable Goods Orders, the Advance US Q1 GDP print and the Core US PCE Price Index on Wednesday, Thursday and Friday, respectively.
Technical levels to watch
-
14:00
Belgium Leading Indicator declined to -7.8 in April from previous -7.6
-
13:38
US: Chicago Fed National Activity Index unchanged at -0.19 in March vs. -0.02 expected
- Chicago Fed National Activity Index was unchanged at -0.19 in March.
- The US Dollar Index remains in negative territory, around 101.60 after the data.
The Federal Reserve Bank of Chicago's National Activity Index (CFNAI) was unchanged at -0.19 in March. This reading came in weaker than the market expectation of -0.02.
“Three of the four broad categories of indicators used to construct the index made negative contributions in March, and two categories deteriorated from February. The index’s three-month moving average, CFNAI-MA3, increased to +0.01 in March from –0.09 in February,” the Chicago Fed noted in its publication.
“The CFNAI Diffusion Index, which is also a three-month moving average, edged up to +0.14 in March from +0.10 in February. Forty-three of the 85 individual indicators made positive contributions to the CFNAI in March, while 42 made negative contributions. Forty-five indicators improved from February to March, while 40 indicators deteriorated. Of the indicators that improved, 13 made negative contributions.”
Market reaction
The US Dollar is trading mixed on Monday. The DXY is falling by 0.08%, as EUR/USD trades above 1.1000. The pair continued to move around 1.1005/10 after the report.
-
13:32
USD/CAD eases from monthly peak amid softer USD, up a little around mid-1.3500s
- USD/CAD touches a fresh monthly high on Monday, albeit lacks follow-through.
- A modest recovery in Oil prices underpins the Loonie and acts as a headwind.
- Sliding US bond yields weigh on the USD and collaborate to capping the upside.
The USD/CAD pair eases from a fresh monthly peak touched earlier this Monday and trades around the 1.3550 area, up less than 0.10% for the day heading into the North American session.
Crude Oil prices bounce off the monthly low amid the prospect of tighter supplies on OPEC+ supply cuts, which, in turn, is seen underpinning the commodity-linked Loonie. The US Dollar (USD), on the other hand, is weighed down by a further decline in the US Treasury bond yields and acts as a headwind for the USD/CAD pair. That said, a combination of factors continues to lend some support to the major and supports prospects for an extension of the recent recovery move from the 1.3300 mark, or a two-month low touched on April 14.
The upside for the black liquid seems limited amid concerns that rising borrowing costs will hamper global economic growth and dent fuel demand. Furthermore, growing acceptance that the Federal Reserve (Fed) will continue raising interest rates to curb inflation, along with a generally weaker risk tone, should lend some support to the safe-haven Greenback. This, in turn, warrants some caution for bearish traders and before positioning for any meaningful corrective pullback in the absence of any relevant market-moving data.
In fact, the markets have fully priced in a 25 bps lift-off at the next FOMC policy meeting in May and the Fed funds future indicates a smaller chance of another rate hike in June. The bets were lifted by the recent hawkish remarks by several Fed officials and the incoming positive US macro data, which suggested that the world's largest economy remained resilient. This, in turn, favours the USD bulls. Traders, however, might refrain from placing aggressive bets and prefer to wait for this week's important US economic releases.
A rather busy week kicks off with the release of the Conference Board's US Consumer Confidence Index on Tuesday, followed by the US Durable Goods Orders data on Wednesday. The focus, however, will remain glued to the release of the US Q1 GDP report on Thursday and the US Core PCE Price Index - the Fed's preferred inflation gauge - on Friday. This will play a key role in influencing the USD demand, which, along with Oil price dynamics, should assist investors to determine the near-term trajectory for the USD/CAD pair.
Technical levels to watch
-
13:32
Canada New Housing Price Index (YoY) dipped from previous 1.4% to 0.2% in March
-
13:31
Canada New Housing Price Index (MoM) above expectations (-0.2%) in March: Actual (0%)
-
13:30
United States Chicago Fed National Activity Index registered at -0.19, below expectations (-0.02) in March
-
13:24
EUR/USD Price Analysis: Extra gains target the 1.1080 region
- EUR/USD reclaims the area beyond the 1.1000 yardstick on Monday.
- Extra upside appears on the cards with the target at the YTD top.
EUR/USD extends the bullish mood north of the key 1.1000 barrier at the beginning of the week.
The pair looks poised to extend the recovery further in the near term at least. That said, the immediate hurdle is expected at the 2023 high at 1.1075 (April 14) seconded by the round level at 1.1100.
Looking at the longer run, the constructive view remains unchanged while above the 200-day SMA, today at 1.0395.
EUR/USD daily chart
-
13:00
Mexico 1st half-month Inflation came in at -0.16% below forecasts (-0.12%) in April
-
13:00
Mexico 1st half-month Core Inflation below expectations (0.22%) in April: Actual (0.18%)
-
12:17
Bundesbank: German economy did better in Q1 of 2023 than expected
"The German economy did better in the first quarter of 2023 than expected a month ago and activity is likely to have picked up again somewhat," Germany's Bundesbank said in its monthly report published on Monday.
"Industry recovered more strongly than expected," the Bundesbank further noted and added that high employment in Germany should keep supporting consumer activity.
In its publication, however, the German central bank also acknowledged that the outlook was still mixed with inflation still weighing on consumption.
Market reaction
EUR/USD clings to modest daily gains a few pips above 1.1000 on Monday.
-
12:16
USD Index Price Analysis: Further range bound ahead of potential losses?
- DXY navigates within the recent side-lined trading below 102.00.
- Further losses could put the 2023 low back on the radar.
DXY extends the move higher and revisits the mid-101.00s following an earlier failed attempt to retake the 102.00 yardstick on Monday.
The recent choppy performance in the index seems to have now refocused back on the downside. Against that, DXY could cling to this consolidative theme ahead of a probable drop to the so far 2023 lows near 100.80 (April 14) ahead of the psychological support at the 100.00 mark.
Looking at the broader picture, while below the 200-day SMA, today at 106.18, the outlook for the index is expected to remain negative.
DXY daily chart
-
12:10
ECB tightening expectations have picked up a bit – BBH
Economists at BBH note that European Central Bank (ECB) officials stressed that increased volatility in inflation and growth are making policymaking more difficult.
Another 25 bp hike is priced in for June 15
"Panetta focused on geopolitics and the Ukraine invasion, noting “Geopolitical shocks may trigger persistent output and inflation volatility, with multiple spillovers. Russia’s aggression against Ukraine has, for instance, disrupted energy and commodities markets, with major implications for inflation.” Elsewhere, Villeroy focused on climate change, noting “Climate transition entails structural changes to the global economy that are both universal and certain, with an overall and possibly negative supply shock. Second, higher volatility is likely, which means shocks on both activity and inflation. This is where we central banks have to do our job in order to maintain a solid anchoring of long-term inflation expectations despite higher volatility. We cannot just look through it, since it is not an unexpected and transitory shock” Both are correct to highlight these long-term issues."
"ECB tightening expectations have picked up a bit. The next policy meeting is May 4 and WIRP suggests about 30% odds of a 50 bp hike then. After that, another 25 bp hike is priced in for June 15 followed by another 25 bp hike July 27. Odds of one final hike in in September or October top out near 45% and so the peak policy rate is now seen between 3.75-4.0%%, up from3.75% at the start of last week and 3.50% at the start of the week before that."
-
12:07
There is additional room for Gold price to drop further – TDS
Analysts at TD Securities note that Gold price dropped below $1,980/oz after the preliminary US Services PMI printed a much stronger-than-expected 53.7 for April.
Strong data suggests more gold downside
"This forced rates up across the curve, which drove the US Dollar sharply higher. It seems we are seeing USD shorts being covered, after specs increased positions amid expectations of a Fed dovish pivot. Similarly, in the gold market, money mangers are also likely increasing recently reduced shorts and are cutting acquired longs."
"With the PMI and potentially other economic data pointing to continued economic strength, the market is starting to bet that rates may continue to increase. As such, there is additional room for gold to drop further. Indeed, we are projecting a $1,975/oz gold price in Q2. Technically, we see significant support at just above $1,960/oz. However, we see the yellow metal trend at $2,100/oz in late H2-2023."
"Traders should keep an eye on data during the Fed's quiet period. Strong data suggests more gold downside, while weakness implies strength for the yellow metal."
-
12:04
EUR/JPY Price Analysis: Next on tap emerges the 150.00 mark
- EUR/JPY extends the rally and prints new 2023 highs on Monday.
- Once the 2022 high is cleared, the cross could challenge 150.00.
EUR/JPY climbs to new YTD peaks past the 148.00 barrier at the beginning of the week.
The strong upside momentum in the cross appears so far unabated. The surpass of the the 2022 peak at 148.40 (October 21) is expected to shift the focus to a potential test of the key 150.00 yardstick in the not-so-distant future.
So far, further upside looks favoured while the cross trades above the 200-day SMA, today at 142.26.
EUR/JPY daily chart
-
12:02
US Dollar should continue to gain – BBH
Economists at BBH note that markets will pay attention to macroeconomic data releases from the United States with the Federal Reserve going into the quiet period until the May 2-3 FOMC meeting.
Fed tightening expectations have picked up bit
"Between now and next Wednesday’s Fed decision, we won’t get any top tier data but we will get some important clues. This week, Chicago Fed NAI today and Q1 GDP data Thursday will tell us about the real sector, while PCE and ECI data Friday will tell us more about the inflation outlook. Next week, Monday brings ISM manufacturing PMI."
"We will get some more labor market readings as next Tuesday brings JOLTS data and next Wednesday brings ADP private sector jobs. NFP won’t come until after the FOMC decision. Recent resilience in the U.S. economy helped push UST yields higher and we look for that process to continue. If so, the dollar should continue to gain as well."
"Fed tightening expectations have picked up bit. WIRP suggests over 90% odds of 25 bp hike at the May 2-3 meeting, up from 80% at the start of last week and 70% at the start of the week before that. To us, a hike next week is a done deal. There are about 15% odds of another 25 bp hike in June. Between the May 2-3 and June 13-14 meetings, the Fed will have digested two more job reports, two CPI/PPI reports, and one retail sales report."
"At this point, a pause in June might just be the most likely outcome but it really will depend on how all that data come in. After all that, one cut is still priced in by year-end vs. two at the start of last week. In that regard, Powell has said that Fed officials “just don’t see” any rate cuts this year. We concur."
-
11:48
Japan: BoJ expected to keep monetary policy unchanged – UOB
Economist at UOB Group Lee Sue Ann sees the BoJ gradually moving towards an exit of the ultra-accommodative stance.
Key Quotes
“This will be new BoJ Gov Kazuo Ueda’s first policy meeting. Since Ueda is not known as either very dovish or very hawkish in his policy view, we believe the normalising will be carried out at a gradual, well-telegraphed pace, and not a sharp and sudden reversal.”
“We expect Ueda to carry out the unwinding in two broad steps: 1) A protracted period (Apr to Dec 2023) of forward guidance to prepare market for an orderly exit of BOJ’s ultra-easy monetary policy which may also involve a widening of the trading range of the 10-year JGB yield (to +/- 100bps). 2) We expect monetary policy normalization to begin only in early 2024 - YCC to be dropped and negative policy call rate to rise from -0.1% to 0% in Jan 2024 MPM.”
-
11:47
US Dollar keeps its cool ahead of key US GDP data this week
- US Dollar struggles to gather strength but losses remain limited for now.
- Key macroeconomic data releases from the United States this week could drive USD valuation.
- US Dollar Index remains technically bearish in the near term.
The US Dollar (USD) failed to benefit from the stronger-than-expected S&P Global PMI surveys on Friday and the US Dollar Index closed the previous week virtually unchanged. At the beginning of the new week, the USD stays under modest selling pressure against its rivals. Ahead of the key macroeconomic data releases later in the week, including the first quarter Gross Domestic Product (GDP) and April Personal Consumption Expenditures (PCE) Price Index, investors could refrain from betting on further USD weakness.
The US Dollar Index, which tracks the USD performance against a basket of six major currencies, stays calm slightly above 101.50 on Monday.
Daily digest market movers: US Dollar’s subdued action continues on Monday
- The data from the US revealed on Friday that the economic activity in the private sector expanded at a strengthening pace in April with S&P Global Composite PMI rising to 53.5 (flash) from 52.3 in March.
- S&P Global Manufacturing PMI improved to 50.4 in the same period from 49.2 and Services PMI rose to 53.7, surpassing analysts' forecast of 51.5.
- Commenting on the data, "the latest survey adds to signs that business activity has regained growth momentum after contracting over the seven months to January," noted Chris Williamson, Chief Business Economist at S&P Global Market Intelligence.
- US stock index trades modestly lower on Monday, suggesting that Wall Street’s main indexes could start the week on the back foot.
- 10-year US Treasury bond yield stays in negative territory but manages to hold above 3.5%.
- The Federal Reserve Bank of Chicago will release the National Activity Index for March on Monday. The Federal Reserve Bank of Dallas will publish the Texas Manufacturing Survey for April as well.
- The CME Group FedWatch Tool shows that markets are currently pricing a nearly 90% probability of one more 25 basis points Federal Reserve (Fed) rate hike at the upcoming meeting.
- The Fed will be in the blackout period until the policy decisions are announced next week, May 3.
- The US Bureau of Economic Analysis will unveil the first estimate of first-quarter GDP growth on Thursday. The US economy is forecast to expand at an annualized rate of 2% in Q1, down from the 2.6% recorded in the last quarter of 2022.
Technical analysis: US Dollar Index remains technically bearish
The US Dollar Index trades slightly below the 20-day Simple Moving Average (SMA), currently located at 102.00. In case the DXY closes the day above that level, it could target 103.00 (static level, psychological level) and 103.40 (50-day SMA, 100-day SMA).
Meanwhile, the Relative Strength Index (RSI) indicator on the daily chart moves sideways slightly below 50, suggesting that buyers remain reluctant to bet on a steady recovery in the DXY.
On the downside, 101.50 (static level) align as interim support ahead of 101.00/100.80 (psychological level, static level, multi-month low set on April 14). A daily close below that support area could open the door for an extended slide toward 100.00 (psychological level).
How does Fed’s policy impact US Dollar?
The US Federal Reserve (Fed) has two mandates: maximum employment and price stability. The Fed uses interest rates as the primary tool to reach its goals but has to find the right balance. If the Fed is concerned about inflation, it tightens its policy by raising the interest rate to increase the cost of borrowing and encourage saving. In that scenario, the US Dollar (USD) is likely to gain value due to decreasing money supply. On the other hand, the Fed could decide to loosen its policy via rate cuts if it’s concerned about a rising unemployment rate due to a slowdown in economic activity. Lower interest rates are likely to lead to a growth in investment and allow companies to hire more people. In that case, the USD is expected to lose value.
The Fed also uses quantitative tightening (QT) or quantitative easing (QE) to adjust the size of its balance sheet and steer the economy in the desired direction. QE refers to the Fed buying assets, such as government bonds, in the open market to spur growth and QT is exactly the opposite. QE is widely seen as a USD-negative central bank policy action and vice versa.
-
11:41
NZD/USD remains below mid-0.6100s, seems vulnerable near one-month low
- NZD/USD rebounds from over a one-month low, though the uptick lacks follow-through.
- A further slide in the US bond yields weighs on the USD and lends support to the major.
- Bets for more Fed rate hikes, a weaker risk tone limit the USD losses and cap the pair.
The NZD/USD pair stages a modest intraday bounce from the 0.6125 area, or its lowest level since March 13 touched earlier this Monday, albeit struggles to capitalize on the move. Spot prices trade with a mild positive bias, around the 0.6140 region during the first half of the European session and for now, seem to have snapped a three-day losing streak.
A further decline in the US Treasury bond yields continues to exert some downward pressure on the US Dollar (USD), which, in turn, is seen as a key factor lending support to the NZD/USD pair. That said, the prospects for further policy tightening by the Federal Reserve (Fed), which, along with a weaker risk tone, help limit the downside for the safe-haven buck and keep a lid on any meaningful upside for the risk-sensitive Kiwi.
The markets seem convinced that the Fed will continue raising interest rates to curb inflation and have fully priced in a 25 bps lift-off at the next FOMC policy meeting in May. Moreover, the Fed funds future indicates a smaller chance of another rate hike in June. The bets were lifted by the recent hawkish comments by several Fed officials and the incoming US macro data, which suggested that the world's largest economy remained resilient.
Meanwhile, worries about economic headwinds stemming from rising borrowing costs temper investors' appetite for riskier assets. This, in turn, could drive some haven flows towards the Greenback and contribute to capping gains for the NZD/USD pair. In the absence of any relevant market-moving economic data, the US bond yields, along with the broader risk sentiment, will influence the USD and provide some impetus to the major.
Market participants now look to this week's rather busy US economic docket, featuring the release of the Conference Board's Consumer Confidence Index on Tuesday, followed by Durable Goods Orders on Wednesday. The focus, however, will remain glued to the Advance US Q1 GDP report on Thursday and the Core PCE Price Index - the Fed's preferred inflation gauge - on Friday, which should determine the near-term trajectory for the NZD/USD pair.
Technical levels to watch
-
10:51
USD/CHF slides below 0.8900 mark amid weaker risk tone, fresh USD selling
- USD/CHF meets with a fresh supply on Monday and is weighed down by a combination of factors.
- A weaker risk tone underpins the safe-haven CHF and exerts pressure amid renewed USD selling.
- Bets for more Fed rate hikes could help limit losses for the buck and lend some support to the pair.
The USD/CHF pair comes under some renewed selling pressure on Monday and drops to a one-week low during the first half of the European session. The pair is currently placed just below the 0.8900 mark and remains well within the striking distance of its lowest level since January 2021 touched earlier this month.
Worries about economic headwinds stemming from rising borrowing costs temper investors' appetite for riskier assets, which is evident from a fresh leg down in the equity markets, which, in turn, benefits the safe-haven Swiss Franc (CHF). The US Dollar (USD), on the other hand, turns lower for the third successive day amid a further decline in the US Treasury bond yields and contributes to the intraday selling bias around the USD/CHF pair.
That said, the prospects for further policy tightening by the Federal Reserve (Fed) could act as a tailwind for the US bond yields and help limit losses for the Greenback. In fact, the markets have nearly fully priced in a 25 bps lift-off at the May FOMC policy meeting and the Fed funds future indicates a smaller chance of another rate hike in June. The bets were reaffirmed by the recent hawkish commentary by a slew of influential FOMC policymakers.
Moreover, the incoming US macro data suggested that the world's largest economy remained resilient and reaffirmed market bets that the Fed will continue raising interest rates to curb inflation. In the absence of any relevant market-moving economic releases from the US, the aforementioned fundamental backdrop warrants some caution before positioning for any further fall for the USD/CHF pair ahead of this week's key US macro data.
This week's rather busy US economic docket kicks off with the release of the Conference Board's Consumer Confidence Index on Tuesday, followed by Durable Goods Orders on Wednesday. The focus, however, will remain glued to the Advance US Q1 GDP report on Thursday and the Core PCE Price Index - the Fed's preferred inflation gauge - on Friday, which will help determine the near-term trajectory for the USD/CHF pair.
Technical levels to watch
-
10:18
ECB’s Panetta: Geopolitics risk persistent inflation volatility
“Geopolitics risk persistent inflation volatility,” the European Central Bank’s executive board member, Fabio Panetta, said on Monday.
Panetta added that “globalization may influence the natural rate of interest.”
Market reaction
The above comments fail to have any impact on the Euro, as EUR/USD is trading close to the intraday high at 1.1021, as of writing. The spot is up 0.27% on the day.
-
09:59
ECB’s Villeroy: Central banks’ core mandate worldwide is price stability
European Central Bank (ECB) Governing Council member and Bank of France head Francois Villeroy de Galhau said on Monday, “central banks’ core mandate worldwide is price stability and climate change already affects the level of prices and activity.”
The ECB is set to announce its policy decision next week and markets are expecting the central bank to raise rates by a quarter point, with the possibility of a 50 bps hike. Eurozone inflation and growth data are due this week.
Market reaction
At the time of writing, EUR/USD is trading 1.0991, up 0.06% on the day.
-
09:51
USD/JPY sticks to modest intraday gains just below mid-134.00s, lacks follow-through
- USD/JPY kicks off the new week on a positive note in reaction to dovish remarks by BoJ’s Ueda.
- The Fed-BoJ policy divergence weighs on the JPY and remains supportive of the intraday gains.
- Sliding US bond yields acts as a headwind for the USD and keeps a lid on any meaningful upside.
The USD/JPY pair builds on Friday's bounce from the vicinity of mid-133.00s and gains some follow-through traction on the first day of a new week. The pair maintains its bid tone through the early part of the European session and currently trades around the 134.30 region, just a few pips below the daily top.
The Japanese Yen (JPY) weakens in reaction to the Bank of Japan (BoJ) Kazuo Ueda's dovish remarks on Monday, saying that the central bank must maintain monetary easing as trend inflation is still below 2%. Ueda added that inflation forecasts must be quite strong and close to 2% in the coming year to consider tweaking yield curve control. In contrast, the Federal Reserve (Fed) is expected to continue raising interest rates to curb stubbornly high inflation. This, in turn, acts as a tailwind for the US Dollar (USD) and is seen lending some support to the USD/JPY pair.
In fact, the markets have fully priced in a 25 bps lift-off at the next FOMC policy meeting in May and the Fed funds future points to a small chance of another rate hike in June. The bets were lifted by the recent hawkish remarks by several Fed officials. Adding to this, the incoming US macro data suggested that the world's largest economy remained resilient and supports prospects for further tightening by the Fed. That said, a fresh leg down in the US Treasury bond yields holds back the USD bulls from placing aggressive bets and caps the USD/JPY pair amid a weaker risk tone.
Worries about economic headwinds stemming from rising borrowing costs temper investors' appetite for riskier assets, which is evident from a generally weaker tone around the equity markets. This, in turn, could drive some haven flows towards the JPY and keep a lid on any meaningful upside for the USD/JPY pair, at least for the time being. In the absence of any relevant market-moving economic releases, the aforementioned mixed fundamental backdrop warrants some caution before positioning for any further intraday appreciating move for the major.
Technical levels to watch
-
09:31
Hong Kong SAR Unemployment rate came in at 3.1%, below expectations (3.3%) in March
-
09:21
IFO’s Economist: German economy far away from substantial upswing
Following the release of the German IFO Business Survey, the institute’s Economist Klaus Wohlrabe said that the “German economy is far away from the substantial upswing.”
Additional quotes
Proportion of German companies that want to raise prices has fallen again.
German economy is lacking momentum.
Industry's export expectations have risen.
Strong economies in China and US seem to support German industry.
Banking turmoil has had no impact on companies' sentiment.
Situation in construction industry has not been worse since December 2015, many cancellations.
Related reads
- EUR/USD Forecast: Euro defines range before next breakout
- ECB’s Wunsch: Central bank to keep raising interest rates unless wage growth slows – FT
-
09:14
USD/CNH: Upside momentum seen improving in the near term – UOB
A more serious advance in USD/CNH needs to break above the 6.9350 level in the short-term horizon, comment Economist Lee Sue Ann and Markets Strategist Quek Ser Leang at UOB Group.
Key Quotes
24-hour view: “Last Friday, we expected USD to trade in a range of 6.8700/6.8900. However, USD rose to a high of 6.9061 and then closed at 6.8974 (+0.18%). Upward momentum has improved a tad and USD is likely to trade with an upward bias. However, any advance is likely to face strong resistance at 6.9100. The major resistance at 6.9350 is not expected to come under threat. Support is at 6.8860, followed by 6.8780.”
Next 1-3 weeks: “Our update from last Thursday (20 Apr, spot at 6.8920) still stands. As highlighted, upward momentum is beginning to improve but USD has to break and stay above 6.9350 before a sustained rise is likely. The chance of USD breaking clearly above 6.9350 is not high for now but it will remain intact as long as the ‘strong support’ level at 6.8600 (no change in level) is not taken out in the next 1-2 days.”
-
09:04
German IFO Business Climate Index improves to 93.6 in April vs. 94 expected
- German IFO Business Climate Index improved modestly in April.
- EUR/USD trades in the upper half of its daily range slightly below 1.1000 after the data.
The headline German IFO Business Climate Index edged higher to 93.6 in April from 93.2 in March. This reading came in slightly weaker than the market expectation of 94.
Meanwhile, the Current Economic Assessment dropped to 95 from 95.4 and the IFO Expectations Index – indicating firms’ projections for the next six months, rose to 92.2 from 91, surpassing analysts' estimate of 91.6.
Market reaction
EUR/USD gained traction and turned positive on the day near 1.0990 with the initial reaction.
About German IFO
The headline IFO business climate index was rebased and recalibrated in April after the IFO Research Institute changed the series from the base year of 2000 to the base year of 2005 as of May 2011 and then changed the series to include services as of April 2018. The survey now includes 9,000 monthly survey responses from firms in the manufacturing, service sector, trade and construction.
-
09:01
Germany IFO – Expectations registered at 92.2 above expectations (91.6) in April
-
09:01
Germany IFO – Current Assessment below forecasts (96.1) in April: Actual (95)
-
09:01
Germany IFO – Business Climate came in at 93.6 below forecasts (94) in April
-
08:59
GBP/USD flat-lines below mid-1.2400s, downside potential seems limited
- GBP/USD lacks any firm intraday direction and oscillates in a narrow trading range on Monday.
- Bets for more Fed rate hikes, a softer risk tone underpin the USD and cap the upside for the pair.
- Expectations for another 25 bps BoE rate hike in May lend support to the GBP and limit losses.
The GBP/USD pair struggles to capitalize on Friday's goodish rebound of over 65 pips from the 1.2365 area and kicks off the new week on a subdued note. Spot prices seesaw between tepid gains/minor losses through the early European session and currently trade around the 1.2435 region, nearly unchanged for the day.
A combination of factors assists the US Dollar (USD) to gain some positive traction on the first day of the new week, which, in turn, is seen acting as a headwind for the GBP/USD pair. The recent hawkish signals by several Federal Reserve (Fed) officials reaffirmed market bets for another 25 bps lift-off at the next FOMC meeting in May. Moreover, the incoming US macro data suggests that the world's largest economy remained resilient and supports prospects for further policy tightening by the Fed. Apart from this, a generally weaker risk tone benefits the Greenback's relative safe-haven status.
The market sentiment remains fragile amid worries about economic headwinds stemming from rising borrowing costs. This is evident from a fresh leg down in the equity markets and drives some haven flows towards the buck. The downside for the GBP/USD pair, however, remains cushioned, at least for the time being, amid rising bets for an additional interest rate hike by the Bank of England (BoE) in May. In fact, the markets now see over a 90% chance of a 25-bps rate hike in May. The bets were lifted by last week's release of stronger UK wage growth data and the stubbornly high inflation figures.
In the absence of any relevant market-moving economic releases, either from the UK or the US, the aforementioned mixed fundamental backdrop warrants some caution before placing aggressive directional bets around the GBP/USD pair. Traders also seem reluctant ahead of this week's key macro data from the US, including the Advance Q1 GDP print on Thursday and the Fed's preferred inflation gauge - the Core PCE Price Index - on Friday. The data will play a key role in influencing the near-term USD price dynamics and help determine the near-term trajectory for the major.
Technical levels to watch
-
08:47
Euro trades at top of its range after hawkish comments from ECB’s Wunsch
- Euro vs US Dollar presses the top of its range after hawkish comments from Belgium central bank President Pierre Wunsch
- The pair is in a medium-term uptrend which is favored to extend.
- The US Dollar benefits from strong macroeconomic data which suggests the Federal Reserve will have to continue raising interest rates.
The Euro (EUR) trades in the upper 1.09s versus the US Dollar (USD) as the new week begins. The single currency is underpinned by market expectations of higher interest rates down the line drawing greater capital inflows into Europe. From a technical perspective, the overall trend is up, giving bulls a wind-in-their-sail’s advantage.
EUR/USD market movers
- The Euro is underpinned by comments from Belgian central bank president Pierre Wunsch, who said “We are waiting for wage growth and core inflation to go down... before we can arrive at the point where we can pause.”
- This supports comments from European Central Bank (ECB) President Christine Lagarde who said there is still “some way to go” before the ECB finishes hiking interest rates.
- The US Dollar benefits from US PMI data pushing into expansionary territory.
- USD further underpinned by hawkish comments from St. Louis Fed’s Bullard who expects more rate hikes due to persistent inflation and overblown recession fears.
- Unexpectedly strong first quarter earnings from US megabanks suggests the sector’s March crisis may be in the rear-view mirror, further supporting the Greenback.
- Data out on May 2 could be key according to European Central Bank’s chief economist Philip Lane. It includes the ECB’s Bank Lending Survey (BLS), giving a snapshot of the health of the region’s banks, and April HICP inflation.
- German IFO survey at 08:00 GMT is the next major release on Monday.
- For the US Dollar the Chicago Fed National Activity Index is the most important release, out at 13:30 GMT.
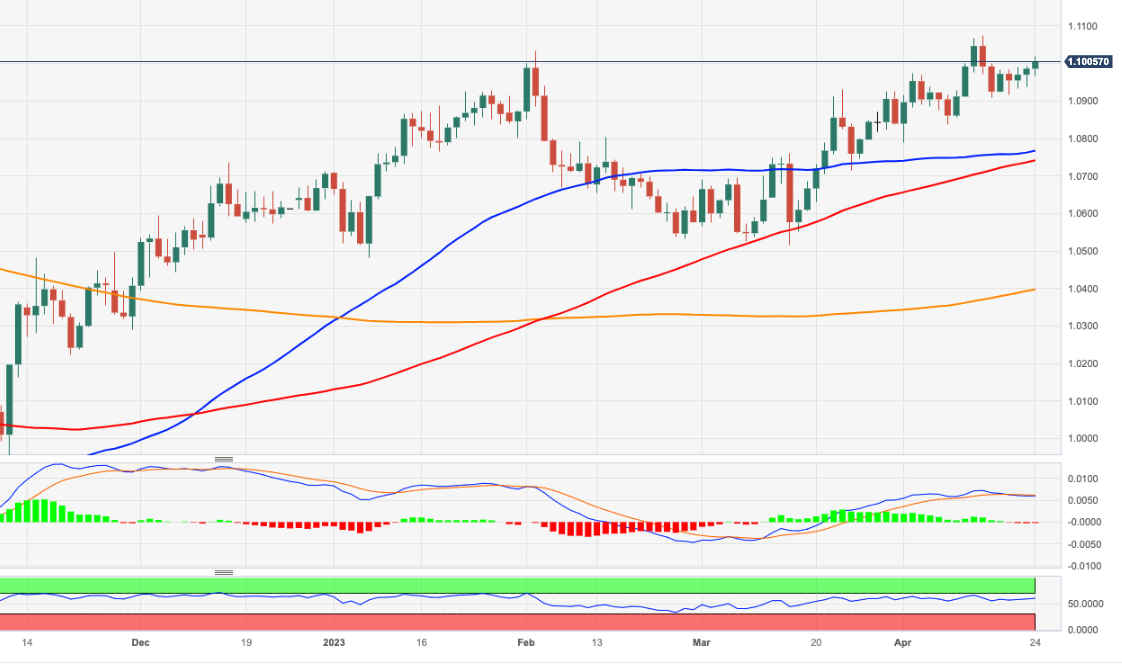
EUR/USD technical analysis: Triangle in an uptrend
EUR/USD continues in a range bound consolidation within a broader medium-term uptrend that started over eight months ago. The odds favor a continuation of the overarching bull trend.
-638179189866926452.png)
EUR/USD: Daily ChartA break and daily close above the 1.1075 year-to-date highs of April 14 would confirm a continuation of the Euro's uptrend to the next key resistance level at around 1.1190, where the 200-week Simple Moving Average (SMA) is situated.
A break and daily close below the important lower high at 1.0830, on the other hand, would bring into doubt the validity of the uptrend and could see losses extend down to a confluence of support at 1.0775-1.0800, and a possible reversal of the dominant trend.
European Central Bank FAQs
What is the ECB and how does it influence the Euro?
The European Central Bank (ECB) in Frankfurt, Germany, is the reserve bank for the Eurozone. The ECB sets interest rates and manages monetary policy for the region.
The ECB primary mandate is to maintain price stability, which means keeping inflation at around 2%. Its primary tool for achieving this is by raising or lowering interest rates. Relatively high interest rates will usually result in a stronger Euro and vice versa.
The ECB Governing Council makes monetary policy decisions at meetings held eight times a year. Decisions are made by heads of the Eurozone national banks and six permanent members, including the President of the ECB, Christine Lagarde.What is Quantitative Easing (QE) and how does it affect the Euro?
In extreme situations, the European Central Bank can enact a policy tool called Quantitative Easing. QE is the process by which the ECB prints Euros and uses them to buy assets – usually government or corporate bonds – from banks and other financial institutions. QE usually results in a weaker Euro.
QE is a last resort when simply lowering interest rates is unlikely to achieve the objective of price stability. The ECB used it during the Great Financial Crisis in 2009-11, in 2015 when inflation remained stubbornly low, as well as during the covid pandemic.What is Quantitative tightening (QT) and how does it affect the Euro?
Quantitative tightening (QT) is the reverse of QE. It is undertaken after QE when an economic recovery is underway and inflation starts rising. Whilst in QE the European Central Bank (ECB) purchases government and corporate bonds from financial institutions to provide them with liquidity, in QT the ECB stops buying more bonds, and stops reinvesting the principal maturing on the bonds it already holds. It is usually positive (or bullish) for the Euro.
-
08:40
EUR/USD remains capped by 1.1000 ahead of key data
- EUR/USD gives away part of the recent advance.
- The dollar kicks in the week slightly on the upside.
- Germany’s IFO Business Climate next on tap in the docket.
Sellers appear to have returned to the European currency and drag EUR/USD back to the 1.0980/70 band at the beginning of the week.
EUR/USD looks at data
EUR/USD loses ground after two consecutive daily gains in response to the so far tepid pick-up in the sentiment around the greenback on Monday.
Looking at the broader picture, the upside bias prevailing in the pair since mid-March remains underpinned by expectations of further tightening by the ECB at its upcoming meetings. On this, a 25 bps rate hike appears already largely priced in in May, while speculation of extra raises at the June and July gatherings also remains on the rise.
In the data space, Germany’s Business Climate tracked by the IFO institute will take centre stage later in the European morning. In the US, the Chicago Fed National Activity Index is due along with the Dallas Fed Manufacturing Index.
What to look for around EUR
EUR/USD keeps the range bound trade well in place always below the 1.1000 region so far on Monday.
Meanwhile, price action around the single currency should continue to closely follow dollar dynamics, as well as the incipient Fed-ECB divergence when it comes to the banks’ intentions regarding the potential next moves in interest rates.
Moving forward, hawkish ECB-speak continue to favour further rate hikes, although this view appears in contrast to some loss of momentum in economic fundamentals in the region.
Key events in the euro area this week: Germany IFO Business Climate (Monday) – Germany GfK Consumer Confidence (Wednesday) – EMU Final Consumer Confidence, Economic Sentiment (Thursday) – Euro group Meeting, Germany labour market report/ Advanced Inflation Rate/Flash Q1 GDP Growth Rate, EMU Flash Q1 GDP Growth Rate (Friday).
Eminent issues on the back boiler: Continuation (or not) of the ECB hiking cycle. Impact of the Russia-Ukraine war on the growth prospects and inflation outlook in the region. Risks of inflation becoming entrenched.
EUR/USD levels to watch
So far, the pair is losing 0.05% at 1.0982 and faces the next support at 1.0831 (monthly low April 10) seconded by 1.0788 (monthly low April 3) and finally 1.0765 (55-day SMA). On the upside, a break above 1.1075 (2023 high April 14) would target 1.1100 (round level) en route to 1.1184 (weekly high March 21 2022).
-
08:17
USD/JPY: Fading probability of extra gains – UOB
A move beyond 135.75 in USD/JPY appears to be losing momentum, comment Economist Lee Sue Ann and Markets Strategist Quek Ser Leang at UOB Group.
Key Quotes
24-hour view: “Last Friday, we held the view that ‘the pullback in USD could extend but a break of the strong support level at 133.50 is unlikely’. Our view was turned out to be correct as USD dropped to 133.54 and then rebounded strongly to closed largely unchanged (134.15, -0.06%). USD appears to have moved into a consolidation phase and it is likely to trade between 133.60 and 134.60.”
Next 1-3 weeks: “We have expected USD to trade with an upward bias since early last week. In our latest narrative from last Thursday (20 Apr, spot at 134.65), we indicated that the bias is still towards a higher USD and the next level to aim for is 135.75. USD has not been able to make further headway on the upside. Upward momentum is beginning to fade and the likelihood of USD advancing to 135.75 is diminishing. However, only a break of 133.50 (no change in ‘strong support’ level) would indicate that USD is likely to trade in a range instead of heading higher to 135.75.”
-
08:13
USD Index starts the week with decent gains near 102.00
- The index regains the smile and looks to retest 102.00 on Monday.
- US yields trade slightly on the defensive and reverse Friday’s gains.
- The Chicago Fed National Activity Index will take centre stage today.
The greenback, when tracked by the USD Index (DXY), gathers some upside impulse and approaches the key 102.00 region on Monday.
USD Index focuses on risk trends
The index maintains the side-lined trade well in place for yet another session on Monday, this time amidst so far declining US yields and a mild knee-jerk in the risk complex.
In the meantime, investors continue to anticipate a 25 bps rate hike at the Fed’s meeting on May 3, while the likelihood of a pause in the tightening cycle following this meeting seems to be gaining momentum as well.
Later in the NA session, the Chicago Fed National Activity Index will be in the limelight seconded by the Dallas Fed Manufacturing Index.
What to look for around USD
The absence of strong catalysts leaves the price action around the dollar – and the rest of the FX space – somewhat muted near the 102.00 region so far at the beginning of the week.
In the meantime, the index seems to have moved into a consolidative phase against steady expectations of another rate increase in May by the Fed, while alternating risk appetite trends also collaborate with the vacillating price action in the buck.
In favour of a pivot in the Fed’s hiking cycle following the May event appears the persevering disinflation and nascent weakness in some key fundamentals.
Key events in the US this week: Chicago Fed National Activity Index (Monday) – House Price Index, CB Consumer Confidence, New Home Sales (Tuesday) – MBA Mortgage Applications, Durable Goods Orders, Advanced Goods Trade Balance (Wednesday) – Flash Q1 GDP Growth Rate, Initial Jobless Claims, Pending Home Sales (Thursday) – PCE/Core PCE, Employment Cost, Personal Income, Personal Spending, Final Michigan Consumer Sentiment (Friday).
Eminent issues on the back boiler: Persistent debate over a soft/hard landing of the US economy. Terminal Interest rate near the peak vs. speculation of rate cuts in 2024. Fed’s pivot. Geopolitical effervescence vs. Russia and China. US-China trade conflict.
USD Index relevant levels
Now, the index is gaining 0.17% at 101.89 and faces the next hurdle at 102.80 (weekly high April 10) followed by 103.05 (monthly high April 3) and then 103.27 (55-day SMA). On the flip side, the breach of 100.78 (2023 low April 14) would open the door to 100.00 (psychological level) and finally 99.81 (weekly low April 21 2022).
-
08:03
Turkey Capacity Utilization increased to 75.4% in April from previous 73.5%
-
08:03
Turkey Manufacturing Confidence increased to 108 in April from previous 105.2
-
08:02
Forex Today: Steady start to the week ahead of key data releases
Here is what you need to know on Monday, April 24:
Major currency pairs continue to fluctuate in familiar ranges early Monday following the previous week's choppy action. IFO sentiment survey for April from Germany will be released during the European trading hours. Later in the day, Federal Reserve Bank of Chicago's National Activity Index will be featured in the US economic docket. Ahead of this week's high-tier data releases, Monday's trading action is likely to remain subdued.
Despite the stronger-than-expected S&P Global Manufacturing and Services PMI readings from the US, the US Dollar struggled to outperform its rivals ahead of the weekend. The US Dollar Index ended the week virtually unchanged and extended its sideways grind slightly below 102.00 early Monday. Meanwhile, US stock index futures trade in negative territory and the benchmark 10-year US Treasury bond yield stays in the red below 3.6%, pointing to a cautious market stance.
EUR/USD edged higher toward 1.1000 during the Asian trading hours on Monday but failed to gather further bullish momentum. In an interview with the Financial Times (FT) on Monday, Pierre Wunsch, the European Central Bank’s (ECB) Governing Council member, said that he expects the ECB to continue raising interest rates until wage growth slows.
After falling toward 1.2350 on Friday, GBP/USD managed to erase its daily losses and closed above 1.2400. The pair continues to move up and down in a narrow channel above that level in the European morning on Monday.
USD/JPY is having a difficult time finding direction while moving sideways at around 134.00. The Sankei newspaper over the weekend Sunday that the Bank of Japan (BoJ) is planning to review and inspect policies taken over the past decades, kicking off discussions at a two-day meeting scheduled for April 27 and 28 under newly-appointed Governor Kazuo Ueda.
Gold price fell sharply on Friday as sellers took action following numerous failed attempts to reclaim $2,000 last week. XAU/USD stays under modest bearish pressure and trades below $1,980 early Monday.
Bitcoin edged lower over the weekend and ended up losing more than 9% on a weekly basis. Early Monday, BTC/USD trades at around $27,500. Following Friday's steep decline, Ethereum stayed relatively quiet over the weekend but snapped a three-week winning streak, losing more than 12%. In the European Morning on Monday, ETH/USD trades modestly lower on the day near $1,850.
-
07:57
Silver Price Analysis: XAG/USD flirts with 100-period SMA on H4, 23.6% Fibo. holds the key
- Silver drifts lower for the second straight day, though defends 100-period SMA on the 4-hour chart.
- The mixed oscillators on hourly/daily charts warrant some caution before placing aggressive bets.
- A sustained weakness below the $24.40-30 area is needed to support prospects for deeper losses.
Silver remains under some selling pressure for the second successive day on Monday and drops to a three-day low, around the $24.80-$24.75 region heading into the European session.
From a technical perspective, the XAG/USD, so far, has managed to defend the 100-period Simple Moving Average (SMA) on the 4-hour chart. This is closely followed by the 23.6% Fibonacci retracement level of the March-April rally, around the $24.65 zone and the $24.40-$24.30 strong horizontal resistance breakpoint, now turned support.
With oscillators on hourly charts holding deep in the negative territory, a convincing break below the latter will set the stage for an extension of the recent pullback from a yearly peak, around the $26.10 region touched on April 14. The XAG/USD might then weaken further below the $24.00 mark and test the 38.2% Fibo. level, around the $23.70 area.
On the flip side, any intraday positive move back above the $25.00 psychological mark now seems to confront some resistance near the $25.20 horizontal level ahead of the $25.50-$25.60 supply zone. A sustained strength beyond will negate the negative bias and allow the XAG/USD to make a fresh attempt to conquer the $26.00 round-figure mark.
Some follow-through buying will mark a fresh bullish breakout and set the stage for a further near-term appreciating move. The next relevant hurdle is pegged near the $26.25-$26.30 region, above which the XAG/USD could aim to reclaim the $27.00 round-figure mark.
Silver 4-hour chart
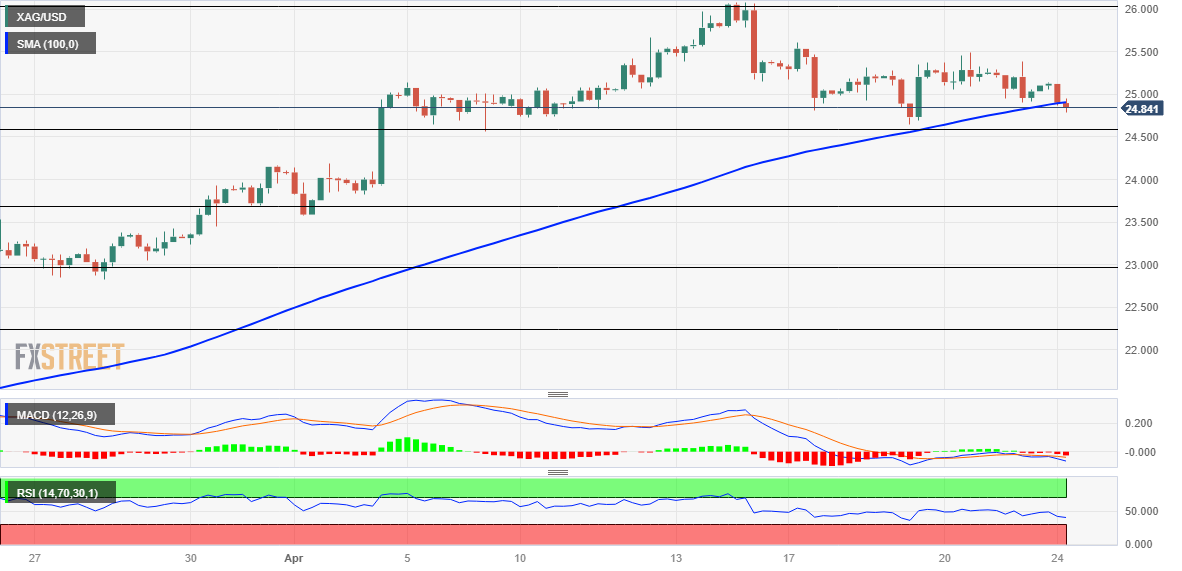
Key levels to watch
-
07:25
Natural Gas: Rebound in the offing?
Open interest in natural gas futures markets extended the downwards bias and dropped by nearly 16K contracts at the end of last week according to preliminary readings from CME Group. In the same line, volume went down for the second straight session, now by around 66.1K contracts.
Natural Gas remained supported by $2.00
Prices of the natural gas retreated modestly on Friday, adding to the bearish performance seen in the second half of the week. The daily drop was on the back of diminishing open interest and volume and opens the door to some recovery in the very near term. So far, the $2.00 zone per MMBtu continues to offer decent contention.
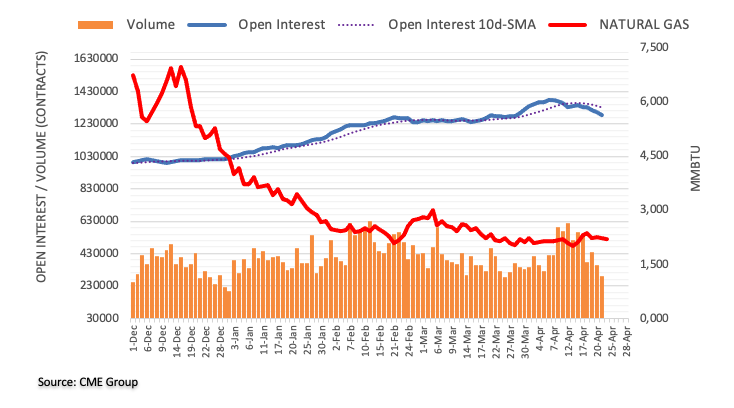
-
07:25
USD/CAD sticks to gains near monthly peak amid sliding Oil prices, modest USD strength
- A combination of supporting factors pushes USD/CAD back closer to the monthly peak.
- Bearish Oil prices undermine the Loonie and act as a tailwind amid fresh USD buying.
- Bets for more Fed rate hikes and a weaker risk tone benefit the safe-haven Greenback.
The USD/CAD pair kicks off the new week on a positive note and steadily climbs back closer to the monthly peak touched on Friday. The pair currently trades just above the mid-1.3500s, up nearly 0.15% for the day and draws support from a combination of factors.
Despite the prospect of tighter supplies on OPEC+ supply cuts, Crude Oil prices languish near the monthly low amid concerns that rising borrowing costs will hamper global economic growth and dent fuel demand. This, in turn, is seen undermining the commodity-linked Loonie. Apart from this, a modest US Dollar (USD) uptick assists the USD/CAD pair to capitalize on its recent strong recovery from the 1.3300 mark, or a two-month low.
The USD regains some positive traction in the wake of growing acceptance that the Federal Reserve (Fed) will continue raising interest rates to curb inflation. In fact, a 25 bps lift-off at the next FOMC meeting in May is fully priced in the markets and the Fed funds future indicates a small chance of another rate hike in June. The bets were lifted by the recent hawkish comments by several Fed officials and the incoming positive US macro data.
The flash version of S&P Global's PMI survey showed on Friday that the overall business activity in the US private sector expanded at a faster pace in April. The activity in the service sector grew for a third straight month and at the fastest rate in a year, while the gauge for the US manufacturing sector moved into the expansion territory for the first time since October 2022, suggesting that the world's largest economy remained resilient.
Apart from this, a generally weaker tone around the equity markets further benefits the Greenback's relative safe-haven status and acts as a tailwind for the USD/CAD pair. In the absence of any relevant economic data from the US, the aforementioned fundamental backdrop favours bullish traders and supports prospects for a further near-term appreciating move for the major. Hence, any meaningful pullback is likely to attract fresh buyers and remain limited.
Technical levels to watch
-
07:17
FX option expiries for Apr 24 NY cut
FX option expiries for Apr 24 NY cut at 10:00 Eastern Time, via DTCC, can be found below.
- EUR/USD: EUR amounts
- 1.0900 900M
- 1.0920-35 910m
- 1.0975-80 378m
- 1.1000 753m
- USD/JPY: USD amounts
- 132.75 425m
- 133.70-82 614m
- EUR/GBP: EUR amounts
- 0.8825-30 573m
- 0.8860 614m
-
07:16
AUD/USD: Outlook remains mixed in the near term – UOB
In the opinion of Economist Lee Sue Ann and Markets Strategist Quek Ser Leang at UOB Group, AUD/USD should maintain the side-lined trading unchanged for the time being.
Key Quotes
24-hour view: “Last Friday, we expected AUD to trade sideways between 0.6700 and 0.6770. Our view was incorrect as AUD dropped to 0.6678. Downward momentum appears to be building and AUD is likely to trade with a downward bias today. However, any decline is likely to face strong support at 0.6660. The major support at 0.6620 is unlikely to come under threat. On the upside, a break of 0.6730 (minor resistance is at 0.6710) would indicate that the build-up in downward momentum has faded.”
Next 1-3 weeks: “Our most recent narrative was from last Monday (17 Apr, spot at 0.6710). As highlighted, after the recent sharp but short-lived swings, the outlook for AUD is mixed. For the time being, there is no clear direction and AUD could trade in a relatively broad range of 0.6620/0.6785.”
-
07:12
WTI drops firmly below $77.00 on mixed global PMIs and deepening fears of more rate hikes
- Oil prices have slipped sharply to near $76.75 in hopes of a global slowdown.
- Western central banks are expected to raise interest rates further to soften galloping inflation.
- Mixed global PMIs would force analysts to a downward revision in the oil demand.
West Texas Intermediate (WTI), futures on NYMEX, have shown a perpendicular fall below $77.00 in the early European session. The oil price has sensed immense pressure after the release of mixed global Purchasing Managers Index (PMI) numbers and accelerating fears of more interest rate hikes from the Western central banks.
The recovery move in the US Dollar Index (DXY) has also weighed heavily on the oil price. The USD Index has reached near 101.85 after a recovery move as upbeat preliminary United States S&P PMI figures have strengthened expectations of consecutive 25 basis points (bps) interest rate hike from the Federal Reserve (Fed).
Friday’s global PMI data indicated that the US economy is recovering firmly as figures beat estimates strongly. In the shared continent and the United Kingdom economy, Manufacturing PMIs fell sharply and propelled fears of a decline in oil’s forward demand. In spite of slowdown fears, central banks of the respective economies are bound to raise interest rates further to arrest stubborn inflation.
The Bank of England (BoE) is expected to hike rates further by 25 bps to 4.5% and the European Central Bank (ECB) would follow the same path and will push rates to 3.75%. This may impact the oil demand forecast further.
-
07:11
Crude Oil Futures: Extra losses in store near term
CME Group’s flash data for crude oil futures markets noted traders scaled back their open interest positions for the fourth session in a row on Friday, now by around 23.6K contracts. In the same line, volume resumed the decline and retreated by around 101.5K contracts.
WTI: Gap is nearly filled
The WTI charted a decent rebound on Friday amidst declining open interest and volume, which is indicative that further recovery is not favoured for the time being. The continuation of the corrective retracement in the commodity is expected to meet the next support at around $75.80.
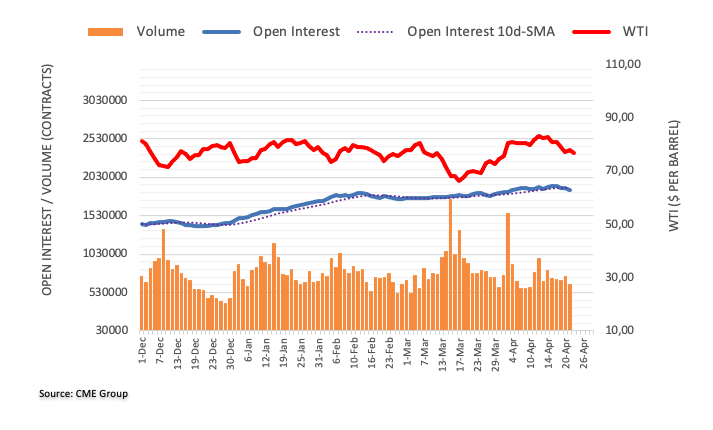
-
06:56
GBP/USD: Extra range bound in the pipeline – UOB
GBP/USD is seen navigating within the 1.2345-1.2510 range in the short term, note Economist Lee Sue Ann and Markets Strategist Quek Ser Leang at UOB Group.
Key Quotes
24-hour view: “Our expectations for GBP to consolidate in a range of 1.2400/1.2475 last Friday were incorrect as it dropped to 1.2368 and then rebounded to end the day unchanged at 1.2445. While there is room for GBP to edge upwards, we view any advance as a higher trading range of 1.2405/1.2475. In other words, a sustained drop below 1.2405 or above 1.2475 is unlikely.”
Next 1-3 weeks: “Last Friday (21 Apr, spot at 1.2435), we indicated that the recent downward pressure has faded and we highlighted that GBP ‘is likely to trade sideways between 1.2345 and 1.2510 for the time being’. We continue to hold the same view.”
-
06:51
Gold Futures: A deeper pullback seems unlikely
Considering advanced prints from CME Group for Gold Futures markets, open interest remained choppy and shrank by around 5.5K contracts on Friday. Volume followed suit and dropped for the second session in a row, this time by almost 13K contracts.
Gold: Next support comes around $1950
Friday’s downtick in gold prices was accompanied by shrinking open interest, hinting at the view that the continuation of the corrective decline appears limited. Further weakness is expected to meet the next contention around the $1950 region per ounce troy.
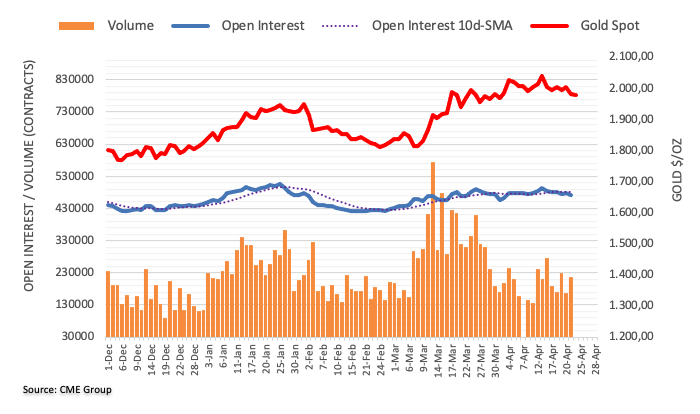
-
06:45
NZD/USD looks set for further downside below 0.6120 as Fed prepares for more rate hike
- NZD/USD is on the verge of delivering a fresh downside below 0.6125 amid a solid recovery in the USD Index.
- US economic activities have shown recovery despite higher interest rates from the Fed and tight credit conditions by banks.
- RBNZ might consider a pause in the policy-tightening spell as the inflation rate has made an intermediate peak.
The NZD/USD pair is on the verge of delivering a fresh downside below 0.6125 in the early European session. The Kiwi asset remained sideways in a 0.612-0.6147 range, however, a recovery move in the US Dollar Index (DXY) is signaling a bumpy ride for the former.
The USD Index has extended its recovery to 101.86 as investors are very much confident of a consecutive 25 basis point (bp) interest rate hike from the Federal Reserve (Fed). To tame stubborn United States inflation and cap the overall demand, more rate hikes are highly required ahead.
US economic activities have shown recovery despite higher interest rates from the Fed and tight credit conditions by US commercial banks. Preliminary US S&P Manufacturing PMI (April) jumped to 50.4 from the consensus of 49.2 and the former release of 49.2. And, Services PMI jumped to 53.7 vs. the estimates of 51.5 and the prior figure of 52.6.
A surprise jump in US economic activities is indicating that demand for labor would remain steady and it will continue to keep the labor cost index elevated.
On the New Zealand front, softened inflationary pressures have provided a sigh of relief to Reserve Bank of New Zealand (RBNZ) policymakers. Last week, Statz NZ reported that quarterly inflationary pressures accelerated by 1.2% vs. the consensus of 1.7% and the former release of 1.4%. Annual inflation softened to 6.7% while the street was anticipating a marginal deceleration to 7.1% from the prior release of 7.2%.
It is likely that RBNZ Governor Adrian Orr would consider a pause in the policy-tightening spell as the inflation rate has made an intermediate peak.
-
06:40
Gold Price Forecast: XAU/USD struggles below $1,980 level amid modest US Dollar strength
- Gold price remains depressed for the second successive day amid a modest US Dollar uptick.
- Bets for more rate hikes by Federal Reserve underpin the buck and weigh on the XAU/USD.
- Looming recession risk and a softer risk tone help limit the downside for the safe-haven metal.
Gold price struggles to capitalize on Friday's modest bounce from the $1.970 region and comes under some selling pressure on the first day of the new week. The XAU/USD trades around the $1,977 area during the Asian session and remains well within the striking distance of over a two-week low touched last Wednesday.
Modest US Dollar strength weighs on Gold price
The prospects for further policy tightening by the Federal Reserve (Fed) assists the US Dollar to attract some buying on Monday, which, in turn, is seen as a key factor dragging Gold price lower for the second successive day. In fact, the markets now seem convinced that the Fed will continue raising interest rates to curb high inflation in the United States (US) and have fully priced in a 25 bps lift-off at the next Federal Open Market Committee (FOMC) policy meeting in May. Adding to this, the Fed funds future indicates a small chance of another rate hike in June.
Hawkish Federal Reserve expectations underpin USD
The bets were lifted by the recent hawkish comments by several Fed officials and the incoming positive US macro data, which suggested that the world's largest economy remained resilient. The flash version of S&P Global's PMI survey showed on Friday that the overall business activity in the US private sector expanded at a faster pace in April. The activity in the service sector grew for a third straight month and at the fastest rate in a year, while the gauge for the US manufacturing sector moved into the expansion territory for the first time since October 2022.
Weaker risk tone lends some support to safe-haven XAU/USD
That said, a softer tone around the US Treasury bond yields is holding back the USD bulls from placing aggressive bets and lending support to Gold price. Furthermore, a fresh leg down in the equity markets further contributes to limiting the downside for the precious metal. The prospects for further policy tightening by the Fed fuel worries about economic headwinds stemming from rising borrowing costs, which, in turn, tempers investors' appetite for riskier assets and boosts demand for traditional safe-haven assets, including the XAU/USD.
There isn't any relevant market-moving economic data due for release from the US on Monday, leaving the USD at the mercy of the US bond yields. Apart from this, traders will take cues from the broader risk sentiment to grab short-term opportunities around the Gold price. Nevertheless, the aforementioned fundamental backdrop and the lack of any meaningful buying suggests that the path of least resistance for the XAU/USD is to the downside.
Gold price technical outlook
From a technical perspective, bearish traders might now wait for some follow-through selling below the $1,969 region before positioning for an extension of the recent retracement slide from a one-year high. The Gold price might then slide towards testing the next relevant support near the $1,956-$1,955 area before eventually dropping to the monthly low around the $1,950 region.
On the flip side, any meaningful recovery attempt is likely to attract fresh sellers near the $2,000 psychological mark and remain capped near the $2,010 barrier. A sustained strength beyond the latter might trigger a fresh bout of a short-covering and lift Gold price beyond the $2,020 hurdle, towards the $2,040 horizontal zone en route to the YTD peak, around the $2,047-$2,049 region.
Key levels to watch
-
06:40
EUR/USD faces further consolidation near term – UOB
Economist Lee Sue Ann and Markets Strategist Quek Ser Leang at UOB Group suggest EUR/USD is now likely to trade within the 1.0900-1.1050 range in the next few weeks.
Key Quotes
24-hour view: “We expected EUR to trade sideways between 1.0925 and 1.0995 last Friday. Our view of sideways trading was not wrong even though EUR traded in a narrower range than expected (1.0937/1.0993). The underlying tone has firmed somewhat and EUR is likely to edge higher today. However, a clear break above 1.1025 appears unlikely. Support is at 1.0965; a breach of 1.0945 would indicate that the current mild upward pressure has eased.”
Next 1-3 weeks: “Last Tuesday (18 Apr, spot at 1.0925), we noted that ‘downward momentum appears to be building, albeit tentatively’ and we expected EUR to trade with a downward bias. However, EUR has not been able to make any headway on the downside and last Friday (21 Apr, spot at 1.0960), we indicated that ‘unless EUR breaks clearly below 1.0925 soon, it is more likely to trade sideways instead of with a downward bias’. EUR did not break 1.0925 and downward pressure has eased. The outlook is neutral and for the time being, EUR is likely to trade sideways in a range of 1.0900/1.1050.”
-
06:16
EUR/USD Price Analysis: Absence of a bullish momentum favors a downside bias
- An absence of momentum in the upside move barricaded EUR/USD from kissing 1.1000.
- ECB Wunsch expects a continuation of the policy-tightening spell if labor demand remains strong.
- The Euro faced pressure while attempting a breakout of the Ascending Triangle pattern.
The EUR/USD pair has dropped after failing to test the psychological resistance of 1.1000 in the early European session. The major currency pair has sensed selling pressure amid an absence of momentum in the upside move. Also, a recovery move in the US Dollar Index (DXY) has impacted on the shared currency pair.
The USD Index has refreshed its day’s high at 101.82 after a recovery move. On a broader note, the USD Index is consolidating in a wider range of 101.63-102.27 for the past four trading sessions.
On the Eurozone front, European Central Bank’s (ECB) Governing Council member Pierre Wunsch said that the central bank will continue raising interest rates until wage growth slows. He further added, “I would not be surprised if we had to go to 4 percent at some point.” The labor shortage has been a major trigger for stubborn Eurozone inflation and it will continue to propel households’ earnings.
EUR/USD is auctioning in an Ascending Triangle chart pattern on a two-hour scale. The Euro has faced pressure while attempting a breakout near the horizontal resistance of the aforementioned chart pattern plotted from April 17 high at 1.1000. The advancing trendline of the chart pattern is placed from April 19 low at 1.0917.
On a broader note, the upward-sloping trendline plotted from March 24 low at 1.0714 will continue to provide support to the Euro bulls. Overlapping movement in the asset and the 20-period Exponential Moving Average (EMA) around 1.0970 conveys a lackluster performance for now
Also, the Relative Strength Index (RSI) (14) is trading back and forth in a 40.00-60.00 range, conveying a consolidation ahead.
Going forward, a break above the psychological resistance of 1.1000 will drive the asset to a fresh annual high at 1.1068, followed by the round-level resistance at 1.1100.
On the flip side, a downside move below April 12 low at 1.0915 will drag the asset toward April 10 low at 1.0837 and April 03 low at 1.0788.
EUR/USD two-hour chart
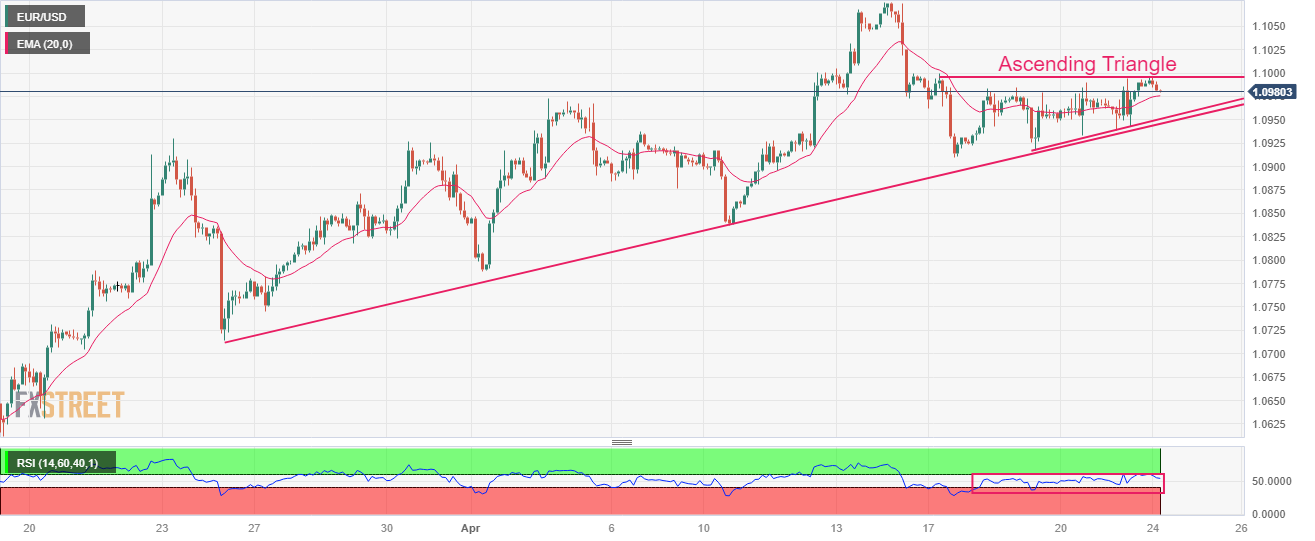
-
06:01
Singapore Consumer Price Index (YoY) below forecasts (5.6) in March: Actual (5.5)
-
05:48
AUD/USD weakens further below 0.6700, over one-week low amid modest USD uptick
- AUD/USD remains under some selling pressure for the second successive day on Monday.
- Bets for more rate hikes by the Fed help revive the USD demand and exert some pressure.
- A softer risk tone also benefits the safe-haven buck and weighs on the risk-sensitive Aussie.
The AUD/USD drifts lower for the second successive day on Monday and drops to a one-and-half-week low, around the 0.6675 region during the Asian session.
A combination of factors assists the US Dollar (USD) to gain some positive traction on the first day of the new week, which, in turn, is seen exerting downward pressure on the AUD/USD pair. The recent hawkish signals by several Federal Reserve (Fed) officials reaffirmed market bets for another 25 bps lift-off at the next FOMC meeting in May. Adding to this, the incoming US macro data suggested that the world's largest economy remained resilient and supported prospects for further policy tightening by the Fed.
The flash version of the S&P Global's PMI survey showed that the overall business activity in the US private sector expanded at a faster pace in April, with the Composite PMI rising from 52.3 in March to 53.5, or the highest since May last year. The upturn was led by the service sector, where activity grew for a third successive month and at the fastest rate for a year. Adding to this, the gauge for the US manufacturing sector moved in the expansion territory for the first time since October 2022, indicating growth momentum.
The data reinforced expectations that the Fed will continue lifting interest rates to curb inflation and fuels worries about economic headwinds stemming from rising borrowing costs. This, in turn, tempers investors' appetite for riskier assets, which is evident from a generally weaker tone around the equity markets. The anti-risk flow is seen as another factor that benefits the Greenback's relative safe-haven status and weighs on the risk-sensitive Aussie, suggesting that the path of least resistance for the AUD/USD pair is to the downside.
That said, the recent pullback in the US Treasury bond yields might hold back the USD bulls from placing aggressive bets. Apart from this, the hawkish tone from the Reserve Bank of Australia's (RBA) April meeting minutes and the upbeat China macro data released last week should help limit losses for the AUD/USD pair. There isn't any relevant market-moving economic data due for release from the US on Monday. Hence, traders will take cues from the broader risk sentiment to grab short-term opportunities around the pair.
Technical levels to watch
-
05:42
ECB’s Wunsch: Central bank to keep raising interest rates unless wage growth slows – FT
In an interview with the Financial Times (FT) on Monday, Pierre Wunsch, the European Central Bank’s (ECB) Governing Council member said that the central bank will continue raising interest rates until wage growth slows.
Key quotes
“We are waiting for wage growth and core inflation to go down, along with headline inflation, before we can arrive at the point where we can pause.”
“I would not be surprised if we had to go to 4 percent at some point.”
“What we try to do is always to go for a soft landing and nobody is going to err on the side of destroying the economy for the sake of destroying the economy,” he said. “But I have absolutely no indication that what we are doing is too much.”
“I’m not a fetishist. I’m not going to hike rates even in a recession just because we have 2.3 percent or 2.1 percent inflation in the two-year forecast. But I’m not seeing inflation numbers going in the right direction yet.”
“If we see wage agreements remaining around 5 percent growth for longer than this is going to be in the forecast and then inflation is not going to go back to 2 percent on a structural basis.”
Market reaction
These comments fail to yield any positive impact on the Euro, as EUR/USD is holding the lower ground near 1.0980, trading modestly flat on the day.
-
05:39
USD/JPY aims to surpass 134.50 as BoJ Ueda warns Japan CPI peaking sooner
- USD/JPY is eyeing 134.50 as BoJ Ueda has reiterated the need for keeping monetary policy expansionary.
- BoJ Ueda believes that Japan’s inflation will peak sooner amid various catalysts.
- March’s US Durable Goods Orders data is expected to expand by 0.8% vs. a contraction of 1.0%.
The USD/JPY pair is making efforts for recapturing the immediate resistance of 134.50 in the Tokyo session. The major has got strength as new Bank of Japan (BoJ) Governor Kauo Ueda has reiterated the need for keeping monetary policy expansionary. BoJ Ueda is strongly supporting the continuation of the decade-long ultra-loose monetary policy on the expectation that Japan’s inflation will peak sooner.
BoJ Governor claimed that the impact of higher imported prices has passed on to households more than expected. Also, Japan's property prices are not expected to get excessively overvalued. An absence of any trigger for Japan’s inflation might result in softening in the upcoming period. BoJ Ueda has refrained from defining the time period required for tweaking Yield Curve Control (YCC).
Meanwhile, S&P500 futures are continuously adding losses in the Asian session as anxiety among investors is soaring. As quickly as the quarterly result season is picking up pace, investors are getting more stock-specific, portraying a cautious market mood.
The US Dollar Index (DXY) has stretched its recovery above 101.80 as upbeat preliminary S&P PMI data released last week has strengthened the need of more rate hikes from the Federal Reserve (Fed). Going forward, the United States Durable Goods Orders data will be keenly watched. March Durable Goods Orders data is expected to expand by 0.8% vs. a contraction of 1.0%. An upbeat Durable Goods Orders data will indicate strong forward demand, which could propel the need for labor further.
-
05:03
AUD/JPY Price Analysis: Braces for a volatile action ahead of Australian Inflation
- AUD/JPY is struggling to find any direction ahead of Australian Inflation data.
- BoJ Ueda has reiterated the need of keeping monetary policy expansionary ahead.
- Further softening in Australian inflation will allow the RBA to continue its unchanged policy ahead.
The AUD/JPY pair is oscillating around 89.80 in the Asian session. The risk barometer is showing a lackluster performance despite novel Bank of Japan (BoJ) Governor Kazuo Ueda saying, “Japan's consumer inflation, including index stripping away fuel costs, likely nearing its peak,” adding that he is “seeing it slowing ahead.” BoJ Ueda has reiterated the need of keeping monetary policy expansionary ahead.
This week, the release of the Australian Inflation data will determine the action in the risk barometer. As per the consensus, inflation data for the first quarter of CY2023 has decelerated to 1.3% from the prior release of 1.9%. Annual inflation has softened to 6.9% vs. the prior release of 7.8%. The monthly Consumer Price Index (CPI) indicator (March), which has been a major catalyst recently, is expected to show further softening to 6.5% against the former release of 6.8%.
Investors should note that the Reserve Bank of Australia (RBA) kept its interest rate policy steady in its April policy meeting. And, further softening in Australian inflation will allow the RBA to continue its unchanged policy ahead.
On a daily scale, AUD/JPY has scaled to near the downward-sloping trendline of the Descending Triangle chart pattern plotted from 13 September 2022 high at 98.58. The horizontal support of the aforementioned chart pattern is placed from 12 May 2022 low at 87.31.
The 50-period Exponential Moving Average (EMA) at 89.85 is overlapping the asset, indicating a consolidation ahead.
In addition, the Relative Strength Index (RSI) (14) is also oscillating in the 40.00-60.00, signaling that investors are awaiting a potential trigger.
Should the asset breaks above March 03 high at 92.25, Australian Dollar bulls will drive the asset towards February 21 high at 93.01 followed by 22 November 2022 high at 94.02.
Alternatively, a break below April 13 low at 88.98 will drag the risk barometer toward March 30 low at 88.40. A slippage below the latter will further drag the asset towards April 06 low at 87.59.
AUD/JPY daily chart
-638179057346654846.png)
-
04:28
GBP/USD turns subdued as USD Index rebounds ahead of US Durable Goods Orders
- GBP/USD has witnessed a loss in the upside momentum and has dropped below 1.2440.
- The recovery move in the USD Index has scaled to near 101.80.
- The BoE would continue hiking rates further despite a more-than-anticipated contraction in UK Retail Sales.
The GBP/USD pair has dropped below 1.2440 in the Asian session amid exhaustion in the Asian session. The Cable has faced some selling pressure as the US Dollar Index (DXY) has shown a recovery move after defending the critical support of 101.63.
S&P500 futures have added more losses in the Asian session amid anxiety among market participants ahead of quarterly results from technology giants. Amazon, Facebook, and Google will release their quarterly earnings this week. The street is worried about the impact of declining demand due to higher interest rates by the Federal Reserve (Fed) on their results.
Contrary to the recovery in the USD Index, US yields have dropped. The 10-year US Treasury yields have dropped to near 3.56%. The recovery move in the USD Index has scaled to near 101.80.
Going forward, a power-pack action is expected from the USD Index amid the release of the United States Durable Goods Orders data. A release of an upbeat demand for Durable Goods will strengthen core consumer inflation expectations and will also advocate for the announcement of consecutive 25 basis points (bps) rate hike from the Fed.
On the Pound Sterling front, further contraction in United Kingdom Retail Sales data failed to impact the odds of one more rate hike from the Bank of England (BoE). UK inflation is extremely stubborn and the BoE may not pause its policy-tightening spell.
-
04:28
US: Key drivers for the week ahead – BBH
Analysts at BBH provide snippets on the key market-moving events that will feature from the United States in the week ahead.
Key quotes
“PCE data Friday will be the highlight. Headline is expected at 0.1% m/m and 4.1% y/y vs. 0.3% and 5.0% in February, while core PCE is expected at 0.3% m/m and 4.5% y/y vs. 0.3% and 4.6% in February. Of note, the Cleveland Fed’s inflation Nowcasting model has headline at 0.08% m/m and 4.10% y/y and core PCE at 0.35% m/m and 4.58% y/y, both very close to consensus. There are no estimates for so-called Super Core PCE, which stood at 4.6% y/y in February. While a headline reading of 4.1% y/y would be the lowest since May 2021, much of that improvement is due to energy as the core measures remain stubbornly high.”
“We get our first look at Q1 GDP Thursday. Consensus currently is at 2.0% SAAR vs. 2.6% in Q4. Of note, the Atlanta Fed’s GDPNow model is currently tracking Q1 growth at 2.5% SAAR. Next and final model update for Q1 will come Wednesday. After that, the model will start tracking Q2. The mix of Q1 growth will be important. In Q4, the bulk of growth came from inventories while personal consumption and net exports slowed.“
“April Chicago PMI Friday will also be closely watched. Headline is expected at 43.5 vs. 43.8 in March. However, we see upside risks after S&P Global preliminary PMIs came in stronger than expected last week. Manufacturing came in 50.4 vs. 49.0 expected and 49.2 in March while services came in at 53.7 vs. 51.5 expected and 52.6 in March. As a result, the composite rose to 53.5 vs. 51.2 expected and 52.3 in March and was the highest since May 2022. Of note, April ISM PMIs won't be reported until next week.”
“Q1 Employment Cost Index Thursday will command more attention than usual. That is because markets are focused on the labor market and the Fed’s desired aim of cooling wage pressures. Consensus sees 1.1% q/q vs. 1.0% in Q4. If so, this would be the first pickup after three straight quarters of deceleration from the 1.4% q/q peak in Q1 2022. Of note, the y/y rate of 5.1% in Q4 was the highest on record dating back to 2001. Any further acceleration would of course be alarming.”
-
04:02
BoJ Governor Ueda: Japan's consumer inflation likely nearing its peak
New Bank of Japan (BoJ) Governor Kazuo Ueda said on Monday, “Japan's consumer inflation, including index stripping away fuel costs, likely nearing its peak,” adding that he is “seeing it slowing ahead.”
Additional quotes
“Don't see Japan's property prices as excessively over-valued.”
“Want to carefully monitor whether monetary easing leads to excessive rise in property prices, cause bubble.“
“It's true that rising import prices are being passed on to domestic prices more than expected.”
"BoJ must maintain monetary easing as trend inflation still below 2%."
"If it can be foreseen that trend inflation will reach 2%, BoJ must head toward policy normalization."
"How to revise YCC will depend on various factors, such as economic conditions, pace of inflation at the time."
"Can't say now how specifically boj could tweak YCC."
"BoJ’s inflation forecast half-year, 1 year, 1.5 year ahead must be quite strong and close to 2%, when asked what will be the conditions for BoJ to consider tweaking YCC."
"Hope to consider whether it's possible, taking into account various thresholds that must be cleared, when asked whether BoJ can reveal exit plan from ultra-easy policy in advance.
"What to do with BoJ’s ETFs holdings will become a big issue when BoJ heads toward an exit from ultra-easy policy, YCC."
"BoJ has been conducting many internal simulations on how future exit from easy monetary policy could affect its finances."
Market reaction
USD/JPY has caught a fresh bid wave on Governor Ueda’s comments, trading near 134.35, as of writing while adding 0.16% on the day.
-
03:30
Commodities. Daily history for Friday, April 21, 2023
Raw materials Closed Change, % Silver 25.081 -0.78 Gold 1983.09 -1.05 Palladium 1593.35 0.06 -
03:19
China’s Premier Li: High-quality economic development is an intrinsic requirement of modernization
Xinhua News Agency reported remarks from Chinese Premier Li Qiang delivered at a State Council study session on Sunday.
Key takeaways
“Efforts should be made to improve our ability to pursue high-quality development.”
“High-quality development is an intrinsic requirement of Chinese modernization.”
“Should steadfastly deepen reform and opening-up.”
Market reaction
At the time of writing, AUD/USD is little changed at around 0.6690, as investors trade with caution in a data-packed week ahead.
-
02:54
Gold Price Forecast: XAU/USD sustains above $1,980.00 as USD Index turns subdued despite hawkish Fed bets
- Gold price is keeping its auction steadily above $1,980.00 amid the subdued USD Index.
- S&P500 futures have generated losses as investors are anxious ahead of quarterly results from giant technology stocks.
- Gold price is expected to display sheer weakness after a breakdown of immediate support plotted from $1,969.26.
Gold price (XAU/USD) is holding its auction above the critical support of $1,980.00 in the Asian session. The precious metal is struggling around $1,985.00 as the US Dollar Index (DXY) is showing mixed signals around its crucial support of 101.63. After topsy-turvy moves in a wide range of 101.63-102.27 for the past four trading sessions, investors are anticipating a decisive move from the USD Index.
S&P500 futures are holding onto losses in the Asian session as investors are anxious ahead of quarterly results from giant technology stocks. Amazon, Facebook, and Google are expected to keep investors busy this week with their first-quarter CY2023 results. The yields offered on US government bonds have dropped marginally amid a subdued performance by the US Dollar Index. The 10-year US Treasury yields have dropped to near 3.56%.
This week, the USD Index will dance to the tunes of Durable Goods Orders (March) data. The economic data is seen expanding by 0.8% vs. a contraction of 1.0%. A recovery in demand for Durable Goods indicates that households’ demand is recovering, which could further lift core inflation expectations. An upbeat economic data would be supportive to more rate hikes from the Federal Reserve (Fed).
Gold technical analysis
Gold price has delivered a breakdown of the Head and Shoulder chart pattern formed on a two-hour scale. The precious metal might display more weakness after slipping below the immediate support plotted from April 19 low at $1,969.26.
Declining 20-and 50-period Exponential Moving Averages (EMAs) at $1,988.00 and $1,994.78 respectively, add to the downside filters.
The downside momentum will get triggered if the Relative Strength Index (RSI) (14) will drop into the bearish range of 20.00-40.00.
Gold two-hour chart
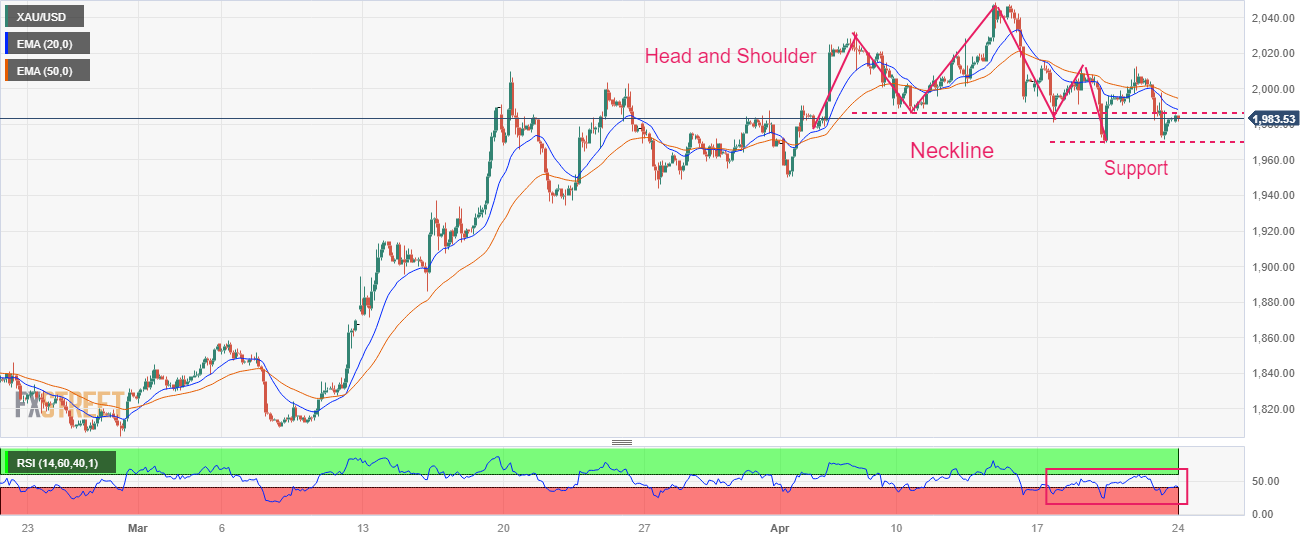
-
02:52
US Dollar bulls holding at key support, Fed sentiment is cautious
- All eyes looking to the Fed meeting in May.
- US Dollar bulls need to get above 101.90.
The US Dollar is a touch softer against most major currencies in early Asia trade. DXY, which measures the US Dollar vs. a basket of currencies is trading flat near 101.67 but the recent break above 102.036 sets up a test of the April 10 high near 102.807, as illustrated below.
The greenback is heading into the final week of the month on the back foot as investors get prepared for the central bank meetings in May. With a focus on the Federal Reserve, Fed officials have been sounding a bit more cautious.
For instance, Cleveland Federal Reserve President Loretta Mester said “I anticipate that monetary policy will need to move somewhat further into restrictive territory this year, with the fed funds rate moving above 5% and the real fed funds rate staying in positive territory for some time. Precisely how much higher the federal funds rate will need to go from here and for how long policy will need to remain restrictive will depend on economic and financial developments.”
Mester added, “even before the stresses in the banking industry in March, banks were already beginning to tighten their credit standards. The question now going forward is, Will stresses in the banking industry, those stresses in March, lead banks to move faster to tighten their credit standards?”
Fed´s Lorie Logan said “As you surely know, inflation has been much too high. The Fed has raised interest rates by 4.5 percentage points over the past year to bring the economy into better balance.”
Fed´s Patrick Harker said “I think we’re close to where we need to be. We need to be a little cautious here to not just respond to the current level of inflation, but where we think it’s going,” adding that due to monetary policy lags, “So this is where I am not in the camp where just keep increasing rates and rates and rates. I think we need to slow it down.”
Fed´s Raphael Bostic said that he favors one more hike and noted “our policy works with the lag. We’ll have moved firmly into a restrictive space. And then I think it’s time for us to let the restrictive action work its way through. And that will take some time.”
The media blackout goes into effect and there will be no Fed speakers until Chair Powell’s press conference on May 3 whereby Federal Reserve policymakers are widely expected to raise rates by another 25 basis points though the focus will be on the guidance for the future rate path.
Analysts at Brown Brother Harriman pointed out that ´´between the May 2-3 and June 13-14 meetings, the Fed will have digested two more job reports, two CPI/PPI reports, and one retail sales report. ´´
´´At this point,´´ they said, ´´a pause in June might just be the most likely outcome but it really will depend on how all that data come in. After all that, one cut is still priced in by year-end vs. two at the start of last week. In that regard, Powell has said that Fed officials “just don’t see” any rate cuts this year. We concur.´´
DXY technical analysis
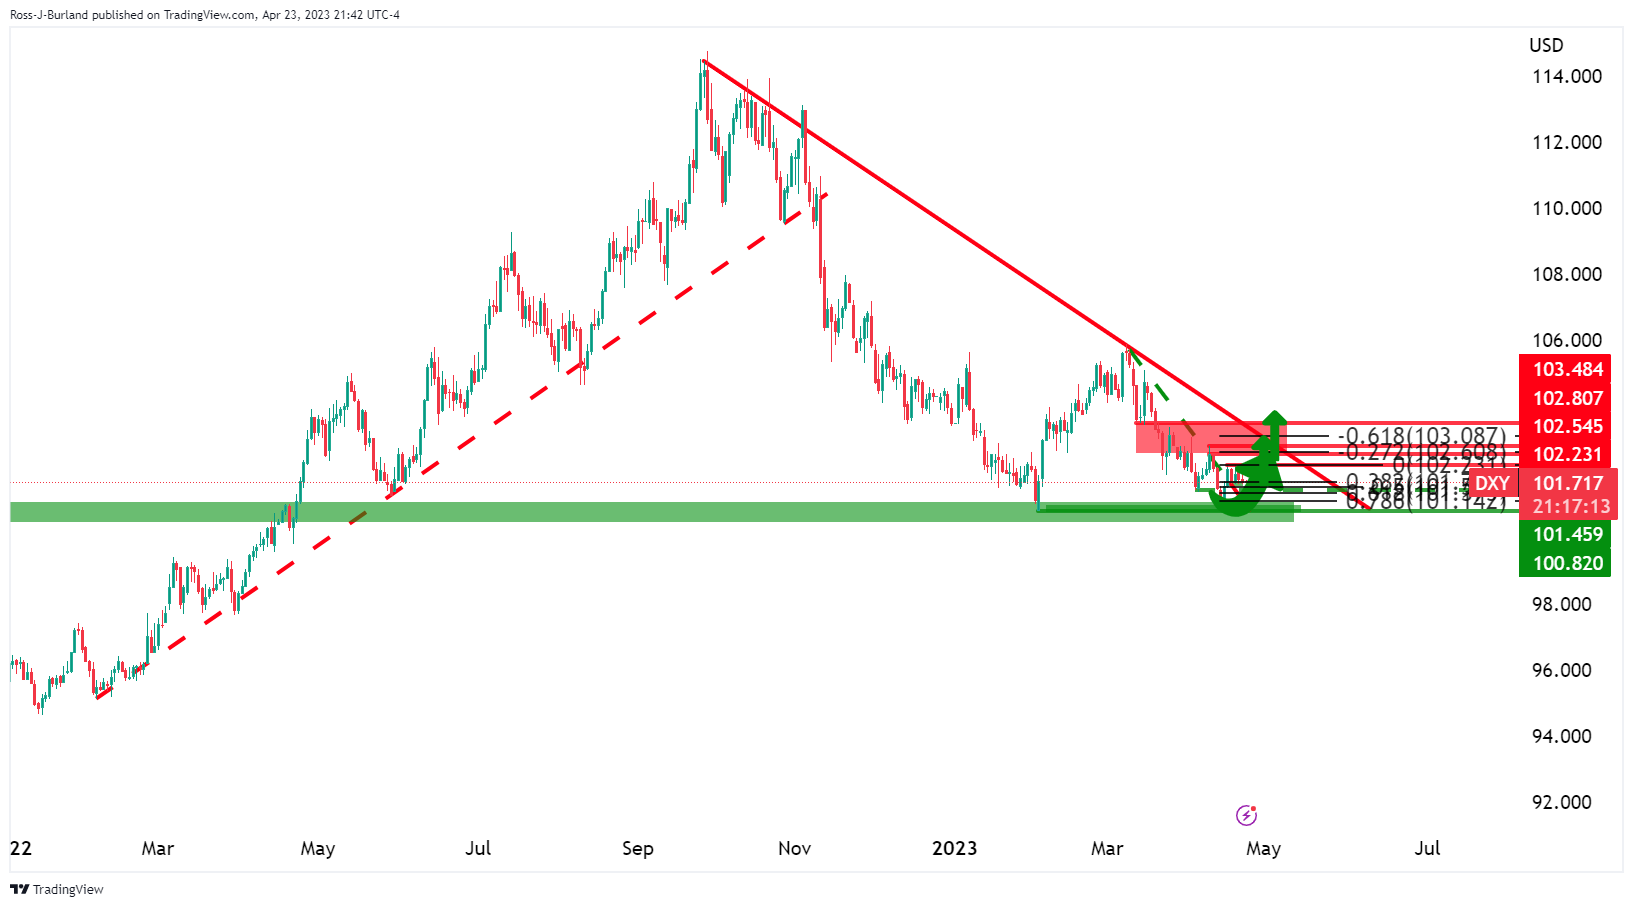
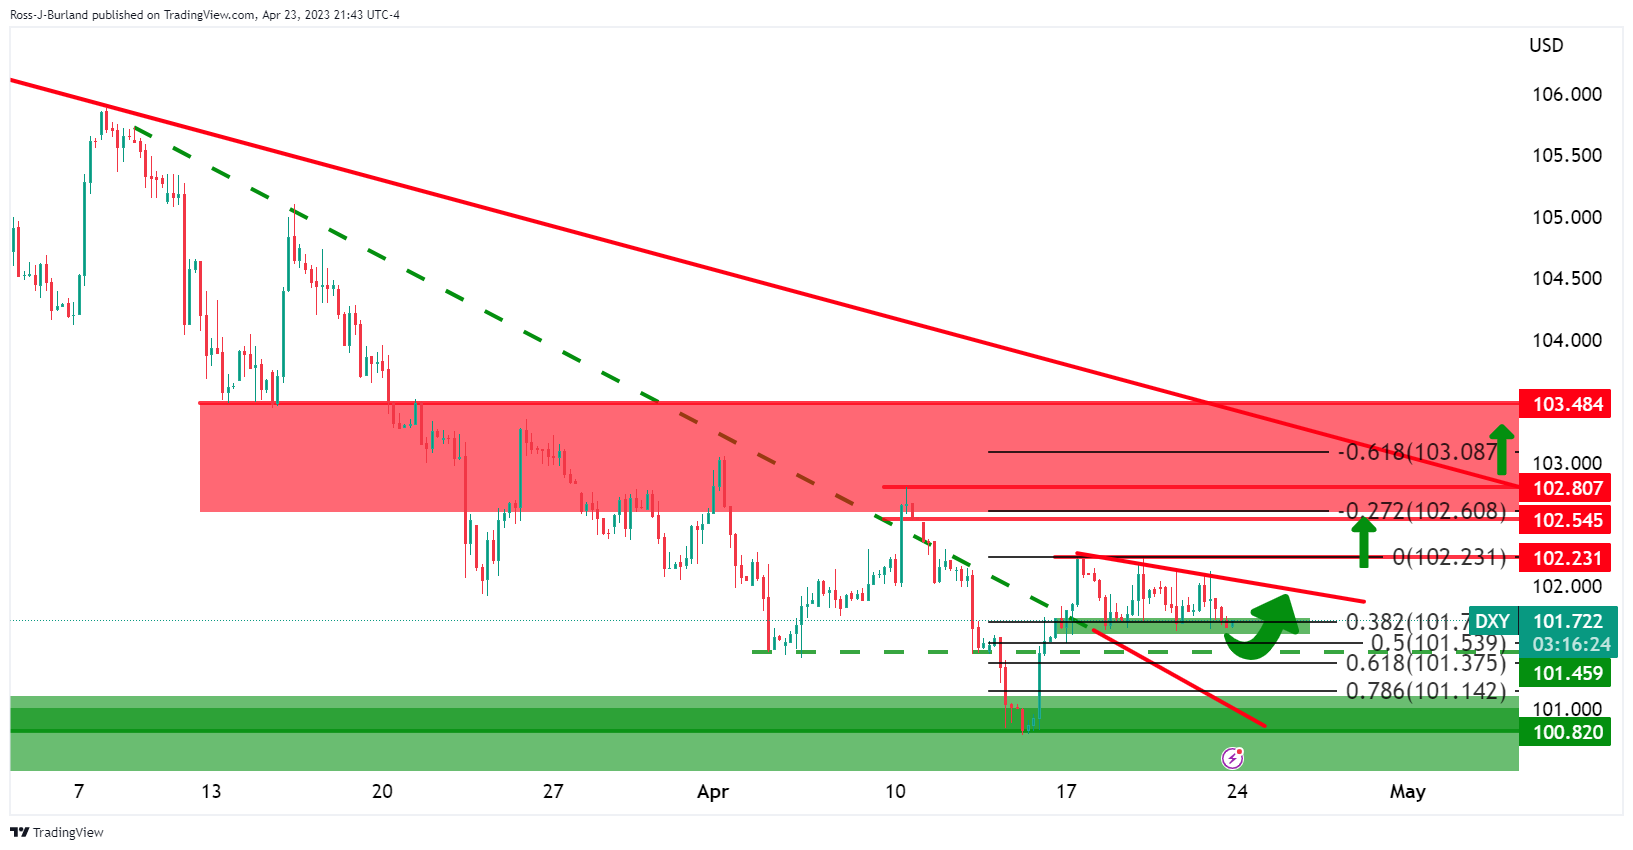
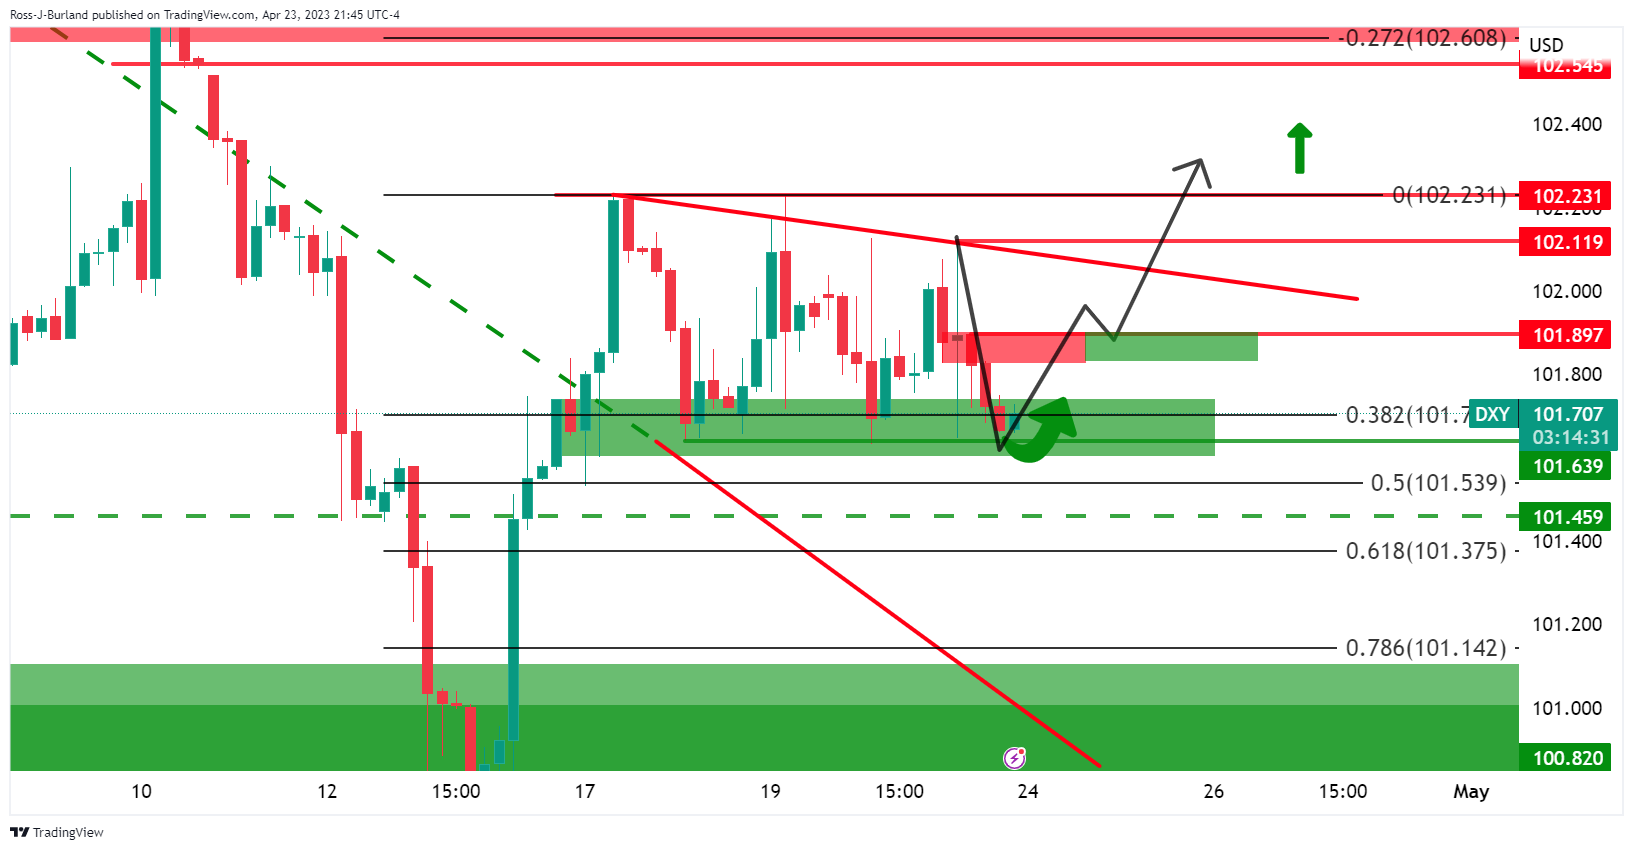
As illustrated from the daily charts in the 4-hour charts, the 101.90s is where the bulls need to get above and stay above for prospects of a move test the 102.80s. A break below 101.45 opens risk of a move back into the bearish trend.
-
02:20
USD/CNY fix: 6.8835 against prior close of 6.8930
In recent trade today, the People’s Bank of China (PBOC) set the yuan at 6.8835 against the previous closing of 6.8930.
About the fix
China maintains strict control of the yuan’s rate on the mainland.
The onshore yuan (CNY) differs from the offshore one (CNH) in trading restrictions, this last one is not as tightly controlled.
Each morning, the People’s Bank of China (PBOC) sets a so-called daily midpoint fix, based on the yuan’s previous day's closing level and quotations taken from the inter-bank dealer.
-
02:14
EUR/USD fails to kiss 1.1000 as USD Index attempts recovery, US Durable Goods Orders in focus
- EUR/USD has corrected marginally after failing to hit the psychological resistance of 1.1000.
- The upbeat performance in US PMI, released by S&P, indicates that economic recovery in the US economy is well on track.
- The Fed is expected to hike interest rates further to continue to weigh on stubborn inflation.
The EUR/USD pair has failed to test the psychological resistance of 1.1000 in the Tokyo session. The major currency pair has dropped below 1.0990 as the US Dollar Index (DXY) has shown a recovery move after defending the crucial support of 101.63. The recovery move in the USD Index is required to pass plenty of filters to make investors confident about its recovery.
S&P500 futures have extended their losses in early Asia ahead of quarterly results from tech giants, portraying negative market sentiment. This week, Amazon, Facebook, and Google will report their first quarter CY2023 results, which will keep investors busy.
April’s preliminary United States S&P PMI data released on Friday bolstered the need for one more rate hike from the Federal Reserve (Fed). The Manufacturing PMI jumped to 50.4 from the consensus of 49.0 and the former release of 49.2. The figure landed above 50.0 for the first time in the past six months. Also, the preliminary Services PMI jumped to 53.7 from the estimates of 51.5 and the former release of 52.6.
Upbeat performance from Manufacturing and Services PMI indicates that economic recovery in the US economy is well on track and labor demand could rebound dramatically. Therefore, one more rate hike from the Fed is highly required to keep weighing on the stubborn inflation.
On the Eurozone front, the European Union is preparing for a ban on many goods passing through Russia. The idea is to weak funding for Russia to get arms and ammunition against Ukraine.
European Central Bank (ECB) Vice President Luis de Guindos cited on Friday, “I'm convinced that core inflation will also come down, but starting point is very high.”
-
02:02
USD/JPY Price Analysis: Bulls seeking a discount
- USD/JPY bears are moving in but bulls are on standby.
- Bulls need to get above hourly resistance structure.
USD/JPY has been offered as the Yen on Friday posted modest gains on signs of strength in Japan’s economy boosted by Japan’s Mar national inflation data that rose more than expected and by the most in 41 years, and a gauge of Japan’s manufacturing activity rose to a 6-month high. Technically, however, the bias remains bullish while above 132.80 and certainly while on the front side of the broader trendline.
USD/JPY weekly chart

The weekly chart is bullish as the bull leg remains intact.
USD/JPY daily charts

On the daily chart, we can see the price resisted by 135.11.

We also have an M-formation in the making with the price testing the 133.40s.
USD/JPY H1 charts

We have the price heading toward trendline support. Bulls will need to get above 133.90.

On the other hand, the 132.70s are in focus.
-
01:35
WTI Price Analysis: Sets for a bumpy ride to $75.00 as recession fears deepen
- Oil prices are showing signs of volatility contraction following the footprints of a sideways US Dollar.
- More rate hikes from central banks would put a serious dent in the oil demand.
- The black gold is expected to surrender entire gains generated after the announcement of production cuts by OPEC+.
West Texas Intermediate (WTI), futures on NYMEX, are showing signs of volatility contraction around $77.60 in the Asian session. The oil price showed a decent recovery after cracking to near $76.70 but is struggling for extending its recovery further as investors are worried that more rate hikes from Western central banks to strengthen their dominance on stubborn inflation would put a serious dent in oil demand.
Western central banks are preparing for a fresh rate hike cycle for May. The Bank of England (BoE) and the Federal Reserve (Fed) are expected to raise interest rates further by 25 basis points (bps). Meanwhile, investors are divided over the pace of the interest rate hike by the European Central Bank (ECB).
Meanwhile, the US Dollar Index (DXY) has shown a rebound move after defending its crucial support of 101.63. The recovery move by the USD Index is yet to go through more filters to infuse confidence among investors that the rebound is for real.
The oil price witnessed a steep fall after dropping below the crucial support placed from April 03 low at $79.00, which has turned into resistance for bulls. The downside move in the black gold is expected to surrender entire gains generated after the surprise announcement of production cuts by OPEC+.
The 20-period Exponential Moving Average (EMA) at $77.88 is acting as a barricade for the oil bulls.
Meanwhile, the Relative Strength Index (RSI) (14) is expected to fall back within the bearish range of 20.00-40.00.
Going forward, a decisive downside below $75.00 will expose the oil price to March 30 low at $72.69 followed by the round-level support at $70.00.
On the flip side, a confident break above April 03 low at $79.00 will drive the oil price toward April 04 high at $81.80 and April 12 high at $83.40.
WTI two-hour chart
-638178932026777403.png)
-
01:30
Stocks. Daily history for Friday, April 21, 2023
Index Change, points Closed Change, % NIKKEI 225 -93.2 28564.37 -0.33 Hang Seng -321.24 20075.73 -1.57 KOSPI -18.71 2544.4 -0.73 ASX 200 -31.8 7330.4 -0.43 FTSE 100 11.5 7914.1 0.15 DAX 85.69 15881.66 0.54 CAC 40 38.29 7577 0.51 Dow Jones 22.34 33808.96 0.07 S&P 500 3.73 4133.52 0.09 NASDAQ Composite 12.9 12072.46 0.11 -
01:15
Currencies. Daily history for Friday, April 21, 2023
Pare Closed Change, % AUDUSD 0.66934 -0.72 EURJPY 147.403 0.11 EURUSD 1.09895 0.19 GBPJPY 166.908 -0.06 GBPUSD 1.24436 0.02 NZDUSD 0.6139 -0.63 USDCAD 1.35399 0.47 USDCHF 0.89218 -0.01 USDJPY 134.132 -0.08 -
00:54
AUD/USD looks vulnerable below 0.6700 as Fed prepares for more rate hikes
- AUD/USD is expected to extend its downside journey amid hawkish Fed bets.
- The USD Index is trying to defend its immediate support of 101.63 ahead of US Durable Goods Orders.
- A consensus of further decline in Australian inflation will allow the RBA to keep rates steady.
The AUD/USD pair has shifted its suction below the round level support of 0.6700 in the Asian session. After defending the immediate support of 0.6680, an absence of recovery in the Aussie asset is making it vulnerable. The downside bias for the Aussie asset is also solid due to rising bets for one more consecutive 25 basis points (bps) rate hike from the Federal Reserve (Fed).
S&P500 futures are holding losses generated in the early Asian session, showing caution as more United States companies are going to report their quarterly earnings ahead. The US Dollar Index (DXY) is attempting to defend the four-day support of 101.63. The USD Index has been displaying topsy-turvy moves for the past four trading sessions in a 101.63-102.23 range amid an absence of a potential trigger.
A power-pack action is expected from the USD Index this week amid the release of the Durable Goods Orders data, which provides a glimpse of forward demand. For March, Durable Goods Orders data is seen expanding by 0.8% vs. a contraction of 1.0%. An upbeat economic data would be supportive of more rate hikes from the Federal Reserve (Fed).
This week, the Australian Dollar will remain in action amid the release of the Inflation data. As per the expectations, inflation data for the first quarter of CY2023 has decelerated to 1.3% from the prior release of 1.9%. Annual inflation has softened to 6.9% vs. the prior release of 7.8%. The monthly Consumer Price Index (CPI) indicator (March) is expected to show further softening to 6.5% against the former release of 6.8%. An occurrence of the same would allow the Reserve Bank of Australia (RBA) to keep the interest rate policy steady ahead.
-
00:26
United Kingdom Rightmove House Price Index (YoY) dipped from previous 3% to 1.7% in April
-
00:26
United Kingdom Rightmove House Price Index (MoM) down to 0.2% in April from previous 0.8%
-
00:20
USD/CAD gathers strength for a break above 1.3550 despite subdued USD Index
- USD/CAD is building a base for a decisive break above 1.3550 despite downside bias for the US Dollar Index.
- Higher interest rates by the BoC have heavily impacted on Canada’s retail demand.
- The further downside in the oil price looks solid as global central banks are preparing for a fresh rate hike cycle.
The USD/CAD pair has turned sideways after a stellar north-side move around 1.3550 in the early Asian session. The Loonie asset is expected to extend its recovery sharply above the immediate resistance of 1.3550. The strength in the Loonie asset looks enormous despite a subdued performance by the US Dollar Index (DXY).
S&P500 futures are showing some losses in Asia as investors are worried about forthcoming quarterly results from the United States corporate, portraying a decline in the risk appetite of the market participants. The US Dollar Index (DXY) has dropped below 101.70 and is declining towards the four-day support of 101.63, showing strength in the downside momentum. The demand for US government bonds is getting sluggish as one more rate hike from the Federal Reserve (Fed) is widely expected. The 10-year US Treasury yields have scaled to near 3.57%.
The USD index has failed to capitalize on the upbeat preliminary United States S&P PMI data, released on Friday. S&P Manufacturing data jumped to 50.4 from the consensus of 49.0 and the former release of 49.2. The figure landed above 50.0 for the first time in the past six months, indicating economic recovery amid pessimist circumstances of higher interest rates from the Fed and tight conditions by US banks for consumers and business-type loans.
The Canadian Dollar has faced immense pressure due to Canada’s weak retail demand. February’s Retail Sales report showed that monthly Retail Sales contracted by 0.2% vs. an expectation of 0.6% contraction. Retail Sales ex-auto data contracted by 0.7% against a contraction of 0.1% as expected by the market participants. This shows a sheer impact on retail demand due to higher interest rates by the Bank of Canada (BoC). BoC Governor Tiff Macklem is expected to keep rates steady at elevated levels to bring down stubborn inflation.
On the oil front, oil prices are showing a sideways auction above $77.00. Further downside looks solid as global central banks are preparing for a fresh rate hike cycle, which would heavily impact oil demand. It is worth noting that Canada is the leading exporter of oil to the United States and lower oil prices will impact the Canadian Dollar.
-