Notícias do Mercado
-
23:47
New Zealand trade deficit widens in March, NZD/USD stays pressured
As per the latest New Zealand (NZ) foreign trade numbers from the New Zealand Statistics, the headline Trade Balance dropped to $-1,273M MoM in March versus $-796M prior (revised). That said, the annual trade deficit increased to $16.4B versus $-15.72B prior figures (revised from $-15.64B).
Further details suggest that Exports rose to $6.51B during the said month versus $5.06B (revised) prior whereas Imports increased to $7.78B compared to $5.86B previous readings.
Market reaction
NZD/USD offers no major reaction to the data while pausing the corrective bounce near 0.6145 by the press time. That said, the Kiwi pair dropped heavily the previous day, mainly led by the risk aversion wave led by banking fears.
About New Zealand Trade Balance
The Trade Balance released by Statistics New Zealand is a measure of the balance amount between imports and exports, and it is published in New Zealand dollar terms. A positive value shows a trade surplus while a negative value shows a trade deficit. Any variation in the figures influences the domestic economy. If a steady demand in exchange for exports is seen, that would turn into a positive growth in the trade balance, and that should be positive for the NZD.
-
23:46
USD/CAD Price Analysis: Breaks through 50-day EMA resistance, reclaims 1.3600
- The USD/CAD is ready to test a one-month-old resistance trendline at around 1.3650.
- USD/CAD Price Analysis: Upward biased, it could test the 1.3700 figure.
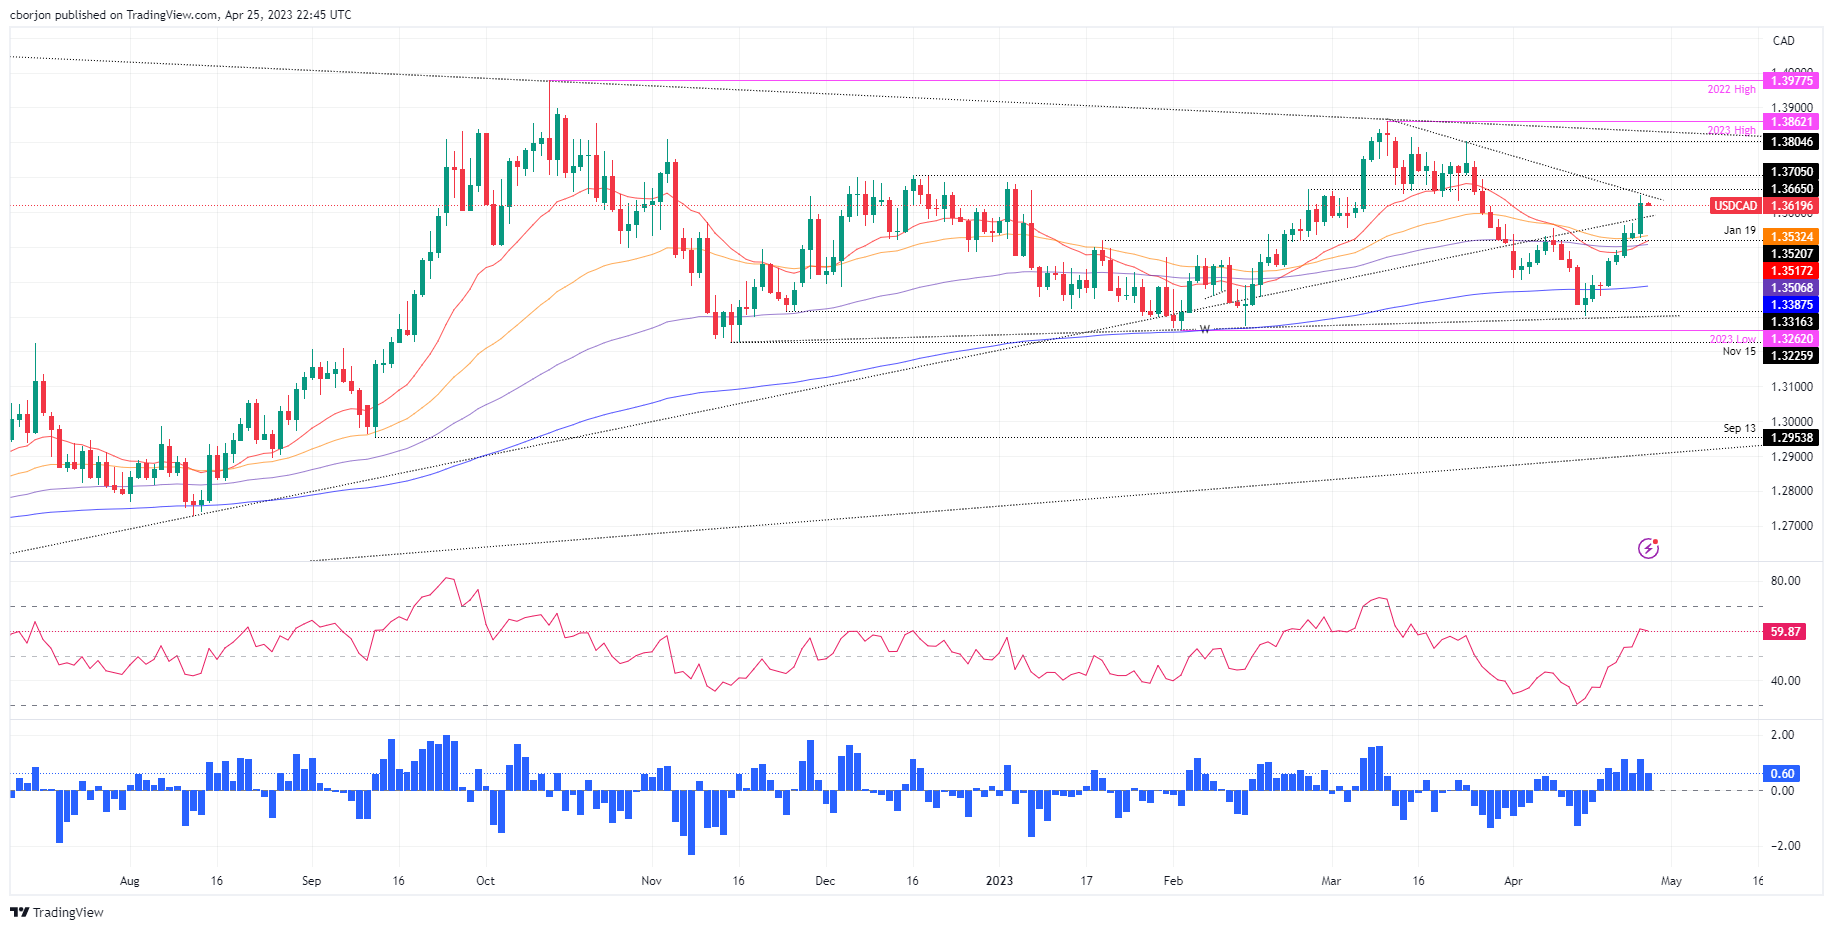
The USD/CAD reclaims the 1.3600 mark after dropping to a daily low of 1.3524. The pair tested the 50-day Exponential Moving Average (EMA) at 1.3532 before reversing its course and posting gains of 0.64% on Tuesday. As the Asian session begins, the USD/CAD exchanges hands at around 1.3620.
USD/CAD Price Analysis
After Tuesday’s price action, the USD/CAD is poised to test a resistance trendline at around 1.3635-50, which could pave the way for further upside once broken. In addition, the Relative Strength Index (RSI), in bullish territory, aims upward, suggesting buyers are moving in. Another reason for the USD/CAD to continue its uptrend is the Rate of Change (RoC), indicating that buying pressure increased in the last three days.
That said, the USD/CAD first resistance would be 1.3650. Once cleared, the USD/CAD next resistance would be 1.3700, followed by the March 24 cycle high at 1.3804 and the YTD high at 1.3862.
Conversely, the USD/CAD could shift downwards if it fails to crack the one-month-old resistance trendline. Hence, the USD/CAD first support would be the psychological 1.3600 figure. The seller’s next stop would be the 50-day EMA at 1.3532 before testing the 20-day EMA at 1.3517, followed by the 100-day EMA at 1.3506.
USD/CAD Daily Chart
-
23:46
New Zealand Exports up to $6.51B in March from previous $5.23B
-
23:46
New Zealand Trade Balance NZD (MoM) declined to $-1273M in March from previous $-714M
-
23:45
New Zealand Imports climbed from previous $5.95B to $7.78B in March
-
23:45
New Zealand Trade Balance NZD (YoY): $-16.4B (March) vs previous $-15.64B
-
23:30
AUD/JPY Price Analysis: Bears occupy driver’s seat below 89.00 ahead of Australia inflation
- AUD/JPY seesaws within a tight range near the lowest levels in a fortnight after falling the most in six weeks.
- Clear downside break of 50-DMA, one-month-old ascending trend line keeps sellers hopeful.
- Looming bear cross on MACD also signals AUD/JPY downside as Australia’s Consumer Price Index data for Q1 and March loom.
AUD/JPY licks its wounds at the lowest levels in two weeks as the pair traders await Australia’s headline inflation data during early Wednesday. That said, the cross-currency pair seesaws around 88.70 after falling the most in six weeks the previous day.
The quote’s heavy fall on Tuesday could be linked to a break of the one-month-old ascending trend line and the 50-DMA. Adding strength to the downside bias could be the impending bear cross. However, the RSI (14) line is below 50 and hence suggests some bottom-picking in case the Aussie data offers a positive surprise.
As a result, the monthly low of around 87.60 gains major attention ahead of the late 2022 low of near the 87.00 round figure.
Following that, a south run towards refreshing the yearly low, currently around 86.05 can’t be ruled out.
On the flip side, the 21-DMA restricts immediate advances of the AUD/JPY pair around 89.25.
Should the quote rises past 21-DMA, the 50-DMA hurdle of around 89.75 and the previous support line surrounding 89.90 will precede the 90.00 psychological magnet to challenge the AUD/JPY pair buyers.
Even if the quote rises past the 90.00 round figure, a downward-sloping resistance line from September 2022, near 90.60, will be the key hurdle for the AUD/JPY bulls to cross before retaking control.
AUD/JPY: Daily chart

Trend: Further downside expected
-
23:26
AUD/NZD retreats from 1.0800 as RBNZ proposes to ease qualitative restrictions, Aussie CPI eyed
- AUD/NZD has retreated after a short-lived pullback to near 1.0800 ahead of Australian Inflation.
- The RBNZ has proposed to loosen the loan-to-value ratio (LVR) restrictions as they may be unnecessarily reducing efficiency.
- RBA policymakers are expecting a further slowdown in the Australian economy, which will decelerate stubborn inflation.
The AUD/NZD pair has sensed selling pressure after a less-confident pullback move to near 1.0800 in the Asian session. The cross is going through an immense sell-off for the past two trading sessions in hopes that the Reserve Bank of Australia (RBA) will continue to keep interest rates steady next week.
Investors will get more clarity for the monetary policy action after the release of the Australian Consumer Price Index (CPI) data. According to the estimates, quarterly inflation (Q1) has accelerated by 1.3% at a slower pace than the velocity of 1.9% recorded in the last quarter of CY2022. Annual inflation is expected to soften to 6.9% from the former release of 7.8%.
Apart from that, the monthly inflation indicator (Mar) is expected to decelerate to 6.6% from the prior release of 6.8%. Australia’s monthly CPI has softened significantly from its peak of 8.4%, recorded in December. This allowed the Reserve Bank of Australia (RBA) to pause its rate-hiking spell after pushing interest rates to 3.60%. RBA policymakers are expecting a further slowdown in the Australian economy, which will decelerate stubborn inflation.
On the New Zealand front, the Reserve Bank of New Zealand (RBNZ) has proposed to loosen the loan-to-value ratio (LVR) restrictions. RBNZ Deputy Governor and head of financial stability Christian Hawkesby cited on Wednesday, "Our assessment is that the risks to financial stability posed by high-LVR lending have reduced to a level where the current restrictions may be unnecessarily reducing efficiency. In particular, impeding the provision of credit to some otherwise creditworthy borrowers, this is not proportionate to the level of risk that we see.”
-
23:14
EUR/USD licks its wounds near 1.0970 after banking woes propelled the biggest daily fall in six weeks
- EUR/USD steadies after the heavy fall as traders await US data.
- Risk aversion supersedes hawkish ECB comments to weigh on Euro pair.
- Fears of banking sector fallouts return as First Republic Bank refrains from earnings guidance.
- US Durable Goods Orders, central bankers’ comments will be important to watch for clear directions.
EUR/USD bears take a breather after witnessing the biggest daily loss in 1.5 months, making rounds to 1.0980-70 during the early hours of Wednesday’s Asian session.
In doing so, the Euro pair seeks fresh clues after the banking fears roiled the market sentiment and fuelled the US Dollar’s demand. With this, the major currency pair even ignored hawkish comments from the European Central Bank (ECB) Officials, as well as mixed US data. It’s worth noting that an update surrounding the major central bank’s Dollar operations also underpinned the US Dollar’s rebound and exerted downside pressure on the quote.
The First Republic Bank’s (FRB) disappointing earnings reports joined the executives’ resistance in taking questions and no earnings guidance to trigger the fresh wave of banking jitters and weighed on the market sentiment the previous day.
Adding strength to the risk aversion were calls that the central bankers are well set for higher rates even as the economics aren’t suitable. Furthermore, the geopolitical concerns surrounding Russia and China also spoil the risk appetite and provide a tailwind to the US Dollar.
In doing so, the EUR/USD ignores hawkish comments from the ECB policymakers. That said, ECB Chief Economist Philip Lane mentioned that the current data suggest we have to raise interest rates again at the upcoming meeting. The policymaker also added, “Beyond May 4 meeting, further rate hikes will depend on data.” Further, ECB Governing Council member and Bank of France head Francois Villeroy de Galhau said that they are likely at the inflation peak today while also adding, “Inflation will probably come down towards 2% at the end of 2024.”
Apart from the ECB talks, the mixed US data also failed to prod the EUR/USD bears. On Tuesday, US Conference Board's Consumer Confidence Index edged lower to 101.3 for April, versus 104.0 prior and Additional details of the publication stated that the Present Situation Index ticked up to 151.1 during the said month from 148.9 prior whereas the Consumer Expectations Index dropped to 68.1 from 74 previous readings. Further, the one-year consumer inflation expectations eased to 6.2% in April from 6.3% in March. In a different release, the US New Home Sales rose to 0.683M MoM in March versus 0.634 expected and 0.623M revised prior while the S&P/Case-Shiller Home Price Indices and Housing Price Index both rose past market forecast to 0.4% and 0.5% respectively for February.
Amid these plays, Wall Street closed in the red and the US Treasury bond yields were down too, which in turn allowed the US Dollar Index (DXY) to snap a three-day downtrend.
Moving on, US Durable Goods Orders for March will be important to watch as it offers clues for Thursday’s US Gross Domestic Product (GDP) for the first quarter (Q1).
Technical analysis
Despite the latest retreat, EUR/USD bears need validation from a three-week-old ascending support line, around 1.0965 to convince sellers. On the contrary, an upward-sloping resistance line from early February, near 1.1085 at the latest, challenges the Euro pair’s recovery.
-
23:06
GBP/USD Price analysis: Bears stacked up to test trendline support
- GBP/USD bears are moving in and eye a downside break of trendline support.
- The 4-hour 38.2% Fibonacci could be significant in the session ahead.
The safe-haven US dollar rose on Tuesday as market sentiment turned risk-averse amid further worries about the banking sector. This has flipped the technicals in GBP/USD bearish once again.
GBP/USD daily chart
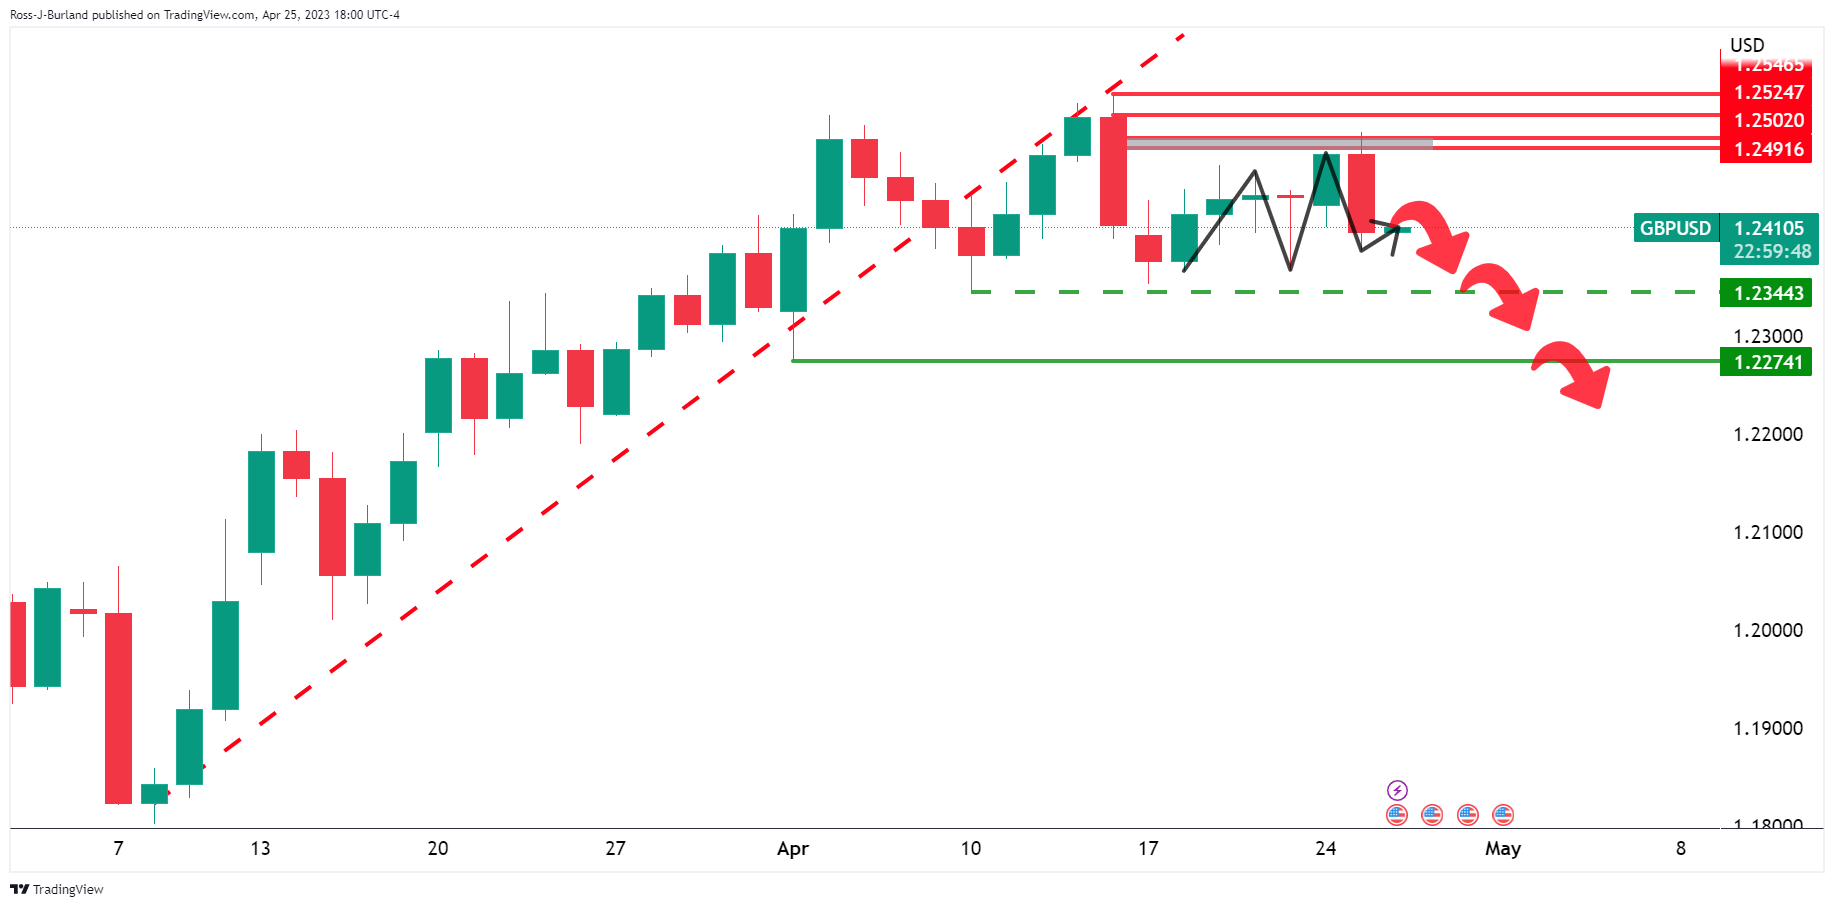
The Daily M-formation is in play. The bears will need to commit to any pullbacks, however, on the lower time frames as follows:
GBP/USD H4 chart
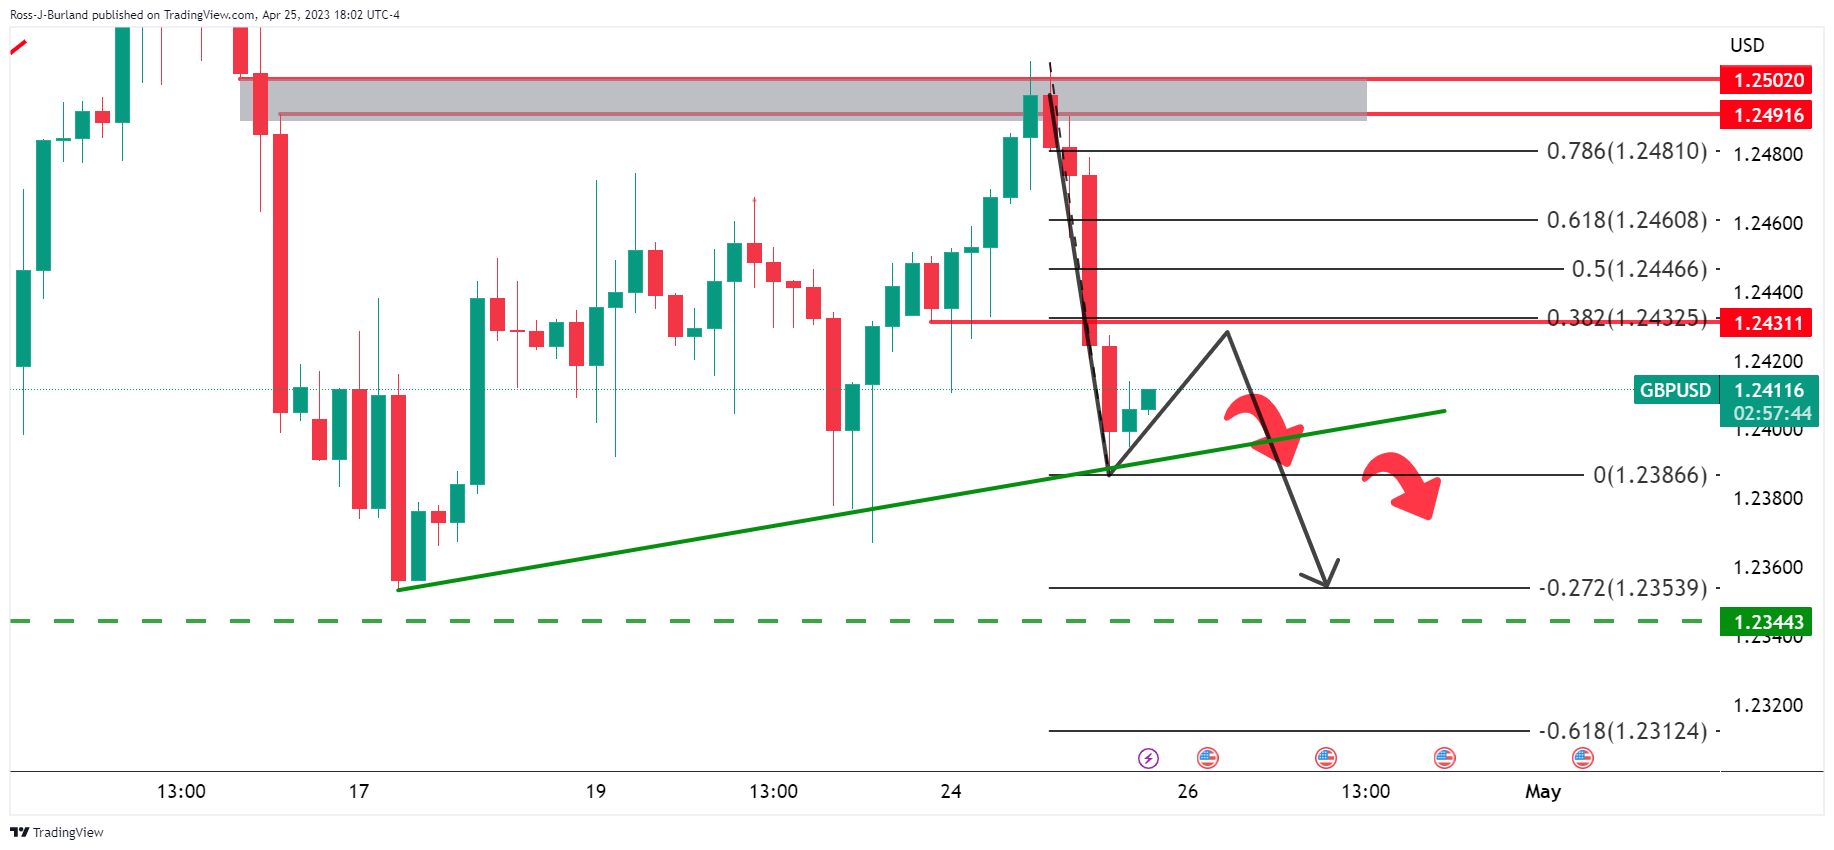
The pair is testing trendline support but should the bears show up at the 38.2% Fibonacci in any decent size, meeting the 4-hour charts M-formaiton´s neckline, then the bias will start to move bearish again.
-
23:01
AUD/USD defends 0.6600 ahead of Australian Inflation and US Durable Goods Orders data
- AUD/USD has shown some recovery after a fresh five-month low of 0.6614 amid strength in the USD Index.
- The USD index showed a V-shape recovery as investors are worried about interest rate guidance from the Fed.
- A further deceleration in Australian inflation will allow the RBA to stick to its stance of policy-tightening pause.
The AUD/USD pair has shown a minor recovery after printing a fresh five-week low of 0.6614 in the early Asian session. The Aussie asset has rebounded to near 0.6625, however, the downside seems favored considering the strength in the US Dollar Index (DXY) and negative market sentiment.
The USD index showed a V-shape recovery from a fresh weekly low of 101.20 as investors are worried about interest rate guidance from the Federal Reserve (Fed). Next week, the Fed will announce May’s monetary policy in which an interest rate hike by 25 basis points (bps) is widely anticipated and the street was earlier expecting that the Fed will pause its quantitative tightening regime after this interest rate hike.
Meanwhile, fresh recovery in United States economic activities as Manufacturing PMI has landed in expansion territory, the core Consumer Price Index (CPI) is still persistent, and a recovery in the housing market indicate that Fed chair Jerome Powell could remain hawkish while guiding about forward interest rates.
S&P500 settled Tuesday’s session on a bearish note despite upbeat earnings from Microsoft and Google. Banking jitters renewed after First Republic Bank reported a sharp decline in customers’ deposits and it is required to bank fundraising for disbursing loans. The events triggered a risk aversion theme in the overall market.
Going forward, US Durable Goods Orders data will be keenly watched. Monthly the Durable Goods Orders data (March) is seen expanding by 0.8% vs. a contraction of 1.0%.
On the Australian Dollar front, inflation data will remain in focus. As per the consensus, quarterly inflation (Q1) accelerated by 1.3% at a slower pace than the velocity of 1.9% recorded in the last quarter of CY2022. Annual inflation is expected to soften to 6.9% from the former release of 7.8%.
Investors should note that the Reserve Bank of Australia (RBA) paused its rate-hike spell in its April policy meeting. A further deceleration in Australian inflation will allow the RBA to stick to its stance of policy-tightening pause.
-
22:48
Gold Price Forecast: XAU/USD surges to weekly high above $2000 amidst deteriorating risk appetite
- Gold price clings to gains above the 20-day EMA, boosted by risk aversion.
- Mixed data in the United States suggests that the economy is slowing.
- XAU/USD Price Analysis: Downside expected beneath $2000., with sellers eyeing $1950.
Gold price advanced and printed a new weekly high at around $2003, though it faltered to hold its gains above the $2000 mark. Deteriorated risk appetite sponsored by fears around the United States (US) banking system, increased flows to safe-haven assets. Therefore, the XAU/USD climbs 0.41%, trading at $1997.10, after hitting a low of $1976.26.
Sentiment takes a hist on First Republic Bank. US Consumer confidence drops and New Home Sales, advanced
Wall Street finished the session with losses. Investors’ woes about First Republic Bank admitting a loss of $100 billion worth of deposits in Q1 2023 reignited worries of a spread contagion around the system. Another tranche of US economic data revealed earlier witnessed Consumer Confidence sliding to a level last seen in July 2022, at 101.3, vs. expectations of 104.0, and New Home Sales in March rising, 9.6% MoM, exceeding estimates of 1.1%.
On other data, the Dallas Fed Services Index dropped to -14.4 in April, an improvement compared to March’s -18, while the Richmond Fed Indices, both readings plunged, a signal that the economy is decelerating.
Despite all that, the greenback slightly capped the XAU/USD’s rally. The US Dollar Index (DXY), a gauge of the buck’s value vs. a basket of six currencies, edges high 0.55%, at 101.872, although US Treasury bond yields continued to tumble.
That comes as speculations of a Federal Reserve (Fed) rate hike for May, had diminished, as reported by the CME FedWatch Tool. Odds for a 25 bps lie at 74.7%, less than Monday’s 90.5% chance, as reflected by US bond yields. However, investors have begun discounting two 25 bps rate cuts by the year’s end, as shown by the CME probabilities table.
XAU/USD Technical Analysis
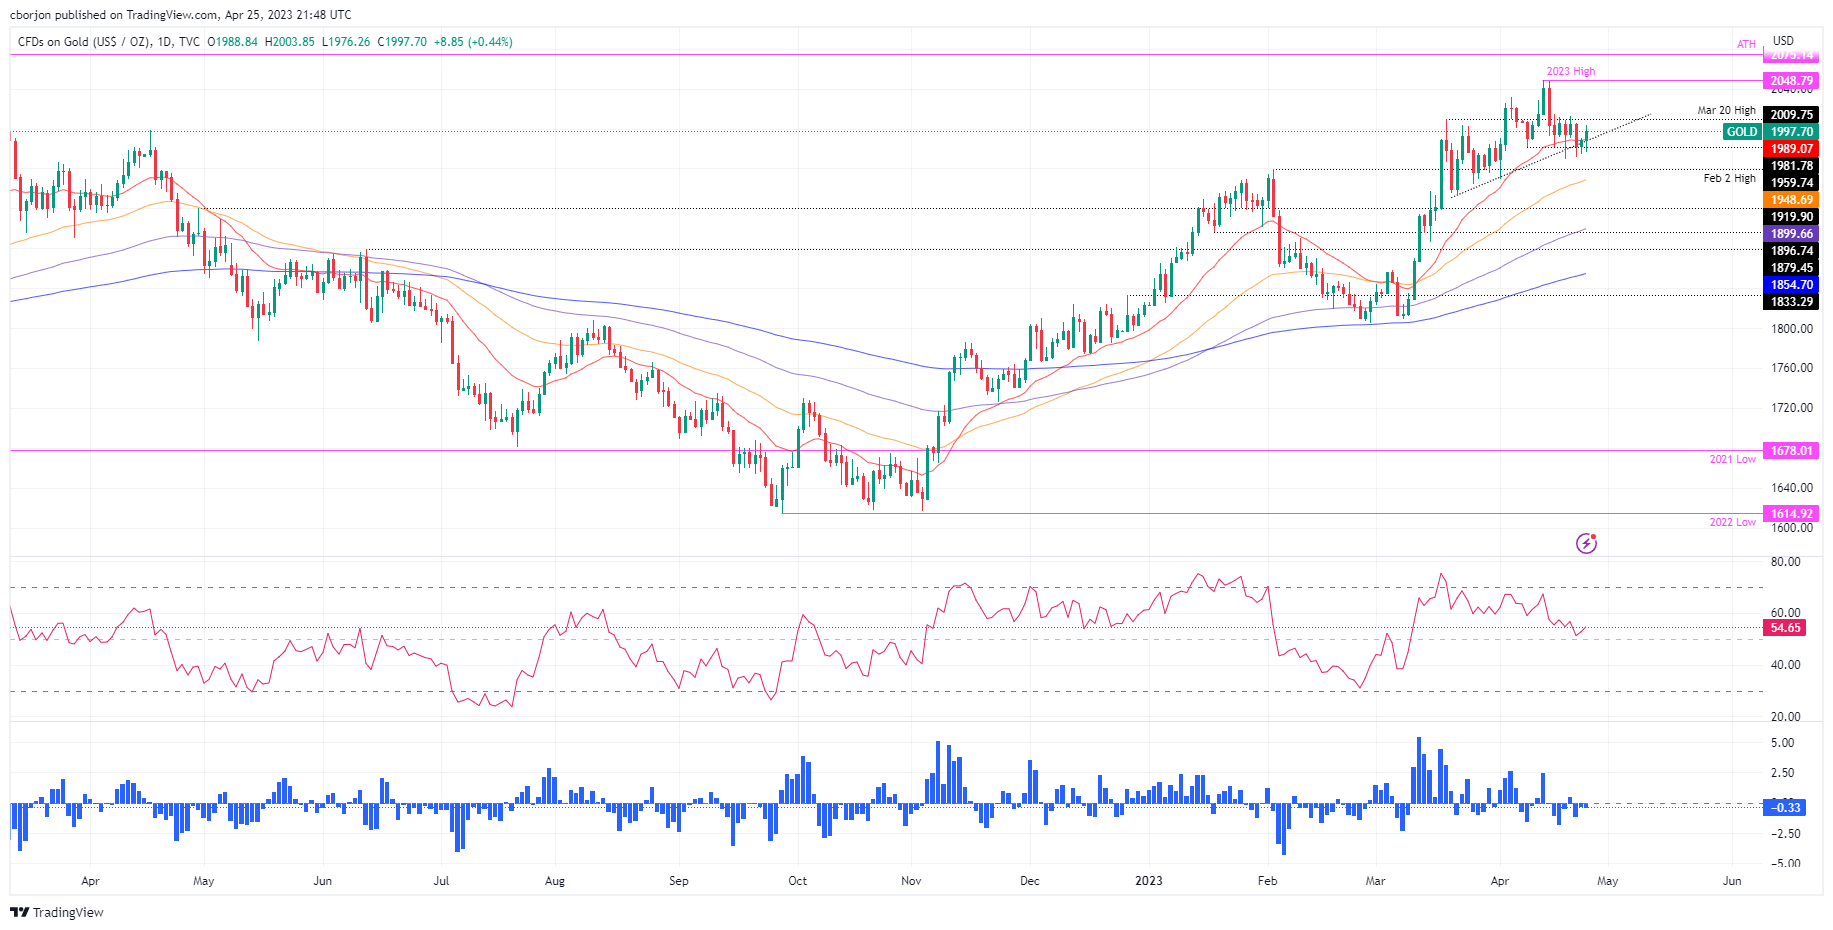
Gold remains supported by the 20-day Exponential Moving Average (EMA) at $1989.07, a dynamic demand zone from which XAU/USD has bounced. The XAU/USD uptrend is intact, and further upside is expected as the Relative Strength Index (RSI) bounces off the 50 levels and aims toward the 60 level. Moreover, the Rate of Change (RoC) indicates sellers are losing momentum. That said, the XAU/USD path of least resistance is upwards. The XAU/USD first resistance would be the $2000 mark. A breach of the latter and Gold could climb towards the April 5 swing high at $2032.13, followed by the YTD high at $2048.79.
-
22:44
RBNZ proposes to ease LVR restrictions
The Reserve Bank of New Zealand has decided to loosen the loan-to-value ratio (LVR) restrictions, as stated today by the Deputy Governor and head of financial stability Christian Hawkesby on Wednesday.
"Our assessment is that the risks to financial stability posed by high-LVR lending have reduced to a level where the current restrictions may be unnecessarily reducing efficiency. In particular, impeding the provision of credit to some otherwise creditworthy borrowers, which is not proportionate to the level of risk that we see," Hawkesby said.
The loosening means for owner-occupiers that banks will now be able to advance up to 15% of their new lending (up from 10%) to customers borrowing on a loan-to-value ratio of in excess of 80%. For investors, the tight restriction that they must have 40% deposits to buy will be moved lower to 35%.
NZD/USD update
- NZD/USD bears take back control on banking sector concerns
NZD/USD fell to a low of 0.6133 in Tuesday´s trade after suffering a risk-off blow with the US Dollar tearing higher since the early Europen session. NZD/USD fell from a high of 0.6187 on the day.
-
22:04
Forex Today: Risk aversion lifts the Yen and the US Dollar
During Wednesday’s Asian session, the highlight will be Australian inflation data. Those numbers will be a key input before next week’s RBA meeting. New Zealand will inform trade data and credit card spending. Later in the day, the US Durable Goods Orders report is due. The US Dollar could continue to benefit amid a deterioration in market sentiment.
Here is what you need to know on Wednesday, April 26:
The Japanese Yen rose sharply on Tuesday amid risk aversion on renewed banking concerns and a rally in government bonds. The US Dollar also rose. A week before the FOMC meeting, banking concerns are back, an episode that could become somewhat similar to what happened in March.
First Republic Bank earnings calls triggered concerns about the banking sector's health. Bank’s executives delivered prepared remarks and refused to take questions. The bank lost $102 billion in customer deposits and borrowed $92 billion during the first quarter. The stock lost almost 50% on Tuesday. Bank stocks dropped sharply.
Global equity markets fell and bonds rose, boosting the Yen and the Dollar. The Dow Jones tumbled 1.02% and the Nasdaq lost 1.98%. The US 10-year bond yield settled at 3.39%, the lowest since April 12.
Economic data from the US came in mostly above expectations, with positive signs from the housing sector. The S&P/Case-Shiller Home Price index rose for the first time in eight months and New Home Sales surged 9.6% in March to a 683.000 annual pace, marking the third increase in the last four months. CB Consumer Confidence dropped, but the present situation indicator improved. The critical report will be on Thursday with the first reading of Q1 GDP and consumer inflation.
EUR/USD reversed from weekly highs above 1.1050 to 1.0960 as Eurozone yields tumbled on risk aversion. Inflation and GDP data are due on Friday.
On Tuesday, Bank of England Huw Pill said that recent events moderated calls for higher interest rates. The UK informed an increase in borrowing of 20.709 billion pounds in March, slightly below expectations. It was the second-highest March borrowing since 1993, with the debt-to-GDP ratio reaching 100%, the highest since the 1960s.
A rate hike at the next Bank of England meeting is priced in. GBP/USD dropped from 1.2500 to the 1.2400 zone amid Dollar strength. EUR/GBP surged to 0.8875, the highest in a month, then sharply reversed to 0.8840.
Ahead of Friday’s monetary policy decision, Bank of Japan (BoJ) Governor Kazuo Ueda suggested no imminent change. Speaking before parliament he said they should continue with monetary easing given current economic conditions. Despite Ueda’s comments, the Japanese Yen ended Tuesday sharply higher boosted by a decline in global government bond yields.
The Japanese Yen jumped on Wednesday. USD/JPY bottomed at 133.35, the lowest in ten days. CHF/JPY reached the highest level since 1980 at 151.51 and then reversed sharply, falling below 150.00
AUD/USD posted the lowest close in a month, below 0.6650. Australia will report inflation on Wednesday and the Reserve Bank of Australia (RBA) meets next week.
NZD/USD approached 0.6200 and then reversed amid a stronger US Dollar, falling below 0.6150. Trade data from New Zealand is due on Wednesday.
USD/CAD rose for the fifth consecutive day, climbing above 1.3600 for the first time since late March, boosted by the deterioration in market sentiment and lower crude oil prices.
Cryptocurrencies rose despite the decline in equity markets. Bitcoin climbed toward $28,000. Gold ended near $2,000 on a volatile session while Silver rebounded sharply from weekly lows to $25.00.
The earnings season continues on Wednesday with Meta, Thermo Fisher Scientific, Boeing, GSK, Vale, Pionerr and Hilton.
Like this article? Help us with some feedback by answering this survey:
Rate this content -
22:00
South Korea Consumer Sentiment Index came in at 95.1, above forecasts (90.9) in April
-
21:35
NZD/USD bears take back control on banking sector concerns
- NZD/USD drops back towards Monday´s open as risk-off sentiment weighs.
- Banking sector worries have sunk equities and high beta currencies.
NZD/USD is down some 0.45% into the closing of the US session and Tuesday´s trade after suffering a risk-off blow with the US Dollar tearing higher since the early Europen session. NZD/USD rallied from a low of 0.6133 and reached a high of 0.6187 on the day.
´´The reversal has come amid a slide in regional bank stocks, which has, in turn, led markets to question how locked in a May Fed hike actually is, and driven safe-haven buying of USDs,´´ analysts at ANZ Bank explained.
Consequently, high beta currencies, such as NZD have fallen as equities drop. The US Dollar index, DXY, benefitted from the risk-off flows and was last up 0.51% at 101.84, a touch off the highs at 101.949. Plunging deposits at First Republic Bank have reignited worries over the health of the banking sector. Additionally, UBS reported a 52% slide in quarterly income as it prepared to swallow fallen rival Credit Suisse.
´´Volatility thus remains elevated, and we may get even more locally today with the release of March trade data, which will only serve as a reminder to markets of NZ’s yawning current account gap – something that we see as a downside risk to our expectation of a mild NZD appreciation in 2023,´´ the analysts at ANZ Bank explained, adding, ´´we also get AU Consumer Price Index data today, which is key given the NZD’s correlation to the AUD.´´
-
21:33
United States API Weekly Crude Oil Stock down to -6.083M in April 21 from previous -2.675M
-
21:07
S&P 500 bears seeking a break of critical support structure
- S&P 500 under pressure on banking sector concerns.
- Plunging deposits at First Republic Bank have reignited worries over the health of the banking sector.
- S&P 500 is on the backside of bull trend, eyes on critical structures.
The S&P 500 is firmly down on Tuesday and is printing fresh lows in late trade to 4,074.22. The index has traveled between a high of 4,126.43 and a low of 4,074.07 so far and is losing 1.57% at the time of writing.
US stocks are on track to end lower on a slew of earnings reports that have come out largely negative has weighed on risk sentiment, especially in the banking sector, bourne out of worrying earnings from First Republic Bank and UBS.
Plunging deposits at First Republic Bank have reignited worries over the health of the banking sector and UBS reporting a 52% slide in quarterly income as it prepares to swallow fallen rival Credit Suisse has not helped to encourage any hunger for risk in the financial markets. The revival of banking sector concerns could be an ongoing theme and that leaves the outlook fundamentally bearish for US equities and the S&P 500 index.
Meanwhile, Tuesday's economic calendar came with a number of several data points on the housing market and combined with consumer confidence falling to its lowest since July, while the Richmond Fed's survey of manufacturing activity came in at -10 versus a consensus of +4, bears have moved in.
S&P 500 index
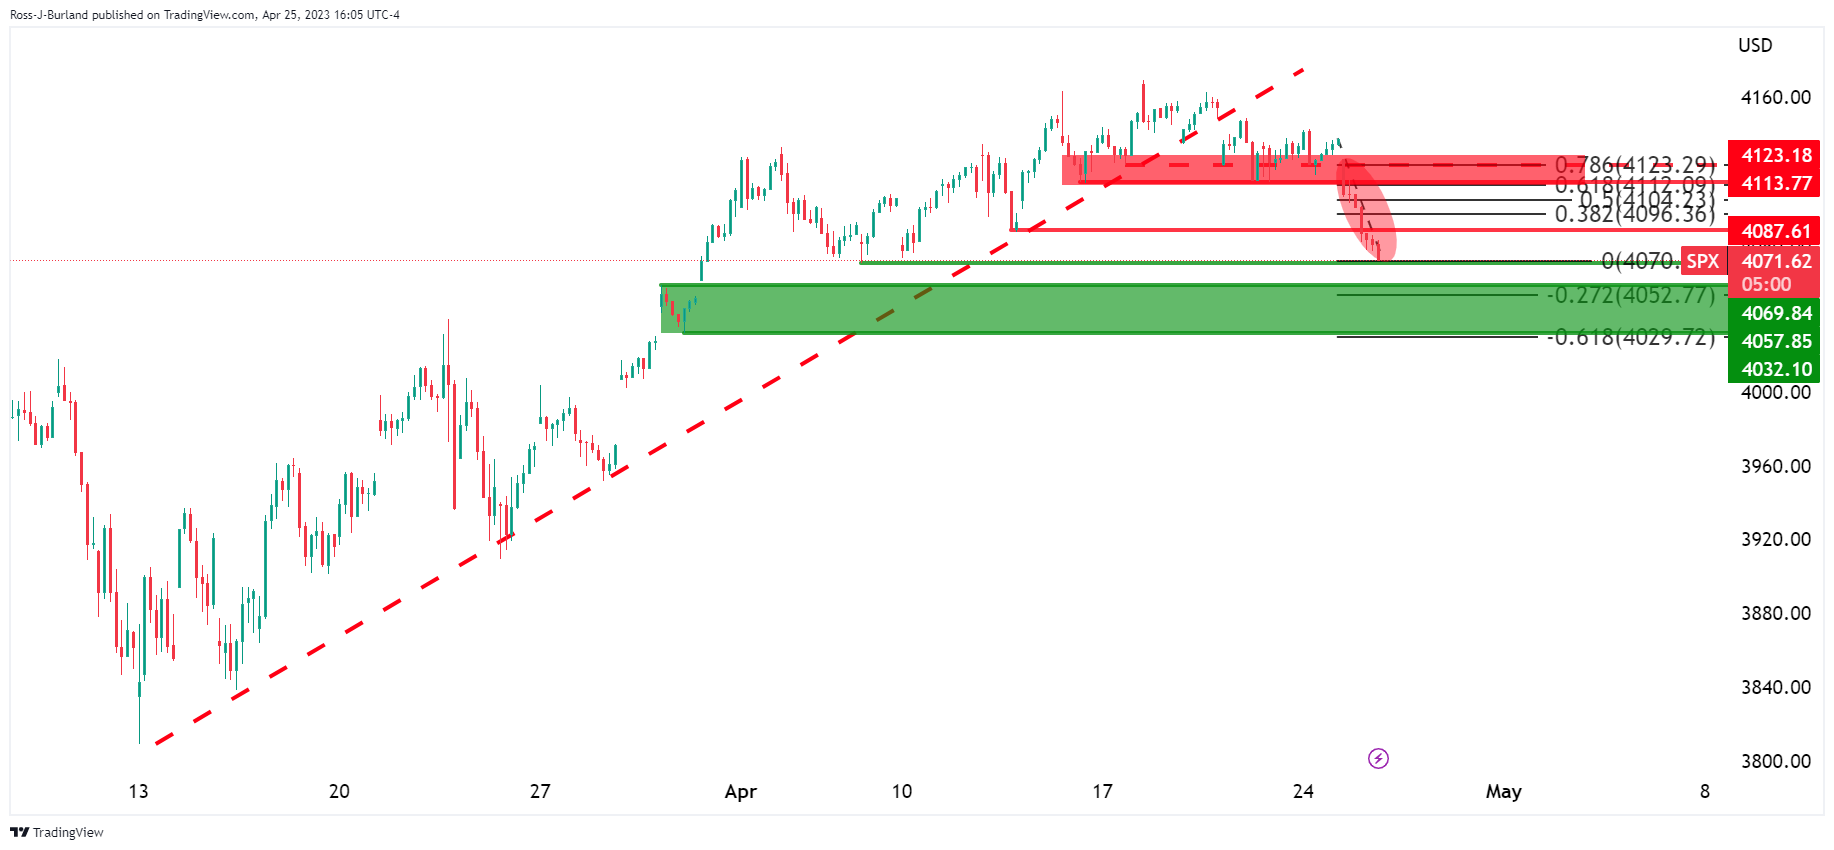
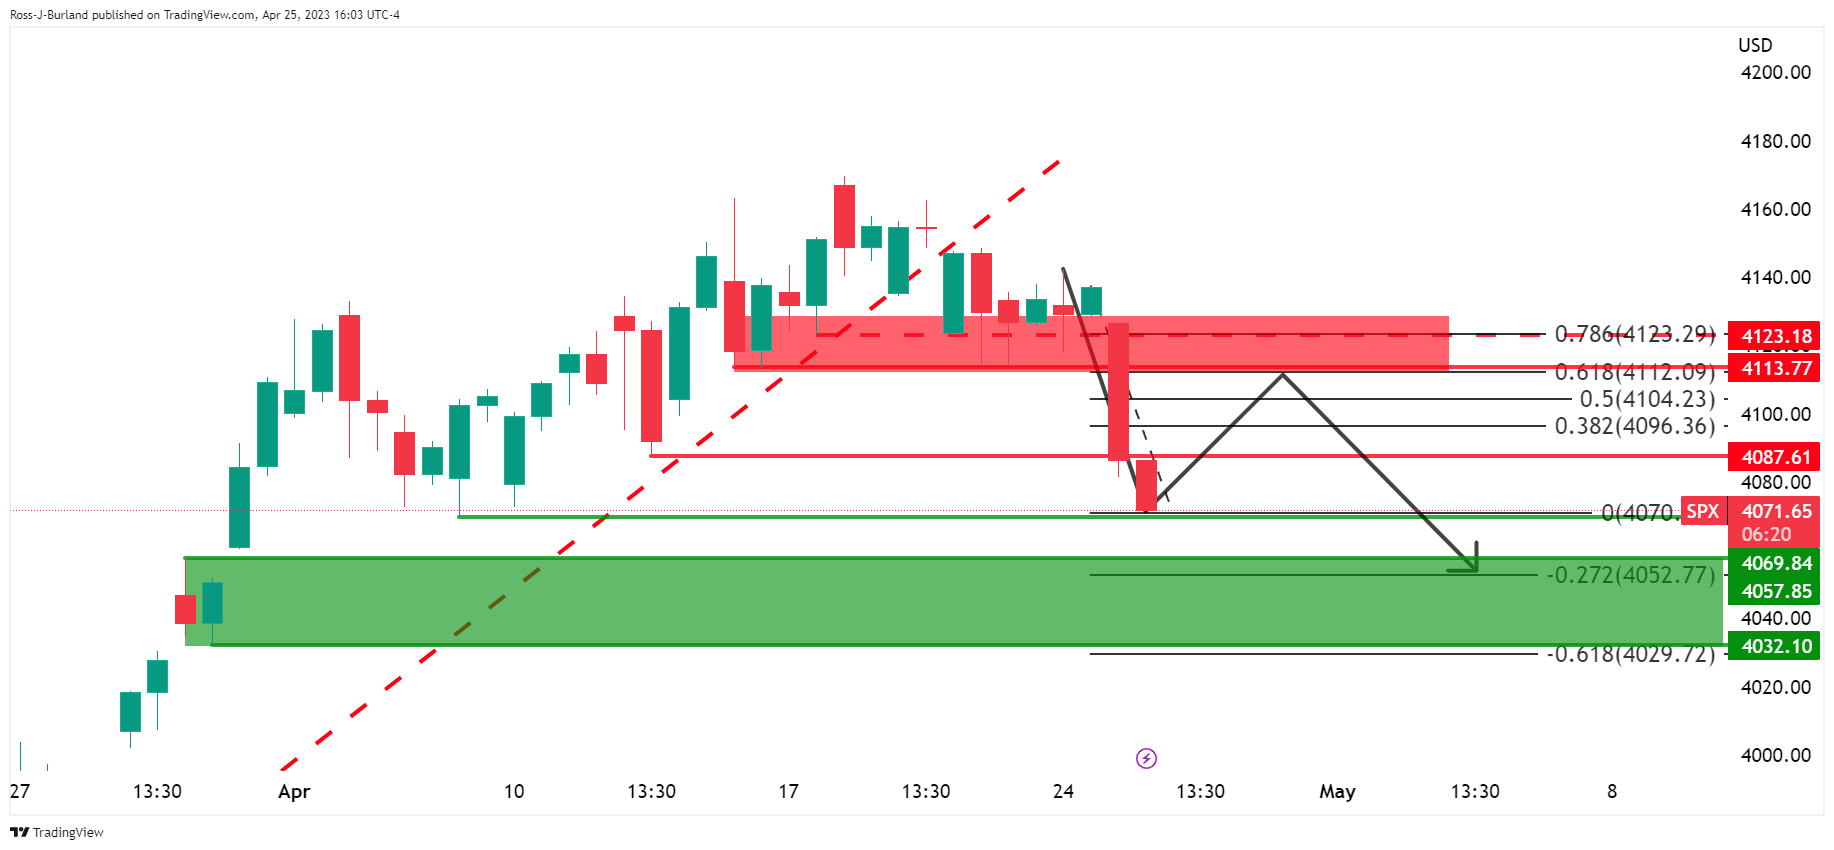
The S&P 500 index has broken structure on the backside of the prior supporting trendline and is embarking on a test of the 4,069 critical support. A pullback could be on the cards at this juncture from such a major support level:
-
20:20
USD/MXN flashes signs of recovery and climbs above 18.1000 on risk aversion
- USD/MXN rallies on sentiment deterioration, triggering flows toward the safety of the US Dollar.
- Reports by Federal Reserve’s Regional Banks showed the US economy is stagnating.
- Banxico is set to pause its tightening cycle, as the latest inflation report in Mexico showed that prices are easing.
The USD/MXN shows flashes of recovery and rallies more than 0.70% on sentiment deterioration, thus denting appetite for the emerging market currency, the Mexican Peso (MXN). The First Republic Bank, which took over the troubled Silicon Valley Bank (SVB), missed estimates and reignited March’s fears of a banking crisis. Therefore, the USD/MXN climbed and is trading at 18.1057.
USD/MXN sees rally on sentiment downturn as Banxico pauses tightening cycle amid easing inflation
Wall Street is set to finish the day with substantial losses. Reports that First Republic Bank witnessed greater-than-expected withdrawals in the first quarter turned the mood sour. Several Federal Reserve (Fed) Regional Banks released their Manufacturing and Services Indices, indicating that the slowdown in the US economy is persisting. Moreover, the Conference Board (CB) released the Consumer Confidence report for April, which was lower than the estimated 104 at 101.3. The report revealed that consumers are increasingly pessimistic about the economy and expect the labor market to weaken.
The USD/MXN reacted upwards once the North American session began, bouncing from daily lows at around 17.9504 and rising towards the daily high at 18.1444 before stabilizing around current exchange rates.
In the meantime, the greenback appreciated, as shown by the US Dollar Index (DXY) gaining 0.53$, at 101.942, despite US Treasury bond yields falling. The CME FedWatch Tool indicates that the odds for a 25 bps rate hike at the May meeting diminished from 84% in the early New York session to 76.6%.
In other data, US New Home Sales in March rose by 683K above estimates of 632K, a signal that easing mortgage rates is helping curb the housing market.
Due to the lack of economic data in the Mexican economic agenda, the latest inflation report showed that it slowed down to 6.24% in April, its lowest level since October 2021. Nevertheless, core inflation remained at 7.75% for the first half of April, suggesting that the Bank of Mexico (Banxico) could pause its tightening cycle.
USD/MXN Technical Analysis
The USD/MXN continues tracking the 20-day EMA at 18.1170, as its dynamic resistance for the last couple of weeks. As of writing, it’s bracing to the EMA abovementioned, though it would need a daily close above it, to pave the way for further upside. If that scenario continues, the USD/MXN’s next resistance would be the 50-day EMA At 18.3222, followed by the April MTD high at 18.4010. Conversely, the USD/MXN could dip towards 18.0000 before testing the daily low at 17.9505.
-
20:10
USD/JPY Price Analysis: Bears in the market, eye the 133.20s
- USD/JPYs 1-hour chart shows the price is on the front side of the bearish trendline.
- The 133.70s and resistance could see any correction back under pressure.
- A subsequent move to the 133.20s could be on the cards.
Risk sentiment has soured and combined with falling longer-term US Treasury yields has led to a bid in the Yen that has started to see a topping in USD/JPY´s rally. However, as the following analysis illustrates, the price is still on the front side of the bullish trend on the longer-term outlook which leaves 132.00 key in this regard,
USD/JPY daily charts
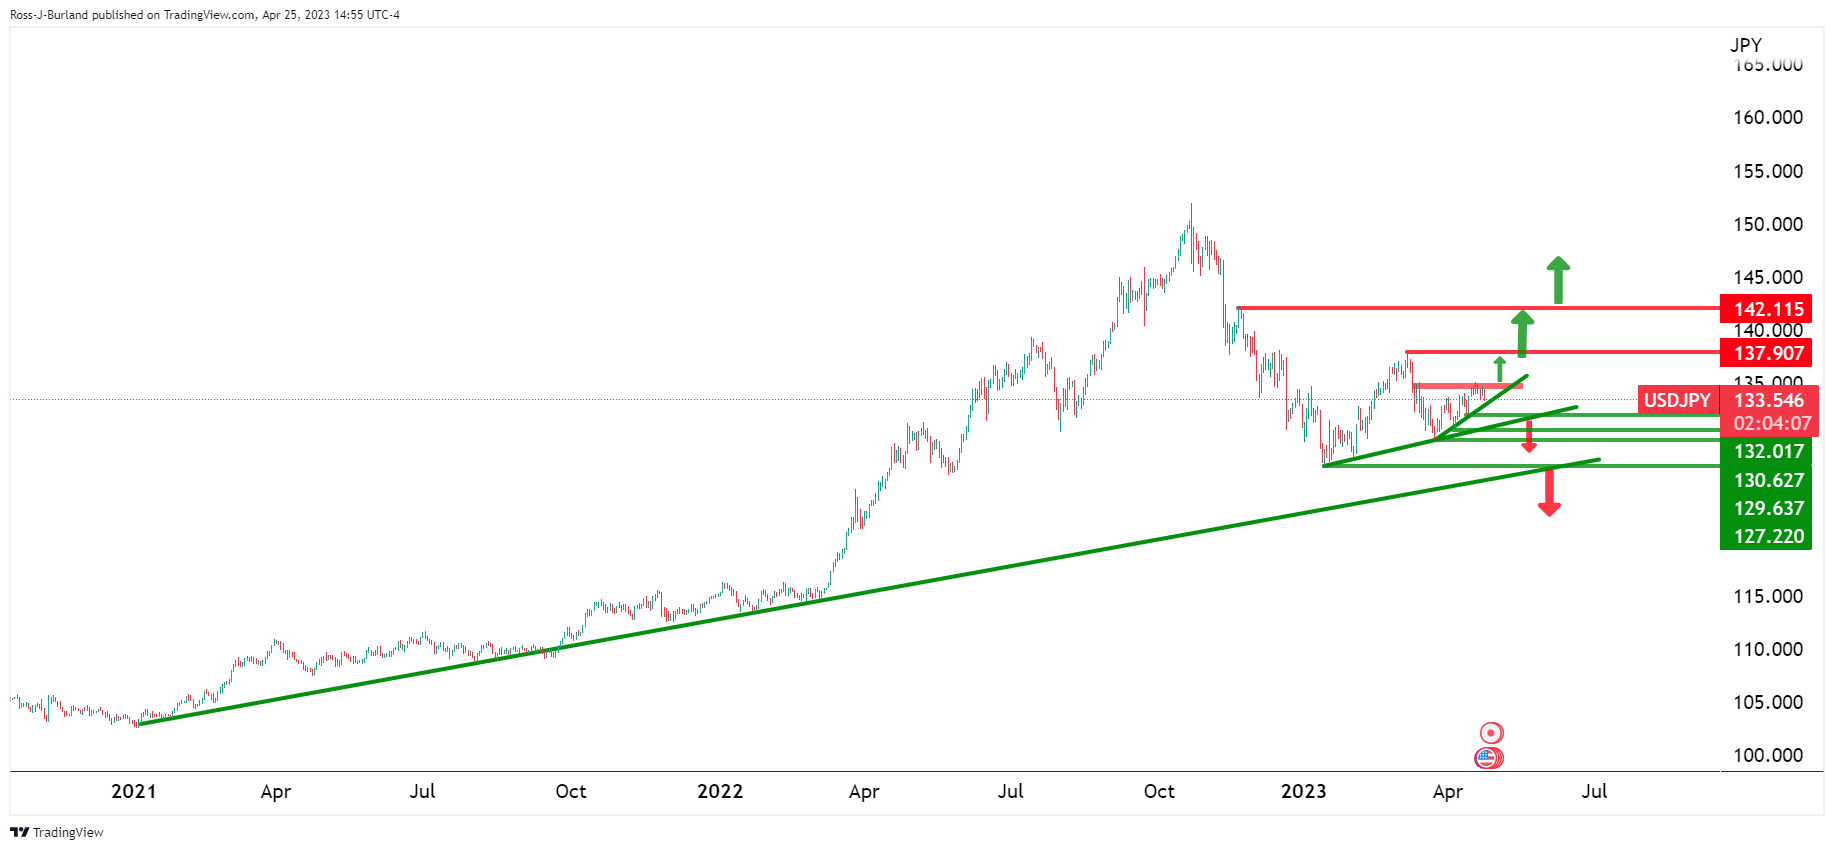

Nevertheless, the price is meeting daily resistance and the bears are in the market. A break of the daily micro trendline support opens risks of a test of 132.00 and then the 130.60s. Below there, 129.60s and 127.20s will be eyed.
USD/JPY H4 charts

The market is still front side, of the bullish trend as shown above.
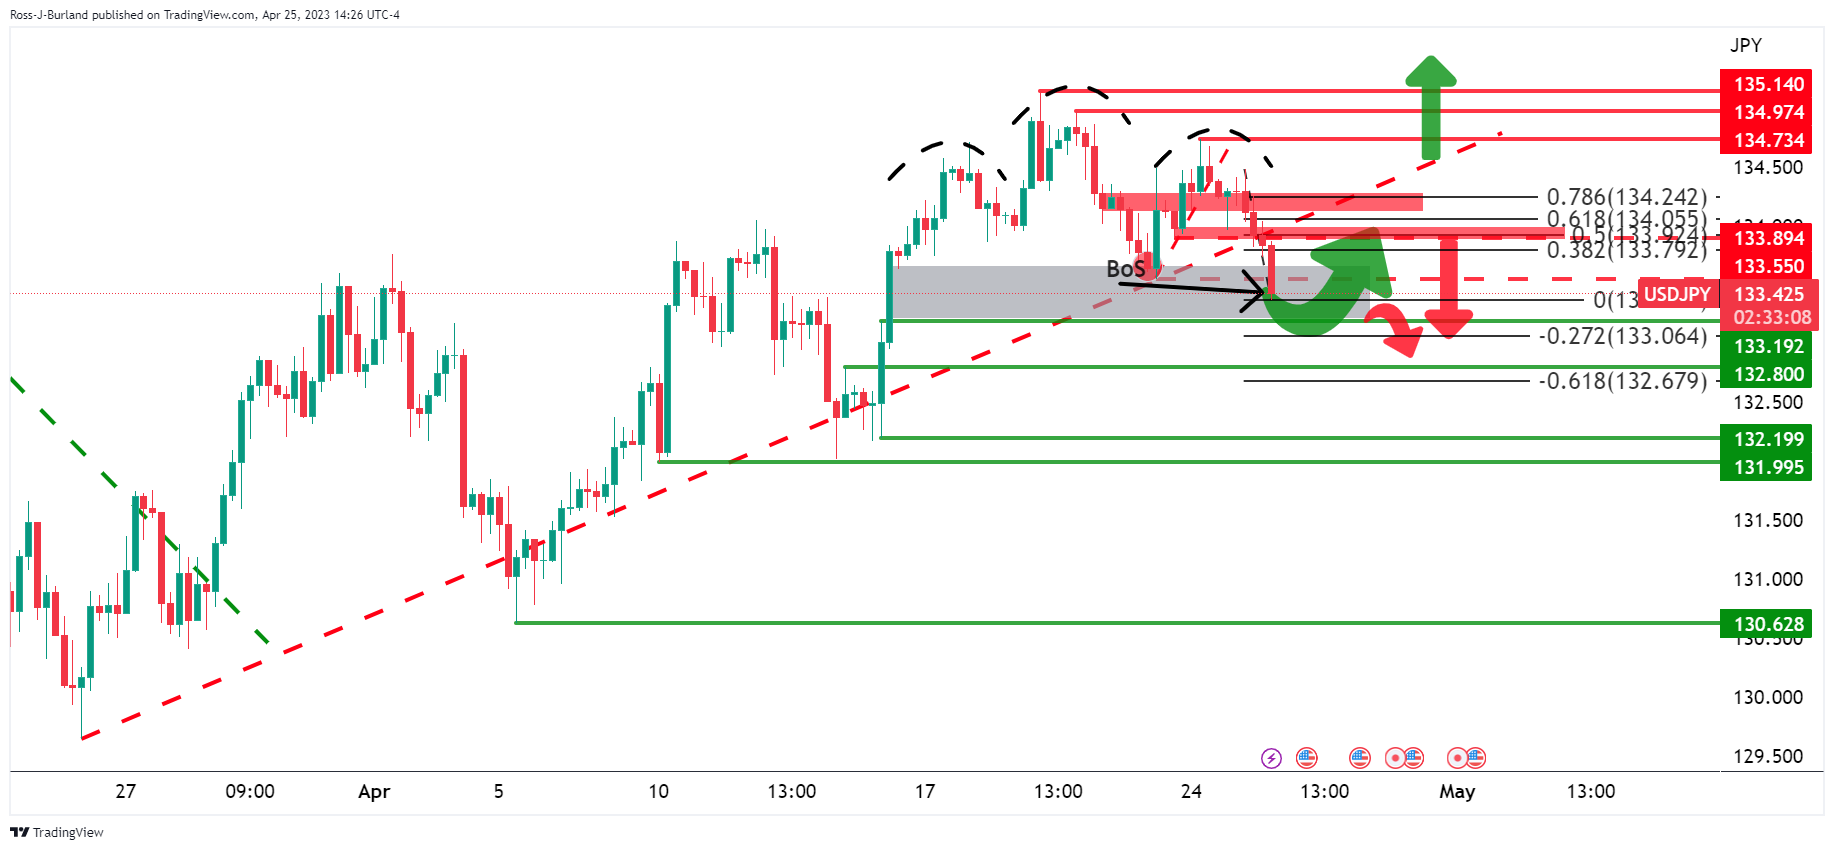
However, we have seen a break in structure, BoS, 133.42. The head and shoulders leave the outlook bearish for the meanwhile while below the 78.6% Fibonacci near 134.25. Nevertheless, bears could be encouraged to reengage below there.
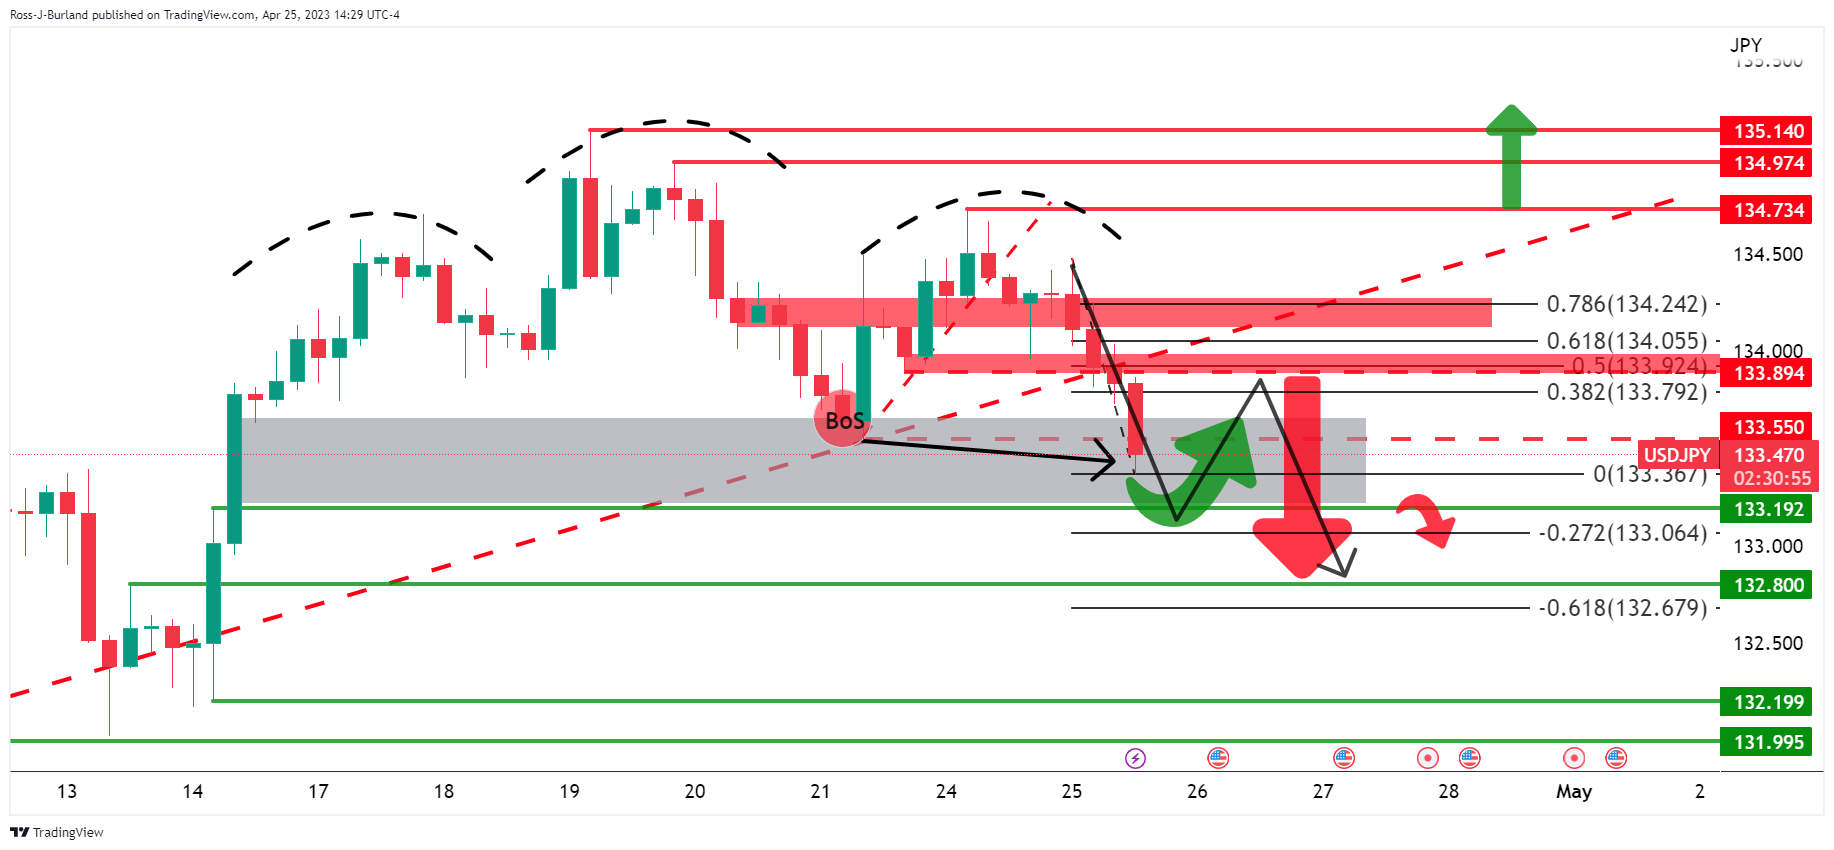
A correction into the 50% mean reversion area near 133.90 could be met by supply for an onward bearish breakdown.
USD/JPY H1 chart
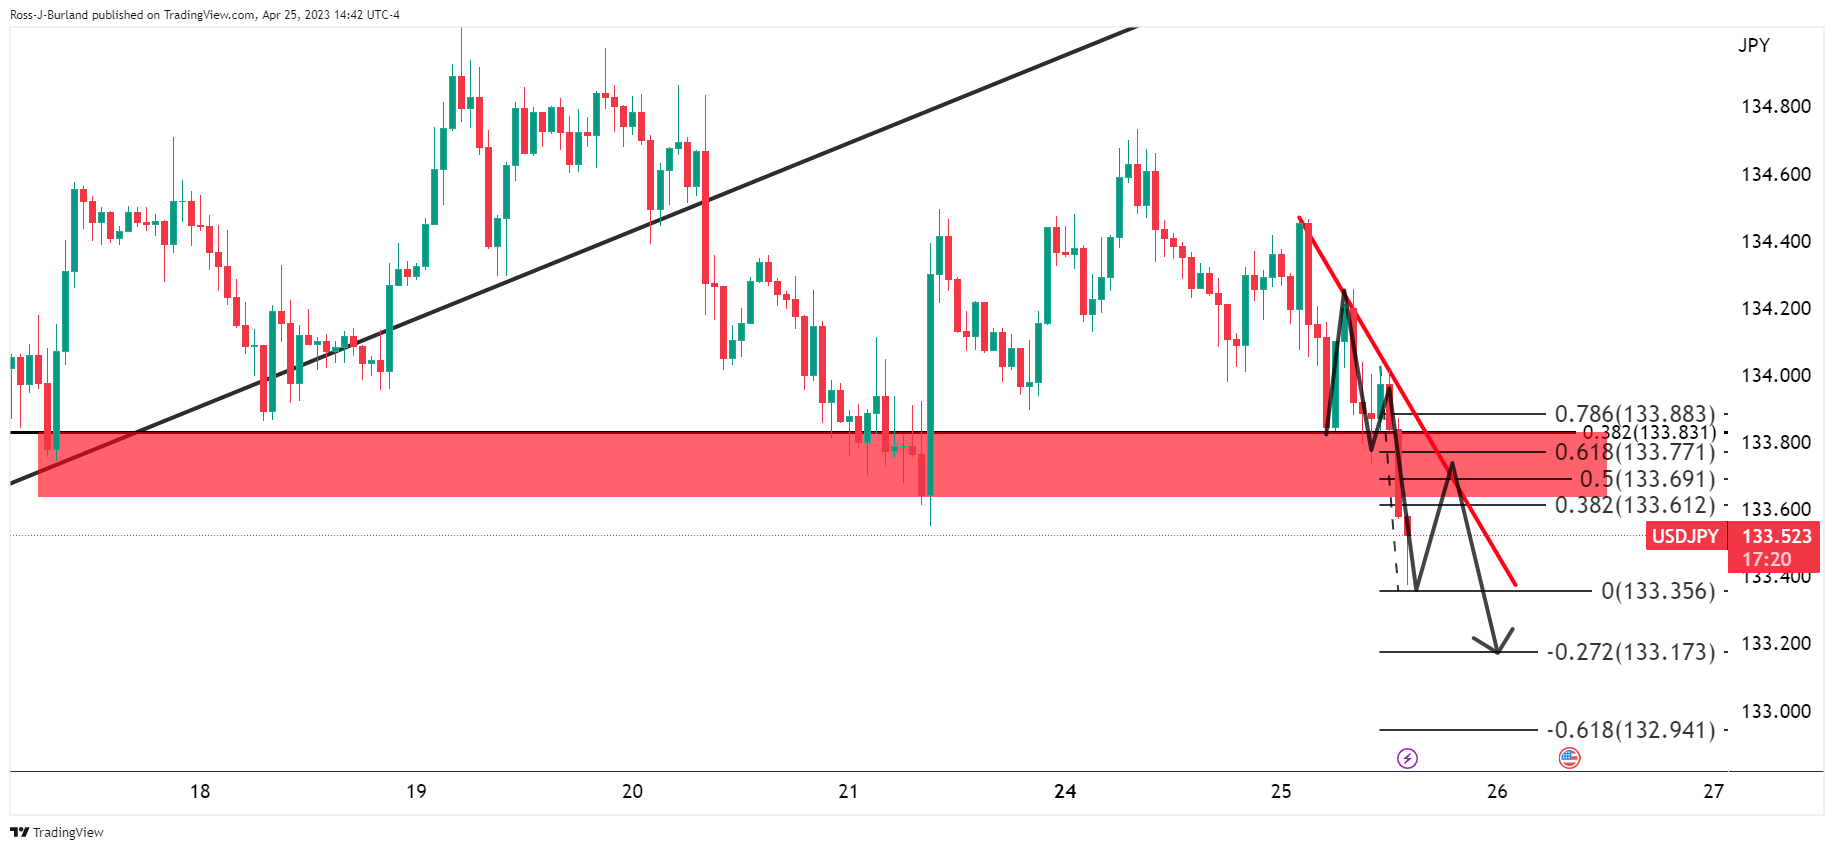
On the 1-hour chart, the price is on the front side of the bearish trendline and the M-formation´s neckline aligns with the 133.70s and resistance. A subsequent move to the 133.20s could be on the cards if the bears stay committed over the coming sessions.
-
18:49
USD/CAD bulls eye a run towards 1.3700 as risk sentiment sours
- Risk sentiment has soured as banking worries resurface, resulting in a resurgence in the US Dollar.
- USD/CAD bulls drive toward the falling wedge target.
USD/CAD rallied on Tuesday from a low of 1.3524 to a high of 1.3637 and is up over 0.7% on the day. The US Dollar is firmly bid as risk sentiment soured in Europe on returning banking worries and is sinking all ships with the high beta currencies, such as CAd, taking the brunt of it.
The US Dollar index, DXY, was last up 0.6% at 101.92, a touch off the highs at 101.949 that were bourne out of worrying earnings from First Republic Bank and UBS. Plunging deposits at First Republic Bank have reignited worries over the health of the banking sector and UBS reporting a 52% slide in quarterly income as it prepares to swallow fallen rival Credit Suisse has not helped to encourage any hunger for risk in the financial markets.
Meanwhile, the price of oil, one of Canada's major exports, has dropped with WTI falling from a high of $79.02bbls to a low of $76.57bbls. US Dollar strength today is pressuring energy prices and the concerns that a slowdown in the global economy will curb energy demand are weighing on the black gold which is hurtling towards the OPEC production cut bullish gap´s origin near $75.65bbls, WTI.
Domestically, the Bank of Canada is due to release its monetary policy deliberations for the April 12 interest rate decision on Wednesday and these will be parsed for any indication of a lower bar to resume tightening after the more hawkish messaging over the last two weeks, analysts at TD Securities explained. The analysts added that the BoC´s governor, Tiff Macklem, has already acknowledged discussing hikes in his media roundtable, and argued that ´´a more hawkish tone from the minutes could see markets price a higher probability of additional rate hikes in upcoming BoC meetings.´´
To note, the central bank left its benchmark rate on hold for a second straight meeting at a 15-year high of 4.50% and raised its growth forecast for 2023 to 1.4% from 1.0% in January.
USD/CAD technical analysis
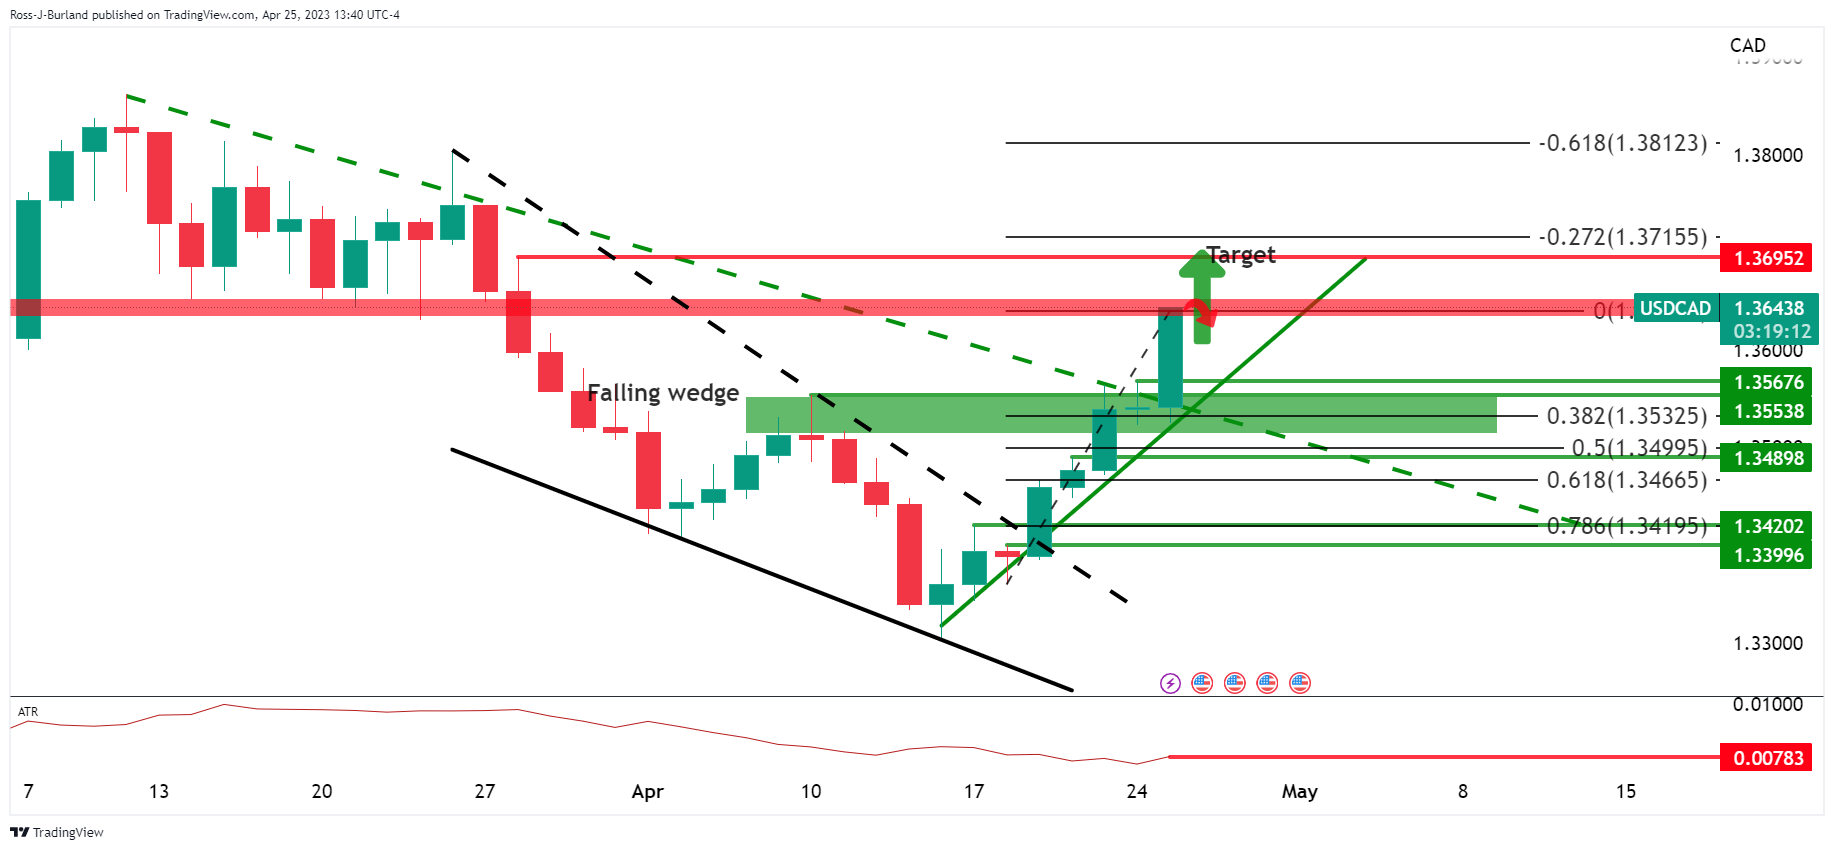
Adverse risk sentiment and the subsequent rally in the Greenback on Tuesday have propelled the price toward the target without looking back. USD/CAD has broken old trendline resistance that would now be expected to act as a counter-trendline for the bulls to lean against should there be a meanwhile and significant correction.
However, the daily candle is a strong momentum candle so if there is profit-taking at the end of the day, then a correction may only be a shallow one leaving a small wick. We could see the bulls re-engaged for the next bullish impulse on Wednesday to the target, 1.3695. This is well within reach for a single day considering the daily ATR of 78 pips.
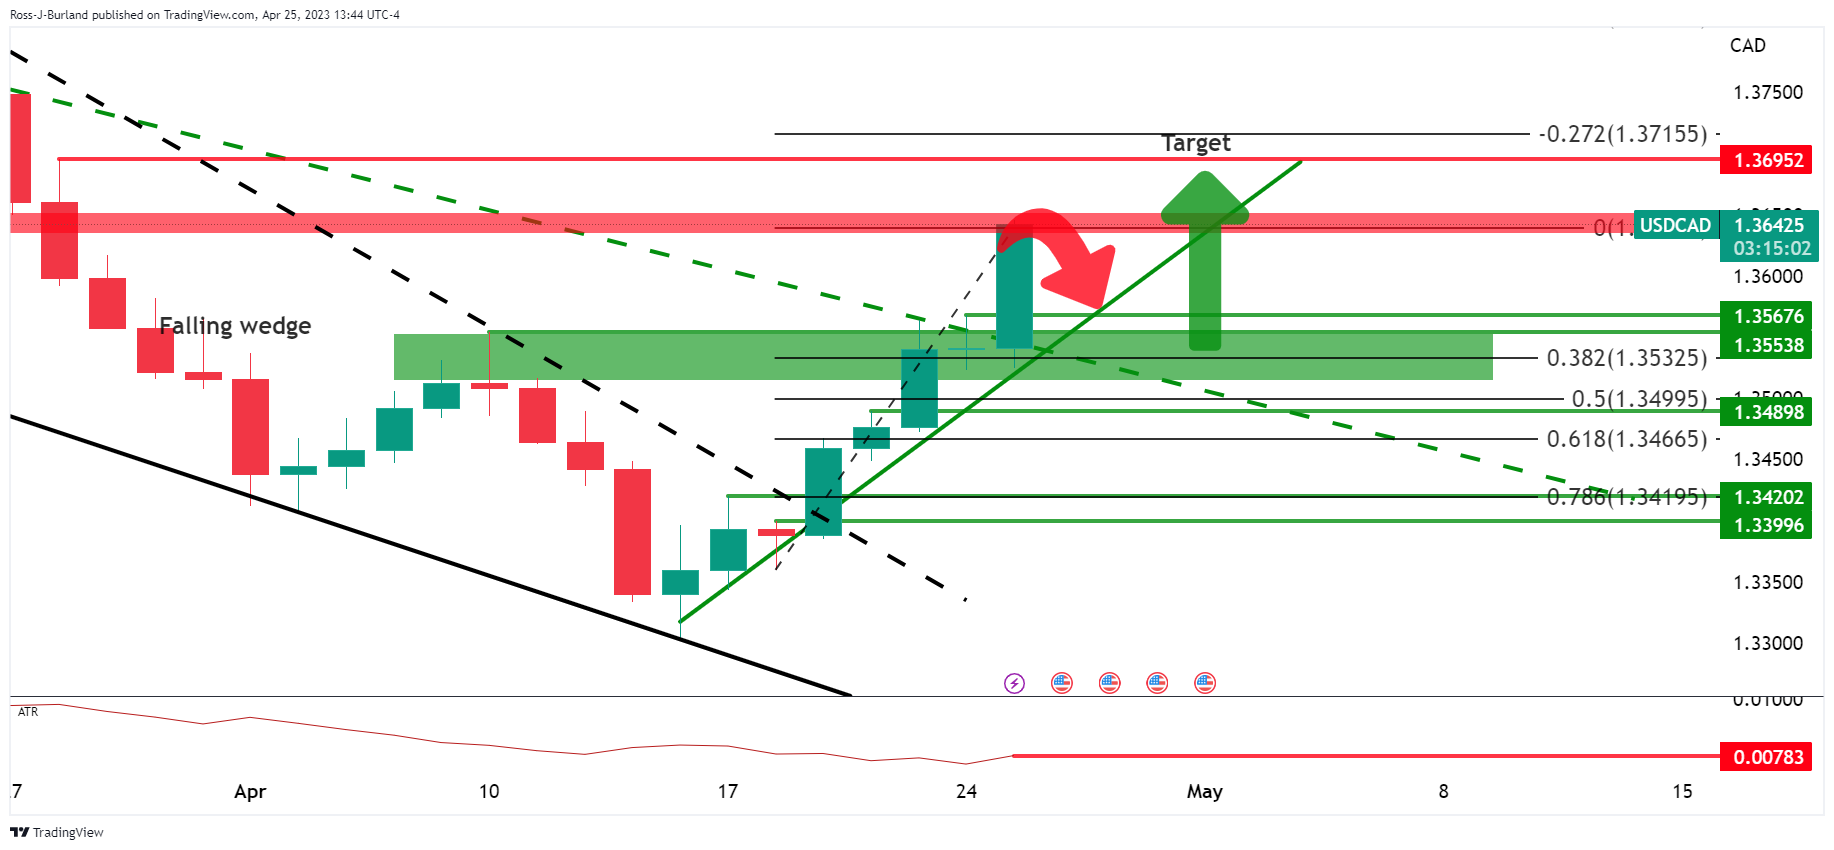
With that being said, a firmer correction would leave the trendline support and then 1.3570, 1.3550 and the 38.2% Fibonacci at 1.3532 ahead of a 50% mean reversion near 1.3500 at risk:
-
18:41
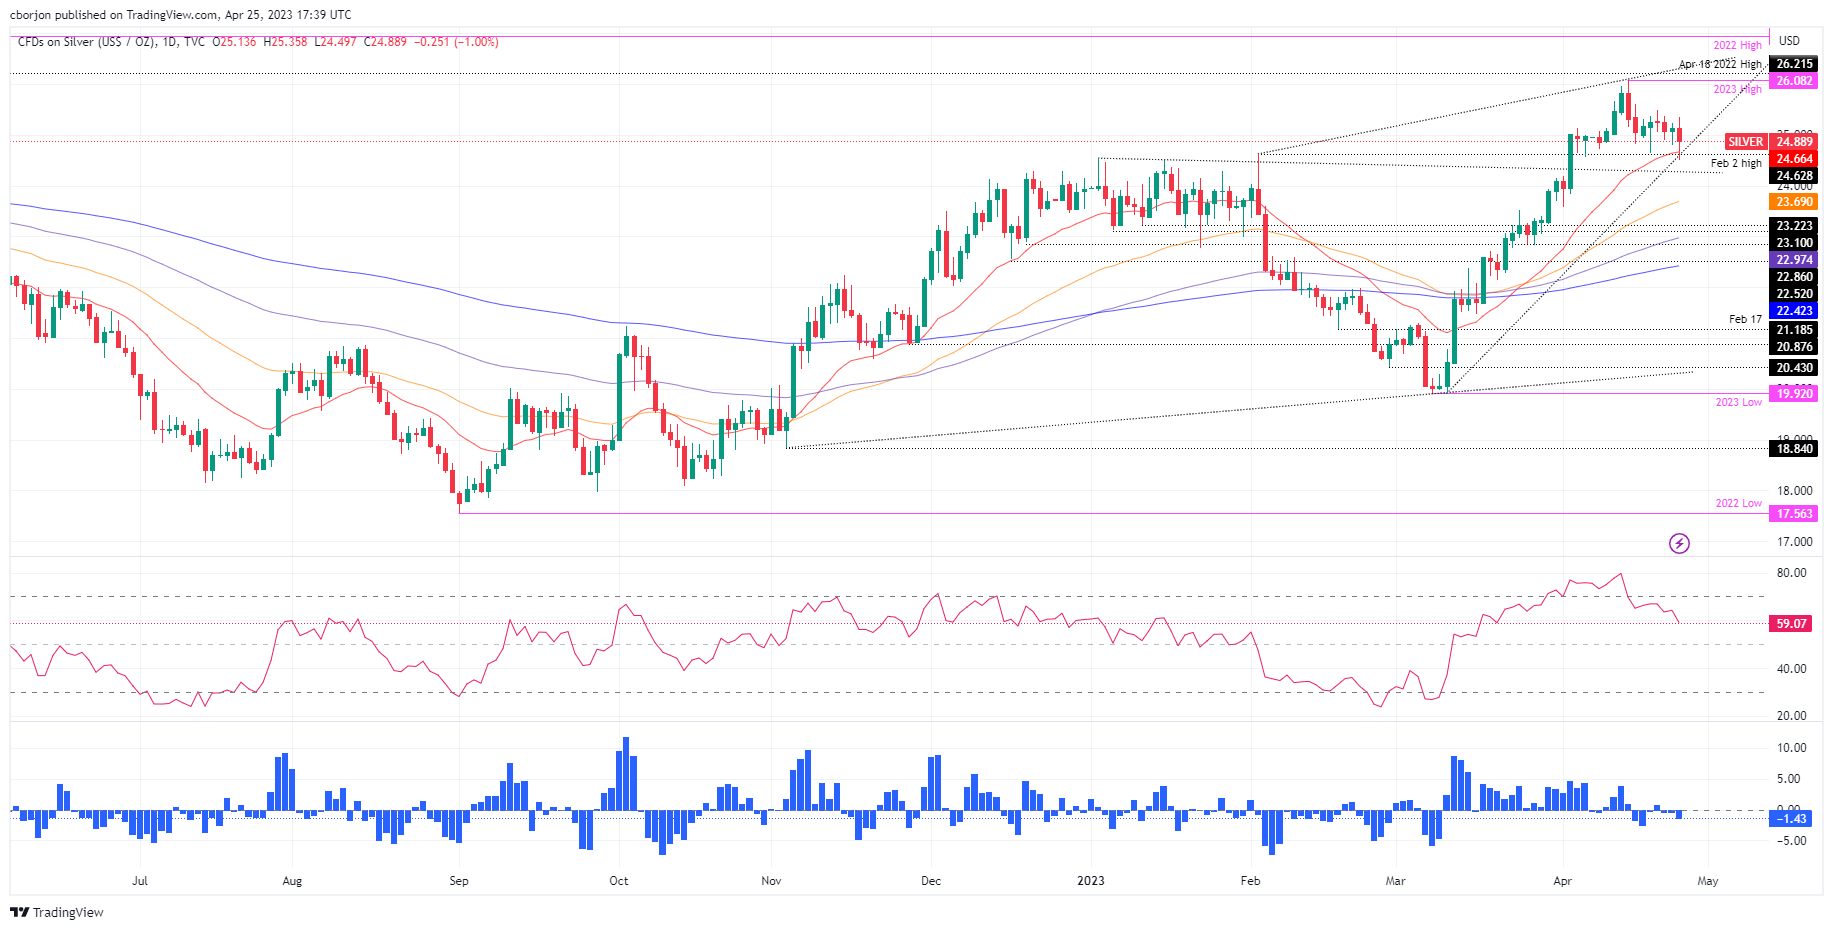
Silver Price Analysis: XAG/USD drops to three-week lows below $25.00, heading for a pullback
- XAG/USD breaks below the $25.00-$25.50 range, though a daily close could pave the way for further downside.
- XAG/USD Price Analysis: Oscillators suggest that sellers are regaining control; therefore, a fall toward $24.00 is likely.
Silver price slides beneath the $25.00 figure after printing a daily high earlier at around $25.36. Though flows toward the US Dollar (USD) exacerbated a fall toward the 20-day Exponential Moving Average (EMA) at around current prices. At the time of writing, the XAG/USD is trading at $24.86.
XAG/USD Price Action
The XAG/USD remains upward biased due to solid support at the 20-day EMA at $24.65. After piercing the latter, the XAG/USD jumped towards the $24.70s area, though oscillators tell a different story. The Relative Strength Index (RSI) aims downward, approaching the 50-mid line, which, once crossed, would indicate that sellers regained control. Also, the Rate of Change (RoC) shows that selling pressure has increased in the last three days. Hence, the XAG/USD is set for a pullback before resuming its uptrend.
The XAG/USD’s next support would be the April 25 daily low at $24.49. A breach of the latter will expose the psychological $24.00 level. Once cleared, the 50-day EMA at $23.69 would be tested, with the 100-day EMA up at $22.97.
Conversely, if XAG/USD cracks and achieves a daily close above $25.00, traders could expect further consolidation between $25.00-$25.50, as it has happened during the last four trading days.
XAG/USD Daily Chart
-
18:31
US Dollar still heading toward a depreciation path longer term – Wells Fargo
Analysts at Wells Fargo point out the US Dollar can trade around current levels during the second quarter, and see it depreciating during the second half of 2023.
Key quotes:
“The U.S. dollar is experiencing multiple cross-currents that can result in a stable greenback through the end of Q2-2023. Longer term, we believe the Fed will lower interest rates more aggressively than peer central banks, which can place broad depreciation pressure on the dollar over the second half of 2023 and into 2024.”
“We also believe emerging market currencies can continue to experience widespread currency strength going forward, with the best opportunities existing within high yielding currencies in Latin America and Emerging Europe.”
-
18:04
EUR/USD plummets below 1.1000 amid decelerating US economy and banking crisis fears
- US Consumer Confidence fell to its lowest level since July 2022.
- Economic activity reports by Regional Fed Banks portray a gloomy outlook for the US economy.
- ECB sources commented that the EU’s central bank is tilting towards a 25 bps rate hike.
EUR/USD dropped below the 1.1000 figure as risk aversion took center stage in Tuesday’s session. Successive reports that the economy in the United States (US) is decelerating, and reignited fears of March’s banking crisis, triggered a flight to safety. Therefore, the EUR/USD pair is trading at 1.0971, below after hitting a daily high of 1.1067, down 0.68%.
US Consumer Confidence hits new low as gloomy economic outlook persists, ECB hints a rate hike
Several Federal Reserve’s (Fed) Regional Banks revealed their Manufacturing and Services related Indices, with most reports suggesting an ongoing deceleration across the country. Additionally, the latest Consumer Confidence report for April, announced by the Conference Board (CB), came at 101.3, below the 104 estimated. The survey showed that consumers are becoming pessimistic about the economy, expecting the labor market to soften. That said, recessionary fears triggered flows toward the US Dollar; thus, the EUR/USD weakened.
The US Dollar Index (DXY), a measure of the American Dollar value against a basket of currencies, edged up 0.63%, at 101.942, even though US Treasury bond yields are collapsing. Odds that the Fed will hike 25 bps at the upcoming May meeting are at 84%, as reported by the CME FedWatch Tool. The report showed that investors are bracing for 50 bps rate cuts by the end of 2023.
In other data, US New Home Sales in March rose by 683K above estimates of 632K, a signal that easing mortgage rates is helping curb the housing market.
Across the pond, the Eurozone (EU) docket was empty, though late comments from European Central Bank (ECB) officials suggest at least a 25 bps interest rate increase is on the cards. The ECB Chief Economist Philip Lane noted that current data indicate a raise of rates is needed, though and guided that further hikes will depend on data. Later, Francois Villeroy added that inflation is at its peak and will reach the ECB’s target by the end of 2024.
Of late, some ECB insiders noted that the next meeting is tilting towards a 25 bps rate hike, but a negative print on April’s inflation could trigger a 50 bps rate hike, according to Econostream.
EUR/USD Technical Analysis
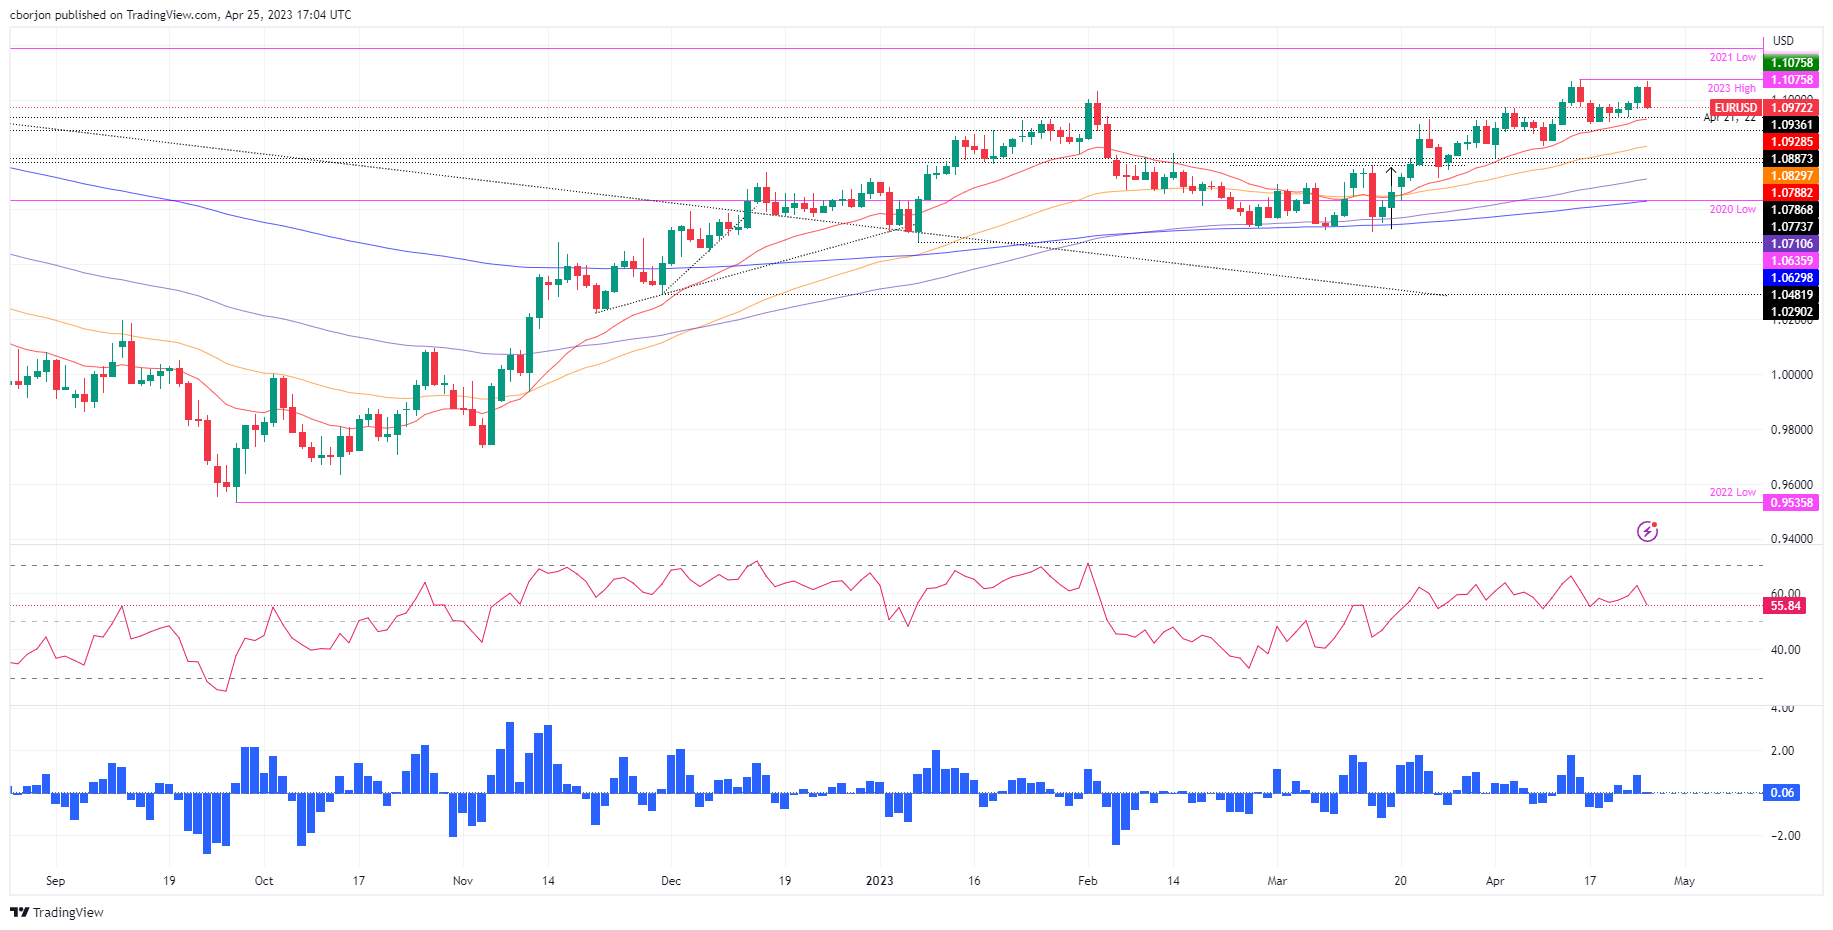
The EUR/USD is forming a bearish-engulfing candle pattern, suggesting that sellers outweigh buyers at the time of writing. However, a daily close below April 24 open price at 1.0990 is needed to pave the way for a pullback. Once that scenario plays out, the EUR/USD first support would be the 20-day Exponential Moving Average (EMA) at 1.0928. A breach of the latter will expose the April 17 cycle low at 1.0900. the EUR/USD’s next floor will be the confluence of the April 10 low and the 50-day EMA at around 1.0829/31 before slipping towards 1.0800.
-
18:03
United States 2-Year Note Auction increased to 3.969% from previous 3.954%
-
16:47
AUD/USD extends slide below 0.6630, hits two-week lows
- Australian Dollar falls as Wall Street wavers.
- US Dollar gains momentum despite lower US yields.
- AUD/USD under pressure, testing level under the 0.6630 support.
The AUD/USD is falling sharply on Tuesday amid a stronger US Dollar and a mixed market sentiment. The pair is trading at 0.6627, the lowest level since April 11. It is testing a relevant support area at 0.6630.
AUD under pressure ahead of Australian inflation
The AUD/USD started to decline on Asian hours, as Iron one prices continued to sink. After a pause, the pair resumed the decline amid US Dollar strength. The US Dollar Index is up by 0.50%, above 101.80, about to test Monday’s highs.
The Greenback is rising even as US yields decline. Such behavior reflects more demand for safety. In Wall Street, stocks are falling with the Dow Jones down 0.39% and the Nasdaq 1%, amid mixed US data and renewed banking concerns.
US data released on Tuesday showed an increase in the S&P/Case-Shiller Home Price Index in February of 0.4% from a year ago; a 9.6% surge in New Home Sales in March and a decline to six-month lows in CB Consumer Confidence in April.
On Wednesday, Australia will report inflation data. The consensus is for the Consumer Price Index to have risen 1.3% in the first quarter; and for the annual rate to decline from 6.8% in February to 6.6% in March. Those numbers will be relevant ahead of next week’s Reserve Bank of Australia meeting.
Testing 0.6630
The AUD/USD bottomed at 0.6627. It is testing levels below the 0.6630 support area. A consolidation below that zone would expose 0.6600. A break lower would target the March low at 0.6560.
A recovery above 0.6670 would alleviate the bearish pressure. The next resistance is 0.6710.
Technical levels
-
16:33
GBP/USD sinks from weekly high as risk aversion takes hold
- US Consumer Confidence continued deteriorating as Americans became more “pessimistic” about the economic outlook.
- Federal Reserve Regional Manufacturing and Services Indices show mixed readings, though flashing a deceleration in the US economy.
- BoE Chief Economist says Brits need to accept they’re “poorer”; calls for higher rates to tackle inflation.
GBP/USD reverses its earlier course after hitting a weekly high of 1.2507 and drops towards the 1.2400 figure amidst a risk-off impulse that triggered flows towards safe-haven assets. Therefore, the US Dollar (USD) remains in the driver’s seat, although US Treasury bond yields are collapsing. The GBP/USD is trading at 1.2401, down 0.67%.
US Consumer Confidence Drops, Fed’s Manufacturing and Services Indices Decelerate, BoE Chief Economist Urges Higher Rates
Sentiment remains deteriorating as the latest tranche of economic data from the United States (US) increased investors’ worries. Consumer Confidence in the United States dipped to its lowest level since July at 101.3, vs. estimates of 104.0. “Consumers became more pessimistic about the outlook for both business conditions and labor markets,” said Ataman Ozyildirim, senior director of economics at the Conference Board.
Further data, like the Philadelphia Fed Non-Manufacturing Activity plunging to -22.8, sparked recessionary fears. Of late, the Dallas Fed revealed the Services Activity Index for April, showing a slight improvement, to -14.4 vs. -18.8 in March, after yesterday’s report showed that the Manufacturing Index plunged to -23.4, as business conditions worsened.
Other data revealed that New Home Sales for March rose by 9.6%, exceeding 1.1% estimates, as increasing speculation that the Federal Reserve will pause its tightening cycle has kept mortgage rates stable.
Given the backdrop, the GBP/USD extended its losses due to risk aversion, even though US Treasury bond yields are plunging. Conversely, the greenback is rising 0.48%, as shown by the US Dollar Index at 101.815.
Across the pond, the UK agenda revealed the CBI Industrial Trend Order, which stood at -20, neither improving nor worsening, though flashed that the economy is stagnating. Meanwhile, the Bank of England (BoE) Governor Ben Broadbent commented that there’s no evidence that QE sparked the jump in inflation.
Of late, the BoE Chief Economist Huw Pill commented that British people need to accept that they are “poorer.” Pill added that recent events call for higher rates and foresees UK’s inflation would dip to 2% in two years.
GBP/USD Technical Analysis
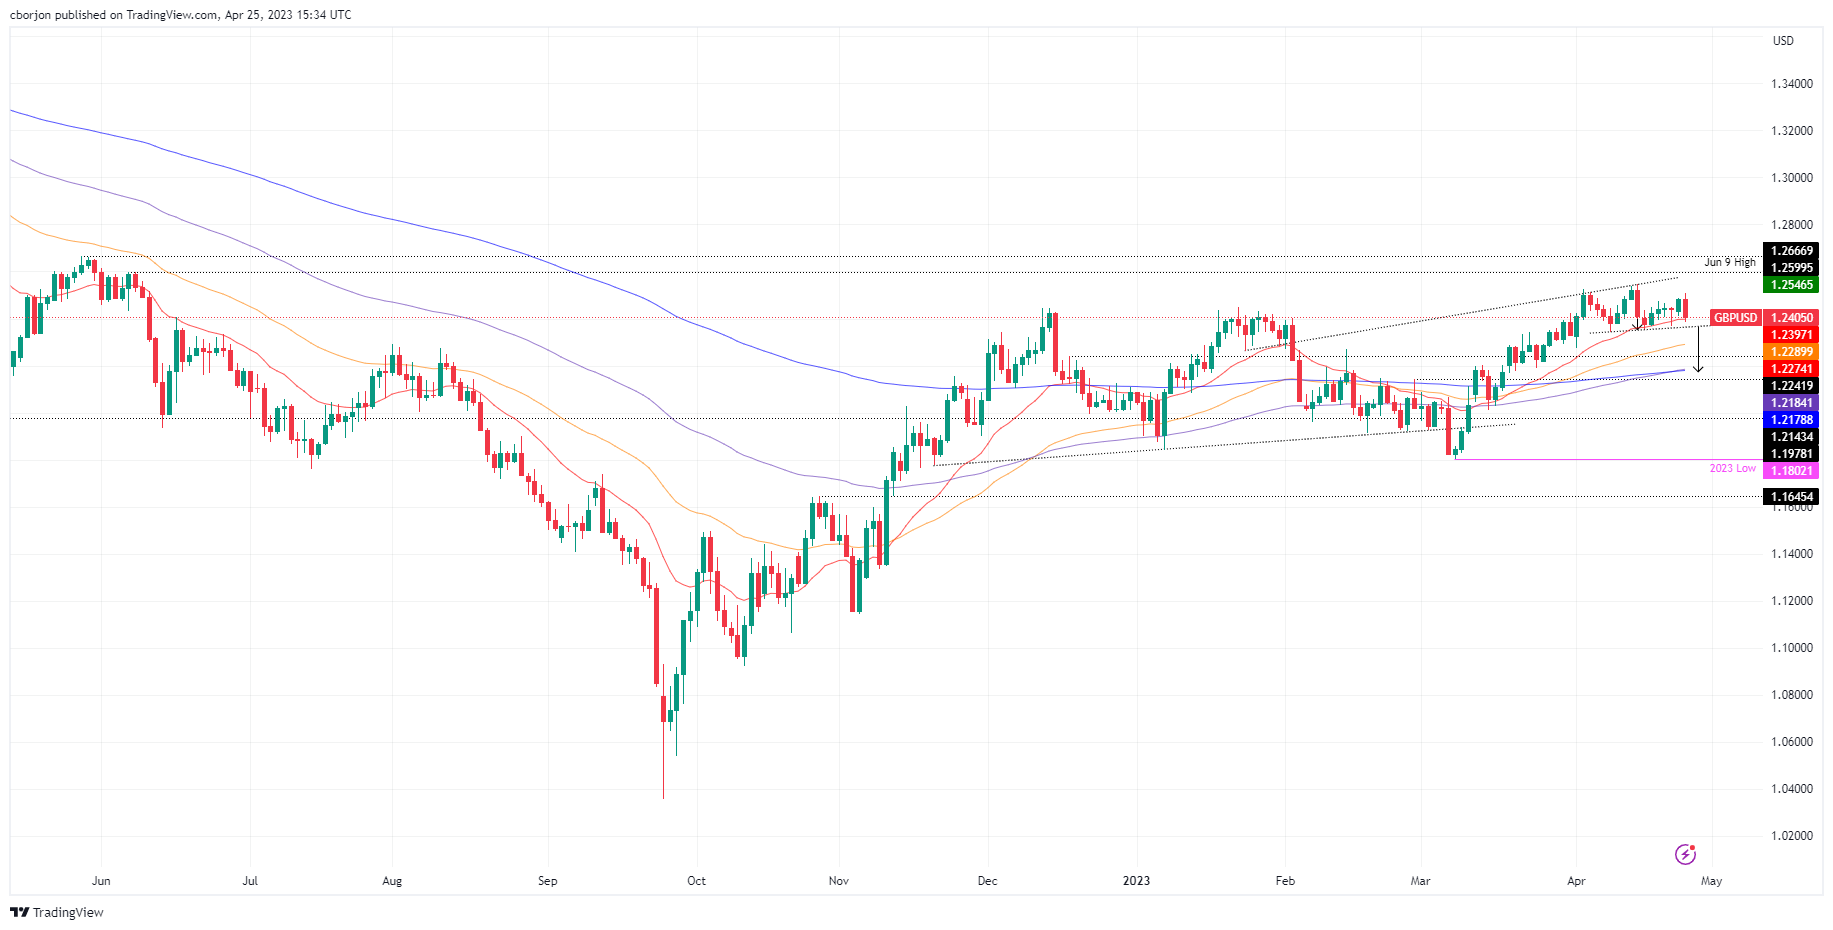
From a technical perspective, the GBP/USD appears to have formed a head-and-shoulders chart pattern that could drive prices to test the confluence of the 100 and 200-day EMAs at around 1.2170. But firstly, the GBP/USD must break below the head-and-shoulders neckline at approximately 1.2360/70, so it could confirm its validity. If that scenario plays out, the GBP/USD next support would be the 50-day EMA at 1.2289 and then the 1.2200 figure. Conversely, if GBP/USD stays above 1.2400, it could pave the way for a bullish continuation towards 1.2500.
-
15:23
US: New Home Sales rise by 9.6% in March vs. 1.1% expected
- New Home Sales in the US increase at a much stronger pace than expected in March.
- US Dollar Index extends its rebound toward 102.00.
Sales of new single‐family houses rose by 9.6% in March to a seasonally adjusted annual rate of 683,000, the data published jointly by the US Census Bureau and the Department of Housing and Urban Development showed on Tuesday.
This reading followed February's decline of 3.9% came in much better than the market expectation for an increase of 1.1%.
Market reaction
The US Dollar continues to gather strength in the American session and the US Dollar Index was last seen rising 0.5% on the day at 101.85.
-
15:08
US: CB Consumer Confidence Index declines to 101.3 in April from 104 in March
- CB Consumer Confidence Index declined slightly in April.
- US Dollar Index clings to daily recovery gains above 101.50.
Consumer sentiment in the US weakened modestly in April with the Conference Board's Consumer Confidence Index edging lower to 101.3 from 104.0 in March (revised from 104.2).
Further details of the publication revealed that the Present Situation Index improved modestly to 151.1 from 148.9 and the Consumer Expectations Index declined to 68.1 from 74.
Finally, the one-year consumer inflation expectations ticked down to 6.2% in April from 6.3% in March.
Market reaction
The US Dollar Index extends its rebound after this data and was last seen rising 0.4% on the day at 101.72.
-
15:00
United States Richmond Fed Manufacturing Index below forecasts (-9) in April: Actual (-10)
-
15:00
United States New Home Sales Change (MoM) above forecasts (1.1%) in March: Actual (9.6%)
-
15:00
United States New Home Sales (MoM) came in at 0.683M, above forecasts (0.634M) in March
-
14:51
USD Index climbs to daily highs near 101.60 as risk-off prevails
- The index gathers extra pace and revisits the 101.60 zone.
- The resurgence of the risk aversion underpins the US Dollar.
- Next on tap in the docket comes the CB’s Consumer Confidence.
The demand for the Greenback intensifies on the back of persistent risk aversion and lifts the USD Index (DXY) to daily highs in the 101.60/70 band on Tuesday.
USD Index stronger on risk-off mood
Banking jitters resurface and favours the re-emergence of the risk-off sentiment, which in turn morphs into extra upside pressure for the Buck.
The move higher in the index comes so far in tandem with further weakness in US yields across the curve, as the fly-to-safety feeling props up the demand for bonds on Tuesday.
Meanwhile, investors seem convinced of another 25 bps rate hike by the Federal Reserve at its meeting on May 3 amidst hawkish Fedspeak and with inflation still way above the Fed’s 2.0% target. At the same time, a source of potential weakness for the Dollar comes from rising speculation of an impasse in the Fed’s hiking cycle soon after the May event.
In the US data space, the the FHFA’s House Price Index expanded 0.5% MoM in February, while the Consumer Confidence tracked by the Conference Board and New Home Sales are due later in the NA session.
What to look for around USD
The dollar faces renewed upside pressure on the back of the re-emergence of the risk aversion mood on Tuesday.
Looking at the broader picture, the index continues to navigate in a consolidative phase against steady expectations of another rate increase in May by the Fed.
In favour of a pivot in the Fed’s hiking cycle following the May event appears the persevering disinflation and nascent weakness in some key fundamentals.
Key events in the US this week: House Price Index, CB Consumer Confidence, New Home Sales (Tuesday) – MBA Mortgage Applications, Durable Goods Orders, Advanced Goods Trade Balance (Wednesday) – Flash Q1 GDP Growth Rate, Initial Jobless Claims, Pending Home Sales (Thursday) – PCE/Core PCE, Employment Cost, Personal Income, Personal Spending, Final Michigan Consumer Sentiment (Friday).
Eminent issues on the back boiler: Persistent debate over a soft/hard landing of the US economy. Terminal Interest rate near the peak vs. speculation of rate cuts in 2024. Fed’s pivot. Geopolitical effervescence vs. Russia and China. US-China trade conflict.
USD Index relevant levels
Now, the index is gaining 0.36% at 101.68 and faces the next hurdle at 102.80 (weekly high April 10) followed by 103.05 (monthly high April 3) and then 103.23 (55-day SMA). On the flip side, the breach of 100.78 (2023 low April 14) would open the door to 100.00 (psychological level) and finally 99.81 (weekly low April 21 2022).
-
14:44
Gold Price Forecast: XAU/USD volatile, between stronger Dollar and lower Treasury yields
- Gold rebounds despite a stronger US Dollar.
- Falling US Treasury yields are helping the yellow metal.
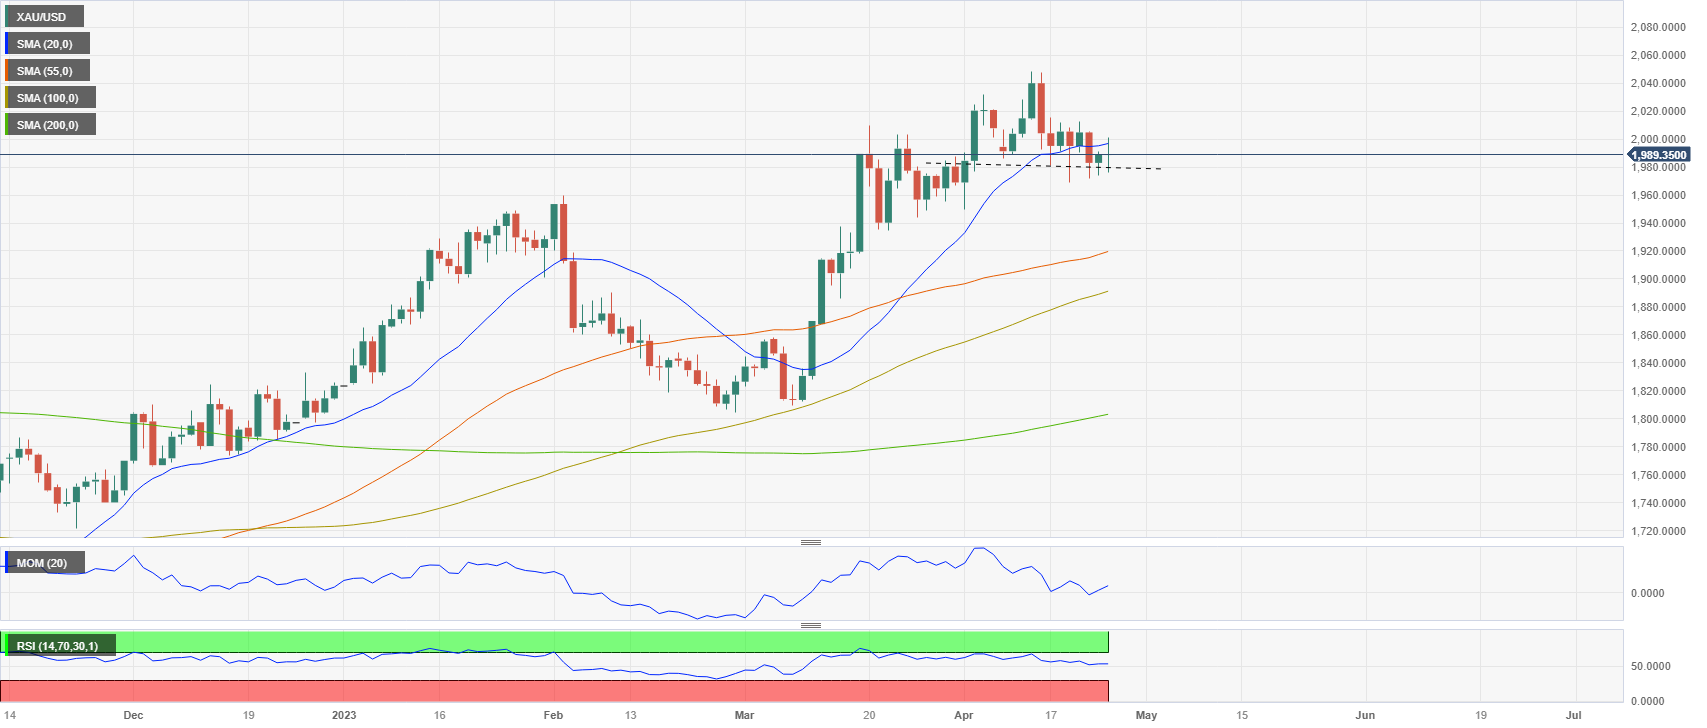
- XAU/USD remains under the 20-day SMA, keeps avoiding daily close under $1.980.
Gold price rebounded sharply during the last hour, rising more than $10. XAU/USD bottomed at $1,975 and then jumped to $1,994. As of writing, it trades at $1,987 marginally lower for the day, on a volatile session. Despite the big swings, price remains in a recent familiar range.
Gold price rebound is losing momentum as the US Dollar prints fresh daily highs across the board. The DXY is up by 0.35%, trading at 101.70. At the same time, US Treasury yields are falling again. The US 10-year yields stands at 3.43% and the 2-year at 4.03%, both at two-week lows.
The combination of a stronger US Dollar and lower Treasury yields is favoring large swings in XAU/USD. Incoming economic data from the US, particularly Q1 GDP and consumer inflation on Thursday, could add fuel to volatility.
On a wider perspective, gold is showing some signs of weakness as it remains below the 20-day Simple Moving Average (SMA) which stands near $2,000. At the same time, it has avoided a daily close under $1,980. A close under the mentioned level would point to an extension of the bearish correction.
XAU/USD Daily chart
-
14:08
Mexico: Inflation data strengthens scenario of Banxico remaining on hold – TD Securities
Data released on Monday showed inflation continues to ease in Mexico. Analysts at TD Securities point out that the numbers strengthen their scenario of the Bank of Mexico (Banxico) remaining on hold at its next monetary policy meeting.
Key quotes:
“Core inflation surprised slightly to the downside in the first half of April. This inflation component posted a 0.18% biweekly change (below the 0.22% expected by the consensus). Thus, core inflation dropped to 7.75% in annual terms from previous 8.03%.”
“We think the slight downward surprise posted by core inflation strengthens our scenario of Banxico remaining on hold in its next monetary policy meeting (May 18). In particular, the recent performance of core inflation appears in line with Banxico's Q2 forecasts (7.5%).”
-
14:05
US: Housing Price Index rises 0.5% in February vs. -0.2% expected
- House prices in the US increased modestly in February.
- US Dollar Index clings to modest daily gains slightly above 101.50.
House prices in the US rose by 0.5% on a monthly basis in February, the monthly data published by the US Federal Housing Finance Agency showed on Tuesday. This reading followed January's increase of 0.1% (revised from +0.2%) and came in better than the market expectation for a decrease of 0.2%.
Meanwhile, the S&P/Case-Shiller Home Price Index arrived at +0.4% on a yearly basis in February, down from +2.6% recorded in January.
Market reaction
These data don't seem to be having an impact on the US Dollar's performance against its rivals. As of writing, the US Dollar Index was up 0.25% on the day at 101.55.
-
14:00
United States Housing Price Index (MoM) above expectations (-0.2%) in February: Actual (0.5%)
-
14:00
United States S&P/Case-Shiller Home Price Indices (YoY) registered at 0.4% above expectations (0.1%) in February
-
13:55
United States Redbook Index (YoY): 1.8% (April 21) vs 1.1%
-
13:32
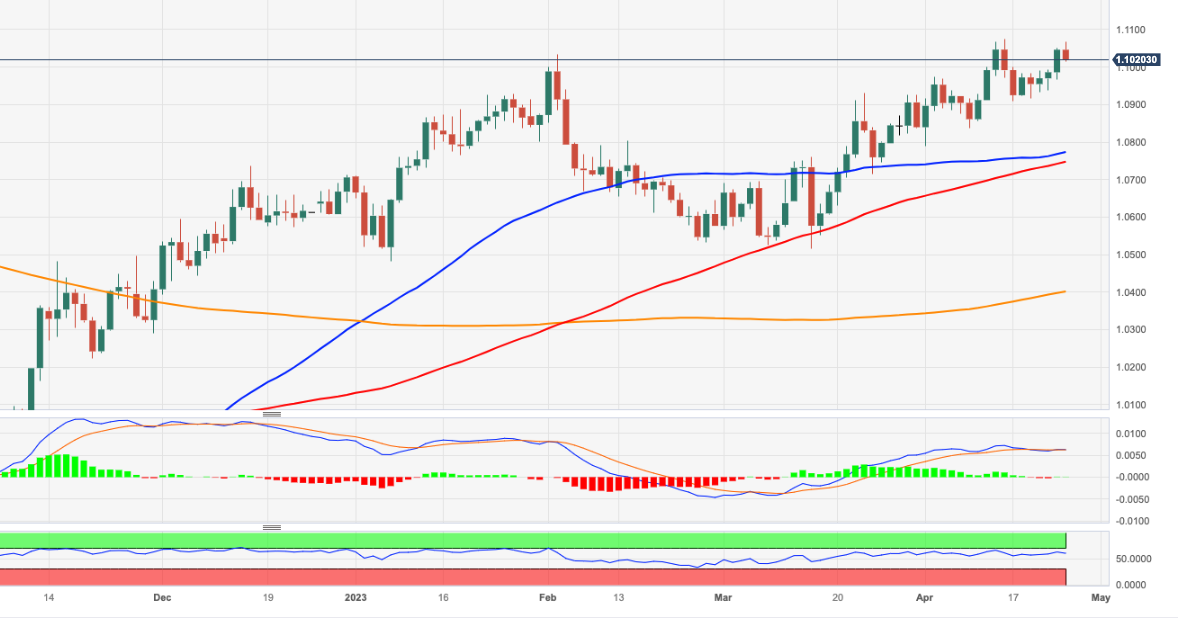
EUR/USD Price Analysis: Attention remains on the 2023 peak
- EUR/USD comes under some pressure following recent tops.
- Immediately to the upside emerges the 2023 high at 1.1075.
EUR/USD surrenders part of the recent positive streak following the breakout of the 1.1000 barrier.
The pair looks poised to extend the recovery further in the near term. That said, the immediate hurdle is expected at the 2023 high at 1.1075 (April 14) seconded by the round level at 1.1100.
Looking at the longer run, the constructive view remains unchanged while above the 200-day SMA, today at 1.0400.
EUR/USD daily chart
-
13:30
Brazil Current Account came in at $0.286B, above expectations ($-9.5B) in March
-
13:00
Brazil Retail Sales (MoM) registered at -0.1%, below expectations (0%) in February
-
12:23
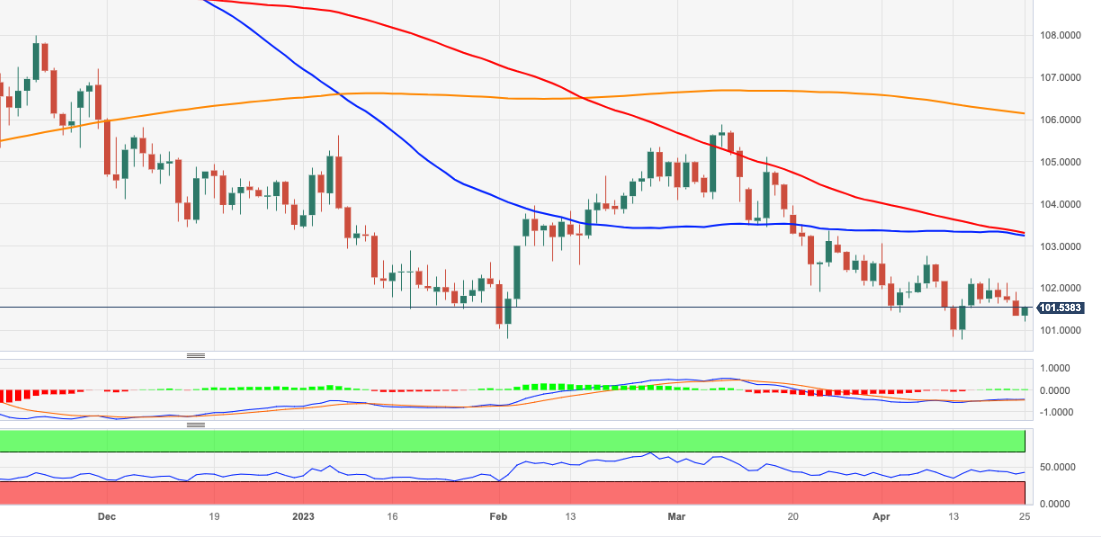
USD Index Price Analysis: A drop below 101.00 remains likely
- DXY regains some buying interest and attempt a decent bounce.
- Next on the downside appears the 101.00 region ahead of YTD lows.
DXY reverses three consecutive sessions with losses and rebound from daily lows near 101.20 on Tuesday.
The recent choppy performance in the index seems to have now refocused back on the downside. Against that, DXY could cling to this consolidative theme ahead of a probable drop to the 101.00 zone. The loss of the latter could expose a move to the so far 2023 lows near 100.80 (April 14).
Looking at the broader picture, while below the 200-day SMA, today at 106.15, the outlook for the index is expected to remain negative.
DXY daily chart
-
12:16
USD/MYR faces a solid resistance at 4.4410 ahead of 4.4550 – UOB
In the view of Markets Strategist Quek Ser Leang at UOB Group, further upside in USD/MYR should meet a firm up-barrier at 4.4410 and 4.4550 in the near term.
Key Quotes
“Last Monday (17 Apr, spot at 4.4160), we highlighted that USD/MYR ‘is likely to edge higher but any advance is expected to face solid resistance at 4.4450’. While USD/MYR rose as expected, it did not quite threaten the resistance at 4.4450 (high has been 4.4400).”
“The underlying appears to be firm, and the bias for USD/MYR this week is still on the upside. That said, there are a couple of strong resistance levels at 4.4410 and 4.4550. Support is at 4.4190, followed by 4.3790.”
-
12:12
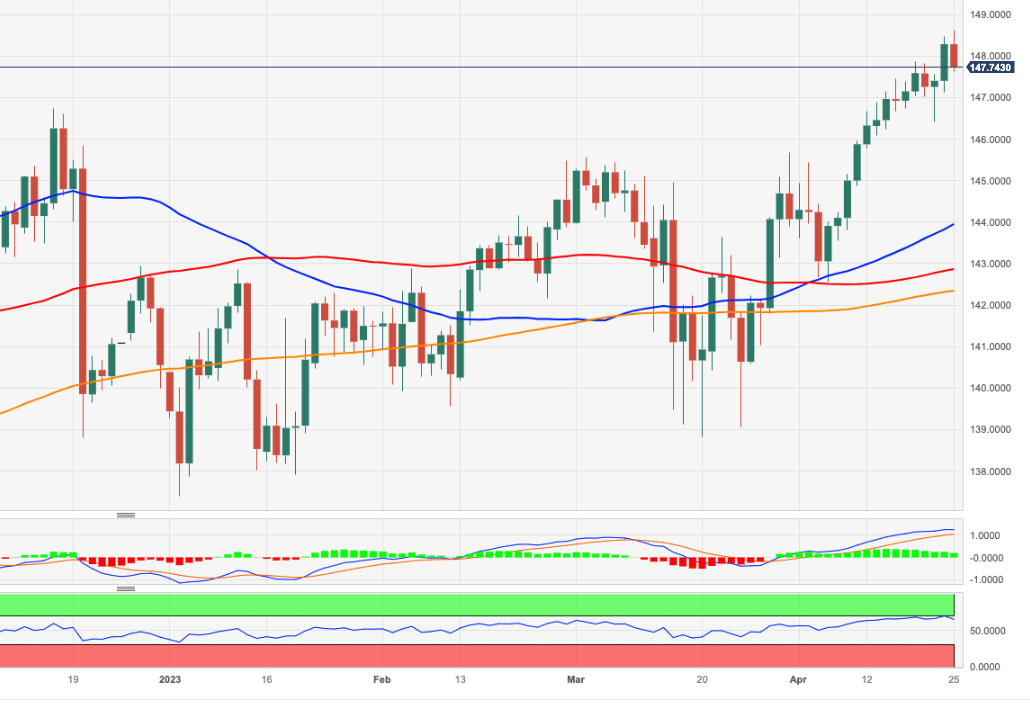
EUR/JPY Price Analysis: Room for extra gains
- EUR/JPY clinches fresh tops near 148.60 on Tuesday.
- Next of note on the upside comes the 150.00 yardstick.
EUR/JPY corrects lower following the move to fresh highs in the 148.60/65 band, an area last seen back in later December 2014.
The underlying strong upside momentum in the cross appears so far unabated despite the ongoing knee-jerk. Further north of recent tops at 148.63 (April 25), the cross could embark on a potential visit to the key 150.00 mark in the not-so-distant future.
So far, further upside looks favoured while the cross trades above the 200-day SMA, today at 142.31.
EUR/JPY daily chart
-
11:39
USD/THB faces extra consolidation near term – UOB
Markets Strategist Quek Ser Leang at UOB Group expects USD/THB to remain side-lined in the short-term horizon.
Key Quotes
“Last Monday (17 Apr, spot at 34.33), we held the view that USD/THB ‘is likely to trade with an upward bias but a sustained rise above 34.55 is unlikely’. Our expectation did not materialize as USD/THB traded in a quiet manner between 34.22 and 34.51.”
“The price movements appear to be consolidative and this week, we expect USD/THB to trade in a range, likely between 34.07 and 34.55.”
-
11:15
Australia: Headline inflation to ease to 1.2% q/q – TD Securities
Previewing Australian inflation data that will be released early Wednesday, analysts at TD Securities note that they are below consensus on both the headline Consumer Price Index (CPI) and trimmed mean measure in Q1.
RBA to keep rates unchanged again in May
"We expect headline inflation to ease to 1.2% q/q (cons: 1.3%, RBA: 1.5%) from 1.9% last quarter. This would bring the annual print to 6.8% y/y, from 7.8% y/y in Q4."
"The Jan-Feb monthly CPIs point to a quick easing in price pressures, and it is unlikely that the Q1 print would meet the RBA implied forecasts. To achieve the RBA's Q1'23 7.1% y/y forecast, this would require the monthly Mar'23 CPI to print ~1.35% m/m, significantly above the March outcomes in prior years."
"For CPI trimmed mean inflation, we project it at 1.2% q/q, 6.5% y/y (cons: 1.4% q/q, 6.7% y/y) as broad-based price pressures remain. If both quarterly prints print in line with our forecasts, this should bolster our call for the RBA to keep rates unchanged again in May."
-
11:00
US Dollar corrects as focus shifts to US tech earnings, economic data
- US Dollar pauses decline but any recovery attempts appear short-lived.
- Top-tier economic data and tech earnings from the United States this week to affect USD valuation.
- The daily technical setup for the US Dollar Index continues to favor bears in the near term.
The United States Dollar (USD) is correcting from weekly lows, as bulls find their footing amid broad risk-aversion. Rising tensions over the approaching US debt ceiling deadline and a lack of clarity on the Federal Reserve (Fed) interest rates outlook weigh on the market sentiment. Investors readjust their US Dollar positions, bracing for a week of high-profile quarterly earnings and closely watched economic data from the United States.
Earnings this week include a spate of potential market movers, including tech and tech-adjacent Alphabet Inc, Microsoft Corp, Meta Platforms Inc and Amazon.com. On the macroeconomic front, the first quarter Gross Domestic Product (GDP) and April Personal Consumption Expenditures (PCE) Price Index will be closely scrutinized in the second half of this week. In the meantime, the mid-tier US Conference Board Consumer Confidence data and housing data will entertain US Dollar traders.
The US Dollar Index, which tracks the USD performance against a basket of six major currencies, trades marginally higher on the day, near 101.50.
Daily digest market movers: US Dollar sellers take a breather
- On Monday, the Federal Reserve Bank of Chicago announced that the National Activity Index remained unchanged at -0.19 in March. Meanwhile, the Federal Reserve Bank of Dallas' Texas Manufacturing Survey showed that the headline Business Index plunged to -223.4 in April from -15.7 in March.
- Wall Street's main indices closed mixed on Monday, as Nasdaq underperformed on worries about tech earnings ahead.
- Troubled US bank, First Republic Bank, shares sank over 20% after market hours, as it said deposits plunged by more than $100 billion in the first quarter.
- Concerns persist over the approaching US debt ceiling deadline. The House of Representatives is expected to vote on a Republican-led debt and spending bill this week.
- 10-year US Treasury bond yields keep falling toward the 3.40% after breaching the 3.50% key level on Monday.
- Markets are currently pricing a roughly 90% probability of a 25 basis points Federal Reserve (Fed) rate hike at the upcoming meeting, according to the CME Group FedWatch Tool.
- The Fed is in the blackout period ahead of its May 3 monetary policy announcements.
- This Tuesday, the Conference Board's Consumer Confidence data for April from the United States will be reported alongside the New Home Sales data.
- Earnings from US tech giants Microsoft Corp, which backs ChatGPT, and Google parent Alphabet Inc, top the watchlist on Tuesday.
- The US Bureau of Economic Analysis will unveil the first estimate of first-quarter GDP growth on Thursday. The US economy is forecast to expand at an annualized rate of 2% in Q1, down from the 2.6% recorded in the last quarter of 2022.
Technical analysis: US Dollar Index remains vulnerable
The US Dollar Index (DXY) is challenging the 101.50 psychological level on the road to recovery from weekly troughs. The recovery could gain traction if DXY manages to yield a daily closing above the bearish 21-Day Moving Average (DMA). It is worth noting that the index has failed to settle above the 21 DMA since March 15 on a daily candlestick closing basis.
Acceptance above the latter could initiate a fresh upswing toward the 102.50 psychological barrier, beyond which the confluence of the downward-sloping 50 and 100 DMAs at around 103.30 will be on buyers’ radars.
With the 14-day Relative Strength Index (RSI), however, still below the 50.00 level, the recovery attempts in DXY are likely to be sold into. Immediate support is seen at the intraday low of 101.19, below which the 101.00 round number will challenge the bullish commitments. Deeper declines will seek validation from the multi-month low reached on April 14 at 100.78.
How is US Dollar correlated with US stock markets?
Stock markets in the US are likely to turn bearish if the Federal Reserve goes into a tightening cycle to battle rising inflation. Higher interest rates will ramp up the cost of borrowing and weigh on business investment. In that scenario, investors are likely to refrain from taking on high-risk, high-return positions. As a result of risk aversion and tight monetary policy, the US Dollar Index (DXY) should rise while the broad S&P 500 Index declines, revealing an inverse correlation.
During times of monetary loosening via lower interest rates and quantitative easing to ramp up economic activity, investors are likely to bet on assets that are expected to deliver higher returns, such as shares of technology companies. The Nasdaq Composite is a technology-heavy index and it is expected to outperform other major equity indexes in such a period. On the other hand, the US Dollar Index should turn bearish due to the rising money supply and the weakening safe-haven demand.
-
10:57
BoE’s Broadbent: Had we seen inflation shocks coming, BoE would have tightened policy sooner
Bank of England (BoE) Deputy Governor, Ben Broadbent, said on Tuesday, “had we seen inflation shocks coming, BoE would have tightened policy sooner.”
Additional comments
“BoE policy has not been optimal.”
“If we had started raising rates 6 months earlier, it might have lowered peak inflation by a maximum half a percentage point.”
-
10:43
Eurozone GDP preview: A surprise in the making? – Rabobank
Analysts at Rabobank expect an upside surprise in the Eurozone preliminary Gross Domestic Product (GDP) data for the first quarter due for release this Friday.
Key quotes
“GDP figures the Eurozone will be published on Friday April 28. We believe that the consensus is too pessimistic and we now expect a relatively strong growth figure for the first quarter.”
“However, we do not expect this strong growth to be sustained throughout the year, as the credit impulse has waned and the global growth landscape is likely to become a drag.”
“Lagarde flags risks of geopolitical changes to central bank policy and inflation. For now, we stick to our base case scenario of 5.4% in 2023 and 3.5% in 2024, but keep an eye on the changing geopolitical landscape.”
-
10:23
Major central banks cut dollar operations with Fed as market stress eases
In a joint statement on Tuesday, The European Central Bank (ECB), the Bank of Japan (BoJ), the Bank of England (BoE) and the Swiss National Bank (SNB) will reduce the frequency of their dollar operations with the US Federal Reserve (Fed) from May 1 as the volatility in financial markets has receded.
Key takeaways
“The BoE, the BoJ, the ECB and the SNB, in consultation with the Fed, have jointly decided to revert the frequency of their 7-day operations from daily to once per week.”
This decision was taken in view of the improvements in US Dollar funding conditions and the low demand at recent US Dollar liquidity-providing operations.
"These central banks stand ready to re-adjust the provision of US dollar liquidity as warranted by market conditions.”
-
09:46
BoJ Preview: New face, new game? – TDS
Analysts at TD Securities (TDS) offer a brief preview of what they expect from Friday’s Bank of Japan (BoJ) monetary policy announcements, the first decision under new Governor Kazuo Ueda.
Key quotes
“For the first meeting under Governor Ueda, the BoJ is expected to keep all of its policy levers unchanged. We think it is highly likely that a formal policy review is announced. That should put the next YCC shift as early as June. Generally, we think assuming a YCC change sooner rather than later is a prudent strategy. Lifting the yield cap to 1% as its next move has a lot of appeal.”
“The BoJ will not provide advance warning to a YCC change and will instead prefer to do it when it is least expected. As such, one cannot fully rule out a change at any meeting. We also think they would prefer to make a shift when the Fed has neared or completed its tightening cycle as there is less natural upward pressure to push global yields higher.”
“For this reason, we like owning some yen upside through the meeting via a 1m 132/129 USDJPY put-spread. We also like the tactical setup going into the Fed meeting and NFP meeting next month. The yen should trade with an asymmetric bias given the correlation persistence that it shows to the red/green SOFR strips (i.e. cut pricing), with particular focus to calendar spreads beyond U4.”
-
09:30
Singapore: Inflation lost momentum in March – UOB
Senior Economist at UOB Group Alvin Liew reviews the latest inflation figures in Singapore.
Key Takeaways
“Headline and core CPI inflation eased and further converged in Mar 2023. Headline CPI rose by 0.5% m/m NSA, from 0.6% in Jan. Despite the m/m increase, CPI inflation rose at a slower pace of 5.5% y/y in Mar (from 6.3% in Feb). Similarly, core inflation (which excludes accommodation and private road transport) rose sequentially in Mar by 0.2% m/m (after staying flat in Feb at 0.0% m/m). Core inflation, like the headline, also eased noticeably in Mar despite the sequential increase, coming in at 5.0% y/y (from 5.5% y/y in Feb).”
“Inflation Outlook – The MAS kept its inflation forecasts (that were first made in the 14 Oct 2022 MPS) unchanged in today’s Mar CPI report, just as it did in the recent Monetary Policy Statement release (14 Apr). The central bank stated that “MAS Core Inflation will stay elevated in the next few months, as accumulated business costs continue to feed through to consumer prices”, and it also expected core inflation “to slow more discernibly in the second half of this year.” The MAS also noted both upside and downside risks to inflation (versus just upside risks previously in the Feb 2023 CPI report). We continue to expect headline inflation to average 5.0% and core inflation to average 4.0% in 2023. Excluding the 2023 GST impact, we expect headline inflation to average 4.0% and core inflation to average 3.0%.”
-
09:29
EUR/USD trims gains and returns to 1.1020, as dollar recovers
- EUR/USD gives away part of the recent 3-day advance.
- The greenback regains some traction and weighs on the pair.
- US Consumer Confidence will be in the limelight later in the day.
Fresh selling pressure now drags EUR/USD to the low-1.1000s on the back of some tepid recovery in the dollar on Tuesday.
EUR/USD continues to target the 2023 high
EUR/USD now succumbs to the better mood around the dollar and snaps three consecutive sessions with gains on Tuesday.
Despite the knee-jerk, the pair remains poised for the continuation of the uptrend in the short-term horizon. Indeed, this view remains underpinned by firmer speculation that the ECB will raise the policy rate in June and July, which in turn appears propped up by the unabated hawkish narrative from ECB’s rate setters.
The absence of data releases in the euro docket on Tuesday will surely leave the attention to the US calendar, where the Consumer Confidence tracked by the Conference Board will be in the centre of the debate seconded by New Home Sales, and the FHFA’s House Price Index.
What to look for around EUR
Renewed weakness now prompts EUR/USD to retreat from recent peaks in response to some signs of life from the greenback.
Meanwhile, price action around the single currency should continue to closely follow dollar dynamics, as well as the incipient Fed-ECB divergence when it comes to the banks’ intentions regarding the potential next moves in interest rates.
Moving forward, hawkish ECB-speak continue to favour further rate hikes, although this view appears in contrast to some loss of momentum in economic fundamentals in the region.
Key events in the euro area this week: Germany GfK Consumer Confidence (Wednesday) – EMU Final Consumer Confidence, Economic Sentiment (Thursday) – Euro group Meeting, Germany labour market report/ Advanced Inflation Rate/Flash Q1 GDP Growth Rate, EMU Flash Q1 GDP Growth Rate (Friday).
Eminent issues on the back boiler: Continuation (or not) of the ECB hiking cycle. Impact of the Russia-Ukraine war on the growth prospects and inflation outlook in the region. Risks of inflation becoming entrenched.
EUR/USD levels to watch
So far, the pair is losing 0.16% at 1.1027 and faces the next support at 1.0909 (weekly low April 17) seconded by 1.0831 (monthly low April 10) and finally 1.0788 (monthly low April 3). On the upside, a break above 1.1075 (2023 high April 14) would target 1.1100 (round level) en route to 1.1184 (weekly high March 21 2022).
-
09:22
Euro makes a date with 1.1075 year-to-date highs on confidence-boosting bank earnings
- Euro vs US Dollar almost reaches 2023 highs at 1.1075 before rolling over.
- Single currency is boosted by Eurozone bank earnings, showing the sector is in good health.
- Technicals show the uptrend remains intact and is expected to continue.
The Euro (EUR) is pulling back after almost touching year-to-date highs above 1.1000 against the US Dollar (USD) during the early European session, on Tuesday. The single currency is supported by confidence-boosting Eurozone bank earnings, which suggest the sector has weathered the March crisis better than expected. Hawkish comments from rate-setters at the European Central Bank (ECB) further aid the Euro, as expectation of higher interest rates would lift capital inflows into Europe. From a technical perspective, the overall trend is up, with the probabilities favoring longs over shorts.
EUR/USD market movers
- The Euro gains strength from comments by Pierre Wunsch, president of Belgium’s Banque Nationale, who said “We are waiting for wage growth and core inflation to go down... before we can arrive at the point where we can pause (hiking rates).”
- The ECB’s chief economist Philip Lane has gone on the record saying interest rates will rise at the May 4 meeting but whether beyond that depends on the data.
- Previously, the Irishman said a lot is riding on the state of Eurozone banks, as assessed by the ECB’s Bank Lending Survey out on May 2, as well as April flash HICP inflation data released on the same day.
- Strong first quarter earnings by European banks due to higher interest margins, however, suggest the BLS will paint a favorable picture.
- Banco Santander’s recently released Q1 earnings, for example, beat profit estimates of 2.4B with 2.57B.
- ECB President Christine Lagarde recently said there is still “some way to go” before Frankfurt is done with hiking interest rates.
- The US Dollar is at a disadvantage since Federal Reserve (Fed) officials are in the two-week blackout period before the May 4 meeting, during which time they are not allowed to comment.
- Prior to the blackout, St. Louis Fed’s Bullard was hawkish, saying he expects more rate hikes due to persistent inflation and overblown recession fears.
- Unexpectedly strong first quarter earnings by US banks suggests the sector’s March crisis may be in the rear-view mirror, further supporting the Greenback.
- The key data release for the US Dollar is Consumer Confidence for April, out at 14:00 GMT. There is no major macroeconomic data out for the Euro.
EUR/USD technical analysis: Nearing year-to-date highs
EUR/USD breaks out of a right-angled triangle (more clearly seen on the 4-hour chart) and unfolds another leg higher, in line with the broader medium-term uptrend that began over eight months ago. The pair is fast approaching the year-to-date highs at 1.1075. The odds favor a continuation of the dominant Euro bullish trend.
-638180075791018996.png)
EUR/USD: Daily ChartA decisive break above 1.1075, which was touched on April 14, would confirm a continuation of the Euro’s uptrend to the next key resistance level at around 1.1190, where the 200-week Simple Moving Average (SMA) sits.
For the sake of clarity, the definition of a ‘decisive break’ either includes a ‘breakout candle’ – a long green bullish daily candle that extends above the 1.1075 highs and closes near its high, or three smaller bullish green candles in a row that break above the highs.
Alternatively, a break and daily close below the key lower high at 1.0830 would bring into doubt the validity of the uptrend and could see losses extend down to a confluence of support at 1.0775-1.0800, marking a possible reversal of the dominant trend.
Euro FAQs
What is the Euro?
The Euro is the currency for the 20 European Union countries that belong to the Eurozone. It is the second most heavily traded currency in the world behind the US Dollar. In 2022, it accounted for 31% of all foreign exchange transactions, with an average daily turnover of over $2.2 trillion a day.
EUR/USD is the most heavily traded currency pair in the world, accounting for an estimated 30% off all transactions, followed by EUR/JPY (4%), EUR/GBP (3%) and EUR/AUD (2%).What is the ECB and how does it impact the Euro?
The European Central Bank (ECB) in Frankfurt, Germany, is the reserve bank for the Eurozone. The ECB sets interest rates and manages monetary policy.
The ECB’s primary mandate is to maintain price stability, which means either controlling inflation or stimulating growth. Its primary tool is the raising or lowering of interest rates. Relatively high interest rates – or the expectation of higher rates – will usually benefit the Euro and vice versa.
The ECB Governing Council makes monetary policy decisions at meetings held eight times a year. Decisions are made by heads of the Eurozone national banks and six permanent members, including the President of the ECB, Christine Lagarde.How does inflation data impact the value of the Euro?
Eurozone inflation data, measured by the Harmonized Index of Consumer Prices (HICP), is an important econometric for the Euro. If inflation rises more than expected, especially if above the ECB’s 2% target, it obliges the ECB to raise interest rates to bring it back under control.
Relatively high interest rates compared to its counterparts will usually benefit the Euro, as it makes the region more attractive as a place for global investors to park their money.How does economic data influence the value of the Euro?
Data releases gauge the health of the economy and can impact on the Euro. Indicators such as GDP, Manufacturing and Services PMIs, employment, and consumer sentiment surveys can all influence the direction of the single currency.
A strong economy is good for the Euro. Not only does it attract more foreign investment but it may encourage the ECB to put up interest rates, which will directly strengthen the Euro. Otherwise, if economic data is weak, the Euro is likely to fall.
Economic data for the four largest economies in the euro area (Germany, France, Italy and Spain) are especially significant, as they account for 75% of the Eurozone’s economy.How does the Trade Balance impact the Euro?
Another significant data release for the Euro is the Trade Balance. This indicator measures the difference between what a country earns from its exports and what it spends on imports over a given period.
If a country produces highly sought after exports then its currency will gain in value purely from the extra demand created from foreign buyers seeking to purchase these goods. Therefore, a positive net Trade Balance strengthens a currency and vice versa for a negative balance. -
09:06
USD/CNH: Upside momentum expected to improve – UOB
Extra gains in USD/CNH are likely on a breakout of the 6.9350 region in the near term, comment UOB Group’s Economist Lee Sue Ann and Markets Strategist Quek Ser Leang.
Key Quotes
24-hour view: “We expected USD to trade with an upward bias yesterday but we held the view that ‘any advance is likely to face strong resistance at 6.9100’. While USD rose above 6.9100, it fell quickly from a high of 6.9125. Upward pressure has more or less faded and USD is unlikely to advance further. Today, it is more likely to trade sideways between 6.8820 and 6.9080.”
Next 1-3 weeks: “Our update from last Thursday (20 Apr, spot at 6.8920) still stands. As highlighted, upward momentum is beginning to improve but USD has to break and stay above 6.9350 before a sustained rise is likely. The chance of USD breaking clearly above 6.9350 is not high for now but it will remain intact as long as the ‘strong support’ level at 6.8600 (no change in level) is not taken out.”
-
09:03
Natural Gas Futures: Further range bound on the cards
In light of advanced prints from CME Group for natural gas futures markets, open interest extended the downtrend and shrank by 880 contracts on Monday. On the other hand, volume reversed two consecutive daily drops and rose by around 42.3K contracts.
Natural Gas remains bolstered by $2.00
Prices of the natural gas rose modestly at the beginning of the week. The uptick, however, came in tandem with declining open interest and higher volume, which should leave the current multi-week consolidation range well in place for the time being. So far, the $2.00 region per MMBtu continues to hold the downside.
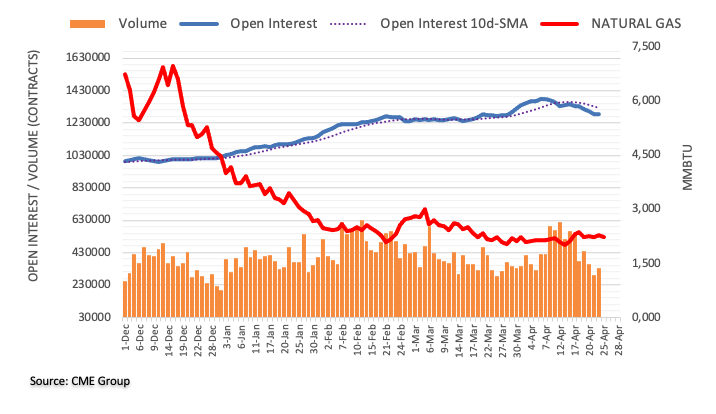
-
07:57
AUD/USD Price Analysis: Portrays bearish consolidation below 0.6700
- AUD/USD remains pressured within 40-pip rectangle, justifies clear break of short-term ascending trend line, 200-HMA.
- Downbeat oscillators suggest further grinding towards the south.
- Aussie pair buyers need validation from 0.6780; bears have ample room to cheer.
AUD/USD bears return to the table, following an upbeat start of the week, as the Aussie pair drops to 0.6680 amid early Tuesday morning in Europe.
In doing so, the risk barometer remains within a short-term rectangle formation comprising multiple levels marked since the last Friday amid a steady RSI (14) line, below the median line of late.
However, a clear downside break of a fortnight-old ascending trend line and the 200-Hour Moving Average (HMA) joins the bearish MACD signals to keep Aussie bears hopeful.
That said, the stated trend continuation pattern’s lower line, close to 0.6665 of late, puts a floor under the AUD/USD prices, a break of which could quickly direct the sellers towards the monthly low of 0.6620.
In a case where the AUD/USD price remains bearish past 0.6620, the 0.6600 round figure and the yearly low marked in March around 0.6560 could lure the sellers.
On the flip side, the aforementioned rectangle’s top line, around 0.6710 at the latest, precedes the 200-HMA level of 0.6720 to restrict the short-term recovery of the AUD/USD pair.
Following that, the previous support line stretched from April 11, near 0.6725 can act as the last defense of the AUD/USD bears.
Should the AUD/USD buyers keep the reins past 0.6725, a one-week-old horizontal resistance area between 0.6770 and 0.6780 can challenge the upside momentum.
AUD/USD: Hourly chart
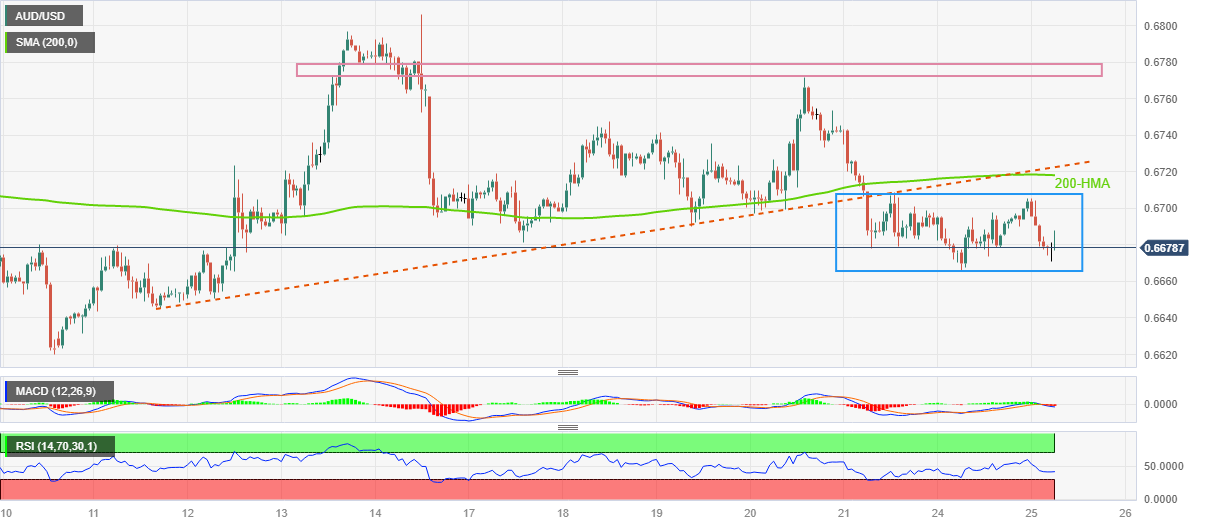
Trend: Further downside expected
-
07:57
Forex Today: US Dollar trying to find a foothold ahead of mid-tier data
Here is what you need to know on Tuesday, April 25:
Following the selloff seen in the American session on Monday, the US Dollar (USD) tries to stabilize early Tuesday with the US Dollar Index recovering from the 10-day low it set at 101.20 in the early Asian session. February Housing Price Index, March New Home Sales and the Conference Board's Consumer Confidence Index for April will be featured in the US economic docket later in the day.
US Consumer Confidence Preview: Recession hints likely to keep the USD under pressure.
The sharp decline witnessed in the US Treasury bond yields weighed heavily on the USD on Monday. The benchmark 10-year US Treasury bond yield lost more than 2% and declined below 3.5% for the first time since April 14. Early Tuesday, the 10-year yield is having a difficult time staging a rebound. Meanwhile, Wall Street's main indexes closed mixed with the Nasdaq Composite posting modest losses and the Dow Jones Industrial Average adding 0.2%. US stock index futures trade in negative territory in the European morning.
EUR/USD capitalized on the renewed USD weakness on Monday and registered strong gains. The pair seems to have gone into a consolidation phase around 1.1050 early Tuesday. Since there won't be any high-tier data releases from the Euro area, the USD's valuation and comments from European Central Bank (ECB) policymakers could drive the pair's action.
GBP/USD closed in positive territory on Monday and continued to push higher during the Asian trading hours on Tuesday. The pair, however, lost its traction after having met resistance at 1.2500 and was last seen trading modestly lower on the day at around 1.2470.
USD/JPY closed flat slightly above 134.00 on Monday and continues to trade in a tight range on Tuesday. Earlier in the day, "we see risk of inflation undershooting forecast as bigger than risk of overshooting, which is why the Bank of Japan (BoJ) must maintain easy policy now," BoJ Governor Kazuo Ueda said.
Gold price benefited from falling US yields and gathered bullish momentum on Monday. XAU/USD continues to edge higher toward the key $2,000 level on Tuesday.
Following Monday's indecisive action, Bitcoin edges slightly lower early Tuesday and was last seen trading below $27,500. Ethereum lost 1% on Monday and is already another 1% on Tuesday, trading slightly above $1,800.
-
07:55
FX option expiries for Apr 25 NY cut
FX option expiries for Apr 25 NY cut at 10:00 Eastern Time, via DTCC, can be found below.
- EUR/USD: EUR amounts
- 1.1000 1.1b
- 1.1050-60 2.0b
- 1.1080 875m
- 1.1100 2.2b
- GBP/USD: GBP amounts
- 1.2300 627m
- USD/JPY: USD amounts
- 133.00 300m
- 133.35 724m
- 133.60 327m
- USD/CHF: USD amounts
- 0.9005 800m
- AUD/USD: AUD amounts
- 0.6665-75 525m
- 0.6720 467m
- NZD/USD: NZD amounts
- 0.6050 400m
- 0.6150 816m
-
07:38
ECB’s Villeroy: Inflation will probably come down towards 2% at the end of 2024
European Central Bank (ECB) Governing Council member and Bank of France head Francois Villeroy de Galhau said on Tuesday, “inflation will probably come down towards 2% at the end of 2024.”
Additional quotes
“We're likely at the inflation peak today.”
“Food price inflation will start to ease in 2h 2023.”
Market reaction
EUR/USD was last seen trading at 1.1050, up 0.07% on the day.
-
07:35
USD/CHF Price Analysis: Dragonfly Doji, oversold RSI hints at corrective bounce towards 0.8900
- USD/CHF rebounds from one-week low after posting bullish candlestick.
- Oversold RSI (14) conditions, eight-day-old horizontal support challenges Swiss Franc pair sellers.
- Buyers have a bumpy road towards the north, 0.8940 appears the last defense of bears.
USD/CHF prods the bears around 0.8875 amid Tuesday’s initial European session, after posting a bullish candlestick during early Asia. Adding strength to the recovery moves is the oversold RSI (14) line, as well as the quote’s U-turn from a one-week-old horizontal support zone.
With this, the USD/CHF buyers are likely approaching the 0.8900 threshold. However, a downward-sloping resistance line from April 19, close to 0.8910 at the latest, restricts the immediate upside of the quote.
Following that, a two-week-old descending resistance line, near 0.8940 by the press time, will be crucial to watch as a break of which can quickly propel the USD/CHF price towards the highs marked on April 10 and 03, near 0.9115 and 0.9200 in that order.
It should be noted that the 0.9100 round figure may also act as an extra filter towards the north.
Meanwhile, a downside break of 0.8860 could defy the bullish signals flashed by the “Dragonfly Doji” candlestick and oversold RSI line.
In that case, the USD/CHF bears may approach the year 2021 low near 0.8755 wherein the December 2020 bottom of around 0.8820 may act as an intermediate halt.
USD/CHF: Four-hour chart
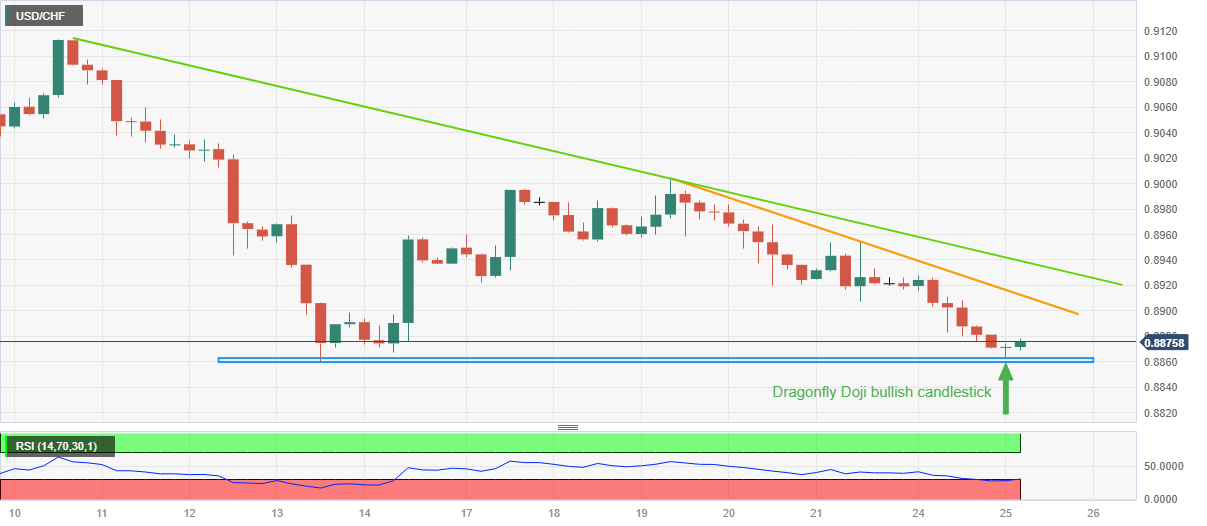
Trend: Further recovery expected
-
07:22
USD/JPY: Dwindling bets for further upside – UOB
A move to the 135.75 in USD/JPY appears to be losing some traction, suggest UOB Group’s Economist Lee Sue Ann and Markets Strategist Quek Ser Leang.
Key Quotes
24-hour view: “We noted yesterday that USD ‘appears to have moved into a consolidation phase’, and we expected it to consolidate and trade between 133.60 and 134.60. USD then traded in a range of 133.88/133.74 before closing largely unchanged at 133.22 (+0.05%). The price actions still appear to be consolidative and today, we expect USD to trade in a range of 133.75/134.60.”
Next 1-3 weeks: “There is not much to add to our update from yesterday (24 Apr, spot at 134.10). As highlighted, upward momentum is beginning to fade and the likelihood of USD advancing to 135.75 is diminishing. However, only a break of 133.50 (no change in ‘strong support’ level) would indicate that the USD strength that started early last week has come to an end.”
-
07:15
Crude Oil Futures: Recovery could lose momentum
CME Group’s flash data for crude oil futures markets noted traders reduced their open interest positions by around 22.1K contracts at the beginning of the week, adding to the ongoing downtrend. Volume followed suit and went down for the second straight session, this time by around 20.2K contracts.
WTI faces the next up barrier around $80.00
Monday’s uptick in prices of the WTI came on the back of diminishing open interest and volume and poured cold water over expectations of further gains in the very near term. On the upside, the key $80.00 mark per barrel emerges as a key initial barrier for bulls.
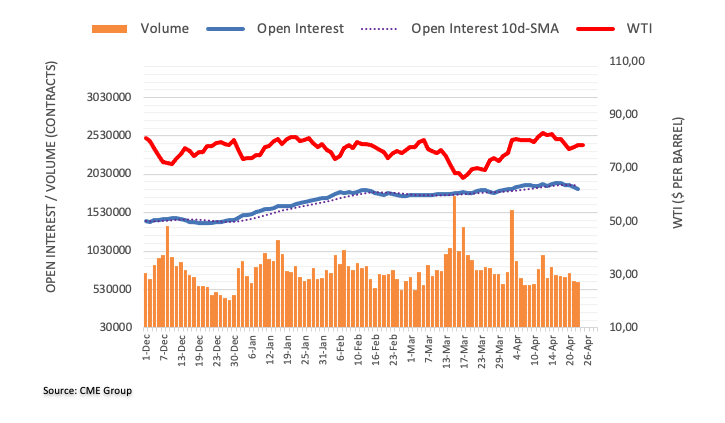
-
07:13
USD/CAD bulls prod 1.3550 as sour sentiment weigh on Oil price, puts a floor under US Dollar
- USD/CAD grinds near the highest levels in three weeks amid downbeat risk profile.
- WTI crude oil fades demand-driven upside amid challenges to sentiment, fears of recession.
- US Dollar bounces off one-week low during four-day downtrend.
USD/CAD clings to mild gains around 1.3550 as it makes rounds to the highest levels in three weeks, marked the previous day, amid early hours of Tuesday morning in Europe. In doing so, the Loonie pair cheers the US Dollar’s latest rebound, as well as justifies the WTI crude oil price’s pullback, amid sluggish trading hours.
It’s worth noting, however, that the risk-off mood, mainly driven by the fears of US debt ceiling expiration and the Federal Reserve’s (Fed) dovish hike, seems to weigh on the sentiment. Adding strength to the sour sentiment are the geopolitical fears surrounding Russia and China, as well as the market’s cautious mood ahead of this week’s top-tier growth and inflation data. China’s alleged support to Moscow in fighting with Ukraine joins the Western readiness to increase sanctions on the Oil-rich nation to weigh on sentiment.
Amid these plays, S&P 500 Futures print mild losses near 4,155 as it snaps a two-day uptrend after mixed closing of the Wall Street benchmarks. On the other hand, the US Treasury bond yields highlight the rush for risk safety as the benchmark 10-year bond coupons drop to 3.48% at the latest. More importantly, the difference between the one-month and the three-month US Treasury bond yields widen the most since 2001 as the coupons flash 3.48% and 4.98% mark of late.
On a different page, the US Dollar Index (DXY) licks its wounds at a one-week low, mildly offered near 101.30, whereas WTI crude oil braces for the first daily loss in three, up 0.10% intraday near $78.70 by the press time.
In addition to the risk catalysts, the Bank of Canada’s (BoC) comparatively more dovish stance than the Federal Reserve (Fed) keeps the USD/CAD buyers hopeful. Even so, today’s US Conference Board’s (CB) Consumer Confidence gauge for April, expected to remain steady near 104.1 versus 104.2 prior, will be important for the intraday directions.
Technical analysis
Monday’s Doji candlestick joins the USD/CAD pair’s repeated failure to cross the 50-DMA hurdle, around 1.3575 by the press time, to challenge the Loonie pair buyers.
-
07:10
USD/JPY shows signs of weakness above 134.00 ahead of US GDP, BoJ policy in focus
- USD/JPY is looking vulnerable above 134.00 as the recovery move by the BoJ seems sort-lived.
- An upbeat Durable Goods Orders data would indicate that core CPI would get more persistent ahead
- BoJ Ueda said it is appropriate to continue with easing yield curve control.
The USD/JPY pair seems vulnerable above the critical support of 134.00 in the early European session. The major is witnessing selling pressure as the recovery move in the US Dollar Index (DXY) is expected to fade sooner. Earlier, the USD Index rebounded after printing a weekly low of 101.20. An absence of supportive indicators conveys that the recovery move in the USD Index is short-lived.
S&P500 futures are auctioning in a negative trajectory in the early European session in anticipation of weak earnings and poor guidance from technology stocks. Investors have underpinned the risk aversion theme and are shifting funds in US government bonds.
This week, investors are awaiting the release of the Durable Goods Orders data for further guidance. The economic data indicates forward demand received by manufacturers for curable products. US core Consumer Price Index (CPI) data has not softened much if compared with headline inflation. And an upbeat Durable Goods Orders data would indicate that core CPI would get more persistent ahead. As per the consensus, the economic data is seen expanding by 0.8% vs. a contraction of 1.0% recorded in February.
On the Japanese Yen front, the interest rate policy from the Bank of Japan (BoJ) will remain in focus. New BoJ Governor Kazuo Ueda is expected to continue the expansionary monetary policy further to support gradually accelerating inflation. Speaking in Parliament, BoJ Ueda said it is appropriate to continue with easing yield curve control (YCC).
Meanwhile, the monthly economic report published by the Japanese Cabinet Office maintained the overview of the economy that it was on a moderate recovery.
-
07:09
NZD/USD risks further downside near term – UOB
In the opinion of UOB Group’s Economist Lee Sue Ann and Markets Strategist Quek Ser Leang, NZD/USD faces a strong support at 0.6085.
Key Quotes
24-hour view: “Our view for NZD to edge lower did not materialize as it rebounded from a low of 0.6125 (high of 0.6167). Downward momentum has eased and NZD is likely to trade sideways. Expected range for today; 0.6135/0.6190.”
Next 1-3 weeks: “Yesterday (24 Apr, spot at 0.6140), we indicated ‘While downward momentum has not increased much, NZD is likely to trade with a downward bias’. We added, ‘It remains to be seen if there is enough momentum for NZD to drop to the major support at 0.6085’. There is no change in our view for now. Only a break of 0.6200 (no change in ‘strong resistance’ level) would indicate the current downward bias in NZD has eased.”
-
07:01
Switzerland Imports (MoM) increased to 22604M in March from previous 19243M
-
07:01
Switzerland Exports (MoM): 27136M (March) vs 22556M
-
07:01
Sweden Producer Price Index (MoM) above forecasts (-2.7%) in March: Actual (-0.1%)
-
07:00
United Kingdom Public Sector Net Borrowing came in at £20.709B below forecasts (£22.942B) in March
-
07:00
Switzerland Trade Balance came in at 4532M, above expectations (3493M) in March
-
07:00
Sweden Producer Price Index (YoY) registered at 3.5%, below expectations (5.6%) in March
-
06:55
EUR/USD Price Analysis: Drops toward 1.1000 amid overbought RSI
- EUR/USD prods three-day winning streak while retreating from one-week-old horizontal hurdle.
- Overbought RSI (14) line adds strength to the pullback moves targeting fortnight-long support zone.
- 200-HMA acts as an additional downside filter within short-term ascending triangle.
EUR/USD is on the cusp of printing the first intraday loss in four as it takes offers to reverse intraday gains around a one-week high, falling to 1.1050 amid early Tuesday morning in Europe. In doing so, the Euro pair takes a U-turn from a short-term key horizontal resistance amid the overbought RSI (14) line.
With this, the EUR/USD sellers are well set to test a two-week-old horizontal support zone of around 1.1000.
However, the 200-Hour Moving Average (HMA) and an upward-sloping trend line from April 10, forming part of a bearish triangle formation, respectively near 1.0985 and 1.0960, can challenge the EUR/USD bears afterward.
In a case where the Euro pair drops below 1.0960, the odds of witnessing a south run towards the 61.8% Fibonacci retracement level of April 10-14 upside, near 1.0930, can act as the last defense of the EUR/USD buyers.
On the contrary, a sustained break of the stated triangle’s top line, close to 1.1070, will defy the bearish chart pattern and can prod the latest multi-month high of around 1.1075.
Though, the EUR/USD pair’s successful trading beyond 1.1075 won’t hesitate to challenge the late March 2022 high surrounding 1.1185.
Overall, EUR/USD pair is likely to decline in the short term but the bullish trend remains intact unless the quote stays beyond 1.0930.
EUR/USD: Hourly chart
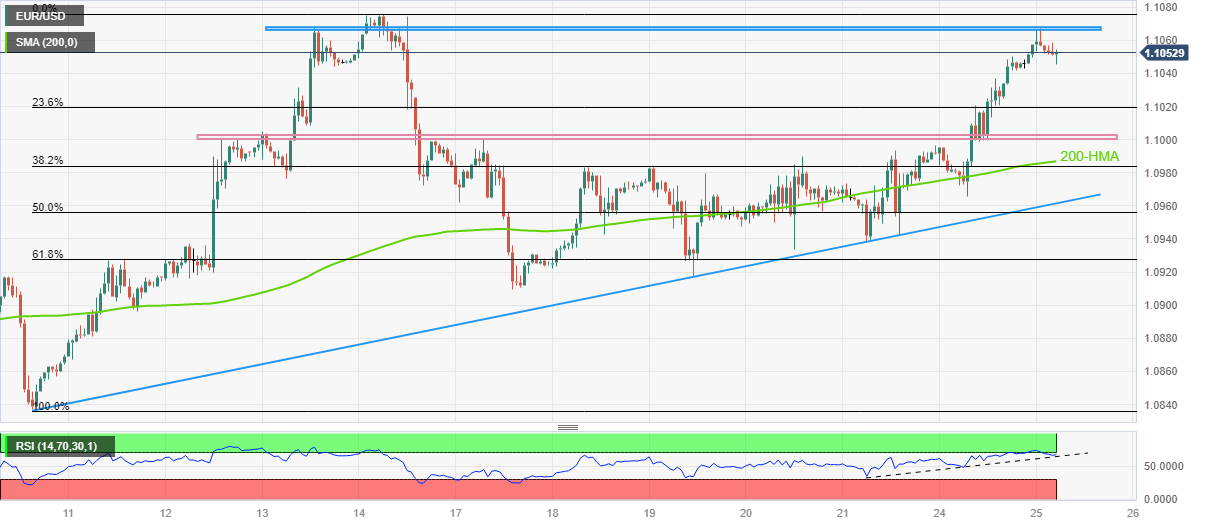
Trend: Further downside expected
-
06:40
GBP/USD corrects further to 1.2480 as Fed policy comes into picture ahead of US GDP
- GBP/USD has dropped sharply to near 1.2480 amid a recovery move by the USD Index and the risk-off market mood.
- Investors are shifting their focus on interest rate guidance from the Federal Reserve as a 25bp rate hike is widely anticipated.
- The street is anticipating one more 25 bps rate hike from the Bank of England to continue pressure on UK’s stubborn inflation.
- GBP/USD has been consolidating in a wide range of 1.2347-1.2545 for the past three weeks.
The GBP/USD pair has dropped after failing to sustain above the psychological resistance of 1.2500 in the early European session. The Cable has sensed selling pressure as the US Dollar Index (DXY) is aiming to extend its recovery above 101.33 also negative market sentiment is weighing on risk-sensitive assets.
The USD Index rebounded sharply from 101.20 as investors are getting anxious ahead of the release of the United States Gross Domestic Product (GDP) data, which will release on Thursday. Also, investors are anticipating that the sticky US core Consumer Price Index (CPI) could force the Federal Reserve (Fed) to remain hawkish on interest rate guidance.
Meanwhile, S&P500 futures are consistently adding losses in the overnight session as the street is worried over quarterly results from giant technology stocks. The week is going to be pretty busy as three FAANG stocks will report their quarterly results. Meta Platforms (Facebook), Amazon, and Google. Also, Microsoft will come forward with quarterly earnings and revenue guidance.
US data to provide more clarity on Federal Reserve policy
Volatility in tradeable markets is expected to remain quite high ahead as investors are shifting their focus toward the interest rate policy from the Federal Reserve, which is due next week. Federal Reserve (Fed) chair Jerome Powell is expected to announce a consecutive 25 basis point (bp) interest rate hike and will push rates above 5%. However, the event that will grab major attention will be the interest rate guidance from the Federal Reserve (Fed).
Considering the fact that the labor market conditions are getting softer, credit conditions from US commercial banks are getting tightened, and Producer Price Index (PPI) figures have significantly trimmed due to lower oil prices, the Federal Reserve will pause the rate hike regime after one more 25 bps rate hike.
However, the release of the US Durable Goods Orders and Gross Domestic Product (GDP) data will provide more clarity this week. March’s Durable Goods Orders data is seen expanding by 0.8% vs. a contraction of 1.0%. Later this week, Annualized (Q1) GDP is expected to contract to 2.0% vs. the former release of 2.6%. A decline in GDP numbers would fuel fears of a slowdown in the United States economy. This may also force the Federal Reserve to go for a steady stance on interest rate guidance.
Bank of England to hike rates further to arrest double-digit Inflation
The United Kingdom has been failing to arrest gigantic inflation in comparison with other developed economies. The inflation rate has remained stuck in the double-digit territory despite restrictive monetary policy from the Bank of England (BoE) and tight fiscal policy from the UK government. Shortage of labor due to early retirement and the Brexit event, and 45-year high food inflation have been major constraints of galloping UK inflation.
The street is anticipating one more 25 bps rate hike from BoE governor Andrew Bailey to continue pressure on stubborn inflation.
GBP/USD technical outlook
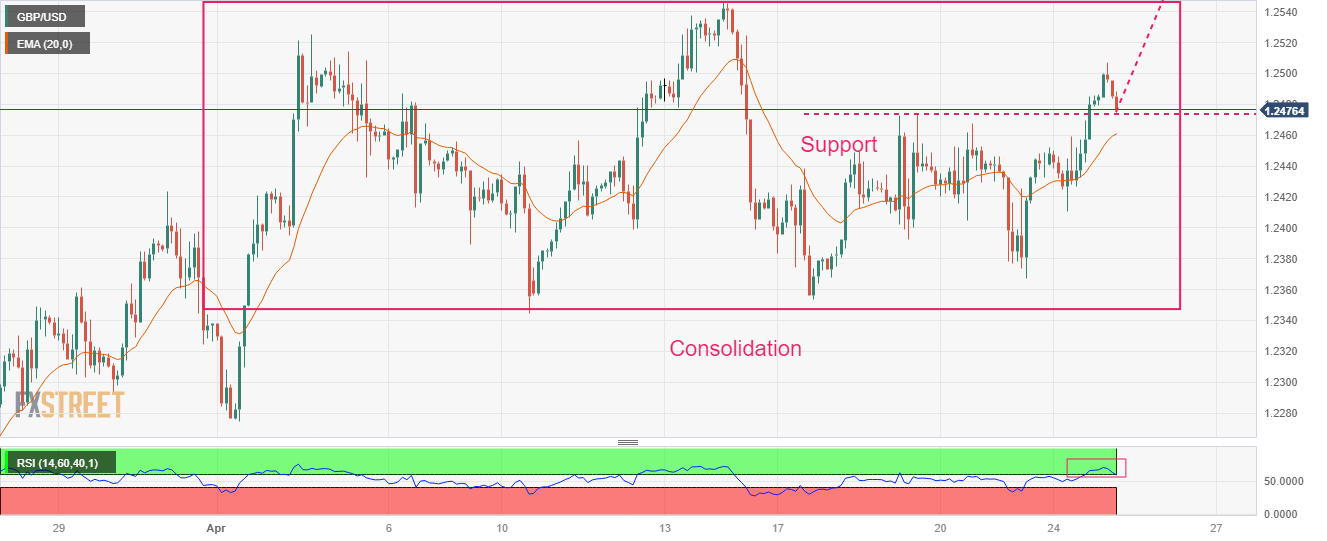
GBP/USD has been consolidating in a wide range of 1.2347-1.2545 on a two-hour scale for the past three weeks. The pair is marching towards April 14 high at 1.2545 amid a solid upside momentum. April 19 high at 1.2472 is providing cushion to the Pound Sterling. The 20-period Exponential Moving Average (EMA) at 1.2460 is aiming higher, indicating more upside ahead.
Meanwhile, the Relative Strength Index (RSI) (14) is gauging cushion around 60.00. A revival from the 60.00 support by the RSI (14) will strengthen Pound Sterling bulls further.
-
06:39
USD Index treads water around 101.30 ahead of key data
- The index alternates gains with losses near 101.30.
- US yields extend the decline early in the European morning.
- CB Consumer Confidence takes centre stage later in the NA session.
The USD Index (DXY), which tracks the greenback vs. a basket of its main competitors, navigates a narrow range around the 101.30 zone on turnaround Tuesday.
USD Index focuses on data
The index remains under pressure and the near-term outlook seems to point to the continuation of the downtrend with the initial support at the 101.00 mark ahead of the 2023 low near 100.80.
So far, investors seem convinced of another 25 bps rate hike by the Federal Reserve at its meeting on May 3 amidst hawkish Fedspeak and with inflation still way above the Fed’s 2.0% target.
Simultaneously, and also weighing on the buck and yields, emerges the speculation of a pause in the Fed’s hiking cycle soon after the May event.
In the US data space, the Consumer Confidence gauged by the Conference Board will grab all the attention later in the NA session seconded by the FHFA’s House Price Index and New Home Sales.
What to look for around USD
The dollar faces renewed downside pressure on the back of the improvement in the sentiment surrounding the risk-associated universe.
Looking at the broader picture, the index continues to navigate in a consolidative phase against steady expectations of another rate increase in May by the Fed.
In favour of a pivot in the Fed’s hiking cycle following the May event appears the persevering disinflation and nascent weakness in some key fundamentals.
Key events in the US this week: House Price Index, CB Consumer Confidence, New Home Sales (Tuesday) – MBA Mortgage Applications, Durable Goods Orders, Advanced Goods Trade Balance (Wednesday) – Flash Q1 GDP Growth Rate, Initial Jobless Claims, Pending Home Sales (Thursday) – PCE/Core PCE, Employment Cost, Personal Income, Personal Spending, Final Michigan Consumer Sentiment (Friday).
Eminent issues on the back boiler: Persistent debate over a soft/hard landing of the US economy. Terminal Interest rate near the peak vs. speculation of rate cuts in 2024. Fed’s pivot. Geopolitical effervescence vs. Russia and China. US-China trade conflict.
USD Index relevant levels
Now, the index is gaining 0.03% at 101.35 and faces the next hurdle at 102.80 (weekly high April 10) followed by 103.05 (monthly high April 3) and then 103.23 (55-day SMA). On the flip side, the breach of 100.78 (2023 low April 14) would open the door to 100.00 (psychological level) and finally 99.81 (weekly low April 21 2022).
-
06:32
UK PM Sunak wants EU deal on passport checks after post-Brexit chaos – Bloomberg
Citing people familiar with the matter, Bloomberg reported on Tuesday that British Prime Minister, Rishi Sunak, wants to leverage the UK’s improved relationship with the European Union (EU) into a deal to make it easier for Britons to travel to the bloc.
No further details are provided on the same.
Market reaction
At the time of writing, GBP/USD is testing lows at 1.2475, down 0.05% on the day. The US Dollar has paused its decline, weighing down on the pair.
-
06:28
EUR/GBP prints four-day uptrend near 0.8850 despite ECB policymakers’ cautious optimism
- EUR/GBP grinds near intraday high, up for the fourth consecutive day.
- Hawkish ECB talks, upbeat Eurozone Treasury bond yields favor pair buyers.
- Mixed UK data, BoEspeak and political jitters prod Sterling buyers.
- Eurozone Q1 GDP is the key for fresh impulse amid light calendar in Britain.
EUR/GBP buyers keep the reins for the fourth day in a row, mildly bid near 0.8855 heading into Tuesday’s London open. In doing so, the cross-currency pair benefits from the broad-based Euro strength, as well as takes clues from the comparatively downbeat UK catalyst, amid slightly hawkish European Central Bank (ECB) officials.
Recently, ECB Chief Economist Philip Lane mentioned that the current data suggest we have to raise interest rates again at the upcoming meeting. The policymaker also added, “Beyond May 4 meeting, further rate hikes will depend on data.”
On Monday, European Central Bank’s (ECB) Governing Council member Pierre Wunsch said in the an interview with the Financial Times (FT) that the central bank will continue raising interest rates until wage growth slows. On the same line, ECB Governing Council member and Bank of France head Francois Villeroy de Galhau said on Monday that the central banks’ core mandate worldwide is price stability and climate change already affects the level of prices and activity. Further, ECB executive board member, Fabio Panetta, said “Geopolitics risk persistent inflation volatility.” These statements are in line with the latest comments from ECB President Christine Lagarde who said there is still “some way to go” before the ECB finishes hiking interest rates.
On the other hand, “BoE must stop the risk of high inflation becoming embedded in the economy,” said Bank of England (BoE) Deputy Governor Dave Ramsden in an interview with The Times on Friday. The policy maker also added that there were still signs of stubbornly high inflation while mentioning that there was a greater risk of the BoE doing too little rather than too much.
It’s worth noting that the recent statistics from the UK and the Eurozone have been quite mixed with the British data lagging on the activity front than those from the old continent.
Amid these plays, the Eurozone and German Treasury bond yields remain firmer for the third consecutive day while those for the UK’s bonds ease of late.
Moving on, a light calendar in Eurozone and the UK may restrict immediate EUR/GBP moves but the comparatively more hawkish comments from the ECB policymakers and upbeat EU data keeps the pair buyers hopeful.
Technical analysis
Although the EUR/GBP bulls are gathering strength of late, a six-week-old horizontal resistance near 0.8865 appears a tough nut to crack for them.
-
06:16
GBP/USD: Further gains seen above 1.2510 – UOB
According to UOB Group’s Economist Lee Sue Ann and Markets Strategist Quek Ser Leang, the upside momentum in GBP/USD is likely to accelerate once 1.2510 is cleared.
Key Quotes
24-hour view: “We expected GBP to edge upwards yesterday but we indicated that ‘any advance is viewed as a higher trading range of 1.2405/1.2475’. While our view for GBP to advance was correct, it strengthened more than expected as it rose to a high of 1.2486. GBP extended its advance in early Asian trade but while it could rise above 1.2510, overbought conditions suggest that it might not be able to break clearly above the month-to-date high of 1.2545 today (next resistance is at 1.2600). Support is at 1.2465; a break below 1.2440 would indicate that the current upward pressure in GBP has eased.”
Next 1-3 weeks: “Our latest narrative was from last Friday (21 Apr, spot at 1.2435) wherein the recent downward pressure has faded and GBP is likely to trade sideways between 1.2345 and 1.2510. Yesterday, GBP rose to a high of 1.2486 and upward momentum is building rapidly. A break of 1.2510 will not be surprising and will increase the odds for further GBP strength in the coming days. Overall, we expect GBP to trade with an upward bias as long as it does not break below 1.2415. Looking ahead, resistance levels are at 1.2545 and 1.2665.”
-
06:11
Gold Futures: Scope for further gains
Open interest in gold futures markets rose by around 1.3K contracts on Monday, partially reversing the previous daily drop according to preliminary readings from CME Group. Volume, instead, shrank for the third session in a row, this time by around 19.5K contracts.
Gold: Immediately to the upside comes $2000
Gold prices started the week with a decent uptick amidst rising open interest, which is supportive of further recovery in the short-term horizon. Next on the upside for the yellow metal appears the key $2000 mark per ounce troy.
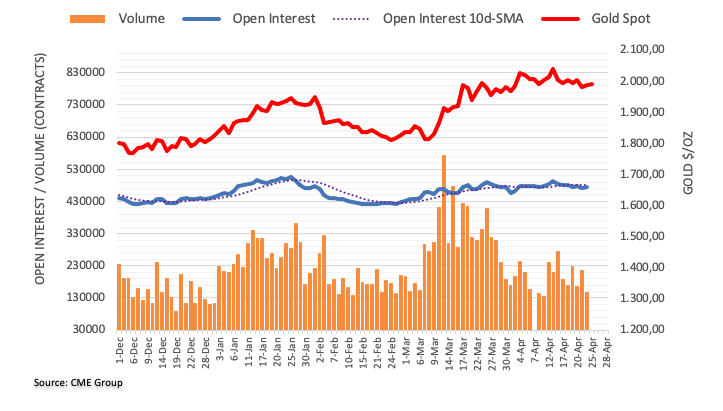
-
06:07
WTI Price Analysis: 100-EMA prods Oil buyers below $79.00
- WTI struggles to extend two-day rebound, sidelined of late.
- Bullish MACD signals, sustained trading above 200-EMA and one-week-old previous resistance line keep Oil buyers hopeful.
- Double bottom around $76.68 puts a floor under Commodity price.
WTI crude oil treads water around $78.70, pausing a two-day uptrend, as the market seeks fresh clues during early Tuesday. In doing so, the black gold makes rounds to the 100-bar Exponential Moving Average (EMA).
Although the energy benchmark seesaws around the short-term key EMA, its ability to stay beyond the 200-EMA level of $77.70, joins the bullish MACD signals to keep Oil buyers hopeful.
Also favoring the WTI bulls is the quote’s successful break of the previous resistance line from April 14, now immediate support near $78.20.
Additionally, the confirmation of a “Double bottom” bullish chart formation, via a sustained break of $78.30 trigger-point, adds strength to the bullish bias surrounding the WTI crude oil.
With this, the WTI crude oil buyers are well set to aim for the $80.00 round figure.
However, the previous support line from late March, around $81.05 by the press time, can challenge the WTI buyers, a break of which could quickly propel the quote towards the monthly high of $83.40.
Meanwhile, WTI crude oil sellers need validation from the double bottoms surrounding $76.68.
Following that, a downward trajectory towards the 50% and 61.8% Fibonacci retracement of its March-April upside, near $73.85 and $71.60 in that order, can’t be ruled out.
WTI crude oil price: Four-hour chart
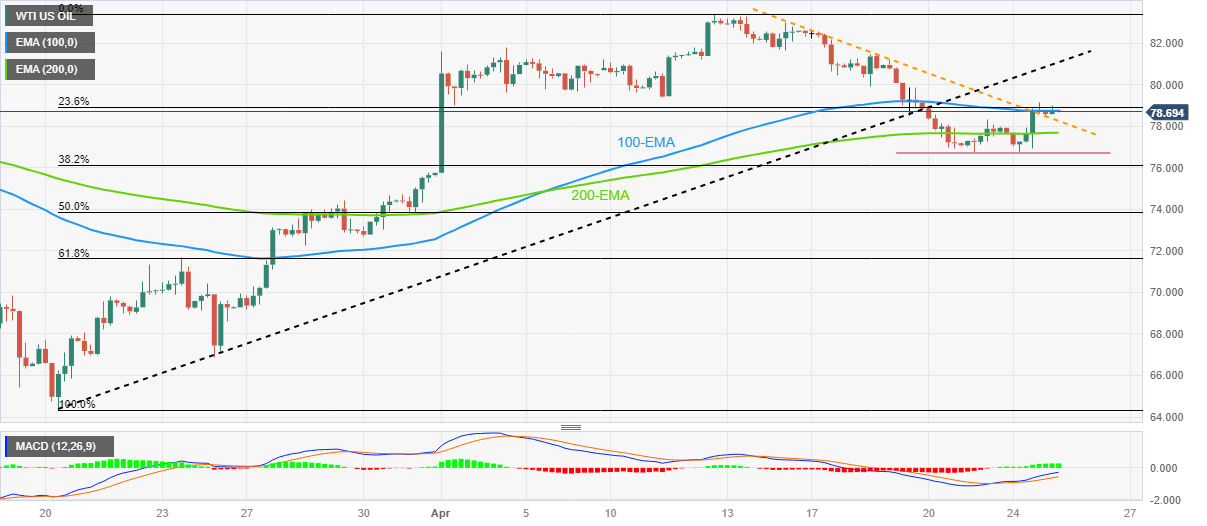
Trend: Further upside expected
-
06:00
EUR/USD could climb towards the 1.1120 level – UOB
UOB Group’s Economist Lee Sue Ann and Markets Strategist Quek Ser Leang note the upward momentum is building in EUR/USD, with the next target at 1.1120.
Key Quotes
24-hour view: “We noted yesterday that ‘the underlying tone has firmed somewhat’ and we expected EUR to edge higher. However, we were of the view that ‘a clear break above 1.1025 appears unlikely’. The anticipated EUR strength exceeded our expectations as EUR soared to a high of 1.1050. While the rapidly improving momentum suggests EUR is likely to advance further, it remains to be seen if it can maintain a foothold above the month-to-date high of 1.1075. The next major resistance at 1.1120 is unlikely to come into view today. The upward pressure is intact as long as EUR stays above 1.1010 (minor support is at 1.1025).”
Next 1-3 weeks: “Yesterday (24 Apr, spot at 1.0990) we highlighted that ‘downward pressure has eased’. We added, ‘The outlook is neutral for the time being and EUR is likely to trade sideways in a range of 1.0900/1.1050’. We did not anticipate the swift and sharp rise to 1.1050. Upward momentum is building rapidly and EUR is likely to trade with an upward bias from here. However, it has to break and stay above the month-to-date high of 1.1075 before a move to the next major resistance at 1.1120 is likely. All in all, only a break of 1.0975 (‘strong support’ level) would indicate that the build-up in momentum has faded.”
-
05:41
ECB’s Lane: Beyond May 4 meeting, further rate hikes will depend on data
European Central Bank (ECB) Chief Economist Philip Lane said on Tuesday, “current data suggest we have to raise interest rates again at the upcoming meeting.”
“Beyond May 4 meeting, further rate hikes will depend on data,” Lane clarified.
Additional comments
“This is still not the right time to stop raising rates.”
“Does not think that Europe is in a 70's style situation with regards to inflation.”
Market reaction
EUR/USD is keeping its consolidative mode intact at around 1.1050, as of writing. The pair is adding 0.10% on the day.
-
05:38
Gold Price Forecast: XAU/USD rebound needs validation from $2,010 and US GDP – Confluence Detector
- Gold price retreats from intraday high, fades week-start rebound.
- Sour sentiment puts a floor under US Dollar amid debt ceiling drama, pre-Fed consolidation.
- Softer US Q1 GDP, Core PCE Price Index can confirm Fed policy pivot talks and propel XAU/USD bulls.
- Fewer hurdles stand to challenge Gold Price upside past $2,010, XAU/USD sellers should wait for $1,987 break.
Gold price (XAU/USD) consolidates the last two-week losses as market sentiment dwindles amid a light calendar, allowing traders to better prepare for the key US Q1 GDP and Core PCE Price Index, the Fed’s favorite inflation gauge.
It’s worth noting, however, that the quote’s corrective bounce needs validation from the $2,000 psychological magnet and the aforementioned key US data as traders struggle with the US debt ceiling concerns and the pre-Fed preparations. Apart from the sour sentiment and pre-data/event consolidation, the Gold Price remains firmer amid the US Dollar’s failure to cheer the sour sentiment, despite stopping the further downside of the greenback.
Moving on, Gold price remains directed toward the north amid broad US Dollar weakness but the quote’s further upside needs validation from the downbeat US Q1 GDP and the Fed’s favorite inflation gauge.
Also read: Gold Price Forecast: XAU/USD needs to find acceptance above 21 DMA for further upside
Gold Price: Key levels to watch
As per out Technical Confluence indicator Gold price retreats from a convergence of the Bollinger on the one-day and Pivot Point one-day R1, around the $2,000 psychological magnet.
Following that, the $2,010 level becomes a tough nut to crack for the Gold price as it comprises the Pivot Point one week R1 and the previous monthly high.
In a case where the Gold price remains firmer past $2,010, the odds of witnessing a run-up towards the monthly high surrounding $2,050 can’t be ruled out.
Alternatively, Fibonacci 38.2% on one week and 23.6% on one day together highlight $1,987 as the immediate key support of around $1,987.
Should the Gold price remains weak past $1,987, the Fibonacci 61.8% on one day and 23.6% on one week will highlight the $1,980 as the last defense of the XAU/USD bulls.
Here is how it looks on the tool
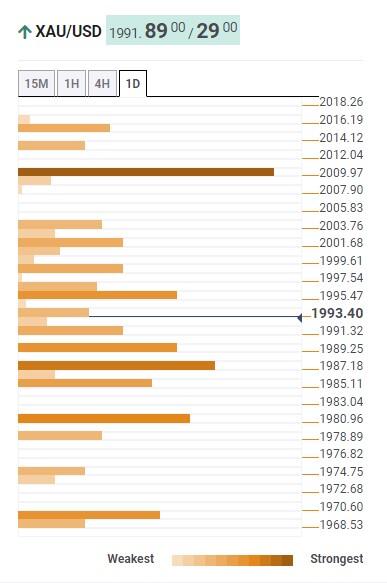
About Technical Confluences Detector
The TCD (Technical Confluences Detector) is a tool to locate and point out those price levels where there is a congestion of indicators, moving averages, Fibonacci levels, Pivot Points, etc. If you are a short-term trader, you will find entry points for counter-trend strategies and hunt a few points at a time. If you are a medium-to-long-term trader, this tool will allow you to know in advance the price levels where a medium-to-long-term trend may stop and rest, where to unwind positions, or where to increase your position size.
-
05:33
Asian Stock Market: Sell-off in US techs weighs on Asian indices, oil struggles around $79.00
- Investors dumped US technology stocks in anticipation of poor earnings and weak guidance.
- Japanese stocks remained positive as BoJ Ueda reiterates the need for an ultra-dovish monetary policy.
- South Korea’s KOSPI has witnessed an intense sell-off after mixed preliminary GDP data.
Markets in the Asian domain are facing immense selling pressure as a sell-off in United States technology stocks recorded on Monday ahead of their quarterly earnings. This week, investors will remain busy amid quarterly results from Amazon, Google, Meta Platforms, and Microsoft. Investors are worried that the impact of higher interest rates from the Federal Reserve (Fed) will be visible in their corporate earnings and they may also impact the revenue guidance.
S&P500 futures are showing significant losses in the Asian session after a choppy Monday, portraying caution among market participants. The US Dollar Index (DXY) has found an intermediate cushion around 101.20 after a rigorous sell-off. The downside in the USD Index seems favored as investors have digested anticipation of consecutive 25 basis points (bps) interest rate hike from the Federal Reserve (Fed).
At the press time, Japan’s Nikkei 225 gained 0.23%, Shanghai dropped 0.35%, Hang Seng plummeted 1.54%, KOSPI dived 1.78%, and Nifty50 remains flat.
Japanese stocks have hogged the limelight as investors are anticipating a continuation of the expansionary monetary policy stance from Bank of Japan (BoJ) Governor Kazuo Ueda. While speaking in the Japanese parliament on Tuesday, new BoJ Governor Kazuo Ueda said, “Trend inflation remains below 2% but gradually accelerating, which is partly due to the effect of monetary easing.” He further added, “It takes very long for the impact of monetary policy steps to appear on economy, prices.
South Korea’s KOSPI has witnessed an intense sell-off after mixed preliminary Gross Domestic Product (GDP) data. The South Korean economy has grown by 0.3% in the first quarter of CY2023 while the street was anticipating a growth rate of 0.2%. On an annual basis, the GDP has declined to 0.8% from the estimates of 0.9%.
On the oil front, oil prices are attempting to overstep the immediate resistance of $79.00. The oil price rebounded on Monday as investors believe that a steady interest rate guidance from the Fed will recede recession fears.
-
05:05
USD/INR Price News: Indian Rupee bulls take a breather around 81.90 amid risk aversion
- USD/INR rebounds from one-week low, snaps three-day losing streak.
- Anxiety surrounding US debt ceiling expiration joins consolidation ahead of top-tier US data to weigh on sentiment.
- Upbeat Oil price also prod Indian Rupee buyers ahead of India fiscal deficit statistics.
USD/INR bounces off the lowest level in a week as it picks up bids to 81.90 during early Tuesday in Europe. In doing so, the Indian Rupee (INR) pair takes clues from the market’s risk appetite and upbeat Oil price amid a sluggish session.
Markets remain downbeat as anxiety over the US debt ceiling deal escalates amid the policymakers’ inability to agree on the much-awaited decision. Recently, Bloomberg said that Kevin McCarthy and his vote-counting lieutenants are telling fellow Republicans they will not change their $1.5 trillion debt-ceiling proposal, despite rank-and-file GOP demands for alterations.
Not only the fears of US government default but the market’s preparations for the Federal Reserve’s (Fed) 0.25% rate hike, as well as the policy pivot and rate cut afterward, also seem to weigh on the sentiment.
While portraying the mood, S&P 500 Futures print mild losses near 4,155 as it snaps a two-day uptrend after mixed closing of the Wall Street benchmarks. On the other hand, the US Treasury bond yields highlight the rush for risk safety as the benchmark 10-year bond coupons drop to 3.48% at the latest. More importantly, the difference between the one-month and the three-month US Treasury bond yields widen the most since 2001 as the coupons flash 3.48% and 4.98% mark of late.
Apart from the risk-off mood, which puts a floor under the US Dollar, the upbeat prices of WTI Crude Oil also weigh on the INR due to India’s reliance on energy demand and record high deficit. That said, WTI Crude Oil prints mild gains around $78.80, up for the third consecutive day.
Looking forward, US Conference Board’s (CB) Consumer Confidence gauge for April, expected to remain steady near 104.1 versus 104.2 prior, will be important for the intraday directions. However, major attention should be given to Thursday’s US Q1 GDP and Friday’s India Federal Fiscal Deficit for March.
Technical analysis
USD/INR fades bounce off an upward-sloping support line from early November 2022, around 81.78 by the press time, as a convergence of the 100-DMA and 50-DMA challenges the Indian Rupee bears, close to 82.30 at the latest.
-
04:53
EUR/USD faces barricades above 1.1060, upside looks likely ahead of US GDP
- EUR/USD has dropped after failing to sustain above 1.1060 as USD Index has attempted a recovery.
- Losses in the S&P500 futures are escalating amid anxiety ahead of US GDP figures and corporate profits.
- Preliminary annualized GDP (Q1) is expected to decline to 2% from the former release of 2.6%.
The EUR/USD pair has faced some selling pressure after climbing above 1.1060 in the Asian session. A loss in the upside momentum in the major currency pair is backed by a recovery attempt by the US Dollar Index (DXY). The USD Index has rebounded after printing a weekly low of 101.20, however, the downside seems favored amid the absence of supportive triggers.
Losses in the S&P500 futures are escalating in the Asian session amid anxiety ahead of United States Gross Domestic Product (GDP) figures and corporate profits. The week is going to be pretty busy as two FAANG stocks will report their quarterly results. Meta Platforms (Facebook), and Google. Also, Microsoft will come forward with quarterly earnings and revenue guidance.
Meanwhile, overall weakness in the USD Index has weighed heavily on US Treasury yields. The 10-year US Treasury yields have dropped below 3.48%.
A power-pack action is anticipated in the USD Index amid the release of the US GDP numbers on Thursday. Preliminary annualized GDP (Q1) is expected to decline to 2% from the former release of 2.6%. This could trigger fears of a slowdown in the US economy.
But before that, US Durable Goods Orders data will be keenly watched. March Durable Goods Orders data is seen expanding by 0.8% vs. a contraction of 1.0%.
On the Eurozone front, European Central Bank (ECB) Governing Council member and Bank of France head Francois Villeroy de Galhau said on Monday, “Central banks’ core mandate worldwide is price stability and climate change already affects the level of prices and activity.”
-
04:23
USD/MXN Price Analysis: Finds cushion below 18.00 amid a recovery in USD Index
- USD/MXN has managed to recapture the critical resistance of 18.00 amid a recovery in the US Dollar.
- S&P500 futures have extended their losses as investors are cautious ahead of quarterly results from giant technology stocks.
- USD/MXN is auctioning in a Descending Triangle chart pattern, which indicates a volatility contraction.
The USD/MXN pair has extended its recovery above the potential resistance of 18.00 in the Asian session. A recovery attempt by the US Dollar Index (DXY) after a nosedive move has infused some strength in the major. The USD Index has rebounded after printing a fresh weekly low of 101.20. The USD Index still needs to fulfill a lot of filters to prove a reversal.
S&P500 futures have extended their losses in the Asian session as investors are cautious ahead of quarterly results from giant technology stocks. The demand for US government bonds has increased as the Federal Reserve (Fed) is expected to deliver a neutral interest rate guidance after a 25 basis point (bp) interest rate hike.
USD/MXN is auctioning in a Descending Triangle chart pattern on a two-hour scale, which indicates a volatility contraction. The downward-sloping trendline of the aforementioned chart pattern is plotted from April 05 high at 18.40 while the horizontal support is placed from April 03 low at 17.96. The 20-period Exponential Moving Average (EMA) at 18.00 is overlapping the asset, indicating a sideways performance.
Also, the Relative Strength Index (RSI) (14) is oscillating in the 40.00-60.00 range, signaling an absence of a potential trigger.
A breakdown of April 03 low at 17.96 will drag the asset to a fresh five-year low below 26 September 2017 low at 17.88 followed by 25 September 2017 low at 17.72.
On the flip side, a break above April 19 high at 18.15 will drive the asset toward April 05 high at 18.40 and March 14 low at 18.55.
USD/MXN two-hour chart
-638179897662644835.png)
-
03:51
AUD/USD justifies risk barometer status to drop towards 0.6650 amid sour sentiment
- AUD/USD takes offers to refresh intraday low, reverses week-start bounce from the lowest levels in fortnight.
- Market sentiment dwindles amid US debt ceiling concerns, cautious mood ahead of top-tier data/events.
- Fed blackout, off in Australia allow traders to consolidate recent moves.
- US CB Consumer Confidence, yields eyed for intraday directions.
AUD/USD renews its intraday low near 0.6680 amid sour sentiment during early Tuesday. In doing so, the Aussie pair reverses the corrective bounce from a two-week low marked the previous day.
While watching over the risk catalysts, escalated indecision among the US policymakers amid the looming debt ceiling expiration in June weighs on the market sentiment of late. On the same line is the trader’s preparation for the US Federal Reserve’s (Fed) one last rate hike, worth 0.25%, in May before signaling the policy pivot.
“Kevin McCarthy and his vote-counting lieutenants are telling fellow Republicans they will not change their $1.5 trillion debt-ceiling proposal, despite rank-and-file GOP demands for alterations,” said Bloomberg on Monday.
On the other hand, CME’s FedWatch Tool hints at an almost 90% probability of the US central bank’s 0.25% rate lift in May. However, concerns surrounding a policy pivot and rate cuts in 2023 seem to keep traders on their toes.
Additionally, the geopolitical fears surrounding Russia and China join the market’s cautious mood ahead of this week’s top-tier growth and inflation data to prod the sentiment. China’s alleged support to Moscow in fighting with Ukraine joins the Western readiness to increase sanctions on the Oil-rich nation to weigh on sentiment.
Against this backdrop, S&P 500 Futures print mild losses near 4,155 as it snaps a two-day uptrend after mixed closing of the Wall Street benchmarks. On the other hand, the US Treasury bond yields highlight the rush for risk safety as the benchmark 10-year bond coupons drop to 3.48% at the latest. More importantly, the difference between the one-month and the three-month US Treasury bond yields widen the most since 2001 as the coupons flash 3.48% and 4.98% mark of late.
Given the ANZAC Day holidays in Australia and New Zealand, the AUD/USD pair may extend the latest fall amid mildly downbeat markets. However, US Conference Board’s (CB) Consumer Confidence gauge for April, expected to remain steady near 104.1 versus 104.2 prior, will be important for the intraday directions.
Technical analysis
AUD/USD retreats from the 21-DMA hurdle surrounding 0.6705, which in turn joins downbeat oscillators to direct the Aussie pair sellers toward an upward-sloping support line from early March, close to 0.6650 at the latest.
-
03:35
BoJ Governor Ueda: Trend inflation remains below 2% but gradually accelerating
While speaking in the Japanese parliament on Tuesday, new Bank of Japan (BoJ) Governor Kazuo Ueda said, “trend inflation remains below 2% but gradually accelerating, which is partly due to the effect of monetary easing.”
Additional quotes
It takes very long for impact of monetary policy steps to appear on economy, prices.
Monetary policy steps taken now will affect economy, prices half-year, 1 year, 1.5 years ahead.
Tightening monetary policy now could push down inflation in future, which is already likely to slow on dissipating effect of import costs.
If we see risk of runaway inflation, we must normalize monetary policy.
We see risk of inflation undershooting forecast as bigger than risk of overshooting, which is why BoJ must maintain easy policy now.
Market reaction
At the time of writing, USD/JPY is off the highs, holding steady at around 134.15. Investors digest the commentary from BoJ Governor Ueda.
-
03:30
Commodities. Daily history for Monday, April 24, 2023
Raw materials Closed Change, % Silver 25.16 0.39 Gold 1988.91 0.34 Palladium 1535.19 -3.88 -
03:28
USD/JPY Price Analysis: Yen buyers lurk around 134.00 support confluence on BoJ concerns
- USD/JPY rebounds from short-term key support confluence, struggles to extend week-start gains.
- 50-SMA, one-week-old ascending trend line resistances immediate downside; bulls need validation from 1.5-month-long horizontal area.
- Sluggish oscillators, key technical levels suggest Yen pair’s further grinding towards the north.
USD/JPY recovers from an intraday low of 134.00, near 134.25 by the press time, as the bulls struggle to defend the week-start gains amid sluggish Tuesday morning. In doing so, the Yen pair justifies comments from the newly appointed Bank of Japan (BoJ) Governor Kazuo Ueda in the Japanese parliament.
Also read: BoJ Ueda: It is reasonable to continue easing with YCC
Apart from the BoJ Governor Ueda’s defense of the easy money policy, a convergence of the 50-SMA and a one-week-old ascending trend line, around 134.00 by the press time, also triggers the USD/JPY pair’s rebound.
Given the steady RSI (14) and the sluggish MACD, the Yen pair is likely to extend the latest rebound from the key support.
However, a horizontal area comprising multiple levels marked since March 10, close to 135.05-15, appears a tough nut to crack for the USD/JPY bulls.
Following that, 135.50 and the 136.00 round figure could test the pair buyers ahead of directing them to the previous monthly top of around 137.90.
Alternatively, pullback moves remain elusive unless the quote stays beyond the 134.00 support confluence.
Even if the USD/JPY price breaks the 134.00 support, an upward-sloping trend line from April 05, around 133.65 at the latest, can prod the bears before giving them control.
USD/JPY: Four-hour chart
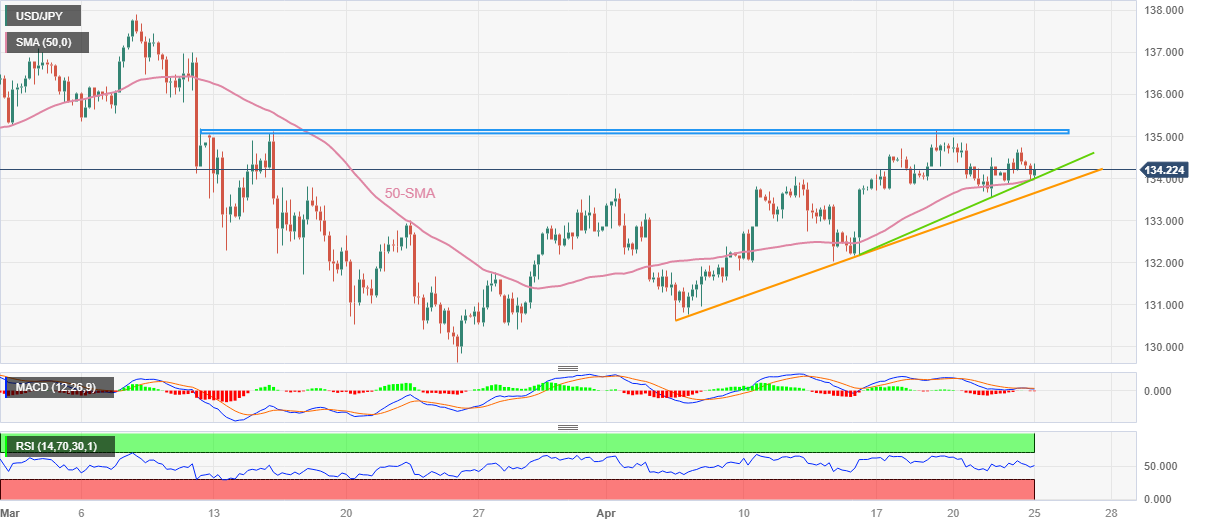
Trend: Further recovery expected
-
03:09
Natural Gas Price Analysis: XNG/USD retreat appears elusive amid impending Golden Cross near $2.50
- Natural Gas price snaps three-day winning streak as bulls take a breather at one-week high.
- 50-SMA pierces 200-SMA from below, suggesting strength of short-term bullish bias.
- 1.5-month-old descending resistance line challenges immediate XNG/USD upside.
- Key SMAs, fortnight-long horizontal support prod Natural Gas sellers amid upbeat RSI (14).
Natural Gas Price (XNG/USD) prints the first intraday loss, so far, in four as the quote eases from a one-week high to $2.48 amid early Tuesday. In doing so, the XNG/USD takes a U-turn from a six-week-old descending resistance line.
However, the energy instrument’s sustained trading beyond the 200-SMA and 50-SMA, as well as the previous horizontal resistance, now the key support zone, keeps the Natural Gas buyers hopeful. Adding strength to the upside bias is the firmer conditions of the RSI (14) line, not overbought.
That said, the quote’s latest weakness also appears elusive as the 50-SMA crosses the 200-SMA from below and portrays a “Golden Cross” bullish signal for the XNG/USD price.
Even if the quote slips beneath the looming bullish moving average crossover, around $2.37 by the press time, a horizontal area comprising multiple levels marked since April 11, close to $2.36-35, appears a tough nut to crack for the XNG/USD bears.
Meanwhile, the Natural Gas price run-up beyond the aforementioned resistance line from early March, close to $2.51 by the press time, needs validation from the monthly high of $2.54 to convince the XNG/USD bulls.
Following that, a run-up toward the mid-March swing high of around $2.74 can’t be ruled out.
Natural Gas Price: Four-hour chart
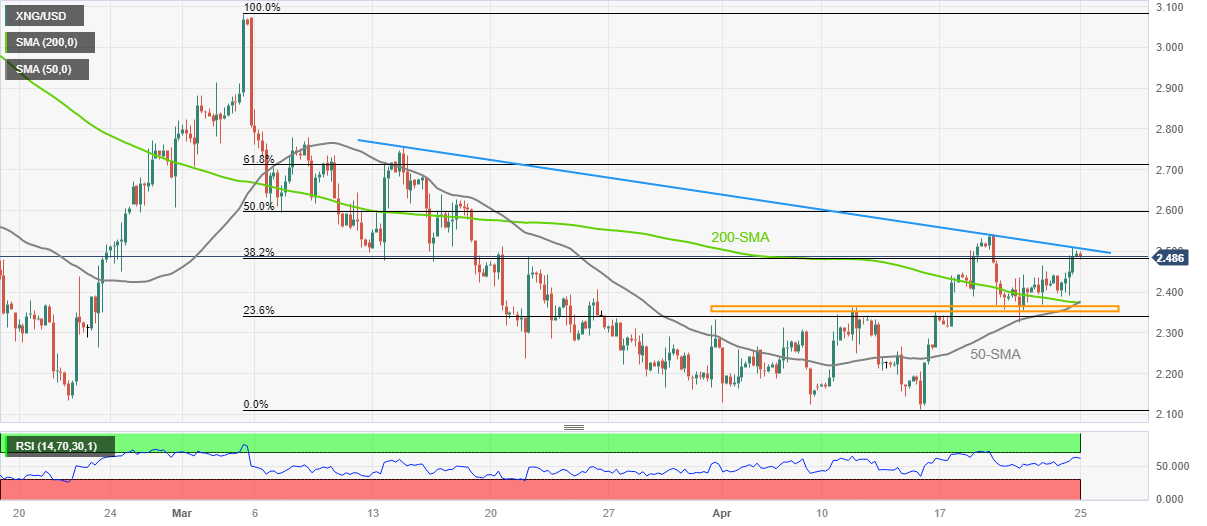
Trend: Recovery expected
-
02:59
USD/CAD Price Analysis: Bears taking over, eye the trendline support
- USD/CAD bears are making their moves in Asia.
- The bears look to the 38.2% Fibonacci and trendline support.
USD/CAD is on the front side of the trendline with a test of the prior resistance failing near the 1.3570s. Should the bears commit at this area of resistance, then a bearish correction could unfold along the lines of the following:
USD/CAD daily charts

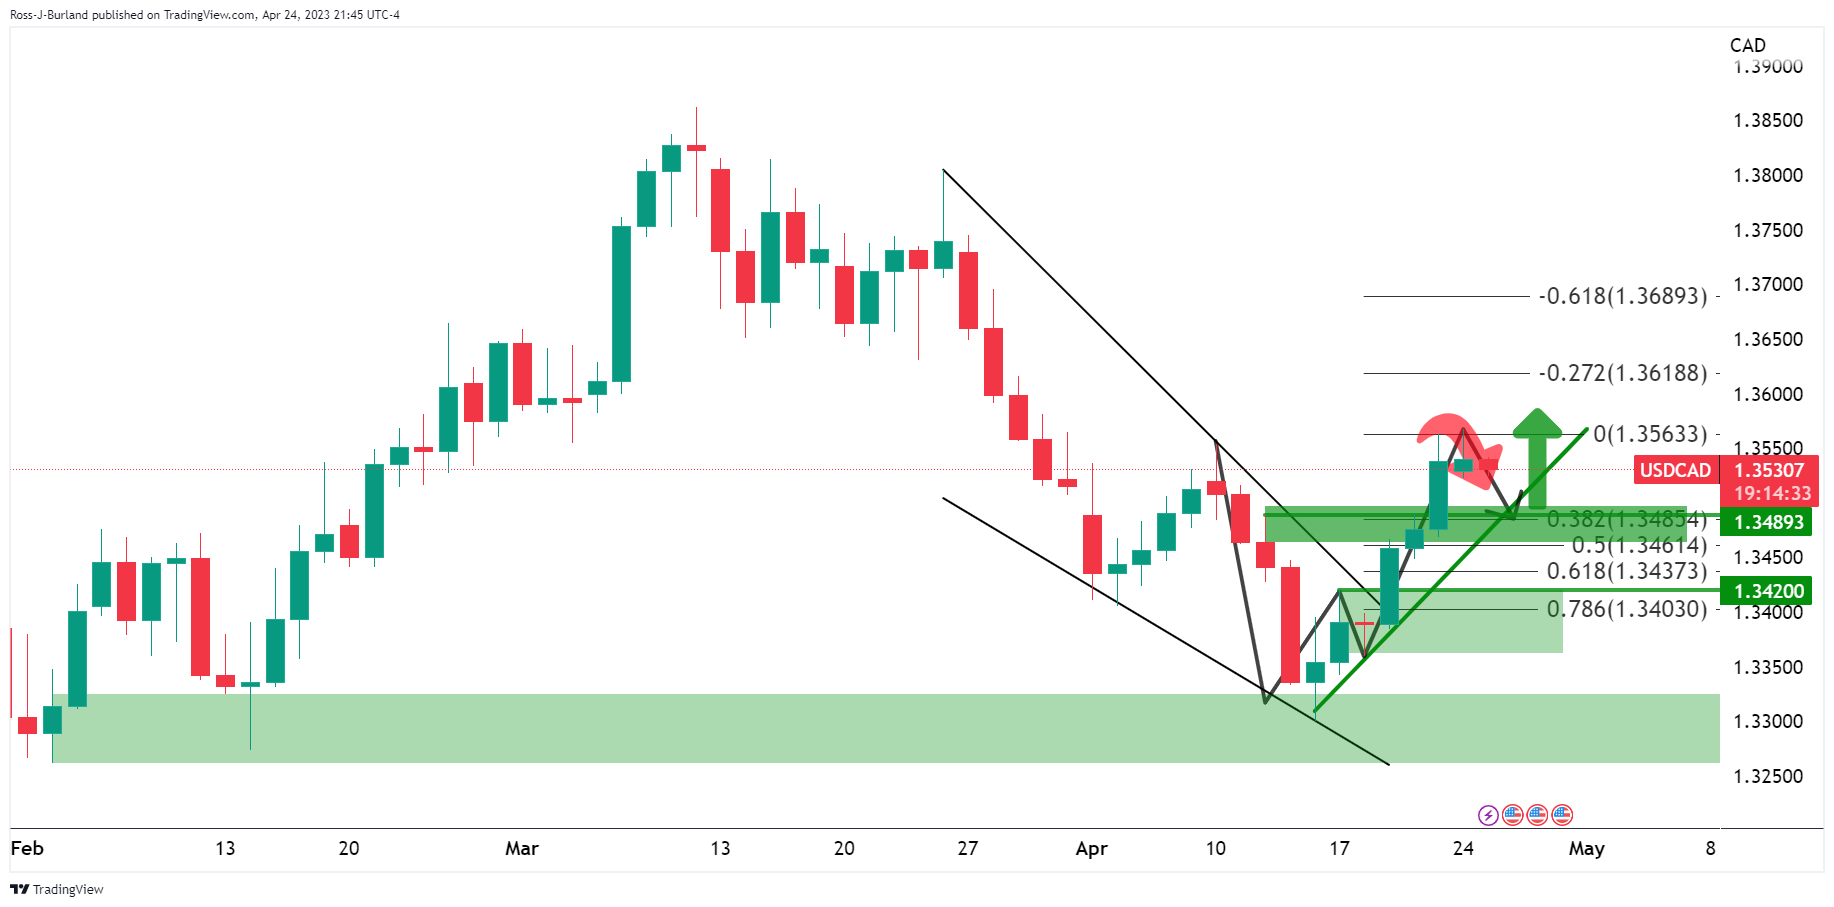
The W-formation is compelling and could draw in the price towards the 38.2% Fibonacci if not deeper toward the neckline of the pattern.
The supporting trendline would be expected to hold initial tests and could potentially see the bulls emerge again considering the break out of the bullish falling wedge.

The 38.2% Fibonacci comes in around the 1.3480s and could be met in the coming sessions.
-
02:49
Japan's Cabinet Office maintains moderate view on economic recovery
In its monthly economic report published early Tuesday, the Japanese Cabinet Office maintained the overview of the economy that it was on a moderate recovery.
Key takeaways
“Japan raised its official assessment of imports for the first time in nine months.”
“Japan's imports are generally staying flat, modifying a previous expression that they were weak.”
“Yen's double-digit depreciation from a year earlier bumped up the value of imported goods.”
“The government recognized rising bankruptcies (previously said they were staying at low levels).”
“Maintained a warning against global financial volatility it added last month in response to Western bank collapses.”
Market reaction
Despite the upbeat report from Japan, USD/JPY is testing daily hghs near 134.35, courtesy of dovish remarks from Bank of Japan (BoJ) Governor Kazuo Ueda. The pair is up 0.09% on the day.
-
02:44
GBP/USD aims to shift auction above 1.2500 as USD Index eyes more downside
- GBP/USD is gathering strength to shift its auction above $1.2500 amid a sell-off in the USD Index.
- The Fed might go for a steady stance on the interest rate guidance to recede fears of a US economic slowdown.
- Further quantitative tightening is expected from the BoE as UK inflation is stuck in double-digit territory.
The GBP/USD pair has reclaimed the psychological resistance of 1.2500 in the Asian session. The Cable has shown a stellar upside move amid weakness in the US Dollar Index (DXY). The USD Index has refreshed its weekly low at 101.20 and more downside is in pipeline as investors are anticipating that the Federal Reserve (Fed) will conclude its quantitative tightening program after a 25 basis point (bp) interest rate hike in May.
S&P500 futures are showing marginal losses in the Asian session after a moderately positive Monday, portraying a decline in the risk appetite of investors. This week, the 500-US stocks basket is expected to show sheer volatility as big technology boys will report first-quarter results of CY2023. Meta Platforms, Google, and Microsoft will present their quarterly performance and revenue guidance, which will keep investors on the tenterhooks.
The impact of the battered USD Index can also be seen in US Treasury yields. The return offered on 10-year US Treasury bonds has dropped to near 3.48%.
This week, the USD Index is expected to remain in action ahead of the preliminary Gross Domestic Product (GDP) data, which is scheduled for Thursday. Annualized (Q1) GDP is expected to contract to 2.0% vs. the former release of 2.6%. A decline in GDP numbers would fuel fears of a slowdown in the United States economy. This may also force the Fed to go for a steady stance on interest rate guidance.
On the United Kingdom front, odds for a hawkish Bank of England (BoE) monetary policy are rising as United Kingdom’s inflation seems sticky with a double-digit figure amid a shortage of labor and galloping food inflation. UK’s food inflation has already roared to a 45-year high at 19.1% and is showing no evidence of softening yet. BoE Governor Andrew Bailey may look for raising rates further by 25 bps to 4.5%.
-
02:41
S&P 500 Futures snap two-day winning streak as US Treasury bond yields portray market fears
- Risk appetite wanes amid US debt ceiling drama, geopolitical woes.
- S&P 500 Futures print mild losses after two-day uptrend as week-start optimism fades.
- Difference between US one-month and three month Treasury bond yields widens the most since 2001.
- US CB Consumer Confidence eyed for intraday directions, risk catalysts are the key.
Market sentiment remains fragile amid anxiety ahead of the US debt ceiling expiration, as well as the key US data and events. Adding strength to the downbeat mood are the market’s preparations for the Federal Reserve’s (Fed) dovish hike in the next week, as well as fears that geopolitical concerns and higher rates could tame global economic growth.
Amid these plays, S&P 500 Futures print mild losses near 4,155 as it snaps a two-day uptrend after mixed closing of the Wall Street benchmarks. On the other hand, the US Treasury bond yields highlight the rush for risk safety as the benchmark 10-year bond coupons drop to 3.48% at the latest. More importantly, the difference between the one-month and the three-month US Treasury bond yields widen the most since 2001 as the coupons flash 3.48% and 4.98% mark of late.
Fears of US debt ceiling expiration, looming in June, escalate as the US policymakers keep jostling over the details. On Monday, US House Speaker Kevin McCarthy signaled no intention of altering the debt ceiling, which in turn flags a tough road for the key decision as multiple proposals from the Democrats need such a move.
“Kevin McCarthy and his vote-counting lieutenants are telling fellow Republicans they will not change their $1.5 trillion debt-ceiling proposal, despite rank-and-file GOP demands for alterations,” said Bloomberg on Monday.
Elsewhere, markets also prepare for the US Federal Reserve’s (Fed) one last rate hike, worth 0.25%, in May before signaling the policy pivot, which in turn weigh on the yields as higher rates propel recession woes.
It should be noted that the geopolitical fears surrounding Russia and China join the market’s cautious mood ahead of this week’s top-tier growth and inflation data to prod the sentiment. China’s alleged support to Moscow in fighting with Ukraine joins the Western readiness to increase sanctions on the Oil-rich nation to weigh on sentiment.
Alternatively, hopes of gradual economic recovery and an upbeat earnings season allow the optimists to battle the market’s negativity. On Tuesday, a slew of top-tier companies like General Electric, Microsoft, Alphabet and UPS are up for publishing their first quarter (Q1) results.
Looking ahead, US Conference Board’s (CB) Consumer Confidence gauge for April, expected to remain steady near 104.1 versus 104.2 prior, will be important for the intraday directions of the market. However, major attention will be given to US Q1 GDP, US Core PCE Price Index and the yields for a clear guide.
Also read: Forex Today: US Dollar loses momentum as Treasury yields slide
-
02:20
BoJ Ueda: It is reasonable to continue easing with YCC
New Bank of Japan (BoJ) Governor Kazuo Ueda speaking in Parliament says it is appropriate to continue with yield curve control, YCC.
Key comments
Japan's yield curve is now smooth.
It is reasonable to continue easing with YCC.More to come...
-
02:17
USD/CNY fix: 6.8847 vs. estimate of 6.8853
In recent trade today, the People’s Bank of China (PBOC) set the yuan at 6.8847 vs. an estimate of 6.8853 and the last close 6.8947.
About the fix
China maintains strict control of the yuan’s rate on the mainland.
The onshore yuan (CNY) differs from the offshore one (CNH) in trading restrictions, this last one is not as tightly controlled.
Each morning, the People’s Bank of China (PBOC) sets a so-called daily midpoint fix, based on the yuan’s previous day's closing level and quotations taken from the inter-bank dealer.
-
02:09
Japanese Trade Minister: Want to provide support for next-gen chips as needed
The Japanese trade minister has crossed the wires and said they want to provide support for next-gen chips as needed.
Key comments
- Decided on 260b yen additional subsidy for Rapidus.
- Have not heard ukraine has asked to join CPTPP trade pact.
- If Ukraine joined EU, it, as a EU member, would not be able to join CPTPP.
Meanwhile, the Bank of Japan´s governor Ueda is scheduled to appear in parliament currently.
As for the Yen, USD/JPY is heading a touch higher, with eyes on 134.50 and 134.70, currently at 134.30 and bid on the front side of the bullish daily trendline.
-
02:07
EUR/USD Price Analysis: Marches towards 1.1100 key psychological hurdle
- EUR/USD prints four-day uptrend as it approaches 11-week-old resistance line.
- Sustained trading above key support lines keep Euro buyers hopeful.
- Nearly overbought RSI (14) prods further upside; bears need validation from 1.0955.
EUR/USD picks up bids to refresh a one-week high with 1.1066 as bulls keep the reins during early Tuesday, portraying a four-day uptrend of late.
The Euro pair’s latest rebound could be linked to its successful rebound from the one-month-old ascending support line, as well as an upward-sloping trend line from the mid-March, respectively near 1.0985 and 1.0955 in that order.
However, a downward-sloping resistance line from early February 2023, close to 1.1085 at the latest, could join the nearly overbought conditions of the RSI (14) line to challenge the EUR/USD bulls past 1.1085.
Even if the quote remains firmer past 1.1085, the 1.1100 psychological magnet can prod the EUR/USD bulls before directing them to the March 2022 peak of around 1.1185.
On the contrary, EUR/USD bears may initially aim for the 1.1000 round figure before highlighting the aforementioned support lines near 1.0985 and 1.0955.
It should be noted that March’s high of around 1.0930 can act as an extra filter towards the south if at all the Euro pair drops below 1.0955 support.
Following that, the monthly low of near 1.0788 gains the market’s attention and give control to the EUR/USD bears.
Overall, EUR/USD is likely to remain firmer even if the upside room appears limited.
EUR/USD: Daily chart

Trend: Limited upside expected
-
02:00
NZD/USD Price Analysis: Advances towards 0.6200 after a consolidation breakout
- NZD/USD is struggling to shore above 0.6180, however, the upside seems favored.
- US Durable Goods Orders data is seen expanding by 0.8% vs. a contraction of 1.0%.
- NZD/USD is in a markup phase after a test of the breakout region of the consolidation.
The NZD/USD pair has recorded a steep run after shifting its business above 0.6150 in the Asian session. The Kiwi asset has shifted into a bullish trajectory amid a sell-off in the US Dollar Index (DXY). The USD Index has continued its declining trend to near 101.20 as the Federal Reserve (Fed) is set to announce a pause in the rate-hiking spree after a consecutive 25 basis point (bp) rate hike in May.
The USD Index is expected to remain in action ahead of the United States Durable Goods Orders data, which will release on Wednesday. For March, the Durable Goods Orders data is seen expanding by 0.8% vs. a contraction of 1.0%. Upbeat economic data will indicate a recovery in forward demand.
The New Zealand Dollar will show immense action after the release of Trade Balance data on Wednesday.
NZD/USD is in a markup phase after a test of the breakout region of the consolidation formed in a range of 0.6125-0.6156 on an hourly scale. The 20-period Exponential Moving Average (EMA) at 0.6158 is providing support to the New Zealand Dollar bulls.
The Relative Strength Index (RSI) (14) is oscillating in the bullish range of 60.00-80.00, indicating that the upside momentum is active.
Should the asset go for a healthy correction to near the 10-EMA at 0.6165, a bargain buy opportunity will emerge, which will drive the Kiwi asset toward the round-level resistance at 0.6200. A breach of the latter will allow the Kiwi to report a fresh weekly high above April 19 high at 0.6227.
Alternatively, a breakdown of April 20 low at 0.6148 will drag the asset toward April 24 low at 0.6125 followed by the round-level resistance at 0.6100.
NZD/USD hourly chart

-
01:45
Gold Price Forecast: XAU/USD approaches $2,000 amid downbeat United States Treasury bond yields, US Dollar
- Gold price extends week-start recovery from a short-term key support line, renews intraday high of late.
- United States Treasury bond yields, US Dollar decline amid debt ceiling drama.
- XAU/USD market also seems to brace for dovish Federal Reserve, downbeat US Gross Domestic Product (GDP).
- US CB Consumer Confidence can direct intraday moves, risk catalysts are the key.
Gold price (XAU/USD) picks up bids to refresh intraday high near $1,996 as it stretches the previous day’s rebound from a five-week-old ascending support line during early Tuesday. In doing so, the bright metal cheers downbeat the United States Treasury bond yields and the US Dollar as markets prepare for the key US Gross Domestic Product and the Federal Reserve (Fed) outcomes. Also weighing on the US bond coupons and the greenback are concerns surrounding the US debt ceiling which is likely to expire in June.
Gold price rebounds as United States Treasury bond yields weigh on US Dollar
Gold price marches amid fears that the United States is reaching its debt limit expiration in June. A political drama ahead of that keeps traders on their toes and pushes them towards the risk-safety, which in turn propelled the demand for one-month US Treasury bond yields. On the same line, are the clues that the US Federal Reserve (Fed) could announce one last rate hike, worth 0.25%, in May before signaling the policy pivot.
With this, the difference between one-month and three-month US Treasury bond yields widen the most since 2001. As a result, the US Dollar Index (DXY) remains depressed near 101.30 as it drops for the fourth consecutive day.
“The dollar fell to a more than one-week low against major currencies on Monday in generally thin trading, as investors continued to price in interest rate cuts this year by the Federal Reserve after a widely expected rate increase at next week's policy meeting,” said Reuters in this regard.
Downbeat United States data also favors XAU/USD buyers
Apart from the concerns surrounding the US debt ceiling and the Fed, recently softer US data also weigh on the US Dollar and allow the XAU/USD to remain firmer. That said, the Federal Reserve Bank of Chicago's National Activity Index (CFNAI) remained unchanged at -0.19 versus the -0.02 expected. However, the publication added that the index’s three-month moving average, CFNAI-MA3, increased to +0.01 in March from –0.09 in February. On the other hand, Dallas Fed Manufacturing Business Index for the said month dropped to 23.4 for April versus -14.6 expected and -15.7 prior.
It’s worth noting, however, that the geopolitical fears surrounding Russia and China join the market’s cautious mood ahead of this week’s top-tier growth and inflation data to prod the Gold buyers. That said, hopes of gradual economic recovery and an upbeat earnings season allow the US Dollar buyers to stay hopeful. Furthermore, geopolitical fears surrounding Russia, due to China’s alleged support to Moscow in fighting with Ukraine, as well as amid the Western readiness to increase sanctions on the Oil-rich nation, prod the market’s cautious optimism and put a floor under the US Dollar price.
Looking forward, US Conference Board’s (CB) Consumer Confidence gauge for April, expected to remain steady near 104.1 versus 104.2 prior, will be important for the intraday directions of the DXY. However, major attention will be given to US Q1 GDP, US Core PCE Price Index and the yields for a clear guide.
Gold price technical analysis
Gold price pierces a one-week-old descending resistance line as it approaches the 50-bar Simple Moving Average (SMA) of around $2,003 amid bullish signals from the Moving Average Convergence and Divergence (MACD) indicator. Also favoring the XAU/USD buyers is the steady Relative Strength Index (RSI) line, placed at 14.
With this, the bullion appears well set for further upside and can well aim for the monthly high of around $2,049.
On the contrary, Gold sellers need validation from a five-week-old ascending support line, around $1,980 by the press time, to retake controls.
Following that, the 200-bar SMA level of around $1,966 and the late March low surrounding $1,935 may gain the XAU/USD bear’s attention.
It’s worth noting that the XAU/USD weakness past $1,935 can quickly drag the quote towards the 61.8% Fibonacci retracement of its March-April upside, near the $1,900 threshold.
Gold price: Four-hour chart
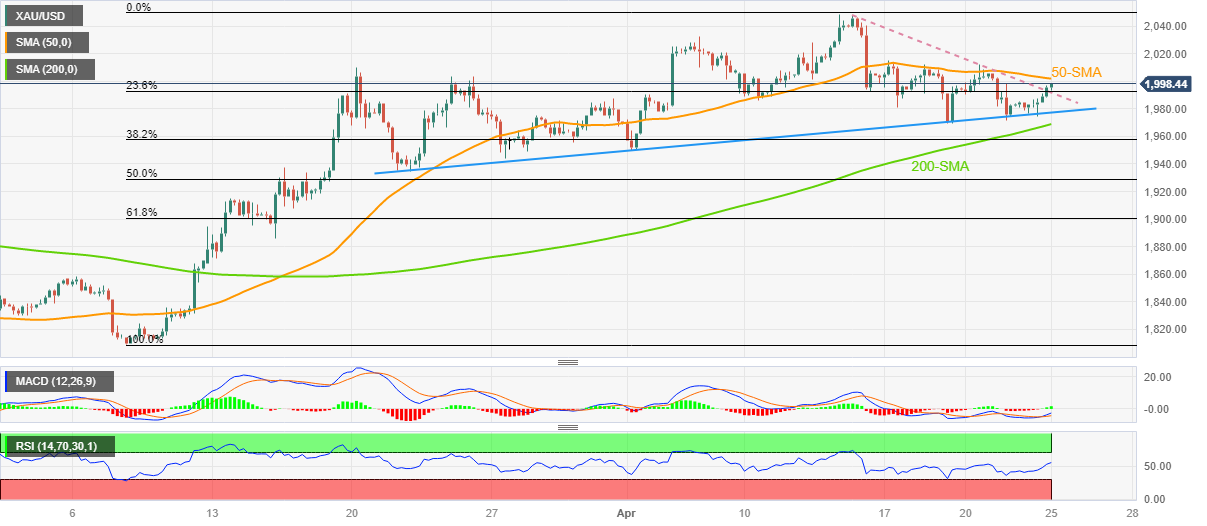
Trend: Limited upside expected
-
01:43
AUD/USD Price Analysis: Where are the bears hibernating?
- AUD/USD bulls move in to test bear´s commitments.
- AUD/USD bears need to show up by the 0.6720s or below.
As per the prior analysis, AUD/USD Price Analysis: Bears aligned below 0.6710, we have seen the price pressured lower, but bulls have put up a good fight, so far. The following illustrates downside prospects while below 0.6710 still.
AUD/USD prior analysis
It was stated that the M-formation on the daily chart may act as the peak formation in a correction and lead to a move lower to break the structure on the downside.
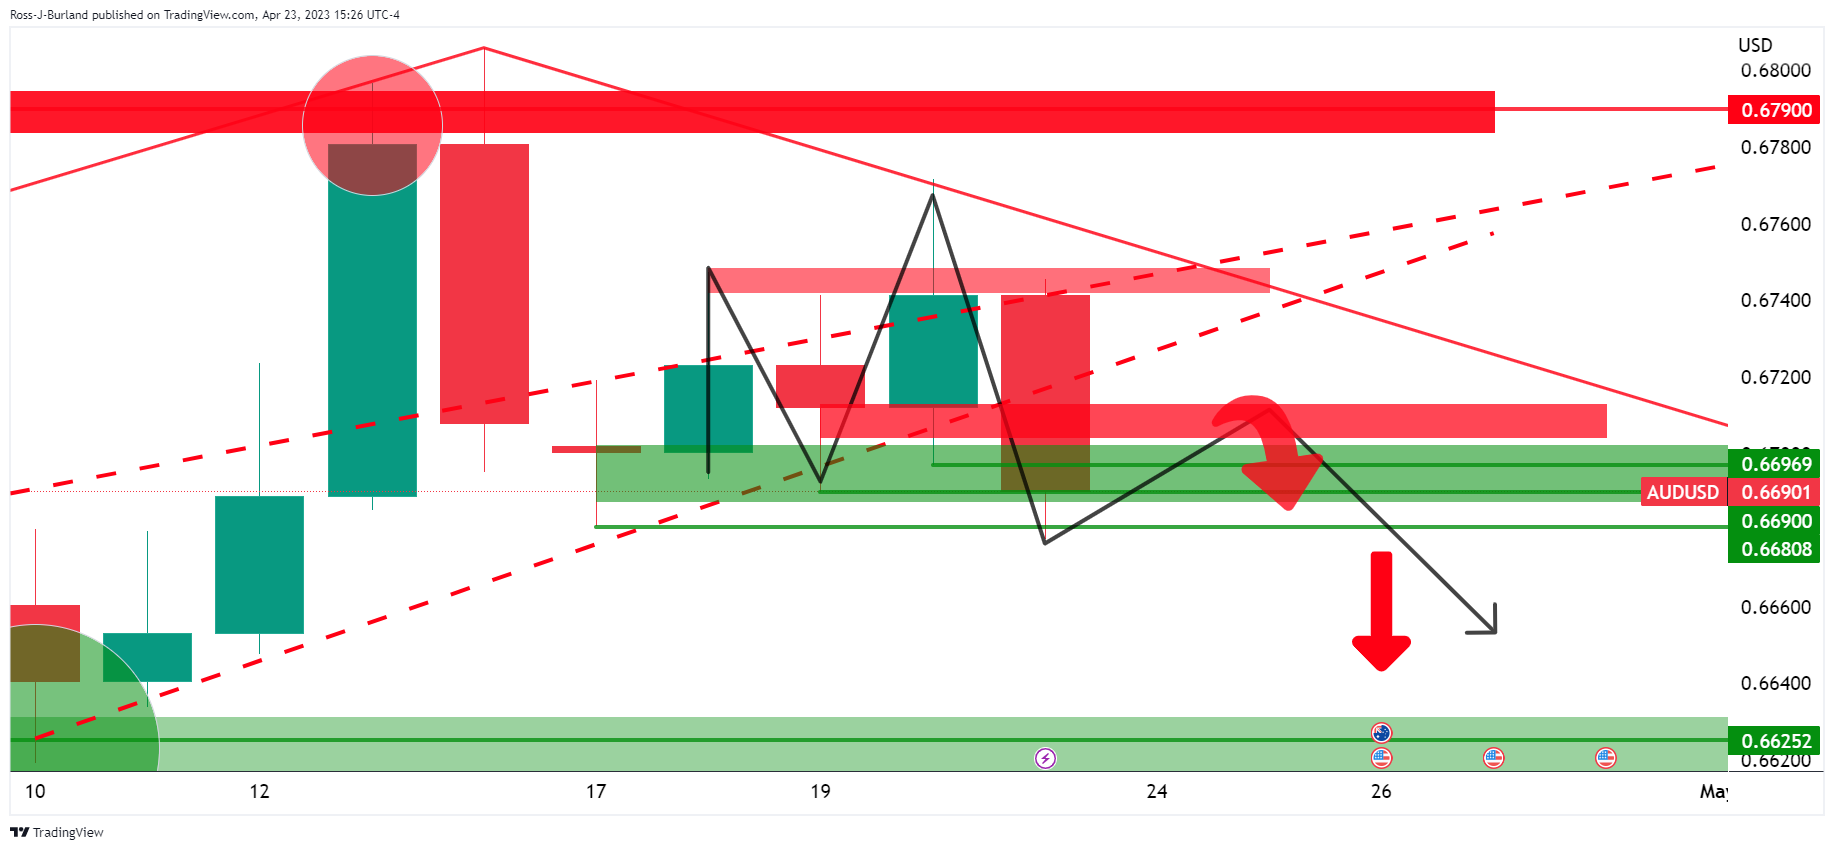
AUD/USD H4 chart
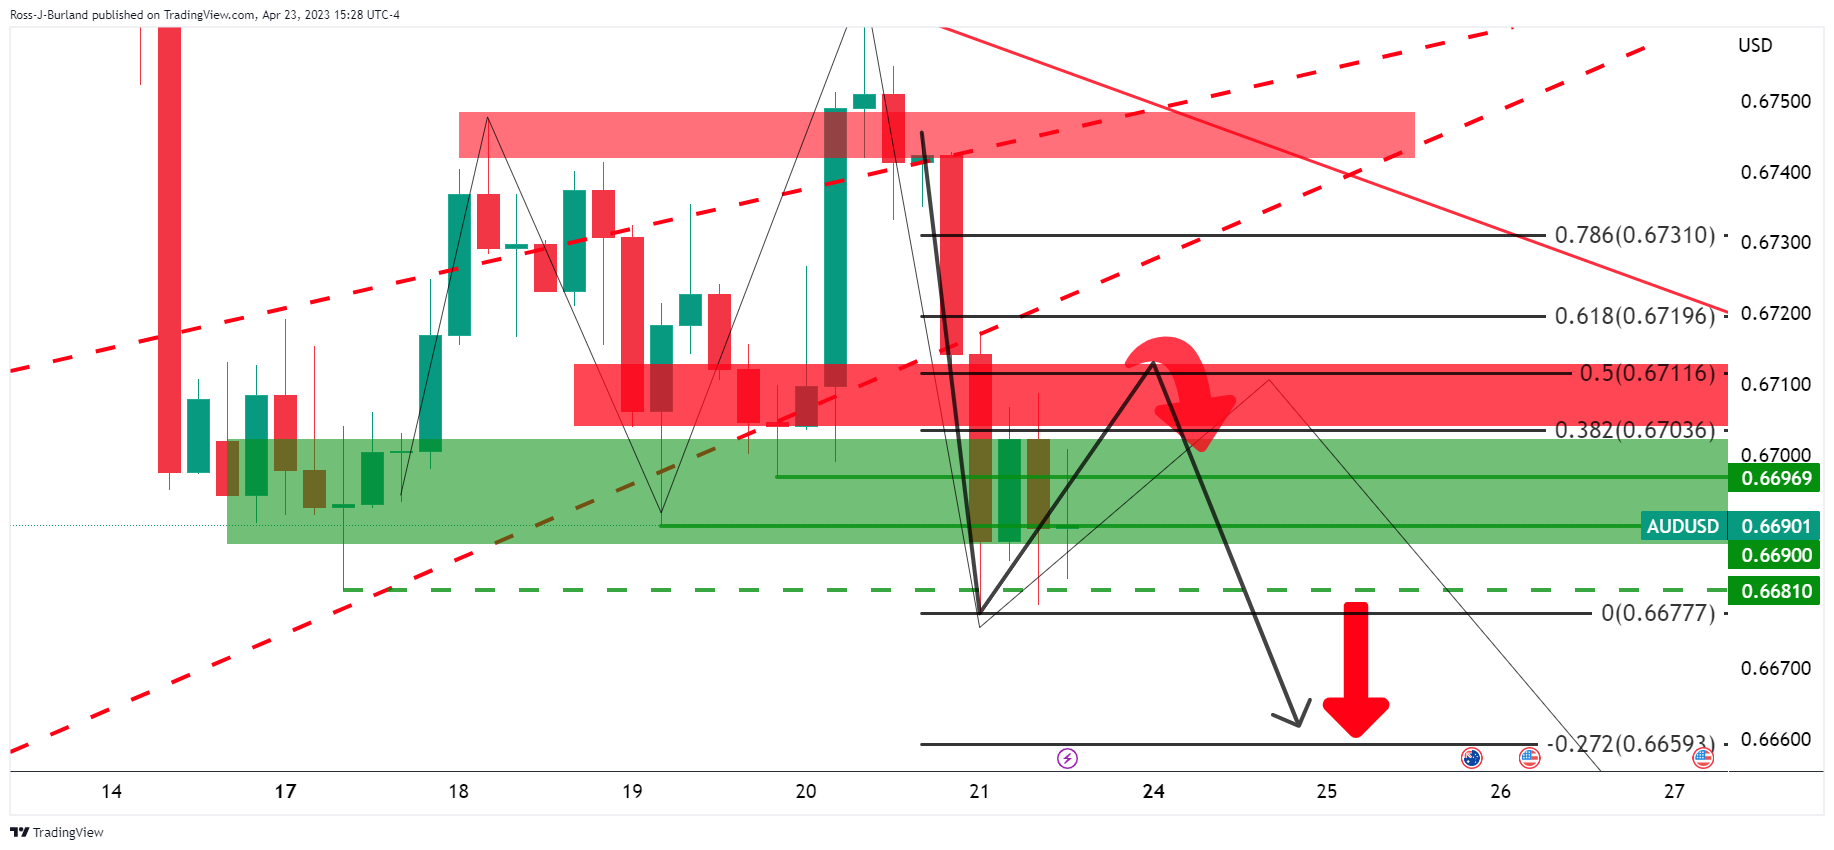
The four-hour chart´s 50% mean reversion level near 0.6710 aligned with the neckline of the pattern that could continue to act as resistance.
AUD/USD updates
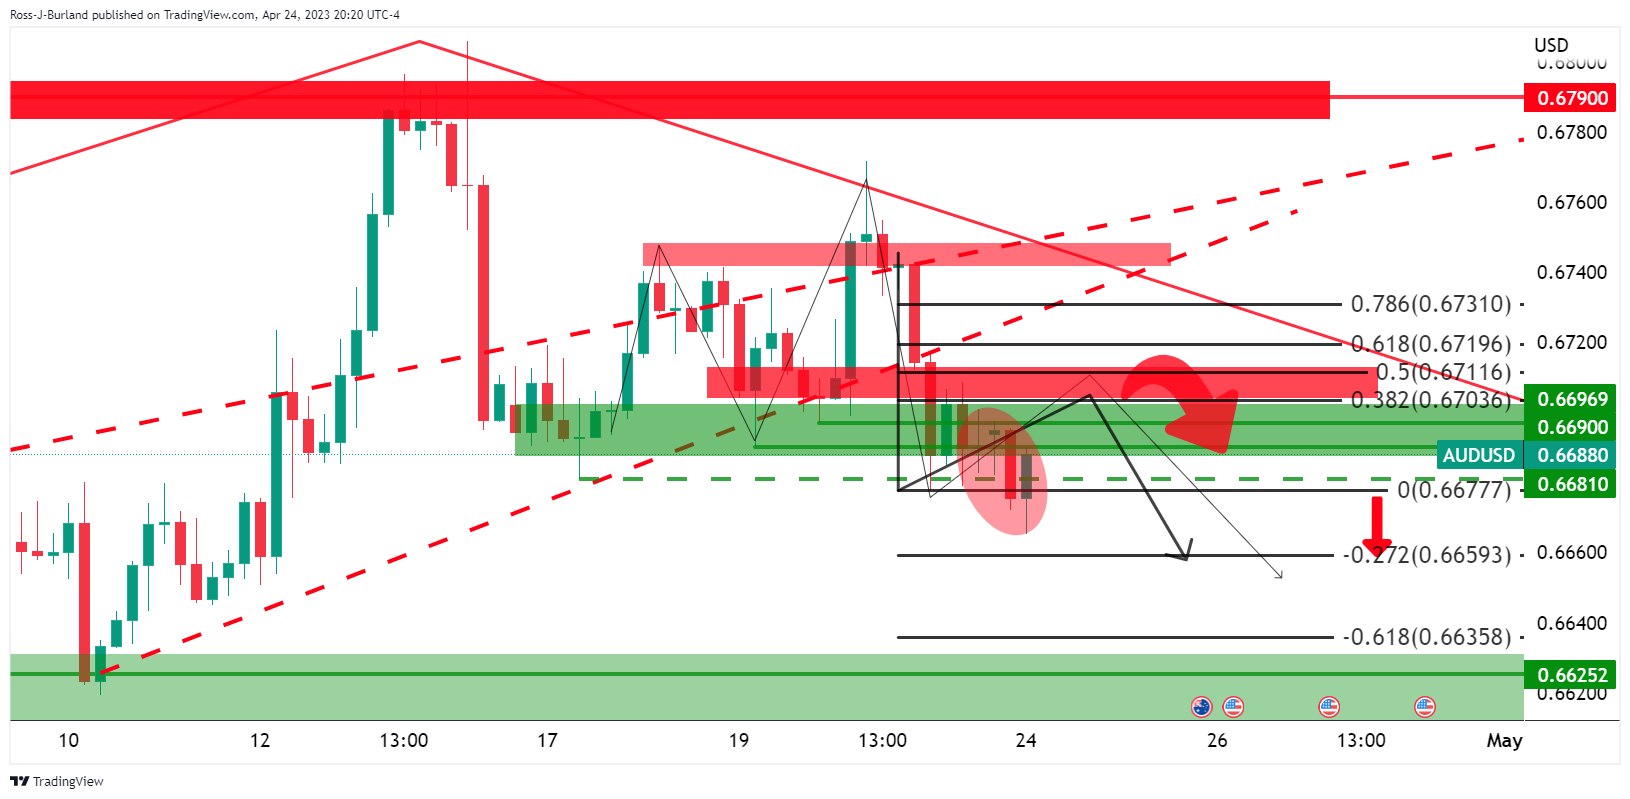
The price deteriorated but there has been a lack of momentum in the US Dollar and AUD/USD has climbed back into the barroom brawl as follows:
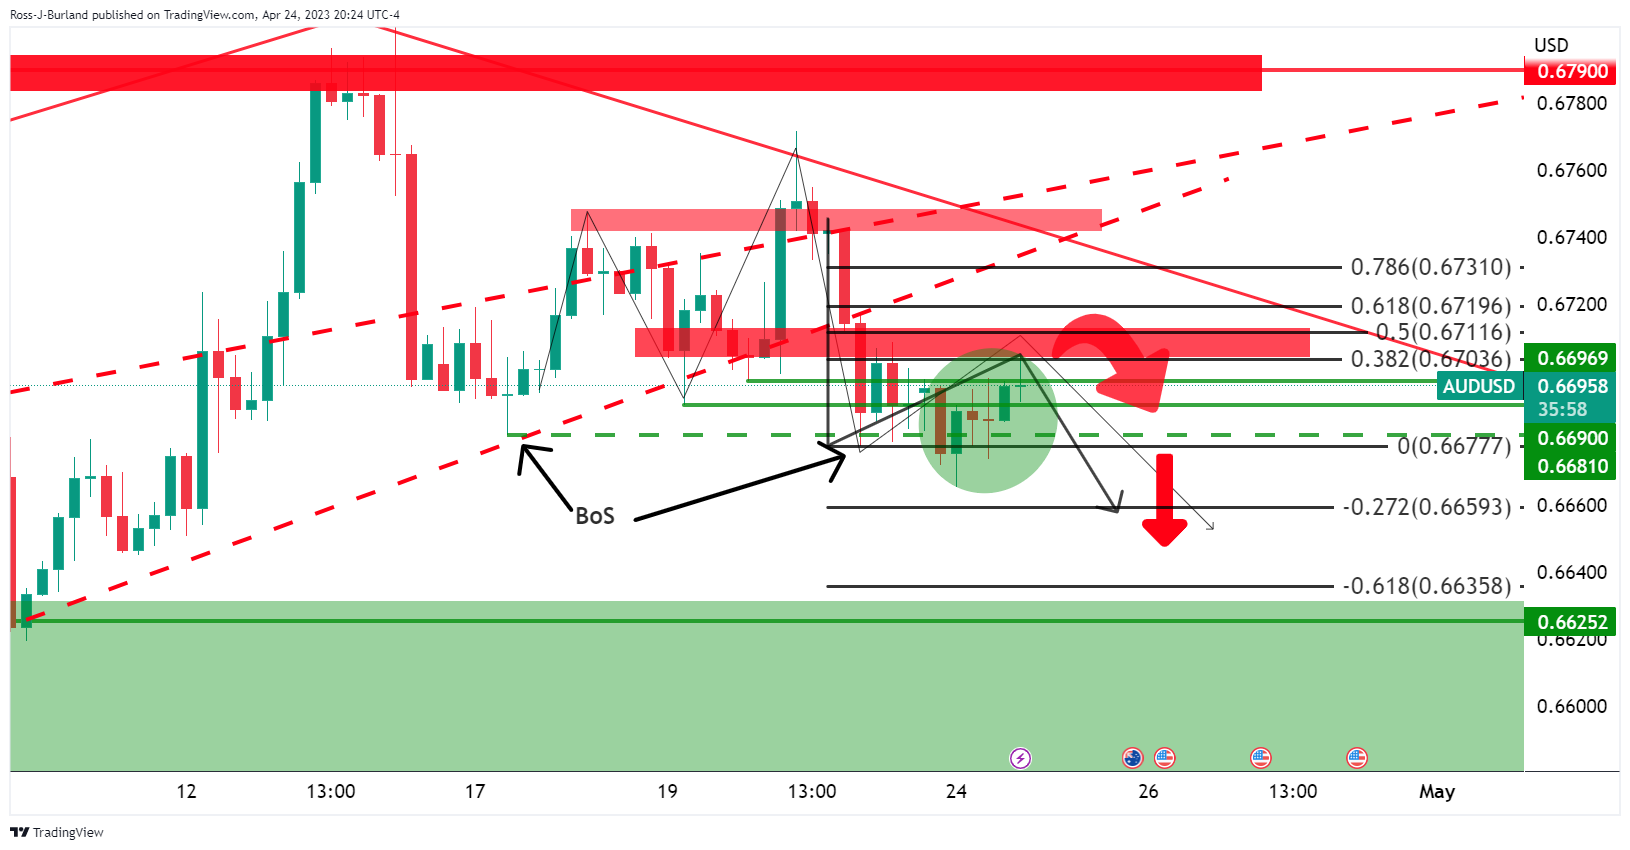
In the bearish thrust, there was a break in structure which leaves the bias to the downside so long as the bears show up and guard the 0.67s.
However, we can now adjust the daily chart´s Fibonaccis as follows:
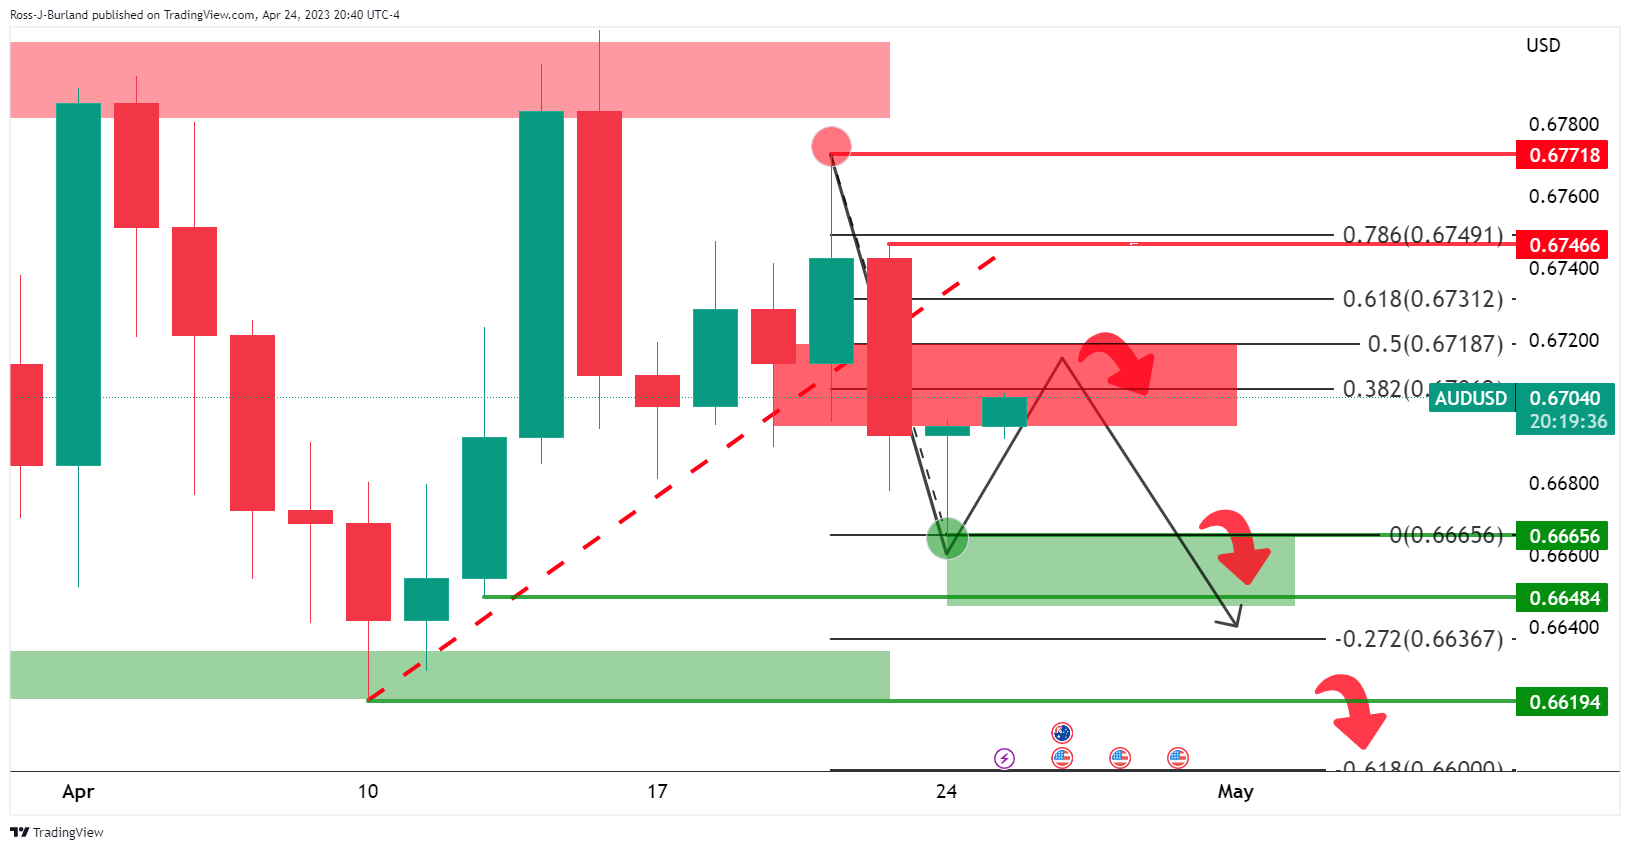
This gives way to a move into the 0.6720s and if bears donlñt show up by there, then the downside bias will be depleted significantly.
-
01:30
Stocks. Daily history for Monday, April 24, 2023
Index Change, points Closed Change, % NIKKEI 225 29.15 28593.52 0.1 Hang Seng -115.79 19959.94 -0.58 KOSPI -20.9 2523.5 -0.82 ASX 200 -8.4 7322 -0.11 FTSE 100 -1.9 7912.2 -0.02 DAX -17.71 15863.95 -0.11 CAC 40 -3.14 7573.86 -0.04 Dow Jones 66.44 33875.4 0.2 S&P 500 3.52 4137.04 0.09 NASDAQ Composite -35.26 12037.2 -0.29 -
01:15
Currencies. Daily history for Monday, April 24, 2023
Pare Closed Change, % AUDUSD 0.66933 0.05 EURJPY 148.192 0.62 EURUSD 1.10445 0.5 GBPJPY 167.505 0.48 GBPUSD 1.2483 0.35 NZDUSD 0.61642 0.45 USDCAD 1.35415 -0.01 USDCHF 0.88769 -0.52 USDJPY 134.162 0.11 -
01:10
USD/JPY corrects sharply to near 134.00 despite investors anticipate a dovish BoJ policy
- USD/JPY has dropped sharply to near 134.00 after a significant sell-off in the USD Index.
- Investors dumped the US Dollar in anticipation that the Fed will pause rate hikes after raising them one more time in May.
- BoJ Ueda is in no hurry of tweaking the Yield Curve Control (YCC) as inflation is expected to peak sooner.
The USD/JPY pair has displayed a steep fall to near 134.00 in the Asian session after failing to sustain above 134.60. The asset has faced immense selling pressure amid a sell-off in the US Dollar index (DXY). The USD Index has corrected firmly to 101.26 after a breakdown of the consolidation formed in a 101.64-102.22 range.
Investors dumped the US Dollar in anticipation that the Federal Reserve (Fed) will consider a pause in the policy-tightening spree after raising interest rates one more time in May. Preliminary United States S&P Manufacturing PMI showed a recovery after landing above 50.0 for the first time in the past six months.
It is worth noting that a figure of 50.0 is considered an expansion in the scale of PMI. However, a one-time figure of recovery is insufficient to infuse optimism in investors. Therefore, the street is anticipating that the Fed will hold key rates steady after pushing rates above 5% to avoid a recession situation in the United States economy.
Meanwhile, S&P500 futures are showing nominal gains in the Asian session after a moderately positive Monday, portraying a minor recovery in the risk appetite of the market participants. The US Treasury yields have dropped further following the footprints of the USD Index. The yields on 10-year US Treasury bonds have dropped further below 3.48%.
This week, the Japanese Yen could face immense volatility amid the interest rate decision by the Bank of Japan (BoJ). A continuation of the decade-long ultra-loose monetary policy by BoJ Governor Kazuo Ueda is highly expected in order to keep inflation steadily above 2%. The BoJ has no plans for tweaking Yield Curve Control (YCC) sooner amid evidence of inflation peaking.
-
01:08
USD/CHF drops to fresh one-week low under 0.8900 amid mixed options market signals
USD/CHF takes offers to refresh a seven-day low around 0.8870 during early Tuesday in Asia. In doing so, the Swiss currency pair cheers broad US Dollar weakness as options market bears keep the reins.
While portraying the mood at the options market, the USD/CHF one-month risk reversal (RR), a spread between the call options and the put options, brace for the biggest monthly loss since November 2022. That said, the monthly RR drops for the second time in a row with the latest print being -0.435.
However, the weekly and daily RR figures are less pessimistic as the weekly numbers stabilize near 0.000 after declining in the last three consecutive weeks whereas the daily RR marks the 0.000 figure for the second time in a row. It’s worth noting that the daily options market signal snapped a 10-day downtrend on Thursday before portraying the market’s late indecision.
Apart from the options market bias and the broad US Dollar weakness, the USD/CHF technical details are also bearish and suggest the quote’s further downside.
Also read: USD/CHF Price Analysis: Tumbles further below 0.8900, with sellers eyeing the YTD low
-
00:57
Silver Price Analysis: XAG/USD bulls keep the reins above $25.00
- Silver price seesaws around weekly resistance line, struggles to extend bounce off 100-SMA.
- Steady oscillators, successful rebound from key SMA, trend line signal further upside of XAG/USD price.
- Silver buyers brace for fresh one-year high but the previous support line from March can prod XAG/USD bulls.
Silver price (XAG/USD) remains sidelined around $25.15-20 as it struggles to extend the week-start rebound from 100-SMA support during early Tuesday. In doing so, the bright metal prods a one-week-old descending resistance line amid steady RSI (14) and mildly positive MACD signals. As a result, the XAG/USD buyers are likely to keep the reins.
However, a downward-sloping trend line from April, around $25.40 at the latest, precedes the current monthly high of around $26.10, as well as the one-year top, can act as intermediate halts during the Silver price run-up beyond $25.40.
It’s worth noting, though, that the April 2022 high of near $26.25 and the previous support line from March 16, now resistance near $26.30, appear tough nuts to crack for the Silver buyers.
Meanwhile, pullback moves remain elusive beyond the 100-SMA levels of around $24.95.
Even if the XAG/USD breaks the 100-SMA support of near $24.95, an upward-sloping trend line from April 06, close to $24.65 by the press time, could challenge the commodity’s further downside.
In a case where the Silver price remains bearish past $24.65, the $24.20 may act as an intermediate halt before directing the quote toward the monthly low of around $23.60.
Overall, Silver bears remain off the table unless witnessing a clear break of $24.65.
Silver price: Four-hour chart

Trend: Limited upside expected
-
00:51
Japan Corporate Service Price Index (YoY) in line with forecasts (1.6%) in March
-
00:41
GBP/JPY Price Analysis: Bulls remain in action as BoJ to consider a continuation of dovish policy
- GBP/JPY is making efforts for keeping business above 167.50 as BoE to raise rates further.
- A dovish stance is expected from the BoJ as Japan’s inflation is needed to sustain above 2%.
- GBP/JPY showed a V-shape recovery after getting support from the lower portion of the Rising Channel pattern.
The GBP/JPY pair is working on keeping its auction above 167.50 in the early Asian session. The cross is broadly advancing from Friday as investors are expecting the continuation of interest rate hikes from the Bank of England (BoE) considering the fact that United Kingdom’s inflation is not willing to ditch the double-digit figure.
Labor shortage and food inflation have remained major drivers for stick UK inflation, which is why BoE policymakers are going through sleepless nights. Monthly UK’s Retail Sales contracted by 0.9% while the street was anticipating a contraction by 0.5%, which indicates that households are feeling the pain of inflation-adjusted prices of goods and services.
Meanwhile, new Bank of Japan (BoJ) Governor Kazuo Ueda is in favor of continuing the dovish policy stance to keep the inflation rate steadily above 2%.
On a six-hour scale, GBP/JPY showed a V-shape recovery after getting support from the lower portion of the Rising Channel chart pattern. Every pullback in the aforementioned chart pattern is considered as buying opportunity by the market participants. The Pound Sterling is driving the cross towards the horizontal resistance plotted from 13 December 2022 high at 169.28.
The Pound Sterling has managed to drive cross sustainably above the 20-period Exponential Moving Average (EMA) at 166.94, indicating that the short-term trend is bullish.
Meanwhile, the Relative Strength Index (RSI) (14) rebounded after sensing support near 40.00, signaling that the downside momentum was defended confidently.
Going forward, a decisive move above April 19 high around 168.00 will drive the cross 13 December 2022 high at 169.28 followed by November 02 high at 170.33.
On the flip side, a breakdown below April 21 low at 165.52 will strengthen the downside bias and will expose the cross to April 10 low at 164.00 and April 05 low at 162.78.
GBP/JPY six-hour chart
-638179763752244318.png)
-
00:33
US Dollar Index: DXY traces downbeat yields above 101.00 as traders brace for US GDP, Fed
- US Dollar Index stays pressured near one-week low as yields drop amid Fed concerns, US debt ceiling drama.
- US politicians jostle over debt ceiling plan ahead of June expiration.
- Markets brace for Fed policy pivot, rate cuts in 2023 ahead of next week’s anticipated 0.25% lift.
- Spread between US one-month and three-month Treasury bond Yields widens the most since 2001.
US Dollar Index (DXY) remains depressed near 101.30 as it drops for the fourth consecutive day amid early hours of Tuesday’s Asian session. In doing so, the greenback index against the major six currencies tracks the downbeat US Treasury bond yields as traders prepare for dovish Federal Reserve (Fed) and downbeat US data.
Fears of the US reaching its debt limit expiration in June and a political drama ahead of that keep traders on their toes and push them towards the risk-safety, which in turn propelled the demand for one-month US Treasury bond yields. On the same line, are the clues that the US Federal Reserve (Fed) could announce one last rate hike, worth 0.25%, in May before signaling the policy pivot. With this, the difference between one-month and three-month US Treasury bond yields widen the most since 2001.
The same joins Monday’s downbeat performance of April month activity data from the Federal Reserve banks of Chicago and Dallas. That said, the Federal Reserve Bank of Chicago's National Activity Index (CFNAI) remained unchanged at -0.19 versus -0.02 expected. However, the publication added that the index’s three-month moving average, CFNAI-MA3, increased to +0.01 in March from –0.09 in February. On the other hand, Dallas Fed Manufacturing Business Index for the said month dropped to 23.4 for April versus -14.6 expected and -15.7 prior.
Furthermore, hopes of gradual economic recovery and an upbeat earnings season allow the US Dollar bears to stay hopeful.
Alternatively, geopolitical fears surrounding Russia, due to China’s alleged support to Moscow in fighting with Ukraine, as well as amid the Western readiness to increase sanctions on the Oil-rich nation, prod the market’s cautious optimism and prod the DXY bears.
Against this backdrop, Wall Street closed mixed and the US 10-year Treasury bond yields marked the biggest daily fall in three weeks before closing the day around 3.50%.
Moving on, US Conference Board’s (CB) Consumer Confidence gauge for April, expected to remain steady near 104.1 versus 104.2 prior, will be important for the intraday directions of the DXY. However, major attention will be given to US Q1 GDP, US Core PCE Price Index and the yields for a clear guide.
Also read: US Consumer Confidence Preview: Recession hints likely to keep the USD under pressure
Technical analysis
Although a double bottom formation around 100.80-78 puts a floor under the US Dollar Index (DXY) price, the 21-DMA hurdle near $101.95 challenges short-term recovery of the greenback’s gauge versus the six major currencies.
-
00:23
EUR/JPY Price Analysis: After hitting 9-year highs, it retreated to 148.20s as sellers stepped in
- Albeit retracing, the EUR/JPY is still upward biased, with bulls eyeing 150.00.
- Oscillators flashed that EUR/JPY’s buyers are losing momentum.
- The EUR/JPY could be headed for a pullback before rallying towards 150.00.
The EUR/JPY reached a fresh 9-year high at around 148.47, as buyers reclaimed the 148.00 area. However, it has retraced below the last year’s high of 148.40 and meanders above the 148.00 figure as the Asian session begins. At the time of writing, the EUR/JPY trades at 148.21.
EUR/JPY Price Action
The pair remains upward-biased, as shown by the daily chart. Although the EUR/JPY’s uptrend is intact, oscillators have begun to shift neutral, as shown by the Relative Strength Index (RSI). The RSI exited below the 70 area, while the Rate of Change (RoC) indicates the last cycle high was achieved on lower volatility levels, meaning buyers could lose momentum.
If EUR/JPY breaks the YTD high at 148.47, the next resistance would be 149.00. A decisive break could push prices towards the 150.00 figure, followed by the next cycle high on September 22, 2008, at 154.83.
Conversely, if the EUR/JPY drops below the 148.00 figure, the risk of forming a bearish-engulfing candlestick pattern increases. Therefore, the EUR/JPY first support would be the April 24 low of 147.12, followed by the last cycle low of 146.40, before testing the 20-day EMA at 146.01.
EUR/JPY Daily Chart
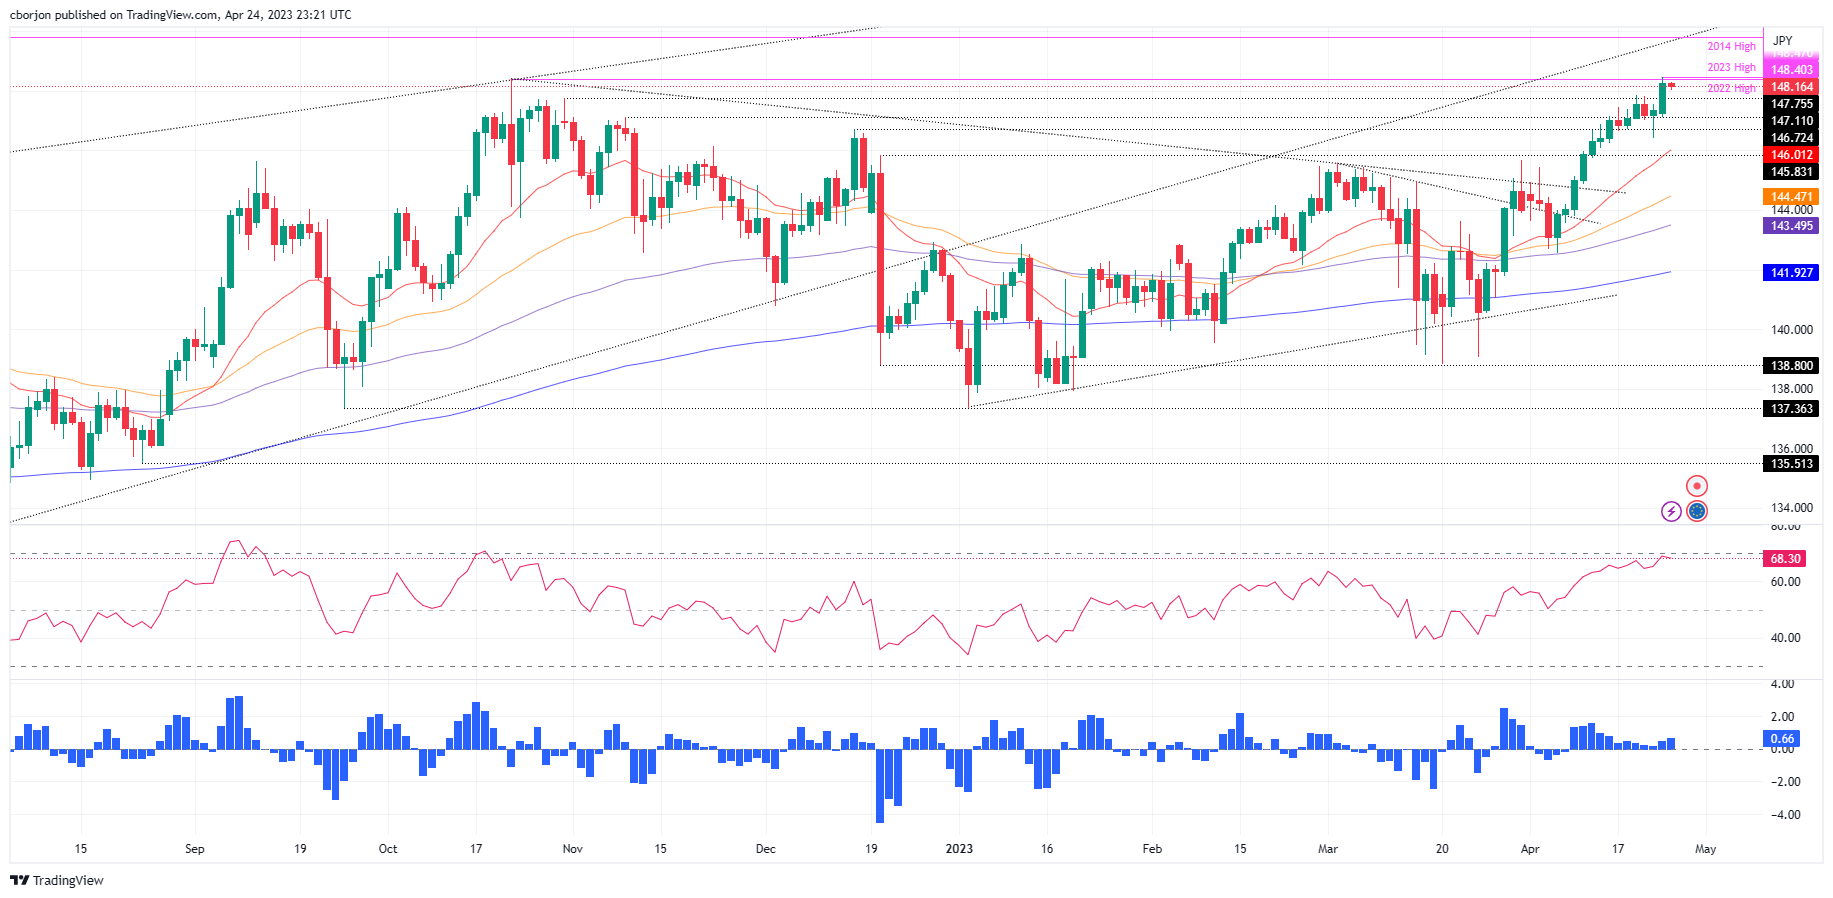
-
00:09
WTI crude oil buyers seek acceptance near $78.50 as demand hopes join cautious markets
- WTI struggles to extend two-day rebound from the lowest levels in three weeks.
- Demand hopes from China jostle with market’s indecision ahead of the key data/events and prod Oil buyers.
- Downbeat US Dollar, geopolitical concerns weigh on the commodity price.
WTI crude oil retreats to $78.60 during early Tuesday, fading a two-day recovery from the early month low, as the black gold buyers seek more clues to extend the latest run-up amid a sluggish start to the key week. Even so, the demand hopes and softer US Dollar keep the commodity buyers positive.
The energy benchmark rose in the last two consecutive days as it consolidates the biggest weekly loss since early March amid expectations of higher demand from China, especially amid the upcoming May Day holidays.
Adding strength to the bullish bias could be the statements from Reuters saying, “Bookings in China for trips abroad during the upcoming May Day holiday point to a continued recovery in travel to Asian countries, but the numbers remain far off pre-COVID-19 levels with long-haul airfares soaring and not enough flights available.”
Furthermore, the US Dollar’s downbeat performance in the last three consecutive days also keeps the WTI crude oil buyers hopeful. That said, the greenback seems to bear the burden of the market’s dovish expectations from the US Federal Reserve (Fed) past the next month’s already priced-in 0.25% rate hike. “The dollar fell to a more than one-week low against major currencies on Monday in generally thin trading, as investors continued to price in interest rate cuts this year by the Federal Reserve after a widely expected rate increase at next week's policy meeting,” said Reuters in this regard.
Elsewhere, geopolitical fears surrounding Russia, due to China’s alleged support to Moscow in fighting with Ukraine, as well as amid the Western readiness to increase sanctions on the Oil-rich nation, also allow the WTI crude oil buyers to remain hopeful.
However, a light calendar and the market’s consolidation of an upbeat week start, as well as the latest rush towards the US one-month US Treasury bonds amid fears of US default, seem to prod the Oil buyers.
Moving forward, WTI bulls are likely to remain hopeful amid an expected weakness in the US Dollar ahead of the key US Q1 GDP and Fed’s favorite inflation gauge, namely the US Core PCE Price Index.
Technical analysis
A clear rebound from the 100-DMA support of $76.90, as well as an upside break of the one-week-old descending resistance line, now immediate support near $78.15, directs WTI crude oil buyers toward the $80.00 round figure.
-
00:02
AUD/JPY gathers strength to shift business above 90.00 ahead of Australian Inflation
- AUD/JPY is gathering strength to confidently reclaim the critical resistance of 90.00.
- Further softening of Australian inflation is highly expected as RBA policymakers confirmed signs of a slowdown ahead.
- BoJ Ueda is expected to keep the expansionary interest rate policy steady as Japan’s inflation is showing signs of a peak.
The AUD/JPY pair has witnessed a mild correction after failing to decisively surpass the critical resistance of 90.00 in the early Tokyo session. The risk barometer is making efforts for shifting its auction confidently above 90.00.
Considering positive cues from AUD/USD, the AUD/JPY pair is expected to remain in the grip of bulls. The Australian Dollar is expected to remain volatile ahead of the release of the Consumer Price Index (CPI) data, which is scheduled for Wednesday.
As per the consensus, quarterly inflation (Q1) accelerated by 1.3% at a slower pace than the velocity of 1.9% recorded in the last quarter of CY2022. Annual inflation is expected to soften to 6.9% from the former release of 7.8%.
Apart from them, the monthly inflation indicator (Mar) is expected to decelerate to 6.6% from the prior release of 6.8%. Australia’s monthly CPI has softened significantly from its peak of 8.4%, recorded in December. The Reserve Bank of Australia (RBA) has paused its rate-hiking spell after pushing interest rates to 3.60%. RBA policymakers are expecting a further slowdown in the Australian economy, which will continue to weigh pressure on inflation.
On the Japanese Yen front, the interest rate decision by the Bank of Japan (BoJ) will be the key event this week. New BoJ Governor Kazuo Ueda is expected to keep the expansionary interest rate policy steady as Japan’s inflation is showing signs of peak knowing the fact that the impact of higher import prices has already passed to the economy. BoJ Ueda denied tweaking Yield Curve Control (YCC) sooner on Monday, citing that inflation is losing its momentum.
-
00:00
South Korea Gross Domestic Product Growth (QoQ) above expectations (0.2%) in 1Q: Actual (0.3%)
-
00:00
South Korea Gross Domestic Product Growth (YoY) came in at 0.8% below forecasts (0.9%) in 1Q
-