Notícias do Mercado
-
23:46
White House: The President has made clear this bill has no chance of becoming law
“The President has made clear this bill has no chance of becoming law,” mentioned the White House (WH) spokesperson after the "Limit, Save, Grow Act" passed with a dicey majority late Wednesday.
The Republican debt ceiling bill crossed the White House barrier with a mostly partisan 217-215 vote, which in turn will lure US President Joe Biden to negotiate on cutting spending with House Speaker Kevin McCarthy and the Democratic team in Congress.
“The US House of Representatives on Wednesday narrowly passed a bill to raise the nation's $31.4 trillion debt ceiling, defying President Joe Biden by attaching sweeping spending cuts for the next decade,” said Reuters.
More comments from WH
US President Biden will never force middle-class and working families to bear the burden of tax cuts for the wealthiest.
We pay our bills, congressional Republicans must do that again now and act to avoid default.
Market sentiment improves
S&P 500 Futures print mild gains of 0.20% around 4,083 by the press time, following a mixed close of Wall Street.
Also read: Forex Today: A mixed US Dollar and cautious markets before crucial US data
-
23:39
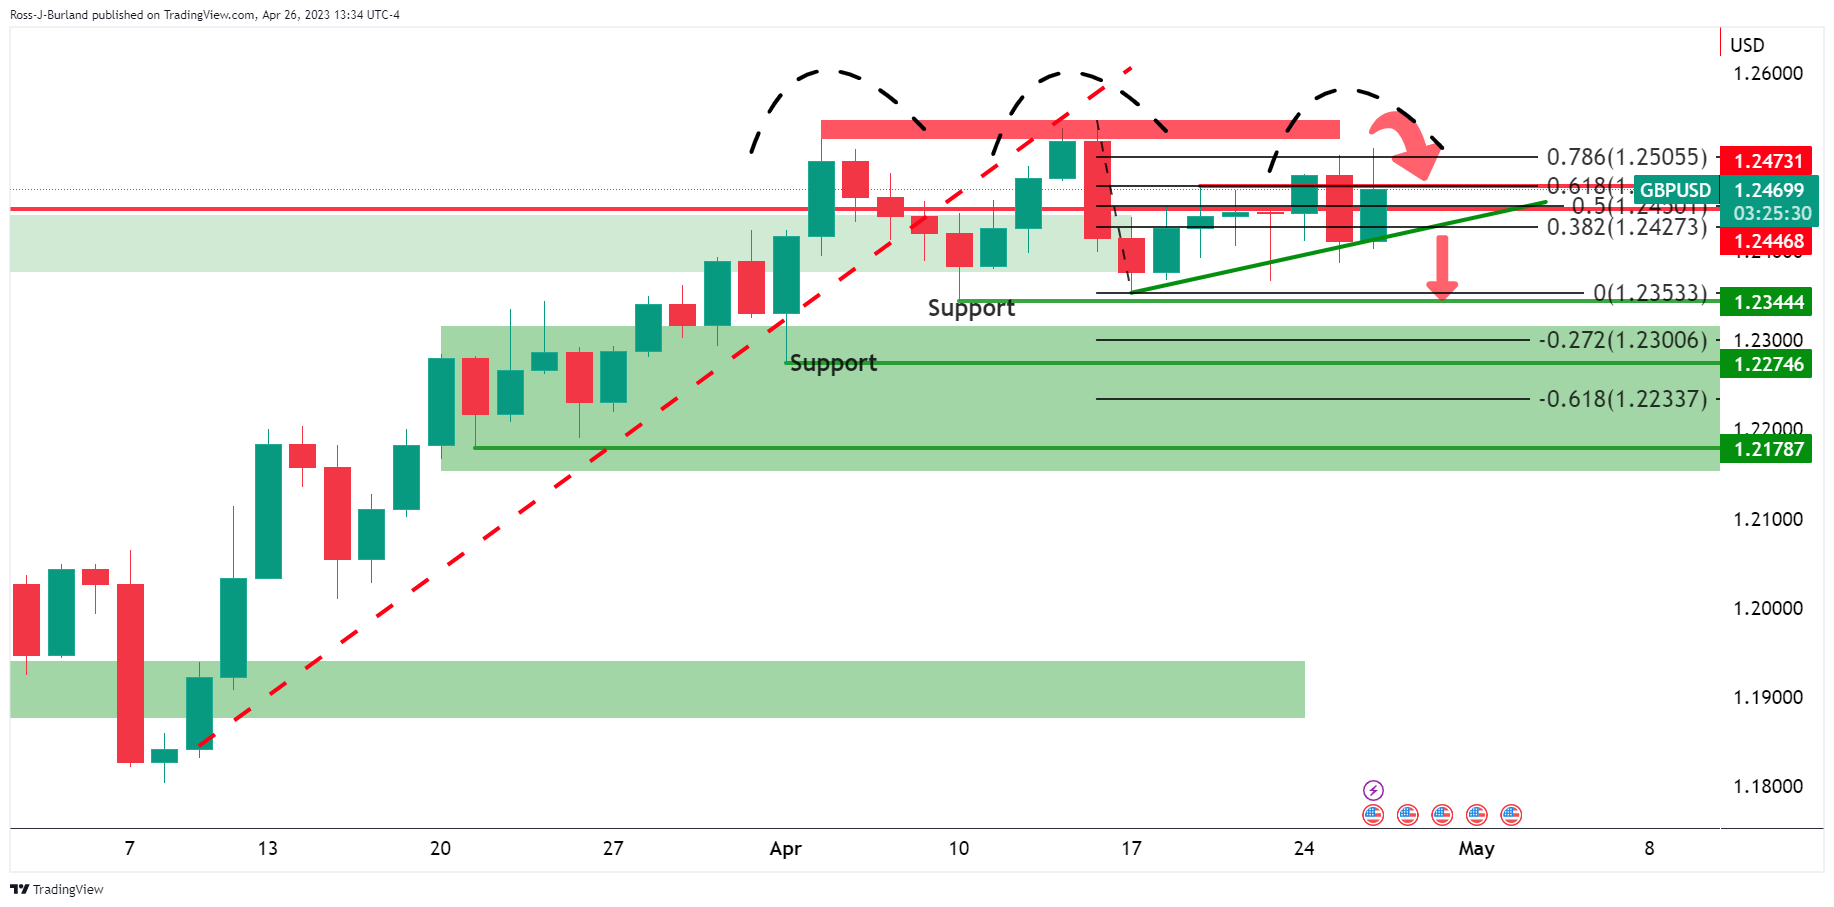
GBP/USD Price Analysis: Continuous failure of instability above 1.2500 makes Pound Sterling delicate
- GBP/USD has shown a corrective move after failing to sustain above 1.2500.
- A survey from Reuters showed that most shop chains do not foresee a lasting improvement in retail sales.
- The lack of upside momentum in the Pound Sterling makes it a fragile counter for market participants.
The GBP/USD pair has gradually corrected after failing to sustain above the psychological resistance of 1.2500 in the Asian session. The Cable has failed plenty of times in sustaining above the aforementioned resistance this month, making the Pound Sterling prone to further losses.
On Wednesday, investors dumped risk-sensitive assets and ran for the US Dollar Index (DXY) as a safe-haven after First Republic Bank cornered the US administration for not providing liquidity support. The USD Index showed a V-shape recovery after dropping to near the crucial support of 101.00.
Meanwhile, the Pound Sterling sensed selling pressure amid a slowdown in accelerating British retail sales. A survey from Reuters showed that most shop chains do not foresee a lasting improvement in retail sales. Also, expectations for May were slightly negative. This might provide some relief to Bank of England (BoE) policymakers.
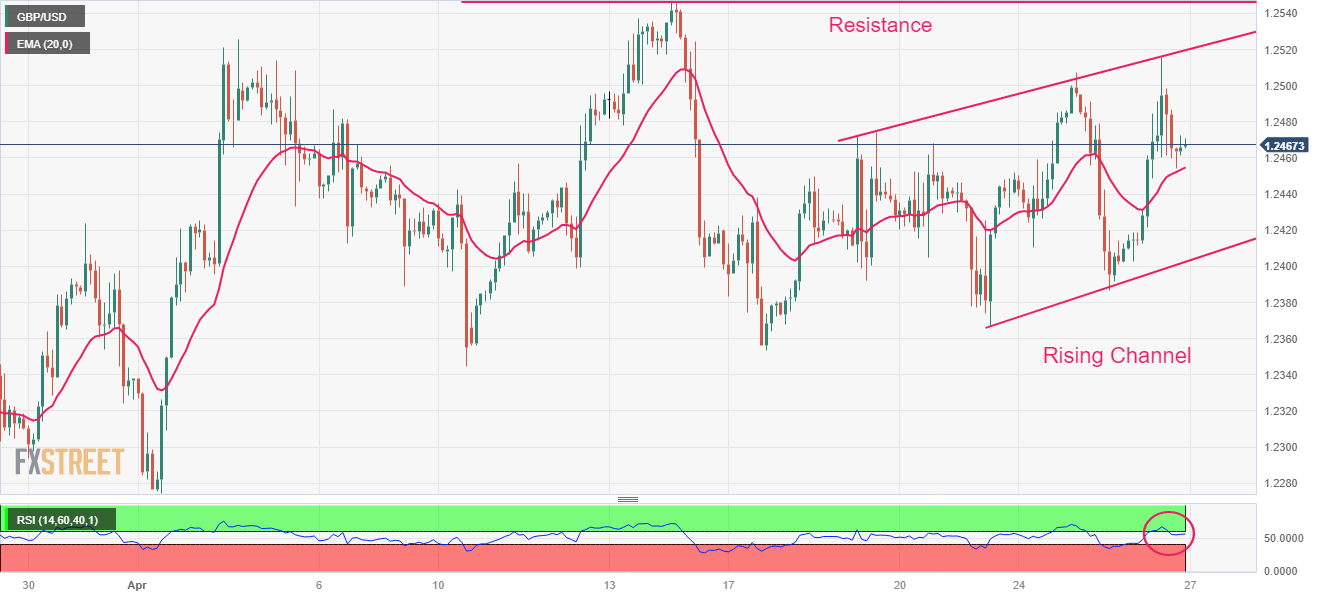
GBP/USD is auctioning in a Rising Channel chart pattern on a two-hour scale in which every pullback is considered a buying opportunity. It is worth noting that the lack of upside momentum in the Pound Sterling is making it a fragile counter for the market participants. The Cable is still above 20-period Exponential Moving Average (EMA) at 1.2468, indicating that the upside bias has not faded yet. Potential resistance is placed from April 14 high at 1.2545.
Meanwhile, the Relative Strength Index (RSI) (14) has slipped back into the 40.00-60.00 range, signaling a lack of momentum.
A decisive move above April 13 high at 1.2537 will drive the asset towards a fresh 10-month high at 1.2597, which is 08 June 2022 high. A breach of the latter will expose the asset to May 27 high at 1.2667.
On the flip side, a slippage below April 10 low at 1.2345 will expose the asset to March 30 low at 1.2294 followed by March 27 low at 1.2219.
GBP/USD daily chart
-
23:32
USD/CHF steady around 0.8900 amidst risk aversion, eyes 0.9000 on the double bottom formation
- USD/CHF remains steady at around 0.8900 amidst risk aversion and higher US T-bond yields.
- After the US economic data release, the major rebounded from daily lows and surged above 0.8900.
- USD/CHF Price Analysis: Double bottom looming could pave the way towards 0.9000, ahead of the 50-day EMA at 0.9100.
The USD/CHF remains steady at around 0.8900 after hitting a daily low of 0.8851 and appears to have bottomed after falling from last year’s highs of 1.0147. As the Asian session begins, the USD/CHF is trading at 0.8906, above its opening price by a minuscule 0.01%.
The main drivers for USD/CHF price action continue to be risk-jitters around the First Republic Bank crisis. Although triggered flows towards the Swiss Franc (CHF), higher US T-bond yields, bolstered the US Dollar (USD), capping the USD/CHF’s fall.
The US economic agenda featured Durable Good Orders for March, which jumped 3.2% MoM, above estimates. Excluding transport orders advanced 0.3%, and stripping defense and aircraft, fell 0.4% MoM. After the release, the USD/CHF bounced off the daily lows and rose above 0.8900.
Later in the New York session, Atlanta’s Fed updated its GDP NOW model, reigniting recessionary worries about the United States economy. The GDPNOW model foresees GDP for Q1 at 1.1% vs. a previous reading of 2.5%.
In the Europan session, the Swiss Economic Sentiment advanced to -33.3 points in April, an improvement compared to -41.3 points in March, according to data from Credit Suisse.
What to watch?
The US economic docket will feature Initial Jobless Claims and the Gross Domestic Product (GDP) Advance for Q1, 2023.
USD/CHF Price Analysis
From a daily chart perspective, a double bottom could be forming. Nevertheless, to cement the case, the USD/CHF must break above the April 19 high at 0.9003. A breach of the latter and the USD/CHF will challenge the 0.9050 figure before testing the 50-day EMA at 0.9103.
-
23:26
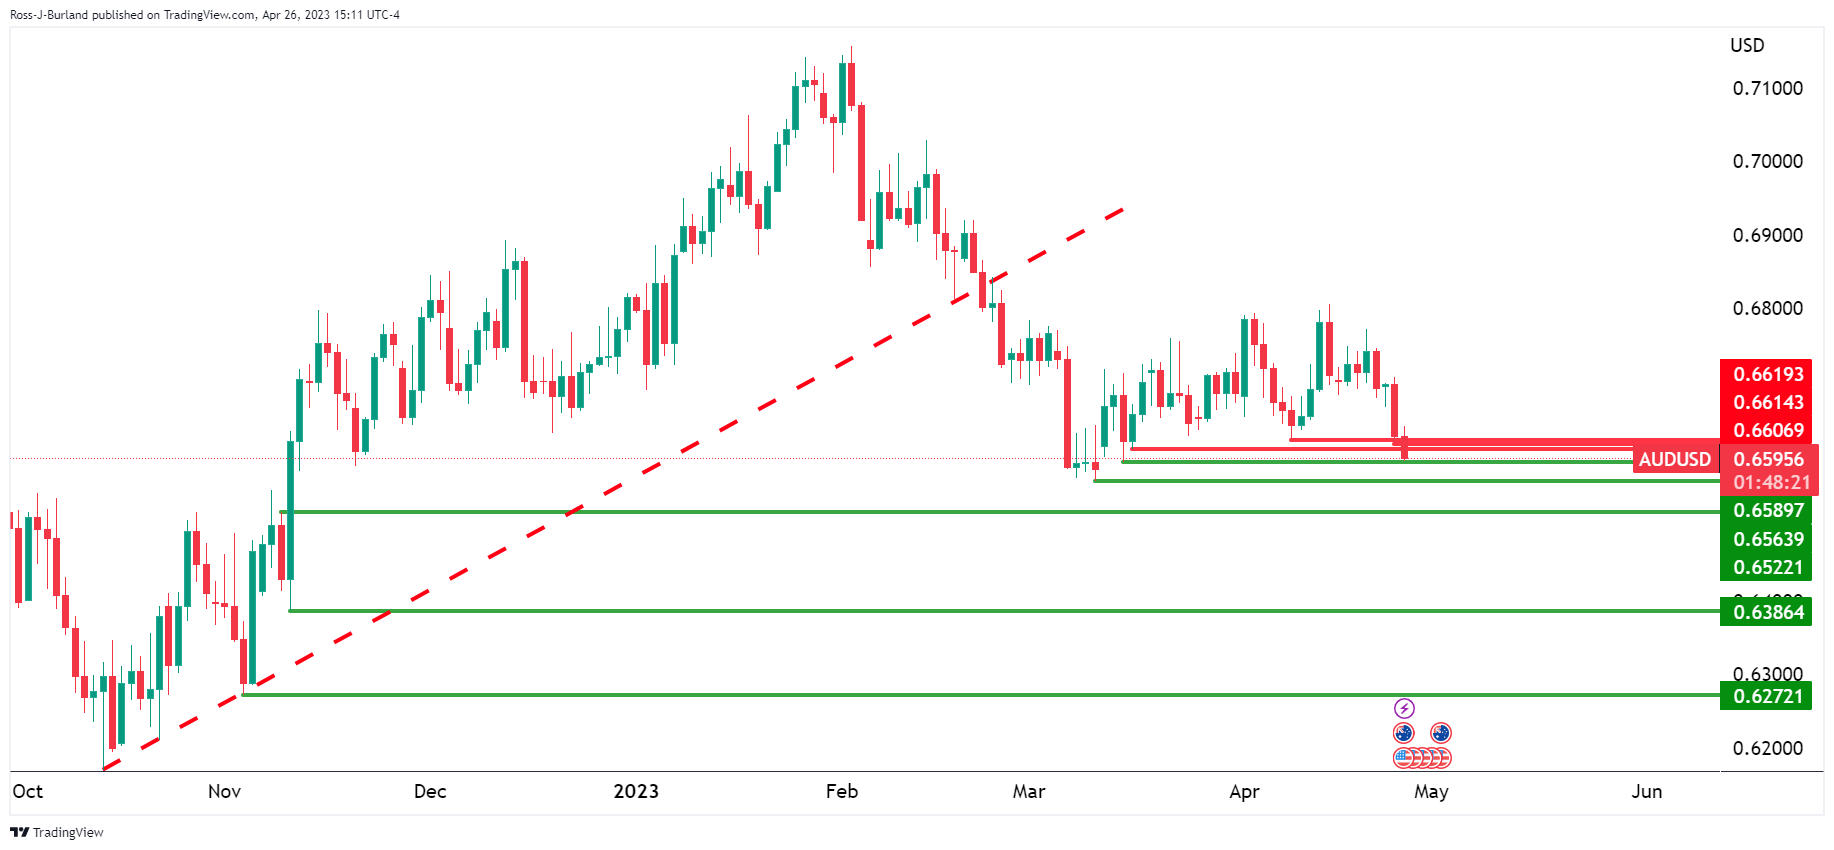
AUD/USD eyes further downside as bears prod 0.6600 amid banking woes ahead of US Q1 GDP
- AUD/USD licks its wounds at the lowest levels in six weeks.
- Mostly downbeat risk profile, mixed Aussie inflation clues weigh on AUD/USD price.
- Cautious mood before US GDP, First Republic Bank-inflicted fears and voting on US debt ceiling increase favor Aussie pair bears.
- Australia Export, Import Price Indexes for Q1 will be eyed ahead of the US growth figures.
AUD/USD consolidates recent losses at the 1.5-month low as it flirts with the 0.6600 round figure during early Thursday morning in the Asia-Pacific zone. In doing so, the Aussie snaps two-day downtrend but the bearish bias remains intact amid multiple negatives to the risk profile and surrounding the Reserve Bank of Australia’s (RBA) next move.
On Wednesday, downbeat Aussie inflation numbers justify the RBA’s pause in rate hike trajectory and suggested one such move in the next monetary policy meeting of the Australian central bank. However, the details weren’t too bad and hence may allow the RBA to show readiness of further rate hikes if needed.
That said, Australia’s Monthly Consumer Price Index (CPI) dropped to 6.1% YoY in March versus 6.6% expected and 6.8% prior. On the same line, the Q1 CPI also eased to 1.4% QoQ from 1.9% in previous readings but crossed the 1.3% market forecasts. Further, the RBA Trimmed Mean CPI declined below 1.4% consensus and 1.7% prior to 1.2% QoQ in the first quarter (Q1).
On the other hand, US Durable Goods Orders rose by 3.2% in March versus 0.8% expected and -1.2% prior. Further details suggest that the Durable Goods Orders ex Transportation and ex Defense also rose past market forecasts and previous readings in March.
It’s worth noting that the cautious mood surrounding the US debt ceiling expiration exerts downside pressure on the AUD/USD price as most policymakers aren’t agreeing on the measures suggested by US President Joe Biden. It should be observed that the US House of Representatives currently votes on a bill suggesting the increase in the debt ceiling and to cut government spending, known as the "Limit, Save, Grow Act". Although the passage of the bill is only one step closer to the final destination, any disappointment can add to the risk-off mood and exert more downside pressure on the AUD/USD.
Elsewhere, market sentiment sours amid escalating fears from the First Republic Bank (FRB) after the troubled bank’s shares dropped another 20% on Wednesday, following a 50% slump the previous day. With this, the FRB is likely to face the limits on its Fed borrowings, which in turn spreads the ripple effect across the markets and weighs on the risk appetite and the Aussie pair.
Against this backdrop, the US Dollar Index (DXY) dropped to the lowest levels in two weeks before paring some of the daily losses to end Wednesday’s trading near 101.43. Further, Wall Street closed mixed while the United States Treasury bond yields are mostly sidelined.
Given the mostly downbeat market sentiment and dovish bias surrounding the RBA, the AUD/USD pair is likely to remain pressured ahead of the key US first quarter (Q1) Gross Domestic Product (GDP), expected to ease to 2.0% on an annualized basis versus 2.6% prior. On an immediate basis, Australia’s Q1 Export Price Index and Import Price Index can entertain the pair traders.
Technical analysis
Unless providing a sustained break of the seven-week-old previous support line, around 0.6655 by the press time, the AUD/USD pair remains vulnerable of refreshing the yearly low, currently around 0.6565.
-
23:25
USD/JPY Price Analysis: Bulls taking a reincheck as bears eye 132.80s
- USD/JPY bears are in the market front side of the bearish trend.
- Bears are a meanwhile extension to the downside.
- Bulls are lurking on longer-term time frames.
As per the prior analysis, USD/JPY bears carving out a bias front side of bearish trend, the market remains in the hands of the bears, for the meantime, as the following analysis will illustrate.
The key notes for the near-term outlook are as follows:
- We have the head and shoulders formed.
- We have seen a break of the 4-hour structure.
- There has been a correction into the bearish trendline resistance meeting the 38.2% ratio.
- A downside continuation with 132.80 eyed.
USDJPY weekly charts
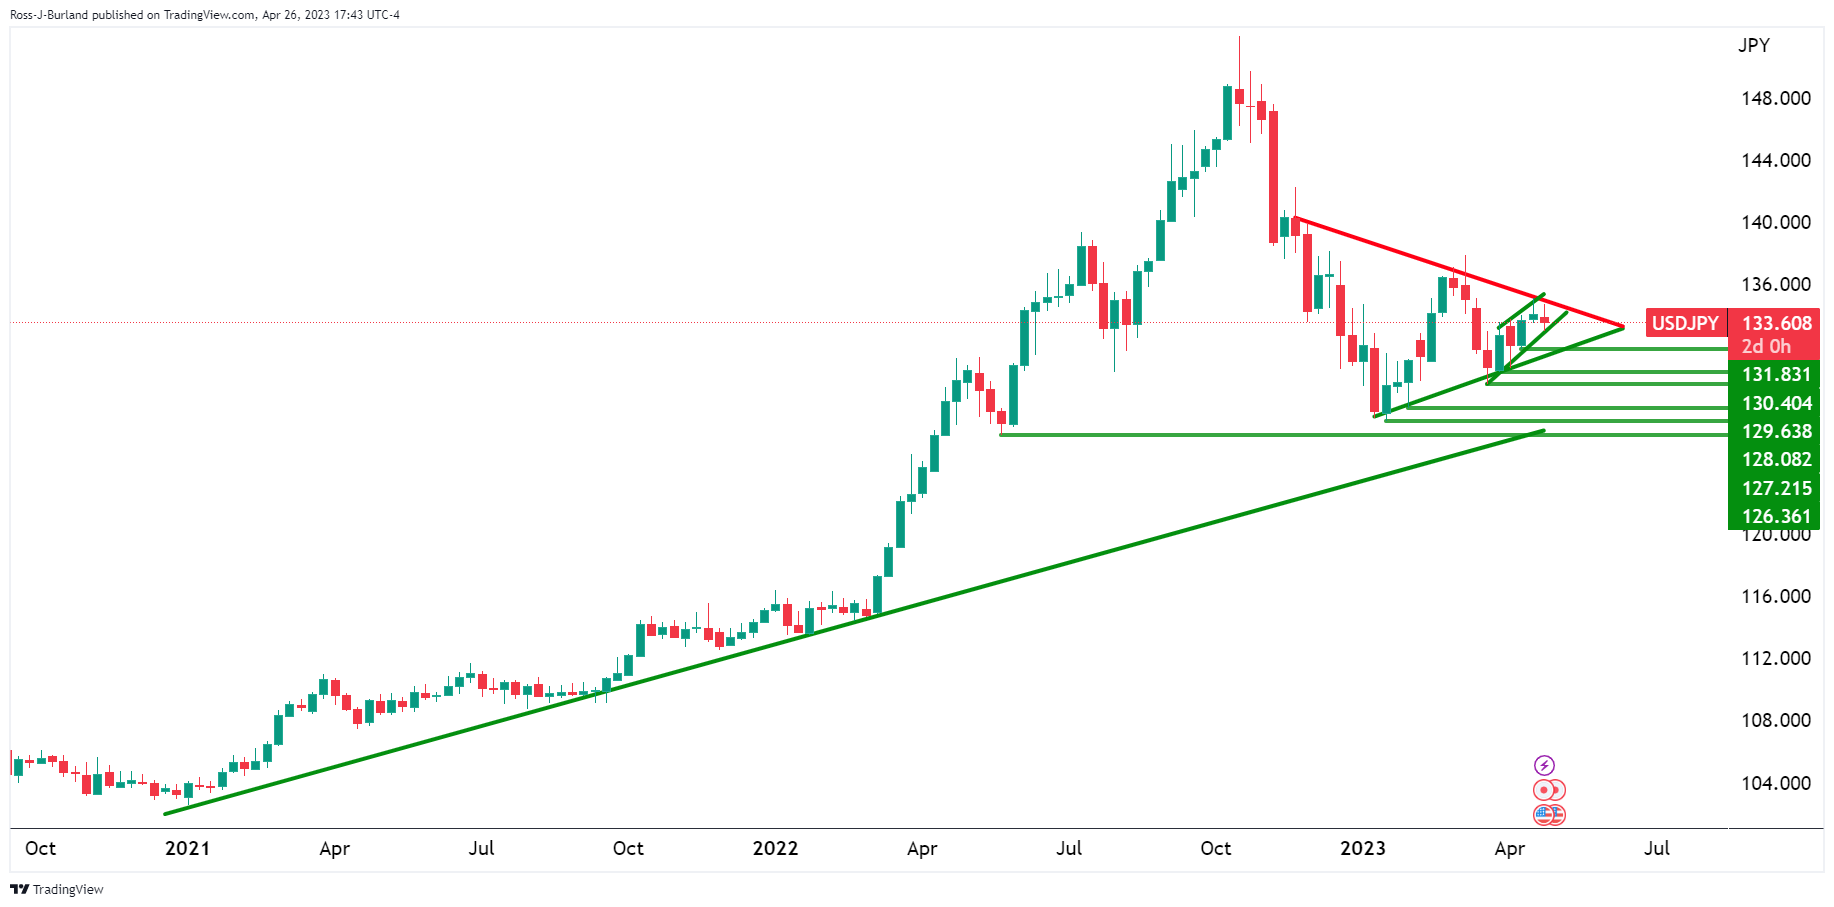
Zooming in on the weekly chart, we can see that a W-formation is taking shape with the potential for the correction to run deeper into the Fibonacci scale. The 38.2% ratio has already been met where trendline support meets the lows, so a bullish impulse could take shape from this point. However, monitoring for a deeper more to the 50% mean reversion could offer the patient bulls a discount.
USD/JPY H4 chart
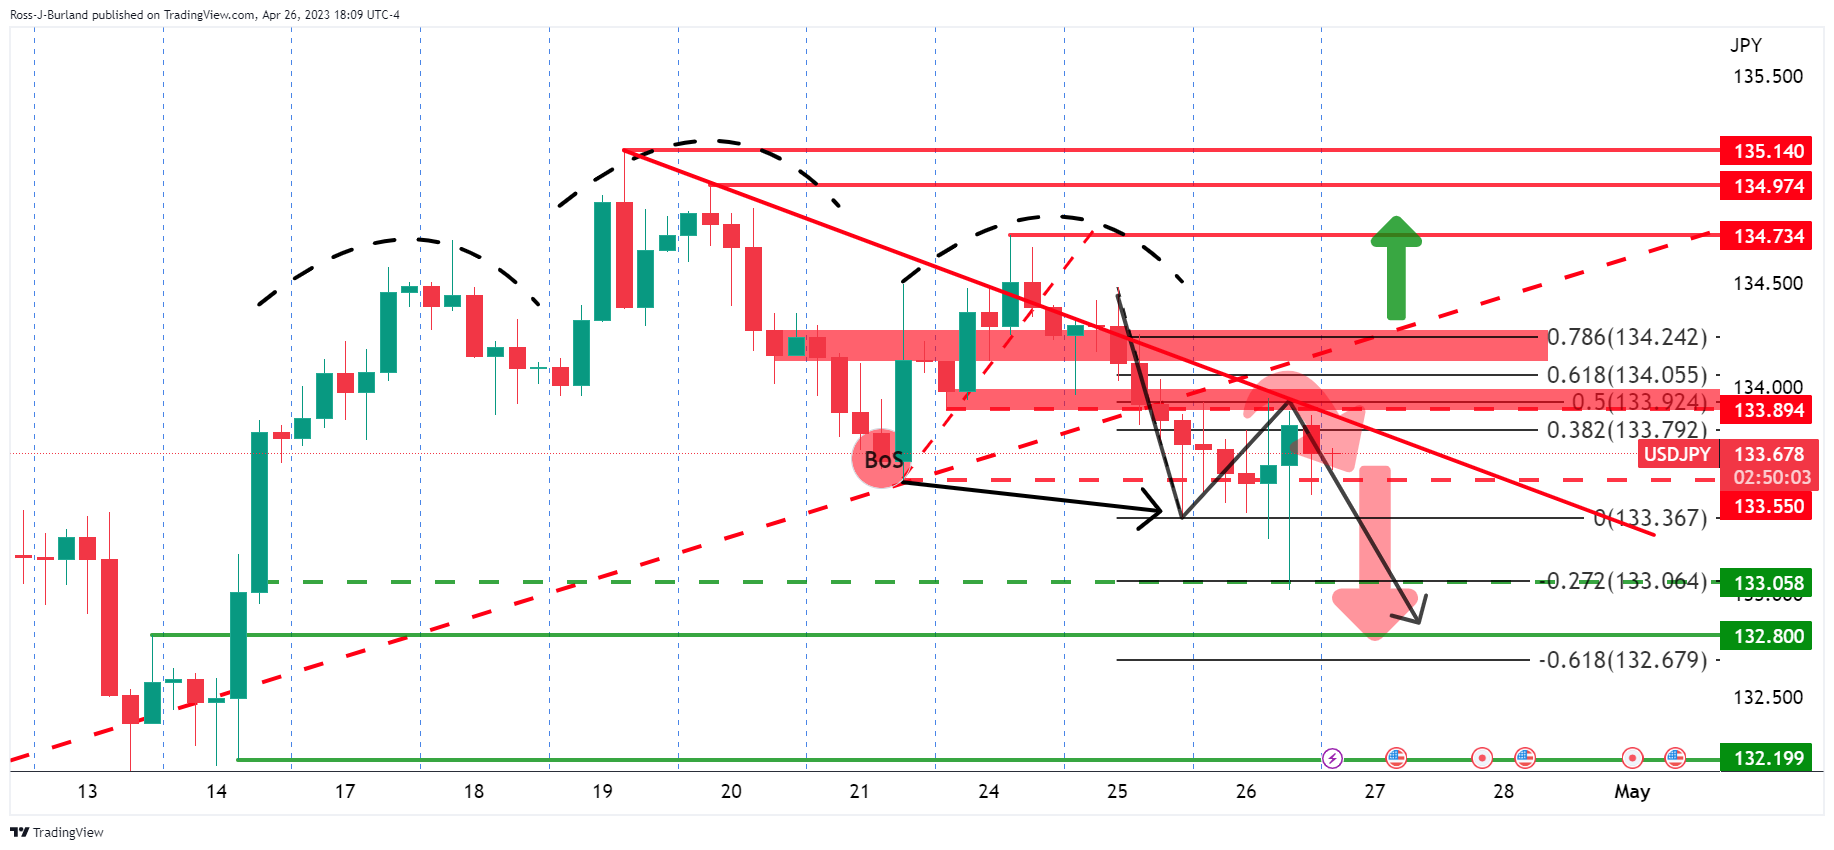
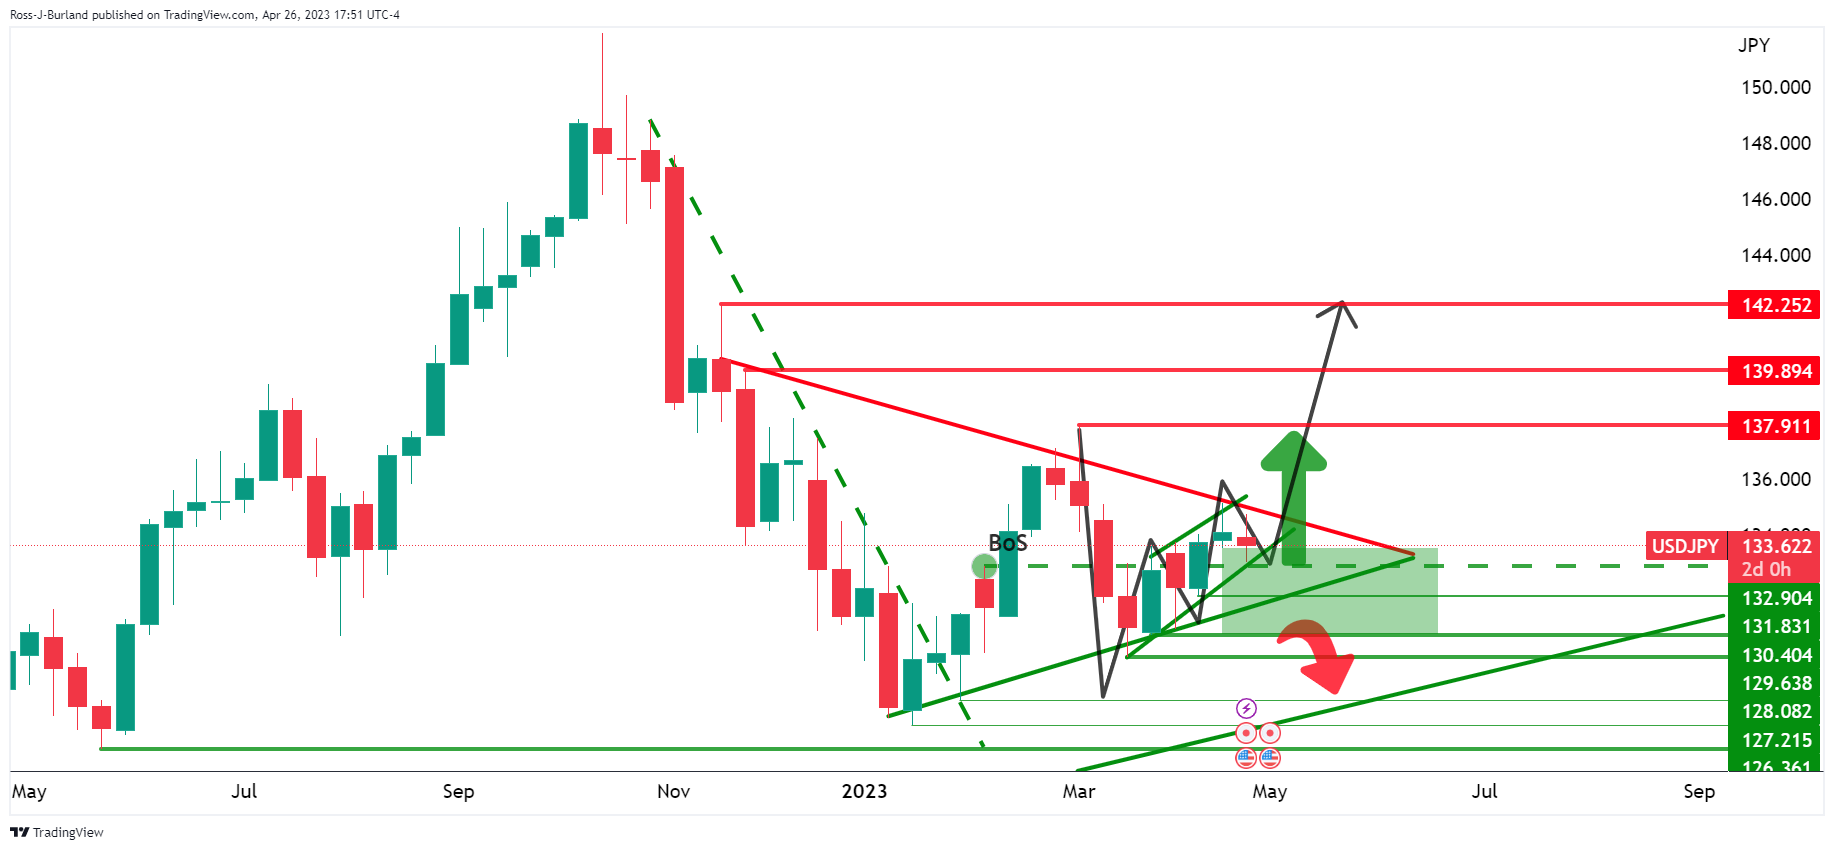
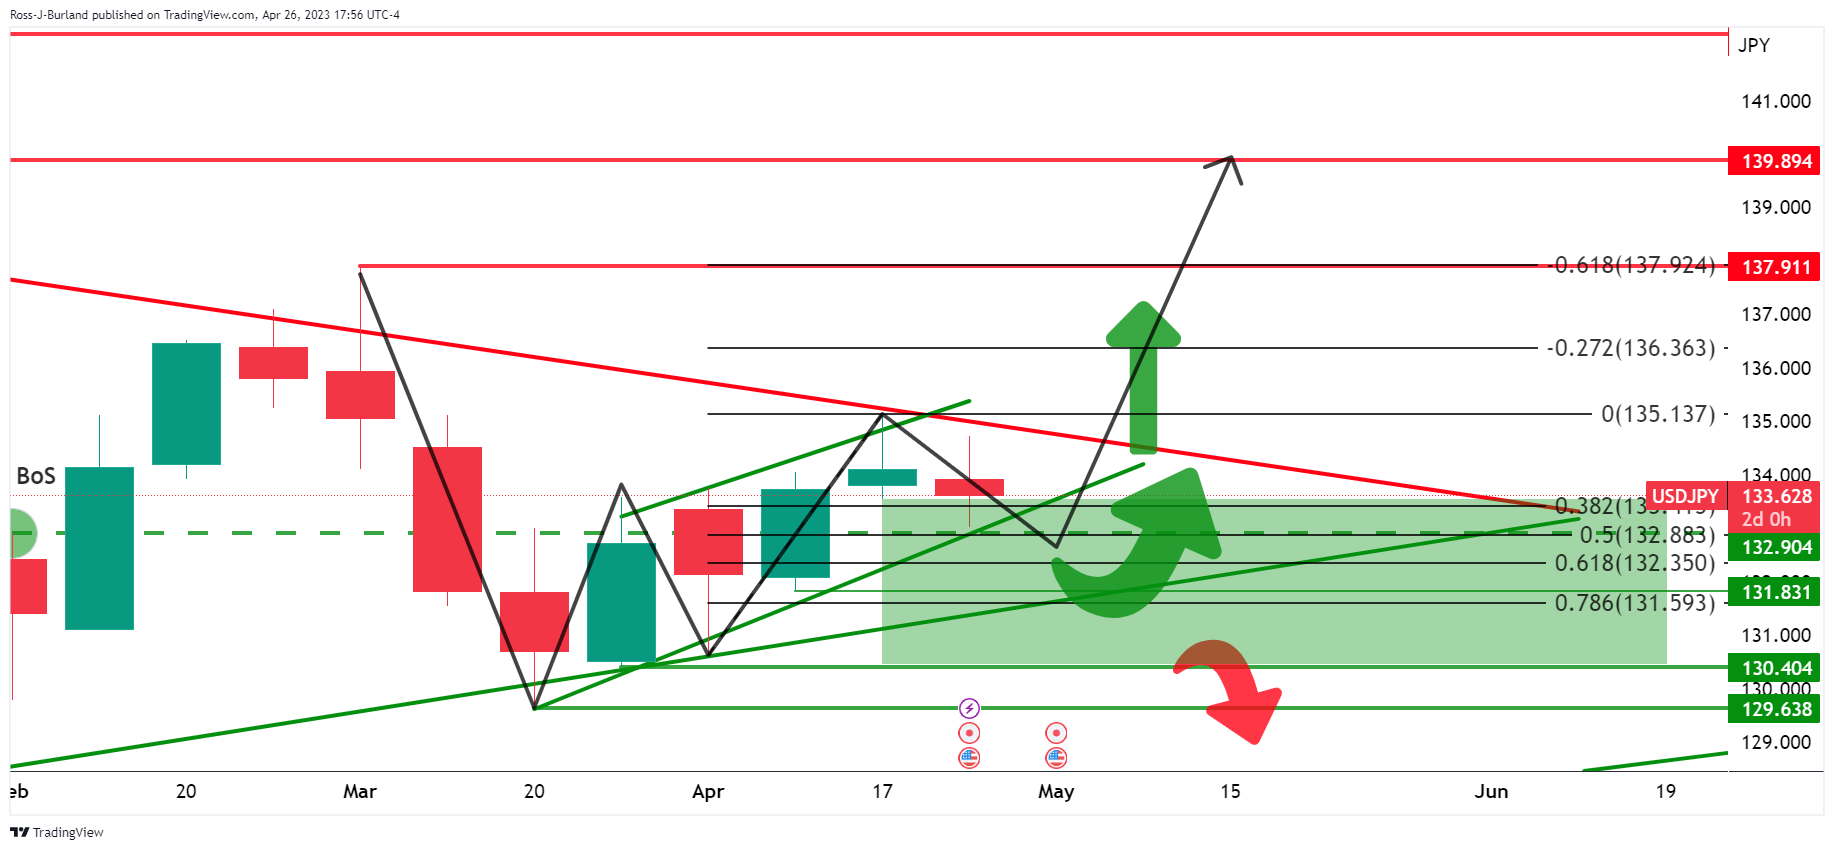
We have the head and shoulders formed with the price on the back side of the prior rising trendline support that is now expected to act as a counter-trendline. We also have seen a break of the 4-hour structure and a correction into the bearish trendline resistance meeting the 38.2% ratio. Bears could engage here which would possibly result in a downside continuation with 132.80 eyed.
-
23:08
Gold Price Forecast: XAU/USD bulls lack conviction ahead of US GDP
- Gold price grinds lower after snapping two-day winning streak as bulls await the key United States statistics.
- Downbeat sentiment, mostly upbeat US data and steady Treasury bond yields prod XAU/USD bulls.
- Softer US Q1 Gross Domestic Product can enable Gold price to refresh 2023 high.
Gold price (XAU/USD) pares the first weekly gains in thee after snapping a two-day uptrend the previous day, depressed near $1,990 amid early Thursday. In doing so, the yellow metal justifies the market’s cautious mood ahead of the United States' first quarter (Q1) Gross Domestic Product (GDP), especially amid banking sector fears and recently mixed US data. That said, the US Dollar’s rebound during late Wednesday also exert downside pressure on the XAU/USD price. Furthermore, the ongoing voting on the bill suggesting an increase in the US debt ceiling adds to the market’s anxiety and keeps the Gold price on a back foot.
Gold price retreat amid escalating banking fears, pre-data anxiety
Gold price marked its first daily loss in three the previous day as market sentiment sours amid escalating fears from the First Republic Bank (FRB) after the troubled bank’s shares dropped another 20% on Wednesday, following a 50% slump the previous day. With this, the FRB is likely to face the limits on its Fed borrowings, which in turn spreads the ripple effect across the markets and weighs on the risk appetite and the XAU/USD.
Elsewhere, the cautious mood surrounding the US debt ceiling expiration also exerts downside pressure on the Gold price as most policymakers aren’t agreeing on the measures suggested by US President Joe Biden. That said, the US House of Representatives currently votes on a bill suggesting the increase in the debt ceiling and to cut government spending, known as the "Limit, Save, Grow Act". Although the passage of the bill is only one step closer to the final destination, any disappointment can add to the risk-off mood and exert more downside pressure on the Gold price.
On a different page, recently mixed US data also confuse the market players about the Federal Reserve’s (Fed) moves past May’s 0.25% rate hike.
On Wednesday, US Durable Goods Orders rose by 3.2% in March versus 0.8% expected and -1.2% prior. Further details suggest that the Durable Goods Orders ex Transportation and ex Defense also rose past market forecasts and previous readings in March. Before that, US Conference Board's Consumer Confidence Index edged lower to 101.3 for April, versus 104.0 prior. Additional details of the publication stated that the Present Situation Index ticked up to 151.1 during the said month from 148.9 prior whereas the Consumer Expectations Index dropped to 68.1 from 74 previous readings. Further, the one-year consumer inflation expectations eased to 6.2% in April from 6.3% in March.
Amid these plays, the US Dollar Index (DXY) dropped to the lowest levels in two weeks before paring some of the daily losses to end Wednesday’s trading near 101.43. Further, Wall Street closed mixed while the United States Treasury bond yields are mostly sidelined.
To sum up, the downbeat sentiment and recent pick-up in the DXY prods the Gold buyers ahead of the key United States Q1 GDP data, expected to ease to 2.0% on an annualized basis versus 2.6% prior.
Also read: Gold Price Forecast: Bears take control as concerns mount
Gold price technical analysis
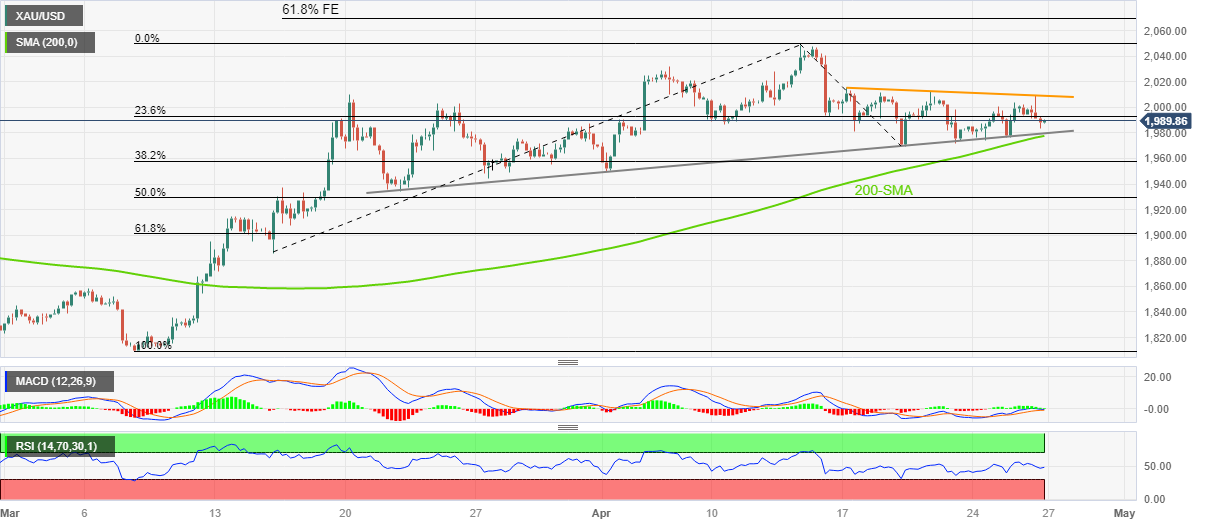
Gold price remains depressed within a small trading area between an eight-day-old descending resistance line, around $2,010, and the $1,978 support confluence including the 200-bar Simple Moving Average (SMA) and a five-week-long upward-sloping trend line.
Given the steady Relative Strength Index (RSI) line, placed at 14, the latest grind is likely to continue. However, bullish signals from the Moving Average Convergence and Divergence (MACD) indicator suggest the XAU/USD’s further upside.
In that case, the Gold price needs a successful break of the $2,010 hurdle, which in turn could trigger the bullion’s run-up towards the monthly high of around $2,049.
Following that, the $2,050 round figure and 61.8% Fibonacci Expansion (FE) of the XAU/USD moves between March 15 and April 19, close to $2,070.
Meanwhile, the Gold price pullback remains elusive unless the quote stays beyond the $1,978 key support, a break of which won’t hesitate to direct the XAU/USD bears toward the late March swing low surrounding $1,934.
Overall, the Gold price remains on the bull’s radar as the United States Gross Domestic Product data loom.
Gold price: Four-hour chart
Trend: Further upside expected
-
23:03
EUR/USD finds a cushion around 1.1040, market mood turns cautious ahead of US GDP
- EUR/USD has gauged an intermediate cushion around 1.1040 after a corrective move from a fresh annual high.
- A statement from the First Republic Bank that the US government was reluctant to provide liquidity support dented market sentiment.
- Investors are divided about the pace of interest rate hike to be adopted by the ECB in its monetary policy meeting.
The EUR/USD pair is consolidating in a narrow area around 1.1040 in the early Asian session. The major currency pair witnessed some profit booking after printing a fresh annual high of 1.0966 in the New York session. Investors turned cautious as the focus shifted to United States Gross Domestic Product (GDP) (Q1) data.
Market sentiment was extremely positive as investors were cheering bumper earnings data from US technology stocks such as Microsoft and Meta Platforms, however, the statement from the First Republic Bank that the government was reluctant to provide liquidity support after its collapse diluted the confidence of investors in the US administration.
S&P500 futures ended Wednesday’s session on a weak note despite soaring chances of steady interest rate guidance from the Federal Reserve (Fed) for its May policy meeting after the release of downbeat US Durable Goods Orders data.
The US Dollar Index (DXY) showed a V-shape rally after dropping to near the crucial support of 101.00 as downbeat market sentiment improved the appeal for the greenback as a safe-haven. Going forward, investors will keep their focus on the preliminary US GDP (Q1) data. As per the consensus, the US economy has grown by 2.0% in the first quarter of CY2023 on an annualized basis lower than the former growth rate of 2.6%. The lower pace of growth will cement fears of economic slowdown.
On the Eurozone front, investors are divided about the pace of interest rate hike to be adopted by the European Central Bank (ECB) in its monetary policy meeting next week. The street believes that options of 25 and 50 basis points (bps) are open as the shortage of labor is consistently propelling inflationary pressures.
-
22:05
NZD/USD bears move to fresh cycle lows and eye the 0.6080s
- NZD/USD bears eye the 0.6080s and 0.6060s as potential structural points.
- The 0.6150s can be regarded as potential resistance.
NZD/USD is down by some 0.3% and fell from a high of 0.6148 to score a low of 0.6111 making fresh lows for the current downtrend as banking sector woes continue to weigh on high beta currencies.
First Republic Bank's shares sank more than 20%, hitting a fresh record low for the second day in a row, on a report that the US government was unwilling to engineer its rescue, after the lender reported plunging deposits earlier this week.
The bears have taken the market toward the 2023 low of 0.6085.´´Given the Kiwi’s outperformance against AUD but staggering underperformance against EUR and GBP, it seems clear that markets are lumping AUD and NZD in the same basket, with the former struggling after softer Consumer Price Index data yesterday, and the latter struggling after yawning trade deficit data yesterday,´´ analysts at ANZ Bank said. ´´High-interest rates are just not cutting it for the Kiwi, and instead markets seem focussed on the big picture: twin deficits, and generally shaky global risk sentiment.´´
Meanwhile, earlier in the month, the Reserve Bank of New Zealand surprised the market and hiked the OCR by 50bps to 5.25%. Analysts at TD Securities noted that upside risks to inflation have been nudged higher in the near term above Feb MPS forecasts, overriding downside risks to growth.
´´Credit conditions not tightening sufficiently played a key role in the Bank's decision to hike 50bps,´´ they said, adding:
´´We discussed the potential of lowering our RBNZ terminal forecast in our Preview. However, after today's decision we retain our 5.50% peak OCR call. We see limited read-through of today's RBNZ decision for other Central Banks.´´
NZD/USD technical analysis
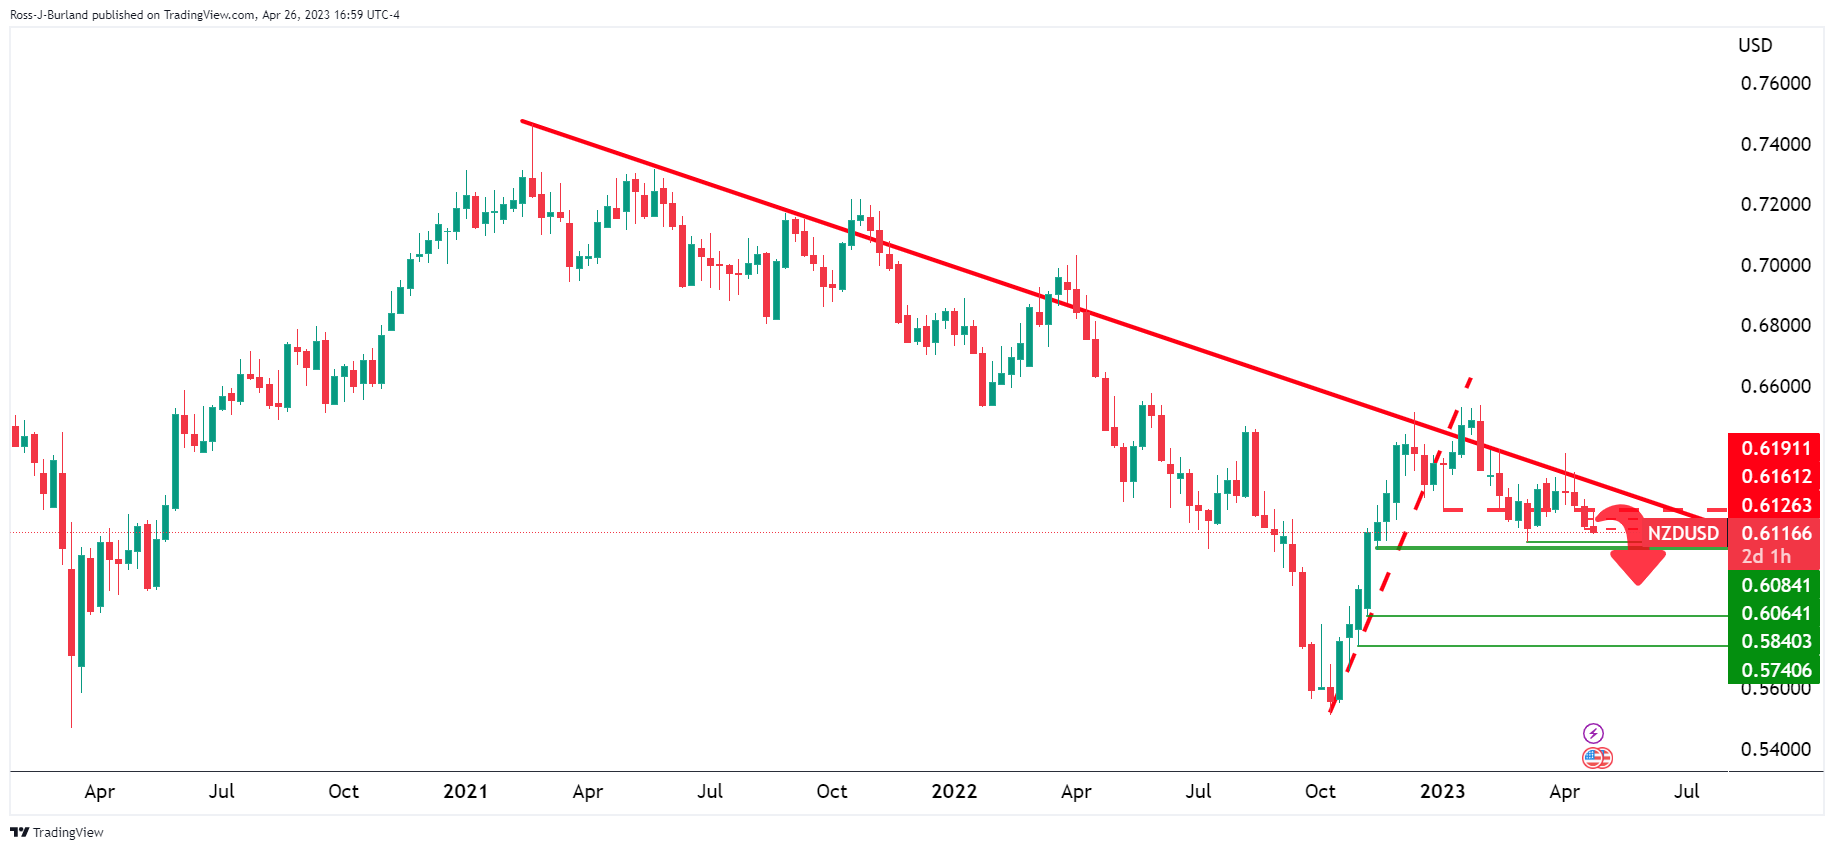
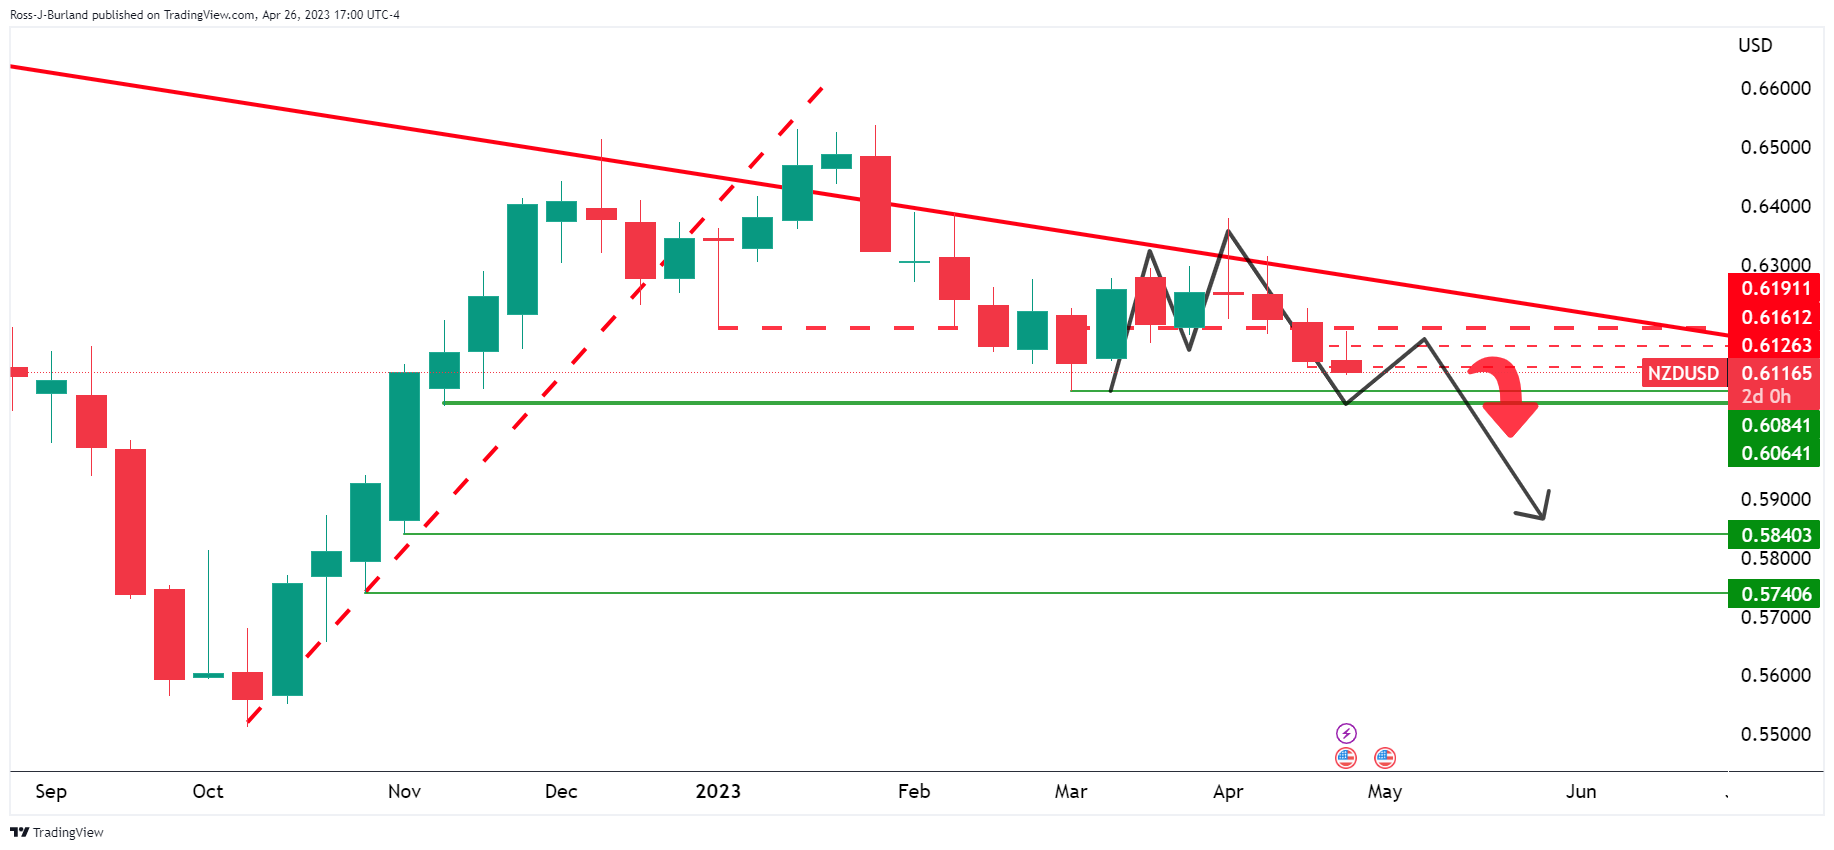
The market is on the front side of the bearish trend and remains biased to the downside while below 0.6190. The M-formation will possibly hold up the bear, however, and a correction could be on the cards over the coming week or two. The 0.6080s and 0.6060s are structural points that could come under pressure. The 0.6150s can be regarded as potential resistance.
-
22:01
Forex Today: A mixed US Dollar and cautious markets before crucial US data
During the Asian session, in New Zealand the ANZ's Business Outlook survey is due and in Australia, the Import and Export Price Index. Markets await critical Eurozone and US economic data ahead of central bank meetings.
Here is what you need to know on Thursday, April 27:
Wall Street slipped again on Thursday amid banking concerns and a gloomy outlook. First Republic Bank tumbled again. Investors continue to digest the latest earnings results. The earning season continues on Thursday with Amazon, Mastercard, Merck, T-Mobile, Intel, Honeywell, Activision Blizzard, American Airlines and Hertz.
On Thursday, the US will report the first estimate of Q1 GDP growth, which includes the Core Personal Consumption Expenditure Index, an inflation measure closely watched by Fed officials. Analysts at Wells Fargo warn that growth numbers could come significantly below consensus.
A revision to prior retail sales data published this week is a potential game-changer. If our interpretation of the latest revisions is correct, then real GDP growth for Q1-2023, which will be reported on Thursday morning, could come in at half the growth rate that is presently expected by the consensus
Other reports due in the US on Thursday include Jobless Claims, Kansas Fed Manufacturing Activity and Pending Home Sales. However, this number could be offset by inflation and growth numbers ahead of next week’s FOMC meeting. A final 25 basis points rate hike is priced in.
The US Dollar Index dropped 0.40% on Wednesday and finished far from the lows. While the Greenback hit fresh 13-month lows versus the Euro, it reached monthly highs against the Aussie and the Kiwi. Commodity currencies were hit by risk sentiment. Next week, the Fed will have its monetary policy. Markets see a final 25 basis point rate hike, but expectations have eased up a bit following renewed banking concerns. US consumer inflation will be critical for Fed’s forecast.
US Core PCE Preview: Why this is a lose-lose situation for the US Dollar
The Euro outperformed on Wednesday, amid rising odds (still low) of a 50 basis points rate hike from the European Central Bank next week. Germany, Spain and France will release inflation data on Friday, alongside Eurozone Q1 GDP. EUR/USD climbed to 1.1094, reaching the highest intraday level since March 2022 and then pulled back trimming gains.
USD/JPY ended flat around 133.60 amid relatively steady bond yields and a mixed Dollar. On Thursday, the two-day monetary policy meeting kicks off at the Bank of Japan, the first one under Kazuo Ueda. No change is expected.
Inflation slowed further during the first quarter in Australia, cementing the case for the Reserve Bank of Australia (RBA) to stay on hold next week. AUD/USD dropped again, reaching monthly lows under 0.6600. NZD/USD continued to move slowly toward 0.6100 and March lows. The ANZ's Business Outlook survey is due on Thursday. USD/CAD rose marginally, holding above 1.3600.
Metals remained sideways. Gold ended lower at $1,988 after hitting a weekly high at $2,009; while Silver slipped below $25.00. Crude oil prices lost more than 3%; WTI fell to $74.50, erasing April’s gains.
Like this article? Help us with some feedback by answering this survey:
Rate this content -
22:00
South Korea BOK Manufacturing BSI in line with expectations (68) in May
-
21:26
USD/CAD climbs as BoC maintains status quo; risk-off sentiment lingers
- USD/CAD remains positive in the day after piercing to fresh weekly highs.
- USD/CAD rallies as safe-haven demand boosts US dollar amid economic concerns.
- BoC’s minutes assure no rate cuts are expected in 2023 but leaves room for potential adjustments if necessary
The USDCAD prints a fresh four-week high at 1.3651 after the Bank of Canada (BoC) revealed its latest monetary policy minutes, which were perceived as neutral. However, a risk-off impulse and falling oil prices undermined the Canadian Dollar (CAD), a tailwind for the USD/CAD. At the time of writing, the USD/CAD is trading at 1.3642.
USD/CAD climbs as sentiment deteriorates and falling oil prices undermine the CAD
Sentiment remains fragile, as shown by US equities. The latest Atlanta Fed GDPNOW, a model that estimates GDP in the US, came at 1.1%, vs. a prior’s estimate of 2.5%, for Q1 2023. The report flashed a slowdown in the US economy, sparking demand for safe-haven assets and underpinning the US Dollar (USD) to the detriment of the CAD. Additionally, oil prices, mainly WTI, is falling off the cliff at $74.24 per barrel, down 3.70%.
The latest minutes of the Bank of Canada (BoC) revealed discussions about hiking rates in April or waiting for more evidence. However, the Governing Council (GC) noted that inflation was declining, aligned with the BoC’s forecasts. Moreover, it signaled that no rate cuts are expected in 2023, and the bank will act if higher rates are needed.
Aside from this, the US economic docket revealed Durable Good Orders for March exceeded estimates and rose 3.2% MoM, above the last month’s reading. Excluding transportation, the so-called core Orders climbed 0.3%, above forecasts.
US Treasury bond yields were gaining ground and helped the greenback to bounce from two-week lows, reaching 101.013, according to the US Dollar Index (DXY). The DXY sits at 101.468, down 0.37%.
Therefore, the USD/CAD soared and hit a new two-day high at 1.3651, and as long as it persists above 1.3600, a test to 1.3700 is on the cards.
USD/CAD Key Technical Levels
-
21:05
S&P 500 bears in control following break of structure amid banking sector woes
- S&P 500 index is moving into what could be a support area after breaking the structure of 4,069.
- The market will remain biased to the downside while below the 78.6% Fibonacci level and on the backside of the prior bullish trendline.
the S&P 500 dropped again on Wednesday and took out structure on the daily chart at 4,069 to print a low of 4,049.35 so far at the time of writing. The market remains offered towards the close and bears have been motivated by bank stocks which remained under pressure.
´´Support from tech stocks following Q1 earnings from Google’s parent Alphabet Inc. and Microsoft Corp. beating expectations was offset by a further 20% fall in First Republic Bank,´´ analysts at ANZ Bank explained.
First Republic Bank's shares sank more than 20%, hitting a fresh record low for the second day in a row, on a report that the US government was unwilling to engineer its rescue, after the lender reported plunging deposits earlier this week.
Analysts at ANZ bank explained that ´´the latest survey of US community banks showed that expectations of tighter regulation are now their biggest concern. If smaller banks in the US are to be regulated more tightly, that could precipitate a keener focus on bank asset quality, which amid high inflation and expected slower growth, could underpin more cautious lending behavior.´´
The analysts added that ´´it will take time to observe how behaviors are changing and the impact that can have on credit provision, but the ongoing concerns over the future of First Republic are continuing to unsettle risk.´´
Still, analysts are expecting a 3.2% contraction in first-quarter profit for S&P 500 companies compared with expectations for a 3.9% decline just a day ago, Reuters reported.
´´Of the 163 S&P 500 companies that reported first-quarter profit through Wednesday, 79.8% topped analysts' expectations, as per Refinitiv IBES data. In a typical quarter, 66% of companies beat estimates.´´
Meanwhile, the Federal Reserve's monetary policy decision on May 3 is coming up and traders will be on the lookout for clues on policymakers' next steps regarding interest rates. Traders have priced in a 79% chance of the U.S. central bank hiking rates by 25 basis points next week, as per CMEGroup's Fedwatch tool.
Elsewhere, ´´the US House of Representatives could vote as early as Wednesday on a bill that sharply cuts spending for a decade in exchange for a short-term hike in the debt ceiling, though it was unclear if it had enough support in the Republican majority to pass,´´ Reuters reported.
S&P 500 technical analysis
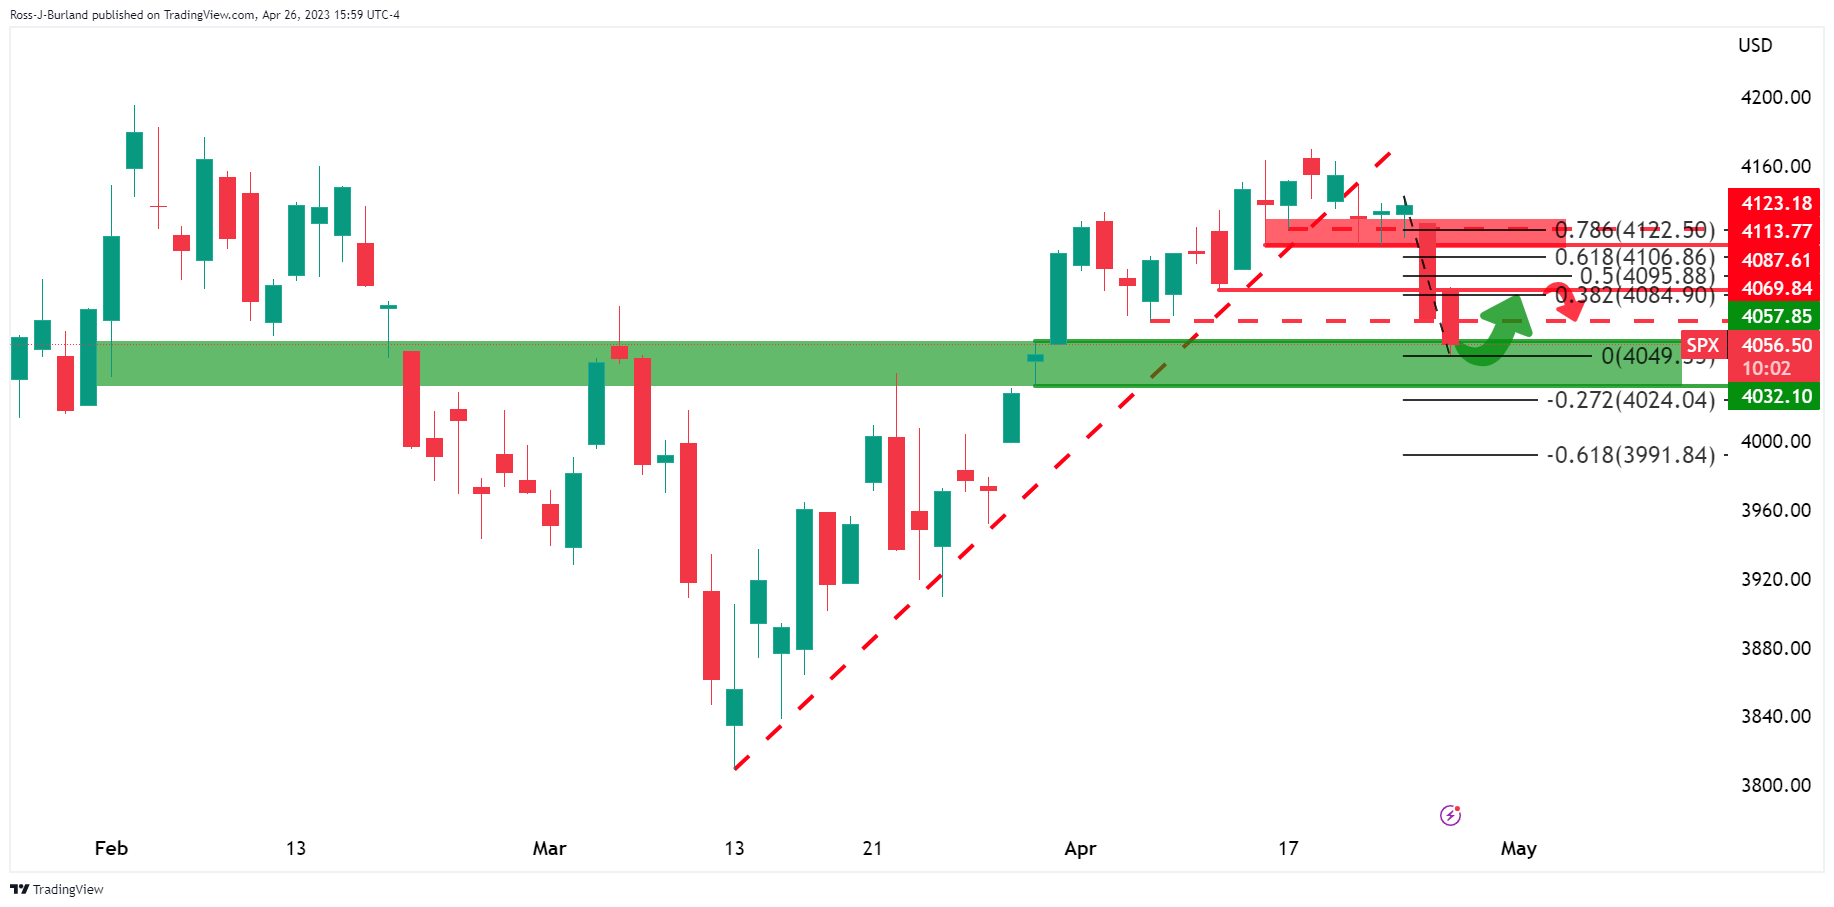
The daily chart shows the index moving into what could be a support area after breaking the structure of 4,069. A move back to 4,080s could be on the cards but the market will remain biased to the downside while below the 78.6% Fibonacci level and on the backside of the prior bullish trendline.
-
20:18
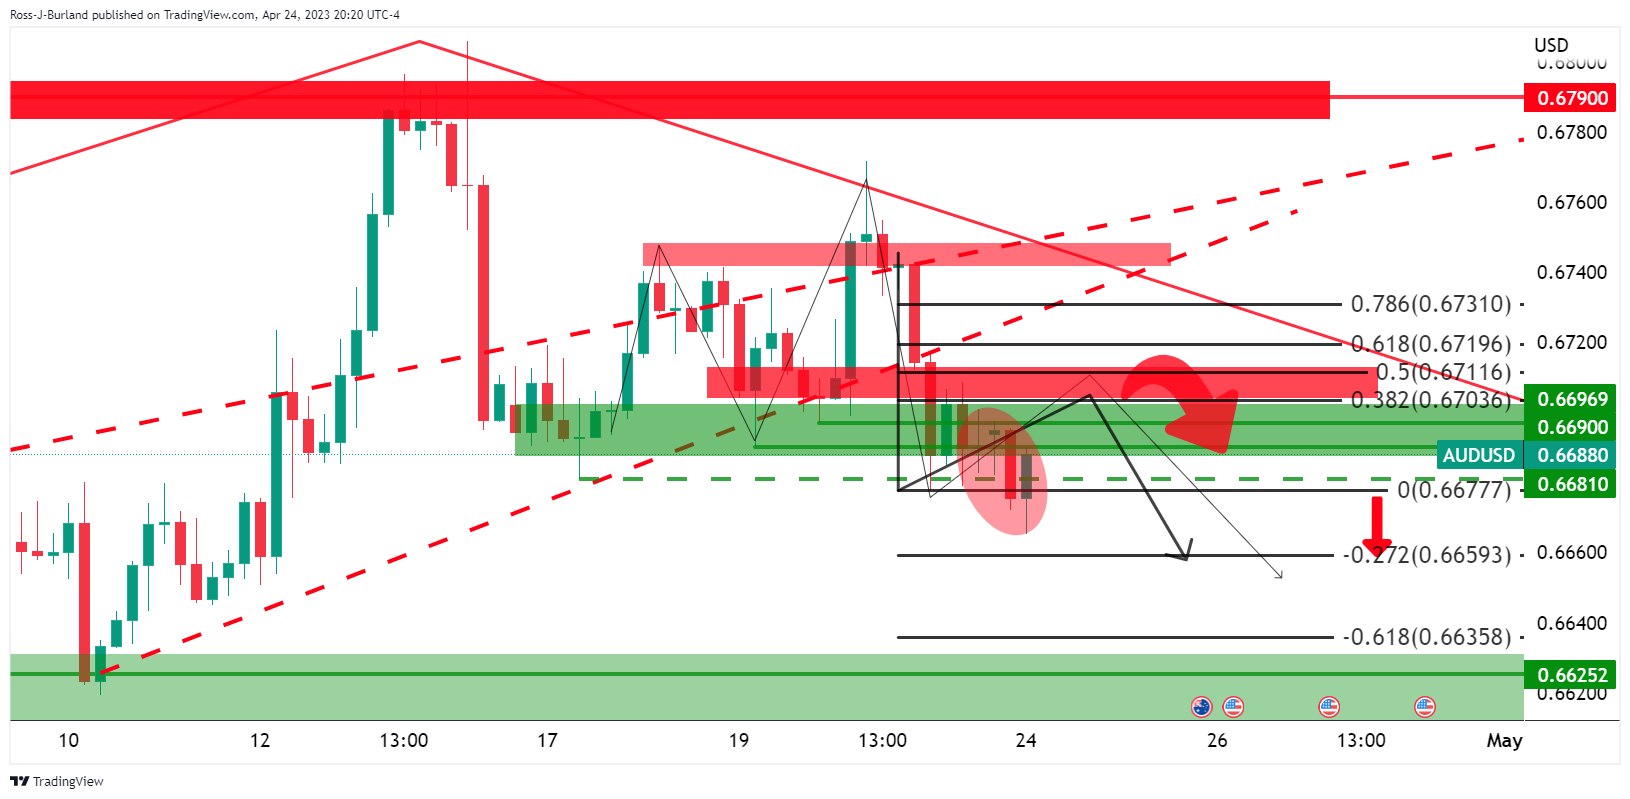
AUD/USD Price Analysis: Bulls could be lurking at the fresh cycle lows but continuaiton not off the table
- AUD/USD bulls could start to show up.
- There will be prospects of a correction into prior support near the 38.2% Fibonacci.
- The 50% mean reversion aligns with the round 0.6650 number also.
As per the prior analysis, AUD/USD Price Analysis: Bears aligned below 0.6710, and AUD/USD Price Analysis: Where are the bears hibernating? where the following illustrated the downside prospects while below 0.6710, we have seen a strong continuation move into 0.6591 today´s low.
AUD/USD prior analysis
The M-formation on the daily chart was expected to act as the peak formation in a correction and lead to a move lower to break the structure on the downside.
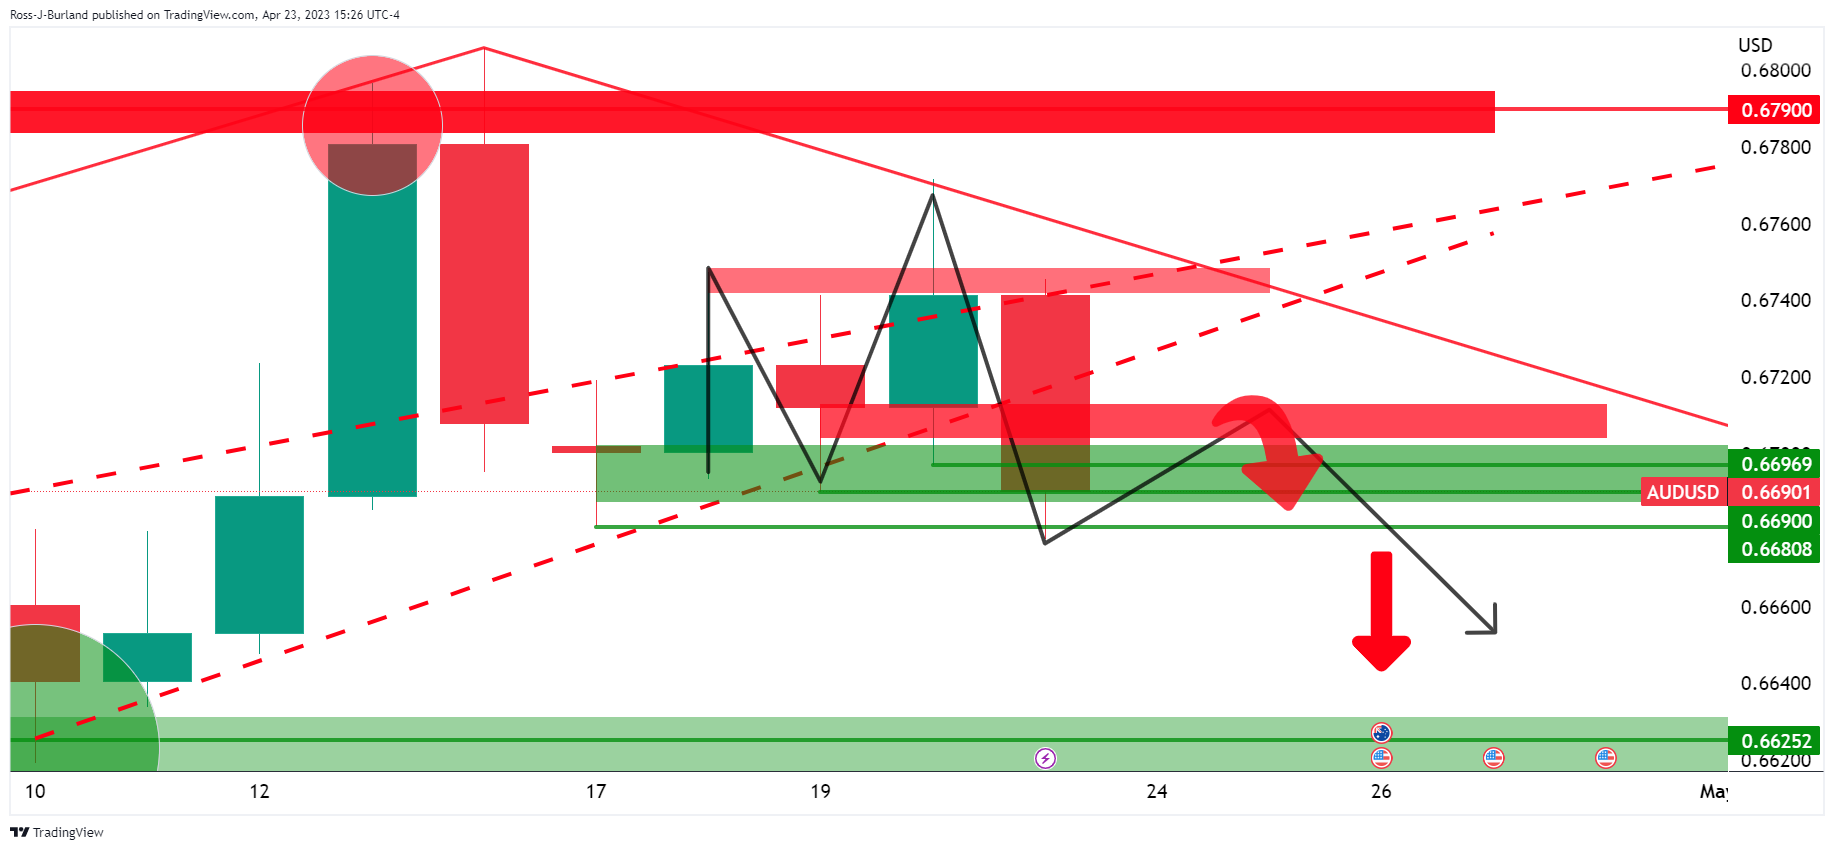
AUD/USD H4 chart
The four-hour chart´s 50% mean reversion level near 0.6710 aligned with the neckline of the pattern that could continue to act as resistance.
The price deteriorated but there had been a lack of momentum in the US Dollar and AUD/USD climbed back into the barroom brawl as follows:
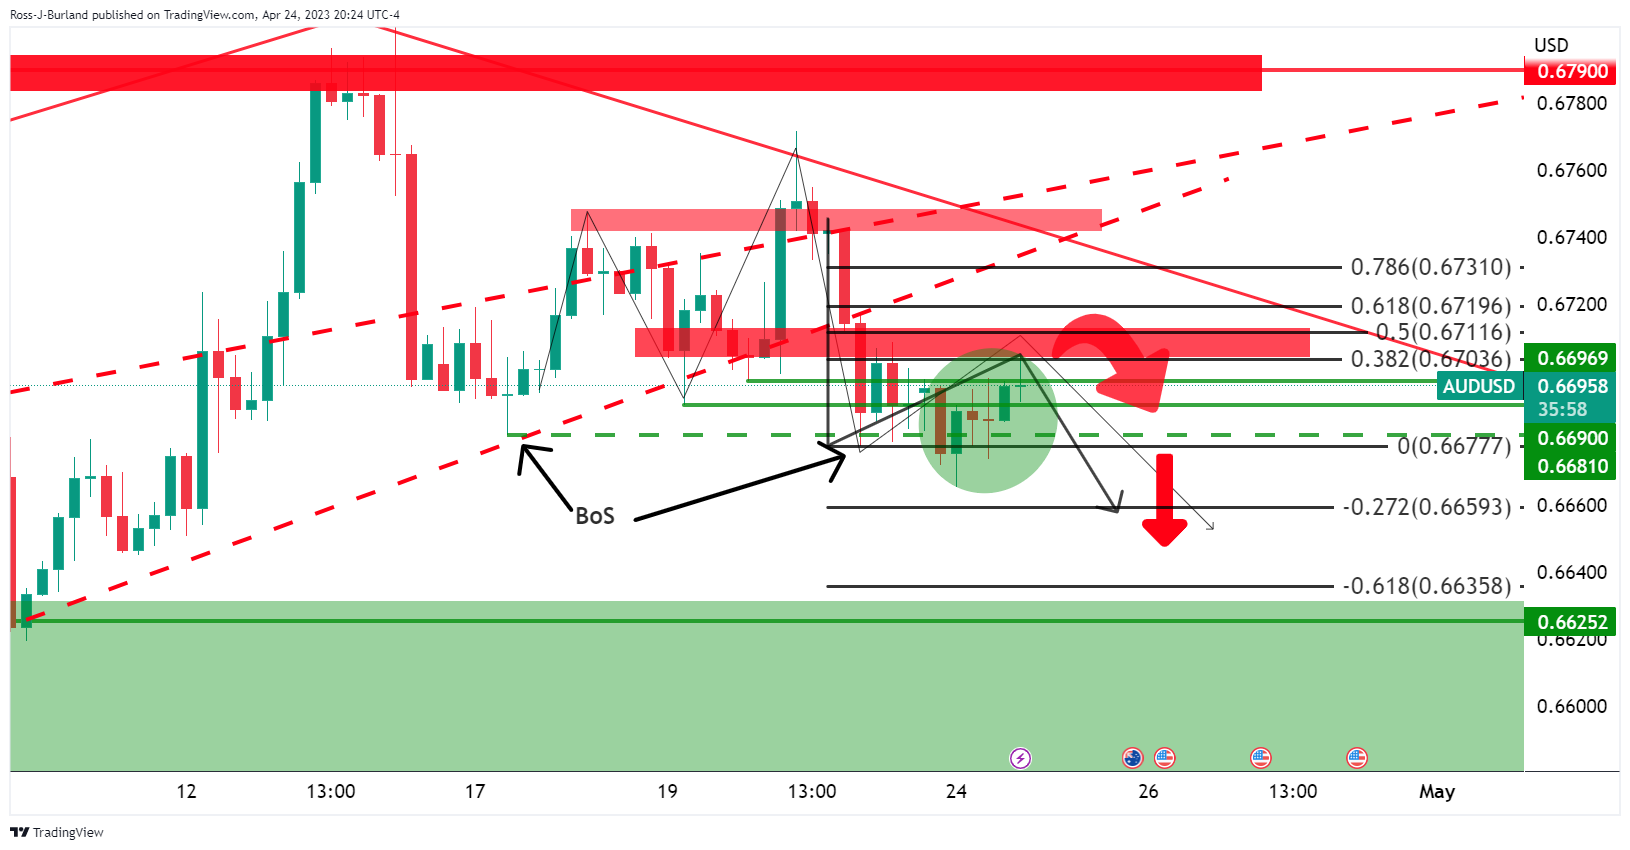
In the bearish thrust, there was a break in structure which left the bias to the downside so long as the bears showed up and guarded the 0.67s.
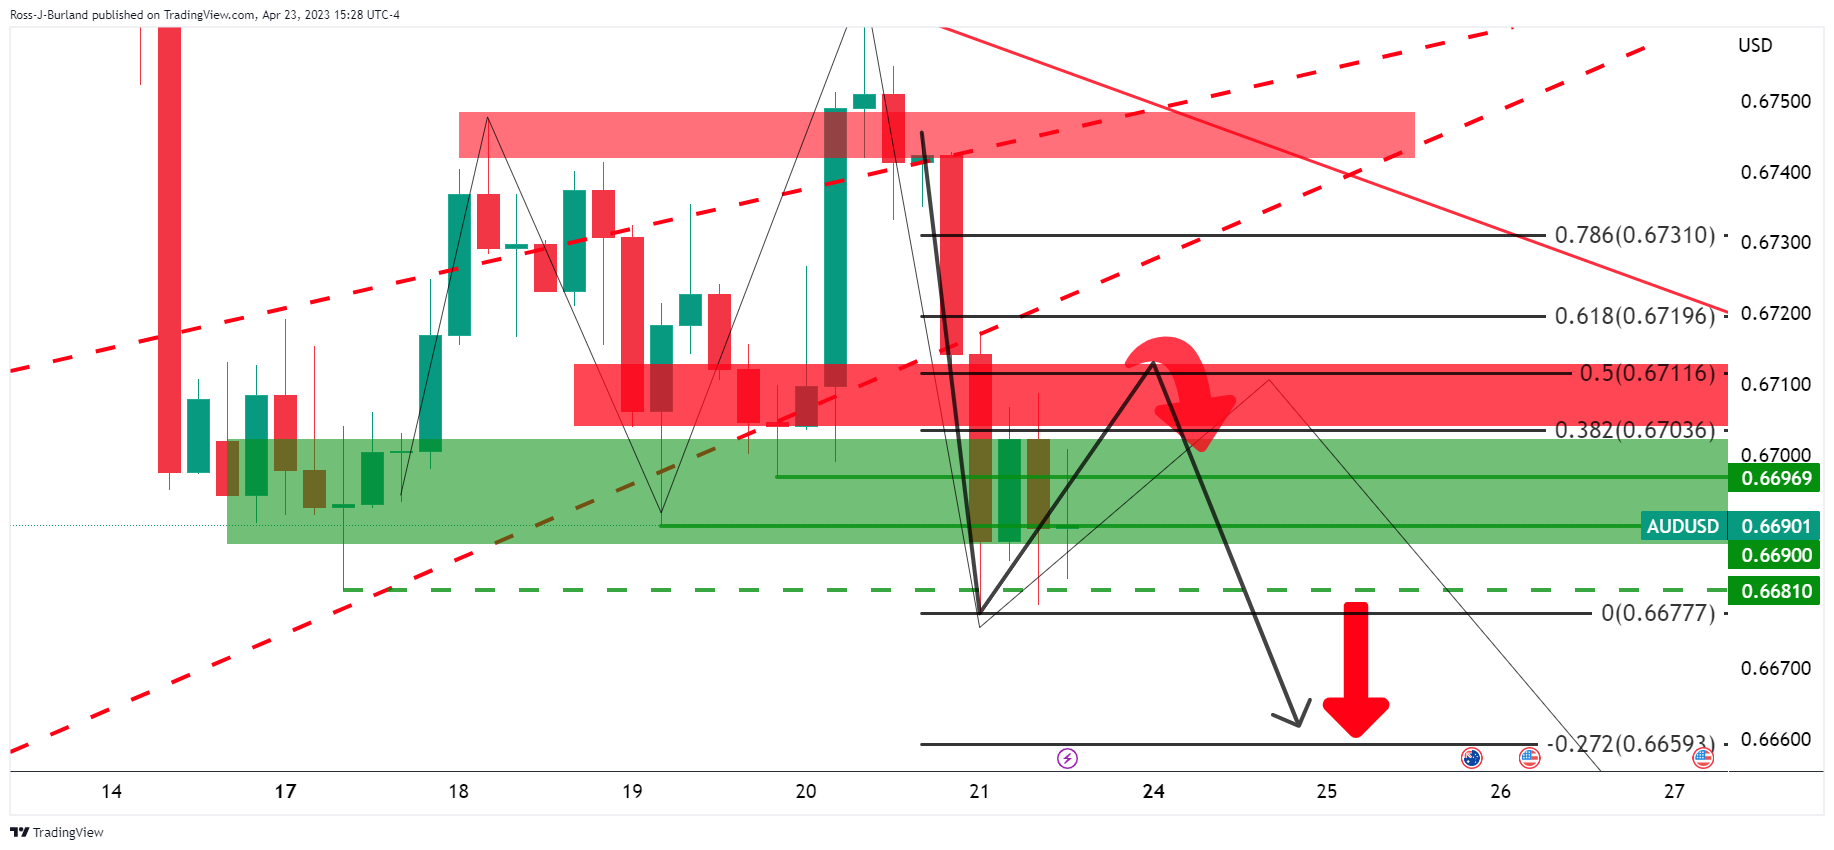
However, there was an adjustment to the daily chart´s Fibonaccis as follows:
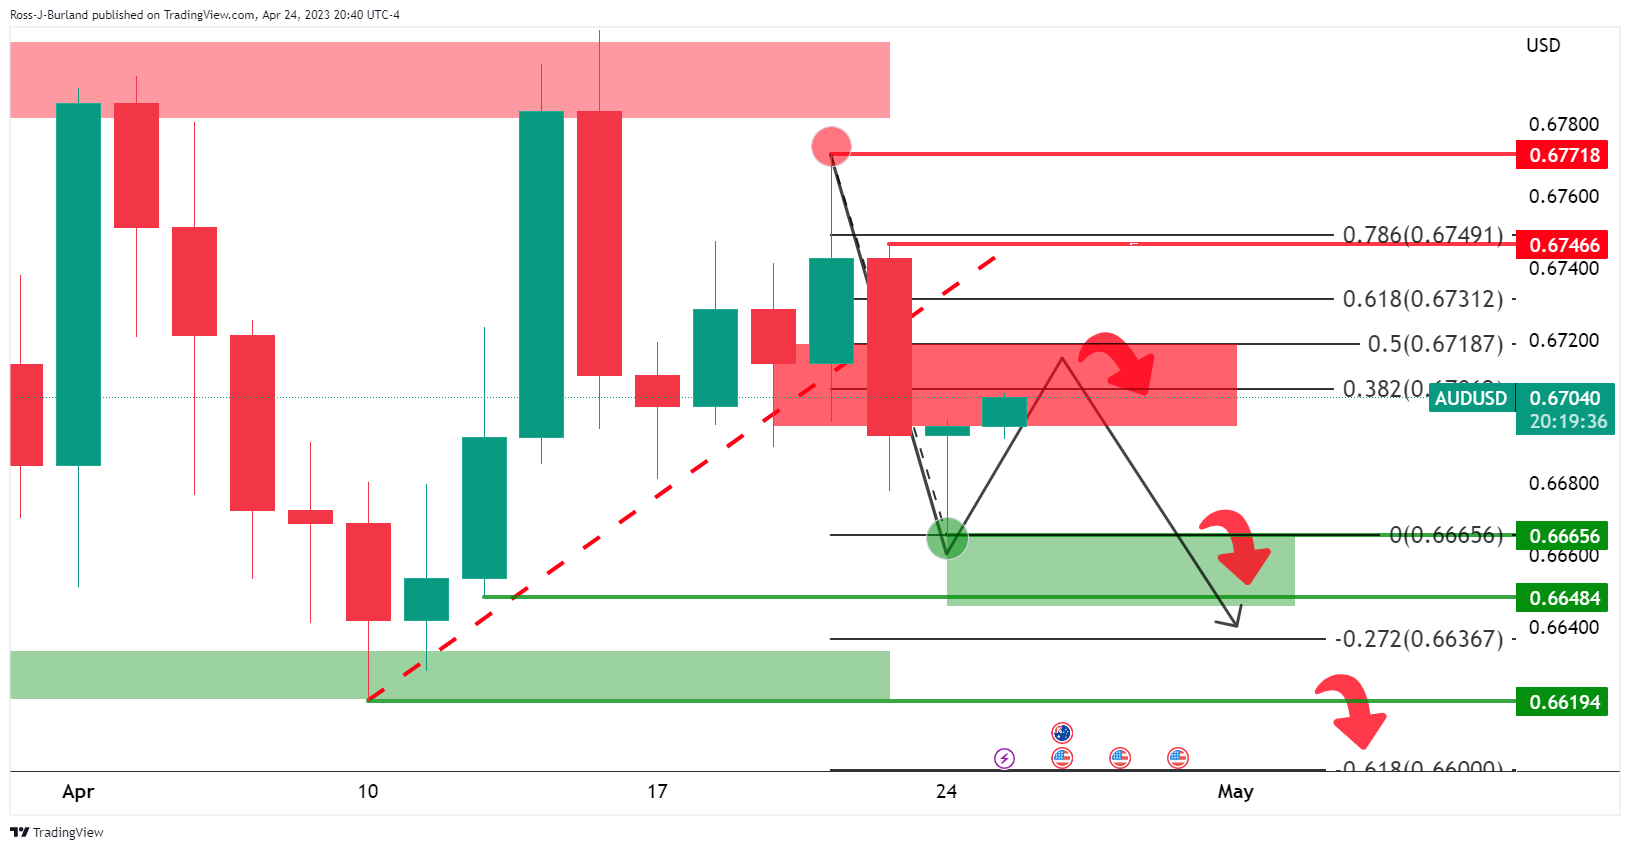
AUD/USD update
The 38.2% Fibonacci acted as resistance and we got a strong bearish impulse from there to test 0.6600 and the -61.8% Fibo.
There are long positions from below 0.6590 and 0.6560 that could see the market move into and further out:
... there is a lot of downside potential below. However...
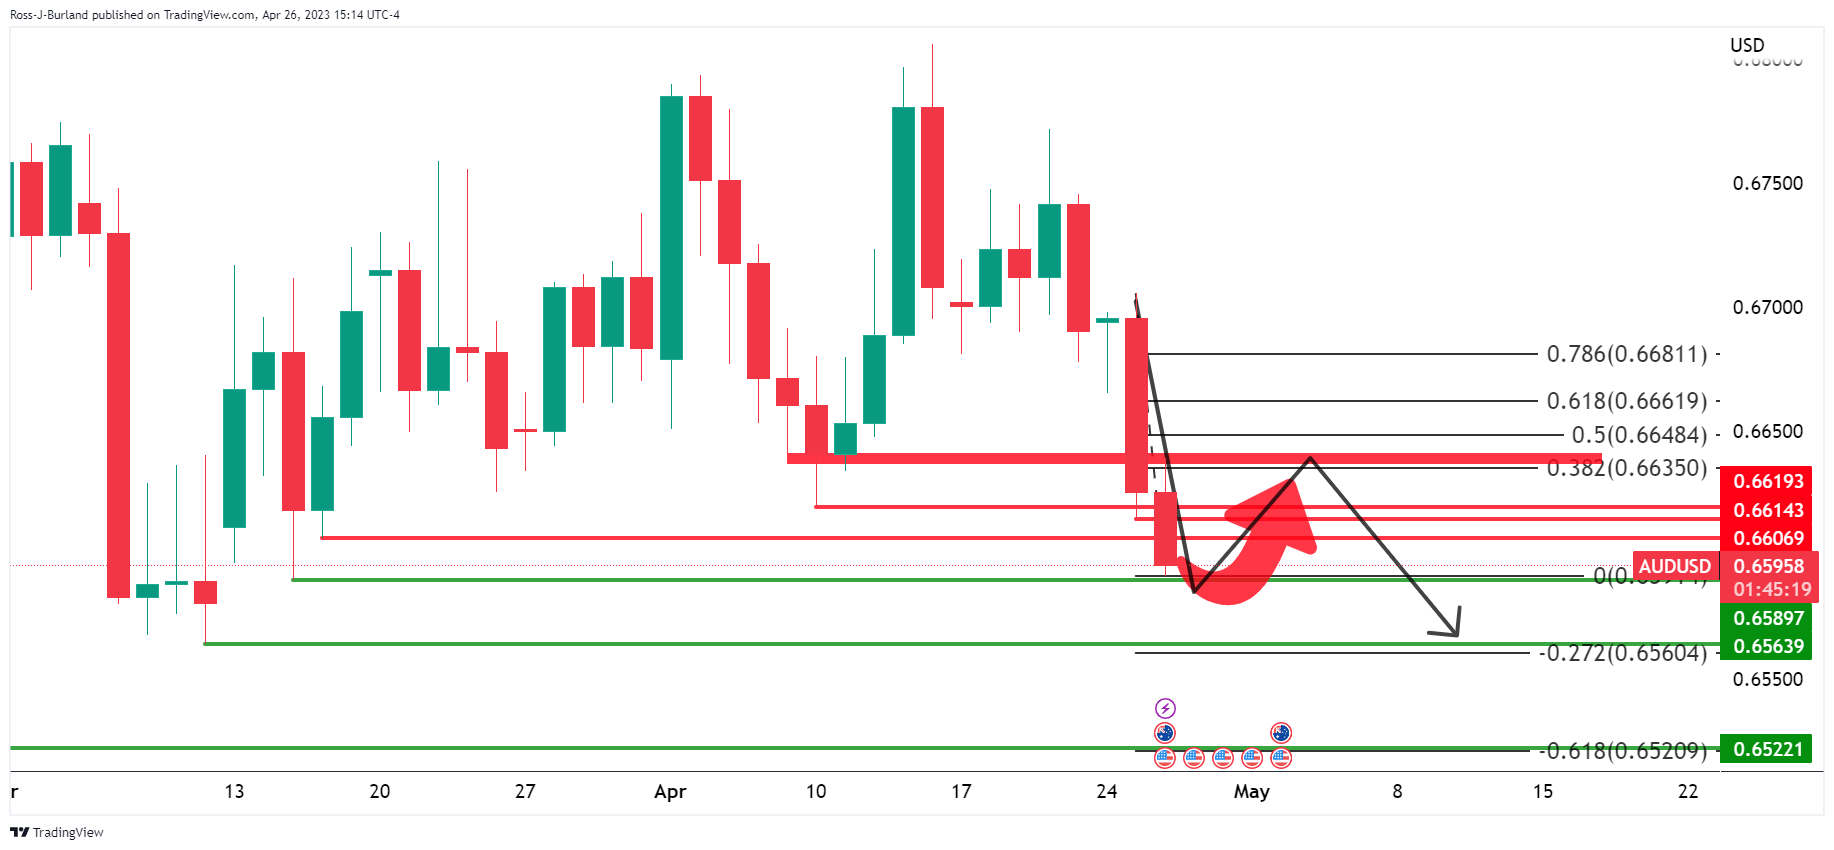
If the bulls step in, then there will be prospects of a correction into prior support near the 38.2% Fibonacci. The 50% mean reversion aligns with the round 0.6650 number also.
-
20:03
First Republic Banks faces potential curb in Fed’s borrowing; Dow Jones extends losses
“US bank regulators are weighing the prospect of downgrading their private assessments of First Republic Bank — a move that may curb the troubled firm’s access to Federal Reserve lending facilities”, reported Bloomberg.
“The Federal Deposit Insurance Corporation (FDIC) has been giving the bank time to reach a private deal to shore up its finances (…) senior officials are increasingly weighing whether to downgrade their scoring of the firm’s condition (…) that would likely limit the bank’s use of the Fed’s discount window and an emergency facility launched last month”, said Bloomberg.
Market reaction
Wall Street indexes printed fresh lows. The Dow Jones is falling 0.70% and the S&P 500 drops 0.46% while the Nasdaq gains 0.45%. First Republic Bank shares are falling 30% on Wednesday at $5.78. Two months ago, it was trading at 121.00.
-
19:51
Gold Price Forecast: XAU/USD falls below 20-Day EMA as Gold price surrenders to US bond yields rise
- Gold price lost its bright as the US 10-year Treasury bond yield recovers lost ground, eyeing 3.45%.
- US Durable Goods Orders soar in March, surpassing estimates, while Core Orders (excl. transport) edge up.
- Gold Price Analysis: XAU/USD shows bearish signs as it stays below the 20-day EMA, and RSI accelerates a downtrend.
Gold price retreats after hitting a weekly high of $2009.34, drops as an uptick in US Treasury bond yields weighed on the yellow metal price. Though the XAU/USD dived below the 20-day Exponential Moving Average (EMA), a weak US Dollar (USD) capped its fall. The XAU/USD is trading at $1987, down 0.50%.
Gold price dulls amidst rising US bond yields and bearish XAU/USD signals
OF late, market sentiment shifted sour, as Wall Street’s turned negative, except for the Nasdaq. US economic data revealed in the day, namely Durable Good Orders surprisingly jumped by 3.2% MoM in March, exceeding estimates of 0.7%. Core Durable Good Orders, which exclude Transports, edged up 0.3% MoM, compared to a contraction of -0.2% estimated by the consensus.
Aside from this, US regional bank woes continued to dent investors’ mood, while a bid in US Treasury bond yields undermined appetite for the XAU/USD. The US 10-year Treasury bond yield advances four basis points, at 3.447%, but remains well below the opening week levels of 3.568%.
In the meantime, expectations for a US Federal Reserve (Fed) 25 bps rate hike in May, diminished, with odds at 76.1%, below the previous week’s 83.3% chance.
Regarding US politics, later news, the Republican Debt ceiling bill advanced in the US House of Representatives toward a debate and a possible vote.
Meanwhile, recession fears in the United States increased, as the US Atlanta Fed GDPNow for Q1 stands at 1.1%, versus a previous reading of 2.5%, ahead of the release on Thursday of Advance GDP figures for Q1 2023.

Besides that, the US economic agenda will feature Initial Jobless Claims for the latest week, alongside Pending Home Sales and Friday’s release of the Fed’s preferred gauge for inflation, the core PCE.
XAU/USD Technical Analysis
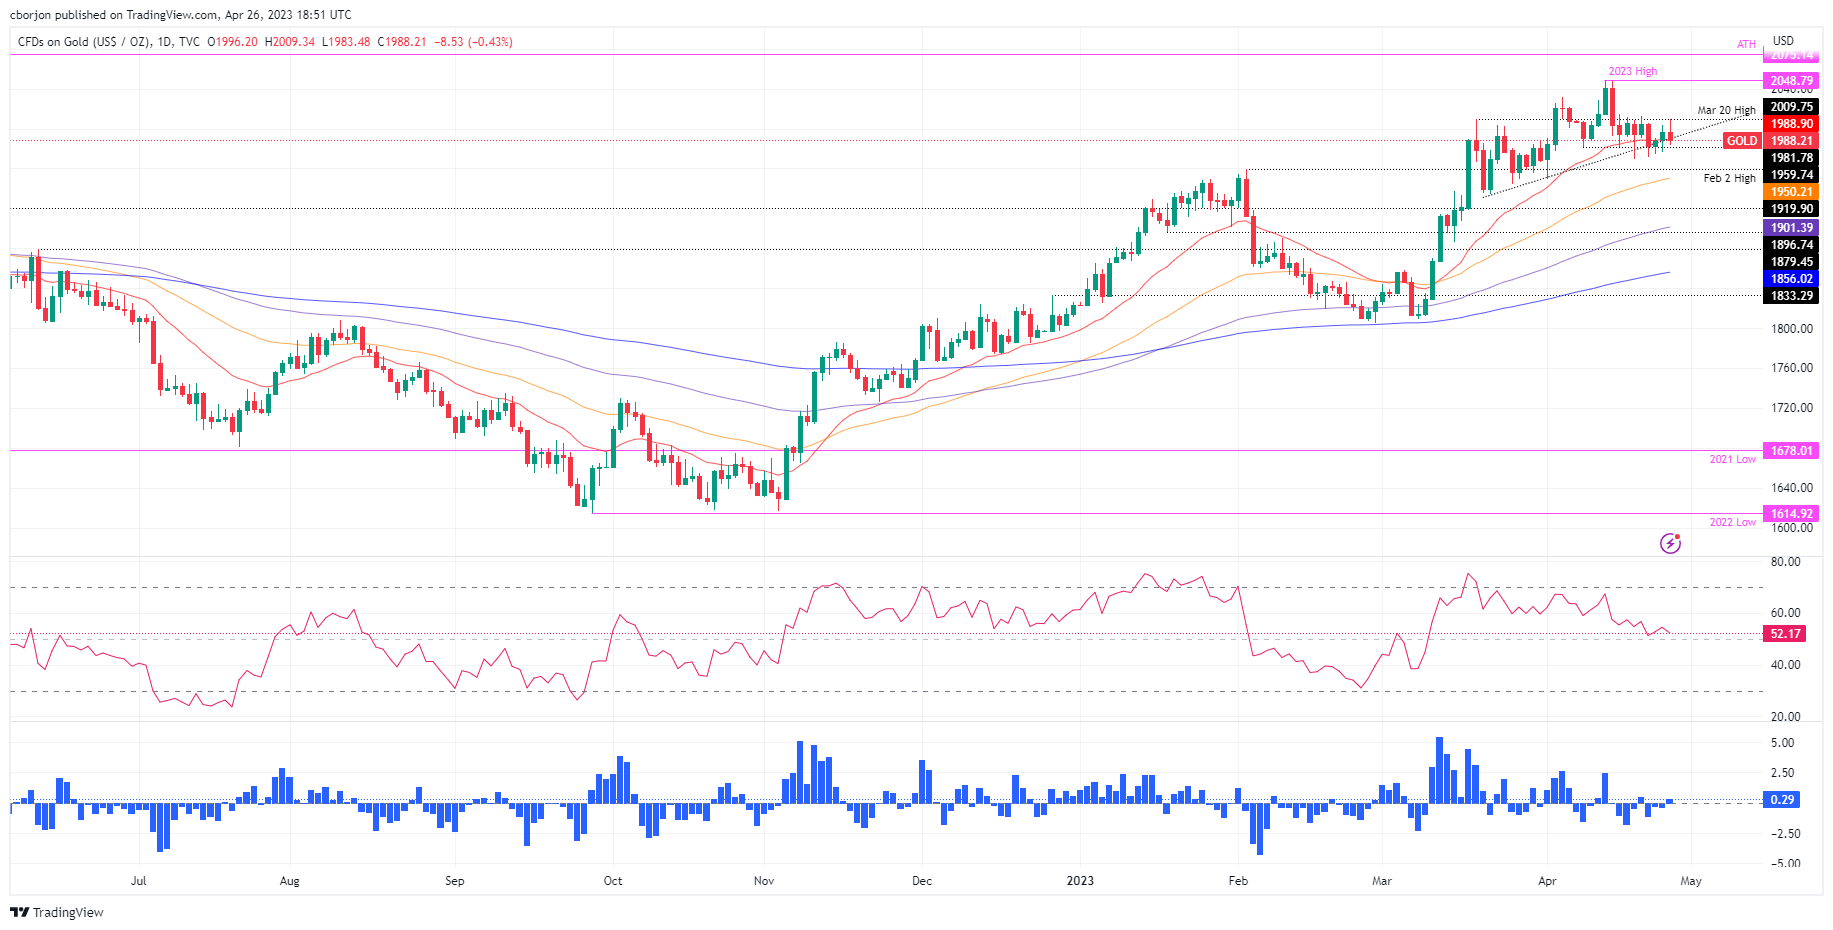
From a technical perspective, some signs suggest the XAU/USD could test the $1950 area in the near term. Firstly, the XAU/USD stays below the 20-day EMA, which sits at $1988.65, not far from the current price, but a daily close below the former, is a signal of bearishness. Moreover, the Relative Strength Index (RSI) accelerated its downtrend and is about to cross below the 50-mid line. That said, further downward action is warranted.
Hence, the XAU/USD first support would be the latest couple of weeks’ low at $1969.34, followed by the February 2 high at $1959.74, before falling to the confluence of the figure and the 50-day EMA at $1950.
Conversely, if XAU/USD reclaims the 20-day EMA, further sideways action between the $1980-$2000 area is expected.
-
18:50
BoC’s Summary of Deliberations: Expectations for rate cuts later in 2023 are not the most likely scenario
The Bank of Canada's Summary of Deliberations from the April 12th meeting when it kept interest rate unchanged, showed they discussed hiking rates. The document notes that inflation was declining in line with BoC Governing Council estimates. Officials agreed that expectations for rate cuts later in 2023 are not the most likely scenario.
“Governing Council agreed that while the new economic projection was similar to January’s, there was a sense that the economy was proving a little stronger than expected,” said the summary. Members were concerned that the current pace of wage growth is not consistent with getting inflation back to 2% without a substantial increase in productivity.
Members agreed that it was important to continue to signal that the central bank is prepared to tighten policy further if needed.
Key quotes:
“Governing Council noted that while global economic growth remained subdued, it was again coming in stronger than expected, particularly in the euro area and the United States.”
“Governing Council assessed recent data and developments in Canada and judged them to be evolving broadly in line with their January projection. Headline inflation was coming down, and signs of a rebalancing of supply and demand were becoming evident. But Governing Council acknowledged that the labour market was still tight and the slowing in growth would likely come a little later.”
“Members of Governing Council revisited their concern that the current pace of wage growth, if sustained, would not be consistent with getting inflation back to 2% without a substantial increase in productivity (which has been declining in recent quarters).”
“Governing Council agreed that, overall, consumer spending is anticipated to be subdued in the second half of 2023 and into 2024 as the effects of the tightening in monetary policy work their way through the economy.”
“Governing Council was more confident that inflation in Canada would continue to fall in the coming months to around 3%, the second stage of disinflation all the way back to 2% could prove more difficult.”
“Members agreed that while a risk of a sharper slowdown remains, based on their current outlook, cutting rates later this year did not seem to be the most likely scenario.”
“The discussion around increasing the interest rate further focused on whether monetary policy was restrictive enough and whether it was best to raise the policy rate now or wait for more evidence.”
Market reaction
The USD/CAD pair dropped modestly after the minutes fell below 1.3620. It is flat for the day after surging on Tuesday from 1.3545 to 1.3647, reaching the highest level in a month.
-
18:39
GBP/USD bulls flush out shorts to test 1.25s
- GBP/USD bulls move into fresh daily highs testing bearish commitments in the 1.25s.
- A break of trendline support is eyed for the days ahead.
GBP/USD rallied on Wednesday to a fresh high of 1.2515 on further signs of a US economic slowdown that has dented the US Dollar. Data this week has not been favorable for the Greenback and today´s orders for core capital goods slipping more than expected in March has weighed on the currency further.
The US Dollar index, DXY, which measures the currency against six major rivals, dropped to a low of 101.013 as new orders for key U.S.-manufactured capital goods fell more than expected last month. Shipments also fell suggesting that business spending on equipment was likely a drag on economic growth while investors await the Gross Domestic Product numbers. All in all, driving the US Dollar versus other major currencies has been early signs of a US slowdown and decelerating inflation.
Meanwhile and domestically, investors are pricing in rate hikes from the Bank of England that will push up Bank Rate to around 4.9% by September from 4.25% currently. Last week´s strong wage and Consumer Price Index data have shown that underlying inflation pressures are more persistent than previously expected. the CPI data in fact revealed Britain's inflation rate remained above the 10% mark for a seventh straight month in March.
For that, analysts at TD Securities said that they expect a final 25bps hike in June, bringing the BoE's terminal rate to 4.75% (was 4.50%). ´´Strong inflation data continues to weigh on GBP rates. We believe the hawkish price action supports entering longs in GBP on a cross-market basis.´´
However, the more recent data have painted a mixed picture of the country's economy. Data from the ONS showed that Retail Sales fell more than expected in March amid the rising cost of living and poor weather conditions. The latest Markit PMI survey suggested that Britain's Gross Domestic Product grew the most in a year in April.
GBP/USD technical analysis
The rally in GBP/USD has moved into the prior day´s shorts and has squeezed positions above yesterday´s highs. This could be a signal that the market is preparing to finally head lower as per the head and shoulders. However, a close above 1.2505 and then 1.2537, April 23 highs, will leave the bias in the hands of the bulls.
-
18:28
WTI is under pressure from rising US Dollar despite a dip in US oil inventories
- WTI bounced as US EIA revealed crude inventories dropped by 5.1 million barrels compared to the last week.
- Gasoline and distillates followed suit, though they did not underpin WTI’s price.
- WTI Price Analysis: Downward pressured by solid resistance around $77.24-$78.37.
Western Texas Intermediate (WTI), the US crude oil benchmark, trims some of its earlier losses that carried oil prices toward its weekly low at $75.69 per barrel. However, a late recovery in the US Dollar (USD) keeps WTI pressured, even though a report on US crude inventories falls more than expected, as data shows. At the time of writing, WTI is trading at $76.42 PB, down 1.21%.
On Wednesday, the US Energy Information Administration (EIA) revealed that crude inventories slid by 5.1 million barrels compared to last week, exceeding estimates of -1.5 million. The EIA informed that gasoline and distillates also declined by 2.4 million barrels and almost 600,000 barrels, respectively.
Following the release of the EIA’s report, WTI bounced off daily lows at around $75.60 PB toward the current price level.
Of note is that WTI prices had almost erased all of their gains after the Organization of the Petroleum Exporting Countries (OPEC) and its allies, known collectively as OPEC+, announced additional cuts to crude oil in early April.
WTI dived on Tuesday on concerns that additional rate hikes by global central banks could dent demand. The latest tranche of US economic data, particularly Federal Reserve’s (Fed) Regional Banks Manufacturing and Business activity indices, flashed an ongoing economic deceleration. Nevertheless, expectations for further tightening remain high, with most investors expecting a 25 bps rate hike by the Fed at the May 2-3 meeting.
Moreover, US consumer confidence deteriorated to a nine-month-low in April, as concerns mounted that the US economy may tip into a recession late in the year.
WTI Technical Analysis
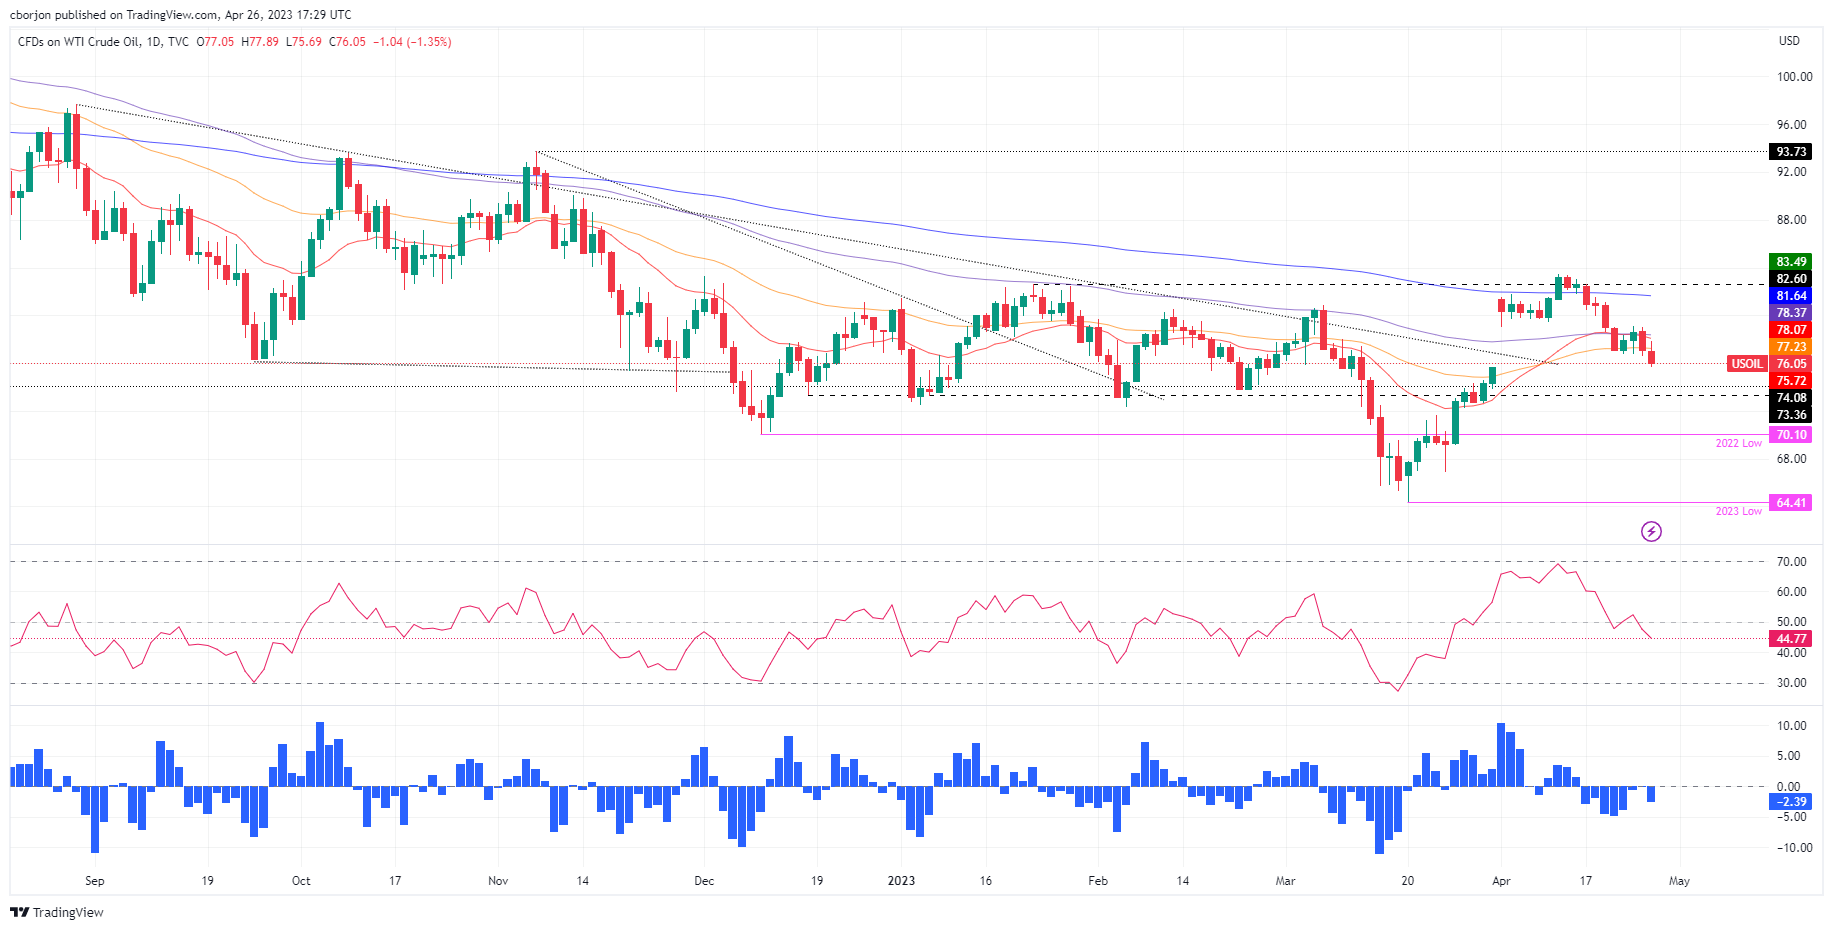
After covering the $6.00 gap, WTI is attempting a recovery towards the $77.00 PB area but faces solid resistance upwards. The 50-day Exponential Moving Average (EMA), at $77.24, would be difficult to surpass, followed by the 20 and 100-day EMAs, at $78.10 and $78.37, respectively. On the flip side, a daily close below the March 31 high of $75.68 could pave the way for a fall toward the $74.00 area.
-
18:02
United States 5-Year Note Auction: 3.5% vs previous 3.665%
-
17:22
USD/MXN gains momentum as investors seek safety amidst US banking sector woes
- US Durable Good Orders exceeded forecasts, while Core advanced above estimates.
- Banxico’s Governor, Victoria Rodriguez Ceja, hints at a potential tightening cycle pause.
- USD/MXN maintains a downward trend with resistance at 18.1122, which, if cleared, expects further upside toward 18.3132.
USD/MXN advanced past the 20-day Exponential Moving Average (EMA) spurred by a risk-off impulse, as US banking sector woes reignited as First Republic Bank stock sank in Tuesday’s session. That said, outflows from the emerging market currency seeking safety moved to the US Dollar (USD). At the time of writing, the USD/MXN is trading at 18.1059, shy of the 20-day EMA.
Positive US economic data and Banxico’s hints of policy changes support USD/MXN
US equities are seesawing between gains and losses as tech companies reported earnings that exceeded estimates. However, bank crisis jitters in the US keep sentiment fragile. US economic data, namely Durable Good Orders for March, jumped by 3.2% MoM, exceeding estimates of 0.7%. Excluding transports, figures advance 0.3% MoM, above forecasts of -0.2%.
Even though risk appetite improved, as shown by the global equity markets, flows toward safety bolstered the USD/MXN. In addition, recent comments from the Bank of Mexico (Banxico’s) Governor Victoria Rodriguez Ceja suggest that Banxico could pause the tightening cycle. She said, “We will be evaluating in the next decision, on May 18, these factors and will be discussing whether it’s the moment to stop the increase in rates. We still have to have the discussion with the members of the board.”
Lately, inflation in Mexico for mid-April was reported at 6.24% YoY, below 6.52% in March, while Core dropped from 8.03% YoY in mid-March to 7.75%. The market is pricing that Banxico will hold rates unchanged for about six months before cutting 175 bps in the subsequent semester.
Given that central banks could diverge in the near term, with the Federal Reserve hiking rates and Banxico’s pausing, further upside in the USD/MXN is expected.
USD/MXN Technical Analysis
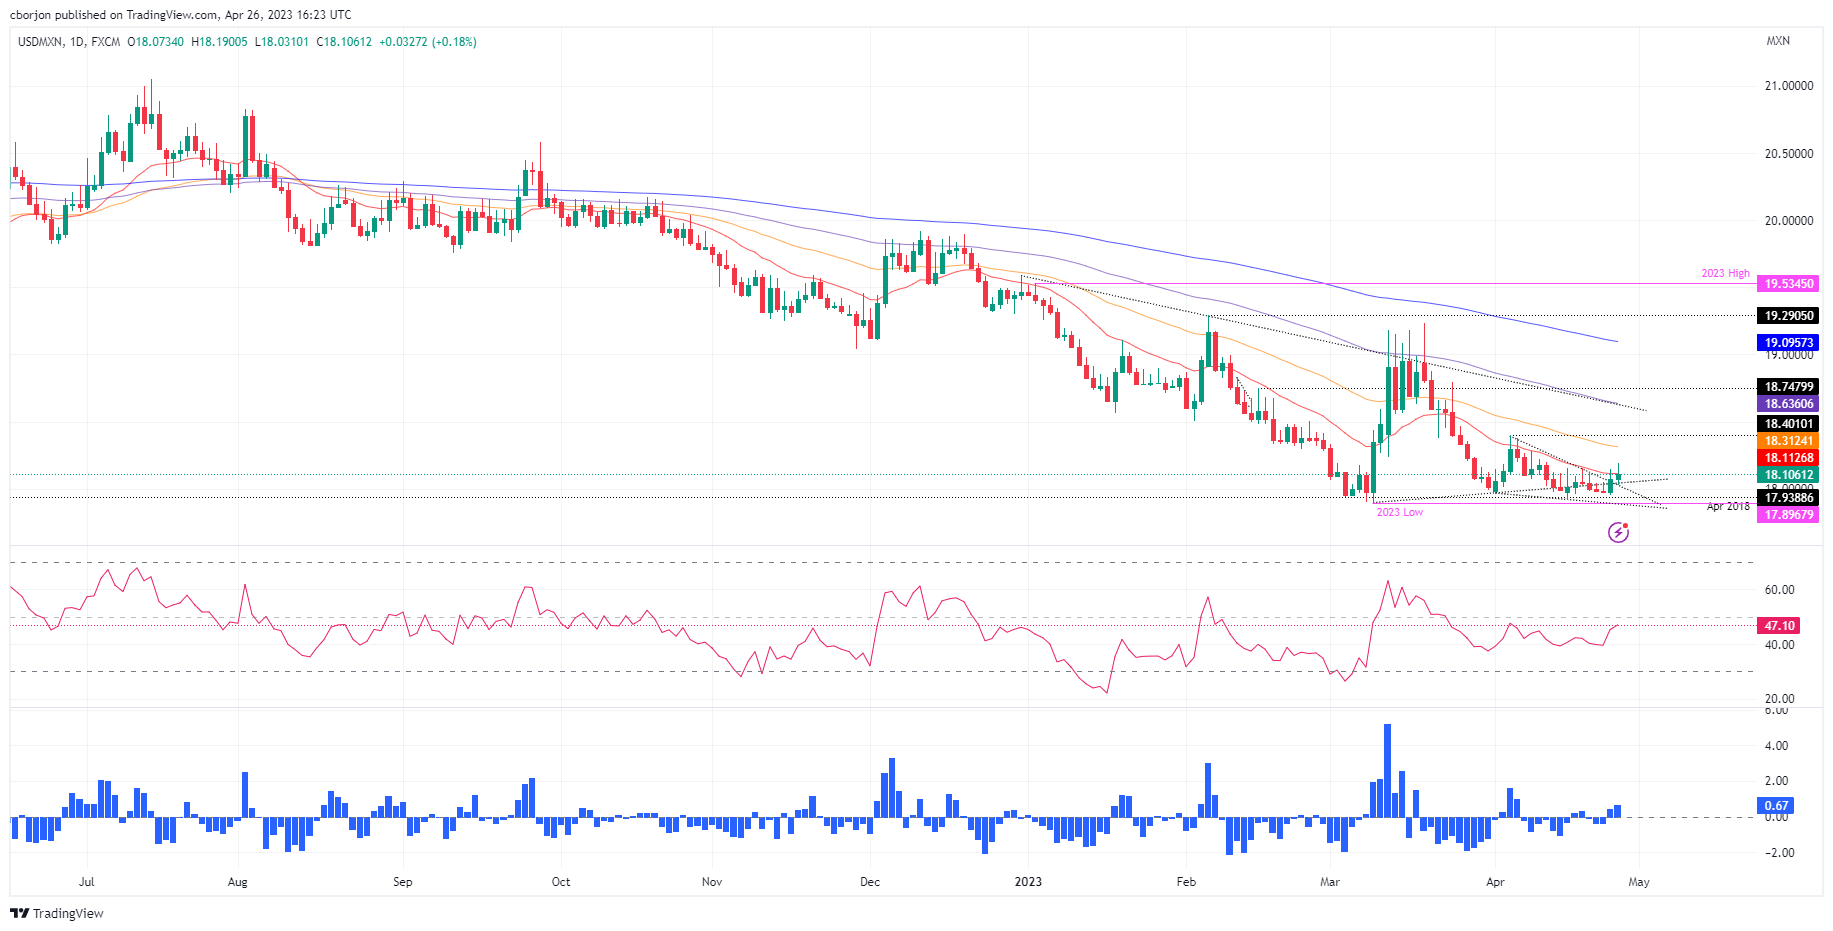
USD/MXN remains downward biased. However, buyers had remained resilient at around the 17.9000-18.0000 area but had failed to decisively break above the 20-day EMA at 18.1122, which would pave the way for further gains. If that scenario continues, the USD/MXN’s next resistance would be the 50-day EMA at 18.3132, ahead of challenging the April 5 cycle high at 18.4010. Conversely, expect further losses if USD/MXN dives below 18.0000.
-
17:01
Russia Industrial Output above expectations (-1.6%) in March: Actual (1.2%)
-
15:30
Breaking: EUR/USD hits a new 13-month high, approaches 1.1100
- EUR/USD rallied to a fresh multi-month high, nearby 1.1100.
- Fears around another round of a banking crisis in the US weighed on the odds for a Fed 25 bps rate hike.
The EUR/USD soars sharply above the past yearly high of 1.1076 and hits a 13-month high at around 1.1095. Concerns about the health of regional banks in the United States (US) triggered flows outside the US Dollar (USD), as shown by the US Dollar Index (DXY), collapsing 0.75%. At the time of writing, the EUR/USD is trading at 1.1067.
US Treasury bond yields, and the risks of a banking crisis in the US, the drivers of EUR/USD’s jump
As the North American session began, the EUR/USD achieved a daily high shy of the 1.1100 figure, as First Republic Bank, which took over Silicon Valley Bank (SVB), witnessed its shares plunge 49% on Tuesday, as deposits shrank. That sparked fears of a possible contagion and a potential pause on the US Federal Reserve (Fed) tightening cycle. Therefore, the greenback fell.
US Treasury bond yield dropping is one reason for the EUR/USD’s rise. Additionally, expectations for a US Federal Reserve 25 bps rate hike diminished to 75.3%, compared to 1 week 83.3%.
EUR/USD Market Reaction
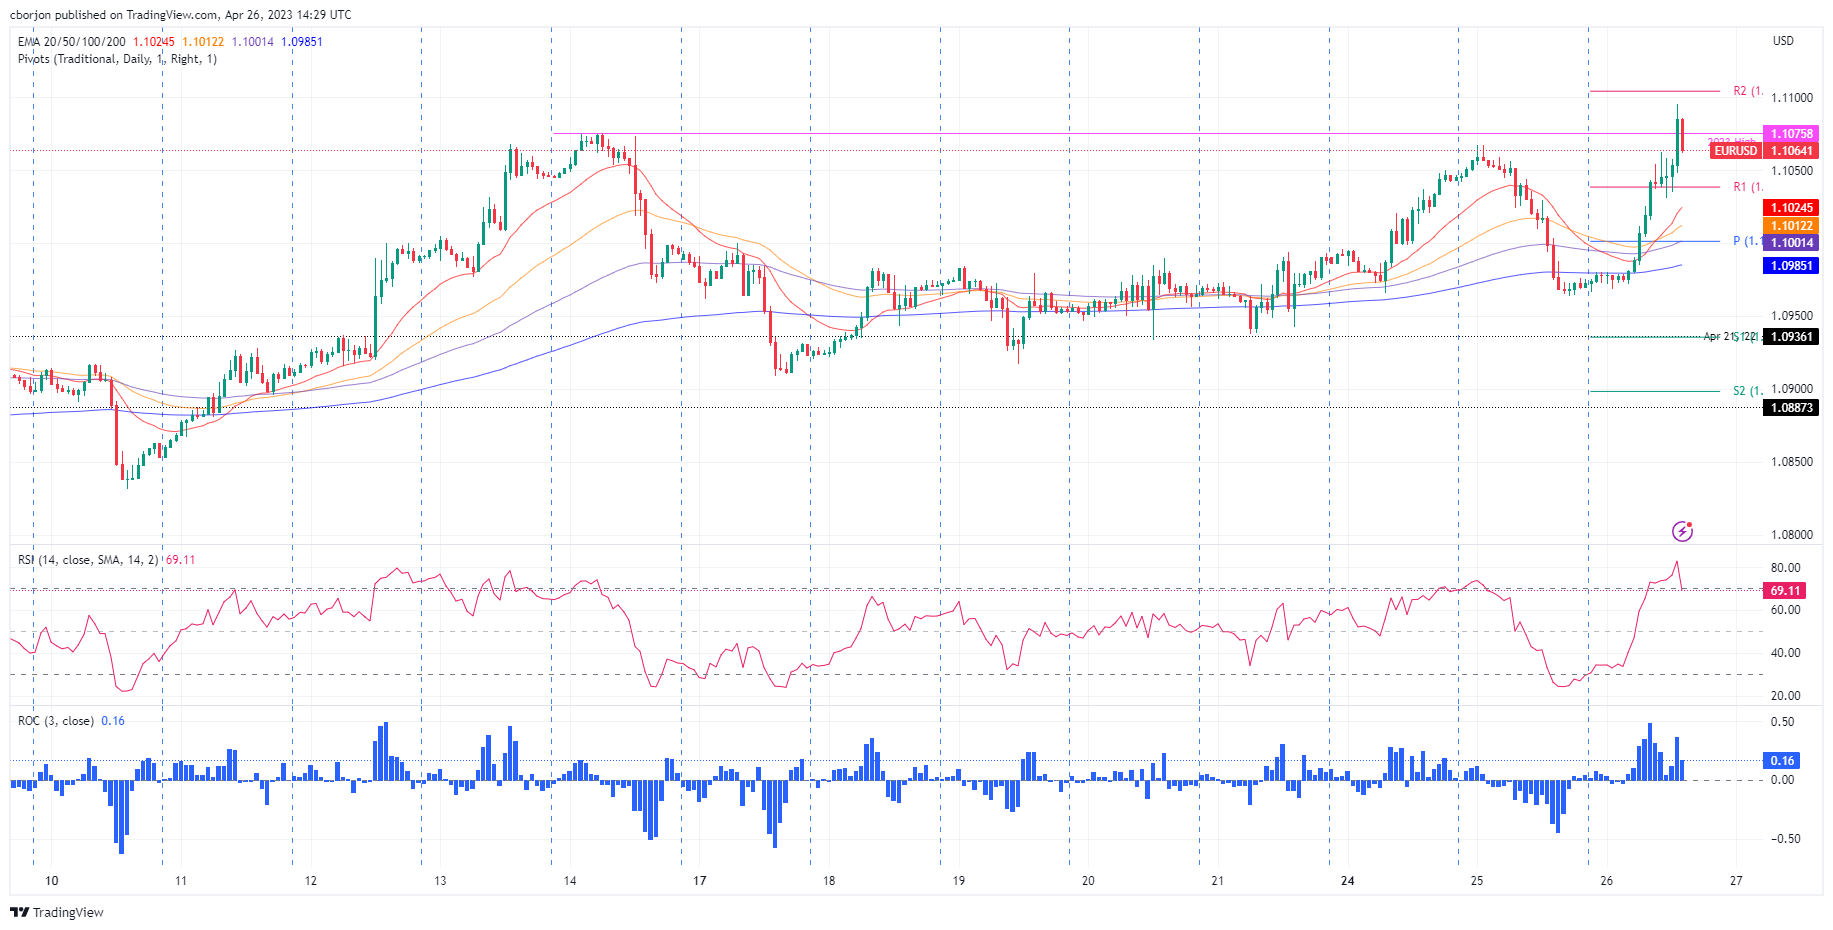
The EUR/USD jumped from around the R1 daily pivot at 1.1040 and accelerated its uptrend towards the 1.1095 multi-month high, some pips of reaching the R1 daily pivot. Though it has retraced some 30 pips from the daily high, buyers are still in charge of the uptrend, and the 1.1100 figure is still in sight.
EUR/USD Technical Levels
-
15:30
United States EIA Crude Oil Stocks Change registered at -5.054M, below expectations (-1.486M) in April 21
-
15:26
US Durable Goods Orders: Not as good as the headline suggests – Wells Fargo
Data released on Wednesday in the US showed that Durable Goods Orders rose 3.2% in March surpassing expectations. Analysts at Wells Fargo point out the increase was due almost entirely to a surge in aircraft orders. They argue that private-sector core capital goods orders is what matters and are showing a continued reversal in demand.
Key quotes:
“Look through the headline durable goods data that suggest orders leaped 3.2% in March. The gain last month was due almost entirely to a pop in aircraft orders specifically after weakness in the first two months of the year. It's not unusual to get wide swings in aircraft orders month-to-month.”
“The trend in private-sector core orders has slowed and suggests the goods sector of the economy still appears to be going through correction as new demand slows amid increased economic uncertainty. Core durable goods orders (excluding defense and aircraft), slid 0.4% in March, marking the fifth decline in seven months.”
-
15:16
Gold Price Forecast: XAU/USD jumps to six-day highs near $2,010 and retreats
- A volatile session for Gold price that continues to move sideways.
- US Dollar weakens during the American session despite upbeat US data.
- US Treasury yields print fresh weekly lows ahead of next week’s FOMC meeting.
Gold price jumped at the beginning of the American session, rising from $1,995 to $2,009, reaching the highest level in six days and then pulled back to the $2,000 area. A weaker US Dollar and lower Treasury yields boosted XAU/USD.
Data from the US came in above expectation with Durable Goods Orders rising 3.2% in March, above the 0.8% of market consensus. Despite the upbeat numbers, the US Dollar weakened particularly against EUR, GBP and JPY.
The US 2-year Treasury yield is at 3.88%, the lowest level in three weeks while the 10-year stands at 3.90%. The US Dollar Index trades at 101.99 (weekly low), down 0.73% for the day.
The rally in XAU/USD is seen as vulnerable amid the lack of clear drivers. The chart is bullish but the price is unable to confirm a firm break of the current range. Volatility is set to remain elevated considering the incoming US data and next week’s FOMC meeting. On Thursday, the US will report the first estimate of Q1 GDP, including consumer inflation figures.
A consolidation above $2,005 would suggest more gains ahead, with the next strong resistance around $2,030. On the flip side, if the current retreat extends, support awaits at $1,990. The crucial level is $1,970.
-638181152725276974.png)
-
15:01
USD/JPY drops to 133.00 neighbourhood, over one-week low amid heavy USD selling
- USD/JPY drops to a nearly two-week low amid the heavily offered tone surrounding the USD.
- Speculations for an imminent Fed rate cut later this year continues to drag the USD lower.
- The BoJ’s dovish stance, a positive risk tone could undermine the JPY and lend some support.
The USD/JPY pair fades a modest intraday uptick to the 134.00 neighbourhood and drops to a one-and-half-week low during the early North American session. The pair is currently placed around the 133.15-133.10 region, down over 0.40% for the day, and is pressured by the heavily offered tone surrounding the US Dollar (USD).
In fact, the USD Index, which tracks the Greenback against a basket of currencies, reverses a major part of the overnight strong gains and is seen weighing on the USD/JPY pair lower. Fresh concerns about the regional banking sector crisis in the US, along with fears of an imminent recession and worries about the US debt ceiling, have been fueling speculations that the Federal Reserve (Fed) will cut interest rates later this year. This, in turn, continues to drag the US Treasury bond yields lower and exerts heavy downward pressure on the Greenback.
That said, the Bank of Japan (BoJ) Kazuo Ueda's dovish remarks earlier this week, along with a modest recovery in the US equity futures, could undermine the safe-haven Japanese Yen (JPY) and lend support to the USD/JPY pair. It is worth recalling that the new BoJ Governor said on Monday that the central bank must maintain monetary easing as trend inflation is still below 2% and added that inflation forecasts must be quite strong and close to 2% in the coming year to consider tweaking yield curve control. This, in turn, warrants caution for bearish traders.
Hence, any subsequent downfall is more likely to find decent support near the 133.00-132.90 region, representing a technically significant 100-day Simple Moving Average (SMA) support. The market focus now shifts to the release of the US Q1 GDP report on Thursday and the US Core PCE Price Index - the Fed's preferred inflation gauge on Friday. This, along with the highly-anticipated BoJ monetary policy meeting, should provide some meaningful impetus and help investors to determine the near-term trajectory for the USD/JPY pair.
Technical levels to watch
-
14:56
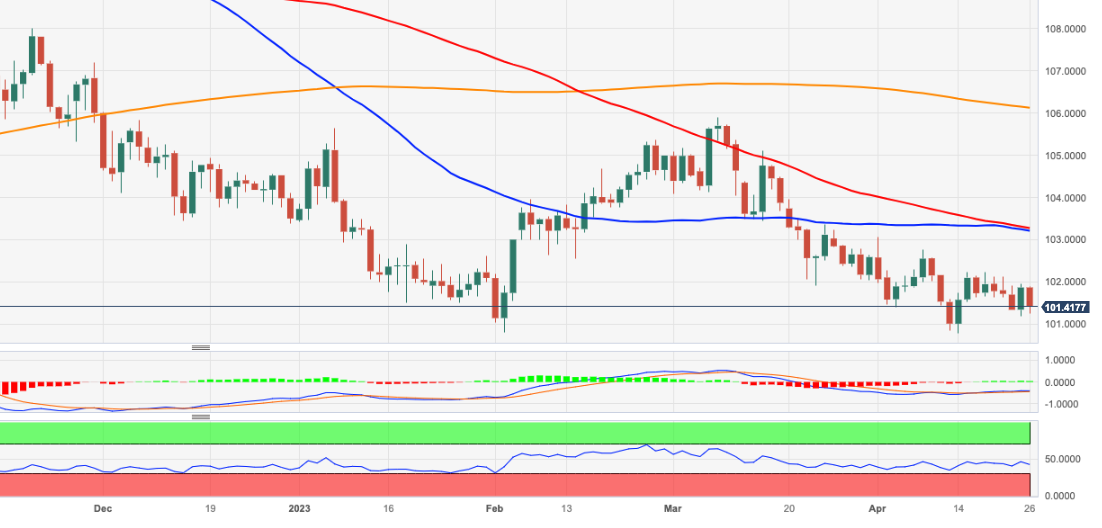
USD Index loses the grip and challenges 101.00
- The index accelerates losses and puts 101.00 to the test.
- US yields extend the leg lower across the curve on Wednesday.
- US Durable Goods Orders came in above expectations in March.
The USD Index (DXY), which tracks the Greenback vs. a basket of its main competitors, gathers further selling pressure and challenges the key support at the 101.00 region on Wednesday.
USD Index on the defensive on rising risk-on trade
The index drops to multi-day lows and revisits the 101.00 neighbourhood on the back of the acute bounce in the risk-associated assets, eroding at the same time the strong advance seen in the previous session.
No news from the macro scenario, where the recent resurgence of banking jitters sponsored the return of the risk aversion on Tuesday and propelled the index to the proximity of the 102.00 region.
In the meantime, investors continue to favour a 25 bps rate hike by the Fed at the May 3 event, although the probability of that outcome shrinks a tad to around 75% (from nearly 90% a day ago).
In the US data space, MBA Mortgage Applications rose 3.7% in the week to April 21, while Durable Goods Orders expanded at a monthly 3.2% in March and advanced figures saw the trade deficit shrinking to $84.6B also in March.
What to look for around USD
The U-turn in the index now opens the door to a deeper retracement, including a potential breakdown of the 101.00 level and a subsequent challenge of 2023 lows near 100.80.
Looking at the broader picture, the index continues to navigate in a consolidative phase against steady expectations of another rate increase in May by the Fed.
In favour of a pivot in the Fed’s hiking cycle following the May event appears the persevering disinflation and nascent weakness in some key fundamentals.
Key events in the US this week: MBA Mortgage Applications, Durable Goods Orders, Advanced Goods Trade Balance (Wednesday) – Flash Q1 GDP Growth Rate, Initial Jobless Claims, Pending Home Sales (Thursday) – PCE/Core PCE, Employment Cost, Personal Income, Personal Spending, Final Michigan Consumer Sentiment (Friday).
Eminent issues on the back boiler: Persistent debate over a soft/hard landing of the US economy. Terminal Interest rate near the peak vs. speculation of rate cuts in 2024. Fed’s pivot. Geopolitical effervescence vs. Russia and China. US-China trade conflict.
USD Index relevant levels
Now, the index is losing 0.79% at 101.04 and the breach of 100.78 (2023 low April 14) would open the door to 100.00 (psychological level) and finally 99.81 (weekly low April 21 2022). On the other hand, the next hurdle emerges at 102.80 (weekly high April 10) followed by 103.05 (monthly high April 3) and then 103.21 (55-day SMA).
-
14:29
NZD/USD bounces off its lowest level since March amid notable USD supply
- NZD/USD remains under some selling pressure for the second straight day.
- The downside seems cushioned amid the emergence of fresh USD selling.
- The upbeat US data fails to impress the USD bulls or provide any impetus.
The NZD/USD pair drifts lower for the second straight day on Wednesday and drops to its lowest level since March 10 during the early North American session. The pair, meanwhile, react little to the upbeat US macro data and bounces to the 0.6135-0.6140 region in the last hour amid the emergence of fresh US Dollar (USD) selling.
In fact, the USD Index, which tracks the Greenback against a basket of currencies, erases a major part of the overnight gains and turns out to be a key factor lending some support to the NZD/USD pair. A slight improvement in the global risk sentiment - as depicted by a goodish recovery in the US equity markets - is seen as a key factor weighing on the safe-haven buck. The USD bulls fail to gain any respite following the better-than-expected release of US Durable Goods Orders and a modest uptick in the US Treasury bond yields.
fresh concerns about the regional banking sector crisis in the US, along with the possibility of an imminent recession and worries about the US debt ceiling, have been fueling speculations that the Federal Reserve (Fed) will cut interest rates later this year. The Fed, however, is still expected to hike interest rates by 25 bps in May, which, along with fears about economic headwinds stemming from rising borrowing costs could help limit the downside for the USD. This, in turn, is seen as a key factor exerting pressure on the NZD/USD pair.
Bearish traders, meanwhile, might wait for a sustained break through the 0.6100 mark and some follow-through selling below the YTD low, around the 0.6085 region touched in March before placing fresh bets. The focus now shifts to the release of the US Q1 GDP report on Thursday and the US Core PCE Price Index - the Fed's preferred inflation gauge on Friday. This will play a key role in influencing the near-term USD price dynamics and help investors to determine the next leg of a directional move for the NZD/USD pair.
Technical levels to watch
-
14:11
RBA: Data suggests it will not raise the key rate next week – Commerzbank
Inflation data from Australia showed it continues to slow down. Next week, the Reserve Bank of Australia (RBA) will have its monetary policy meeting. Analysts at Commerzbank point out that inflation data suggest the central bank will not raise rates.
Key quotes:
“The Reserve Bank of Australia (RBA) can't really breathe a sigh of relief yet, but it can breathe a little. Inflation fell quite significantly in the first quarter, from 7.8% to 7.0%. The two measures of core inflation also fell noticeably to 6.6% and 5.8%. This is likely to confirm the RBA's expectation that inflation will gradually decline and that the interest rate pause earlier this month was justified.”
“The data suggest that the RBA will not raise the key rate next week either, but leave it at 3.60%. However, with (core) inflation still well above the 2-3% inflation target, it is likely to maintain the restrictive undertone in its statement and assure that it is ready to do more should it be necessary.”
“The market already expects that the interest rate cycle in Australia is over and that no more rate hikes will follow, but that the first rate cuts are on the agenda in the fall.”
-
13:52
GBP/USD sticks to gains near daily peak, comfortably above mid-1.2400s post-US data
- GBP/USD regains positive traction on Wednesday amid the emergence of fresh USD selling.
- A slight improvement in the global risk sentiment is seen weighing on the safe-haven buck.
- The upbeat US Durable Goods Orders fail to impress the USD bulls or provide any impetus.
The GBP/USD pair sticks to its strong intraday gains, around the 1.2465-1.2470 area through the early North American session and moves little in reaction to the US macro data.
The US Census Bureau reported this Wednesday that Durable Goods Orders in the US smashed market expectations by a big margin and increased by 3.2% in March. Excluding transportation, new orders increased 0.3% during the reported month as against consensus estimates pointing to a 0.2% fall and the 0.3% decline registered in March. The upbeat data, however, fails to impress the US Dollar (USD) bulls or provide any meaningful impetus to the GBP/USD pair.
Meanwhile, a slight improvement in the global risk sentiment - as depicted by a modest uptick in the US equity futures - is seen weighing on the safe-haven Greenback amid speculations for an imminent rate cut by the Federal Reserve (Fed) later this year. Apart from this, rising bets for another 25 bps interest rate hike by the Bank of England (BoE) in May continue to underpin the British Pound and remains supportive of the strong bid tone surrounding the GBP/USD pair.
That said, a modest uptick in the US Treasury bond yields might hold back bearish traders from placing aggressive bets around the USD and keep a lid on any further gains for the major, at least for the time being. Investors also seem reluctant and could move to the sidelines ahead of the US Q1 GDP report on Thursday. This will be followed by the release of the US Core PCE Price Index - the Fed preferred inflation gauge on Friday.
The data will play a key role in influencing the near-term USD price dynamics and should provide some meaningful impetus to the GBP/USD pair. Nevertheless, the intraday positive move assists spot prices to reverse a major part of the previous day's retracement slide from over a one-week high - levels just above the 1.2500 psychological mark - and is exclusively sponsored by the prevalent USD selling bias.
Technical levels to watch
-
13:35
US: Durable Goods Orders rise by 3.2% in March vs. 0.8% expected
- Durable Goods Orders in the US rose at a much stronger pace than expected in March.
- US Dollar Index stays deep in negative territory below 101.50.
Durable Goods Orders in the US increased by 3.2%, or $8.6 billion, in March to $276.4 billion, the US Census Bureau announced on Wednesday. This reading followed February's contraction of 1.2% (revised from -1%) and surpassed the market expectation for an increase of 0.8% by a wide margin.
"Excluding transportation, new orders increased 0.3%," the publication further read. "Excluding defense, new orders increased 3.5%. Transportation equipment, also up following two consecutive monthly decreases, led the increase, $8.1 billion or 9.1% to $97.4 billion."
Market reaction
The US Dollar stays under pressure despite the upbeat data and the US Dollar Index was last seen losing 0.5% on the day at 101.35.
-
13:31
United States Goods Trade Balance came in at $-84.6B, above expectations ($-89B) in March
-
13:31
United States Wholesale Inventories came in at 0.1%, below expectations (0.2%) in March
-
13:30
United States Durable Goods Orders ex Transportation came in at 0.3%, above expectations (-0.2%) in March
-
13:30
United States Durable Goods Orders above forecasts (0.8%) in March: Actual (3.2%)
-
13:30
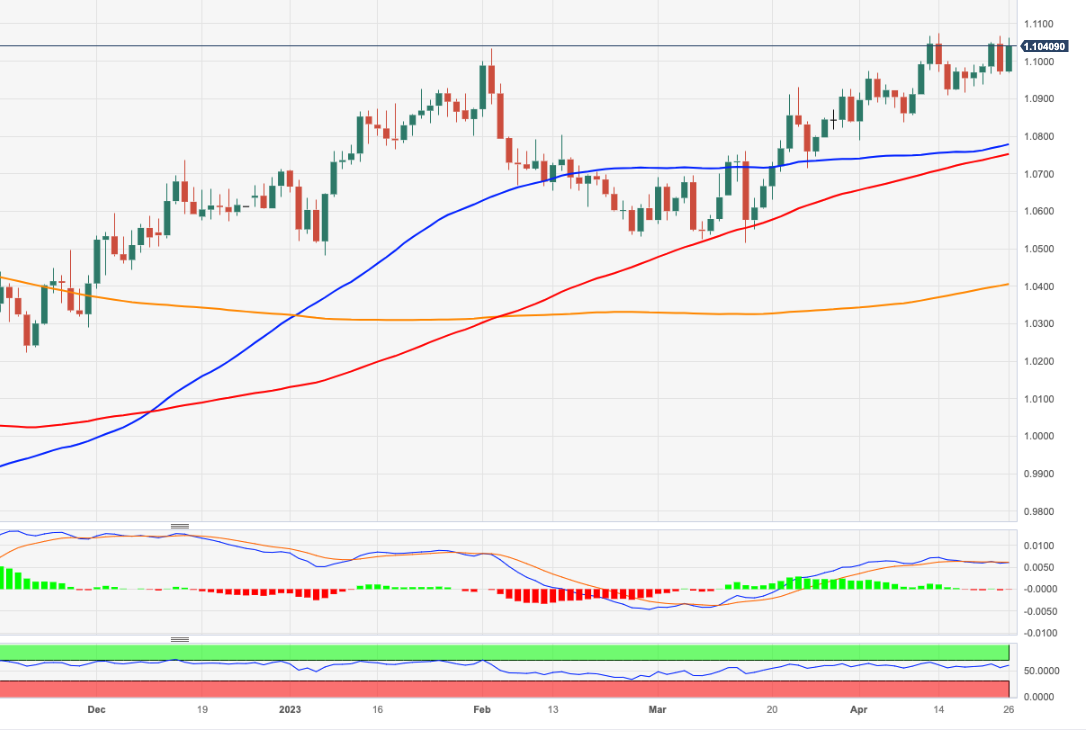
EUR/USD Price Analysis: Immediately to the upside comes the YTD high
- EUR/USD regains upside traction and advances past 1.1000.
- Bulls continue to target the 2023 peak at 1.1075.
EUR/USD leaves behind Tuesday’s pronounced decline and reclaims the area beyond 1.1000 the figure on Wednesday.
The pair looks poised to extend the recovery further in the near term. That said, the immediate hurdle is expected at the 2023 high at 1.1075 (April 14) seconded by the round level at 1.1100.
Looking at the longer run, the constructive view remains unchanged while above the 200-day SMA, today at 1.0404.
EUR/USD daily chart
-
13:30
United States Durable Goods Orders ex Defense above forecasts (0%) in March: Actual (3.5%)
-
13:00
Brazil Mid-month Inflation registered at 0.57% above expectations (0.53%) in April
-
12:21
Dollar soft as risk sentiment improves – BBH
Strong earnings reports from the big tech companies last night have helped improve market sentiment and weigh on the US Dollar, write Economists at BBH. DXY is trading lower near 101.269 and has given back nearly all of yesterday’s gains.
Key quotes:
“WIRP suggests over 80% odds of 25 bp hike at the May 2-3 meeting, down from 90% at the start of this week and back to the 80% seen at the start of last week and 70% at the start of the week before that. We believe a hike next week is a done deal. There are no longer any odds of another 25 bp hike in June, down from about 15% at the start of this week. Between the May 2-3 and June 13-14 meetings, the Fed will have digested two more job reports, two CPI/PPI reports, and one retail sales report. At this point, a pause in June might just be the most likely outcome but it really will depend on how all that data come in. After all that, two cuts are now priced in by year-end vs. one at the start of this week and back to two seen at the start of last week. In that regard, Powell has said that Fed officials “just don’t see” any rate cuts this year. We concur.”
-
12:17
USD Index Price Analysis: No changes to the consolidative theme
- DXY comes under pressure amidst choppy price action this week.
- The loss of 101.00 could open the door to a probable test of the YTD low.
DXY fades part of Tuesday’s acute rebound and return to the 101.40/50 region on Wednesday.
The recent choppy performance in the index seems to have now refocused back on the downside. Against that, DXY could cling to this consolidative theme ahead of a probable drop to the 101.00 zone. The loss of the latter could expose a move to the so far 2023 lows near 100.80 (April 14).
Looking at the broader picture, while below the 200-day SMA, today at 106.12, the outlook for the index is expected to remain negative.
DXY daily chart
-
12:17
When are the US Durable Goods Orders and how could they affect EUR/USD?
US Durable Goods Orders Overview
The US Census Bureau will publish the monthly Durable Goods Orders data for March later during the early North American session this Wednesday, at 12:30 GMT. The report is expected to show that headline orders rose by 0.8% during the reported month as compared to the 1% fall reported in February. Orders excluding transportation items, which tend to have a broader impact, are anticipated to register a modest 0.2% decline in March.
How could it affect EUR/USD?
Ahead of the key macro data, the emergence of fresh selling around the US Dollar (USD) lifts the EUR/USD pair back above the 1.1050 level, closer to a one-year high touched earlier this month. A weaker US Durable Goods Orders data will add to worries about a deeper economic downturn and reaffirm market expectations for an imminent interest rate cut by the Federal Reserve (Fed) later this year. This, in turn, could lead to a further decline in the US Treasury bond yields and weigh heavily on the buck, pacing the way for a further intraday appreciating move for the major.
In contrast, the market reaction to stronger US macro data is likely to be short-lived and do little to provide any respite to the USD bulls. Traders might prefer to wait on the sidelines ahead of the release of the Advance Q1 GDP report on Thursday and the US Core PCE Price Index - the Fed's preferred inflation gauge on Friday. This, in turn, suggests that the path of least resistance for the EUR/USD pair is to the downside and any intraday pullback might still be seen as a buying opportunity.
Eren Sengezer, Editor at FXStreet, offers a brief technical outlook for the EUR/USD pair and writes: “The 100-period Simple Moving Average on the four-hour chart at 1.0960 stays intact following Tuesday's pullback, highlighting buyers' willingness to continue to defend this level. The Fibonacci 23.6% retracement level of the latest uptrend is also located slightly below that level at 1.0950 to reinforce that support. Additionally, the Relative Strength Index (RSI) indicator recovered back above 50, confirming the bullish tilt in the short-term outlook.”
Eren also outlines important technical levels to trade the EUR/USD pair: “On the upside, 1.1050 (static level) could be seen as the next bullish target before 1.1075 (end-point of the latest uptrend) and 1.1100 (psychological level).”
“1.1000 (psychological level, static level) aligns as interim support before 1.0960/50. A four-hour close below the latter could cause technical sellers to come into play and drag the pair lower toward 1.0900,” Eren adds further.
Key Notes
• EUR/USD Forecast: Buyers manage to keep Euro above key support
• EUR/USD regains the smile and the 1.1000 barrier
• EUR/USD looks side-lined for the time being – UOB
About US durable goods orders
The Durable Goods Orders, released by the US Census Bureau, measures the cost of orders received by manufacturers for durable goods, which means goods planned to last for three years or more, such as motor vehicles and appliances. As those durable products often involve large investments they are sensitive to the US economic situation. The final figure shows the state of US production activity. Generally speaking, a high reading is bullish for the USD.
-
12:13
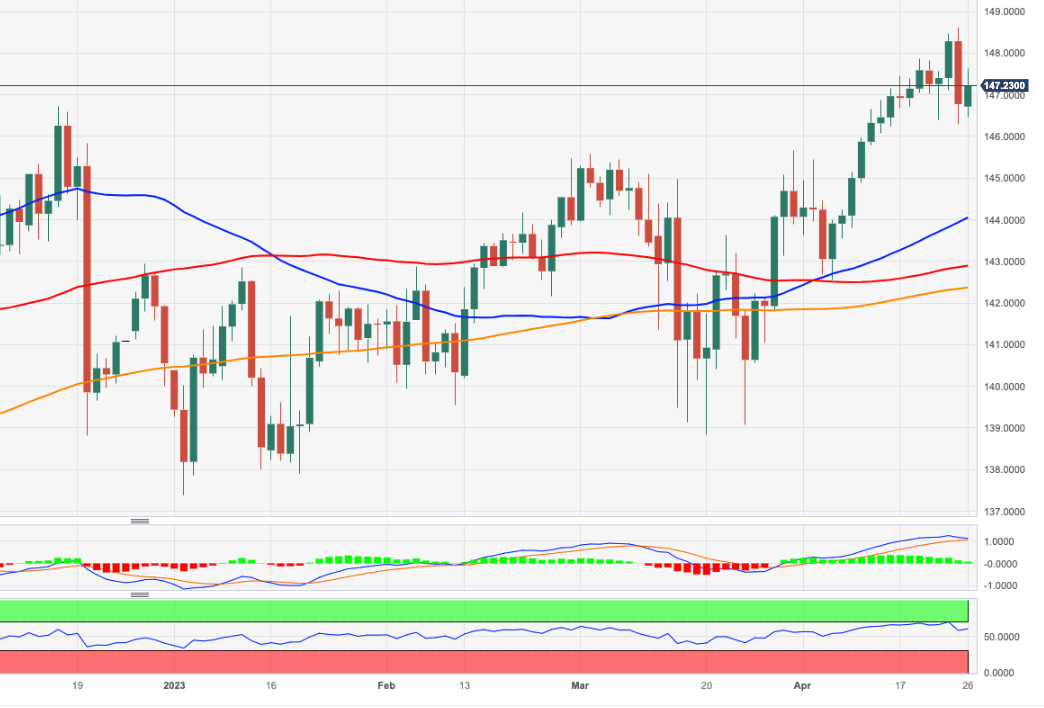
EUR/JPY Price Analysis: Target remains at 148.00 and above
- EUR/JPY regains some balance following Tuesday’s pullback.
- Further recovery should retest the 148.00 barrier in the near term.
EUR/JPY resumes the uptrend and leaves behind part of Tuesday’s pronounced pullback to weekly lows near 146.30.
The underlying strong upside momentum in the cross appears so far unabated. Against that, the surpass of the 148.00 hurdle should put a potential test of the 2023 peak at 148.63 (April 25) back on the radar.
Further north, the cross could embark on further gains and attempt a visit to the key 150.00 mark.
So far, further upside looks favoured while the cross trades above the 200-day SMA, today at 142.34.
EUR/JPY daily chart
-
12:01
South Korea: Technical recession avoided – UOB
UOB Group’s Economist Ho Woei Chen reviews the latest GDP figures in South Korea.
Key Takeaways
“South Korea’s advance 1Q23 GDP growth was in line with expectations at 0.8% y/y, 0.3% q/q SA. The sequential rebound in GDP meant that South Korea’s economy avoided a technical recession.”
“The q/q expansion was due to stronger private consumption as well as goods exports that were led by motor vehicle shipments even as electronics had remained in a downcycle. This mitigated declines in facilities investment and services exports in 1Q23.”
“We maintain our cautious outlook for South Korea’s growth in 2023 at 1.3% (2022: 2.6%) with lackluster forecasts of 0.8% y/y in 2Q23 and 1.0% y/y in 3Q23 before a recovery to 2.5% y/y in 4Q23.”
“We continue to expect the BOK to remain on hold at 3.50% for the rest of 2023.”
-
12:00
United States MBA Mortgage Applications: 3.7% (April 21) vs -8.8%
-
11:50
USD/CAD oscillates in a range around 1.3620 area, just below a nearly one-month high
- USD/CAD consolidates its recent strong gains to a nearly one-month high touched on Tuesday.
- A modest recovery in Oil prices underpins the Loonie and caps the pair amid fresh USD selling.
- Rebounding US bond yields lend some support to the Greenback and help limit the downside.
The USD/CAD pair enters a bullish consolidation phase on Wednesday and oscillates in a narrow trading band through the first half of the European session. The pair is currently placed in neutral territory, around the 1.3620 region, just below a nearly one-month high touched the previous day.
Crude Oil prices gain some positive traction and reverses a part of Tuesday's slide to a fresh monthly low amid reports of falling US fuel inventories, which pointed to robust demand in the world's top consumer. This, in turn, underpins the commodity-linked Loonie and acts as a headwind for the USD/CAD pair amid the emergence of fresh US Dollar (USD) selling.
The intraday USD downtick could be attributed to the recent slump in the US Treasury bond yields amid fresh concerns about the regional banking sector. In fact, the yield on the benchmark 10-year US government bond registered its largest decline since March after the First Republic Bank reported a more than $100 billion plunge in deposits during the first quarter.
The Conference Board's Consumer Confidence Index unexpectedly dropped to a nine-month low in April and fueled worries about a deeper economic downturn. This, in turn, lifted bets for an imminent rate cut by the Federal Reserve (Fed) later this year, which dragged longer-duration Treasury yields lower across the board and is seen weighing on the Greenback.
Apart from this, signs of stability in the equity markets turn out to be another factor weighing on the safe-haven buck and contributing to capping the upside for the USD/CAD pair, at least for the time being. The Fed, however, is still expected to deliver a 25 bps rate hike in May, which acts as a tailwind for the US bond yields and lends support to the USD.
The aforementioned fundamental backdrop favours bulls and suggests that the path of least resistance for spot prices is to the upside. Traders, however, seem reluctant and move to the sidelines ahead of this week's key US macro releases, including the Advance Q1 GDP on Thursday and the Core PCE Price Index - the Fed's preferred inflation gauge on Friday.
In the meantime, traders on Thursday will take cues from the release of the US Durable Goods Orders data, due later during the early North American session. The data might influence the USD and provide some impetus to the USD/CAD pair. Apart from this, Oil price dynamics might further contribute to producing short-term opportunities around the major.
Technical levels to watch
-
11:06
Gold Price Forecast: XAU/USD lacks firm intraday direction, stuck in a range around $2,000
- Gold price oscillates in a narrow band and is influenced by a combination of diverging factors.
- The emergence of fresh US Dollar selling is seen as a key factor lending support to the XAU/USD.
- Bets for another 25 bps rate hike by the Federal Reserve in May act as a headwind for the metal.
Gold price struggles to capitalize on its gains recorded over the past two sessions and seesaws between tepid gains/minor losses on Wednesday. The XAU/USD holds steady around the $2,000 psychological mark through the first half of the European session and is influenced by a combination of diverging forces.
Fresh US Dollar selling lends support to Gold price
The US Dollar (USD) comes under renewed selling pressure and erodes a major part of the overnight gains amid the uncertainty over the Federal Reserve's (Fed) rate-hike path. This, in turn, is seen lending support to the US Dollar-denominated Gold prices. Fresh concerns about the regional banking sector crisis, the possibility of an imminent recession and worries about the debt ceiling in the United States (US) lift bets for an imminent rate cut by the Fed later this year. This led to the overnight slum in the US Treasury bond yields and continues to act as a headwind for the Greenback.
Federal Reserve rate hike bets cap XAU/USD
It is worth recalling that the yield on the benchmark 10-year Treasury yields registered its largest decline since March. That said, the US central bank is still expected to deliver a 25 bps rate hike at the next Federal Open Market Committee (FOMC) monetary policy meeting in May. This, in turn, allows the US bond yields to stage a modest recovery on Wednesday and keeps a lid on any meaningful upside for the non-yielding Gold price. Apart from this, signs of stability in the equity markets further contribute to caping gains for the safe-haven precious metal, at least for the time being.
Traders now eye macro data from United States for fresh impetus
The aforementioned fundamental backdrop makes it prudent to wait for strong follow-through buying before confirming that the Gold price has formed a near-term bottom around the $1,970 area and positioning for any further gains. Market participants now look forward to the US economic docket, featuring the release of the Durable Goods Orders data later during the early North American session. This, along with the US bond yields, might influence the USD price dynamics. Apart from this, the broader risk sentiment might provide some impetus to the Gold price.
Focus remains on US Q1 GDP and US PCE Price Index
The focus, however, remains glued to the release of the first-quarter US Gross domestic product (GDP) report on Thursday. This will be followed by the US Core Personal Consumption Expenditure (PCE) Price Index - the Fed's preferred inflation gauge - on Friday, which will help determine the near-term trajectory for the Greenback and the Gold price. In the meantime, the XAU/USD is more likely to extend its sideways consolidative price moves and remain confined in a familiar trading band held over the past one-and-half-weeks or so.
Gold price technical outlook
From a technical perspective, any subsequent move up is likely to confront stiff resistance near the $2,010 area. A sustained move beyond might trigger a fresh bout of a short-covering and lift Gold price beyond the $2,020 hurdle, towards the $2,040 horizontal zone en route to the YTD peak, around the $2,047-$2,049 region.
On the flip side, the $1,980 level, followed by the $1,969 region might continue to act as immediate support levels. Some follow-through selling will be seen as a fresh trigger for bearish traders and drag Gold price towards the next relevant support near the $1,956-$1,955 area. The XAU/USD could eventually drop to the monthly low around the $1,950 region.
Key levels to watch
-
10:32
South Africa Producer Price Index (MoM) registered at 1% above expectations (0%) in March
-
10:30
South Africa Producer Price Index (MoM) meets forecasts (0%) in March
-
10:30
South Africa Producer Price Index (YoY) registered at 10.6% above expectations (10.4%) in March
-
10:27
USD/CNH: Upside faces a solid resistance at 6.9650 – UOB
Extra gains in USD/CNH appear on the cards and are expected to meet a tough barrier around 6.9650, note UOB Group Lee Sue Ann and Markets Strategist Quek Ser Leang.
Key Quotes
24-hour view: “The strong jump in USD came as a surprise (we were expecting it to trade sideways). The rapid advance appears to be overdone but with no sign of easing just yet, USD could rise above the NY high near 6.9510. However, the major resistance at 6.9650 is likely out of reach today. Support is at 6.9300, followed by 6.9230.”
Next 1-3 weeks: “We have held the same view since last Thursday (20 Apr, spot at 6.8920) wherein ‘upward momentum is beginning to improve but USD has to break and stay above 6.9350 before a sustained rise is likely’. We indicated that, ‘The chance of USD breaking clearly above 6.9350 is not high for now but it will remain intact as long as the ‘strong support’ level at 6.8600 is not taken out’. However, we did not quite anticipate the strong rally yesterday that blew past 6.9350 (USD soared to a high of 6.9509 in NY trade). While upward momentum has improved further, the rally appears to be running ahead of itself and the major resistance at 6.9650 might not come into view so soon. Overall, USD is expected to stay underpinned in the coming days as long as it stays above 6.8950 (‘strong support’ level previously at 6.8600).”
-
10:21
Natural Gas Futures: Recovery could run out of steam
In light of advanced figures from CME Group for natural gas futures markets, open interest shrank for yet another session on Tuesday, now by more than 8K contracts, while volume rose for the second straight session, this time by around 29.7K contracts.
Natural Gas faces the next hurdle at $2.50
Prices of the natural gas appears to have embarked on a marked rebound. Tuesday’s uptick, however, came on the back of diminishing open interest, which is indicative that the continuation of the recovery could face some headwinds in the very near term. The next hurdle of note now emerges at the $2.50 region per MMBtu.
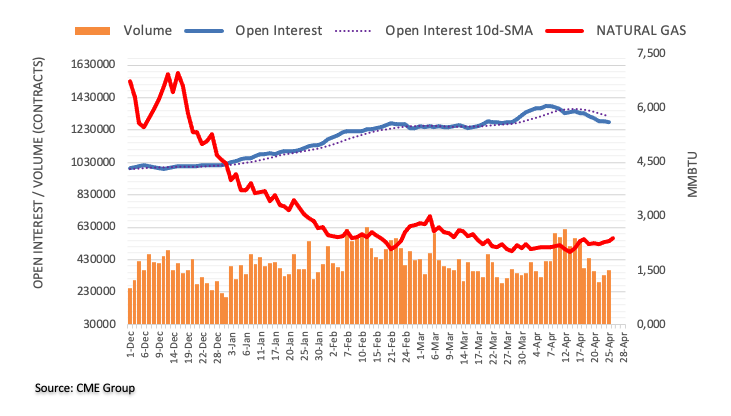
-
10:19
AUD/USD sticks to softer Australian CPI-led losses, flirts with 0.6600 despite weaker USD
- AUD/USD drops to its lowest level since mid-March in reaction to softer domestic CPI print.
- The emergence of fresh USD selling lends some support to the major and helps limit losses.
- Traders now look forward to the US Durable Goods Orders data for short-term opportunities.
The AUD/USD pair adds to the previous day's heavy losses and remains under some selling pressure for the second successive day on Wednesday. The pair maintains its offered tone through the first half of the European session and is currently placed around the 0.6600 mark, or its lowest level since mid-March.
The Australian Dollar (AUD) weakens across the board after the Australian Bureau of Statistics reported that the headline CPI eased from 1.9% to 1.4% during the March quarter, marking the smallest increase since late 2021. Furthermore, the annual CPI decelerated to 7.0% from 7.8% and suggests that inflation might have finally peaked. Adding to this, the softer core CPI eases pressure on the Reserve Bank of Australia for another hike in interest rates and drags the AUD/USD pair lower.
The US Dollar (USD), on the other hand, comes under some renewed selling pressure and erodes a major part of the overnight strong gains, which, in turn, is holding back bearish traders from placing aggressive bets around the AUD/USD pair. Fresh concerns about the regional banking sector crisis, the possibility of an imminent recession and worries about the US debt ceiling lift bets for an imminent rate cut by the Federal Reserve (Fed) later this year, which, in turn, weigh on the Greenback.
Apart from this, a modest bounce in the US equity futures exerts additional downward pressure on the safe-haven buck and contributes to limiting losses for the AUD/USD pair, at least for the time being. Nevertheless, the aforementioned fundamental still seems tilted in favour of bearish traders and supports prospects for additional losses. Hence, a subsequent fall back towards challenging the YTD low, around the 0.6570-0.6565 region, looks like a distinct possibility.
Market participants now look to the US Durable Goods Orders data, due later during the early North American session, for a fresh impetus. The focus, however, remains glued to the US Q1 GDP report on Thursday and the Core PCE Price Index - the Fed's preferred inflation gauge on Friday. The crucial US inflation data will influence the near-term USD price dynamics and help determine the next leg of a directional move for the AUD/USD pair.
Technical levels to watch
-
10:14
USD/JPY: Scope for further consolidation near term – UOB
USD/JPY seems to have now moved into a consolidative phase and is likely to navigate within the 132.85-134.70 range for the time being, comment UOB Group Lee Sue Ann and Markets Strategist Quek Ser Leang.
Key Quotes
24-hour view: “Yesterday, we expected USD to consolidate and trade between 133.75 and 134.60. We did not anticipate the sharp drop to 133.36. Downward momentum is building and USD is likely to weaken further. However, the major support at 132.85 is likely out of reach today. Resistance is at 133.85; a break of 134.10 would suggest the build-up in momentum has faded.”
Next 1-3 weeks: “On Monday (24 Apr, spot at 134.10), we highlighted that ‘upward momentum is beginning to fade and the likelihood of USD advancing to 135.75 is diminishing’. We added, ‘a break of 133.50 would indicate that the USD strength that started early last week has come to an end’. USD breached 133.50 in NY trade as it dropped to a low of 133.36. USD appears to have entered a consolidation phase and for the time being, it is likely to trade in a range of 132.85/134.70.”
-
09:48
Russia’s Novak: Without OPEC+, there are risks to energy security
Russian Deputy Prime Minister Alexander Novak said on Wednesday, “without OPEC and its allies (OPEC+), there are risks to energy security.”
Additional takeaways
An unprecedented embargo against Russian oil, and equipment imports, and the imposition of price caps all resulted in global shifts in energy markets.
The overall balance of oil supply and demand has remained unchanged.
Europe became more reliant on liquefied natural gas imports.
Russia's energy industry has proven its durability, and we have found new logistical routes.
Around 20% of Russian oil initially delivered to Europe is redirected to other markets, such as Asia.
OPEC+ is effective.
At OPEC+, we're not regulating oil prices.
It's sometimes difficult to reach an agreement among the 24 countries of OPEC+.
Market reaction
WTI is holding higher ground on the above comments, trading at $77.70. The US oil is adding 0.80% on the day, as of writing.
-
09:40
Japan’s ex-Current Diplomat: Bank of Japan has no reason to move this week
Japan's former top currency diplomat, Hiroshi Watanabe, said on Wednesday that the “Bank of Japan (BoJ) has no reason to move this week.”
Additional quotes
“Markets still feeling the jitters from recent banking woes.”
“BoJ might find it hard to raise rates this year as economic conditions are still weak.”
“There will also be a tough backdrop to raise rates next year.”
Market reaction
USD/JPY remains weighed down by broad US Dollar weakness, currently trading at 133.53, down 0.12% on the day.
-
09:16
GBP/USD climbs back above mid-1.2400s, refreshes daily high amid broad-based USD weakness
- GBP/USD catches fresh bids on Wednesday and reverses a major part of the overnight downfall.
- The emergence of fresh selling around the USD is seen as a key factor pushing the pair higher.
- Traders now look forward to the US Durable Goods Orders data for short-term opportunities.
The GBP/USD pair regains positive traction on Wednesday and reverses a major part of the previous day's retracement slide from over a one-week high - levels just above the 1.2500 psychological mark. Spot prices build on the steady intraday ascent through the early part of the European session and currently trade around the 1.2455-1.2460 region, up over 0.40% for the day.
The US Dollar (USD) struggles to capitalize on the overnight strong move up and comes under renewed selling pressure, which, in turn, is seen as a key factor pushing the GBP/USD pair. Fresh concerns about the regional banking sector crisis, the possibility of an imminent recession and worries about the US debt ceiling lift bets for an imminent rate cut by the Federal Reserve (Fed) later this year. This, in turn, led to the overnight steep decline in longer-duration US Treasury bond yields and continues to weigh on the Greenback.
Apart from this, a modest recovery in the US equity exerts additional downward pressure on the safe-haven buck and remains supportive of the GBP/USD pair's intraday positive move. The British Pound further seems to draw support from expectations for another 25 bps interest rate hike by the Bank of England (BoE) in May. The bets were lifted by last week's release of stronger UK wage growth data and consumer inflation figures, which, in turn, favours bulls and supports prospects for a further intraday appreciating move for the major.
In the absence of any relevant market-moving macro data from the UK, traders now look to the US economic docket, featuring the release of Durable Goods Orders data later during the early North American session. The focus, however, will remain glued to the Advance US Q1 GDP report on Thursday and the US Core PCE Price Index - the Fed's preferred inflation gauge on Friday. This will play a key role in influencing the near-term USD price dynamics and help determine the next leg of a directional move for the GBP/USD pair.
Technical levels to watch
-
09:03
Euro back above 1.1000 as market sentiment recovers
- Euro vs US Dollar trades back in the green after a steep sell-off on Tuesday.
- US recession woes and banking fears were given as the major catalysts for the sell-off.
- The trend remains bullish according to technical analysis, however, with the 1.1075 YTD highs as the next key level on the radar.
The Euro (EUR) trades back above 1.1000 against the US Dollar (USD) during the early European session, on Wednesday. The pair has stabilized after the market turbulence witnessed on Tuesday in which the pair fell over 100 pips on a sudden surge in USD strength. Whilst the general consensus is the move was driven by safe-haven flows due to US recession and banking fears, it’s also possible it was helped by hedge funds racing to cover a massive $10B failed US Treasury bond short.
Despite Tuesday’s sell-off, from a technical perspective the overall trend is still up, with the probabilities favoring longs over shorts.EUR/USD market movers
- The US Dollar surged on Tuesday due to safe-haven flows from recession and banking-crisis fears.
- The news that ailing lender First Republic Bank is mulling over whether to sell $100B of its loans – over half its loan book – to shore up its balance sheet, resurrects banking-crisis fears.
- Lower-than-expected US Consumer Confidence figures for April eclipsed higher-than-expected New Home Sales and were viewed as evidence of a possible impending US recession.
- That said, US T-bond yields, especially of a two-year maturity, plummeted dramatically, as investors reassessed the possibility the Federal Reserve (Fed) might start cutting rates sooner than had been expected.
- The Euro has been supported by overall hawkish comments from ECB officials.
- Pierre Wunsch, president of Belgium’s Banque Nationale, said, “We are waiting for wage growth and core inflation to go down... before we can arrive at the point where we can pause (hiking rates).”
- The ECB’s chief economist Philip Lane also went on record as saying interest rates will rise at the May 4 meeting but whether beyond that depends on the data.
- Previously, the Irishman had said a lot is riding on the state of Eurozone banks, as assessed by the ECB’s Bank Lending Survey out on May 2, as well as April flash HICP inflation data released on the same day.
- Strong first quarter earnings by European banks due to higher interest margins, however, suggest the BLS may paint a favorable picture.
- Banco Santander’s recently released Q1 earnings, for example, beat profit estimates of 2.4B with 2.57B.
- ECB President Christine Lagarde recently said there is still “some way to go” before Frankfurt is done with hiking interest rates.
- The US Dollar is at a disadvantage since Federal Reserve (Fed) officials are in the two-week blackout period before the May 4 meeting, during which time they are not allowed to comment.
- Prior to the blackout, St. Louis Fed’s Bullard was hawkish, saying he expects more rate hikes due to persistent inflation and overblown recession fears.
- The key data release for the US Dollar on Wednesday is March Durable Goods Orders out at 12:30 GMT. For the Euro, the main release has come and gone, with German Consumer Confidence Gfk in May, which came out at -25.7, beating the previous result by 2 bps.
EUR/USD technical analysis: Nearing year-to-date highs
EUR/USD peaks at 1.1067 and rolls over, dropping over a 100 pips in a day. That said, it has found a floor and recovered, and is currently trading back above 1.1000. Tuesday’s decline was violent but despite that the broader medium-term uptrend remains intact – and will continue to – as long as the 1.0830 lows hold. Overall the odds favor a continuation of the dominant Euro bullish trend.
-638180928412684047.png)
EUR/USD: Daily ChartA decisive break above the 1.1075 year-to-date highs would confirm a continuation of the Euro’s uptrend to the next key resistance level at around 1.1190, where the 200-week Simple Moving Average (SMA) is located.
For the sake of clarity, a ‘decisive break’ might be a ‘breakout candle’ – a long green bullish daily candle that extends above the 1.1075 highs and closes near its high, or three smaller bullish green candles in a row that break above the highs.
Alternatively, a break and daily close below the key lower high at 1.0830 could see losses extend down to a confluence of support at 1.0775-1.0800, marking a possible reversal of the dominant trend.
Euro FAQ
Euro FAQs
What is the Euro?
The Euro is the currency for the 20 European Union countries that belong to the Eurozone. It is the second most heavily traded currency in the world behind the US Dollar. In 2022, it accounted for 31% of all foreign exchange transactions, with an average daily turnover of over $2.2 trillion a day.
EUR/USD is the most heavily traded currency pair in the world, accounting for an estimated 30% off all transactions, followed by EUR/JPY (4%), EUR/GBP (3%) and EUR/AUD (2%).What is the ECB and how does it impact the Euro?
The European Central Bank (ECB) in Frankfurt, Germany, is the reserve bank for the Eurozone. The ECB sets interest rates and manages monetary policy.
The ECB’s primary mandate is to maintain price stability, which means either controlling inflation or stimulating growth. Its primary tool is the raising or lowering of interest rates. Relatively high interest rates – or the expectation of higher rates – will usually benefit the Euro and vice versa.
The ECB Governing Council makes monetary policy decisions at meetings held eight times a year. Decisions are made by heads of the Eurozone national banks and six permanent members, including the President of the ECB, Christine Lagarde.How does inflation data impact the value of the Euro?
Eurozone inflation data, measured by the Harmonized Index of Consumer Prices (HICP), is an important econometric for the Euro. If inflation rises more than expected, especially if above the ECB’s 2% target, it obliges the ECB to raise interest rates to bring it back under control.
Relatively high interest rates compared to its counterparts will usually benefit the Euro, as it makes the region more attractive as a place for global investors to park their money.How does economic data influence the value of the Euro?
Data releases gauge the health of the economy and can impact on the Euro. Indicators such as GDP, Manufacturing and Services PMIs, employment, and consumer sentiment surveys can all influence the direction of the single currency.
A strong economy is good for the Euro. Not only does it attract more foreign investment but it may encourage the ECB to put up interest rates, which will directly strengthen the Euro. Otherwise, if economic data is weak, the Euro is likely to fall.
Economic data for the four largest economies in the euro area (Germany, France, Italy and Spain) are especially significant, as they account for 75% of the Eurozone’s economy.How does the Trade Balance impact the Euro?
Another significant data release for the Euro is the Trade Balance. This indicator measures the difference between what a country earns from its exports and what it spends on imports over a given period.
If a country produces highly sought after exports then its currency will gain in value purely from the extra demand created from foreign buyers seeking to purchase these goods. Therefore, a positive net Trade Balance strengthens a currency and vice versa for a negative balance. -
09:00
Austria Purchasing Manager Index fell from previous 44.7 to 42 in April
-
09:00
Switzerland ZEW Survey – Expectations below forecasts (-18.9) in April: Actual (-33.3)
-
08:59
EUR/USD regains the smile and the 1.1000 barrier
- EUR/USD picks up renewed buying interest and surpasses 1.1000.
- The Greenback appears offered in tandem with shrinking risk aversion.
- Germany’s Consumer Confidence surprised to the upside in May.
The single currency regains some composure and lifts EUR/USD back above the key hurdle at 1.1000 the figure.
EUR/USD continues to target the YTD top
EUR/USD gathers some extra steam and partially reverses the sharp decline seen on Tuesday when spot lost around a cent from tops around 1.1060 to 2-day lows in the vicinity of 1.0960.
The rebound in the pair comes on the back of diminishing risk aversion, which in turn favours the resumption of the selling pressure in the Greenback in a context of further weakness in US yields across the curve.
Also bolstering the upside bias around the Euro emerges the continuation of the hawkish narrative from ECB’s policy makers, who leaves the door open to a 50 bps rate hike in May (despite this is not the most likely scenario so far) as well as extra rate raises at both meetings in June and July.
In the docket, Germany’s Consumer Confidence gauged by GfK improved to -25.7 for the month of May, while the Consumer Confidence rose to 83. In France in April.
Later in the NA session, Durable Goods Orders, MBA Mortgage Applications and Advanced Goods Trade Balance are all due.
What to look for around EUR
EUR/USD regains balance and reclaims the area beyond the 1.1000 barrier following the weak note in the Dollar and dwindling risk-off trade.
Meanwhile, price action around the single currency should continue to closely follow dollar dynamics, as well as the incipient Fed-ECB divergence when it comes to the banks’ intentions regarding the potential next moves in interest rates.
Moving forward, hawkish ECB-speak continue to favour further rate hikes, although this view appears in contrast to some loss of momentum in economic fundamentals in the region.
Key events in the euro area this week: Germany GfK Consumer Confidence (Wednesday) – EMU Final Consumer Confidence, Economic Sentiment (Thursday) – Euro group Meeting, Germany labour market report/ Advanced Inflation Rate/Flash Q1 GDP Growth Rate, EMU Flash Q1 GDP Growth Rate (Friday).
EUR/USD levels to watch
So far, the pair is gaining 0.39% at 1.1015 and the breakout of 1.1075 (2023 high April 14) would target 1.1100 (round level) en route to 1.1184 (weekly high March 21 2022). On the other hand, the initial support aligns at 1.0909 (weekly low April 17) seconded by 1.0831 (monthly low April 10) and finally 1.0788 (monthly low April 3).
-
08:41
AUD/USD: Downward bias picks up pace – UOB
In the opinion of Economist at UOB Group Lee Sue Ann and Markets Strategist Quek Ser Leang, AUD/USD is expected to face extra downside pressure in the short-term horizon.
Key Quotes
24-hour view: “The outsized drop in AUD of 1.05% (NY close of 0.6626) came as a surprise (we were expecting AUD to trade in a range). While the rapid decline is clearly oversold, AUD could test 0.6600 before stabilization is likely. Today, the major support at 0.6565 is unlikely to come into view. The downside risk is intact as long as AUD stays below 0.6670 (minor resistance is at 0.6655).”
Next 1-3 weeks: “Our most recent narrative was from last Monday (17 Apr, spot at 0.6710), wherein ‘there is no clear direction and AUD could trade in a relatively broad range of 0.6620/0.6785 for the time being’. AUD traded within the range for more than a week until yesterday when it dropped slightly below 0.6620 (low of 0.6614). Downward momentum is beginning to build and AUD is likely to edge lower in the coming days. However, any decline is likely to face solid support at the year-to-date low near 0.6565. All in all, AUD is likely to stay under pressure as long as the ‘strong resistance’ level at 0.6700 is not breached.”
-
08:38
Crude Oil Futures: A deeper drop is not favoured
CME Group’s flash data for crude oil futures markets noted open interest dropped for yet another session on Tuesday, this time by around 11.7K contracts. On the other hand, volume went up by around 163.3K contracts after two consecutive daily pullbacks.
WTI faces some near-term consolidation
Tuesday’s strong decline in prices of the WTI was accompanied by shrinking open interest, which rules out a sustained drop in the very near term at least. Against that, further range bound trade appears in store for the commodity and with the immediate hurdle at the $80.00 mark per barrel.
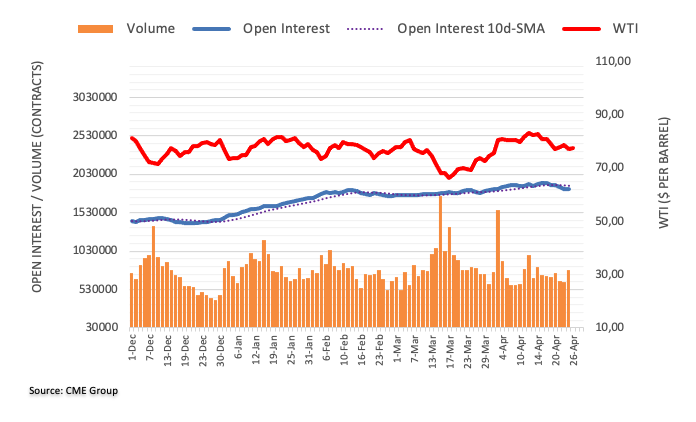
-
08:32
GBP/USD: Extra losses look probable below 1.2345 – UOB
GBP/USD risks a deeper pullback once 1.2345 is cleared, according to Economist at UOB Group Lee Sue Ann and Markets Strategist Quek Ser Leang.
Key Quotes
24-hour view: “Yesterday, we indicated that GBP ‘could rise above 1.2510 but it might not be able to break clearly above the month-to-date high of 1.2545’. However, instead of rising above 1.2510, GBP plummeted from 1.2507 to a low of 1.2388. The sharp and rapid decline appears to be running ahead of itself but with no signs of stabilization just yet, GBP could drop further. In view of the oversold conditions, the major support at 1.2345 is unlikely to come under threat (there is another support at 1.2375). On the upside, a break of 1.2460 (minor resistance is at 1.2435) would indicate that the weakness in GBP has stabilized.”
Next 1-3 weeks: “Our view from yesterday (25 Apr, spot at 1.2485) wherein ‘a break of 1.2510 will not be surprising and will increase the odds for further GBP strength’ was invalidated quickly as GBP plunged and took out our ‘strong support’ level of 1.2415 (low of 1.2388). While the downward risk is beginning to build, GBP has to break and stay below 1.2345 before a sustained decline is likely. The chance of GBP breaking clearly below 1.2345 will increase as long as it stays below 1.2490 in the next few days.”
-
08:31
Sweden Riksbank Interest Rate Decision meets forecasts (3.5%)
-
08:28
USD/JPY trades with modest losses around mid-133.00s amid softer USD
- USD/JPY edges lower for the second successive day, though the downside lacks follow-through.
- The BoJ’s dovish outlook, along with a positive risk tone undermine the JPY and lend support.
- The recent slump in the US bond yields weighs on the USD and might cap the upside for the pair.
The USD/JPY pair remains on the defensive for the second successive day on Wednesday, albeit manages to hold just above over a one-week low touched the previous day. The pair trades around the 133.50, down over 0.10% for the day during the early European session and is influenced by a combination of diverging forces.
The Bank of Japan (BoJ) Kazuo Ueda's dovish remarks earlier this week, along with a modest recovery in the US equity futures, undermine the safe-haven Japanese Yen (JPY) and act as a tailwind for the USD/JPY pair. It is worth recalling that the new BoJ Governor said on Monday that the central bank must maintain monetary easing as trend inflation is still below 2% and added that inflation forecasts must be quite strong and close to 2% in the coming year to consider tweaking yield curve control.
The upside for the USD/JPY pair, however, remains capped, at least for the time being, amid renewed US Dollar (USD) selling, led by the recent slump in the US Treasury bond yields. In fact, the yield on the benchmark 10-year Treasury yields registered its largest decline since March amid rising concerns about the regional banking sector, the possibility of an imminent recession and worries about the US debt ceiling. This, in turn, fails to assist the Greenback to capitalize on the overnight strong gains.
Traders might also refrain from placing aggressive directional bets and move to wait on the sidelines ahead of the key US macro data/central bank event risk. Investors this week will confront the release of the Advance US Q1 GDP print on Thursday, which will be followed by the US Core PCE Price Index - the Fed's preferred inflation gauge. This, along with the crucial BoJ monetary policy meeting on Friday, should provide a fresh impetus and help determine the near-term trajectory for the USD/JPY pair.
In the meantime, traders on Thursday will take cues from the release of the US Durable Goods Orders, due later during the early North American session. This, along with the US bond yields, might influence the USD price dynamics and provide some impetus to the USD/JPY pair. Apart from this, the broader risk sentiment should further contribute to producing short-term opportunities around the major.
Technical levels to watch
-
08:07
Forex Today: Mood remains mixed as focus shifts to US data
Here is what you need to know on Wednesday, April 26:
The US Dollar (USD) is finding it difficult to build on Tuesday recovery gains early Wednesday as investors' focus shift to upcoming data releases. Led by tech-heavy Nasdaq Futures, US stock index futures trade in positive territory and the 10-year US Treasury bond yield hold steady slightly above 3.4%. Durable Goods Orders for March and Wholesale Inventories will be featured in the US economic docket ahead of Thursday's highly anticipated Gross Domestic Product (GDP) report for the first quarter.
The USD benefited from souring market mood on Tuesday after Wall Street's main indexes opened in negative territory and continued to push lower. With Microsoft and Google Alphabet releasing upbeat earnings reports for the first quarter after the closing bell, however, technology stocks gained traction and Nasdaq Futures were last seen rising more than 1% on the day. On the other hand, major European equity indexes trade modestly lower in the early session. Meanwhile, the US Dollar Index started to edge lower 101.50 after having gained 0.5% on Tuesday.
During the Asian trading hours, the data from Australia revealed that the Consumer Price Index declined to 7% on a yearly basis in the first quarter from 7.8%. The Reserve Bank of Australia's (RBA) Trimmed Mean CPI in the same period edged lower to 6.6% from 6.9%, coming in much lower than the market forecast of 7.2%. Softer-than-expected inflation data seem to be weighing on the Australian Dollar and AUD/USD was last seen trading at its lowest level in five weeks near 0.6600.
EUR/USD turned south on Tuesday and erased all of Monday's gains to close below 1.1000. The pair has regained its traction early Wednesday and recovered above 1.1000 early Wednesday. Gfk Consumer Confidence Index for Germany improved to -25.7 for May from -29.3 in April, helping the Euro find a foothold.
GBP/USD fell sharply but managed to hold above 1.2400 on Tuesday. The pair benefits from the renewed USD weakness and climbs toward 1.2450 in the European morning on Wednesday.
Despite the USD's decisive rebound on Tuesday, Gold price edged higher supported by the retreating US yields. XAU/USD stays relatively quiet on Wednesday and trades within a touching distance of $2,000.
USD/JPY broke below 134.00 on Tuesday as the Japanese Yen found demand as a safe haven. The pair consolidates its recent losses and holds above 133.50 early Wednesday.
Bitcoin gathered recovery momentum and rose nearly 3% on Tuesday. BTC/USD continues to stretch higher toward $28,500 mid-week. Ethereum registered small losses on Tuesday and continues to fluctuate in a tight range below $1,900 on Wednesday.
-
07:57
Silver Price Analysis: XAG/USD bounces off multi-day-old previous resistance to defend $25.00
- Silver price clings to mild gains after recovering from three-week low.
- Bearish MACD signals join lower high and lower low formation to lure XAG/USD sellers.
- 10-DMA, one-week-old descending trend line restrict immediate upside.
- $21.20 holds the key for further Silver price downside.
Silver price (XAG/USD) remains defensive around $25.05 as bulls and bears jostle ahead of the key US data early Wednesday.
In doing so, the XAG/USD rebounds from an upward-sloping support line from early January, the previous resistance. Also putting a floor under the Silver price is the 21-DMA.
However, the lower high and lower low formation of the bright metal joins the bearish MACD signals to keep the Silver sellers hopeful.
Hence, the bullion price is likely to remain pressured and can decline further on breaking the aforementioned resistance-turned-support line, close to $24.90, at the latest.
It’s worth noting that the 21-DMA level surrounding $24.80 and multiple tops marked during early 2023 around $24.20 can act as additional downside filters to watch for the Silver sellers past $24.90.
Should the XAG/USD remains bearish past $24.20, the odds of witnessing a slump toward January’s low of $22.76 can’t be ruled out.
Alternatively, the 10-DMA level of $25.23 guards the immediate recovery of the Silver price.
Following that, a one-week-old descending resistance line, close to $25.35 by the press time, can act as the last defense of the XAG/USD bears.
In a case where the Silver price remains firmer past $25.35, a rally towards refreshing the Year-To-Date (YTD) top, currently around $26.10, can be anticipated.
Silver Price: Daily chart
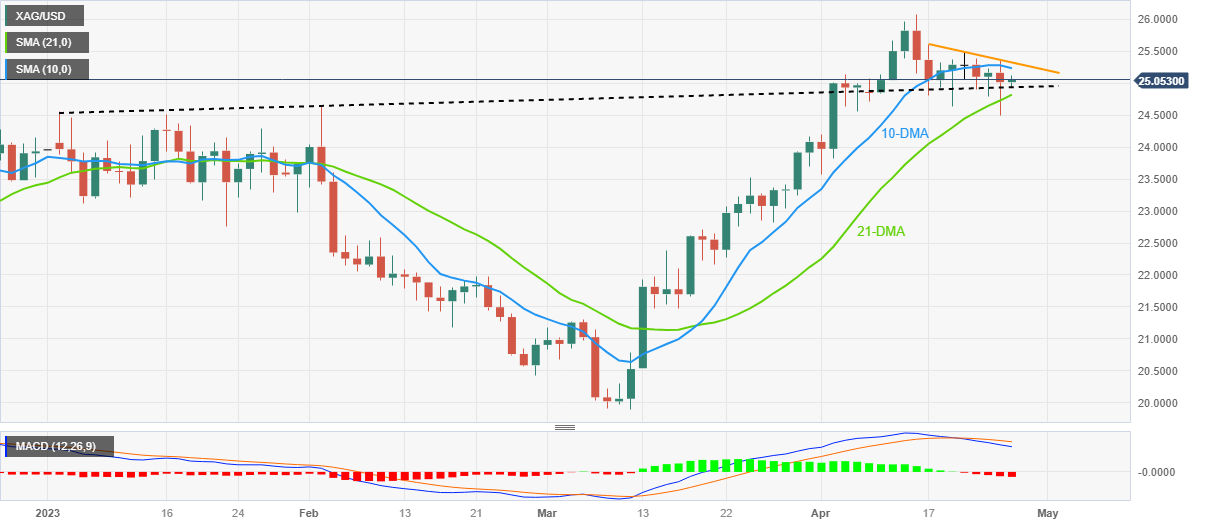
Trend: Downside expected
-
07:45
France Consumer Confidence came in at 83, above forecasts (82) in April
-
07:44
FX option expiries for Apr 26 NY cut
FX option expiries for Apr 26 NY cut at 10:00 Eastern Time, via DTCC, can be found below.
- EUR/USD: EUR amounts
- 1.0900 2.6b
- 1.0925-40 2.6b
- 1.0950 2.5b
- 1.0955-60 1.7b
- 1.0970-75 1.4b
- 1.1000 1.5b
- 1.1030-45 2.1b
- GBP/USD: GBP amounts
- 1.2350 487m
- 1.2400-10 718m
- USD/JPY: USD amounts
- 133.00 584m
- 133.40-50 839m
- 134.00 397m
- 134.40-50 500m
- USD/CHF: USD amounts
- 0.8925 610m
- 0.8990-00 800m
- AUD/USD: AUD amounts
- 0.6625-30 589m
- 0.6650-60 1.2b
- 0.6700 839m
-
07:30
Hungary Gross Wages (YoY) down to 0.8% in February from previous 16.1%
-
07:28
Gold Price Forecast: XAU/USD bears flex muscles around $1,990 as clues for US GDP loom
- Gold price retreats after two-day winning streak, clings to mild losses of late.
- Market’s cautious optimism ahead of US Durable Goods Orders allows XAU/USD to pare recent gains.
- US debt ceiling talks, banking updates also become important for clear Gold price directions.
Gold price (XAU/USD) stays defensive around $1,995 as the metal buyers await fresh clues to defend the two-day uptrend amid early Wednesday. In doing so, the XAU/USD struggles amid cautious optimism in the market, as well as anxiety ahead of a key clue for the United States Gross Domestic Product (GDP) for the first quarter (Q1), namely the Durable Goods Orders for March.
While portraying the mood, S&P 500 Futures rises half a percent while paring the biggest daily loss in a month, backed by upbeat tech earnings released late Tuesday. Additionally, the US 10-year Treasury bond yields prod a two-day downtrend while the US two-year bond coupons remain pressured. That said, the US Dollar Index (DXY) retreats to 101.70 after snapping a three-day downtrend the previous day.
Talking about the key catalysts, upbeat earnings from Microsoft and Alphabet join US President Joe Biden’s warning to use the veto to avoid the US default also underpin the cautious optimism in the market and trigger a pullback in the Gold price.
“President Biden on Tuesday threatened to veto legislation being pushed by House Republican leaders that would condition support for raising the debt ceiling on deep spending cuts, calling it “a reckless attempt to extract extreme concessions as a condition for the United States simply paying the bills it has already incurred,” per the Washington Post.
Previously, fresh banking fears, triggered through the First Republic Bank (FRB), joined the US debt ceiling talks and mixed US data to prod the market sentiment and propelled the XAU/USD run-up due to the metal’s haven demand.
Moving on, the US Durable Goods Orders for March, expected to improve to 0.8% versus -1.0% prior, will join the market’s risk appetite and the US Dollar moves to determine short-term XAU/USD performance ahead of the US Q1 GDP.
Gold price technical analysis
Gold price fades upside momentum within a one-week-old symmetrical triangle, currently between $2,001 and $1,977. However, the bearish MACD signals and steady RSI teases XAU/USD sellers.
Also suggesting the Gold price downside is the 200-Hour Moving Average (HMA), around $1,998 by the press time.
Meanwhile, the 100-HMA level of $1,990 acts as immediate support for the XAU/USD ahead of the $1,977 level.
Overall, the Gold price remains sidelined but the lack of upside momentum and multiple barriers toward the north lures bears of late.
Gold price: Hourly chart
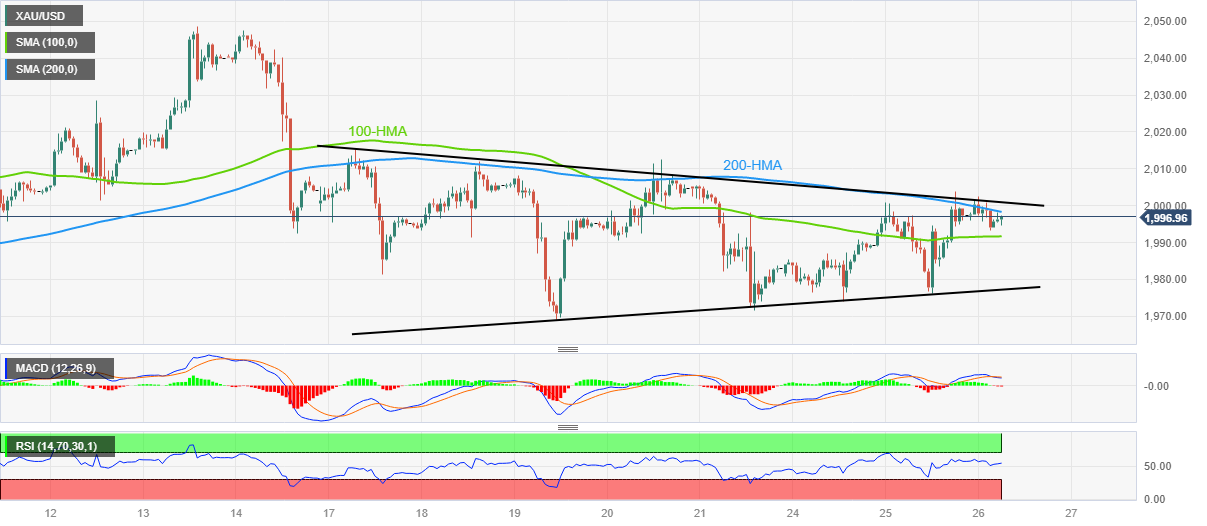
Trend: Lacks clear direction
-
07:15
Gold Futures: A sustainable rebound seems unlikely
Open interest in gold futures markets shrank by nearly 1.5K contracts on Tuesday, reversing the previous daily build at the same time according to preliminary readings from CME Group. Volume, instead, went up by around 18.3K contracts after three daily drops in a row.
Gold: Further consolidation appears on the cards
Gold prices extended the positive mood on Tuesday and briefly revisited the area above the key $2000 mark per ounce troy. The uptick, however, was on the back of shrinking open interest and leaves the prospect for further gains somewhat curtailed. That said, the continuation of the consolidative mood seems the most likely scenario for bullion for the time being.
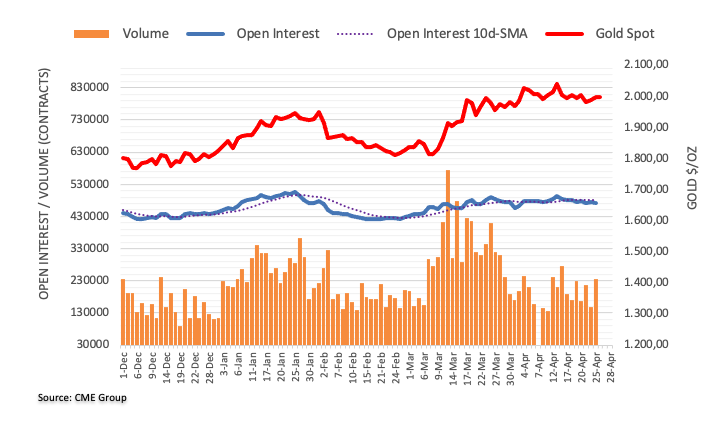
-
07:14
USD/CHF declines towards 0.8900 as USD index corrects further, US Durable Goods Orders eyed
- USD/CHF is declining towards 0.8900 amid further correction in the US Dollar Index.
- Federal Reserve might remain hawkish while guiding on terminal rates if Durable Goods Orders data land above expectations.
- Solid Swiss ZEW Survey-Expectations would convey improving business conditions which will increase labor demand and will propel consumer spending.
- USD/CHF has attempted a recovery after testing prior support levels plotted from 0.8860 with weak selling pressure.
USD/CHF has witnessed a steep fall after failing to sustain above the critical resistance of 0.8920 in the early European session. The Swiss Franc asset is declining towards the round-level support of 0.8900 as the US Dollar Index (DXY) has extended its correction further. The absence of anxiety among investors ahead of the United States Durable Goods Orders data has trimmed the appeal for the US Dollar Index.
S&P500 futures have added significant gains in early Europe. The 500-US stocks basket witnessed an intense sell-off on Tuesday after vulnerable quarterly earnings from the First Republic Bank renewed fears of a banking fiasco. The United States commercial bank reported a steep decline in deposits from customers, which forced it to rely on external borrowings that come with heavy interest tags. Significant gains added in S&P500 futures in early Asia indicate a recovery in the risk appetite of the market participants.
Meanwhile, the demand for US government bonds has trimmed as investors have started ignoring US banking woes. The 10-year US Treasury yields have rebounded to near 3.41%.
Bottomed out US housing sector recedes fears of economic slowdown
US Commerce Department reported on Tuesday that New home sales surged 9.6%, the highest level since March 2022. The economic data indicates that US real estate sector which was going through a rough phase due to higher interest rates from the Federal Reserve (Fed) is bottoming out. This has trimmed the risk of soon recession as investors believe that more construction proposals will accelerate labor demand, which will eventually propel consumer spending. Usually, the impact of the recession is first observed in the property sector, and bottoming out real estate indicates that the economic slowdown shall postpone.
Investors await US Durable Goods Orders data for further guidance
There is no denying the fact that the Federal Reserve is widely anticipated to announce a consecutive 25 basis point (bp) in the first week of May. As the event is widely expected, investors are keenly focusing on the interest rate guidance to be provided by Fed chair Jerome Powell. The release of the monthly US Durable Goods Orders (March) would provide cues about guidance on terminal rates. As per the consensus, the economic data has expanded by 0.8% in March against a contraction of 1.0% reported in February.
An expansion in orders for Durable Goods to manufacturers indicates strong demand from households, which could keep the core Consumer Price Index (CPI) stubborn ahead and may force the Federal Reserve to remain hawkish while delivering guidance on interest rates. It is worth noting that US core inflation is not softening consistently and a further jump in Durable Goods demand could spoil the market mood.
Swiss ZEW Survey-Expectations in focus
On Wednesday, a power-pack action is expected from the Swiss Franc amid the release of the ZEW Survey-Expectations data. The street is anticipating that business conditions will improve to -18.9 from the former release of -41.3. An occurrence of the same might support the Swiss Franc ahead. Also, improving business conditions indicate strong labor demand and robust consumer spending.
USD/CHF technical outlook
-638180864026472062.png)
USD/CHF has attempted a recovery after testing prior support levels plotted from April 13 low at 0.8860 with weak selling pressure on a two-hour scale. The 100-period Exponential Moving Average (EMA) at 0.8938 has acted as a major roadblock for the US Dollar bulls. Southward-sloping trendline from March 21 high at 0.9317 will continue to act as a barricade for the greenback.
The Relative Strength Index (RSI) (14) is making efforts to overstep 60.00, which will trigger an upside momentum.
-
07:00
Sweden Trade Balance (MoM) came in at 6.9B, above expectations (-2.1B) in March
-
07:00
Sweden Unemployment Rate registered at 7.7%, below expectations (7.9%) in March
-
07:00
Germany Gfk Consumer Confidence Survey came in at -25.7, above forecasts (-27.5) in May
-
06:55
USD/CAD Price Analysis: Loonie buyers resist cheering 50-DMA breakout below 1.3650
- USD/CAD fades recovery from intraday low as bulls struggle around one-month high.
- 50-DMA challenges immediate downside ahead of one-week-old ascending support line.
- Downward-sloping resistance line prods Loonie pair buyers amid nearly overbought RSI, bullish MACD signals.
USD/CAD bulls take a breather at the highest level in a month, retreating to 1.3625 amid early Wednesday morning in Europe.
Although the nearly overbought RSI (14) line triggered the USD/CAD pair’s latest pullback, the Loonie pair remains on the buyer’s radar amid bullish MACD signals and a successful upside break of the 50-DMA.
Hence, the quote’s latest retreat appears elusive unless staying beyond the 50-DMA level of around 1.3580.
Even if the USD/CAD pair breaks the 50-DMA support, an ascending trend line from April 14, close to 1.3540 at the latest, acts as an extra filter towards the south.
Above all, the Loonie pair bears remain cautious unless witnessing a clear downside break of a 5.5-month-long ascending support line, near 1.3300 by the press time.
On the contrary, a six-week-long falling resistance line of around 1.3665 guards the quote’s immediate upside.
Following that, the late 2022 peak near 1.3705 will precede the current yearly high of 1.3861 to lure the USD/CAD bulls.
To sum up, the Loonie pair’s first daily closing above the 50-DMA in a month joins upbeat oscillators to keep buyers hopeful.
USD/CAD: Daily chart
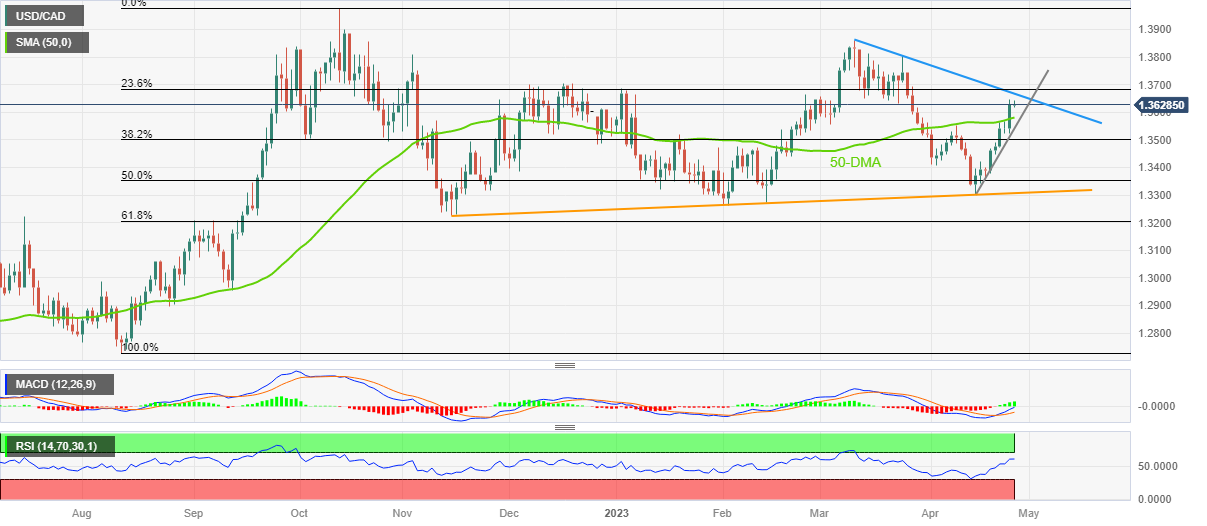
Trend: Bullish
-
06:43
USD Index appears slightly bid near 101.80 ahead of data
- The index gives away some gains following Tuesday’s strong uptick.
- The risk aversion looks somewhat mitigated early on Wednesday.
- Durable Goods Orders, Trade Balance next of note in the docket.
The greenback trades with marginal losses near the 101.80 region when tracked by the USD Index (DXY) ahead of the opening bell in Europe on Wednesday.
USD Index remains capped by 102.00
The index faces a knee-jerk following Tuesday’s pronounced pullback amidst diminishing risk aversion and some improvement in the risk-linked galaxy.
No news from the macro scenario, where the recent resurgence of banking jitters sponsored the return of the risk aversion on Tuesday and propelled the index to the proximity of the 102.00 region.
In the meantime, investors continue to favour a 25 bps rate hike by the Fed at the May 3 event, although the probability of that outcome shrinks a tad to around 75% (from nearly 90% a day ago).
In the docket, Durable Goods Orders will take centre stage later in the session seconded by MBA Mortgage Applications and Advanced Goods Trade Balance.
What to look for around USD
The dollar’s recovery meets some initial resistance near the 102.00 hurdle so far this week.
Looking at the broader picture, the index continues to navigate in a consolidative phase against steady expectations of another rate increase in May by the Fed.
In favour of a pivot in the Fed’s hiking cycle following the May event appears the persevering disinflation and nascent weakness in some key fundamentals.
Key events in the US this week: MBA Mortgage Applications, Durable Goods Orders, Advanced Goods Trade Balance (Wednesday) – Flash Q1 GDP Growth Rate, Initial Jobless Claims, Pending Home Sales (Thursday) – PCE/Core PCE, Employment Cost, Personal Income, Personal Spending, Final Michigan Consumer Sentiment (Friday).
Eminent issues on the back boiler: Persistent debate over a soft/hard landing of the US economy. Terminal Interest rate near the peak vs. speculation of rate cuts in 2024. Fed’s pivot. Geopolitical effervescence vs. Russia and China. US-China trade conflict.
USD Index relevant levels
Now, the index is losing 0.09% at 101.75 and the breach of 100.78 (2023 low April 14) would open the door to 100.00 (psychological level) and finally 99.81 (weekly low April 21 2022). On the other hand, the next hurdle emerges at 102.80 (weekly high April 10) followed by 103.05 (monthly high April 3) and then 103.21 (55-day SMA).
-
06:38
WTI crude oil rebounds from three-week low to $77.50 as markets brace for key US data
- WTI picks up bids to pare the biggest daily loss in a week.
- Fears of cut in output by the key Oil refiners, cautious optimism in market underpin recovery moves.
- Surprise draw in API inventories adds strength to recovery moves.
- EIA Crude Oil Stocks Change, US Durable Goods Orders eyed for clear directions.
WTI crude oil pares the biggest daily loss in a week around $77.50 heading into Wednesday’s European session as market sentiment improves ahead of the key US data, as well as the weekly official Oil inventory numbers.
Adding strength to the rebound can be the headlines suggesting a likely production cut from the key refiners due to fears of lesser demand. That said, Tuesday’s surprise draw in the Oil inventories, as per the industry source American Petroleum Institute (API), also underpins the WTI crude oil recovery.
It’s worth noting that the API Weekly Crude Oil Stock came in -6.083M for the week ended on April 21 versus -2.675M prior.
On the other hand, Bloomberg flags fears of further decline in the Oil output from the Organization of Petroleum Exporting Countries and its allies, correctively known as OPEC+, by citing deterioration in oil-refining profits over the last few weeks.
It’s worth mentioning that upbeat earnings from Microsoft and Alphabet join US President Joe Biden’s warning to use the veto to avoid the US default also underpin the cautious optimism in the market and trigger a corrective bounce in the black gold prices.
“President Biden on Tuesday threatened to veto legislation being pushed by House Republican leaders that would condition support for raising the debt ceiling on deep spending cuts, calling it “a reckless attempt to extract extreme concessions as a condition for the United States simply paying the bills it has already incurred,” per the Washington Post.
Previously, fresh banking fears, triggered through the First Republic Bank (FRB), joined the US debt ceiling talks and mixed US data to prod the market sentiment and drown the WTI Crude Oil.
Moving on, the WTI crude oil traders should pay attention to the official US stockpile data from the Energy Information Administration (EIA), as well as the US Durable Goods Orders for March, expected to improve to 0.8% versus -1.0% prior, for clear directions. Above all, the market’s risk appetite and the US Dollar moves will be crucial for the Oil traders to watch.
Technical analysis
Although the 100-DMA level of around $76.90 restricts short-term WTI crude oil downside, the energy bulls remain cautious unless the quote stays below the early-month swing low surrounding $79.50.
-
06:24
Asian Stock Market: Upbeat US tech stocks’ earnings fail to cheer Asian indices, oil advances
- Asian stocks have faced immense pressure amid renewed US banking jitters.
- Japanese stocks have dropped sharply despite chances of continuation of ultra-dovish monetary policy by the BoJ.
- Oil prices have stretched their recovery above $77.50 ahead of the oil inventory data to be reported by US EIA.
Markets in the Asian domain have witnessed immense selling pressure despite upbeat earnings reported by United States technology stocks on Tuesday. Microsoft and Google outperformed street’ estimates despite higher interest rates from the Federal Reserve (Fed). However, renewed banking jitters inspired by weak quarterly performance from First Republic Bank spoiled the market mood.
At the press time, Japan’s Nikkei 225 tumbled 0.77%, Shanghai dropped 0.23%, Hang Seng gains 0.64%, and Nifty50 eased 0.03%.
The US Dollar Index (DXY) has delivered a breakdown of the consolidation formed in a narrow range above 101.80 in the Asian session. The USD Index is in a further correction mode as investors don’t seem anxious ahead of the United States Durable Goods Orders data.
Japanese stocks have dropped sharply despite chances of continuation of ultra-dovish monetary policy by the Bank of Japan (BoJ). New BoJ Governor Kazuo Ueda has no other option than to continue the expansionary monetary policy to keep inflation steadily above 2% by creating domestic demand.
In the Asia Pacific region, Australian inflation softened sharply but remained marginally higher than estimates. Australian inflation is consistently declining and is expected to support the Reserve Bank of Australia (RBA) for the continuation of a steady interest rate policy.
On the oil front, oil prices have stretched their recovery above $77.50 ahead of the oil inventory data to be reported by US Energy Information Administration (EIA) for the week ending April 21.
-
06:22
EUR/USD looks side-lined for the time being – UOB
Economist at UOB Group Lee Sue Ann and Markets Strategist Quek Ser Leang now see EUR/USD trading between 1.0900 and 1.1050 in the next few weeks.
Key Quotes
24-hour view: “We indicated yesterday that EUR ‘is likely to advance further but it remains to be seen if it can maintain a foothold above 1.1075’. EUR eked out a fresh year’s high of 1.1066 before plummeting to 1.0962. While the sharp and swift drop is oversold, there is room for EUR to decline further. However, the major support at 1.0900 is unlikely to come under threat (there is another support at 1.0940). Resistance is at 1.1000; a break of 1.1025 would indicate that the weakness in EUR has stabilized.”
Next 1-3 weeks: “Yesterday (25 Apr, spot at 1.1045), we highlighted that EUR ‘is likely to trade with an upward bias but it has to break and stay above the month-to-date high of 1.1075 before a move to the next major resistance at 1.1120 is likely’. We added, ‘a break of 1.0975 would indicate that the build-up in momentum has faded’. We did not anticipate the sharp drop in NY trade that took out our ‘strong support’ level of 1.0975 (low has been 1.0962). The build-up of upward momentum has fizzled out. In other words, instead of advancing, EUR is more likely to trade in a range for now, expected to be between 1.0900 and 1.1050.”
-
06:06
USD/CNH Price Analysis: Retreats from 200-DMA to snap three-day uptrend above 6.9300
- USD/CNH prints the first daily loss in four as it eases from the highest levels in six weeks.
- Key DMA, nearly overbought RSI (14) challenges further upside of the offshore Chinese Yuan (CNH) pair.
- Four-month-old symmetrical triangle restricts short-term moves, ascending trend line from early February adds to downside filters.
USD/CNH drops towards 6.9300 while defying the three-day winning streak ahead of Wednesday’s European session, down 0.16% intraday to 6.9320 at the latest. In doing so, the offshore Chinese Yuan (CNH) pair reverses from its highest levels in 1.5 months.
That said, a failure to cross the 200-DMA triggered the USD/CNH pair’s pullback move. Adding strength to the retreat is the nearly overbought RSI (14) conditions.
As a result, the quote’s further declines towards an upward-sloping support line from February 02, close to 6.8820 at the latest, can’t be ruled out.
However, the bottom line of the four-month-old symmetrical triangle, between 6.9840 and 6.8465, appears strong hurdles for the USD/CNH pair traders to tackle before suggesting clear moves.
On the flip side, a daily closing beyond the 200-DMA level of 6.9520 could direct the USD/CNH bulls toward the stated triangle’s top line surrounding 6.9840.
It’s worth noting that the USD/CNH bulls need validation from the November 2022 bottom surrounding 7.0200 to retake control whereas multiple levels around the 6.8000 round figure can check the pair sellers past 6.8465.
Overall, USD/CNH is likely to remain within the multi-day-old symmetrical triangle.
USD/CNH: Daily chart
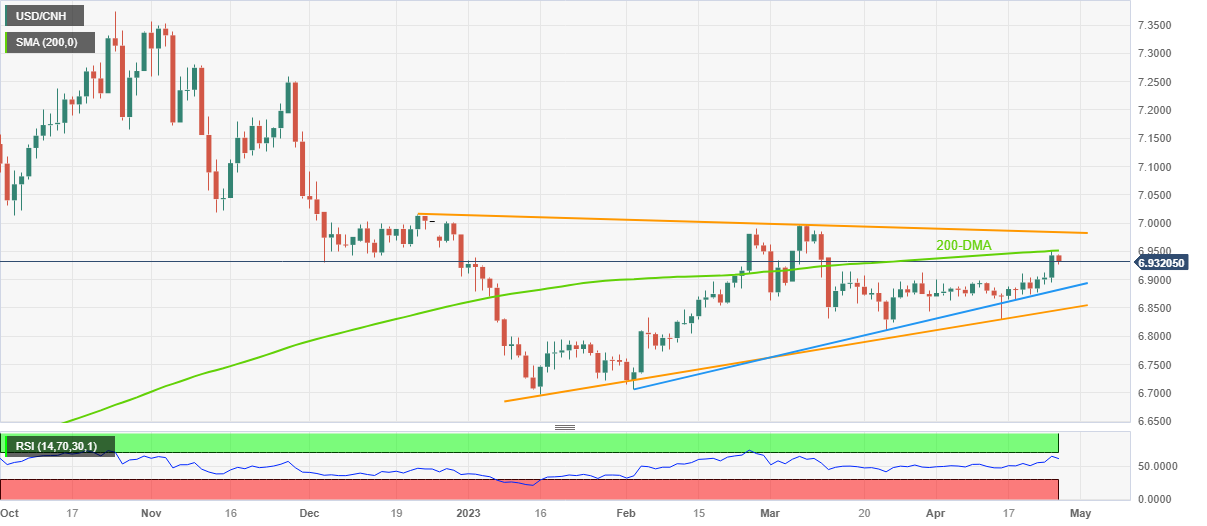
Trend: Limited downside expected
-
06:00
Singapore Industrial Production (MoM) registered at 9.3% above expectations (6.2%) in March
-
06:00
Singapore Industrial Production (YoY) registered at -4.2% above expectations (-6.1%) in March
-
05:44
AUD/USD Price Analysis: Inch far from 0.6600 as soft Australian CPI cements steady RBA policy
- AUD/USD has dropped sharply to near 0.6600 as Australian inflation softens further.
- Soft Australian inflation would support the RBA to stay with the decision of keeping interest rates unchanged.
- The USD Index is eying an upside break of the consolidation formed in a narrow range above 101.80.
The AUD/USD pair is continuously declining towards the round-level support of 0.6600 after the Australian Bureau of Statistics reported further softening of inflation data. The quarterly Consumer Price Index (CPI) (Q1) accelerated by 1.4% but was lower than the former pace of 1.9%. Annual inflation has softened to 7.0%, a little higher than the estimates of 6.9% but lower than the prior release of 7.8%.
The monthly CPI indicator decelerated to 6.1% from the consensus of 6.6% and the previous release of 6.8%. A significant deceleration in Australian inflation is going to support the Reserve Bank of Australia (RBA) to stay with the decision of keeping interest rates unchanged at 3.60%, as announced in April’s monetary policy meeting.
Meanwhile, the US Dollar Index (DXY) is eying an upside break of the consolidation formed in a narrow range above 101.80. S&P500 futures have added significant gains despite a bearish Tuesday, portraying a recovery in the risk appetite of the market participants.
AUD/USD has delivered a breakdown of the Inverted Flag chart pattern formed on a daily scale. The aforementioned chart pattern is a trend continuation pattern in which a long consolidation is followed by a breakdown. Usually, the consolidation phase of the chart pattern serves as an inventory adjustment in which those participants initiate shorts, which prefer to enter an auction after the establishment of a bearish bias and current sellers add more positions.
Going forward, the 20-period Exponential Moving Average (EMA) around 0.6700 will act as a barricade for the Aussie bulls.
Adding to that, a slippage into the bearish range of 20.00-40.00 by the Relative Strength Index (RSI) (14) will trigger a downside momentum.
US Dollar bulls will flex their muscles if the Aussie asset will drop below March 15 low at 0.6590. An occurrence of the same will expose the asset to March 08 low at 0.6568 followed by 02 November 2022 high around 0.6500.
In an alternate scenario, only a decisive move above the round-level resistance of 0.6800 will drive the asset toward February 23 high at 0.6872 and February 20 high at 0.6920.
AUD/USD daily chart
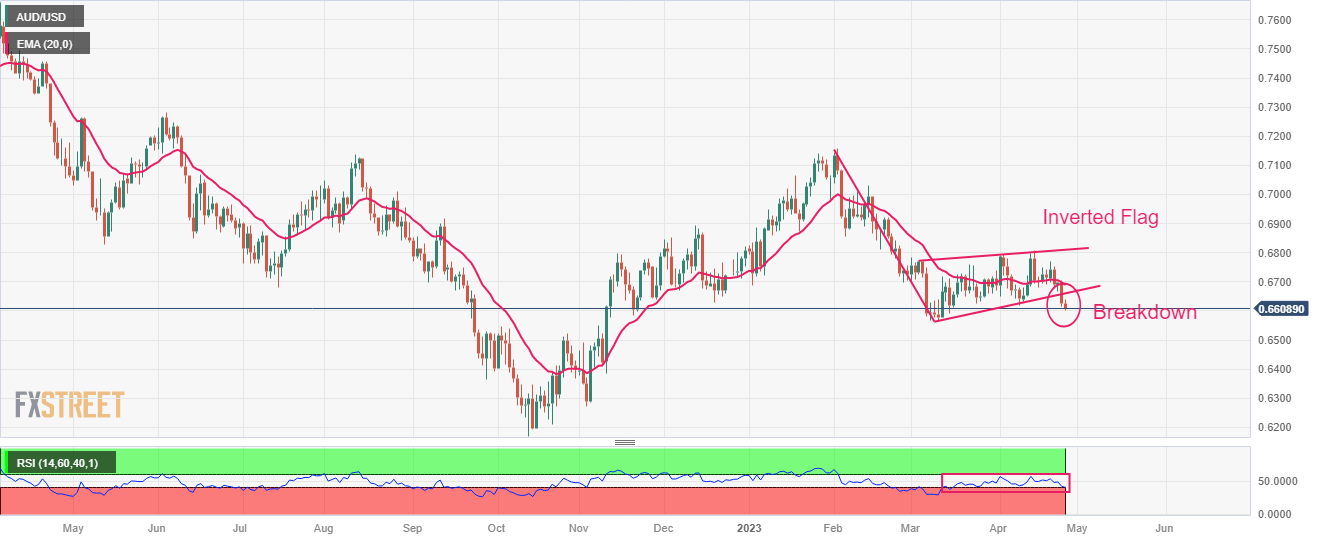
-
05:39
GBP/USD stays defensive around 1.2400 amid banking turbulence, pre-data positioning
- GBP/USD licks its wounds after falling the most in eight days.
- UK’s political crisis, banking fears and lack of hawkish BoE statements prod Cable pair’s corrective bounce.
- Market’s consolidation defends GBP/USD but US Durable Goods Orders, risk catalysts are more important for clear directions.
GBP/USD steadiness around 1.2410-15 heading into Wednesday’s London open as bears take a breather after cheering the biggest daily slump in a week. In doing so, the Cable pair benefits from the market’s consolidation ahead of the US Durable Goods Orders for March.
That said, the major central banks’ attempts to restore market confidence by curtailing the US Dollar operations initiated during the first wave of the banking crisis seemed to have put a floor under the GBP/USD prices of late. “The world's top central banks are cutting the frequency of their dollar liquidity operations with the U.S. Federal Reserve from May, sending the clearest signal yet that last month's financial market volatility is essentially over,” said Reuters.
However, the looming banking crisis, triggered through the First Republic Bank (FRB) joins the fears of US default to check the Cable pair buyers.
On Tuesday, the FRB renewed the woes of banking fallouts by flashing disappointing earnings reports and the executives’ resistance in taking questions, not to forget mentioning the absence of earnings guidance.
On the other hand, US Treasury Secretary Janet Yellen warned that failure by Congress to raise the government's debt ceiling–and the resulting default–would trigger an "economic catastrophe" that would send interest rates higher for years to come, per Reuters.
It’s worth noting that the ethics committee investigation on UK Prime Minister Rishi Sunak and the cautious mood surrounding the Brexit deal with the European Union, as British PM Sunak pushes for easy travel rules, also challenge the GBP/USD pair’s recovery moves.
Elsewhere, a jump in the UK’s borrowing in March that fuelled the British debt-to-GDP ratio reaching 100%, the highest since the 1960s, also weighs on the Cable pair prices. On the same line are the comments from Bank of England (BoE) officials as they hesitate confirming the hawkish bias. Firstly, BoE Deputy Governor, Ben Broadbent, said on Tuesday, “had we seen inflation shocks coming, BoE would have tightened policy sooner.” Following him, BoE Chief Economist Huw Pill said that recent events moderated calls for higher interest rates.
Furthermore, the US statistics have been mixed and contribute to the uncertainty surrounding the Federal Reserve’s (Fed) future moves, which in turn strengthen the market’s downbeat bias, despite the latest cautious optimism. That said, US Conference Board's Consumer Confidence Index edged lower to 101.3 for April, versus 104.0 prior. Additional details of the publication stated that the Present Situation Index ticked up to 151.1 during the said month from 148.9 prior whereas the Consumer Expectations Index dropped to 68.1 from 74 previous readings. Further, the one-year consumer inflation expectations eased to 6.2% in April from 6.3% in March.
Moving ahead, the US Durable Goods Orders for March, expected to improve to 0.8% versus -1.0% prior, will be important for the Cable pair traders to watch amid a light calendar in the UK. However, risk catalysts will be more important for a clear guide.
Technical analysis
Although a three-week-old ascending support line joins the 21-day Exponential Moving Average (EMA) to restrict short-term GBP/USD downside around 1.2400-2395, recovery needs validation from the 10-day EMA hurdle of 1.2430 to convince Cable buyers.
-
05:30
Netherlands, The Retail Sales (YoY): 5.1% (March) vs previous 8.5%
-
05:08
USD/INR Price News: Attempts a break above 82.00 as focus shifts to US Durable Goods Orders
- USD/INR is attempting a break above 82.00 ahead of US Durable Goods Orders data.
- An expansion in orders for Durable Goods to manufacturers indicates strong demand from households.
- Bottoming out US real estate despite higher interest rates from the Fed indicates that recession is not in picture for now.
The USD/INR pair is making efforts to break above the immediate resistance of 82.00 in the Asian session. The asset is expected to discount the overnight gains in the US Dollar index (DXY) supported by a recovery in the United States real estate market.
Upbeat New Home Sales data in the US economy trimmed the risk of soon recession as investors believe that more construction proposals will strengthen the labor market further and also consumer spending is rising. Usually, the impact of recession is first observed in the property sector, and bottoming out real estate despite higher interest rates from the Federal Reserve (Fed) indicates that recession is not in picture for now.
At the time of writing, the USD Index is consolidating in a nominal range above 101.80 as investors are awaiting the monthly US Durable Goods Orders data (March) for further guidance. The street is anticipating an expansion of 0.8% against a contraction of 1.0%.
An expansion in orders for Durable Goods to manufacturers indicates strong demand from households, which could keep the core Consumer Price Index (CPI) stubborn ahead and may force the Fed to remain hawkish while delivering guidance on interest rates.
On the oil front, oil prices have gradually advanced to near $77.50 in the Asian session after declining to a three-week low at $76.60. The oil price is expected to show a volatile action ahead of the release of the inventory data by the US Energy Information Administration (EIA).
It is worth noting that India is one of the leading importers of oil in the world and a recovery in the oil price will impact the Indian rupee.
-
05:06
EUR/USD Price Analysis: Dribbles within key SMA envelope below 1.1000 ahead of US Durable Goods Orders
- EUR/USD remains sidelined after posting the biggest daily slump in six weeks.
- 50-SMA, 100-SMA restrict immediate Euro moves while defending buyers past one-month-old ascending support line.
- Downbeat oscillators, failure to pick-up bids keep EUR/USD bears hopeful.
- US Durable Goods Orders for March will provide early signals for the key US Q1 GDP.
EUR/USD treads water around 1.0980 heading into Wednesday’s European session as bears take a breather after posting the biggest daily loss in 1.5 months. Also challenging the Euro pair’s latest moves could be the cautious mood ahead of the US Durable Goods Orders for March, expected to improve to 0.8% versus -1.0% prior.
Also read: EUR/USD licks its wounds near 1.0970 after banking woes propelled the biggest daily fall in six weeks
Apart from an immediate challenge to the EUR/USD pair’s momentum caused by the 50-SMA and the 100-SMA, an upward-sloping support line from late March, also restrict the quote’s nearby moves by offering a strong support around 1.0955.
It’s worth noting, however, that the quote’s hesitance in accepting bids joins the bearish MACD signals and a mostly steady RSI (14) keeps the EUR/USD sellers hopeful.
However, a clear downside break of the 1.0955 support confluence, encompassing the 100-SMA and the aforementioned trend line, becomes necessary to convince the Euro sellers.
Even so, the 200-SMA level of 1.0865 can act as the last defense of the EUR/USD buyers.
On the contrary, an upside break of the 50-SMA hurdle of 1.0980 will need validation from the 1.1000 psychological magnet to convince the Euro bulls.
Following that, a descending resistance line from mid-April, close to 1.1065 at the latest, will be crucial for the EUR/USD pair to cross to keep the bulls on board.
EUR/USD: Four-hour chart
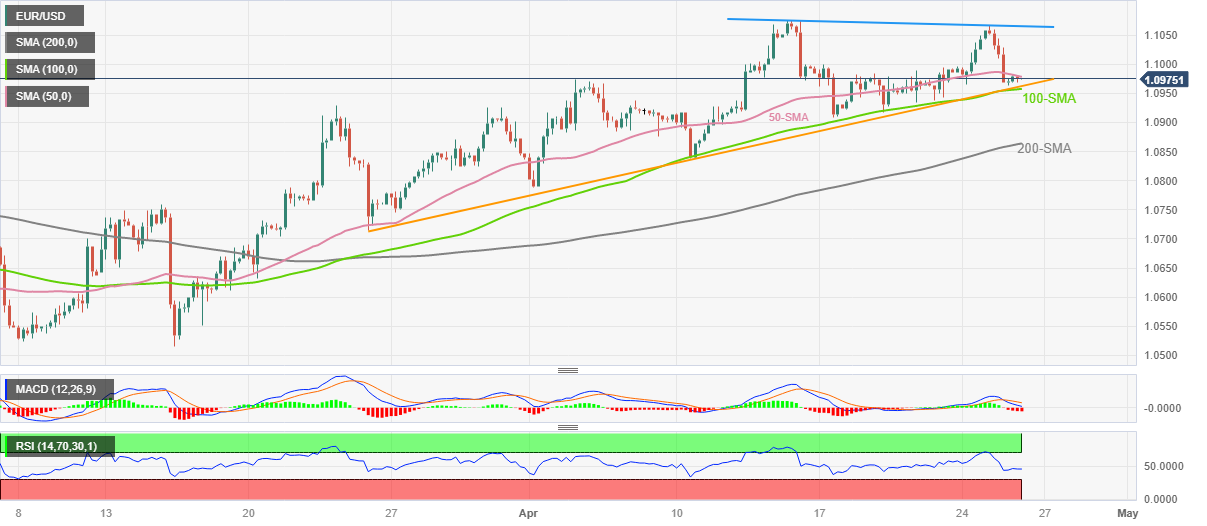
Trend: Downside expected
-
04:32
Gold Price Forecast: XAU/USD fails to sustain above $2,000 as investors digest renewed US banking woes
- Gold price has sensed selling pressure while shifting its auction above $2,000 as US banking jitters eased.
- A rangebound performance is expected from the US Dollar ahead of the release of the United States Durable Goods Orders.
- Gold price is auctioning in a Symmetrical Triangle pattern that conveys a volatility contraction.
Gold price (XAU/USD) is struggling to shift its auction above the psychological resistance of $2,000.00 in the Asian session. The precious metal showed a stellar rally on Tuesday as investors hid behind bullions to safeguard themselves from renewed banking jitters.
The quarterly earnings report of First Republic Bank showed that customers’ deposits have dropped significantly than estimates and the commercial bank has to rely on outside funds for disbursement of advances, which will come at a higher interest rate and will impact its Net Interest Margins (NIMs).
However, investors have started digesting renewed banking woes and are moving funds into the S&P500 futures. The 500-US stocks basket futures have added immense gains in the Asian session, portraying a solid recovery in the risk appetite of the market participants. Meanwhile, the 10-year US Treasury yields have also rebounded to 3.41%.
The US Dollar Index (DXY) is consolidating above 101.80 after a minor correction and is expected to continue its rangebound performance ahead of the release of the United States Durable Goods Orders (March) data. As per the estimates, monthly economic data will expand by 0.8% vs. a contraction of 1.0%.
Gold technical analysis
Gold price is auctioning in a symmetrical triangle chart pattern on an hourly scale, which indicates a sheer volatility contraction. The upward-sloping trendline of the triangle is placed from April 21 low at $1,971.62 while the downward-sloping trendline is plotted from April 20 high at $2,012.44. The Gold price is still above the 50-period Exponential Moving Average (EMA) at $1,992.32, which indicates that the upside bias is still solid.
A 40.00-60.00 range oscillation by the Relative Strength Index (RSI) (14) indicates that investors are awaiting a potential trigger.
Gold hourly chart
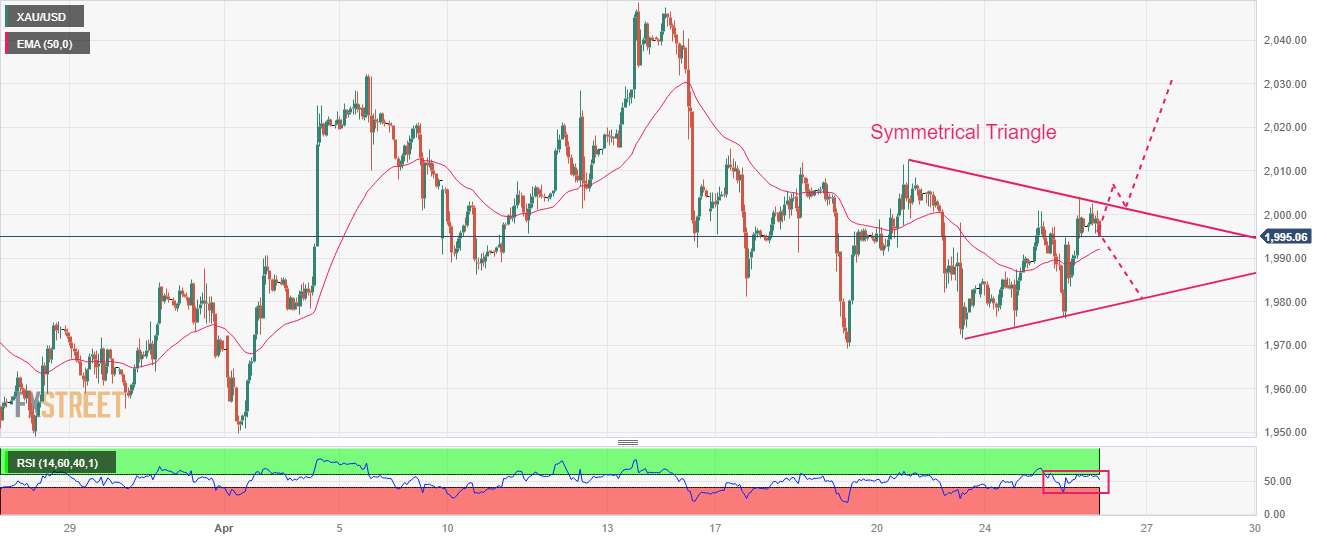
-
04:02
USD/MXN Price Analysis: Mexican Peso bears retreat from 100-SMA, 18.00 in focus
- USD/MXN prints mild losses to consolidate the biggest daily jump in three weeks.
- Failure to cross 100-SMA appears less lucrative for Mexican Peso buyers unless slipping below previous resistance line from early April.
- 200-SMA, seven-week-long ascending trend line are the key levels to follow clear directions.
USD/MXN drops to 18.05 as it pares the longest daily run-up in three weeks amid Wednesday’s sluggish morning. In doing so, the Mexican Peso (MXN) pair retreats from a one-week high after snapping a four-day downtrend the previous day.
That said, the 100-SMA hurdle of around 18.10 by the press time guards the immediate recovery of the USD/MXN pair.
However, the pair buyers remain hopeful amid the upbeat RSI (14) line unless the quote defies Tuesday’s break of a three-week-old resistance line, now immediate support near 18.00.
Even if the USD/MXN sellers manage to conquer the 18.00 resistance-turned-support, an upward-sloping support line from early March, close to 17.94 at the latest, becomes crucial for them to break.
Meanwhile, an upside break of the 100-SMA hurdle of 18.10 isn’t an open invitation to the USD/MXN bulls as the 200-SMA level of 18.30 and the monthly high surrounding 18.40 can challenge the USD/MXN bulls afterward.
In a case where the Mexican Peso bears keep the reins past 18.40, the late March swing high of around 18.80 and the 19.00 round figure could lure the traders.
USD/MXN: Four-hour chart
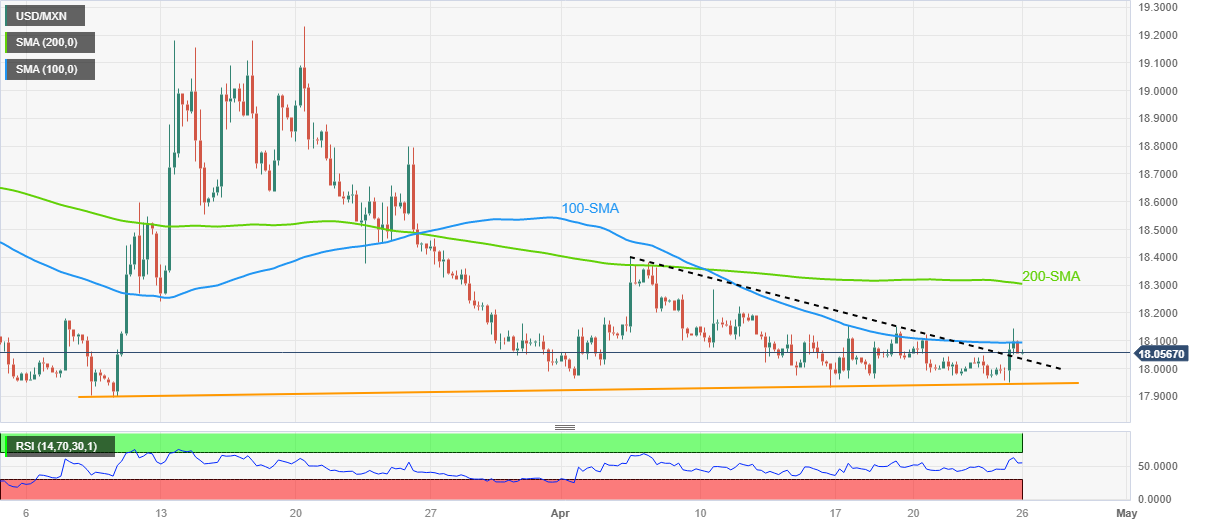
Trend: Limited downside expected
-
03:41
USD/JPY Price Analysis: Yen bears appear well set to refresh weekly low around 132.90
- USD/JPY fades bounce off eight-day low as 50-DMA challenges corrective bounce.
- Impending bear cross on MACD, steady RSI favor continuation of the latest downside.
- 100-DMA, 3.5-month-old ascending trend line appear tough nuts to crack for Yen pair sellers.
USD/JPY drops back towards the lowest levels in a week, mildly offered near 133.55 by the press time, as it defends the previous day’s downside break of the 50-DMA amid early Wednesday.
Adding strength to the bearish bias is the steady RSI (14) line around the 50.00 level, as well as the looming bear cross on the MACD indicator.
With this, the Yen pair is all set to revisit the eight-day low marked on Tuesday around 133.35. However, the 100-DMA support of near 132.90 could challenge the USD/JPY bears afterward.
In a case where the quote remains bearish past 132.90, an upward-sloping support line from the mid-January, close to 131.90 by the press time, will be the last defense of the Yen pair buyers as a break of which could open doors for the pair’s fall towards the yearly low of near 127.20.
Alternatively, a daily closing beyond the 50-DMA level of 133.80 becomes necessary for the USD/JPY buyers to take the risk of fresh entry.
Even so, the latest swing high around 135.15 and a horizontal area comprising multiple levels marked since November 2022, surrounding 133.45-70, will be a tough nut to crack for the Yen pair bulls.
To sum up, USD/JPY remains on the bear’s radar with the 50-DMA breakdown.
USD/JPY: Daily chart
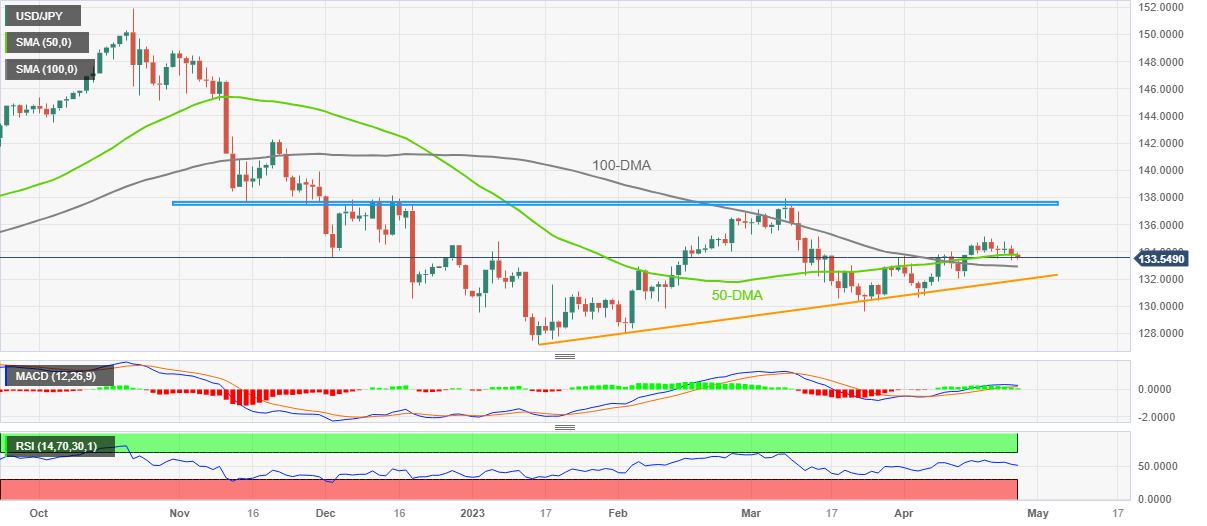
Trend: Further downside expected
-
03:30
Commodities. Daily history for Tuesday, April 25, 2023
Raw materials Closed Change, % Silver 25.006 -0.65 Gold 1996.6 0.23 Palladium 1493.93 -2.71 -
03:16
S&P500 Futures, yields stabilize ahead of US Durable Goods Orders, banking woes, US debt ceiling talks eyed
- Market slips into consolidation phase after heavy risk aversion.
- S&P500 Futures pare the biggest daily loss in a month, yields prod two-day downtrend.
- First Republican Bank renews fears of banking fallouts, US Treasury Secretary Yellen flags fears of “catastrophic” default.
- US data, risk catalysts are the key as sour sentiment underpins US Dollar, Gold and Yen demand.
Risk appetite improves early Wednesday, following a pessimistic day in the financial markets, mainly led by the banking fears as US default woes.
While portraying the mood, the S&P 500 Futures print mild gains around 4,115 as it pares the biggest daily loss in a month. However, the US 10-year Treasury bond yields prod a two-day downtrend while the US two-year bond coupons remain pressured. That said, the US Dollar Index (DXY) remains indecision around 101.85 after snapping a three-day downtrend while the prices of Gold and WTI crude oil remain slightly positive.
That said, the latest fears emanating from the First Republic Bank (FRB) and the US debt ceiling discussion appear the major driver of the market even as the traders lick their wounds ahead of the key US Durable Goods Orders for March of late.
The FRB renewed the woes of banking fallouts by flashing disappointing earnings reports and the executives’ resistance in taking questions, not to forget mentioning the absence of earnings guidance. However, the major central banks tried to restore market confidence by curtailing the US Dollar operations initiated during the first wave of the banking crisis. “The world's top central banks are cutting the frequency of their dollar liquidity operations with the U.S. Federal Reserve from May, sending the clearest signal yet that last month's financial market volatility is essentially over,” said Reuters.
Elsewhere, the US policymakers’ inability to agree on the key debt ceiling as the expiration looms in June also roils the market sentiment. On Tuesday, US Treasury Secretary Janet Yellen warned that failure by Congress to raise the government's debt ceiling–and the resulting default–would trigger an "economic catastrophe" that would send interest rates higher for years to come, per Reuters.
On a different page, the US statistics have been mixed and contribute to the uncertainty surrounding the Federal Reserve’s (Fed) future moves, which in turn strengthen the market’s downbeat bias, despite the latest cautious optimism. That said, US Conference Board's Consumer Confidence Index edged lower to 101.3 for April, versus 104.0 prior. Additional details of the publication stated that the Present Situation Index ticked up to 151.1 during the said month from 148.9 prior whereas the Consumer Expectations Index dropped to 68.1 from 74 previous readings. Further, the one-year consumer inflation expectations eased to 6.2% in April from 6.3% in March. In a different release, the US New Home Sales rose to 0.683M MoM in March versus 0.634 expected and 0.623M revised prior while the S&P/Case-Shiller Home Price Indices and Housing Price Index both rose past market forecast to 0.4% and 0.5% respectively for February.
Moving on, the US Durable Goods Orders for March, expected to improve to 0.8% versus -1.0% prior, will be important for market forecasts.
Also read: Forex Today: Risk aversion lifts the Yen and the US Dollar
-
02:54
AUD/JPY drops heavily below 88.40 on mixed Australian Inflation, BoJ policy eyed
- AUD/JPY has surrendered the crucial support of 88.40 despite Australian Inflation data missed estimates.
- A further softening of Australian inflation will allow the RBA to keep rates steady.
- BoJ Ueda needs to continue the expansionary monetary policy to trigger domestic demand.
The AUD/JPY pair has slipped sharply below 88.40 despite the Australian Consumer Price Index (CPI) data having landed higher than estimates but has remained lower than prior releases. The Australian Bureau of Statistics has reported that quarterly CPI (Q1) has accelerated by 1.4% at a higher pace as expected by the market participants but lower than the former pace of 1.9%. Annual inflation has softened to 7.0%, a little higher than the estimates of 6.9% but lower than the prior release of 7.8%.
The monthly CPI indicator which has already softened heavily from its peak of 8.4% recorded in December has decelerated further to 6.1% from the consensus of 6.6% and the previous release of 6.8%.
A significant deceleration in Australian inflation is going to support the Reserve Bank of Australia (RBA) to stay with the decision of keeping interest rates unchanged at 3.60%, as announced in April’s monetary policy meeting. Therefore, the odds of maintenance of a status quo by the RBA in its May policy meeting are extremely high.
On the Japanese Yen front, the interest rate decision from the Bank of Japan (BoJ), scheduled for Friday will be the key event. To assure inflation above 2%, new BoJ Governor Kazuo Ueda needs to continue the expansionary monetary policy to trigger the domestic demand. BoJ Ueda cited on Monday that the impact of higher import prices has been passed on in the economy more than anticipated, therefore, to keep inflationary pressures steady a continuation of ultra-loose monetary policy is highly required.
-
02:41
AUD/USD whipsaws 20 pips above 0.6600 on easy Australia inflation, US Durable Goods Orders eyed
- AUD/USD renews six-week low near 0.6600 despite mixed Aussie inflation data.
- Australia Q1 CPI crosses downbeat forecasts, RBA Trimmed Mean CPI disappoints.
- Concerns about First Republic Bank, US debt ceiling expiration exert downside pressure on risk barometer pair.
- US Durable Goods Orders, risk catalysts are the key for clear directions.
AUD/USD marks a swift move of around 20 pips while refreshing the six-week low on mostly downbeat Australian inflation data during early Wednesday. That said, the Aussie pair initially dropped to 0.6611 before recently poking 0.6630 as traders turn cautious ahead of the key US Durable Goods Orders for March.
Australia’s Monthly CPI drops to 6.1% YoY in March versus 6.6% expected and 6.8% prior, confirming policymakers’ latest claims of easing inflation pressure due to higher rates. On the same line, the Q1 CPI also eased to 1.4% QoQ from 1.9% in previous readings but crossed the 1.3% market forecasts. Further, the RBA Trimmed Mean CPI declines below 1.4% consensus and 1.7% prior to 1.2% QoQ in the first quarter (Q1).
Also read: Breaking: Australia Q1 RBA trimmed mean CPI +1.2% QoQ misses expectations
Apart from the mostly downbeat Aussie inflation data, the latest fears emanating from the First Republic Bank (FRB) and the US debt ceiling discussion also weigh on the AUD/USD prices.
On Tuesday, the FRB’s disappointing earnings reports joined the executives’ resistance in taking questions and no earnings guidance to trigger a fresh wave of banking jitters. Even so, the major central banks tried to restore market confidence by curtailing the US Dollar operations initiated during the first wave of the banking crisis. “The world's top central banks are cutting the frequency of their dollar liquidity operations with the U.S. Federal Reserve from May, sending the clearest signal yet that last month's financial market volatility is essentially over,” said Reuters.
Furthermore, US Treasury Secretary Janet Yellen warned that failure by Congress to raise the government's debt ceiling–and the resulting default–would trigger an "economic catastrophe" that would send interest rates higher for years to come, per Reuters.
It should be noted that the mostly upbeat US data also keep the AUD/USD pair sellers hopeful, especially amid the Reserve Bank of Australia’s (RBA) dovish bias. On Tuesday, US Conference Board's Consumer Confidence Index edged lower to 101.3 for April, versus 104.0 prior. Additional details of the publication stated that the Present Situation Index ticked up to 151.1 during the said month from 148.9 prior whereas the Consumer Expectations Index dropped to 68.1 from 74 previous readings. Further, the one-year consumer inflation expectations eased to 6.2% in April from 6.3% in March. In a different release, the US New Home Sales rose to 0.683M MoM in March versus 0.634 expected and 0.623M revised prior while the S&P/Case-Shiller Home Price Indices and Housing Price Index both rose past market forecast to 0.4% and 0.5% respectively for February.
It should be observed, however, that the recent gains of the S&P 500 Futures and a pause in the US Treasury bond yields’ downside prod the AUD/USD bears.
Having witnessed the initial reaction to Australia’s headline inflation numbers, the AUD/USD pair traders should closely observe the risk catalysts for clear directions ahead of the US Durable Goods Orders for March, expected to improve to 0.8% versus -1.0% prior.
Technical analysis
The AUD/USD pair’s sustained downside break of a 1.5-month-old support line, now immediate resistance near 0.6655, joins bearish MACD signals to keep the Aussie pair sellers hopeful. Even so, a one-month-old horizontal support area near 0.6620-25 challenges the immediate downside of the Aussie pair.
-
02:33
Breaking: Australia Q1 RBA trimmed mean CPI +1.2% QoQ misses expectations
The quarterly Consumer Price Index (CPI) published by the Australian Bureau of Statistics is out as follows:
- Australia q1 RBA trimmed mean CPI +1.2 pct QoQ (Reuters poll +1.4 pct).
- Q1 CPI (all groups) +1.4 pct QoQ (Reuters poll +1.3 pct).
- Q1 RBA weighted median CPI +1.2 pct QoQ (Reuters poll +1.3 pct).
- Q1 RBA trimmed mean CPI +6.6 pct YoY (Reuters poll +6.7 pct).
- Q1 CPI (all groups) +7 pct YoY (Reuters poll +6.9 pct).
- Q1 RBA weighted median CPI +5.8 pct YoY (Reuters poll +5.9 pct).
AUD/USD update
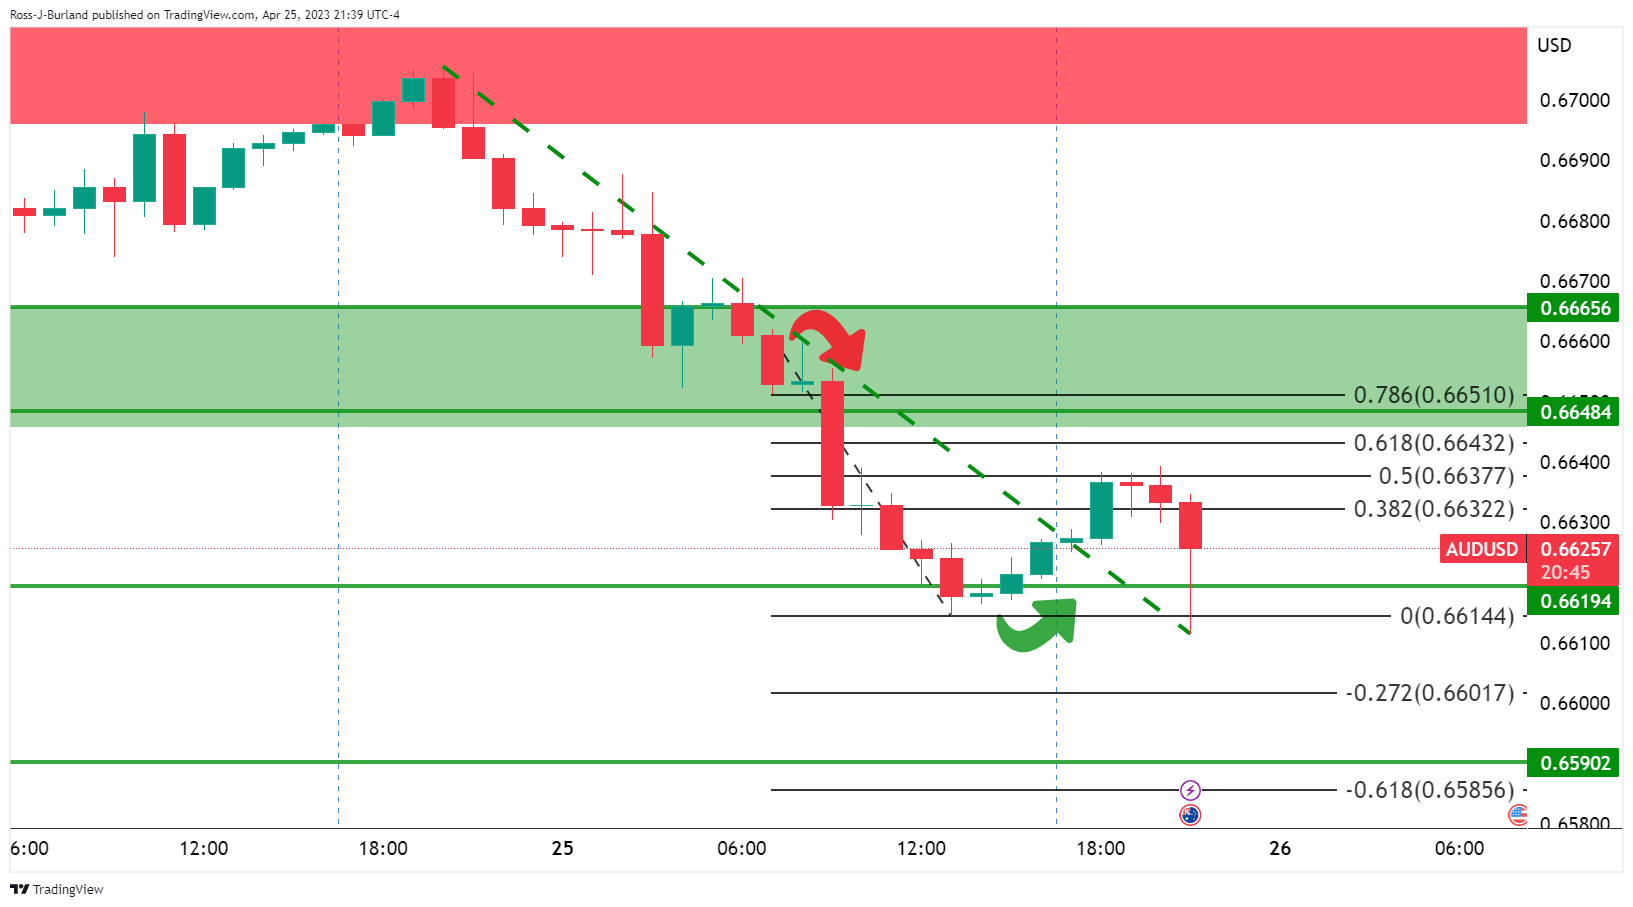
The price was rejected at the 50% mean reversion mark ahead of the data and was forced lower on the outcome from the 38.2% Fibonacci area to a fresh low in the bear cycle at 0.6611.
About Australia´s Consumer Price Index
The quarterly Consumer Price Index (CPI) published by the Australian Bureau of Statistics (ABS) has a significant impact on the market and the AUD valuation. The gauge is closely watched by the Reserve Bank of Australia (RBA), in order to achieve its inflation mandate, which has major monetary policy implications. Rising consumer prices tend to be AUD bullish, as the RBA could hike interest rates to maintain its inflation target. The data is released nearly 25 days after the quarter ends.
-
02:31
Australia Consumer Price Index (QoQ) registered at 1.4% above expectations (1.3%) in 1Q
-
02:31
Australia RBA Trimmed Mean CPI (YoY) below expectations (7.2%) in 1Q: Actual (6.6%)
-
02:30
Australia RBA Trimmed Mean CPI (QoQ) below expectations (1.4%) in 1Q: Actual (1.2%)
-
02:30
Australia Consumer Price Index (YoY) above expectations (6.9%) in 1Q: Actual (7%)
-
02:29
NZD/USD Price Analysis: Declines towards 0.6100 as RBNZ looks back to policy easing
- NZD/USD has shown a pullback move to near 0.6147 after a three-day low of 0.6133, however, the downside seems favored.
- The RBNZ has considered the qualitative easing proposal amid lower risks to financial stability.
- NZD/USD witnessed a steep fall after a mean-reversion move to near the 50-period EMA around 0.6180.
The NZD/USD pair has displayed a pullback move to near 0.6147 after a three-day low of 0.6133 in the Tokyo session. The Kiwi asset might see a conclusion of pullback move sooner as the Reserve Bank of New Zealand’s (RBNZ) proposal to loosen the loan-to-value ratio (LVR) restrictions has delivered an approach of consideration of easing monetary policy.
RBNZ has considered the qualitative easing proposal citing that current restrictions may be unnecessarily reducing efficiency as risks to financial stability are lower.
The US Dollar Index (DXY) has shown some recovery after a corrective move to near 101.80. Pre-Federal Reserve (Fed) interest rate policy anxiety is kicking in and is improving the appeal for the US Dollar as a safe-haven asset.
NZD/USD witnessed a steep fall after a mean-reversion move to near the 50-period Exponential Moving Average (EMA) around 0.6180 on a four-hour scale. The Kiwi asset has continued its downside journey and is expected to meet critical supports placed at April 21 and March 08 low at 0.6126 and 0.6088 respectively.
A downside momentum will be triggered if the Relative Strength Index (RSI) (14) gets slipped into the bearish range of 20.00-40.00.
Going ahead, a breakdown of April 24 low at 0.6125 will drag the asset toward March 08 low at 0.6088 followed by the 15 Nov 2022 low at 0.6058.
Alternatively, an upside move above April 24 high at 0.6168 will drive the Kiwi asset toward the round-level resistance at 0.6200. A breach of the latter will allow the Kiwi to report a fresh weekly high above April 19 high at 0.6227.
NZD/USD four-hour chart
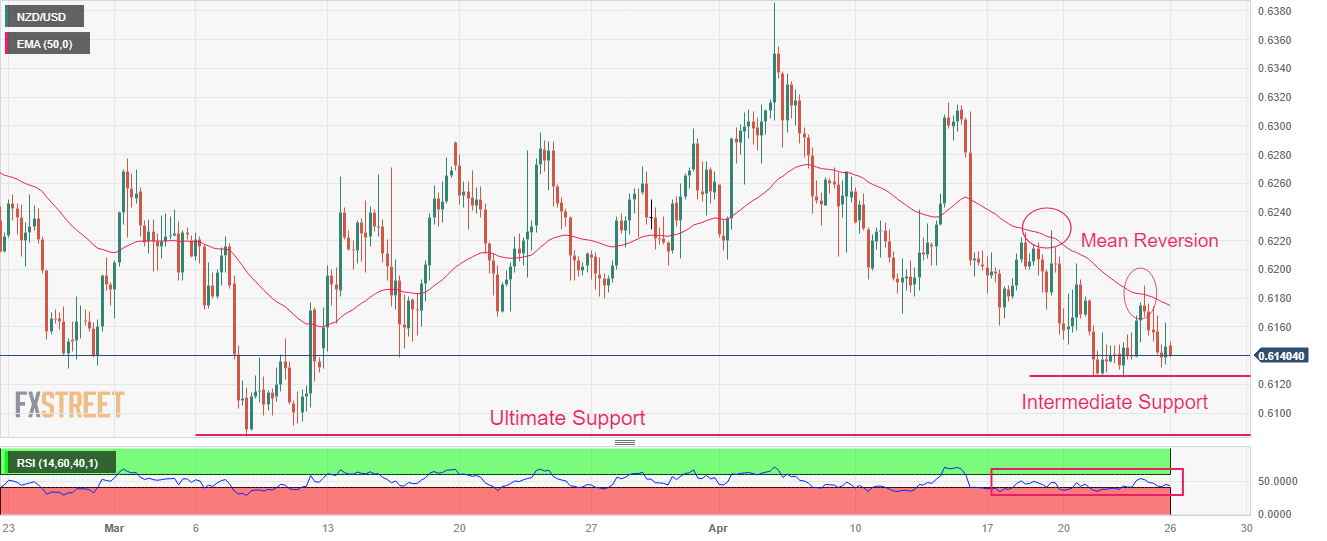
-
02:17
USD/CNY fix: 6.9237 against the last close of 6.9323
In recent trade today, the People’s Bank of China (PBOC) set the yuan at 6.9237 against the last close of 6.9323.
About the fix
China maintains strict control of the yuan’s rate on the mainland.
The onshore yuan (CNY) differs from the offshore one (CNH) in trading restrictions, this last one is not as tightly controlled.
Each morning, the People’s Bank of China (PBOC) sets a so-called daily midpoint fix, based on the yuan’s previous day's closing level and quotations taken from the inter-bank dealer.
-
02:14
USD/CAD grinds higher past 1.3600 as sluggish Oil price jostles with banking, US default concerns
- USD/CAD seesaws around the highest level in a month after rising the most in seven weeks.
- Markets consolidate the previous day’s moves ahead of the key US data amid central banks’ efforts to restore confidence.
- Worrisome earnings from First Republic Bank, indecision over US debt ceiling underpin Loonie pair’s latest run-up.
- WTI licks its wounds ahead of weekly Oil inventory data.
USD/CAD struggles to extend the biggest daily gains in seven weeks as it makes rounds to 1.3620-30 during early Wednesday. In doing so, the Loonie pair seems to take clues from the latest pause in the Oil price downside, Canada’s main export, as well as the market’s consolidation ahead of the key US Durable Goods Orders for March. However, fresh fears surrounding the bank fallouts and the US debt ceiling expiration keep the Loonie pair buyers hopeful, especially amid the Bank of Canada’s (BoC) comparatively dovish bias than the Federal Reserve (Fed).
The Loonie pair jumped to the highest levels in one month the previous day as the US Dollar cheered the broad risk-off mood, as well as mostly upbeat US data. That said, headlines surrounding the First Republic Bank (FRB) and the US debt ceiling discussion propelled the risk aversion the previous day, which in turn underpinned the US Dollar’s haven demand and weighed on the WTI price.
It’s worth noting that the WTI crude oil remains pressured around $77.00 after falling to the lowest levels in three weeks on Tuesday. The black gold’s latest pause in further downside could be linked to the sluggish markets and cautious mood before the key US data and weekly Oil inventories from the US Energy Information Administration (EIA).
Talking about the risks, Wall Street closed in the red while the US Treasury bond yields remained downbeat as the First Republic Bank’s (FRB) disappointing earnings reports joined the executives’ resistance in taking questions and no earnings guidance to trigger a fresh wave of banking jitters. Even so, the major central banks tried to restore market confidence by curtailing the US Dollar operations initiated during the first wave of the banking crisis. “The world's top central banks are cutting the frequency of their dollar liquidity operations with the U.S. Federal Reserve from May, sending the clearest signal yet that last month's financial market volatility is essentially over,” said Reuters.
On the other hand, fears of US debt ceiling expiration also weigh on the risk appetite as the current limit expires in June. That said, US Treasury Secretary Janet Yellen warned that failure by Congress to raise the government's debt ceiling–and the resulting default–would trigger an "economic catastrophe" that would send interest rates higher for years to come, per Reuters.
It’s worth noting that mostly upbeat US data also favored the USD/CAD buyers. On Tuesday, US Conference Board's Consumer Confidence Index edged lower to 101.3 for April, versus 104.0 prior. Additional details of the publication stated that the Present Situation Index ticked up to 151.1 during the said month from 148.9 prior whereas the Consumer Expectations Index dropped to 68.1 from 74 previous readings. Further, the one-year consumer inflation expectations eased to 6.2% in April from 6.3% in March. In a different release, the US New Home Sales rose to 0.683M MoM in March versus 0.634 expected and 0.623M revised prior while the S&P/Case-Shiller Home Price Indices and Housing Price Index both rose past market forecast to 0.4% and 0.5% respectively for February.
Technical analysis
A clear upside break of the 50-DMA hurdle, now immediate support near 1.3575, joins bullish MACD signals to direct USD/CAD buyers towards a downward-sloping resistance line from early March, close to 1.3675 at the latest.
-
02:05
BoJ Kazuo Ueda: Risk of rise in inflation driven by lost of market trust in Japan's finances low for now
Bank of Japan´s governor Kazuo Ueda is speaking in Parliament and the following comments are coming across the wires:
Key comments
Monetary easing is not aimed at funding government spending.
Consideration towards govt's debt-financing cost won't constrain necessary monetary policy moves.
Dealing with cost-push inflation with monetary policy is very difficult, it's about striking balance between need to curb inflation and supporting economy.
Cost-push inflation driven by rising raw material costs seems to be subsiding in Japan.
Risk of rise in inflation driven by lost of market trust in Japan's finances low for now.In general, dealing with cost-push inflation is very difficult for central banks. On the one hand, you'd like to curb inflation. On the other hand, you don't want to tighten monetary policy knowing that cost-push inflation will cool the economy." Ueda told parliament.
"Striking the right balance is very difficult. It depends on economic developments at the time, including where inflation stood at the outset."
-
02:00
GBP/USD bears could be looking to guard the 1.2420s
- GBP/USD bears are lurking near a potential key resistance area.
- Eyes on a break of structure to the downside on renewed US Dollar strength.
GBP/USD is currently correcting towards a 38.2% Fibonacci retracement level near the 1.2420s as it takes on resistance while the Greenback gives some ground back following Tuesday´s resurgence.
Market sentiment turned risk-averse amid worries about earnings in the banking sector especially which drove the US Dollar higher. The DXY index, which measures the US dollar vs. a basket of currencies, benefitted from the related risk-off flows and touched a high of 101.949.
Plunging deposits at First Republic Bank have reignited worries over the health of the banking sector. Additionally, UBS reported a 52% slide in quarterly income as it prepared to swallow fallen rival Credit Suisse. Meanwhile, a weak consumer confidence report added to the rout in stocks on Wall Street as did the decline in Federal Reserve manufacturing data, supporting the US Dollar for its safe haven qualities.
Meanwhile, analysts at Brown Brothers Harriman explained that the Bank of England Deputy Governor Broadbent defended the bank’s policies. ´´Specifically,´´ the analysts said, ´´he said that the BOE’s QE program during the pandemic was not responsible for current high inflation shock. Broadbent noted that “QE inevitably leads to rapid growth of commercial bank deposits … and that this, in turn, inevitably leads to excessive inflation are not well supported by the evidence.” He added that it was “difficult to see these additional deposits as the principal cause of the inflation that’s followed” and that “very large jumps” in import prices such as energy, “seem the more likely cause.” We concur. Massive waves of QE in the wake of the financial crisis and then the eurozone crisis did not spark inflation.´´
The analysts anticipate another 25 bp hike June 22 is around 80% priced, while odds of one last 25 bp hike top out near 75% for September 21 and so the peak policy rate is seen near 5.0% vs. 4.75% at the start of last week and between 4.50-4.75% at the start of the week before that.
GBP/USD technical analysis
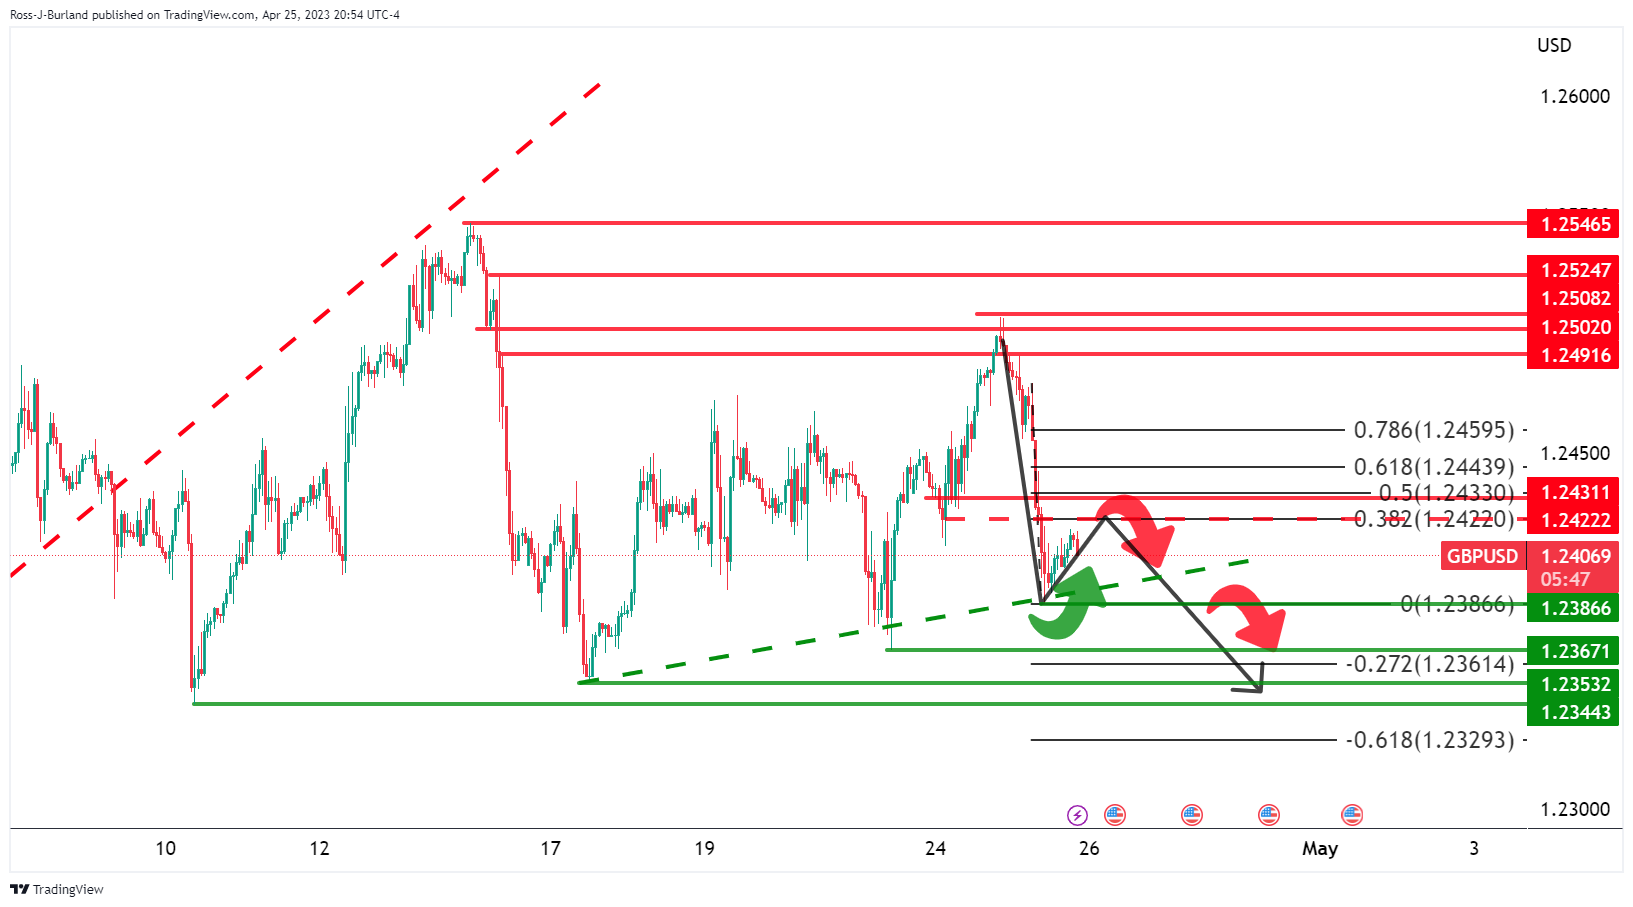
The price is correcting back into what would be a potential resistance area before what could evolve into a downward continuation.
-
01:56
EUR/USD faces resistance around 1.0980 after a less-confident recovery, US GDP eyed
- EUR/USD has struggled while extending its recovery above 1.0980 amid an overall downbeat market mood.
- The USD Index has turned sideways after a corrective move to near 101.80 ahead of US GDP data.
- The ECB is expecting inflation to decline to 2% in late 2024.
The EUR/USD pair is facing barricades around 1.0980 after a short-lived pullback move from 1.0965 in the Asian session. The major currency pair was heavily dumped by the market participants amid a stellar recovery in the US Dollar Index (DXY). Investors are pumping money into the USD Index amid anxiety ahead of the monetary policy by the Federal Reserve (Fed), which is due next week.
S&P500 futures have added significant gains in the Asian session. The 500-US stocks basket witnessed an intense sell-off on Tuesday after vulnerable quarterly earnings from the First Republic Bank renewed fears of a banking fiasco. The United States commercial bank reported a steep decline in deposits from customers, which forced it to rely on external borrowings that come with heavy interest tags. Significant gains added in S&P500 futures in early Asia indicate a recovery in the risk appetite of the market participants.
The US Treasury yields have also rebounded as a recovery in the S&P500 futures has impacted demand for US government bonds. The 10-year US Treasury yields have scaled to near 3.42%.
The USD Index has turned sideways after a corrective move to near 101.80. This week, US Gross Domestic Product (GDP) data will remain in the spotlight. Annualized GDP (Q1) is expected to decelerate to 2.0% from the former release of 2.6%. This would indicate a slowdown in the US economy must be due to higher interest rates from the Fed.
On the Eurozone front, European Central Bank (ECB) Governing Council member and Bank of France head Francois Villeroy de Galhau said on Tuesday, “Inflation will probably come down towards 2% at the end of 2024.” He further added, “Food price inflation will start to ease in 2h 2023.”
-
01:54
Natural Gas Price Analysis: XAG/USD rebound appears elusive below $2.53-54 resistance confluence
- Natural Gas price picks up bids to pare the biggest daily loss in a week.
- Clear downside break of short-term key support favors XNG/USD sellers.
- One-week-old horizontal area, support-turned-resistance line highlights $2.53-54 key hurdle.
- Immediate DMAs challenge Natural Gas sellers ahead of crucial $2.13-11 support zone.
Natural Gas (XNG/USD) price prints mild gains around $2.43 amid early Wednesday’s sluggish session, after snapping a three-day uptrend the previous day. In doing so, the energy instrument also pares the biggest daily loss in a week amid bullish MACD signals and a steady RSI (14) line. With this, the XNG/USD is likely to witness further recovery.
However, a convergence of the previous support line from April 14 and a one-week-old horizontal area comprising the previous weekly tops, around $2.53-54, appears a tough nut to crack for the Natural Gas buyers to crack.
Following that, a run-up towards the mid-March swing high of around $2.75 and then to the $3.00 round figure can’t be ruled out.
In a case where the XNG/USD remains firmer past $3.00, the previous monthly high close to $3.07 will be in the spotlight.
On the flip side, the 10-DMA and the 21-DMA put a floor under the Natural Gas price around $2.38 and $2.30 respectively.
Should the XNG/USD bears keep the reins past $2.30, a horizontal area comprising multiple lows marked since February, near $2.13-11, can act as the last defense of the Natural Gas buyers.
Natural Gas Price: Daily chart
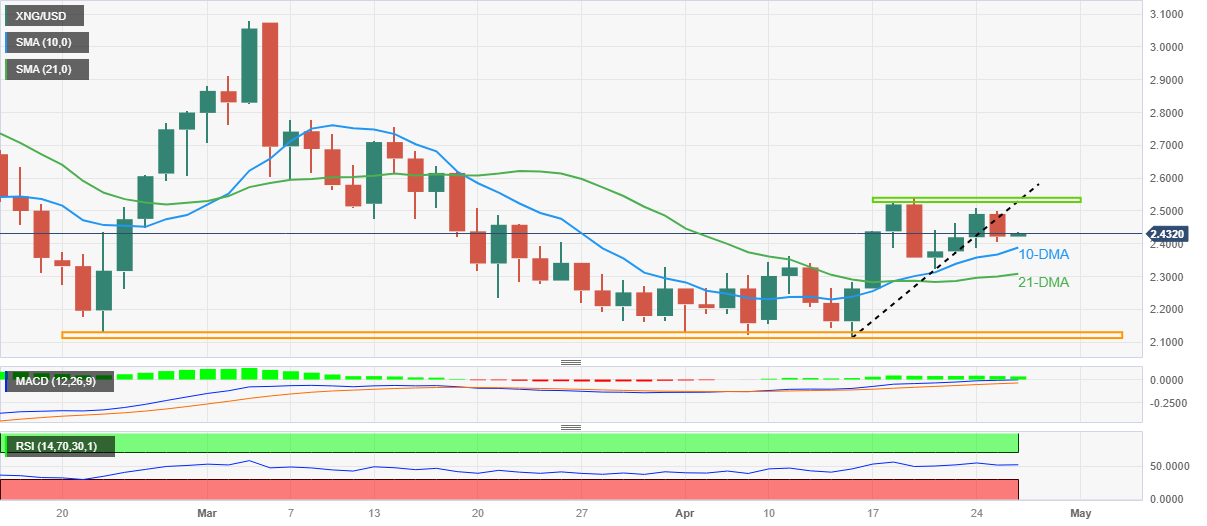
Trend: Further recovery expected
-
01:30
Stocks. Daily history for Tuesday, April 25, 2023
Index Change, points Closed Change, % NIKKEI 225 26.55 28620.07 0.09 Hang Seng -342.06 19617.88 -1.71 KOSPI -34.48 2489.02 -1.37 FTSE 100 -21.07 7891.13 -0.27 DAX 8.18 15872.13 0.05 CAC 40 -42.25 7531.61 -0.56 Dow Jones -344.57 33530.83 -1.02 S&P 500 -65.41 4071.63 -1.58 NASDAQ Composite -238.04 11799.16 -1.98 -
01:29
When is Australia inflation data and how could it affect AUD/USD?
Overview
Australia’s first quarter (Q1) and Monthly Consumer Price Index (CPI) for March, scheduled for publishing on early Wednesday around 00:30 GMT, appear the crucial data for the AUD/USD pair traders to watch. The reason could be linked to the Reserve Bank of Australia’s (RBA) recent pause in the rate hike trajectory.
Forecasts suggest that the Monthly CPI is expected to ease to 6.6% YoY versus 6.8% prior, confirming policymakers’ latest claims of easing inflation pressure due to higher rates. On the same line, the Q1 CPI is likely to ease to 1.3% QoQ from 1.9% in previous readings.
However, the RBA Trimmed Mean CPI is likely to increase to 7.2% YoY during the first quarter, versus 6.9% prior, which in turn can surprise the markets and the AUD/USD pair traders.
Ahead of the release, Analysts at the ANZ said,
We’re expecting headline CPI inflation to fall sharply to 6.9% from a peak of 7.8% in Q4, although we expect the trimmed mean measure will prove sticky, declining only marginally to 6.8% from 6.9%. With the market undecided on whether or not the RBA will hike again, these data will be closely watched. We are forecasting a final 25bp hike from the RBA in August.
How could AUD/USD react to the news?
AUD/USD prints mild gains around 0.6635 as it consolidates the previous day’s heavy losses, the biggest in eight days, amid a sluggish session heading into the key Aussie data.
In doing so, the Aussie pair also seems to prepare for a negative surprise from the Aussie data.
As a result, upbeat data may only provide a knee-jerk reaction to the AUD/USD prices while defending the overall bearish trend unless marking a heavy positive surprise, which is less expected.
Technically, the AUD/USD pair’s sustained downside break of a 1.5-month-old support line, now immediate resistance near 0.6655, joins bearish MACD signals to keep the Aussie pair sellers hopeful.
Key notes
AUD/USD Price Analysis: Corrective bounce seeks acceptance from 0.6655 hurdle and Australia inflation
AUD/USD defends 0.6600 ahead of Australian Inflation and US Durable Goods Orders data
AUD/USD Forecast: Aussie tumbles on risk aversion, likely to challenge 0.6600
About Aussie Consumer Price Index
The quarterly Consumer Price Index (CPI) published by the Australian Bureau of Statistics (ABS) has a significant impact on the market and the AUD valuation. The gauge is closely watched by the Reserve Bank of Australia (RBA), in order to achieve its inflation mandate, which has major monetary policy implications. Rising consumer prices tend to be AUD bullish, as the RBA could hike interest rates to maintain its inflation target. The data is released nearly 25 days after the quarter ends.
-
01:20
AUD/USD Price Analysis: Corrective bounce seeks acceptance from 0.6655 hurdle and Australia inflation
- AUD/USD pares the biggest daily loss in eight days with minor gains.
- One-month-old horizontal support, oversold RSI (14) put a floor under Aussie prices.
- Six-week-long previous support line guards recovery moves ahead of Australia CPI for Q1 and March.
AUD/USD prints mild gains around 0.6630 as it consolidates the biggest daily loss in a week ahead of the Australia Consumer Price Index (CPI) amid early Wednesday. In doing so, the Aussie pair rebounds from a horizontal area comprising multiple levels marked since late March amid an oversold RSI (14) line.
The recovery moves, however, lack upside momentum amid bearish MACD signals. Also challenging the AUD/USD buyers is the quote’s sustained downside break of a 1.5-month-old previous support line, now immediate resistance near 0.6655. Furthermore, likely downbeat prints of Aussie inflation and the Reserve Bank of Australia’s (RBA) dovish bias keep the pair sellers hopeful.
Even so, the quote needs to provide a successful break of the aforementioned horizontal support surrounding 0.6620-25 to convince the AUD/USD bears.
Following that, the yearly low marked in March around 0.6565 will be in the spotlight.
Meanwhile, recovery moves need to cross the support-turned-resistance line of around 0.6655 to convince intraday buyers of the AUD/USD pair.
However, a downward-sloping resistance line from April 20 and the 200-SMA, respectively near 0.6680 and 0.6690, quickly followed by the 0.6700 round figure, could challenge the Aussie pair buyers afterward.
To sum up, AUD/USD remains on the bear’s radar even if the quote bounces off short-term key support.
AUD/USD: Four-hour chart
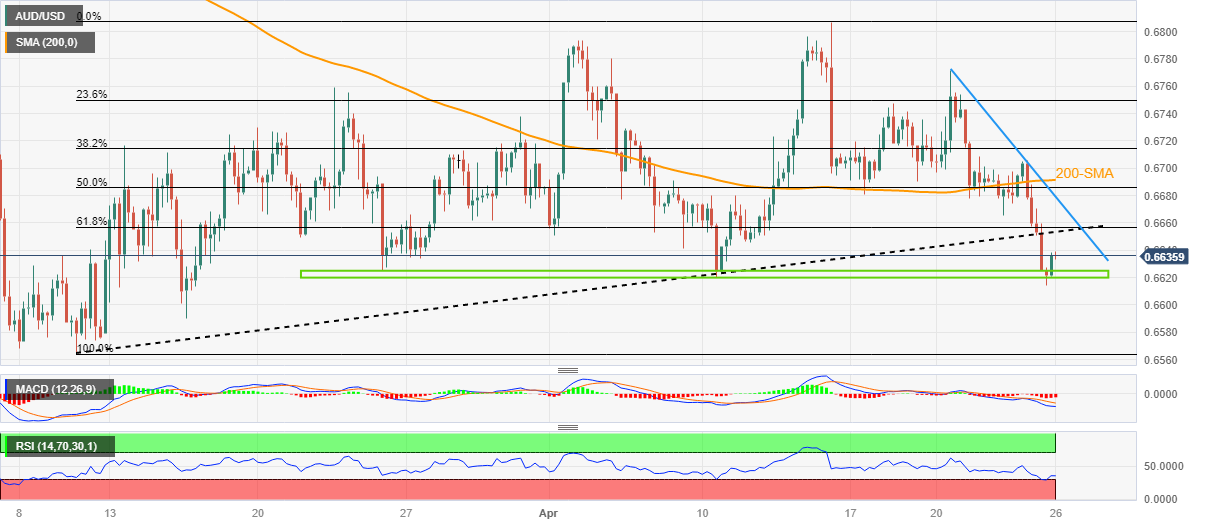
Trend: Limited upside expected
-
01:15
Currencies. Daily history for Tuesday, April 25, 2023
Pare Closed Change, % AUDUSD 0.66273 -1.03 EURJPY 146.766 -0.98 EURUSD 1.09735 -0.68 GBPJPY 165.949 -0.95 GBPUSD 1.24096 -0.63 NZDUSD 0.61383 -0.46 USDCAD 1.36238 0.63 USDCHF 0.89148 0.45 USDJPY 133.741 -0.31 -
01:14
WTI Price Analysis: Defends three-week support of $76.70 ahead of oil inventory data
- Oil price has turned sideways after defending three-week support of $76.70 ahead of UK EIA inventory data.
- Anticipation of more interest rate hikes from Western central banks is weighing heavily on oil prices.
- The USD Index has extended its correction to near 101.81 after a stellar upside move.
West Texas Intermediate (WTI), futures on NYMEX, have managed to find an intermediate cushion near three-week support of $76.70. The oil price is showing a sideways performance after defending the three-week low as investors are awaiting the release of the oil inventory data by the United States Energy Information Administration (EIA) for further guidance.
The US Dollar Index (DXY) has extended its correction to near 101.81 after a stellar upside move. A resumption for the upside move in the USD Index could impact the oil price further.
Meanwhile, the anticipation of more interest rate hikes from the Federal Reserve (Fed), the Bank of England (BoE), and the European Central Bank (ECB) to arrest stubborn inflation in their respective economies is weighing heavily on oil prices. Further interest rate hikes from Western central banks will trigger fears of economic slowdown and will eventually impact the oil demand.
The oil price witnessed a steep fall after dropping below the crucial support placed from April 03 low at $79.00, which is now acting as a barricade for bulls. The downside move in the black gold is expected to surrender entire gains generated after the surprise announcement of production cuts by OPEC+.
The 20-period Exponential Moving Average (EMA) at $77.75 is acting as a hurdle for the oil bulls.
Meanwhile, the Relative Strength Index (RSI) (14) has fallen back inside the bearish range of 20.00-40.00, advocating further weakness.
Going forward, a decisive downside below $75.00 will expose the oil price to March 30 low at $72.69 followed by the round-level support at $70.00.
On the flip side, a confident break above April 03 low at $79.00 will drive the oil price toward April 04 high at $81.80 and April 12 high at $83.40.
WTI two-hour chart
-638180647710217758.png)
-
01:01
Gold Price Forecast: XAU/USD bulls attack $2,000 amid banking, United States default woes
- Gold price ignores US Dollar recovery to rise ahead of the key United States data.
- First Republic Bank earnings, US debt ceiling drama propel risk aversion and XAU/USD price.
- US Treasury bond yields, Durable Goods Orders should be watched for intraday direction of the Gold price.
- US GDP, Federal Reserve’s favourite inflation gauge appears the key ahead of next week’s Federal Open Market Committee (FOMC).
Gold price (XAU/USD) stays on the front foot around $2,000 during a three-day winning streak amid early Wednesday. In doing so, the bright metal benefits from the risk aversion wave, mainly led by the fresh banking fears and woes surrounding the United States debt ceiling expiration, as well as the Federal Reserve’s (Fed) policy pivot. It’s worth noting that the XAU/USD run-up pays little heed to the US Dollar’s recent recovery ahead of the US Durable Goods Orders for March.
Gold price rises on sour sentiment, ignores US Dollar rebound
Gold price rises for the third consecutive day inside a one-month-old bullish trend channel as downbeat sentiment provides a tailwind to the XAU/USD’s haven demand.
Fresh fears of banking fallouts and US default weighed on the market sentiment and allowed the Gold Price to remain firmer amid a risk-off mood. However, the cautious mood ahead of today’s US Durable Goods Orders for March and major central banks’ efforts to restore the market’s confidence seems to challenge the XAU/USD buyers of late.
On Tuesday, the First Republic Bank’s (FRB) disappointing earnings reports joined the executives’ resistance in taking questions and no earnings guidance to trigger a fresh wave of banking jitters. Even so, the major central banks tried to restore market confidence by curtailing the US Dollar operations initiated during the first wave of the banking crisis. “The world's top central banks are cutting the frequency of their dollar liquidity operations with the U.S. Federal Reserve from May, sending the clearest signal yet that last month's financial market volatility is essentially over,” said Reuters.
Apart from the banking crisis, fears of US debt ceiling expiration also weigh on the risk appetite as the current limit expires in June. That said, US Treasury Secretary Janet Yellen warned that failure by Congress to raise the government's debt ceiling–and the resulting default–would trigger an "economic catastrophe" that would send interest rates higher for years to come, per Reuters.
Against this backdrop, Wall Street closed in the red and the US Treasury bond yields were down too, which in turn allowed the US Dollar Index (DXY) to snap a three-day downtrend.
Unimpressive United States data adds strength to XAU/USD
Apart from the risk aversion, the mixed United States economics also propel the Gold price. That said, US Conference Board's Consumer Confidence Index edged lower to 101.3 for April, versus 104.0 prior and Additional details of the publication stated that the Present Situation Index ticked up to 151.1 during the said month from 148.9 prior whereas the Consumer Expectations Index dropped to 68.1 from 74 previous readings. Further, the one-year consumer inflation expectations eased to 6.2% in April from 6.3% in March. In a different release, the US New Home Sales rose to 0.683M MoM in March versus 0.634 expected and 0.623M revised prior while the S&P/Case-Shiller Home Price Indices and Housing Price Index both rose past market forecast to 0.4% and 0.5% respectively for February.
Looking forward, sour sentiment and the downbeat United States Treasury bond yields can keep the Gold price firmer ahead of the US Durable Goods Orders for March, 0.8% expected and -1.0% prior.
Gold price technical analysis
Gold price rebounds from a lower line of the one-month-old ascending trend channel bullish formation, recently crossing the 21-DMA of late.
In addition to the break of the 21-DMA hurdle, currently around $1,997, mostly steady Relative Strength Index (RSI) line, placed at 14, adds strength to the bullish bias as it stays near the 50.0 level.
However, the bearish signals from the Moving Average Convergence and Divergence (MACD) indicator lure the XAU/USD sellers amid risk aversion.
That said, the $2,000 round figure and the recent top surrounding $2,050 may check the XAU/USD buyers before directing them to the aforementioned channel’s upper line, close to $2,055 at the latest.
Meanwhile, Gold bears need validation from the stated channel’s lower line, close to $1,983 by the press time to retake control.
Even so, February’s high of around $1,960 and the 50-DMA level near $1,925 can prod the Gold price declines. It’s worth noting that a rising trend line from November 2022, near $1,885, acts as the last defense of the XAU/USD bulls.
Overall, Gold price is likely to rise further but the road towards the north appears bumpy.
Gold price: Daily chart
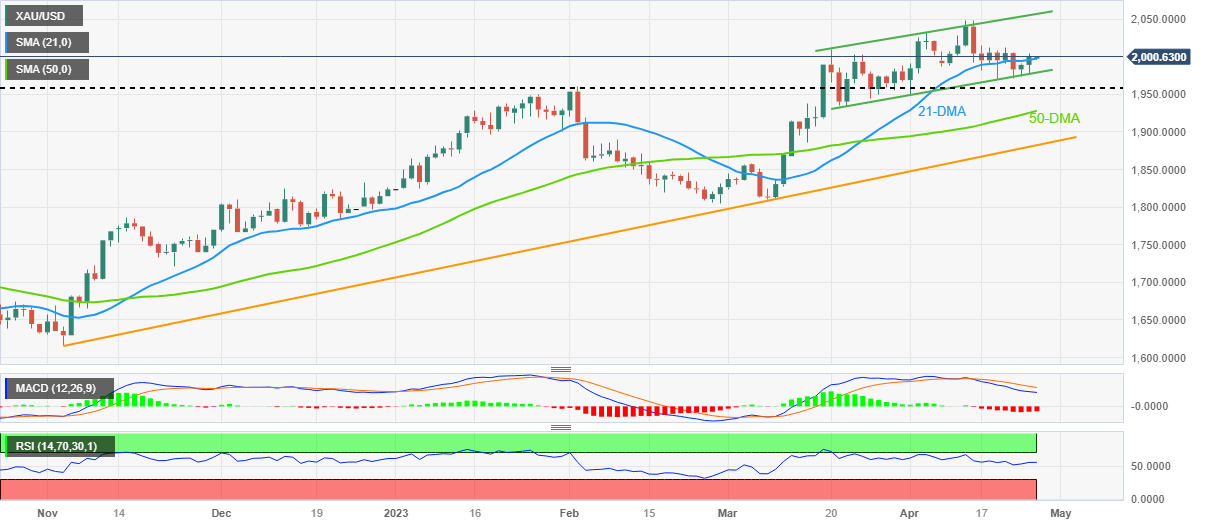
Trend: Further downside expected
-
01:00
USD/JPY bears carving out a bias front side of bearish trend
- USD/JPY bears are taking control again, front side of the bearish hourly trendline.
- BoJ guidance eyed this week as markets turn risk-off.
USDJPY has been rising off the Tuesday sell-off lows near 133.40 and is currently trading at around 133.70 having ranged so far between 133.62 and 133.91 where it is meeting a potentially solid resistance barrier.
The safe-haven US Dollar finally kicked into the pair, sending an otherwise firm yen back onto the backfoot as investors turned risk-averse due to worries about the banking sector again. The US Dollar index, DXY, touch off the made highs at 101.949 on Tuesday after earnings from First Republic Bank and UBS. Plunging deposits at First Republic Bank have reignited worries over the health of the banking sector and UBS reporting a 52% slide in quarterly income as it prepares to swallow fallen rival Credit Suisse.
Meanwhile, the US data was a disappointment in the April Consumer Confidence that dropped 2.7pts to 101.3, its lowest reading since November. Current conditions strengthened, rising to 151.1 vs 148.9. ´´The weakness was concentrated in expectations, which fell to 68.1 vs 74.0,´´ analysts at ANZ Bank explained.
The weak consumer confidence report and a decline in Federal Reserve manufacturing data further added to the Dollar's safe-haven appeal.
In other themes, the Yen picked up a bid, behaving like a typical safe haven, even as the Bank of Japan's (BOJ) new governor Kazuo Ueda signaled he was not in a hurry to shift policy. Ueda will lead his first BoJ meeting that concludes this Friday.
USD/JPY technical analysis
As per the earlier analysis, USD/JPY Price Analysis: Bears in the market, eye the 133.20s, whereby the 1-hour chart, showed that the M-formation´s neckline aligned with the 133.70s and resistance, we have seen this play out as follows:
USD/JPY H1 chart, prior analysis
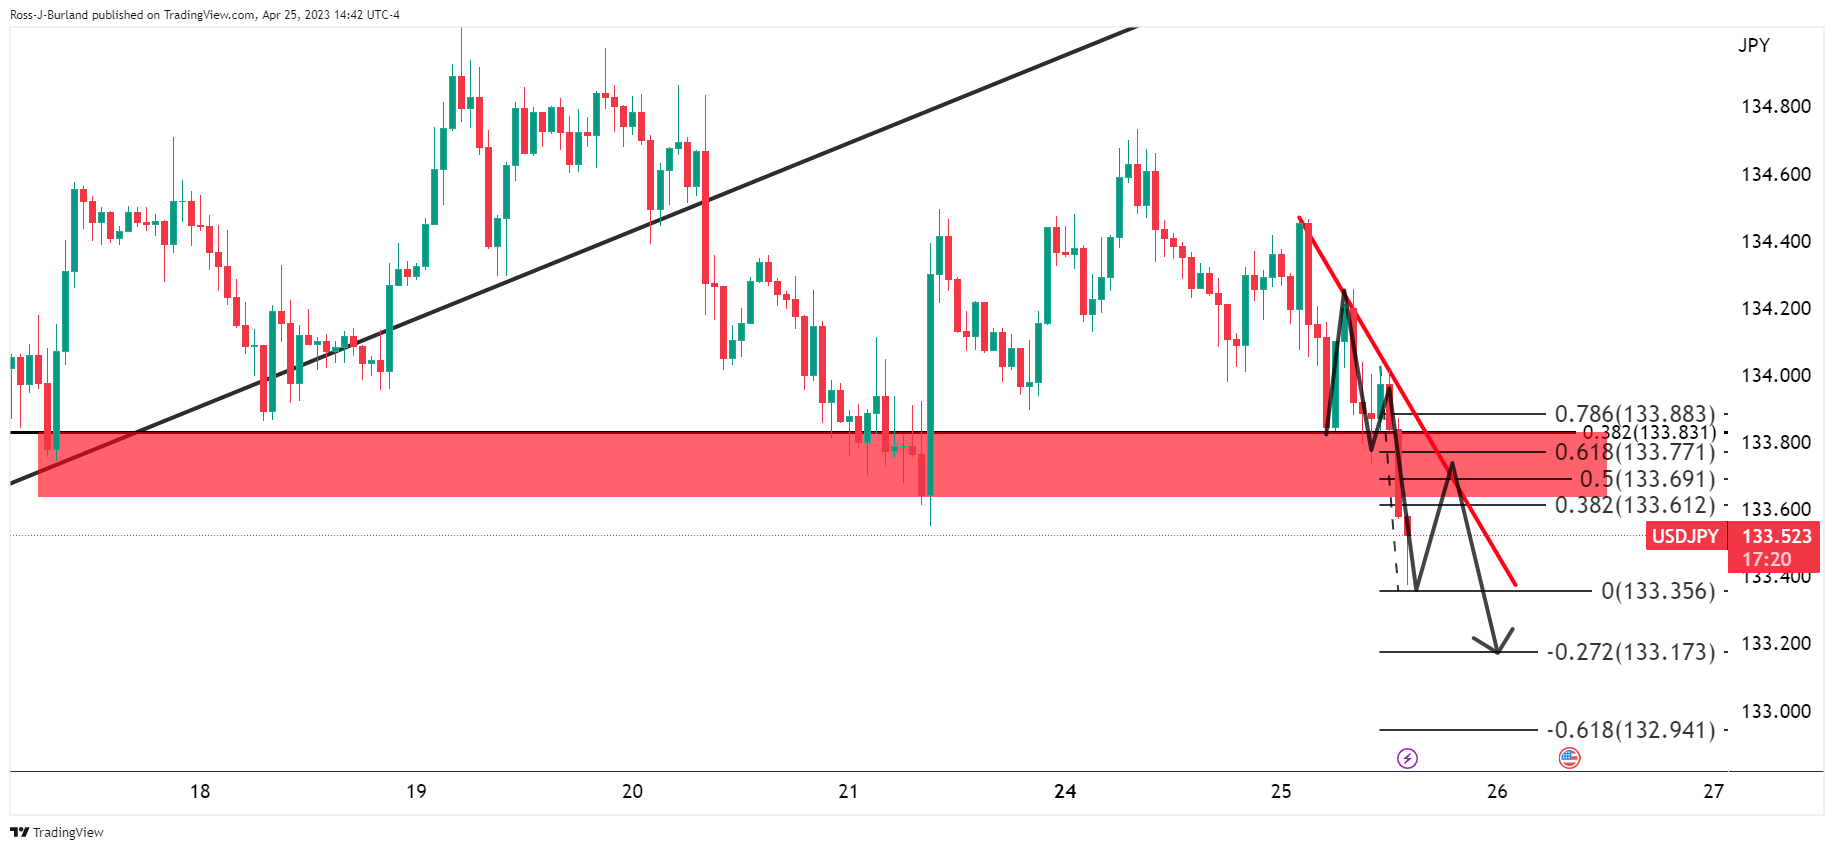
USD/JPY live update
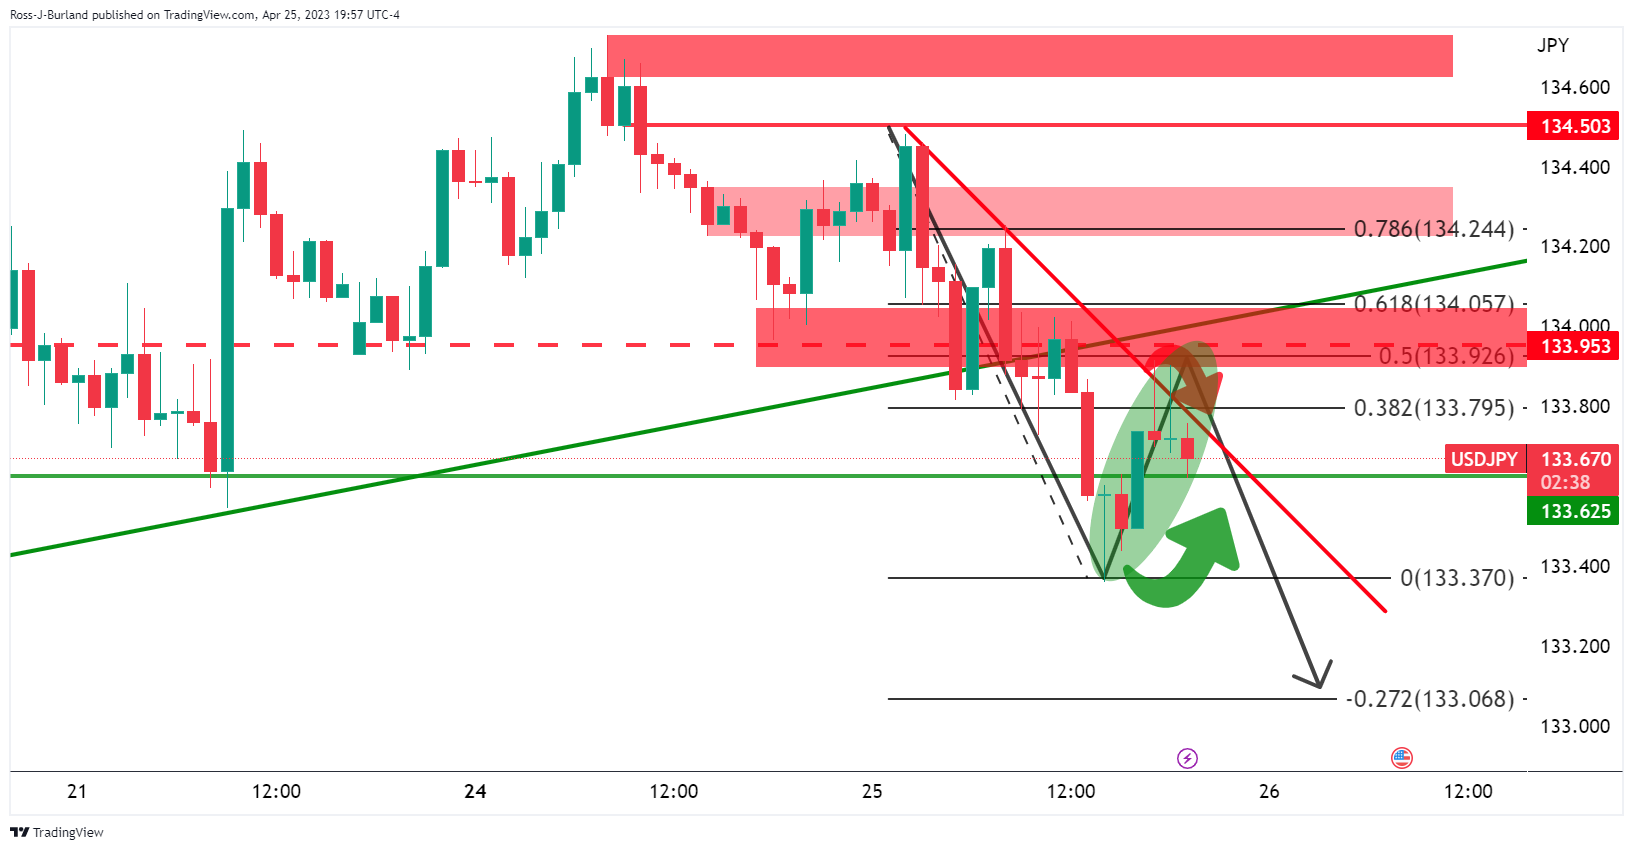
It was also stated that ´´a subsequent move to the 133.20s could be on the cards if the bears stay committed over the coming sessions.´´
For now, the price is being resisted and falling away while being front side of the micro bearish trendline.
-
00:41
Silver Price Forecast: XAG/USD sustains above $25.00 amid risk-off mood and renewed US banking jitters
- Silver price has confidently shifted above the $25.00 resistance amid renewed banking jitters.
- Disappointing earnings from S&P500 strengthened the appeal for bullions and US bonds.
- Silver price is marching towards the upper portion of the sideways channel after overstepping the 20-EMA.
Silver Price (XAG/USD) has shifted its business confidently above the critical resistance of $25.00 in the early Tokyo session. The white metal witnessed immense buying interest after investors shifted their funds into bullions to avoid sheer volatility inspired by disappointing earnings from S&P500 companies.
Risings fears of economic slowdown after poor earnings and weak revenue guidance from S&P500 companies have sent demand for US Treasury bonds and bullions on fire. Also, renewed banking jitters after the release of quarterly results of First Republic Bank underpinned bullions and US government bonds as safe-haven. First Republic Bank showed a sharp fall in customers’ deposits, which has forced the financial institution to rely on borrowings that will attract higher interest rates.
Higher demand for US government yields dragged yields significantly. The 10-year US Treasury yields have dropped heavily to 3.40%.
Meanwhile, the US Dollar Index (DXY) has shown a minor correction to near 101.83 after printing a two-day high of 101.95. Weaker demand for the S&500 amid mixed earnings and soaring anxiety ahead of the interest rate decision from the Federal Reserve (Fed) have improved the appeal for the US Dollar.
Going forward, US Durable Goods Orders (March) data will remain in focus. Monthly economic data that indicates forward demand for core goods is expected to expand by 0.8% vs. a contraction of 1.0%.
Silver technical analysis
Silver price is marching towards the upper portion of the Sideways Channel chart pattern formed on a two-hour scale. The aforementioned chart pattern indicates a rangebound performance by the asset. The white metal has crossed the 20-period Exponential Moving Average (EMA) at $25.08 on the upside, indicating that the short-term trend is bullish.
Also, the Relative Strength Index (RSI) (14) is oscillating in the 40.00-60.00, which signals that investors are awaiting a potential trigger for further action.
Silver two-hour chart
-638180627635072479.png)
-
00:33
US Dollar Index: DXY bulls eye 102.00 amid banking jitters, debt ceiling drama
- US Dollar Index grinds higher after rising the most in a week by snapping three-day downtrend.
- Earnings update from First Republic Bank renews banking fears even as major central banks seem confident.
- Mixed US data, uncertainty surrounding Fed’s policy pivot and downbeat yields fail to prod DXY bulls.
- US Durable Goods Orders for March, risk catalysts eyed for fresh impulse.
US Dollar Index (DXY) struggles to overcome the 101.90 resistance confluence, following the biggest daily jump in a week, as traders seek more clues to defend the latest rebound amid early Wednesday.
Fresh fears of banking fallouts and US default allowed the greenback’s gauge versus the six major currencies to print the first daily gains in four the previous day. However, the cautious mood ahead of today’s US Durable Goods Orders for March and major central banks’ efforts to restore the market’s confidence seems to challenge the US dollar bulls of late.
On Tuesday, the First Republic Bank’s (FRB) disappointing earnings reports joined the executives’ resistance in taking questions and no earnings guidance to trigger a fresh wave of banking jitters. Even so, the major central banks tried to restore market confidence by curtailing the US Dollar operations initiated during the first wave of the banking crisis. “The world's top central banks are cutting the frequency of their dollar liquidity operations with the U.S. Federal Reserve from May, sending the clearest signal yet that last month's financial market volatility is essentially over,” said Reuters.
Apart from the banking crisis, fears of US debt ceiling expiration also weigh on the risk appetite and allow the DXY to remain firmer. That said, US Treasury Secretary Janet Yellen warned that failure by Congress to raise the government's debt ceiling–and the resulting default–would trigger an "economic catastrophe" that would send interest rates higher for years to come, per Reuters.
While portraying the mood, Wall Street closed in the red and the US Treasury bond yields were down too, which in turn allowed the US Dollar Index (DXY) to snap a three-day downtrend.
It’s worth noting that the mixed US data failed to prod the DXY buyers. That said, US Conference Board's Consumer Confidence Index edged lower to 101.3 for April, versus 104.0 prior and Additional details of the publication stated that the Present Situation Index ticked up to 151.1 during the said month from 148.9 prior whereas the Consumer Expectations Index dropped to 68.1 from 74 previous readings. Further, the one-year consumer inflation expectations eased to 6.2% in April from 6.3% in March. In a different release, the US New Home Sales rose to 0.683M MoM in March versus 0.634 expected and 0.623M revised prior while the S&P/Case-Shiller Home Price Indices and Housing Price Index both rose past market forecast to 0.4% and 0.5% respectively for February.
Moving ahead, US Durable Goods Orders for March will be important to watch as it offers clues for Thursday’s US Gross Domestic Product (GDP) for the first quarter (Q1). Should the scheduled data offer a downbeat print, versus 0.8% expected and -1.0% prior, the US Dollar Index may consolidate recent gains.
Technical analysis
Despite the latest rebound, the US Dollar Index (DXY) remains below the 101.90 resistance confluence, comprising 21-DMA and a three-week-old descending resistance line, which in turn keeps the DXY bears hopeful.
-
00:15
EUR/JPY Price Analysis: Multi-year high is short-lived as a bearish engulfing candle pattern emerges
- EUR/JPY needs to break below the April 25 low of 146.28 for further downside action.
- For a bullish scenario, the EUR/JPY needs to reclaim 147.00 to pave the way towards re-testing 148.00.
A bearish-engulfing candle pattern emerges at the EUR/JPY daily chart after the pair hit a new multi-year high at 148.63. However, the EUR/JPY collapsed by more than 150 pips, and as the Asian session begins, the EUR/JPY is trading at 146.79.
EUR/JPY Price Action
After Tuesday's price action, the EUR/JPY is set for a deeper pullback. However, the pair must break below the April 25 low of 146.28 before challenging the 20-day Exponential Moving Average (EMA) at 145.95. As of writing, the EUR/JPY is testing the December 15 daily high at 146.72, previous resistance that turned support, and once it is broken, it could pave the way to the 146.00 mark, ahead of the 20-day EMA.
The next demand area would be the March 31 swing high-turned-support at 145.67, followed by the 145.00 figure, ahead of the 50-day EMA at 144.50.
Conversely, if EUR/JPY buyers reclaim 147.00, that could pave the way towards re-testing 148.00 before challenging the YTD high.
EUR/JPY Daily Chart
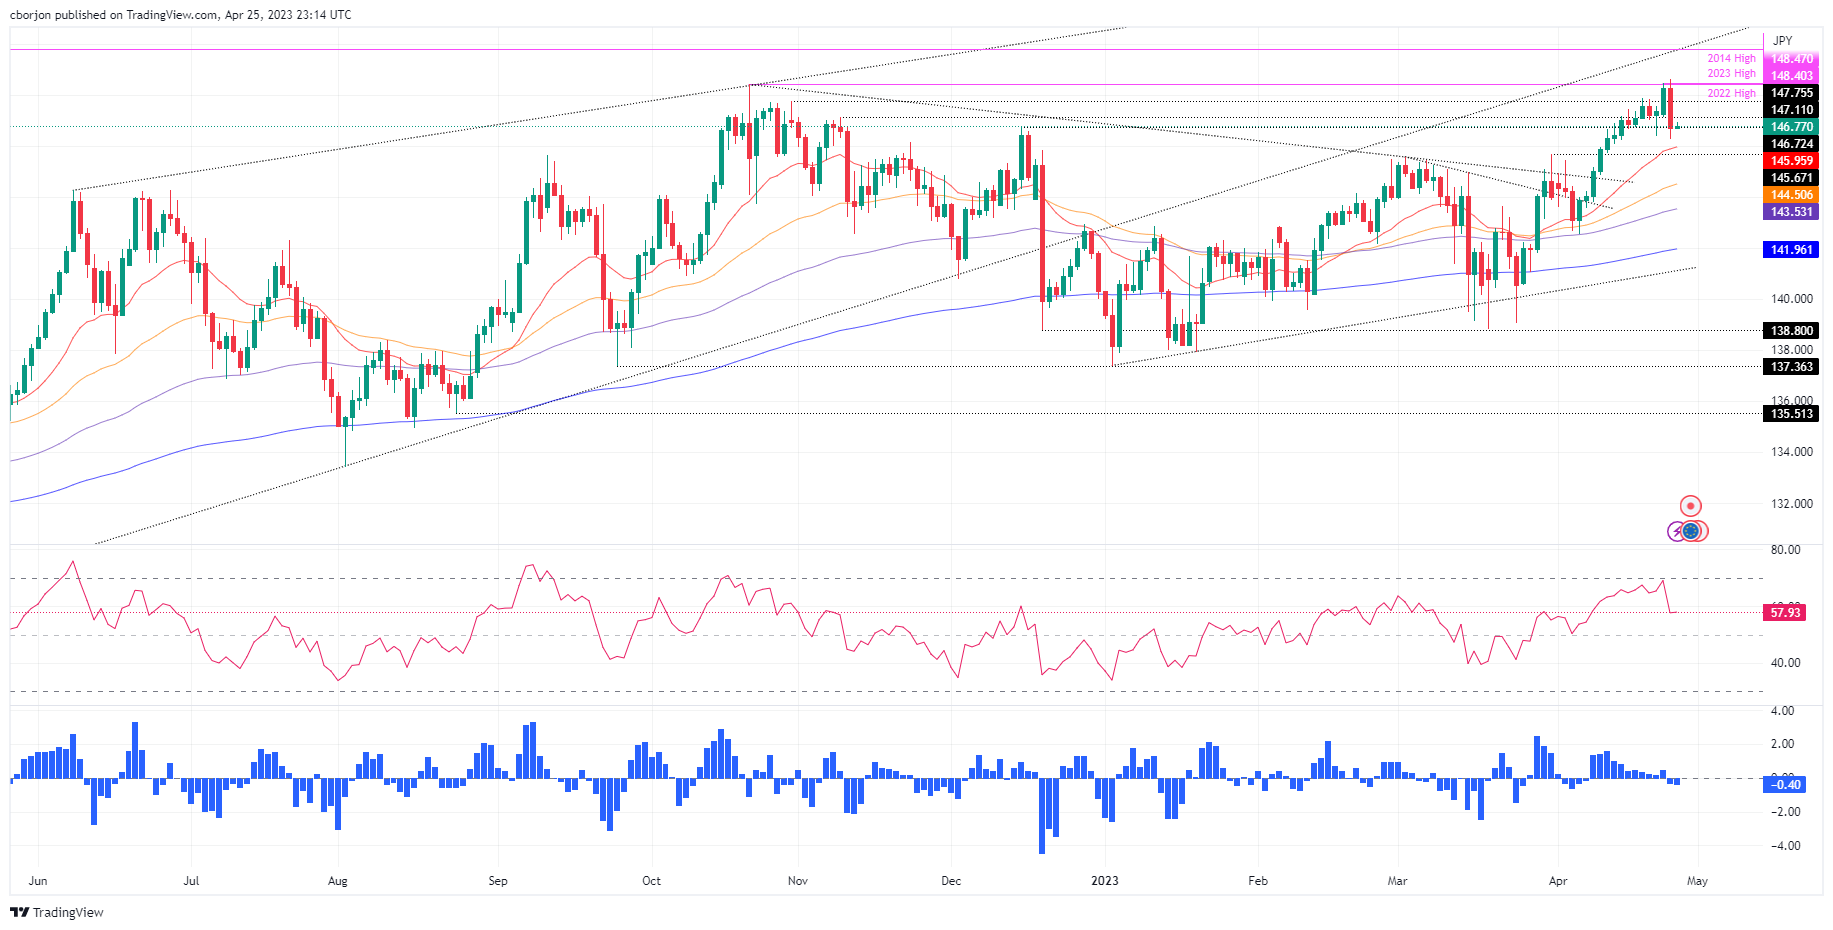
-
00:07
USD/CHF shows a sharp recovery from 0.8900 as focus shifts to US Durable Goods Orders
- USD/CHF has recovered sharply from 0.8900 after a corrective move.
- The risk-aversion theme in the overall market and pre-Fed policy anxiety improved safe-haven appeal for the US Dollar.
- An upbeat US Durable Goods Orders will indicate that US core inflation would be more persistent ahead.
The USD/CHF pair has recovered its minor correction quickly after dropping to near the round-level support of 0.8900 in the early Asian session. The Swiss Franc asset showed a stellar recovery on Tuesday after a fresh two-year low of 0.8860. Ample bids for the US Dollar Index (DXY) also infused fresh blood into the Swiss Franc asset.
S&P500 futures recorded significant losses on Tuesday after upbeat earnings from Microsoft and Google failed to recede negative market sentiment. Also, quarterly earnings from First Republic Bank showed a sharp fall in customers’ deposits, which has forced the financial institution to rely on borrowings that will attract higher interest rates.
The risk-aversion theme in the overall market and pre-Federal Reserve (Fed) policy anxiety improved the safe-haven appeal for the US Dollar. The USD Index showed a perpendicular upside move and printed a two-day high of 101.95. A power-pack action is expected from the USD Index this week ahead of economic indicators.
Wednesday’s United States Durable Goods Orders data (March) is seen expanding by 0.8% against a contraction of 1.0%. The economic data indicates forward demand made to manufacturers for core goods. An upbeat Durable Goods demand data will make the core Consumer Price Index (CPI) more persistent ahead.
Apart from that, Thursday’s annualized Gross Domestic Product (GDP) data will be of utmost importance. The consensus indicates that GDP (Q1) declined to 2.0% from the former pace of 2.6%. A weaker GDP data might escalate fears of a slowdown in the US economy.
On the Swiss Franc front, ZEW Survey-Expectations (April) will be in focus. As per the estimates, business conditions will improve to -18.9 from the former release of -41.3. An occurrence of the same might support the Swiss Franc ahead.
-
00:04
NZD/USD struggles near 0.6150 amid downbeat NZ trade numbers, bank fears
- NZD/USD licks its wounds as risk aversion joins downbeat New Zealand trade numbers for March.
- First Republican Bank renews banking fears even as major central banks cut USD operations to show confidence.
- Fears of recession, uncertainty surrounding the Fed’s next move also weigh on the Kiwi pair.
- RBNZ’s proposal to ease LVR restrictions defends Kiwi buyers ahead of US Durable Goods Orders.
NZD/USD seesaws around mid-0.6100s as it consolidates the previous day’s losses during early Wednesday morning in the Asia-Pacific zone. In doing so, the Kiwi pair fails to justify downbeat New Zealand (NZ) trade numbers, as well as broad US Dollar strength amid a risk-off mood ahead of the key US Durable Goods Orders for March.
That said, NZ Trade Balance dropped to $-1,273M versus $-796M prior (revised) while the annual trade deficit rose to $16.4B versus $-15.72B prior figures (revised from $-15.64B). Further details suggest that Exports rose to $6.51B during the said month versus $5.06B (revised) prior whereas Imports increased to $7.78B compared to $5.86B previous readings.
Also read: New Zealand trade deficit widens in March, NZD/USD stays pressured
Earlier in the day, the Reserve Bank of New Zealand (RBNZ) came out with an update suggesting easy Loan-To-Value Ratio (LVR) restrictions, which in turn allowed the NZD/USD to pare the previous day’s losses.
"Our assessment is that the risks to financial stability posed by high-LVR lending have reduced to a level where the current restrictions may be unnecessarily reducing efficiency," said RBNZ Deputy Governor Christian Hawksby.
Above all, the First Republic Bank’s (FRB) disappointing earnings reports joined the executives’ resistance in taking questions and no earnings guidance to trigger the fresh wave of banking jitters and weighed on the market sentiment the previous day, which in turn drowned NZD/USD. It’s worth noting that the major central banks tried to restore market confidence but could not. “The world's top central banks are cutting the frequency of their dollar liquidity operations with the U.S. Federal Reserve from May, sending the clearest signal yet that last month's financial market volatility is essentially over,” said Reuters.
On the same line could be the fears of US debt ceiling expiration as US Treasury Secretary Janet Yellen warned that failure by Congress to raise the government's debt ceiling - and the resulting default - would trigger an "economic catastrophe" that would send interest rates higher for years to come, per Reuters.
Against this backdrop, market sentiment remains sour and weighs on the Antipodeans. That said, Wall Street closed in the red and the US Treasury bond yields were down too, which in turn allowed the US Dollar Index (DXY) to snap a three-day downtrend.
Looking forward, US Durable Goods Orders for March will be important to watch as it offers clues for Thursday’s US Gross Domestic Product (GDP) for the first quarter (Q1).
Technical analysis
Sustained trading below the 200-DMA hurdle, around 0.6165 by the press time, keeps NZD/USD bears hopeful of refreshing the yearly low, currently around 0.6085 at the latest.
-