Notícias do Mercado
-
23:47
Silver Price Analysis: XAG/USD bears are on a test around $23.50
- Silver price remains pressured around one-month-old ascending support line.
- Fortnight-long horizontal region, 100-SMA adds to the immediate downside filters.
- Bearish MACD signals keep sellers hopeful but further declines hinge on $23.35 breakdown.
- Bulls need validation from $24.30 to retake control.
Silver price (XAG/USD) stays depressed around $23.55 as bears poke the monthly support line during early Thursday. It’s worth noting that the bright metal dropped the most in two weeks the previous day.
Given the metal’s sustained downside break of the previous support line from December 16 and the bearish MACD signals, the XAG/USD price is likely to break the immediate support line close to $23.50.
However, a two-week-old horizontal area comprising the 100-SMA, between $23.35 and $23.45, appears a tough nut to crack for the silver bears.
Should the commodity price breaks the $23.35 support, the odds of witnessing a slump to $23.00 can’t be ruled out.
Following that, the mid-month swing low of $22.55 and the monthly bottom surrounding $22.00 will gain the market’s attention.
Meanwhile, recovery moves may initially aim for the two-wee-old support-turned-resistance line near the $24.00 round figure before eyeing the double tops surrounding $24.30.
It should be noted, however, that the XAG/USD run-up beyond $24.30 won’t hesitate to poke the $25.00 round figure. Though, April’s top surrounding $26.25 could challenge the Silver buyers afterward.
Overall, the Silver price is likely to remain bearish but the quote’s further downside hinges on a $23.35 breakdown.
Silver: Four-hour chart

Trend: Further weakness expected
-
23:45
GBP/JPY Price Analysis: Faces selling pressure from 200-EMA around 162.00
- GBP/JPY has slipped sharply after failing to sustain above the critical resistance of 162.00.
- The pound Sterling has sensed selling pressure above the 200-EMA around 162.00.
- The RSI (14) has dropped into the 40.00-60.00 range from the bullish range of 60.00-80.00.
The GBP/JPY pair has sensed selling pressure while attempting to surpass the immediate resistance of 161.50 in the early Tokyo session. Broadly, the cross has dropped firmly after failing to hold the crucial resistance above 162.00. The asset is facing the heat after a four-day winning streak despite the expression of an accommodative policy stance by the Bank of Japan (BOJ) in its summary of opinions.
GBP/JPY has witnessed a steep sell-off after failing to sustain above the 200-period Exponential Moving Average (EMA) at 162.13 on an hourly scale. The cross has dropped to near the 20-EMA around 161.38 and is likely to remain on tenterhooks ahead. On a broader note, potential support is plotted from December 21 high of around 161.00.
Meanwhile, the Relative Strength Index (RSI) (14) has dropped into the 40.00-60.00 range from the bullish range of 60.00-80.00, which indicates that the upside momentum has been terminated, for now, however, the upside bias has not been lost yet.
For an upside, the pair needs to overstep December 28 high at 162.34, which will send the cross toward November 11 low and December 2 low around 163.00 and 164.00 respectively.
Alternatively, a breakdown of December 21 high around 161.00 will drag the asset toward December 26 low at 160.19, followed by December 21 low at 159.50.
GBP/JPY hourly chart
-638078678330790154.png)
-
23:31
US 10-year inflation expectations refresh two-week high
US inflation expectations as per the 10-year breakeven inflation rates from the St. Louis Federal Reserve (FRED) data, justify the recently firmer US Treasury bond yields as the same rose to the fresh high since December 12 by the end of Wednesday’s North American session. That said, the key inflation precursor jumped to 2.28% versus 2.26% marked the previous day.
On the other hand, the 5-year counterpart of the said inflation data portrays inaction at around 2.33% level at the latest.
It’s worth noting that the fears emanating from China unlock seemed to have propelled the latest inflation woes and underpinned the US Treasury yields, as well as the US Dollar.
That said, US 10-year Treasury yields rose to the highest levels since November 14 while flashing 3.88% by the end of Wednesday’s North American session. In doing so, the key US bond coupon marked the biggest one-day rise since October 19 on Wednesday. While tracing the firmer Treasury bond yields, the US Dollar Index (DXY) rose for the second consecutive day to 104.50 at the latest.
Also read: Forex Today: Trading remains choppy ahead of year-end
-
23:23
WTI licks its wounds below $79.00 as supply crunch fears take a back seat
- WTI stays depressed after falling the most in a fortnight.
- API inventories improve from -3.069M to -1.3M for the week ended on December 23.
- Russian decree on oil export pause gains little acceptance from market as it’s detached from OPEC+.
- Doubts on China unlock, firmer US Dollar exert more downside pressure on the Oil price.
WTI crude oil holds lower ground near $78.80 during early Thursday, after posting the two-day downtrend, as the commodity bears seek more clues to extend the latest south-run amid the holiday season.
Even so, the oil bears keep the reins amid receding fears of a supply crunch, as well as fresh doubts on demand from China. Additionally weighing on the black gold could be the latest weekly prints of the American Petroleum Institute’s (API) Crude Oil Stock data.
That said, the API Weekly Crude Oil Stock marked a decline of -1.3 million barrels versus the previous draw of -3.069 million barrels.
Elsewhere, multiple restrictions on Chinese travelers reverse the previous optimism surrounding the dragon nation’s unlock and renew fears of less oil demand from the world’s biggest commodity user. Recently, the US Health Official mentioned, “Beginning January 5, all passengers from China aged 2 and up will be required to undergo a Covid test two days before departure.” Previously, India, Japan, Taiwan and Italy announced requirements for COVID tests for visitors from China. Also teasing the WTI sellers was news from Reuters suggesting inconsistent virus details from Beijing. “China reported three new COVID-related deaths for Tuesday, up from one for Monday - numbers that are inconsistent with what funeral parlors are reporting, as well as with the experience of much less populous countries after they re-opened,” reported Reuters.
On the other hand, the Russian decree to stop exports to the countries adhering to the EU oil price cap lost importance as it is detached from OPEC+ and hence suggests minor effects on the energy markets.
It should be noted that the escalation in the Russia-Ukraine tension joins the fears emanating from China to propel the US Treasury yields and the US Dollar, which in turn weighs on the WTI crude oil prices amid the holiday season. However, the official weekly inventory data from the US Energy Information Administration (EIA) will be eyed for fresh impulse.
Technical analysis
A clear downside break of the three-week-old ascending support line, around $78.50 by the press time, becomes necessary for the WTI crude oil bears to retake control. Meanwhile, the 50-DMA hurdle surrounding $81.15 guards the quote’s short-term upside moves.
-
23:11
AUD/JPY sees buying interest around 90.50 as BOJ advocates an accommodative stance
- AUD/JPY is likely to find a cushion around 90.50 amid rising volatility in the Japanese Yen.
- A spike in Covid infections in China might worsen supply chain bottlenecks further.
- The BOJ has cleared that the central bank is not ditching the ultra-loose policy.
The AUD/JPY pair is sensing a halt in the corrective move to near 90.50 in the early Asian session. Earlier, the risk barometer slipped gradually after failing to extend its upside journey above the crucial resistance of 91.00. The cross is expected to deliver a recovery move as the expression of the continuation of the accommodative stance by the Bank of Japan (BOJ) has triggered volatility for the Japanese yen.
Meanwhile, the AUD/USD is showing signs of loss in the downside momentum and a similar kind of expectation is from the AUD/JPY pair.
The Australian Dollar is likely to display complicated moves as various countries are levying Covid safety measures for travelers from China. Covid infections have spiked dramatically in China after the rollback of lockdown restrictions and the reopening of the economy at a sheer pace. Health officials in the United States cited that the economy will impose mandatory COVID-19 tests on travelers from China.
The Chinese economy has already dismantled quarantine rules for inbound travelers. The staff of hospitals is describing the current time as the busiest period of their lifetime citing a sharp rise in Covid-19 cases. The rationale behind the reopening of the economy was to ease supply chain disruptions, however, it seems that the sheer pace of the economy’s reopening has worsened supply chain bottlenecks.
On the Tokyo front, the BOJ cleared that widening of the yield band was meant to address distortion in the 10-year Japanese Government Bonds (JGBs) pricing and this is not a step toward an exit from ultra-accommodative policy, as reported by Reuters. This might result in further weakness in the Japanese yen ahead.
-
23:03
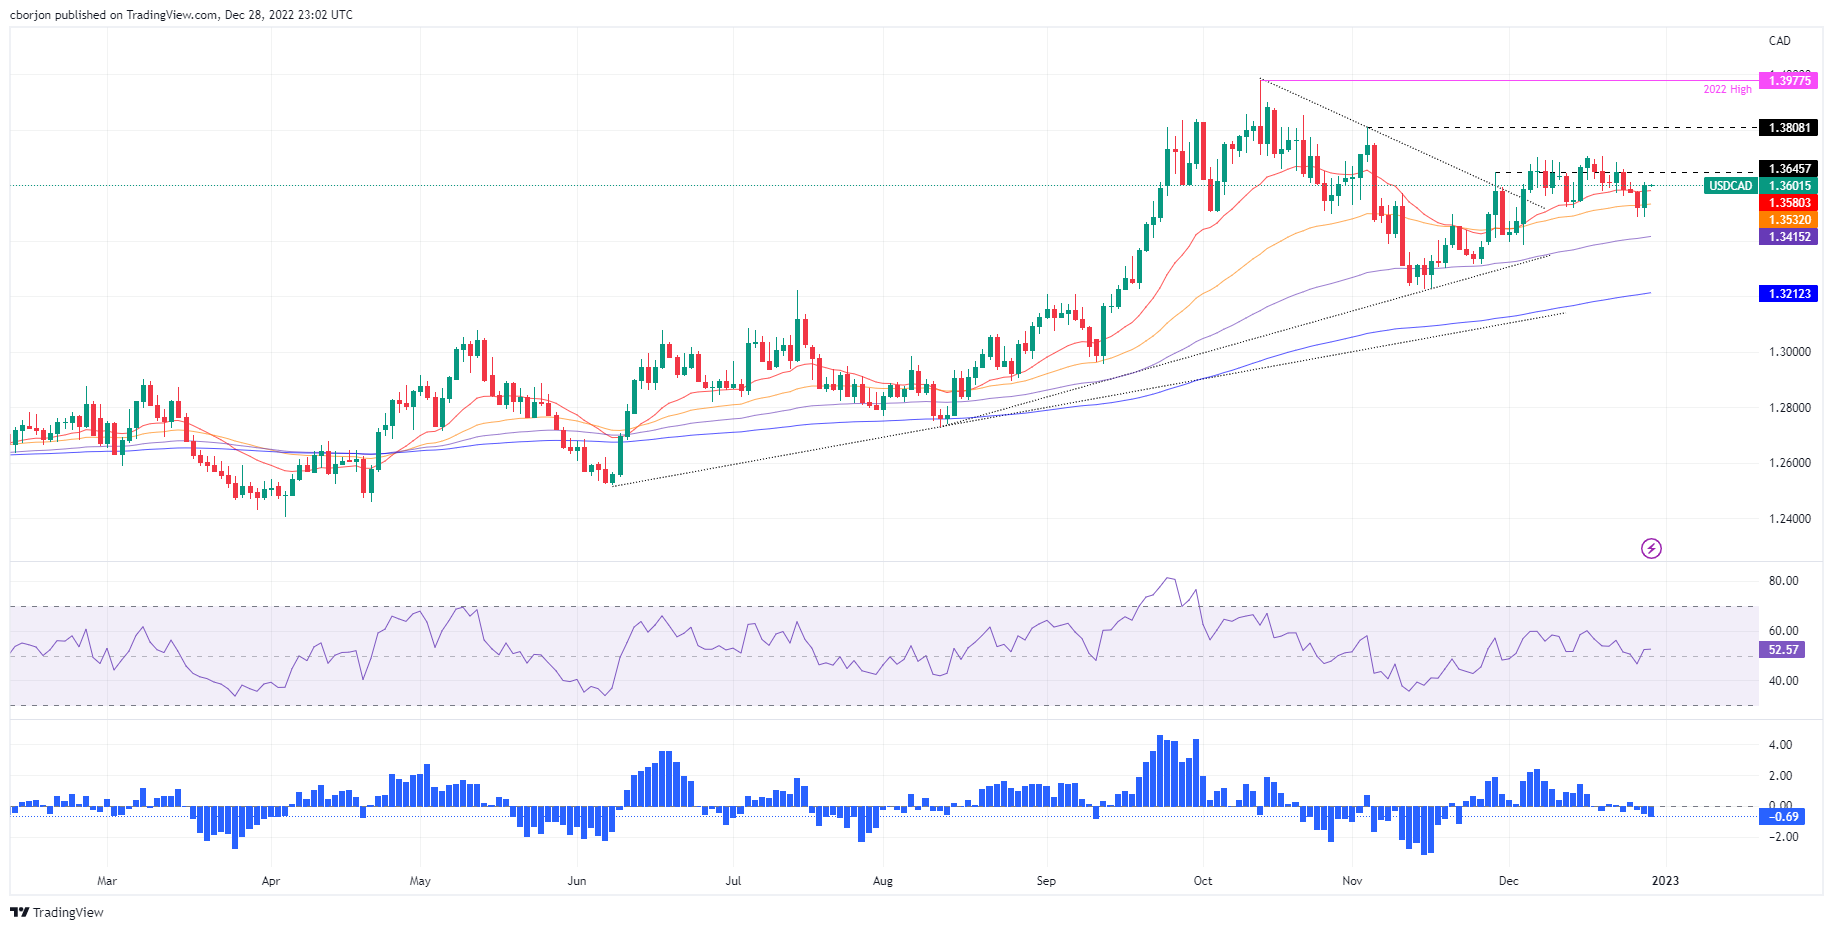
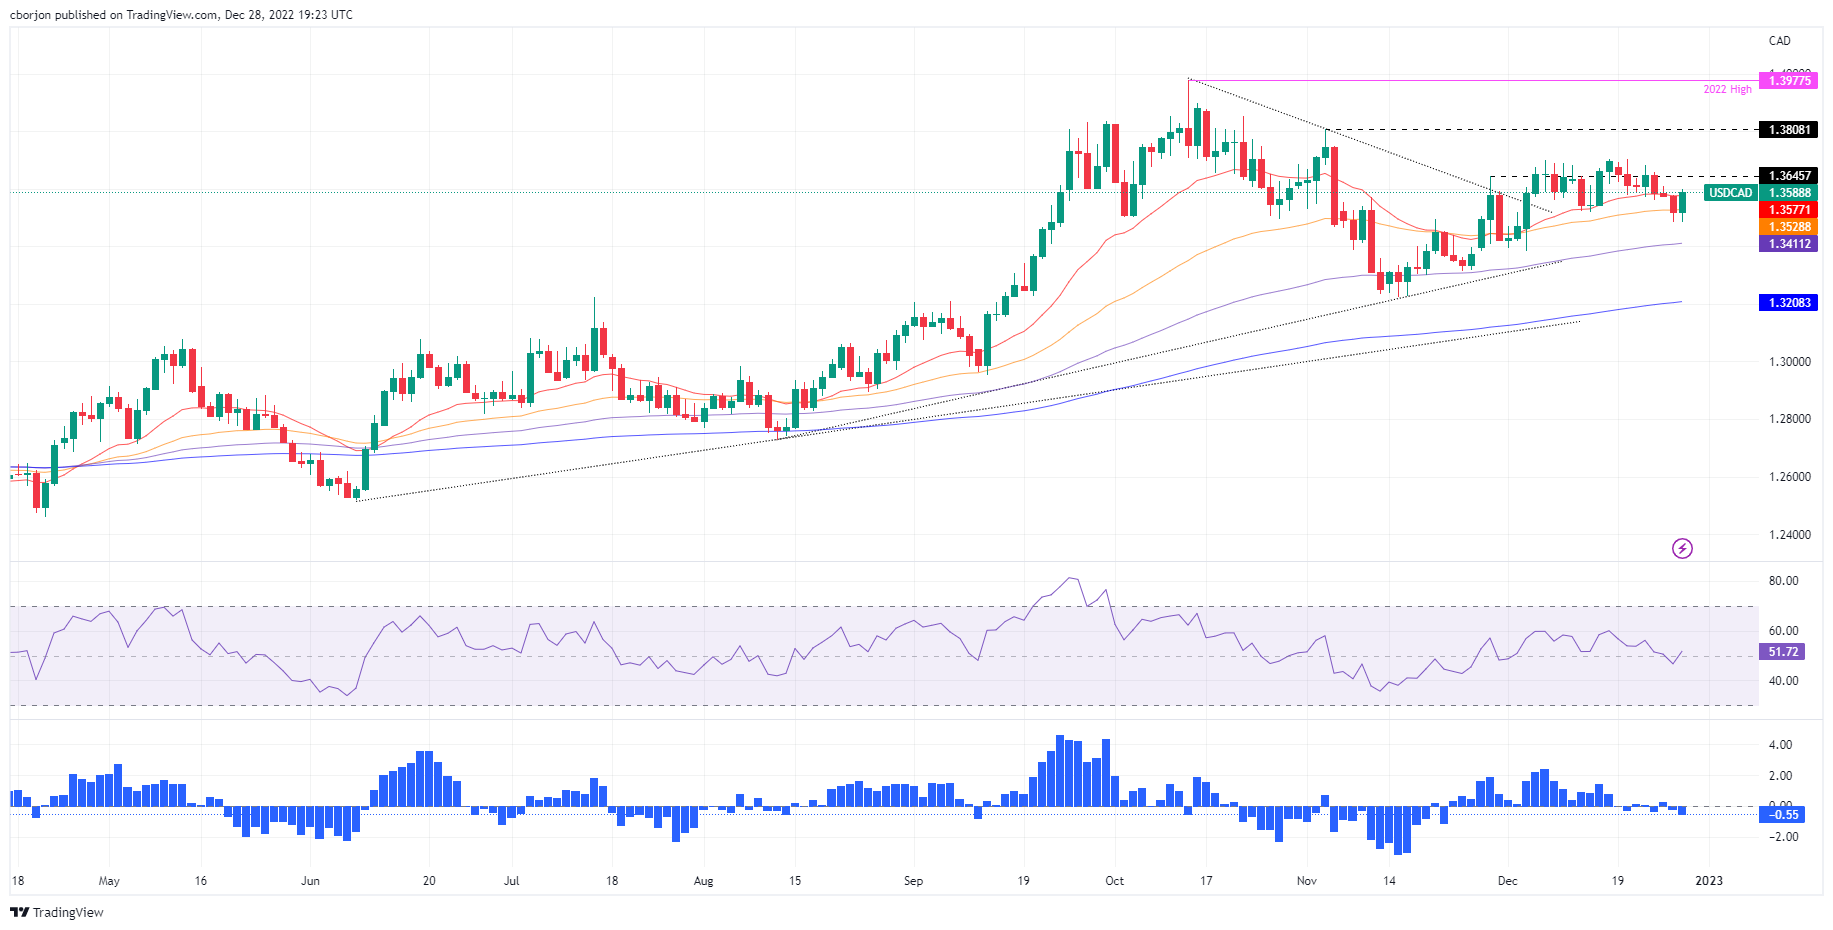
USD/CAD Price Analysis: Bullish engulfing candle emerges, as buyers eye 1.3700
- USD/CAD snaps three days of losses, forming a bullish engulfing candle pattern
- USD/CAD Price Analysis: A decisive break above 1.3600 exposes 1.3700; otherwise, a fall to 1.3500 is on the cards.
The USD/CAD hurdles the 20-day Exponential Moving Average (EMA) at 1.3580, back above the 1.3600 threshold for the third time in the week, as the pair formed a bullish engulfing candle pattern. As the Asian session begins, the USD/CAD is trading at 1.3601, registering minimal gains of 0.02%.
USD/CAD Price Analysis: Technical outlook
From a daily chart perspective, the USD/CAD pair remains neutral-to-upward biased after peaking twice at around 1.3704, forming a double top. Nevertheless, failure to extend its losses below the 50-day EMA at 1.3532 exacerbated a rally above 1.3600, as the USD/CAD looks poised to re-test the 1.3700 mark ahead of the next year. Even though the Relative Strength Index (RSI) is in bullish territory but almost flat, and the Rate of Change (RoC) suggests that sellers are losing momentum, the USD/CAD might consolidate on either side of the 1.3600 mark. Also, the lack of economic data through the week’s reminder might refrain traders from opening fresh bets in the USD/CAD pair.
If the USD/CAD decisively clears 1.3600, the next resistance would be the 1.3700 figure. Break above will expose November’s high of 1.3808, ahead of the YTD high of 1.3977. As an alternate scenario, the USD/CAD first support would be the 20-day EMA at 1.3580, followed by the 50-day EMA at 1.3532, ahead of the 1.3500 figure.
USD/CAD Key Technical Levels
-
23:01
EUR/USD struggles to defend 1.0600 as market fears renew US Dollar demand
- EUR/USD holds lower grounds after closely avoiding the 1.0600 breakdown.
- Distrust on China unlock, global restrictions on travelers from Beijing reverse Covid-linked optimism.
- Escalation in the Russia-Ukraine tension adds strength to the risk-off mood.
- US 10-year Treasury bond yields rose the most since October 19 and underpinned US Dollar despite downbeat US data.
EUR/USD fades bounce off 1.0606 as bears keep the reins after retaking control the previous day, following a two-day winning streak. The major currency pair’s latest losses could be attributed to the strong US Treasury bond yields that triggered the US Dollar’s comeback.
US 10-year Treasury yields rose to the highest levels since November 14 while flashing 3.88% by the end of Wednesday’s North American session. In doing so, the key US bond coupon marked the biggest one-day rise since October 19 on Wednesday.
The run-up in the US Treasury bond yields could be linked to the market’s lack of confidence in China’s unlock, as well as the geopolitical woes surrounding Russia.
Recently, the US Health Official mentioned, “Beginning January 5, all passengers from China aged 2 and up will be required to undergo a Covid test two days before departure.” Previously, India, Japan, Taiwan and Italy announced requirements for COVID tests for visitors from China. Also teasing the EUR/USD sellers was news from Reuters suggesting inconsistent virus details from Beijing. “China reported three new COVID-related deaths for Tuesday, up from one for Monday - numbers that are inconsistent with what funeral parlors are reporting, as well as with the experience of much less populous countries after they re-opened,” reported Reuters.
On the other hand, the latest updates from Ukrainian Military and Russian offices also portray the escalation of the geopolitical tension propel the US Dollar’s haven demand. “Russian forces increased mortar and artillery attacks on the city of Kherson more than six weeks after it was retaken by Ukrainian troops, while also exerting pressure along frontlines in the east,” said the Ukrainian Military office per Reuters. In this regard, Russia previously stated that the only agreements that account for the four additional territories joining Russia are feasible.
Amid these plays, Wall Street closed in the red while commodities also reversed previous gains.
That said, the US Dollar Index (DXY) rose for the second consecutive day to 104.50 at the latest. While tracing the firmer US bond coupons and cheering the risk-aversion the USD ignored downbeat US Pending Home Sales for November, -37.8% YoY versus -36.7% expected and -37.0% previous readings. It should be noted that the US Richmond Fed Manufacturing Index for December improved to 1.0 versus -4.0 anticipated and -9.0 prior.
Looking forward, US Initial Jobless Claims will decorate the economic calendar but major attention should be given to the qualitative details for fresh impulse.
Technical analysis
The increasing strength of the bearish MACD signals join the EUR/USD pair’s repeated attempts to break the 1.0600 round figure to keep the bears hopeful. It’s worth noting that the 21-DMA support near 1.0580 adds to the immediate downside filters.
-
23:00
South Korea Industrial Output Growth below forecasts (0.7%) in November: Actual (0.4%)
-
23:00
South Korea Service Sector Output below forecasts (-0.2%) in November: Actual (-0.6%)
-
23:00
South Korea Industrial Output (YoY) below expectations (0.4%) in November: Actual (-3.7%)
-
22:44
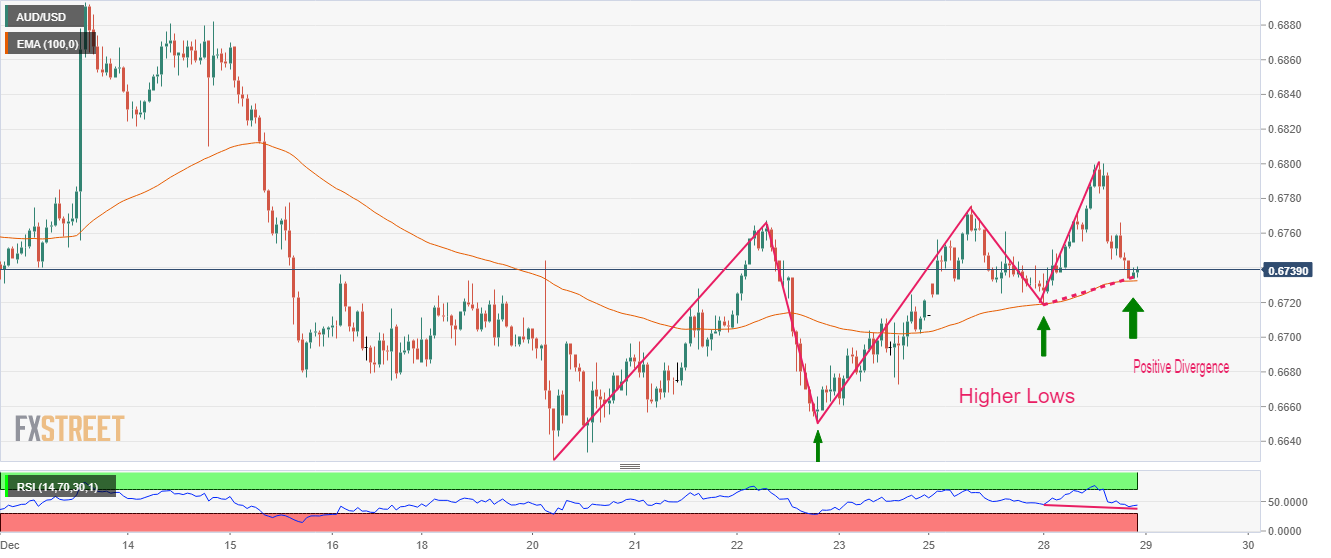
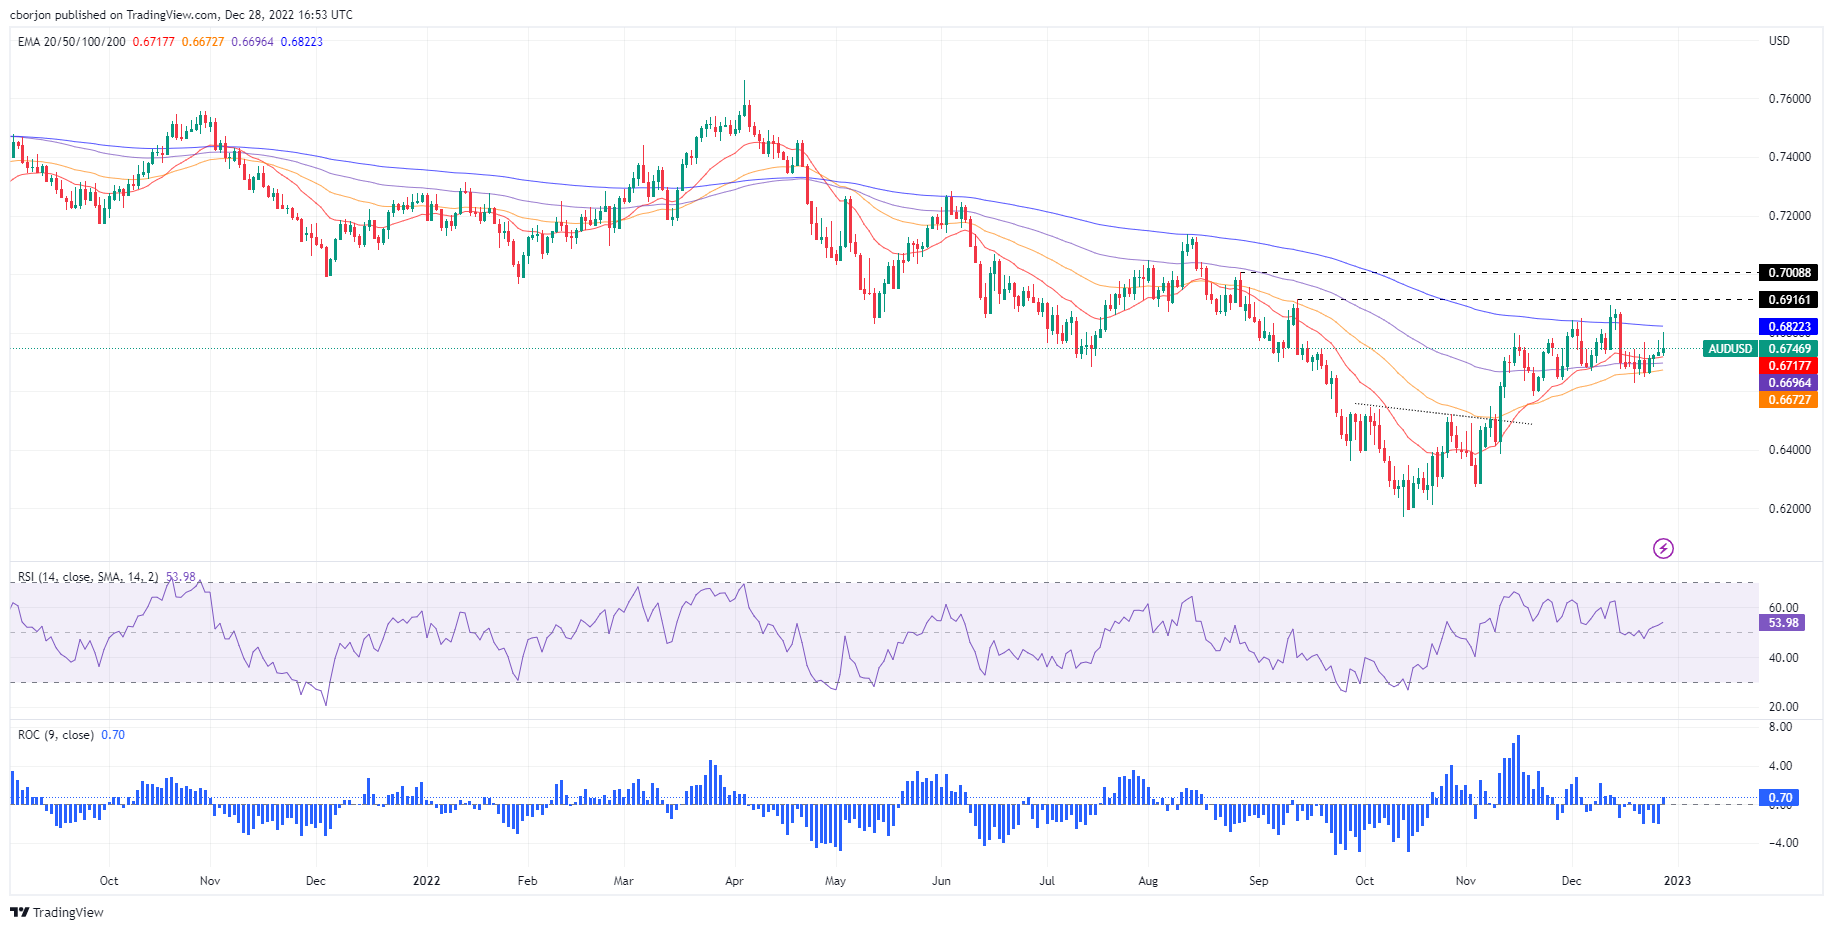
AUD/USD Price Analysis: Oversold oscillator advocates a reversal
- AUD/USD displayed a steep fall to near 0.6735 amid a V-shape recovery in the US Dollar Index.
- A breakdown of 0.6719 will result in the termination of the bullish trend for the Aussie asset.
- The RSI (14) is in an oversold position while the higher lows structure in the asset has yet not been scrapped.
The AUD/USD pair displayed a perpendicular fall after finding significant offers near the round-level resistance at 0.6800 on Wednesday. The Aussie asset has extended its losses as the risk appetite of the market participants has trimmed dramatically.
The US Dollar Index has witnessed a sharp recovery to near 104.20 and is expected to extend its gains further amid sheer volatility in the festive week. The impact of sheer volatility is also visible on United States equities as S&P500 slipped vigorously on Wednesday.
On an hourly scale, the Aussie asset is continuously forming higher lows, which indicates that the pair is in an upwards trend. The major has dropped sharply from 0.6800 and a breakdown of December 27 low at 0.6719 will result in the termination of the bullish trend. Therefore, it is high time that a responsive buying action toward the Australian Dollar could save Aussie bulls.
The 100-period Exponential Moving Average (EMA) at 0.6735 could act as a support for the asset. Apart from that, an occurrence of a bullish positive divergence is visible as the asset has not made a lower low yet while the momentum oscillator, Relative Strength Index (RSI) (14), has made a lower low. An oversold position from the momentum oscillator in an upside trend indicates a bargain buy for the market participants.
For a reversal move, the Aussie asset needs to surpass December 22 high at 0.6756, which will drive the asset toward Wednesday’s high around 0.6800, followed by December 13 high around 0.6880.
On the contrary, a breakdown of December 27 low at 0.6719 will drag the major towards December 15 low around 0.6677. A slippage below the latter will expose the asset for more downside toward December 20 low at 0.6629.
AUD/USD hourly chart
-
22:31
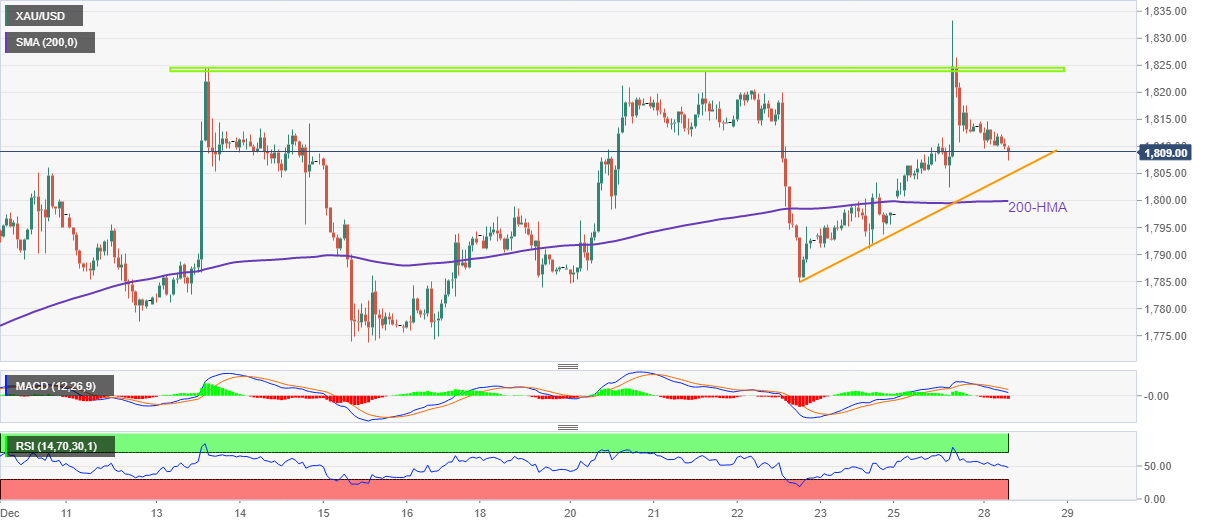
Gold Price Forecast: XAU/USD bears the burden of firmer United States Treasury bond yields
- Gold price stays pressured towards 21-Daily Moving Average after snapping two-day winning streak.
- United States Treasury bond yields renew multi-day high as optimism surrounding China propels inflation fears.
- US Dollar regains upside momentum but Gold price remains depressed despite holiday season.
Gold price (XAU/USD) remains defensive around $1,805, after printing the first daily negative closing in three, as bears struggle to retake control amid the lackluster holiday season. In doing so, the yellow metal portrays the market’s fresh fears of inflation, emanating from China, as well as geopolitical tension surrounding Russia and Ukraine, which in turn propel US Treasury bond yields and the US Dollar. However, the lack of major data/events joins the strong presence of the 21-Daily Moving Average (DMA) support to challenge the precious metal’s immediate downside.
Gold bears sense negatives from China unlock
China’s almost total repeal of the “Zero-Covid” policy initially triggered the market’s optimism before Gold traders feared the negative outcomes, especially in the form of rising inflation due to the dragon nation’s push for a faster reversal of the lost economic momentum during COVID-19. On Wednesday, China's Civil Aviation Authority stated that they will gradually start taking applications from domestic and foreign airlines for international passenger charter flights.
Other than the inflation fears, the doubts over the official virus numbers pushed some of the major economies, including the US to announce restrictive measures for Chinese travelers. Recently, the US Health Official mentioned, “Beginning January 5, all passengers from China aged 2 and up will be required to undergo a Covid test two days before departure.” Previously, India, Japan, Taiwan and Italy announced requirements for COVID tests for visitors from China.
Also teasing the Gold sellers was news from Reuters suggesting inconsistent virus details from Beijing. “China reported three new COVID-related deaths for Tuesday, up from one for Monday - numbers that are inconsistent with what funeral parlors are reporting, as well as with the experience of much less populous countries after they re-opened,” reported Reuters.
Hence, fears surrounding China, one of the world’s biggest Gold consumers weigh on the metal prices despite the Asian major’s attempt to please markets.
Geopolitical fears add strength to the XAU/USD weakness
Not only China, but geopolitical concerns surrounding Russia and Ukraine also exert downside pressure on the Gold price. As per the latest updates from Ukrainian Military, per Reuters, “Russian forces increased mortar and artillery attacks on the city of Kherson more than six weeks after it was retaken by Ukrainian troops, while also exerting pressure along frontlines in the east.” In this regard, Russia previously stated that the only agreements that account for the four additional territories joining Russia are feasible.
Market fears propel yields, US Dollar and weigh on the Gold price
Given the virus woes and a likely run-up in inflation fueling the recession woes, the US Treasury bond yields refresh a multi-day high and enable the US Dollar to pare recent losses. That said, the US 10-year Treasury yields rose to the highest levels since November 14 while flashing 3.88% by the end of Thursday whereas the US Dollar Index (DXY) rose for the second consecutive day to 104.50 at the latest. It should be noted that the key US bond coupon, namely the 10-year Treasury bond yields, marked the biggest one-day rise since October 19 on Wednesday.
Light calendar to challenge XAU/USD moves
Although the fresh run-up in the US Treasury yields weighs on the Gold price, a lack of major data and events could probe the metal’s moves during the holiday season. Even so, the XAU/USD bears are likely to keep the reins.
Gold price technical analysis
Gold price justifies multiple failures to cross upward-sloping resistance lines from early September and October, respectively near $1,835 and $1,848, to retreat towards the 21-Daily Moving Average (DMA) retest, around $1,795 by the press time.
Adding strength to the bearish bias over the Gold price momentum are the downbeat signals from the Moving Average Convergence and Divergence (MACD) indicator, as well as the steady Relative Strength Index (RSI), located at 14.
Even so, the metal’s downside past $1,795 appears limited as the 618% Fibonacci retracement level of the June-September south-run, near $1,778, precedes the 50% Fibonacci retracement level of around $1,747 to challenge XAU/USD bears.
In a case where Gold sellers manage to keep the reins past $1,747, a southward trajectory towards the late November swing low near $1,721 can’t be ruled out.
Alternatively, an upward-sloping resistance line from September, close to $1,835 by the press time, restricts immediate advances of the XAU/USD before the ascending trend line resistance line from October, around $1,848, to restrict the short-term upside of the Gold price.
Should the Gold price remains firmer past $1,848, June’s top near $1,880 and the $1,900 round figure should return to the charts.
Overall, the Gold price remains firmer unless breaking the 21-DMA support even if the XAU/USD bulls appear to run out of steam.
Gold price: Daily chart
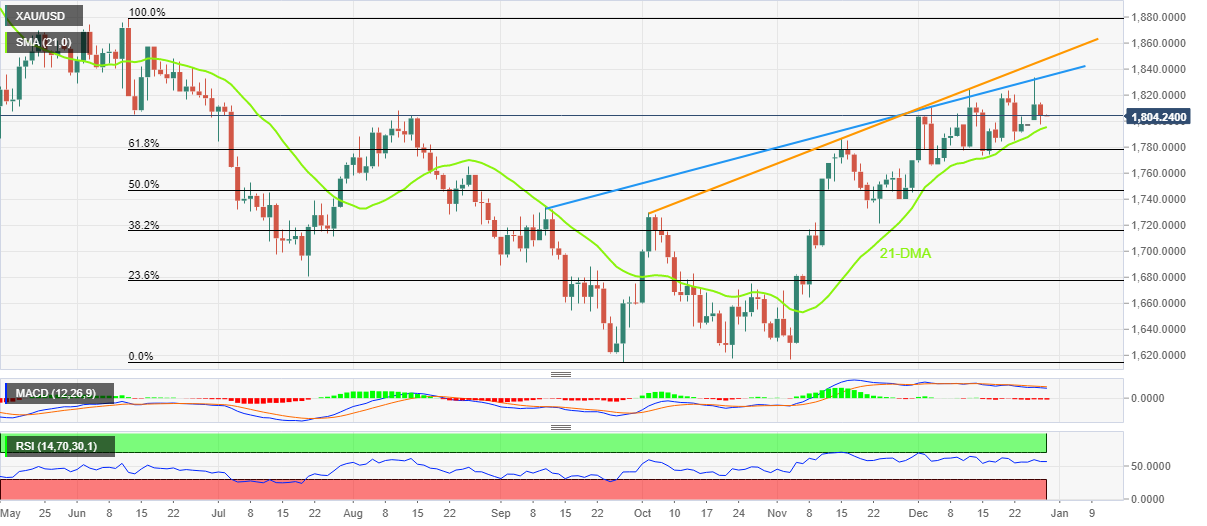
Trend: Limited downside expected
-
22:31
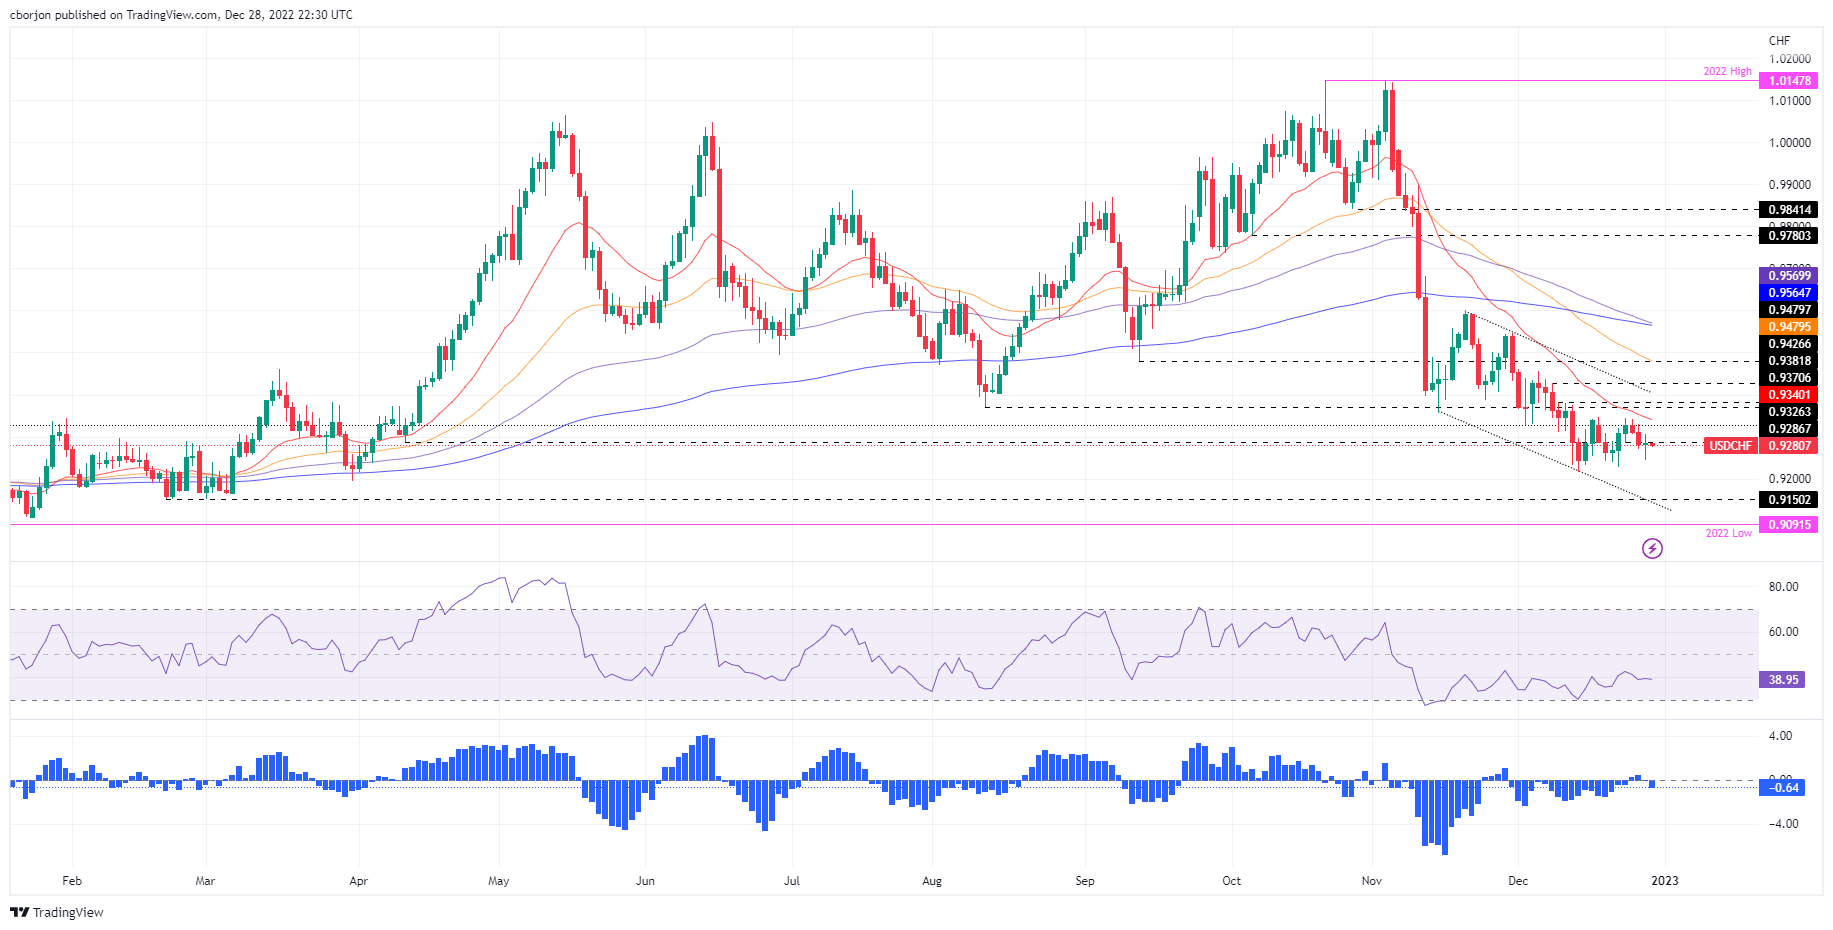
USD/CHF Price Analysis: Doji emerges after two days of losses, meanders around 0.9275
- USD/CHF slightly falls as the Asian session begins.
- Risk aversion was spurred by the increase of Covid cases in China and Western countries requiring tests from flights originating in China.
- USD/CHF Price Analysis: A doji suggests buyers are stepping in, but failure to crack 0.9300 could exacerbate a fall.
The USD/CHF snaps two days of losses and forms a doji in the daily chart after sentiment shifted sour on the increase of Covid-19 cases in China. Therefore, some Western countries like Italy and the United States (US) would begin soliciting Covid-19 tests from travelers with flights originating in China. At the time of writing, the USD/CHF is trading at 0.9275.
USD/CHF Price Analysis: Technical outlook
From a daily chart perspective, the USD/CHF continued its downtrend after dropping below the 200-day Exponential Moving Average (EMA), which exacerbated a fall toward 2022 open at 0.9116. Nonetheless, since mid-December, the USD/CHF pair has strengthened, but as long as it remains below the 20-day EMA at 0.9339, keeping sellers under control.
However, the presence of a doji could pave the way for a rally to the 0.9300 mark, but unless the USD/CHF clears the 0.9344 mark, risks will remain skewed to the downside.
Therefore, the USD/CHF first support would be the December 28 daily low of 0.9244, followed by the December 22 low of 0.9226, ahead of the 0.9200 mark. As an alternate scenario, if the USD/CHF clears 0.9300, the pair would be poised to challenge 0.9344.
USD/CHF Key Technical Levels
-
22:12
GBP/USD drops to near 1.2000 as risk-off soars amid a festive week
- GBP/USD is expected to extend its downside journey as investors have underpinned the risk aversion theme.
- Major countries are announcing Covid safety measures for travelers from China that have soared risk-off mood.
- A decline in the United States Pending Home Sales data failed to impact the US Dollar Index.
The GBP/USD pair has witnessed a steep fall after failing to sustain above the critical resistance of 1.2120 in the late New York session. The Cable has delivered a sheer downside and has dropped to near 1.2018. The major is expected to extend its downside journey to near the psychological support of 1.2000 as the US Dollar Index (DXY) has gained significant traction amid the risk-aversion theme.
Market sentiment turned extremely bearish on Wednesday led by a sell-off in S&P500 after the United States administration announced mandatory Covid tests for travelers from China as the dismantling of lockdown restrictions by the Chinese administration at a sheer pace has accelerated the number of infections in the Chinese economy. US equities have continued their bearish run before entering into the new calendar year as the market participants have underpinned the risk-off mood.
The US Dollar Index displayed a V-shape recovery after dropping to near 103.50 and has surpassed the crucial resistance of 104.00. The USD Index has refreshed its three-day high at 104.20 and is expected to remain in the grip of bulls ahead. Also, the 10-year US Treasury yields have climbed to near 3.90%.
A decline in the United States Pending Home Sales data failed to impact the USD Index. The data published by the National Association of Realtors showed that Pending Home Sales in the US declined by 4% on a monthly basis in November while the street was expecting an expansion of 0.6%. It seems that households are ditching the plans of purchasing homes to dodge higher interest obligations and preferring to pay rentals.
On the United Kingdom front, the ending of the CY2023 at a higher inflation rate led by higher energy prices is going to keep the Bank of England (BOE) busy next year in handling the inflation mess. BOE Governor Andrew Bailey might bank upon further increments in the interest rates to trim inflationary pressures.
-
22:10
United States API Weekly Crude Oil Stock rose from previous -3.069M to -1.3M in December 23
-
21:53
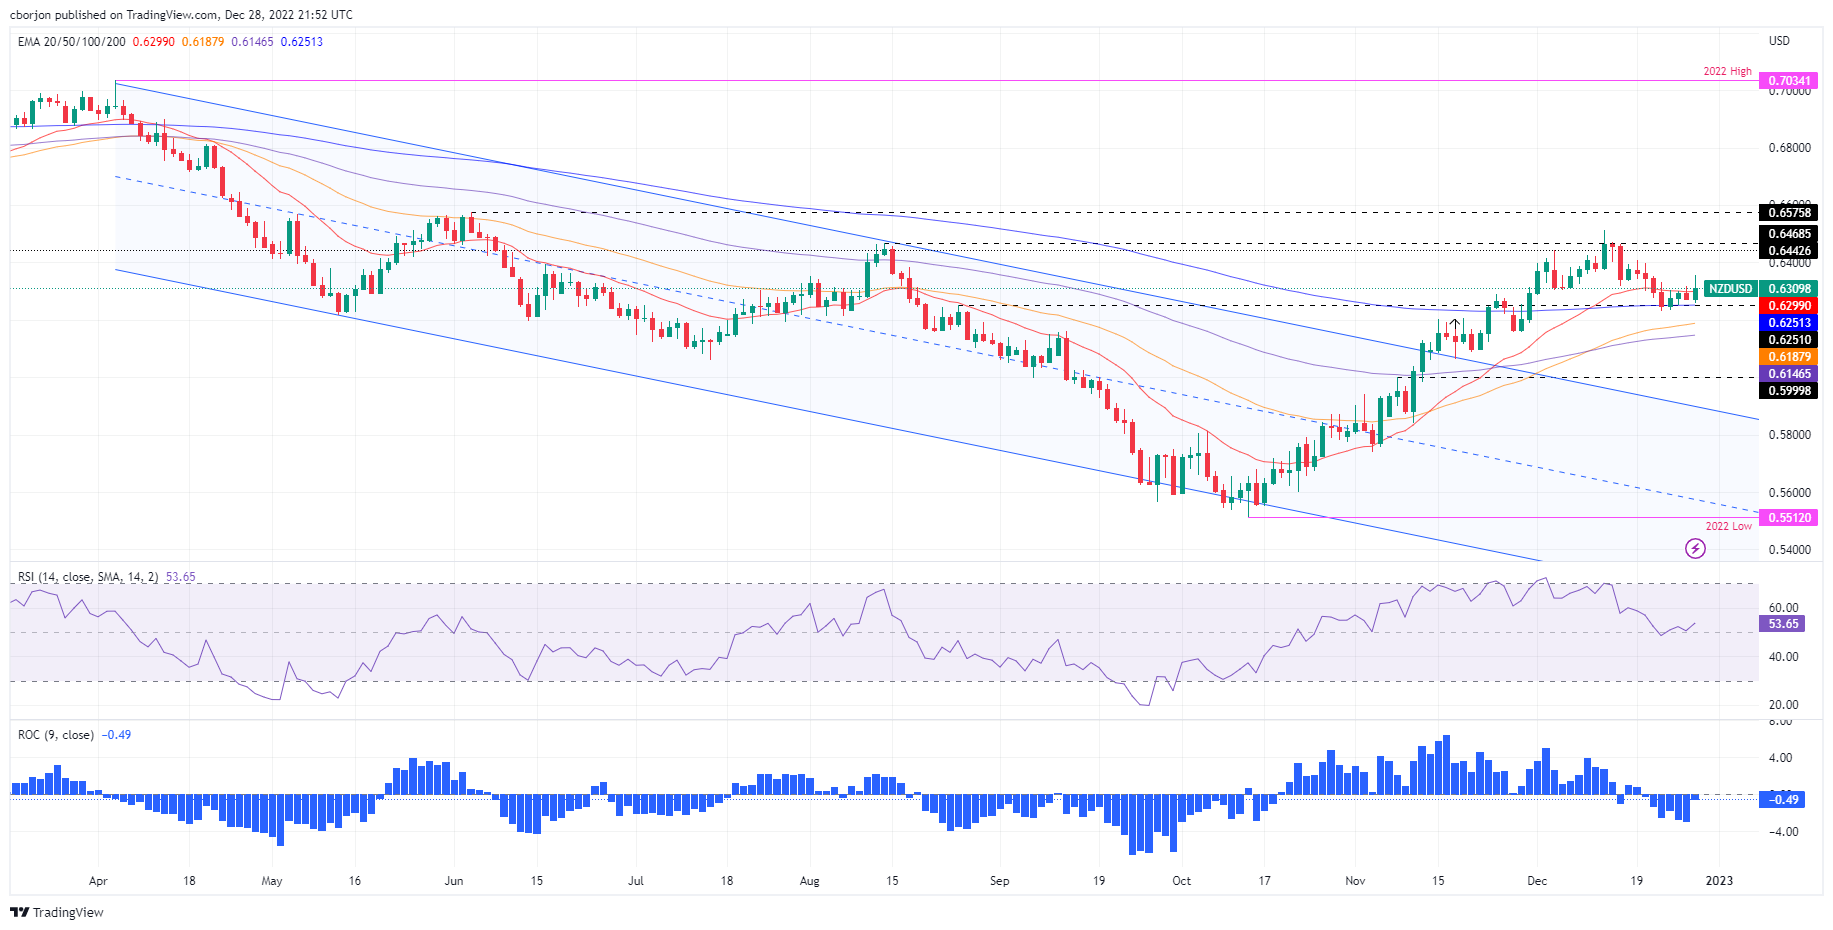
NZD/USD erases some of its earlier gains, remaining positive around 0.6310s
- NZD/USD edges up 0.50% during Wednesday’s session amidst risk-aversion.
- Sentiment shifted on the rise of China’s Covid-19 cases.
- NZD/USD Price Analysis: Downward biased once it clears 0.6300, and the 20-day EMA, it could aim towards 0.6180s.
The New Zealand Dollar (NZD) clings to some of its earlier gains after hitting a weekly high of 0.6355 and sliding toward the 0.6300 regions, though it remains positive in the day, gaining 0.50%. Factors such as China’s relaxing Covid-19 restrictions, and the rise of cases, in the second-largest economy sounded the alarms worldwide. Therefore, the NZD/USD is trading at 0.6309.
Wall Street finished Wednesday’s session in the red. The jump in Covid-19 cases in China triggered restrictions on flights originating from China, with Italy beginning to test arrivals after two flights to Milan were found to have the virus, according to Bloomberg. Later, the US said that it would require all air passengers to get a Covid-19 test no more than two days before departure.
Data-wise, the US economic docket revealed that Pending Home Sales for November dropped 4% MoM vs. expectations for a 4.6% contraction, which was better than estimated. However, according to the National Association of Realtors, it fell to its lowest level outside the pandemic in data back to 2001. On an annual basis, Pending Sales plunged to 37.8% YoY, below a 37% fall.
In the meantime, the Richmond Fed Manufacturing Index improved to 1, exceeding the previous month’s contraction to -9.
Aside from this, higher US Treasury yields lifted the battered US Dollar (USD), which has tumbled some 9% after peaking at 114.778. The US 10-year Treasury bond yield rises four bps, at 3.885%, while the US Dollar Index (DXY) recovers some ground, up 0.25%, at 104.530.
In the week ahead, the US economic docket will feature Initial Jobless Claims for the week ending on December 23, while an absent New Zealand economic calendar will leave the NZD/USD pair adrift to US Dollar dynamics.
NZD/USD Price Analysis: Technical outlook
From a daily chart perspective, the NZD/USD has been trending up during the week until today, when it could not crack the 0.6355 daily high and retreated toward the 0.6300-0.6310 area. Also, the Relative Strength Index (RSI) shows buyers are losing momentum, while the 20-day Exponential Moving Average (EMA) at 0.6299 keeps the major from dropping. Even though the NZD/USD clings to its gains, the Rate of Change (RoC) signals sellers could be positioning for further downside action. Therefore, the NZD/USD first support would be the 0.6300 figure, followed by the 20-day EMA and the 200-day EMA at 0.6255. Once cleared, the next support would be the 50-day EMA at 0.6187.
-
20:10
Forex Today: Trading remains choppy ahead of year-end
What you need to take care of on Thursday, December 29:
The US Dollar dollar advanced in the last trading session on Wednesday, helped by a souring market mood. Global stock markets closed in the red, with the focus still on China and the potential effects of a full reopening. On the one hand, market players welcomed news the government is shifting away from its zero-covid policy to favor economic growth. On the other, it fears that such change would fuel price pressures and put skyrocketing inflation under the spotlight. Major indexes are headed to post the worst year in over a decade.
The 10-year US Treasury note yield stands at 3.88%, more than double the roughly 1.5% it offered at the end of 2021. The 2-year note currently yields 4.35% after paying around 0.75% at the beginning of the year. One thing leads to another, as speculation inflation could rise again, pushing yields at the shorter end of the curve higher, which in turn, fuels concerns about a potential recession.
OPEC+ detached from the Russian decision to cut oil exports to countries that adhere to the price cap. Crude oil edged lower intraday but trimmed intraday losses ahead of the close. WTI trades at around $78.80 a barrel.
Spot gold eased further but managed to retain the $1,800 level and trades at $1,805 a troy ounce.
Commodity-linked currencies were firmly lower, weighed by stocks and oil prices. USD/CAD trades at around 1.3600, while AUD/USD hovers around 0.6740.
The EUR/USD pair remains above 1.0600, down for the day while GBP/USD hovers around 1.2025. Finally, the USD/JPY pressures its weekly highs in the 134.30 region.
BTC Price Analysis: Bitcoin traders hanging on in the belief last-minute pop is still possible
Like this article? Help us with some feedback by answering this survey:
Rate this content -
19:24
USD/CAD edges higher toward 1.3590s amidst a robust US Dollar, risk aversion
- USD/CAD rebounds from weekly lows around 1.3520s and closes to the 1.3600 mark.
- Overall, US Dollar strength and falling oil prices keep the USD/CAD rallying.
- USD/CAD Price Analysis: Upward biased, and a daily close above 1.3600, could pave the way to 1.3700.
The USD/CAD erases Tuesday’s losses and forms a tweezers bottom candle pattern, as it failed to crack the 50-day Exponential Moving Average (EMA) at 1.3583. Also, a sudden shift in market mood increased appetite for the US Dollar (USD) due to its safe-haven status. At the time of writing, the USD/CAD is trading at 1.3590 after hitting a low of 1.3485.
US Pending Home Sales plummets, though sentiment lifts the US Dollar
Wall Street extends its losses for the second straight day. The National Association of Realtors reported that Pending Home Sales for the United States (US) dropped 4% MoM vs. expectations for a 4.6% contraction, which was better than estimated. However, it fell to its lowest level outside the pandemic, in data back to 2001. On an annual basis, Pending Sales plunged to 37.8% YoY, below a 37% fall.
In the meantime, the Richmond Fed Manufacturing Index improved to 1, exceeding the previous month’s contraction to -9.
Although sentiment improved throughout the Asian and European sessions, courtesy of China’s relaxing Covid-19 restrictions, of late, shifted sour. Fears that the full reopening of China could unleash another virus outbreak weighed on Wall Street, which turned red. Chinese authorities began to issue travel permits to Hong Kong residents and passports as it prepares to reopen borders on January 8.
A strong American Dollar keeps the Canadian Dollar (CAD) pressured. The US Dollar Index (DXY), a gauge of the greenback’s value against a basket of its rivals, advances 0.18%, at 104.454, underpinned by higher US Treasury bond yields. The 10-year benchmark note rate edges up three and a half bps at 3.879%.
Another reason that keeps the Loonie under pressure is the oil price, with WTI’s extending its losses below $80.00 a barrel, after failing to clear the 200-day Exponential Moving Average (EMA) at $81.54.
In the week ahead, the US economic docket will feature Initial Jobless Claims for the week ending on December 23, while the Canadian calendar will unveil the CFIB Business Barometer on Friday.
USD/CAD Price Analysis: Technical outlook
From a technical perspective, the USD/CAD continues to advance, and it’s approaching the 1.3600 mark. The Relative Strength Index (RSI) shifted bullish above the 50-midline, while the Rate of Change (RoC) is still flashing signs that selling pressure is beginning to wane. Another reason to expect further upside is the bounce at the 50-day EMA at 1.3528 and a break above the 1.3600 mark.
If the USD/CAD clears the 1.3600 mark, the following resistance would be the December 23 high of 1.3658, followed by the December 22 pivot high at 1.3684. Once those levels are cleared, the next stop would be 1.3700.
-
18:13
United States 5-Year Note Auction: 3.973% vs previous 3.974%
-
17:45
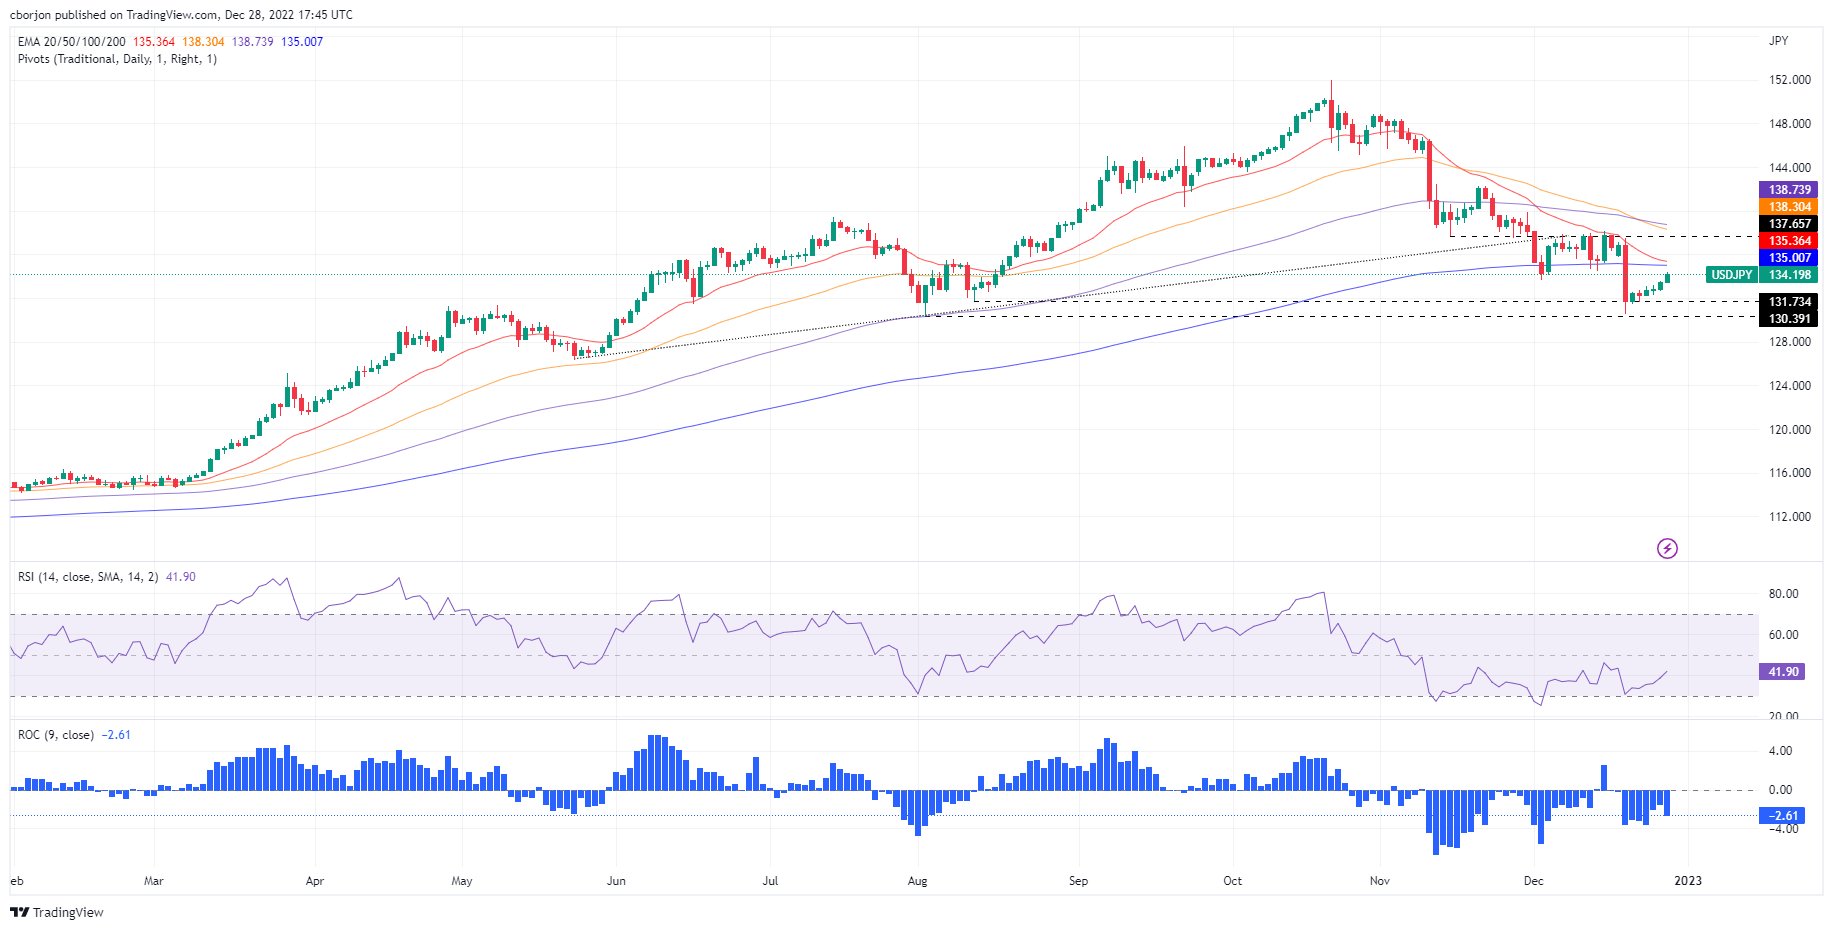
USD/JPY Price Analysis: Remains below the 200-DMA, albeit reclaiming 134.00
- USD/JPY is back above 134.00, eyeing a challenge of the 200-day EMA.
- The major is consolidated around 130.50/134.40 after dropping below the 200-day EMA.
- USD/JPY Price Analysis: Minor divergence between price action and the RoC suggests a fall below 134.00.
The USD/JPY has advanced steadily since the December 20 500-pip fall after the Bank of Japan (BoJ) removed the cap of 0.25% to the 10-year Japanese Government Bond (JGB), catching traders off guard. Therefore, the Japanese Yen (JPY) strengthened, though it has erased some of its gains. At the time of writing, the USD/JPY is trading at 134.17, up by 0.54%.
USD/JPY Price Analysis: Technical outlook
The USD/JPY daily chart shows the pair edged below the 200-day Exponential Moving Average (EMA), opening the door for further losses. Since then, the USD/JPY consolidated at around the 130.50/134.40 range, due to light liquidity conditions, amidst the last trading week of 2022. The Relative Strength Index (RSI) is in bearish territory, while the Rate of Chance (RoC) suggests that sellers are gathering momentum, even though the USD/JPY reached higher highs. Therefore, a minor divergence between price action and the RoC could pave the way for further losses in the USD/JPY.
If the USD/JPY fails to clear the 200-day EMA at 135.00, the next support would be the 134.00 mark. Break below will expose the December 27 daily low of 132.63, followed by the August 11 swing low of 131.73.
An alternate scenario, if the USD/JPY clears the 200-day EMA, that could pave the way towards November 15 swing low-turned-resistance at 137.65, though it would face some resistance on its way north, like the 136.00 figure.
USD/JPY Key Technical Levels
-
16:54
AUD/USD hovers around 0.6750s as Wall Street edges lower
- AUD/USD clings to decent gains as the mood shifts sour.
- A jump in US Treasury bond yields underpins the US Dollar and weighs on the Australian Dollar.
- AUD/USD: Struggles at the 0.6800 and tumbles 50 pips beneath the 0.6750 mark.
The Australian Dollar (AUD) appears to have bottomed around the 0.6680 area since December 19 and advanced toward the 0.6800 region amid an upbeat sentiment. Nevertheless, the choppiness of the last trading week of 2022 keeps traders at bay from opening fresh longs ahead of the month, quarter, and year-end flow, which usually benefits the US Dollar (USD). At the time of writing, the AUD/USD is trading at 0.6785.
Market sentiment shifted sour following the release of US Pending Home Sales for November, which plunged to 37.8% YoY contraction, compared to a previous reading of a 37% fall, while on a monthly basis, dived slightly improved but remained at -4% vs. expectations of -4.6%. According to the National Association of Realtors report, signings decreased to the lowest level outside of the pandemic in data back to 2001.
Aside from this, the Richmond Fed Manufacturing Index improved to 1, exceeding the previous month’s contraction to -9.
Even though sentiment improved throughout the Asian and European sessions, courtesy of China’s relaxing Covid-19 restrictions, of late shifted sour. Fears that the full reopening of China could unleash another raft of higher prices turned Wall Street into negative territory. Chinese authorities began to issue travel permits to Hong Kong residents and passports as it prepares to reopen borders on January 8.
The US Dollar Index, a gauge of the American Dollar (USD) value against a basket of peers, is recovering some ground back above 104.000, gaining 0.12%, underpinned by US yields. The 10-year benchmark note rate is up three and a half bps, at 3.879%.
AUD/USD Price Analysis: Technical outlook
From a technical perspective, the AUD/USD trades within the boundaries of the 200-day Exponential Moving Average (EMA) and the 20-day EMA, each at 0.6822 and 0.6718. After peaking at a two-week high of 0.6801, the AUD/USD edged lower, while the Relative Strength Index (RSI) has been unable to crack above the 60 mark, signaling that buying pressure is abating. If the AUD/USD tumbles below 0.6750, the next support would be 20-day EMA at 0.6718. Breach of the latter will expose the 0.6700 mark.
As an alternate scenario, the AUD/USD first resistance would be 0.6800, followed by the 200-day EMA at 0.6822.
-
16:37
Gold Price Forecast: XAU/USD hits daily lows under $1,800
- A stronger US Dollar and higher US yields sent gold prices below $1,800.
- Next support is a short-term uptrend line around $1,795.
- US stocks turn negative, adding support to the Dollar.
Gold prices extended losses during the American session and printed a fresh daily low at $1,797. Currently, XAU/USD is hovering around $1,800 with a bearish bias.
A slide back under $1,800 would make gold vulnerable to a decline to test an uptrend line around $1,795. A break below could trigger more losses, to the $1,785 zone. Below the next support is located at $1,773 (Dec 15 & 16 low).
On the upside, Gold faces immediate resistance at $1,805. A break above $1,810 would improve the short-term outlook for the yellow metal. The critical level continues to be $1,820: a consolidation above would add a new support for a test of $1,830.
Dollar strengthens
The slide in Gold took place as equity prices in Wall Street turned negative and amid a rebound in US yields to fresh daily highs. The context weighed on XAU/USD. The US Dollar Index rose from the lowest level in almost a week at 103.84 to 104.45, the strongest since Friday.
Silver is falling by 1.80% and crude oil tumbles 2%. The Dow Jones is losing 0.53% and the Nasdaq 0.95%.
XAU/USD 4-hour chart
-638078416019854202.png)
-
16:01
EUR/USD drops from 13-day highs to fresh daily lows near 1.0600
- EUR/USD makes a run to weekly highs and retreats.
- Pair now closer to the daily low as US yields rise.
- Equity markets turn negative, oil sinks.
The EUR/USD failed to break the current range despite hitting the highest level in 13 days. The pair peaked at 1.0675 and then pulled back. It is trading at daily lows under 1.0620.
The short-lived run to 1.0675 coincided with the US dollar bottoming across the board. Afterwards, boosted by a rebound in US yields. The US 10-year yield rose from 3.82% to 3.87%, a fresh monthly high. Equity prices in the US turned negative adding some support to the greenback. The US Dollar reversed sharply during the last hour. The DXY rose from 6-day lows at 103.84 to 104.42, the strongest since Friday. Crude oil prices are falling by more than 2%.
Economic data released in the US showed mixed numbers. Pending Home Sales in November dropped unexpectedly by 4% against expectations of a 0.6% increase; compared to a year ago sales are down by 37.8%. The Richmond Fed Manufacturing Index jumped in December to 1 from -9, surpassing the market consensus of -4.
Levels to watch
The EUR/USD was again rejected from the 1.0660/70 area and it reversed. Now it is moving toward 1.0600. A break lower would expose the lower limit of the current range at 1.0580. A consolidation below would point to a deeper correction, with the next support seen at 1.0530.
Technical levels
-
16:00
Russia Unemployment Rate declined to 3.7% in November from previous 3.9%
-
16:00
Russia Industrial Output: -1.8% (November) vs -2.6%
-
15:49
Gold Price Forecast: XAU/USD to enjoy further gains towards $1,876/96 and potentially beyond – Credit Suisse
Gold is above its 200-Day Moving Average at 1,785. Economists at Credit Suisse expect the yellow metal to extend its rise towards $1,876/96.
Gold to outperform the broader commodity complex
“Whilst we see room for further tactical gains towards $1,876/96 and potentially beyond, the overall environment remains choppy, which keeps our broader technical outlook neutral.”
“With Bloomberg Commodity TR Index (BCOM) weakening and Gold stabilizing, the precious metal has already made some gains relative to the broader commodity index and with a base in relative terms now seen in place, we believe the technical evidence suggests that Gold is likely to continue outperforming BCOM over the coming 6-12 months.”
-
15:14
USD/MXN to gradually rise towards 20.25 by end-2023 – SocGen
The Mexican Peso is the third best performing EM currency in 2022 after the RUB and BRL and analysts at Société Générale believe this run could carry on into 2023.
MXN offers good positive total return potential on a 12-month horizon
“The main downside risks stem from sluggish US and growth outlook, the weakening of Mexico’s terms of trade (lower commodity prices). However, the tailwinds from attractive carry-to-vol, macro stability and low external imbalances mean the Peso may still outperform Latam peers next year.”
“MXN should also benefit from FDI inflows relating to Mexico remaining a strategic investment hub for US near-shoring and re-shoring from China.”
“Our house call is for USD/MXN to gradually rise towards 20.25 by end-2023.”
“With the policy rate of 10.50% and benchmark 10y yield near 9%, we think the Peso offers good positive total return potential on a 12-month horizon.”
-
15:14
EUR/JPY looks to test the 20-day SMA at 143.00
- EUR/JPY recovers from short lived correction, back near 143.00.
- Japanshort-livedes momentum as bonds trims gains.
- EUR/USD tests the upper limit of the current range, break could trigger more gains in the cross.
The e EUR/JPY is rising for the fourth consecutive day. On Asian hours the cross peaked at 142.93, the highest level since December 20. It then pulled back to as low as 142.11. The correction was short-lived and it resumed the upside.
The 143.00 area is on the radar. It is a round number and also where the 20-day Simple Moving Average stands. A firm break above could open the doors to more gains. A failure at current levels could trigger a deeper correction, probably toward the strong barrier at 141.20.
The EUR/JPY is recovering after hitting last week at 138.77, the lowest level since late September. The Yen surged after the Bank of Japan meeting, having the biggest daily gain in years and since then it has been trimming those gains.
On Tuesday, sovereign bond yields jumped, adding to Yen’s weakness. On Wednesday yields look steady while equity markets are mixed. Trading activity is subdued amid the holidays.
Price action in EUR/USD could impact the EUR/JPY. The pair is testing the upper limit of the current range. The first attempt is being followed by a retracement that could weigh on the cross. On the contrary, a rally above 1.0670 would help EUR/JPY bulls.
Technical levels
-
15:05
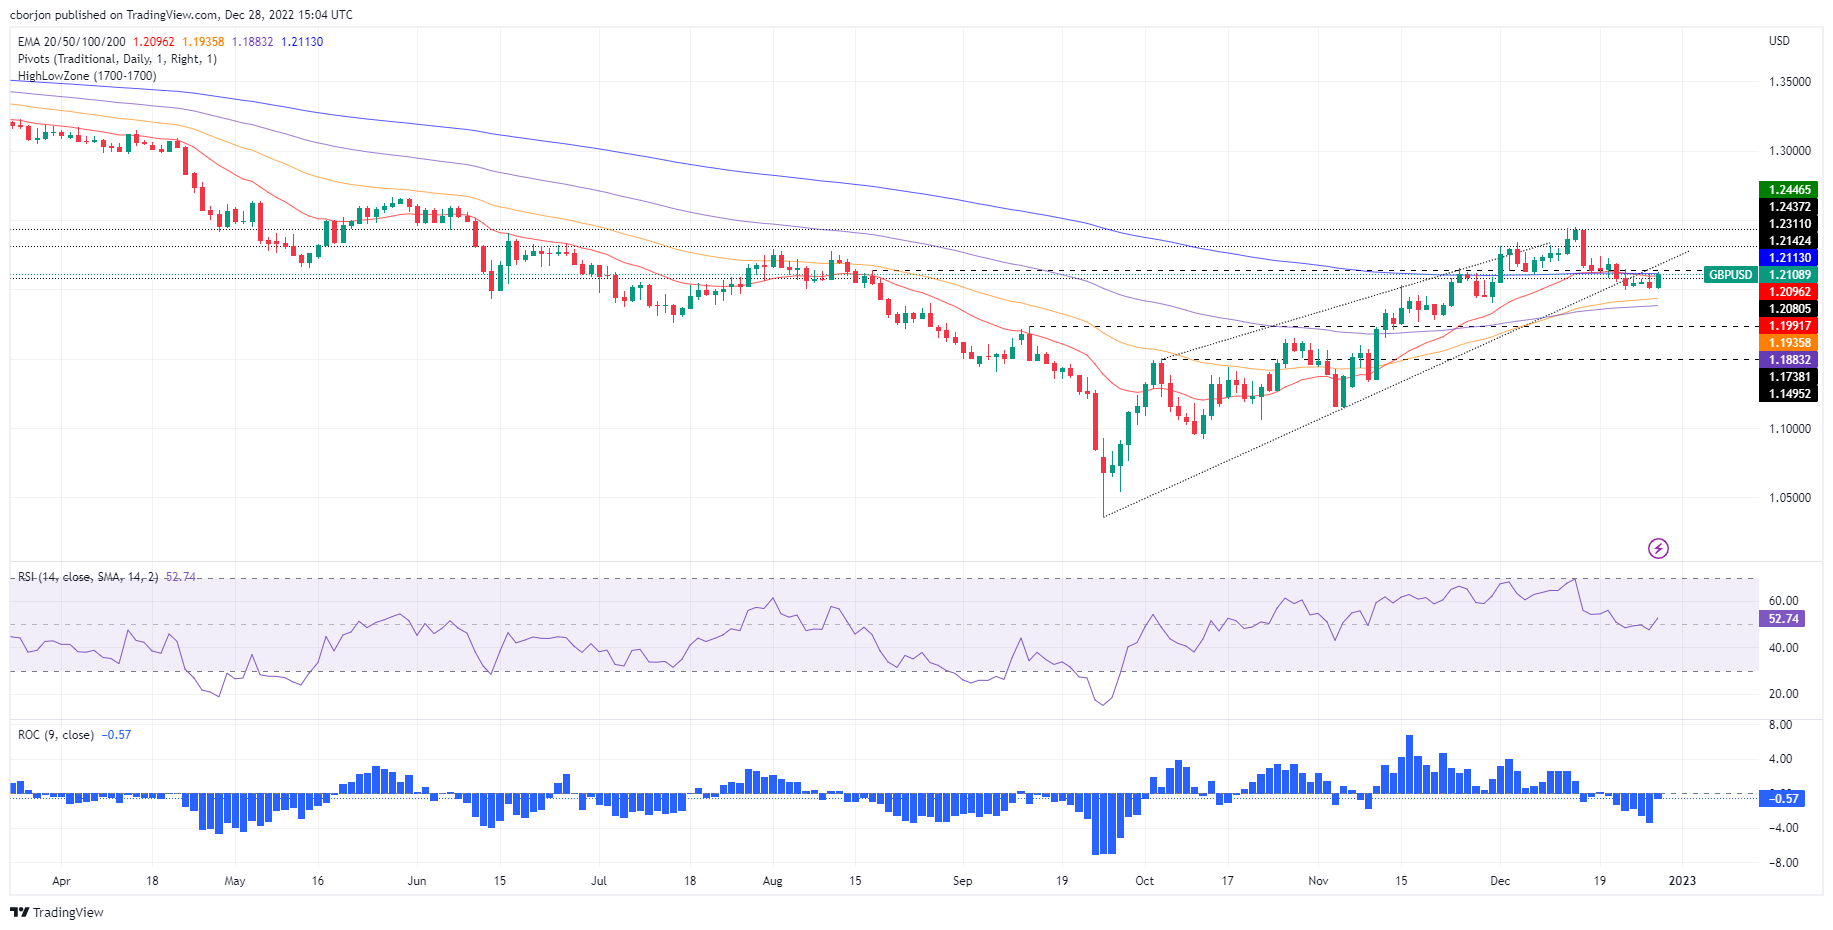
GBP/USD climbs above 1.2100 on upbeat mood, soft USD
- GBP/USD is back above the 1.2100 figure, courtesy of the US Dollar weakness.
- China’s relaxing Covid-19 restrictions keep sentiment positive.
- GBP/USD> Testing the 20 and 200-DMAs, on its way toward 1.2200.
The Pound Sterling advances sharply following a European choppy trading session, bouncing off the day’s lows around 1.2000, posing a challenge to the 1.2100 figure in the New York session. At the time of writing, the GBP/USD is trading at 1.2108.
Improvement in sentiment weighs on the USD
Investors’ mood is mixed amidst the North American session. The lack of US economic data, with the US Redbook released around 13:55 GMT, coming at 9.6% YoY, compared to the previous reading of 7.6%, failed to underpin the US Dollar (USD). Later at 15:00 GMT, US Pending Home Sales for November and the Richmond Fed Indices are expected to improve slightly compared to its previous readings.
Another factor that improved traders’ sentiment is that China is removing Covid-19 restrictions on visitors while beginning to issue travel permits to Hong kong residents. Additionally, authorities started to issue passports and would officially reopen its borders on January 8. Even though the mood shifted positively, fears that inflationary pressures would rise keep traders wary.
In the meantime, the US Dollar Index (DXY), a gauge of the buck’s value against a basket of peers, losses 0.28%, down at 103.984, undermined by falling US Treasury bond yields.
Ahead into the week, the UK economic docket is empty, while the US calendar will feature Initial Jobless Claims for the week ending on December 23, ahead of the release of the Chicago PMI on Friday.
GBP/USD Price Analysis: Technical outlook
From the daily chart perspective, the GBP/USD is testing the 20 and 200-day Exponential Moving Average (EMA) at 1.2113 after bouncing from weekly lows around 1.2000. If the former is cleared, the nest resistance would be an upslope trendline previous support-shifted- resistance around 1.2180, followed by the 1.2200 figure. On the flip side, failure to stay above 1.2100 could pave the way toward weekly lows at 1.2000 and the 50-day EMA at 1.1935.
-
15:04
US: Pending Home Sales decline by 4% in November vs +0.6% expected
- Pending Home Sales in the US continued to contract in November.
- US Dollar Index stays in negative territory near 104.00.
Pending Home Sales in the US declined by 4% on a monthly basis in November, the data published by the National Association of Realtors showed on Wednesday. This reading followed October's decrease of 4.6% and came in much worse than the market expectation for an increase of 0.6%.
On a yearly basis, Pending Home Sales plunged by 37.8%, compared to analysts' estimate for a decline of 36.7%.
Market reaction
The US Dollar Index showed no immediate reaction to these figures and was last seen losing 0.22% on the day at 104.04.
-
15:00
United States Richmond Fed Manufacturing Index registered at 1 above expectations (-4) in December
-
15:00
United States Pending Home Sales (YoY) came in at -37.8% below forecasts (-36.7%) in November
-
15:00
United States Pending Home Sales (MoM) came in at -4% below forecasts (0.6%) in November
-
14:44
USD/JPY to see a deeper downtrend on failure to defend 130.40 – SocGen
USD/JPY met projections near 150/152 in October and has embarked on a steady pullback. A break under 130.40 would open up further losses towards 128, then 125.85/124.00, analysts at Société Générale report
Downtrend to deepen if 130.40 is violated
“The pair is now in vicinity to August trough near 130.40. An initial bounce is not ruled out however 138 is likely to cap.”
“Failure to defend 130.40 would mean a deeper downtrend. Next potential objectives could be at projections of 128 and 2015 levels of 125.85/124.00.”
-
13:58
United States Redbook Index (YoY): 9.6% (December 23) vs 7.6%
-
13:54
EUR/GBP finds resistance at 0.8860 and returns to 0.8800 area
- The Euro trims gains after failure at the 0.8860 resistance area.
- The Poundnappreciates across the board amid a softer USD.
- Longer-term, the pair remains positive, with the GBP weighed after BoE's dovish hike.
The Euro has been unable to breach the 0.8860 resistance area on Wednesday. The pair retreated to 0.8800 at the moment of writing, retracing Tuesday’s gains, and is on track to put an end to a five-day winning streak.
The pound picks up on a quiet market session
The Sterling is trimming losses on Wednesday, underpinned by a mild recovery on the GBP/USD, as the US Dollar loses ground across the board in a thin market session and amid a moderate appetite for risk.
In absence of key macroeconomic releases, investors remain moderately upbeat following news that the Chinese authorities are set to end the restrictions for inbound travelers, which is expected to accelerate economic recovery in the major Asian economy.
On a longer-term perspective, however, the Pound remains on the defensive, with the EUR/ GBP nearly 3% up in the last two weeks.
The Bank of England hurt GBP demand after slowing down its tightening cycle after its December monetary policy meeting. The BoE hiked rates by 0.5%, following a 0.75% hike in November, with two out of the nine committee members voting to leave rates unchanged. This has boosted speculation about a softer normalization phase in 2023 and possibly a lower interest rate peak.
Technical levels to watch
-
13:13
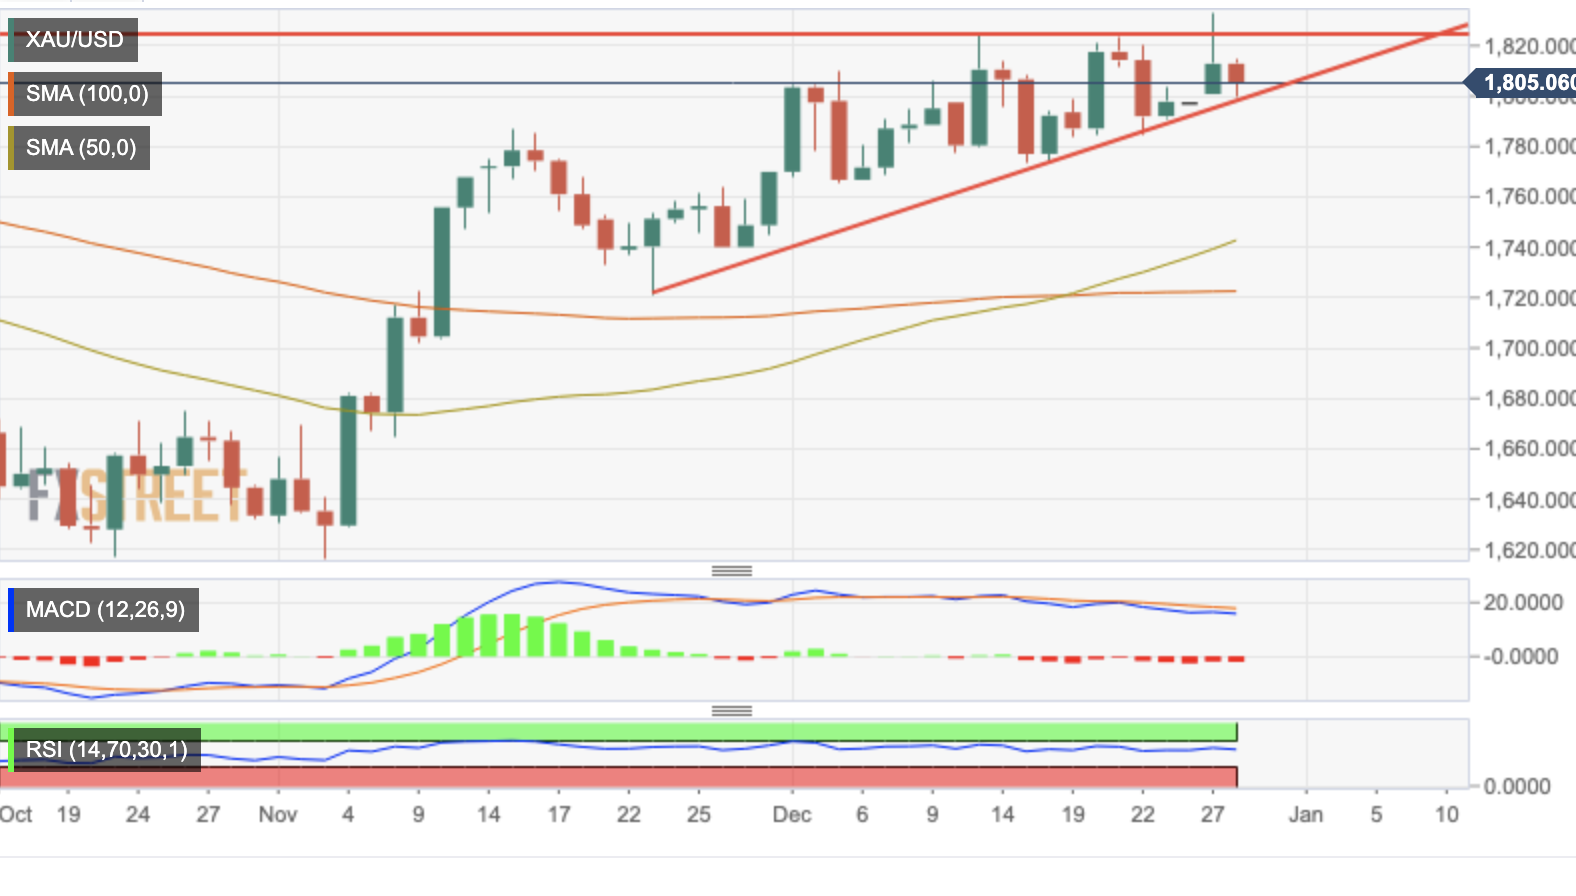
Gold Price Forecast: XAU/USD testing support at $1,800 after rejection at $1,830
- Gold treats from $1,835 to test support at the $1,800 area.
- A moderate risk appetite is weighing on demand for the precious metal.
- XAU/USD, approaching the apex of an ascending triangle pattern.
Gold futures are testing support at the $1,800 mark on Wednesday’s European session, after pulling back from Tuesday’s high at $1,833. Bullion prices have been treading water above $1,825 for the last two weeks, following a 12% rally from mid-November lows near $1,600.
Gold loses ground amid a moderate risk appetite
The precious metal has been trading lower on Tuesday, giving away gains after a spike high to $1,835 seen on Tuesday. The moderately positive market mood, triggered by news that China is scrapping quarantine for inbound travelers has lifted the market mood in an otherwise quiet post-Christmas market.
Furthermore, the US Dollar remains on the back foot, with the Dollar Index trading 0.2% lower on daily charts and moving right above the 104.00 level, following a moderately positive opening, which pushed the DXY to session highs at 104.35.
XAU/USD moving in an ascending triangle pattern
From a technical perspective, the daily chart shows the pair approaching the apex of an ascending triangle pattern, limited by a resistance area at $1,825, and trendline support from late-November lows, now around $1,795.
With the MACD indicator in negative territory, a confirmation below the mentioned $1795 would negate the uptrend and boost sellers' confidence to push the pair towards $1765/75 December 6 and 15 lows and November 23 low at $1720.
On the contrary, a run-up above the $1825/35 resistance area would confirm the bullish pattern and set the pair aiming to June high at $1,880 before the $1,900 psychological level.
XAU/USD daily chart
Technical levels to watch
-
13:09
Brent Crude Oil to extend its decline to 63.02 – Credit Suisse
Brent Crude Oil has been on a choppy decline since early summer. In the view of strategists at Credit Suisse, the black gold has not seen the end of its decline.
Decline is not over yet
“The market remains well below its 55-Day Moving Average and 200DMA at 89.01 and 100.67, and with medium-term momentum declining and global growth concerns looming, we think further weakness is likely to follow.”
“Brent is likely in due course to see further downside towards the 61.8% retracement at 63.02, where we would have higher confidence of a more stable floor and for a consolidation phase to emerge.”
“Only a move above the 200DMA and the downtrend from the 2022 peak at 100.67/102.13 would see scope to stabilize the market and challenge our bearish outlook.”
-
12:17
USD Index to rebound towards 108 if defends 103 – SocGen
The US Dollar Index (DXY) stays quiet slightly above 104.00. Holding above 103 is crucial to see a gradual bounce, economists at Société Générale report.
Defense of 103 could spur a bounce
“DXY is drifting towards 2020 peak of 103.00. This could be a potential support. Defending it can lead to a gradual bounce however recent pivot high near 108 is expected to be a short-term resistance. Failure to cross this can result in persistence of downtrend.”
“Failure to hold 103 would mean a much deeper down move. In such a scenario, the index could dip towards 101.90/101.30, the 50% retracement from 2021 and 100.”
-
12:09
EUR/USD bounces up to approach 1.0650 with the US Dollar losing ground
- The euro bounces up at 1.0625 and approaches 1.0650 area.
- The US Dollar turns lower on thin post-Christmas trading.
- EUR/USD should return above 1.0780 to confirm the longer-term uptrend – SocGen
The Euro is regaining some upside traction during Wednesday’s European trading. The pair has bounced up from the intra-day low at 1.0625 to regain lost ground, approaching the 1.0650 area.
On a wider perspective, however, the common currency remains trapped within a horizontal channel between 1.0610 and 1.0650, consolidating gains after an 11% rally from September lows at 0.9535.
The Dollar ticks down on a thin trading session
In the absence of key macroeconomic drivers, the dollar remains on the back foot this week amid growing speculation that the Federal Reserve will slow down the monetary tightening cycle in 2023.
US data released last Friday showed that inflationary pressure has eased for the third consecutive month in November, suggesting that the peak of inflation might have passed. These figures would offer some leeway for the Federal Reserve to ease tame its hawkish stance over the coming months which has increased selling pressure on the USD.
Furthermore, the moderately positive market sentiment, buoyed by news that China is scrapping restrictions for inbound travelers and relaxing the covid control policy in the country, is putting additional pressure on the safe-haven USD.
The US Dollar Index, which opened the day on a mildly positive tone, has turned lower from session highs at 104.35 during the European session, losing about 0.25% to approach the 104.00 level.
EUR/USD needs to return above 1.0780 to resume its uptrend – SocGen
Analysts at Société Générale point out to 1.0780 as a crucial level to confirm the longer-term bullish bias: “Recent bout of bounce has developed within two converging ascending trend lines forming a rising wedge; this generally denotes receding upward momentum. This is also highlighted by daily MACD which has turned flattish (…) In case the rebound falters near 1.0780, a short-term pullback is not ruled out towards the 200DMA at 1.0340 and 1.0220.”
Technical levels to watch
-
12:01
Mexico Jobless Rate came in at 2.8% below forecasts (3.3%) in November
-
12:00
Mexico Jobless Rate s.a: 3% (November) vs previous 3.2%
-
11:36
Euro Stoxx 50 must overcome 4020/4080 to extend the uptrend – SocGen
Euro Stoxx 50 failed to cross resistance zone of 4020/4080. A move beyond here is essential for affirming an extended uptrend, economists at Société Générale report.
3730/3670 is near term support
“Resistance zone of 4020/4080, representing the high of March and the 61.8% retracement from last year, remains a key hurdle that must be overcome for affirming an extended uptrend.”
“If the index establishes itself below the support at 3670, a deeper decline could materialize towards 3550 and 3435, the 76.4% retracement of recent rebound.”
-
11:32
USD/CHF fails to return above 0.9300 with the Dollar losing ground
- The US Dollar revisits session lows at 0.9275 after failure at 0.9300.
- The pair remains moving in recent ranges in a thin market session.
- Speculation about a potential US recession and Fed easing in 2023 are hurting Dollar demand.
The Greenback’s attempt to regain the 0.9300 level seen on Wednesday’s early European session has been capped at 0.9305. The pair, however, remains within recent ranges, supported above 0.9275/80 and moderately positive on daily charts.
The USD treads water, weighed by Fed easing speculation
In absence of relevant macroeconomic releases this week, the cooling US inflation figures seen on Friday have boosted speculation about a slowdown on the Federal Reserve’s monetary tightening path in 2023, which is keeping Dollar bulls in check.
Furthermore, a recent batch of lackluster US indicators has spurred concerns about the possibility of a recession in 2023, which add pressure on the US central bank to abandon its hawkish stance ahead of schedule.
The US Dollar Index, as a matter of fact, is accelerating its reversal from session highs at 104.35, losing 0.2% on the daily chart after a moderately positive session opening and erasing Tuesday’s mild recovery.
Furthermore, the flat US Treasury bond yields are failing to stimulate Dollar bulls, while the market mood remains moderately upbeat, with the major European stock indexes in the green on the back of news that China is planning to end restrictions to inbound travelers from January 8.
Regarding the macroeconomic calendar, the Swiss ZEW survey has shown a larger-than-expected improvement in economic expectations, with a -42.8 reading in December against market expectations of -50.5 and from the -57.5 seen in the previous month.
During the North American session, the US Pending Home sales, the Richmond Fed Manufacturing index, and oil stocks figures might offer some distraction to currency traders.
Technical levels to watch
-
10:56
USD to be more stable in 2023 after initial weakness in Q1 – Credit Suisse
The US Dollar is likely to be more stable in 2023 after two years of trending strongly higher. Strategists at Credit Suisse expect further USD weakness in Q1, followed by the development of a broad rangebound environment.
Further USD weakness in Q1, followed by a broad range
“For the DXY, we look for a test of a cluster of supports in the 102.99/101.99 zone – the March 2020 high, the 50% retracement of the 2021/2022 bull trend and importantly the back of the 2017/2022 five-year bull ‘triangle’ pattern. We then look for the DXY to find an important floor here.”
“Our bias is that this will not be the beginning of a fresh move that takes the USD back to its 2022 highs but rather a rally in what we look to be a broader sideways range that we think could dominate all year, especially given that we have just had two years of strongly trending markets.”
“Immediate resistance for a recovery is seen at 105.80/106.00, back above which should further reinforce a range trading environment, with resistance seen next at 107.68/108.00, potentially as far as 110.00/110.45.”
“Should weakness extend below 101.30, this would warn of further weakness to 99/98.98, potentially even back to the 38.2% retracement of the entire 2008/2022 uptrend at 97.94.”
-
10:42
GBP/USD, steady above 1.2020, approaches session highs at 1.2055
- The Pound bounces up from 1.2020 and approaches 1.2055 session highs.
- The pair remains practically flat in a quiet trading session.
- GBP/USD needs to regain 2.2450 to confirm its longer-term uptrend – SocGen.
Sterling’s reversal from the intra-day high of 1.2055 seen on the early European session opening has been supported near 1.2020, and the pair picked up again to reach the 1.2040 area so far.
On a wider perspective, the GBP/USD remains practically unchanged on the daily chart, hovering within the lower range of the 1.20s after the reversal from six-month highs at 1.2450 seen last week.
The Pound, looking for direction on a thin trading session
The pair lost momentum earlier this month after the Bank of England slowed down the monetary tightening pace after its December meeting. The bank hiked rates by 50 basis points, with two of the nine committee members voting to leave rates unchanged.
The BoE’s decision has triggered speculation of an easier monetary tightening in 2023 and suggests that interest rates might peak at a lower level than previously estimated. Some market sources anticipate a Bank Rate peak at 4% next year instead of the previously expected 6%.
Forex markets remain practically flat on a post-Christmas week, with stock markets posting moderate advances, buoyed by the Chinese Authorities’ announcement of the end of the restrictions for inbound travelers, which is expected to trigger a sharp economic recovery in the Asian country.
GBP/USD needs to regain 1.2450 to confirm the longer-term uptrend – SocGen
From a technical point of view, analysts at Société Générale see 1.2450 resistance as a crucial element to confirm the larger-term uptrend: “Recent peak at 1.2450 is expected to be an intermittent resistance. Failure to cross above this hurdle can result in a phase of pullback (…) Recent pivot low of 1.1900 is near-term support. A break can lead to a deeper pullback towards the October high of 1.1640.”
Technical levels to watch
-
10:14
AUD/USD needs to establish beyond 0.6900 to extend its move higher – SocGen
AUD/USD is stalling at the 200-Day Moving Average of 0.6900. A move above here is essential to see further gains, analysts at Société Générale report.
Support aligns at 0.6520
“AUD/USD has staged the expected uptrend after breaking out of a small base in November. It has faced resistance near its falling 200DMA at 0.6900. This was fourth attempt of crossover since May for the pair; establishing itself beyond 0.6900 is essential for affirming continuation in up-move.”
“A short-term consolidation is not ruled out; upper end of recent base at 0.6520 is near term support. In case this gets violated, a deeper down move is likely towards 0.6340, the 76.4% retracement of the bounce and 0.6170/0.6100.”
-
10:01
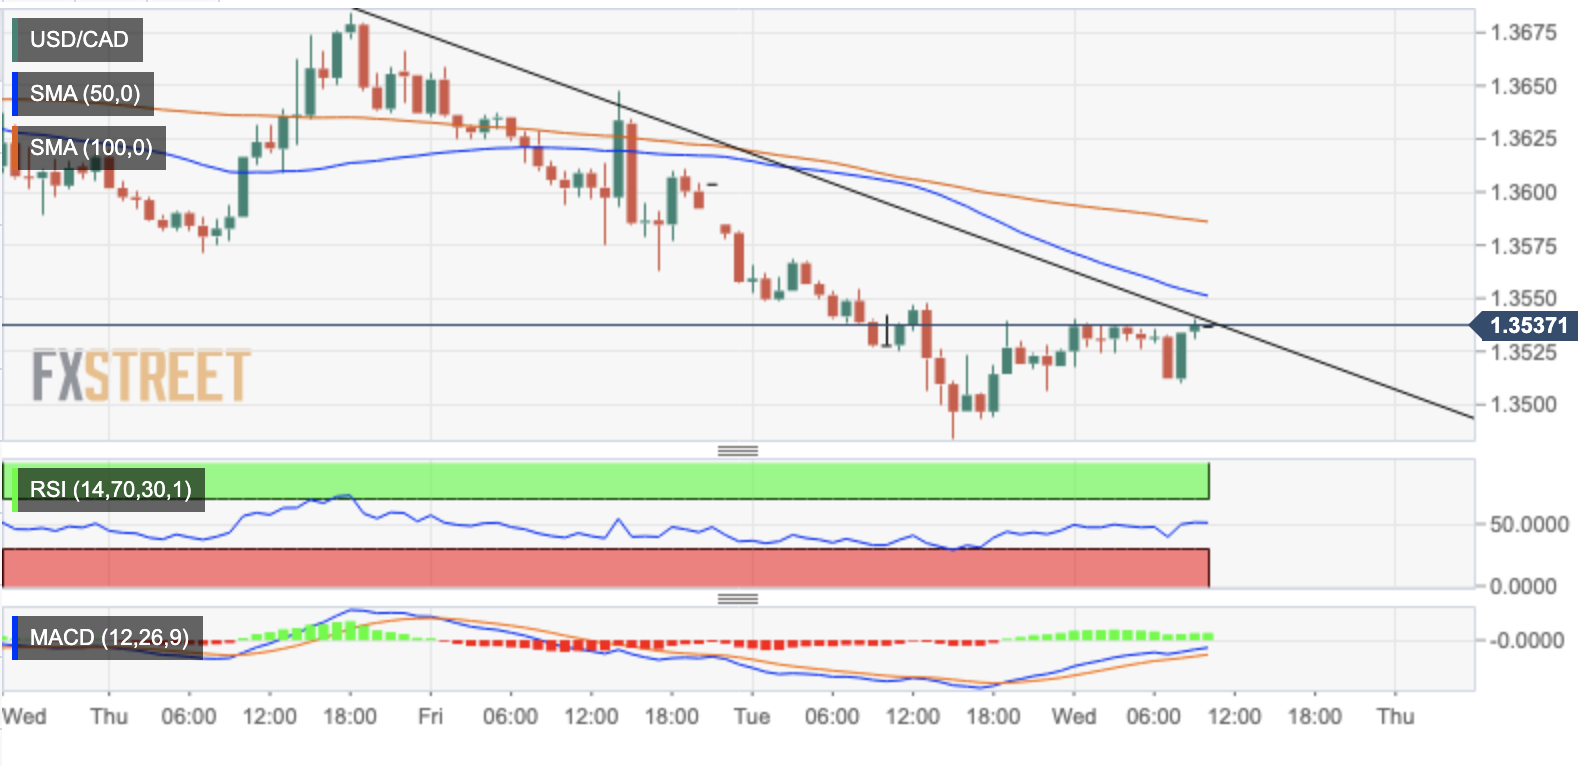
USD/CAD bounces up from 1.3510 to retest 1.3540 intra-day high
- The US Dollar bounces up and tests session highs at 1.3540.
- The CAD rally loses steam with oil prices retreating.
- A confirmation above 1.3540 might cancel the near-term downtrend from the 1.3690 high.
The US Dollar has bounced up from the 1.3510 low on Wednesday’s early European session to retrace previous losses and test the 1.3540 resistance area which, so far, remains intact.
The Lonie loses ground with oil prices droppingIn a thin post-Christmas trading session, decline on crude prices might be weighing on the commodity-linked CAD. The US benchmark WTI trading at $78.80, about 3% below the $81.15 peak hit on Tuesday.
The oil export ban to countries applying a price top for Russian crude has failed to trigger a remarkable impact on crude prices so far. The fact that the Russian decree might not apply to countries with formal bans might have eased fears of a shortage in global supply.
On the other end, the US Dollar remains practically flat. The USD Index, which measures the value of the US Dollar against a basket of the most traded currencies is moving near session opening times.
The cooling US inflation data released last Friday, with the US Core PCE Prices Index retreating for the third consecutive month has spurred speculation about a slowdown on the Federal Reserve’s monetary tightening path, which is weighing US Dollar demand.
USD/CAD testing important resistance at 1.3540
From a technical point of view, the pair has reached a relevant resistance area at 1.3540 where the USD is testing the downward trendline resistance from December, 22 high.
With RSI and MACD indicators pointing higher on the hourly chart, a successful breach of the mentioned 1.3540 might find resistance at the 50 SMA, now around 1.3555 before visiting previous support at 1.3575.
On the downside, immediate support lies at the 1.3510 intra-day low, and below here, Dec ember 27 low at 1.3485 and December 5 low at 1.3385.
USD/CAD Hourly Chart
Technical levels to watch
-
09:43
USD/JPY to extend its fall toward 127.47/27 – Credit Suisse
Economists at Credit Suisse believe USD/JPY has seen an important peak in 2022 and look for further weakness to 127.47/27.
USD/JPY has established a major peak
“The surprise BoJ tweak to their Yield Curve Control (YCC) framework should further reinforce the likelihood for continued weakness into Q1 2023 and reinforce the view that we have seen a major peak in USD/JPY in 2022.”
“We maintain our target of 127.47/27, which is the 50% retracement of the 2021/2022 bull trend and more importantly the ‘neckline’ to the 2007/2022 base, and this is where we will look for a potentially important floor to define the lower end of a broad range.”
“Should weakness extend directly below 127.27 and key price support at 126.36, we would see scope for the sell-off to extend to the 61.8% retracement of the 2021/2022 uptrend at 121.44.”
-
09:01
Austria Purchasing Manager Index rose from previous 46.6 to 47.3 in December
-
09:00
Switzerland ZEW Survey – Expectations above forecasts (-50.5) in December: Actual (-42.8)
-
08:58
EUR/USD needs to surpass 1.0780 to extend the bounce – SocGen
EUR/USD continues to move sideways at around 1.0650. Next hurdle is seen near 1.0780, economists at Société Générale report.
Receding upward momentum
“The pair has achieved initial projections for the bounce and is approaching last June high of 1.0780. This is an interim resistance.”
“Recent bout of bounce has developed within two converging ascending trend lines forming a rising wedge; this generally denotes receding upward momentum. This is also highlighted by daily MACD which has turned flattish.”
“In case the rebound falters near 1.0780, a short-term pullback is not ruled out towards the 200DMA at 1.0340 and 1.0220.”
-
08:48
USD/JPY recovery falters at 134.40: the pairretreats below 134.00
- The Dollar trims gains after hitting resistance at the 134.40 area.
- From a wider perspective, the near-term trend remains positive.
- The Yen, on the defensive after BoJ Kuroda discarded any monetary policy change.
The US Dollar has lost ground against the Japanese yen ahead of Wednesday’s European session opening. The pair is trimming gains after a solid market opening as the pair hit resistance at a one-week high of 134.40.
In the near term, however, the greenback remains trading within an upward-trending channel, after having bounced at a 4, 1/2 -month lows at 130.55 last week.
The Yen, on the defensive on BoJ's dovishness
The Yen has traded lower over the last few days, hurt by the comments of Haruhiko Kuroda, Governor of the Bank of Japan, who discarded any chance of the bank ending its ultra-expansive monetary policy.
Kuroda’s comments have triggered disappointment among traders who were speculating about, a certain monetary policy tweak after the surprising announcement that the bank was loosening its control over the long-term bond yields' curve.
On the other hand, the Dollar is trading moderately lower in a thinned post-Christmas week. The US Dollar Index eases about 0.1% on the day, trading around 104.20 at the moment of writing, at a short distance to the six-month low at 103.40 seen two weeks ago.
Market sentiment remains positive on Wednesday, boosted by the announcement that China is planning to scrap restrictions on inbound travelers, which is expected to trigger a strong rebound in the country’s economic growth
On the macroeconomic front, the calendar is practically empty on Wednesday with only a handful of US releases, namely the US Pending Home sales, the Richmond Fed Manufacturing index, and oil stocks figures worth mentioning.
Technical levels to watch
-
08:09
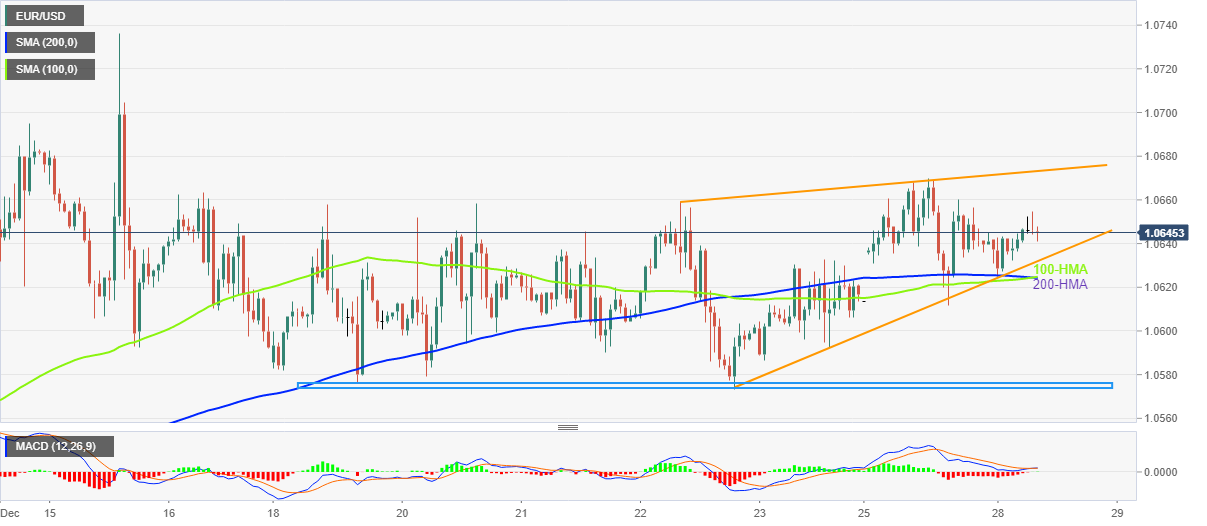
EUR/USD Price Analysis: Grinds higher past 100, 200 HMA confluence
- EUR/USD prints three-day uptrend as it seesaws around intraday top.
- MACD teases buyers but rising wedge formation challenges upside momentum.
- One-week-old horizontal support adds to the downside filters.
EUR/USD stays defensive around 1.0645, portraying a three-day winning streak amid a sluggish Wednesday morning in Europe.
In doing so, the major currency pair justifies the previous bounce off the key Hourly Moving Averages (HMAs) inside a short-term rising wedge bearish chart formation.
It’s worth noting that the impending bull cross on the MACD and the quote’s sustained trading beyond the 100 and 200-HMA confluence, near 1.0620, keep the EUR/USD buyers hopeful.
Also favoring the EUR/USD bulls is the quote’s U-turn from the 1.0580-75 horizontal support area.
However, a rejection of the three-day-old rising wedge is necessary for the pair buyer’s conviction. As a result, successful trading beyond 1.0675 could push back the sellers.
Following that, an uptick to the monthly high flashed on December 15, around 1.0735, becomes imminent.
In the case where the EUR/USD price remains firmer past 1.0735, May’s peak of 1.0786 and the 1.0800 round figure will be in the spotlight.
On the contrary, a downside break of 1.0630 will confirm the rising wedge bearish formation. Even so, the convergence of the stated HMAs, near 1.0620, could challenge the EUR/USD bears.
Should the EUR/USD remains weak past 1.0620, the one-week-old horizontal support area surrounding 1.0580-75, holds the key to the pair’s south-run towards the monthly low near 1.0390.
EUR/USD: Hourly chart
Trend: Limited upside expected
-
08:07
A US recession in 2023 would see the Dollar fall further than anyone expects – SocGen
The US Leading Index is pointing to the possibility of a bigger Dollar fall in 2023 than expected, Kit Juckes, Chief Global FX Strategist at Société Générale, reports.
An old-school indicator warning of trouble ahead for the Dollar
“I have plotted the 6-month change in the Leading Index against quarterly GDP since the late 1970s. The 6-month change in the index, at -4.4, is clearly in territory that in the past has preceded the economy slipping into recession at some point in the next two or three quarters.”
“The Dollar has risen a long way since 2008 as the US economy has outperformed Europe, and while currency markets are all about relative growth, relative monetary policy and other relative measures, a US recession in 2023 would see the Dollar fall further than anyone expects, particularly if Santa Claus were to find a way to give us peace on earth at some point next year.”
-
07:42
Gold Price Forecast: XAU/USD snaps two-day uptrend above $1,800 amid mixed sentiment
- Gold price extends pullback from six-month high, renews intraday low of late.
- Easing optimism surrounding China, fading recession woes in the US weigh on XAU/USD price.
- Holiday season, immediate support line challenges Gold’s downside but bulls need validation from $1,825.
Gold price (XAU/USD) remains pressured around $1,810 while snapping a two-day winning streak during the initial trading hour of Wednesday’s European session. In doing so, the yellow metal fails to justify the latest retreat in the US Treasury bond yields, as well as the US Dollar Index (DXY), amid the holiday season.
US Dollar Index (DXY) takes offers to reverse the early Asian session gains, as well as the previous day’s rebound, while refreshing the intraday low near 104.10. That said, the US 10-year Treasury yields take a U-turn from the six-week high, marked on Tuesday, while marking 2.3 basis points (bps) of decline to 3.83% by the press time.
The reason for Gold’s latest weakness could be linked to easing optimism surrounding China’s reopening as the US conveys dissatisfaction with the dragon nation’s virus numbers. As a result, the US is searching for a way to impose new COVID-19 measures on travelers to the United States from China.
On the other hand, a Researcher from the Federal Reserve Bank of San Francisco’s Economic Research Department ruled out odds favoring the US economic slowdown for at least the upcoming two quarters.
Amid these plays, the US stock futures print mild gains while equities in Europe and the UK remain mildly offered while tracing Asia-Pacific shares and Wall Street’s mixed closing.
To sum up, Gold portrays the market’s indecision while consolidating the recent gains.
Gold price technical analysis
A triple top around $1,825 and a pullback from the overbought RSI justify the latest declines in the Gold price.
However, a one-week-old ascending support line, around $1,805 by the press time, quickly followed by the 200-HMA level surrounding the $1,800 threshold, challenges the Gold bears.
In a case where Gold drops below the $1,800 round figure, a quick drop to the previous weekly low near $1,785 can’t be ruled out.
Alternatively, a successful break of the $1,825 hurdle will be enough for the Gold buyers to aim for June’s peak surrounding $1,880.
Overall, the Gold price slips to the bear’s radar after failing to keep buyers on the board. Though, the downside mood needs validation from the $1,800 mark.
Gold price: Hourly chart
Trend: Further downside expected
-
07:36
Sweden Trade Balance (MoM) came in at -5.4B, above forecasts (-6.1B) in November
-
07:34
Gold Price Forecast: XAU/USD needs a daily close above $1,825 to beat triangle hurdle
Gold price consolidates after volatile trading above the $1,800 mark. XAU/USD needs acceptance above $1,825 to confirm a triangle breakout, FXStreet’s Dhwani Mehta reports.
Risks remain tilted to the upside
“Gold bulls need a daily closing above the horizontal trendline resistance at $1,825. to validate an upside break for the ascending triangle, opening doors for a retest of the multi-month high at $1,833. Further up, the psychological $1,850 level will come into the picture.”
“Should the pullback from higher levels extend, Gold could revisit the previous day’s high at $1,800. The next critical support awaits at $1,794, which is the confluence of the rising trendline (triangle support line) and the bullish 21-Daily Moving Average (DMA). Daily closing below the latter will confirm the downside break from the triangle, invalidating the bullish thesis.”
-
07:21
Switzerland ZEW Survey – Expectations registered at -5.4 above expectations (-50.5) in December
-
07:13
Forex Today: Choppy action continues ahead of US housing data
Here is what you need to know on Wednesday, December 28:
Action in financial markets remains choppy on Wednesday as trading conditions remain thin ahead of the New Year holiday. The US Dollar Index stays quiet slightly above 104.00 and US stock index futures trade flat following Wall Street's main indexes' mixed tone on Tuesday. The benchmark 10-year US Treasury bond yield, which gained more than 2%, holds steady above 3.8%. Later in the session, November Pending Home Sales and the Federal Reserve Bank of Richmond's Manufacturing Index for December from the US will be looked upon for fresh impetus.
China's decision to further ease COVID restrictions helped the market mood improve on Tuesday but investors seem to have turned cautious with the latest reports suggesting that the Chinese healthcare system is overwhelmed amid soaring cases. Earlier in the day, Reuters reported that some US officials were considering imposing new restrictions on travellers from China.
EUR/USD continues to move sideways at around 1.0650 after having closed flat on Tuesday. The European economic docket will not feature any data releases on Wednesday.
GBP/USD declined toward 1.2000 on Tuesday but managed to erase a small portion of its daily losses. The pair trades virtually unchanged slightly above 1.2020 in the early European morning.
The Bank of Japan's Summary of opinions for the December policy meeting revealed that the bank is committed to maintaining the easy monetary policy. Meanwhile, Japan’s former Top Currency Diplomat and a potential contender to replace Bank of Japan (BoJ) Governor Haruhiko Kuroda, Takehiko Nakao, said on Wednesday that widening the yield curve control bank would help them smoothly transition the policy. USD/JPY edged higher during the Asian trading hours and was last seen trading in positive territory near 134.00.
Gold price climbed above $1,830 for the first time in June on Tuesday but retraced a large portion of its daily rally amid rising US Treasury bond yields. XAU/USD trades in negative territory slightly below $1,810 early Wednesday.
Bitcoin lost more than 1% on Tuesday and continued to edge lower toward $16,600 early Wednesday. Ethereum closed in negative territory on Tuesday and declined below $1,200 on Wednesday, where it's down more than 1% on the day.
-
06:51
AUD/USD Price Analysis: Bulls cheer ‘golden cross’ to approach fortnight-old resistance near 0.6765
- AUD/USD picks up bids to refresh intraday high after confirming a bullish moving average crossover.
- Two-week-long downward-sloping resistance line challenges short-term upside moves.
- MACD signals suggest further upside, rising trend line from December 16 adds to the upside filters.
AUD/USD renews intraday high around 0.6755 while reversing the previous day’s pullback from the two-week top amid the initial European session on Wednesday.
In doing so, the Aussie pair justifies the bullish moving average crossover amid sluggish days of trading due to the year-end holiday mood in the West.
That said, the 50-HMA pierced the 200-HMA from below and portrayed the “Golden Cross” the previous day. The MACD also justifies the bullish signals from the Hourly Moving Averages (HMAs).
As a result, the quote is up for challenging a two-week-old resistance line near 0.6765. However, another trend line resistance from December 16, close to 0.6780, adds filters to the AUD/USD upside.
In a case where the Aussie pair remains firmer past 0.6780, the 0.6800 round figure and 0.6820 hurdle may probe the bulls before directing them towards the monthly high near 0.6895.
On the flip side, the 50-HMA level near 0.6730 restricts short-term AUD/USD downside ahead of the 200-HMA support, close to 0.6715 at the latest.
Following that, an ascending trend line from the last Tuesday, near 0.6680 by the press time, could act as the last defense of the AUD/USD bulls, a break of which could quickly drag the quote towards the monthly low surrounding 0.6630.
AUD/USD: Hourly chart
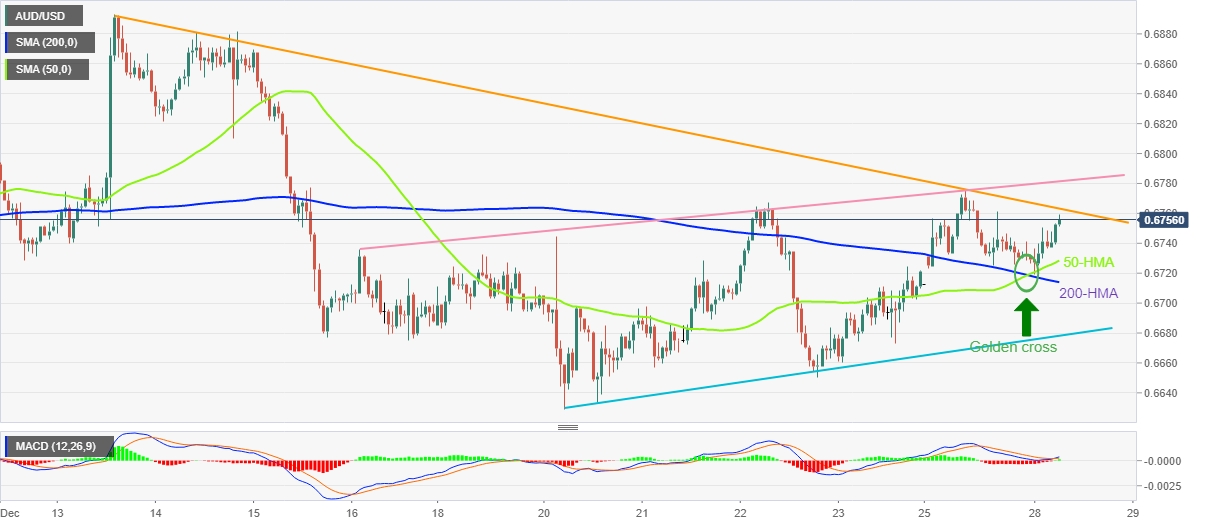
Trend: Limited upside expected
-
06:34
FX option expiries for Dec 28 NY cut
FX option expiries for Dec 28 NY cut at 10:00 Eastern Time, via DTCC, can be found below.
- GBP/USD: GBP amounts
- 1.2385 775.9m
- 1.1100 709.8m
- 1.0000 708m
- USD/JPY: USD amounts
- 137.00 1.01b
- 145.00 850m
- 150.00 790m
- AUD/USD: AUD amounts
- 0.6370 869.8m
- 0.7010 599.1m
- 0.6670 389.9m
- USD/CNY: USD amounts
- 7.5000 601.3m
- 7.0000 567m
- 7.2500 552m
-
06:24
US Dollar Index retreats towards 104.00 as yields dribble on mixed concerns over Fed, recession
- US Dollar Index retreats from intraday high, struggles to defend DXY bulls after snapping two-day downtrend.
- San Francisco Fed’s Researcher rules out US recession, mixed data probe hawkish Fed concerns.
- Receding optimism for China unlock announcements jostle with boring performance of yields to restrict DXY moves.
US Dollar Index (DXY) takes offers to reverse the early day gains around 104.20 as European traders brace for Wednesday’s work amid the holiday mood.
The sluggish markets also take clues from the lack of major data/events, as well as mixed concerns surrounding China and the Federal Reserve (Fed). However, receding hopes of the US economic slowdown keeps DXY bulls hopeful.
Earlier in the day, a Researcher from the Federal Reserve Bank of San Francisco’s Economic Research Department ruled out odds favoring the US economic slowdown for at least the upcoming two quarters.
Talking about the day, Monday’s US economic releases mentioned that the Good Trade Balance for November improved to $-83.3B versus $98.8B prior. However, the US S&P/Case-Shiller Home Price Indices for October dropped to 8.6% YoY versus 9.7% expected and 10.4% previous readings.
Elsewhere, the US raised doubts about China’s latest Covid-linked moves and probes the risk-on mood. The dragon nation initially ruled out the quarantine requirement for inbound travelers before stating that the nation will resume citizens' applications for ordinary passports for tourism and visits abroad from January 8, 2023. Even so, a US Official mentioned, per Reuters, that the US government may impose new COVID-19 measures on travelers to the United States from China over concerns about the "lack of transparent data" coming from Beijing.
While portraying the mood, the US Treasury yields remain stable while the stock futures print mild gains.
Moving on, a light calendar and lack of major macros may allow the DXY traders to pare recent gains. That said, the US Pending Home Sales for November which holds the market consensus of 0.6% versus -4.6% previous readings will decorate the calendar and should be eyed amid a lack of major data/events for fresh impulse. Even so, major attention will be on the concerns surrounding Fed and China, not to forget the US Treasury bond yields.
Technical analysis
Despite the latest failure to defend DXY bulls, Tuesday’s bullish Doji candlestick suggests further recovery unless the quote drops back below the recent low of 103.88.
-
06:12
WTI Price Analysis: Stability above 200-EMA signals more upside
- WTI is sensing selling pressure after a sheer upside move.
- The oil price is aiming to shift its auction above the 200-EMA at $78.90.
- A drop in the 40.00-60.00 range by the RSI (14) indicates a loss in the upside momentum.
West Texas Intermediate (WTI), futures on NYMEX, have sensed selling pressure in early Europe after remaining sideways in the Asian session. Earlier, the oil price witnessed a steep fall after failing to hold the $81.00 resistance on Tuesday as the US Dollar Index (DXY) regained strength.
On a four-hour scale, the oil price is accelerating after a break above the downward-sloping trendline from November 7 high at $92.36. The black gold is aiming to shift its auction profile above the 200-period Exponential Moving Average (EMA) at $78.90, which indicates that the upside trend is solid on a long-term basis.
Meanwhile, the Relative Strength Index (RSI) (14) has dropped into the 40.00-60.00 range from the bullish range of 60.00-80.00, which indicates a loss in the upside momentum.
For more upside, the oil price needs to surpass the round-level resistance of $80.00, which will drive the asset toward December 5 high at $82.72 and the November 17 high at $85.00.
On the flip side, a break below December 22 low at $77.00 will drag the oil price toward December 12 high at $74.00, followed by December 7 low at $72.00.
WTI four-hour chart
-638078046251421764.png)
-
06:04
GBP/USD Price Analysis: Multiple bounces off 1.2000 tease buyers
- GBP/USD picks up bids to portray the third U-turn from 1.2000.
- RSI, MACD both suggest that bears are running out steam.
- Bulls need validation from weekly resistance line, 200-HMA.
GBP/USD picks up bids to reverse the initial losses around 1.2030 heading into Wednesday’s London open. In doing so, the Cable pair marks the third rebound from the 1.2000 psychological magnet while probing the bearish bias portrayed on Tuesday.
Although one-week-old horizontal support near 1.2000 restricts the immediate downside of the GBP/USD pair, recovery remains elusive unless the quote crosses a downward-sloping resistance line from December 19, close to 1.2090 by the press time.
That said, the 1.2050 mark and the 100-HMA level surrounding 1.2070 restrict immediate recovery moves of the Cable pair.
It’s worth noting that the GBP/USD pair’s upside past 1.2070 will need validation from the 200-HMA hurdle, close to 1.2140 at the latest, a break of which could give control to the buyers.
Meanwhile, a clear downside break of the 1.2000 round figure precedes the monthly low of 1.1992 to restrict the short-term GBP/USD declines.
Following that, the late November swing low of 1.1900 will gain the market’s attention as the pair’s sustained trading below the same could put the sellers in the driver’s seat.
Overall, GBP/USD is likely to consolidate recent losses but the recovery remains doubtful below 1.2140.
GBP/USD: Hourly chart
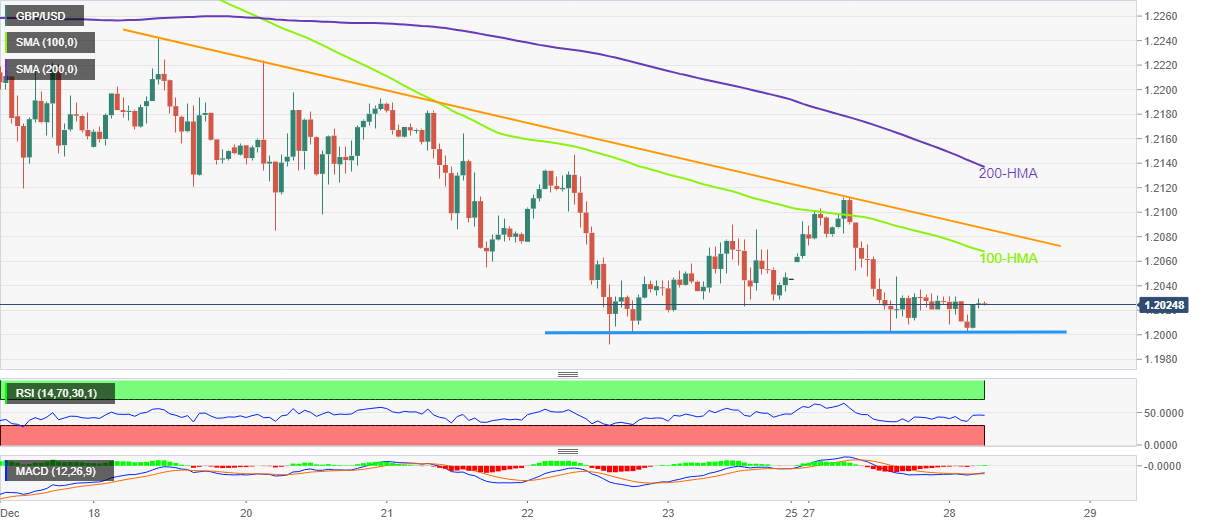
Trend: Limited recovery expected
-
05:49
USD/JPY corrects marginally to near 134.00, upside still solid due to BOJ’s dovish commentary
- USD/JPY has slipped marginally to near 134.00, however, the upside is still favored amid uncertainty in the market.
- Federal Reserve might look for returning to policy easing led by the recent decline in retail demand and economic activities.
- The expression of loose monetary policy continuation in the Bank of Japan’s summary of opinions has weakened the Japanese Yen.
- USD/JPY may display more upside after a Rising Channel breakout and bullish signs from the momentum oscillator.
USD/JPY pair has sensed long liquidations after a vertical rally around 134.40 in the early European session. The asset has corrected marginally to near 134.10, however, the corrective move seems healthy for the major as the market sentiment is still risk-averse. The Japanese yen pair is expected to resume its upside journey for recapturing the critical resistance of 135.00 ahead.
Meanwhile, S&P500 futures are displaying a subdued performance as the market participants are getting anxious amid the festive mood. The 500 United States stock basket witnessed selling pressure on Tuesday led by weakness in technology stocks and a decline in International Trade Deficit. The return on 10-year US Treasury bonds has trimmed below 3.85% but is still showing promising signs of recovery ahead.
The US Dollar Index (DXY) is struggling to surpass the crucial resistance of 104.00, however, the upside is still favored amid uncertainty in the global market towards the rapid reopening approach of the Chinese administration.
Federal Reserve might return to policy easing sooner
Recent decline in the United States Durable Goods Orders and Personal Consumption Expenditure (PCE) Price Index have delivered an expression of a slowdown in inflation expectations further. A sheer decline in the demand for durable goods, and consumption expenditure by households are critical for a decline in inflationary pressures. And now, a decline in Tuesday’s International Deficit as firms are restricting themselves from expanding operations due to higher interest obligations is going to compel the Federal Reserve to return to policy easing context sooner.
On Tuesday, the US Census Bureau reported that Exports of goods for November were $168.9 billion, $5.3 billion less than October exports while Imports of goods for November were $252.2 billion, $20.8 billion less than October imports. This indicates a decline in overall economic activities, which might result in lower employment opportunities in the CY2023.
United States economy is far from recession
Market participants have been debating over the United States economy getting into recession and a higher Unemployment Rate to achieve price stability. As the Federal Reserve is hiking interest rates dramatically, economists have been compelled to trim Gross Domestic Product (GDP) projections and firms get restricted from executing of expansion plans.
Thomas M. Mertens, a Researcher from the Federal Reserve (Fed) Bank of San Francisco’s Economic Research Department came out with a recession predictor based on macroeconomic time series, particularly the jobless unemployment rate. He cited that no predictors indicate an upcoming recession over the next two quarters currently. And, the jobless rate does not currently signal an impending recession.
Bank of Japan’s Summary of Opinions favors easy monetary policy ahead
In the Summary of Opinions by the Bank of Japan, the central bank cleared that widening of the yield band was meant to address distortion in 10-year Japanese Government Bonds (JGBs) pricing but this is not a step toward an exit from ultra-easy policy, as reported by Reuters. The expression from the Bank of Japan’s summary of opinions indicates that the central bank must maintain the easy policy as the Japanese economy is in a critical phase in hitting the price goal. No doubt, the economy is showing signs of wage rises, and a positive economic cycle but it is appropriate to maintain an easy policy for time being.
USD/JPY technical outlook
-638078032275014883.png)
USD/JPY is on the verge of kissing the horizontal resistance plotted from the December 14 low around 134.52. The US Dollar is extremely strong as the asset has delivered a breakout of the Rising Channel chart pattern formed on an hourly scale. The pair has scrolled above the 200-period Exponential Moving Average (EMA) at 133.88, which indicates that the long-term trend has turned bullish.
Meanwhile, the Relative Strength Index (RSI) (14) has shifted into the bullish range of 60.00-80.00, which signals that the upside momentum has been triggered.
-
05:34
USD/CAD clings to mild gains above 1.3500 despite downbeat Oil price
- USD/CAD grinds near intraday high after bouncing off three-week low.
- US Dollar rebound, easing optimism over China’s Covid updates weigh on Oil price.
- Holiday season, light calendar restricts immediate moves but firmer US Treasury yields keep USD/CAD buyers hopeful.
USD/CAD prints mild gains around 1.3530 as bulls and bears jostle during the first positive day for the Loonie pair in three.
The US Dollar rebound and the recent pullback in the Oil prices could be linked to the quote’s recovery. However, the holiday mood and a light calendar, not to forget fewer macros, keep the USD/CAD traders in check.
US Dollar Index (DXY) struggles to defend recent gains around 104.25, fading the bounce off a one-week low, amid sluggish US Treasury bond yields. In doing so, the greenback’s gauge versus the six major currencies also justifies the recently mixed US data, as well as mixed concerns surrounding the Fed’s next moves. Even so, receding fears of the US recession and easing optimism surrounding China’s Covid conditions seem to keep the DXY bulls hopeful.
Recently, a Researcher from the Federal Reserve Bank of San Francisco’s Economic Research Department ruled out odds favoring the US economic slowdown for at least the upcoming two quarters. That said, US Good Trade Balance for November improved to $-83.3B versus $98.8B prior but the US S&P/Case-Shiller Home Price Indices for October dropped to 8.6% YoY versus 9.7% expected and 10.4% previous readings.
In the last week, mixed readings of the US inflation and growth figures raised doubts about the Federal Reserve’s (Fed) hawkish move, especially after the US central bank appeared cautiously optimistic in its latest monetary policy meeting.
On a different page, China announced multiple measures to open national and international boundaries in a rush to convey the easing of COVID-19 fears. However, the US doubts the moves and probes the risk-on mood. The dragon nation initially ruled out the quarantine requirement for inbound travelers before stating that the nation will resume citizens' applications for ordinary passports for tourism and visits abroad from January 8, 2023. Even so, a US Official mentioned, per Reuters, that the US government may impose new COVID-19 measures on travelers to the United States from China over concerns about the "lack of transparent data" coming from Beijing.
Against this backdrop, the US Treasury yields remain stable while the stock futures print mild gains and the WTI crude oil extends the previous day’s pullback from a three-week high, down 0.22% intraday near $79.60 at the latest.
Given the market’s actions, as well as the light calendar and no major macros, the USD/CAD is likely to remain sidelined. It should be noted that the US Pending Home Sales for November which holds the market consensus of 0.6% versus -4.6% previous readings, will decorate the calendar.
Technical analysis
USD/CAD recovers from the 200-SMA, around 1.3500 by the press time, as the RSI (14) defends recovery from the oversold territory. Also supporting the Loonie pair’s rebound is the receding strength of the bearish MACD signals.
As a result, the USD/CAD rebound is likely to approach the 1.3570 resistance confluence including the one-week-old descending resistance line, as well as the previous support line from November 15.
-
05:08
NZD/USD Price Analysis: Drops back below 200-SMA, monthly support line in focus
- NZD/USD holds lower ground near intraday bottom, extends pullback from 50-SMA.
- Failure to stay beyond 200-SMA, looming bear cross on MACD favor sellers.
- One-month-old ascending trend line restricts immediate downside.
- 61.8% Fibonacci retracement adds to the upside filters.
NZD/USD prints mild losses around 0.6260 as it drops for the second consecutive day heading into Wednesday’s European session.
In doing so, the Kiwi pair not only extends pullback from the 50-SMA but also marks one more downside move below the 200-SMA.
The downside moves also take clues from the impending bear cross on the MACD indicator, as well as the lower high formation marked since December 13.
That said, an upward-sloping support line from November 28, close to 0.6245, holds the key for the NZD/USD pair’s further downside.
Also acting as the short-term key support is the monthly low near 0.6230, quickly followed by late November’s swing low surrounding 0.6290.
Meanwhile, the 61.8% Fibonacci retracement level of the NZD/USD pair’s November 28 to December 13 upside, also known as the “Golden Ratio”, guards immediate recovery moves of the pair around 0.6290, in addition to the 200-SMA hurdle of 0.6283.
During the quote’s run-up beyond 0.6290, the 0.6300 round figure and the 50-SMA resistance of 0.6311 could probe the NZD/USD bulls before giving them control.
Even so, successful trading beyond the 50% Fibonacci retracement level surrounding 0.6335 appears necessary for the Kiwi pair buyers to keep the reins.
NZD/USD: Four-hour chart
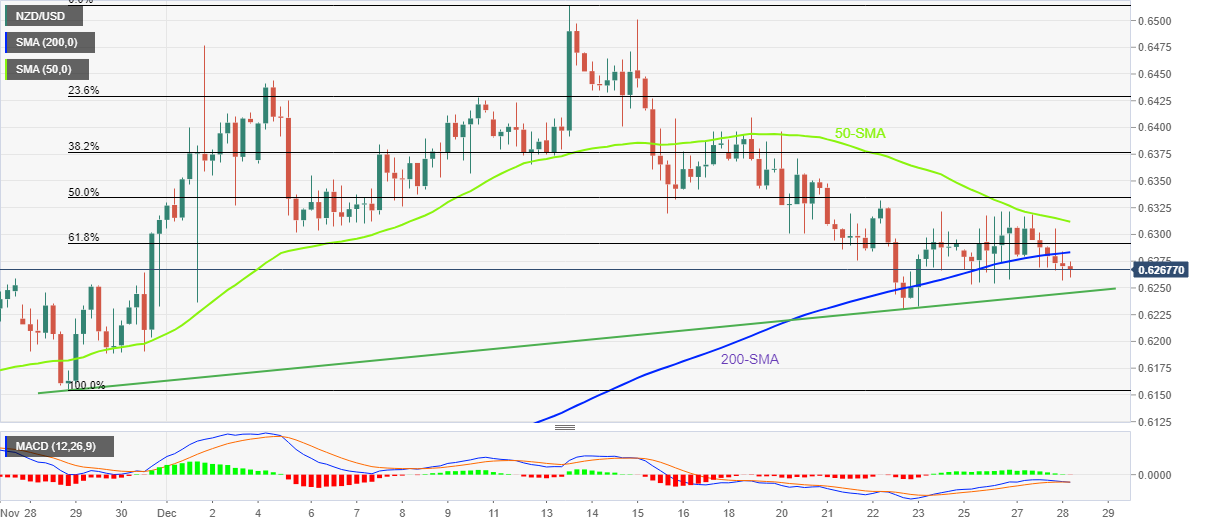
Trend: Further downside expected
-
04:42
Asian Stock Market: Remains weak despite China’s progressive steps for easing Covid curbs
- Escalating anxiety among market participants amid the festive mood is impacting Asian equities.
- The US Dollar Index is looking to shift its auction profile above the crucial resistance of 104.00.
- Oil prices seem solid despite a correction as Russia has banned oil supply to G7 countries and European Union.
Markets in the Asian domain are facing selling pressure after S&P500 failed to carry-forwarded Friday’s revival move on Tuesday. Mild strength in the US Dollar Index (DXY) is indicating a recovery in the risk-aversion theme. The return on 10-year US Treasury bonds has marginally trimmed but is still solid around 3.85%.
At the press time, Japan’s Nikkei225 dropped 0.63%, ChinaA50 slipped 0.20%, Hang Seng jumped 2.38%, and Nifty50 remained flat.
Chinese equities have failed to capitalize on bold steps from China for reopening the economy despite a spike in Covid-19 cases. It seems that the pace adopted by the administration in reopening of the economy has spooked sentiment. The rollback of strict Covid-19 restrictions at a sheer pace has accelerated infections and medical agencies are failing to control the damage.
The move of scraping quarantine rules for inbound travelers to easy supply chain disruptions is not expected to be respected by other countries. Reuters reported that the United States is considering new Covid measures for travelers from China. “The US government may impose new COVID-19 measures on travelers to the United States from China over concerns about the "lack of transparent data" coming from Beijing, U.S. officials said on Tuesday” mentioned the news.
Meanwhile, the return of the Bank of Japan (BOJ) policymakers to lose monetary policy after scrutinizing the summary of opinions to accelerate wages further to achieve 2% inflation has weakened Japanese stocks. The move will depreciate the Japanese yen again and the firms will be forced to pay higher for bringing foreign inputs.
On the oil front, the oil price has turned sideways after dropping from the crucial resistance of $81.00. Bullish sentiment for the oil price is still solid as Russia has announced a ban on the supply of oil to G7 countries and the European Union for levying a price cap.
-
04:37
EUR/USD aptly portrays holiday mood around mid-1.0600s, Treasury bond yields eyed
- EUR/USD picks up bids to pare early-day losses amid sluggish Treasury bond yields.
- US Dollar remains mildly bid as China-linked optimism fades.
- Bond rout keeps buyers hopeful despite recent inaction, Eurozone economic fears cap upside momentum.
EUR/USD reverses initial pullback as it grinds higher around 1.0640-50 amid early Wednesday morning in Europe.
The major currency pair initially took clues from the US Dollar rebound before the market’s inaction challenged the downside. Following that, the lower prices and a rebound from the short-term key support, near 1.0620, attracted bids and consolidated the previous losses. However, the holiday mood on the trading floor joins a light calendar and fewer macros to restrict the EUR/USD pair’s immediate moves.
Easing optimism surrounding China’s easing of the Covid-led restrictions joined the recent rebound in the US Treasury bond yields to tease the bears previously. However, the comparatively more hawkish mood at the European Central Bank (ECB) than the Federal Reserve (Fed) seems to keep the pair buyers hopeful. Even so, economic fears concerning the region limit the upside momentum amid inactive trading sessions.
That said, comments from the US Official challenged China-inspired COVID-19 optimism. US government may impose new COVID-19 measures on travelers to the United States from China over concerns about the "lack of transparent data" coming from Beijing, per Reuters.
It should be noted that hawkish comments from the most senior policymaker from the European Central Bank (ECB) seemed to have put a floor under the EUR/USD prices. The ECB has only just passed the halfway point of its tightening cycle and needs to be “in there for the long game” to tame high inflation, per ECB Governing Council member and Dutch central bank Governor Klaas Knot.
Elsewhere, the rebound in the US Treasury yields jostle with the firmer EU bond coupons but the economic fears over the bloc remain more important and weigh on the pair than those for the US economy. The reason could be linked to the latest analysis from Thomas M. Mertens, a Researcher from the Federal Reserve Bank of San Francisco’s Economic Research Department who came out with a recession predictor based on macroeconomic time series, particularly the jobless unemployment rate. The researcher claims that this predictor is almost as accurate as the slope of the yield curve but is more accurate at shorter horizons, suggesting no recession fears for at least the upcoming two quarters.
While portraying the mood in the market, the 10-year Treasury bond yields remain sidelined near 3.85%, after refreshing the six-week high the previous day, whereas the S&P 500 Futures remain indecisive while tracking the mixed closing of the Wall Street benchmarks. It should be observed the 10-year European Treasury bond yields jumped to the highest levels since 2011 the previous day.
Looking forward, a lack of major data/events could restrict EUR/USD moves but the buyers appear losing upside momentum of late. That said, the US Pending Home Sales for November which holds the market consensus of 0.6% versus -4.6% previous readings, will decorate the calendar.
Technical analysis
Although the oscillators suggest that the EUR/USD buyers are running out of steam, the 1.0620 support confluence comprising the 50-SMA and an upward-sloping trend line from late November appears a tough nut to crack for the bears. Alternatively, recovery moves need to stay beyond the latest swing high surrounding 1.0670 to direct the EUR/USD pair buyers toward the monthly top surrounding 1.0740.
-
04:27
Japan’s Kihara: Government needs to increase focus on achieving wage growth
Japanese Deputy Chief Cabinet Secretary Seiji Kihara said on Wednesday, the country’s government will need to prioritize higher wages in its economic policy next year.
Key quotes
"The biggest challenge for Japan's economy is a lack of wage growth. Unless wages rise, consumption won't pick up and companies won't increase investment."
"The government will increase its focus on achieving wage growth. This is particularly important because prices are rising."
-
04:08
AUD/USD struggles around 0.6750 post-recovery as US Dollar Index approaches 104.00
- AUD/USD has sensed barricades around 0.6750 as the US Dollar Index has also attempted a recovery.
- A sheer decline in the US International deficit displays the impact of the Fed’s tight monetary policy.
- Scrapping of quarantine rules for inbound travelers in China will ease supply chain disruptions.
The AUD/USD pair is facing pressure in overstepping the critical resistance of 0.6750 in the Tokyo session. Earlier, the Aussie asset displayed a recovery after dropping to near 0.6720. The major is needed to surpass the 0.6750 hurdle to extend its recovery, however, a recovery in the US Dollar index (DXY) is dampening optimism in the antipodean.
The US Dollar index has recaptured the crucial resistance of 104.00 and is expected to re-test the two-day high around 104.20 as the festive mood is inspiring volatility in the global market. Anxiety among market participants is forcing them to hide behind the safe-haven. Therefore, the risk aversion theme is gaining more traction.
Meanwhile, S&P500 futures have attempted a rebound move after a weak Tuesday. It would be early to call the rebound move in the 500-stock basket a reversal as the recovery move is less confident amid the unavailability of a potential trigger. The 10-year US Treasury yields have trimmed marginally but are still near 3.85%.
On Tuesday, the release of the decline in the United States International Trade Deficit, reported by the Census Bureau, is reflecting the consequences of extremely hawkish monetary policy by the Federal Reserve (Fed). Exports of goods for November were $168.9 billion, $5.3 billion less than October exports while Imports of goods for November were $252.2 billion, $20.8 billion less than October imports, which indicates a decline in economic activities as firms are dodging debt due to higher interest obligations.
On the Aussie front, reopening measures by China to regain the path of progress is not supporting well to the Australian Dollar. Chinese administration has scrapped quarantine rules for inbound travelers to ease supply chain disruptions. Being a leading trading partner of China, Australia will be benefitted from the relaxation of Covid-19 restrictions.
-
04:04
Gold Price Forecast: XAU/USD eases below $1,825 hurdle amid firmer US Dollar, hidden bullish RSI divergence
- Gold price retreats from six-month high, snaps two-day uptrend while printing mild losses.
- Hidden bullish RSI divergence keeps XAU/USD buyers hopeful amid mixed sentiment.
- US Treasury yields underpin US Dollar rebound despite holiday-thinned market participation.
- Risk catalysts are in focus amid light calendar.
Gold price (XAU/USD) retreats to $1,810 as it pares the latest gains around the six-month high, flashed the previous day, while snapping a two-day winning streak during early Wednesday morning in Europe. In doing so, the yellow metal justifies the US Dollar rebound, as well as receding optimism surrounding China amid the sluggish trading session amid the holiday season.
That said, the US Dollar Index (DXY) prints 0.12% intraday gains around 104.35 by the press time as it defends the previous day’s recovery moves. In doing so, the greenback’s gauge versus the six major currencies also justifies the recently mixed US data, as well as mixed concerns surrounding the Fed’s next moves.
Talking about the data, US Good Trade Balance for November improved to $-83.3B versus $98.8B prior but the US S&P/Case-Shiller Home Price Indices for October dropped to 8.6% YoY versus 9.7% expected and 10.4% previous readings. It’s worth noting that the previously mixed readings of the US inflation and growth figures raised doubts about the Federal Reserve’s (Fed) hawkish move, especially after the US central bank appeared cautiously optimistic over the rate hikes in its latest monetary policy meeting.
It should be observed that the receding optimism surrounding China could also be held responsible for the XAU/USD retreat, due to the dragon nation’s status as the world’s largest commodity user. Although China announced multiple measures to open national and international boundaries in a rush to convey the easing of COVID-19 fears, the US doubts the moves and probes the risk-on mood. That said, the dragon nation initially ruled out the quarantine requirement for inbound travelers before stating that the nation will resume citizens' applications for ordinary passports for tourism and visits abroad from January 8, 2023. Even so, a US Official mentioned, per Reuters, that the US government may impose new COVID-19 measures on travelers to the United States from China over concerns about the "lack of transparent data" coming from Beijing.
Amid these plays, the 10-year Treasury bond yields remain sidelined near 3.85%, after refreshing the six-week high the previous day, whereas the S&P 500 Futures remain indecisive while tracking the mixed closing of the Wall Street benchmarks.
Looking forward, the US Pending Home Sales for November which holds the market consensus of 0.6% versus -4.6% previous readings, will decorate the calendar but major attention will be given to the US Treasury bond yields and headlines surrounding China for fresh impulse.
Gold price technical analysis
Gold price portrays a bullish RSI divergence on the daily formation despite the latest pullback from the two-week-old horizontal resistance area surrounding $1,825.
That said, the yellow metal portrays the higher lows on price but the RSI (14) indicator fails to justify firmer quotes and prints lower lows on the indicator.
As a result, the metal’s further upside appears likely, which in turn highlights the $1,825 resistance.
A clear upside break of the $1,825 key hurdle could direct Gold price towards June’s top near $1,880 and late March swing low around $1,890 before flashing lights on the $1,900 mark.
Meanwhile, the $1,800 round and the 21-DMA support near $1,795 restricts short-term downside of the Gold price, a break of which won’t hesitate to direct XAU/USD bears towards the monthly low near $1,765.
Gold price: Daily chart
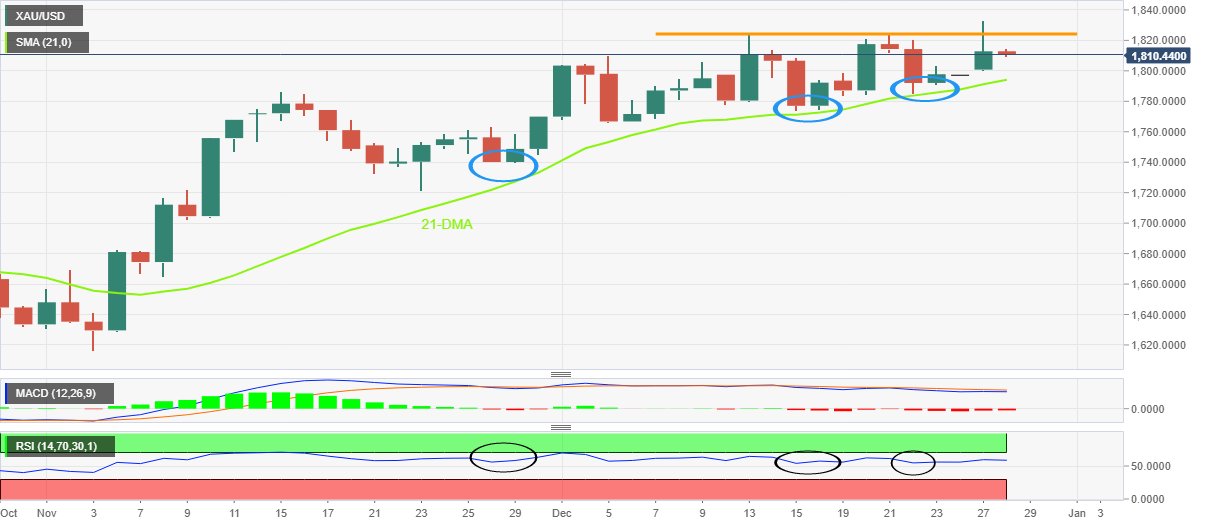
Trend: Bullish
-
03:30
USD/INR Price News: Inside the woods below 83.00 as US Dollar remains sideways
- USD/INR is trading inside the woods but is expected to reach 83.00 sooner.
- A decline in overall economic activities in the US economy might trim inflation expectations further.
- Firmer oil prices are impacting the Indian Rupee, being one of the leading importers of oil.
The USD/INR pair is oscillating in a rangebound territory below 83.00, following the footprints of the US Dollar Index (DXY). The asset is inside the woods from the past two trading sessions but is expected to recapture the critical resistance of 83.00 ahead.
The US Dollar Index (DXY) is attempting to recapture the crucial hurdle of 104.00 as progressive steps from China for the reopening of the economy after a longer follow-up of no-tolerance Covid-19 policy failed to support risk-perceived currencies. S&P500 failed to make progress in the revival move recorded on Friday as faced selling pressure on Tuesday. The 10-year US Treasury yields have sensed marginal correction after reaching to near 3.85%, displaying a risk-off mood in the global market.
Going forward, investors will keep eye on views from think tanks about the decline in the inflation-related indicators in the United States economy. The recent slowdown in demand for Durable Goods and consumption expenditure compelled think tanks to trim the longevity of hawkish monetary policy by the Federal Reserve (Fed). Economists at ING shared an opinion that the recession will accelerate inflation's slide and will allow the Fed to respond with rate cuts before CY2023 is out.
Now, a decline in US International deficit led by a slowdown in overall economic activities is signaling the mounting side-effects of higher interest rates by the Fed.
On the oil front, oil price is struggling to recapture the $80.00 hurdle but is still in a bullish trajectory. The deadly duo of solid oil prices and volatility in the global market are impacting the India Rupee. It is worth noting that India is one of the leading importers of oil and higher oil prices weaken Indian Rupee.
-
02:50
USD/JPY Price Analysis: 50-SMA probes bulls near 134.00
- USD/JPY grinds higher around weekly top during five-day winning streak.
- 50-SMA, fortnight-old descending trend line probe immediate upside.
- Bullish MACD signals, one-week-old ascending trend line keeps buyers hopeful.
USD/JPY seesaws around 134.00 as bulls keep the reins during a five-day uptrend near the weekly top. In doing so, the Yen pair pokes the 50-SMA level amid Wednesday’s sluggish trading.
Given the Yen pair’s steady recovery from the four-month low marked in the last week, portrayed by short-term support, as well as the bullish MACD signals, the USD/JPY could cross the immediate hurdle, namely the 50-SMA level of 134.00.
Even so, a downward-sloping resistance line from December 15, near 134.45 by the press time, will precede the previous support line from the month-start low, close to 135.50, to challenge the short-term USD/JPY upside.
It’s worth noting that the 200-SMA and the monthly peak, respectively near 137.15 and 138.20, could act as the last defense of the USD/JPY bears, a successful break of which will give control to the buyers.
Alternatively, a one-week-old ascending support line, around 133.20 by the press time, restricts nearby downside of the Yen pair.
Following that, the monthly low and the August 2022 bottom, near 130.55 and 130.40 in that order, could challenge the pair sellers before directing USD/JPY to the 130.00 psychological magnet.
USD/JPY: Four-hour chart
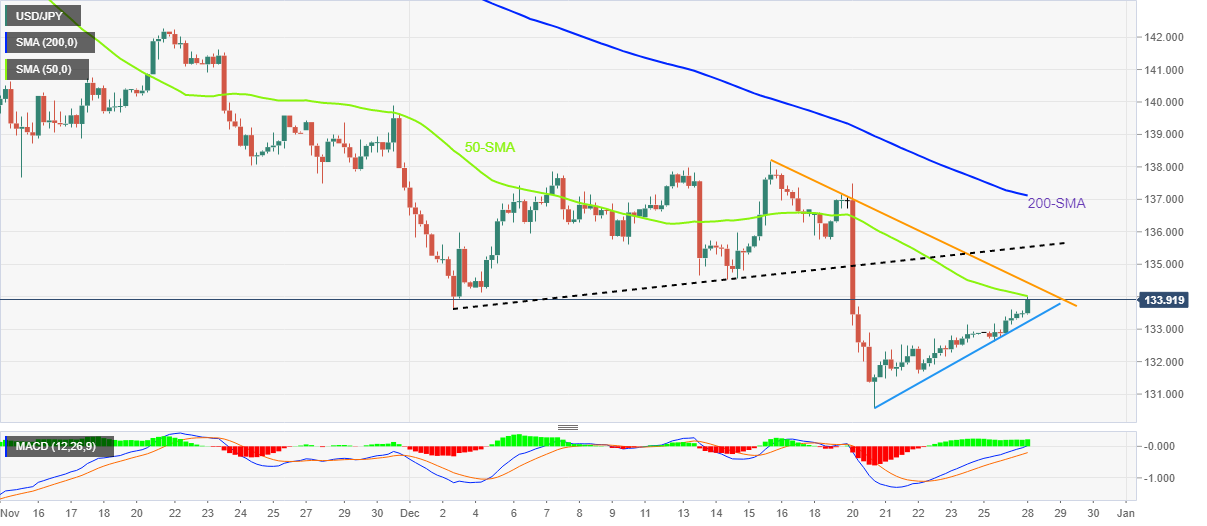
Trend: Further upside expected
-
02:30
Japan’s Ex-MoF Nakao: Widening YCC band to make policy transition smoother
Japan’s former Top Currency Diplomat and a potential contender to replace Bank of Japan (BoJ) Governor Haruhiko Kuroda, Takehiko Nakao, spoke about a smoother transition away from the central bank’s ultra-loose monetary policy, in a Reuters interview on Wednesday.
Key quotes
“The BOJ has not succeeded so much in raising inflation expectations and bringing down real interest rates while side-effects became larger. I was thinking the current framework must be modified sooner or later.”
"I am not sure about the reason for the latest action, but it may have an effect of alleviating the burden for whoever succeeds Kuroda regarding all the negative shocks stemming from adjustments.”
"It was good in the sense that it reduced the burdens of starting policy adjustment."
“There's no need to think that a recession is inevitable.”
"The yen was too strong back then, but now the yen is clearly too weak.”
Market reaction
USD/JPY is closing in on the 134.00 level, finding fresh support from the dovish BoJ Summary of Opinions, which showed that the board members still argued for maintaining the easy policy. The pair is adding 0.32% on the day.
-
02:30
Commodities. Daily history for Tuesday, December 27, 2022
Raw materials Closed Change, % Silver 24.042 0.7 Gold 1814.2 0.78 Palladium 1827.07 4.16 -
02:28
Silver Price Forecast: XAG/USD slides below $24.00 to snap two-day uptrend as US Dollar rebounds
- Silver takes offers to refresh intraday low during the first negative daily performance in three.
- Mixed sentiment, firmer Treasury yields allow US Dollar recover amid holiday season.
- China-linked Covid optimism fails to defend XAG/USD buyers as US doubts Beijing’s lack of transparency.
Silver price (XAG/USD) renews its intraday low near $23.95 as bears return to the table early Wednesday, after a two-day absence. The bright metal’s latest weakness could be linked to the US Dollar’s mildly positive performance, as well as doubts over China’s Covid-linked optimism.
US Dollar Index (DXY) prints mild gains around 104.25 by the press time as it defends the previous day’s recovery moves during the sluggish session. In doing so, the greenback’s gauge versus the six major currencies also justifies the recently mixed US data, as well as mixed concerns surrounding the Fed’s next moves.
US Good Trade Balance for November improved to $-83.3B versus $98.8B prior but the US S&P/Case-Shiller Home Price Indices for October dropped to 8.6% YoY versus 9.7% expected and 10.4% previous readings. It’s worth noting that the previously mixed readings of the US inflation and growth figures raised doubts about the Federal Reserve’s (Fed) hawkish move, especially after the US central bank appeared cautiously optimistic over the rate hikes in its latest monetary policy meeting.
Elsewhere, China announced multiple measures to open national and international boundaries in a rush to convey the easing of COVID-19 fears. In doing so, the dragon nation initially ruled out the quarantine requirement for inbound travelers before stating that the nation will resume citizens' applications for ordinary passports for tourism and visits abroad from January 8, 2023. Even so, a US Official mentioned, per Reuters, that the US government may impose new COVID-19 measures on travelers to the United States from China over concerns about the "lack of transparent data" coming from Beijing.
Against this backdrop, the 10-year Treasury bond yields remain sidelined near 3.85%, after refreshing the six-week high the previous day, whereas the S&P 500 Futures remain indecisive while tracking the mixed closing of the Wall Street benchmarks.
Given the sluggish session and a light calendar, except for the US Pending Home Sales for November which holds the market consensus of 0.6% versus -4.6% previous readings, the Silver price is likely to extend the latest weakness amid firmer US Treasury bond yields.
Technical analysis
Although the double top formation near $24.30 lures Silver bears, the 21-DMA level near $23.30 restricts short-term XAG/USD downside.
-
02:15
USD/CAD Price Analysis: Extends rebound from 200-SMA towards 1.3570 resistance confluence
- USD/CAD picks up bids while snapping two-day down trend, recovers from three-week low.
- RSI rebound, easing bearish bias of MACD joins the failure to break the key SMA to lure buyers.
- Convergence of one-week-old descending trend line, previous support line from mid-November challenges immediate upside.
USD/CAD stays mildly bid near 1.3530 as it prints the first daily gains in three during early Wednesday. In doing so, the Loonie pair defends the latest bounce off a three-week low.
That said, the quote recovered from the 200-SMA the previous day as the RSI (14) took a U-turn from the oversold territory. Also supporting the recovery moves was the receding strength of the bearish MACD signals.
As a result, the USD/CAD rebound is likely to approach the 1.3570 resistance confluence including the one-week-old descending resistance line, as well as the previous support line from November 15.
Should the Loonie pair successfully breaks the 1.3570 hurdle, November’s peak of 1.3645 and the previous weekly top near 1.3685 could lure the buyers.
Following that, the monthly high near 1.3705 could check the upside momentum before allowing buyers to aim for the yearly peak of 1.3977.
Meanwhile, the 1.3500 round figure precedes the 200-SMA, near 1.3495 at the latest, to restrict short-term USD/CAD downside.
In a case where the quote remains bearish past 1.3495, the monthly low of 1.3385 will act as the last defense of the pair buyers.
USD/CAD: Four-hour chart

Trend: Further upside expected
-
01:57
GBP/USD steadies around 1.2030 as firmer yields battle with UK’s Covid optimism
- GBP/USD struggles to defend the latest bounce off the intraday low.
- UK rules out publishing Covid R number amid declining virus cases.
- China removes quarantine requirements for inbound travelers, resumes processing citizens' applications for ordinary passports.
- Firmer US Treasury yields, doubts on China Covid unlock keeps bears hopeful amid year-end holiday season.
GBP/USD treads water around 1.2030 as it struggles for clear directions amid mixed clues and the year-end holiday season. The Cable pair welcomed bears the previous day as the US Treasury yields underpinned the US Dollar. However, the Covid-linked optimism in the UK and China puts a floor under the prices.
UK Health Security Agency Chief Data Scientist Nick Watkins said in a statement, per Reuters, “Now that vaccines and therapeutics have allowed us to move to a phase where we are living with COVID-19, with surveillance scaled down but still closely monitored through a number of different indicators, the publication of this specific data is no longer necessary.” The news also stated that Britain will continue to publish its weekly flu and COVID-19 surveillance report and infection surveys.
On the other hand, China announced multiple measures to open national and international boundaries in a rush to convey the easing of COVID-19 fears. In doing so, the dragon nation initially ruled out the quarantine requirement for inbound travelers before stating that the nation will resume citizens' applications for ordinary passports for tourism and visits abroad from January 8, 2023.
Even so, a US Official mentioned, per Reuters, that the US government may impose new COVID-19 measures on travelers to the United States from China over concerns about the "lack of transparent data" coming from Beijing.
It’s worth noting that the positive headlines surrounding the virus renewed hawkish concerns over the US Federal Reserve (Fed) and propelled the US Treasury yields, which in turn allowed the US Dollar Index (DXY) to regain upside momentum the previous day. The greenback’s gauge versus the six major currencies grinds higher to around 104.20 by the press time.
Amid these plays, the 10-year Treasury bond yields remain sidelined near 3.85%, after refreshing the six-week high the previous day, whereas the S&P 500 Futures remain indecisive while tracking the mixed closing of the Wall Street benchmarks.
Moving on, the US Pending Home Sales for November which holds the market consensus of 0.6% versus -4.6% previous readings could decorate the calendar but is unlikely to move the market amid the holiday mood.
Technical analysis
An upward-sloping support line from November 30, around the 1.2000 psychological magnet by the press time, restricts the GBP/USD pair’s short-term downside. Alternatively, a convergence of the 200-SMA and one-week-old descending trend line highlights the 1.2080 level as the key upside hurdle for the Cable bulls.
-
01:40
AUD/JPY breaks above 90.00 as BOJ favors continuation of easy policy
- AUD/JPY has surpassed 90.00 as BOJ policymakers have advocated dovish policy continuation.
- The Australian Dollar has sensed a severe demand due to the scrapping of Covid-19 restrictions in China.
- The United States is considering new Covid measures for travelers from China due to a lack of transparent data.
The AUD/JPY pair has surpassed the psychological resistance of 90.00 in the Asian session. The expression of the continuation of easy monetary policy by the Bank of Japan (BOJ) through the summary of opinions of the previous week’s meeting has trimmed the appeal for the Japanese yen. The risk barometer is delivering a breakout of the volatility contraction pattern, which will drive the asset firmly higher.
Contrary to the movement of the AUD/USD pair, which is displaying weakness, the AUD/JPY pair is showing strength. The Australian Dollar has sensed a severe demand due to the scrapping of Covid-19 restrictions in China. The Chinese administration is making solid steps towards the economy reopening and rerouting to the path of progress.
In order to ease supply chain disruptions, the Chinese economy has revoked quarantine rules imposed on inbound travelers to meet the tolerance Covid policy. This has also resulted in an upside revision of the 2023 Gross Domestic Product (GDP) forecast by China’s National Bureau of Statistics (NBS). The agency said that they have revised the country’s estimate of 2023 GDP growth to 8.4% from 8.1% previously.
However, in THE Asian session, Reuters reported that the United States is considering new Covid measures for travelers from China. “The US government may impose new COVID-19 measures on travelers to the United States from China over concerns about the "lack of transparent data" coming from Beijing, U.S. officials said on Tuesday” mentioned the news.
On the Tokyo front, BOJ’s summary of opinions is indicating that policymakers are in favor of the continuation of loose monetary policy. It also conveyed that the Japanese economy is showing signs of wage rises, a positive economic cycle but it is appropriate to maintain an easy policy.
-
01:30
EUR/USD Price Analysis: Retreats towards 1.0620 support confluence
- EUR/USD remains pressured around short-term key support, snaps two-day uptrend.
- Convergence of 50-SMA, one-month-old ascending trend line puts a floor under the prices.
- Impending bear cross on MACD also keeps sellers hopeful.
EUR/USD prints mild losses around 1.0635 despite recently bouncing off the intraday low. The reason could be linked to the previous day’s U-turn from the 1.0669 level, which in turn allows the major currency pair to snap a two-day winning streak by the press time.
In addition to the quote’s retreat from 1.0669, the looming bear cross on the MACD also teases the EUR/USD sellers of late.
However, a clear downside break of the 1.0620 support confluence comprising the 50-SMA and an upward-sloping trend line from late November becomes necessary for the EUR/USD sellers to retake control.
Following that, the previous weekly low near 1.0590 could lure intraday bears ahead of the 50% Fibonacci retracement level of the pair’s November 30 to December 15 upside, close to 1.0510.
In a case where the EUR/USD prices remain weak past 1.0510, the 61.8% Fibonacci retracement, also known as the golden ratio, near 1.0460 could act as the last defense of the pair buyers.
On the contrary, recovery moves need to stay beyond the latest swing high surrounding 1.0670 to direct the EUR/USD pair buyers toward the monthly high of 1.0736.
Also acting as an upside filter is May’s peak of around 1.0790 and the 1.0800 round figure.
Overall, EUR/USD is likely to return to the bear’s radar but a clear break of 1.0620 is necessary.
EUR/USD: Four-hour chart
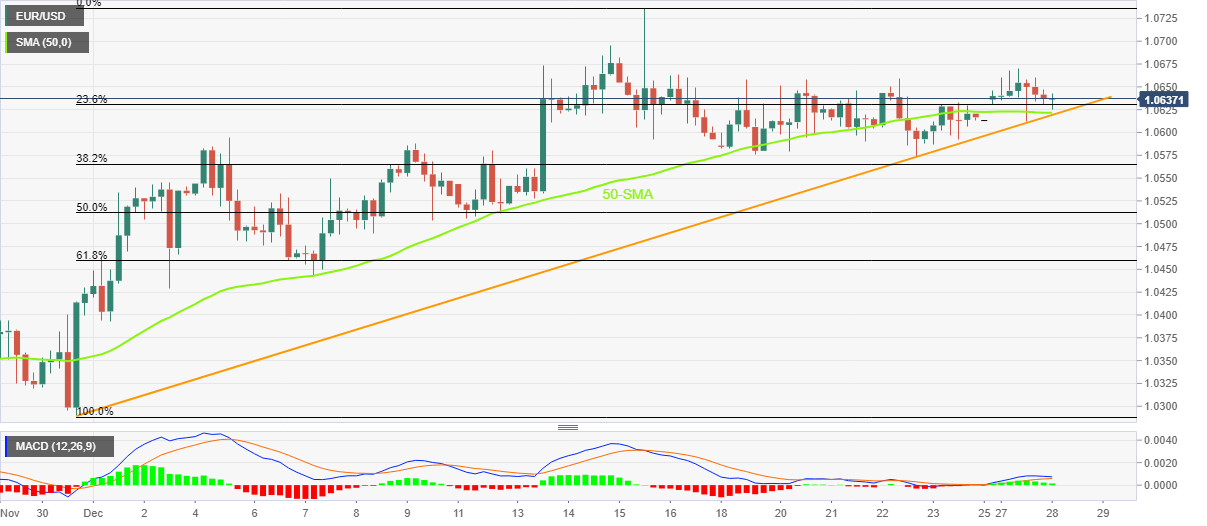
Trend: Further downside expected
-
01:19
PBOC sets USD/CNY reference rate at 6.9681 vs. 6.9546 previous
On Wednesday, the People’s Bank of China (PBOC) set the USD/CNY central rate at 6.9681 versus Tuesday's fix of 6.9546 and market expectations of 6.9687.
It's worth noting that the USD/CNY closed near the 6.9600 round figure on the previous day, taking rounds to the same by the press time.
About the fix
China maintains strict control of the yuan’s rate on the mainland.
The onshore yuan (CNY) differs from the offshore one (CNH) in trading restrictions, this last one is not as tightly controlled.
Each morning, the People’s Bank of China (PBOC) sets a so-called daily midpoint fix, based on the yuan’s previous day's closing level and quotations taken from the inter-bank dealer.
-
01:09
Gold Price Forecast: XAU/USD drops to near $1,810 despite lackluster US Dollar amid a festive week
- Gold price has slipped sharply to near $1,810.00 despite less volatility due to the festive mood.
- The risk profile seems averse as US equities are facing immense heat.
- Gold price dropped back into the Ascending Triangle after a failed breakout attempt.
Gold price (XAU/USD) is declining at a decent pace in the Asian session after failing to sustain above the critical resistance of $1,830.00 on Tuesday. The precious metal delivered a wild gyration but failed to keep reins as the US Dollar Index (DXY) defended the downside and reclaimed the 104.00 hurdle. The Gold price has dropped to near $1,810.00 and is displaying volatility despite less trading activity due to the festive mood.
Meanwhile, the risk profile has turned averse as S&P500 faced selling interest by the market participants. S&P500 futures have continued their weak performance and will remain on the tenterhooks amid the unavailability of a critical trigger. The 10-year US Treasury yields have witnessed a minor selling pressure but are still holding 3.85%.
The decline in the demand for US Durable Goods, and a steep fall in the Personal Consumption Expenditure (PCE) Price Index have raised expectations for early cuts by the Federal Reserve (Fed) in its policy rates. Economists at ING shared an opinion that the recession will accelerate inflation's slide and will allow the Fed to respond with rate cuts before CY2023 is out.
Gold technical analysis
On a four-hour scale, Gold price has reversed into the Ascending Triangle chart pattern after a failed breakout attempt. The horizontal resistance of the aforementioned chart pattern is plotted from December 13 high of around $1,824.55 while the upward-sloping trendline is placed from November 28 low at $1,738.73.
Gold price is still above the 20-period Exponential Moving Average (EMA) at around $1,807.00, which indicates that the upside is still solid. Meanwhile, the Relative Strength Index (RSI) (14) has failed to sustain above 60.00 and has dropped into the 40.00-60.00 range, which indicates a consolidation ahead.
Gold four-hour chart
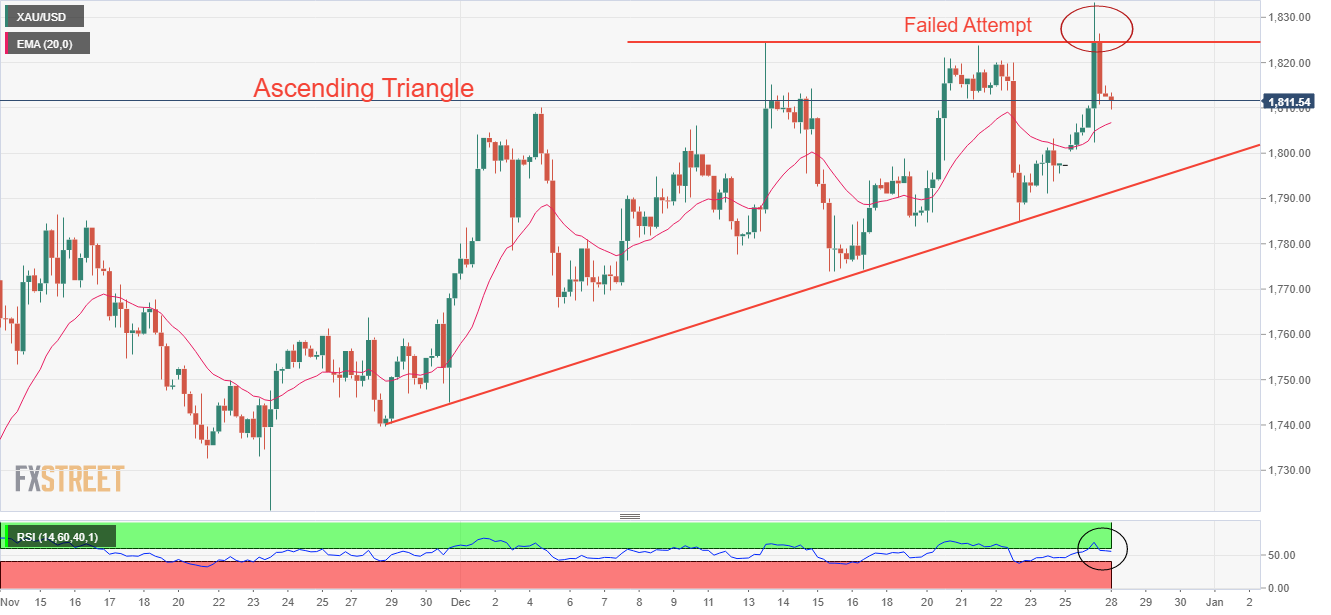
-
00:56
US Official: US is considering new Covid measures for travelers from China
US Official: US is considering new Covid measures for travelers from China
More to come
-
00:50
NZD/USD traces downbeat options market signals to slide beneath 0.6300
NZD/USD takes offers to refresh intraday low near 0.6260, extending the previous day’s downbeat momentum, while tracing the recently bearish options market signals.
That said, the Risk Reversal (RR), calculated as the difference between call and put options, drops the most in a week while posting the consecutive second negative daily RR with the latest -0.100 figures.
It’s worth noting that the weekly RR also braces for the second negative print after snapping the four-week uptrend in the last, to -0.110 at the latest.
The reason could be linked to the US Dollar’s recovery, mainly due to the latest rebound in the US Treasury yields.
Even so, the lack of major data/events joins China-linked market optimism to challenge the NZD/USD bears.
Also read: NZD/USD Price Forecast: Unconvinced buyers maintain the pair afloat
-
00:43
AUD/USD Price Analysis: Justifies Gravestone Doji bearish candlestick as sellers approach 0.6700
- AUD/USD takes offers to refresh intraday low after posting a bearish candlestick formation.
- Repeated failures to cross 21-DMA, bearish MACD signals keep sellers hopeful.
- Five-week-old ascending support line lures bears, bulls need validation from monthly high.
AUD/USD renews its intraday low near 0.6720 as it justifies the bearish candlestick formation during early Wednesday.
In doing so, the Aussie pair takes clues from the Gravestone Doji bearish candlestick pattern while also positing repeated failures to cross the 21-DMA.
Other than the bearish candlestick and multiple failures to cross the 21-DMA, the bearish MACD signals also favor AUD/USD bears targeting the 0.6700 round figure.
However, an upward-sloping support line from November 21, close to 0.6640 by the press time, could challenge the AUD/USD sellers afterward.
In a case where the Aussie pair breaks the aforementioned key support line, the odds of witnessing a slump towards the late November swing low near 0.6585 can’t be ruled out.
On the flip side, a daily closing beyond the 21-DMA hurdle surrounding 0.6745 lures the AUD/USD bulls.
Even so, the recent swing high precedes the 200-DMA resistance, respectively near 0.6775 and 0.6870, could challenge the AUD/USD buyers. Also acting as an upside filter is the monthly high near 0.6895 and the 0.6900 round figure.
Overall, AUD/USD remains on the bear’s radar but the downside room appears limited.
AUD/USD: Daily chart

Trend: Limited downside expected
-
00:39
USD/JPY breaks above 133.50 as BOJ’s summary of opinions support easy policy outlook
- USD/JPY has refreshed its day’s high at 133.70 on the continuation of the ultra-dovish policy.
- According to economists at ING, the Fed will bank upon rate cut context before the 2023 conclusion.
- Fed’s hawkish monetary policy has resulted in a decline in overall economic activities in the US.
The USD/JPY pair has delivered an upside break after displaying topsy-turvy moves around 133.50 in the Asian session. The expectations of the continuation of an ultra-loose monetary policy by the Bank of Japan (BOJ) have triggered volatility for the Japanese Yen.
The USD Index has continued its sideways performance around 103.80 despite volatility in the risk-sensitive assets. S&P500 faced selling pressure on Tuesday led by weakness in the technology stocks. Also, a decline in economic activities as shown by Trade Balance data reported by the United States Census Bureau added uncertainty in the US equities.
The US international rate deficit dropped by $15.5 billion to $83.3 billion in November from $98.8 billion recorded in October. The decline in the trade deficit is not the outcome of a proportional rise in exports but is backed by a decline in overall economic activities. The US economy has started facing the consequences of higher interest rates by the Federal Reserve (Fed) to tame the roaring inflation.
Meanwhile, the decline in the US Durable Goods Orders and households consumption expenditure has started raising red flags for the longevity of hawkish monetary policy by the Fed. Economists at ING are of the view that the recession will accelerate inflation's slide and will allow the Fed to respond with rate cuts before CY2023 is out.
On the Japan front, Reuters conveyed the Bank of Japan (BOJ) Summary of Opinions for the latest monetary policy meeting highlighting that the central bank must maintain the easy policy as Japan is in a critical phase of hitting the price goal. Also, the economy is showing signs of wage rises, a positive economic cycle but appropriate to maintain an easy policy for time being.
-
00:30
Stocks. Daily history for Tuesday, December 27, 2022
Index Change, points Closed Change, % NIKKEI 225 42 26447.87 0.16 KOSPI 15.65 2332.79 0.68 DAX 54.17 13995.1 0.39 CAC 40 45.76 6550.66 0.7 Dow Jones 37.63 33241.56 0.11 S&P 500 -15.57 3829.25 -0.4 NASDAQ Composite -144.63 10353.23 -1.38 -
00:25
US Dollar Index extends recovery above 104.00 amid strong US Treasury bond yields
- US Dollar Index picks up bids to extend the latest rebound from one-week low.
- China-linked optimism, mixed US data renew hawkish Fed bets amid holiday season.
- Second-tier US data can entertain traders amid likely inactive markets.
US Dollar Index (DXY) holds onto the week-start recovery moves around 104.25 during early Wednesday. In doing so, the Greenback’s gauge versus the six major currencies traces the firmer prints of the US Treasury bond yields amid a trading session due to the holiday season.
That said, US 10-year Treasury bond yields rose to the fresh high in six weeks the previous day, firmer around 3.85% by the press time, as the positive mood surrounding China’s reopening helped renew hopes of faster Fed rate hikes.
It’s worth noting that the hawkish Fed concerns might have taken clues from the improvement in the US Good Trade Balance for November, $-83.3B versus $98.8B prior, while ignoring softer prints of the US S&P/Case-Shiller Home Price Indices for October, 8.6% YoY versus 9.7% expected and 10.4% previous readings. It’s worth noting that the previously mixed readings of the US inflation and growth figures raised doubts about the Federal Reserve’s (Fed) hawkish move, especially after the US central bank appeared cautiously optimistic over the rate hikes in its latest monetary policy meeting.
China’s easing of the Coronavirus-linked activity restrictions joined an upward revision to the 2021 Gross Domestic Production forecast to favor the sentiment despite the sluggish holiday season. That said, China mentioned that it would stop requiring inbound travelers to go into quarantine from January 8, the National Health Commission (NHC) said late on Monday, a major step towards loosening its curbs, per Reuters. The news joins China’s National Bureau of Statistics (NBS) upward revision to the 2021 GDP growth to 8.4% from 8.1% previous forecast also favored the risk-on mood.
Amid these plays, Wall Street closed mixed and the S&P 500 Futures remain indecisive by the press time.
Looking forward, a lack of major data/events could keep restricting short-term DXY moves but firmer US Treasury bond yields favor the bulls. Even so, the US Pending Home Sales for November which holds the market consensus of 0.6% versus -4.6% previous readings could decorate the calendar.
Technical analysis
Tuesday’s bullish Doji candlestick suggests further recovery of the US Dollar Index unless the quote drops back below the recent low of 103.88.
-
00:15
Currencies. Daily history for Tuesday, December 27, 2022
Pare Closed Change, % AUDUSD 0.67341 0.19 EURJPY 141.998 0.57 EURUSD 1.06377 0.02 GBPJPY 160.603 0.31 GBPUSD 1.20312 -0.16 NZDUSD 0.62739 -0.28 USDCAD 1.35227 -0.42 USDCHF 0.9294 -0.13 USDJPY 133.488 0.47 -