Notícias do Mercado
-
23:26
Currencies. Daily history for March 08’2018:
(raw materials / closing price /% change)
Oil 60.33 -1.34%
Gold 1,322.50 -0.38%
-
11:16
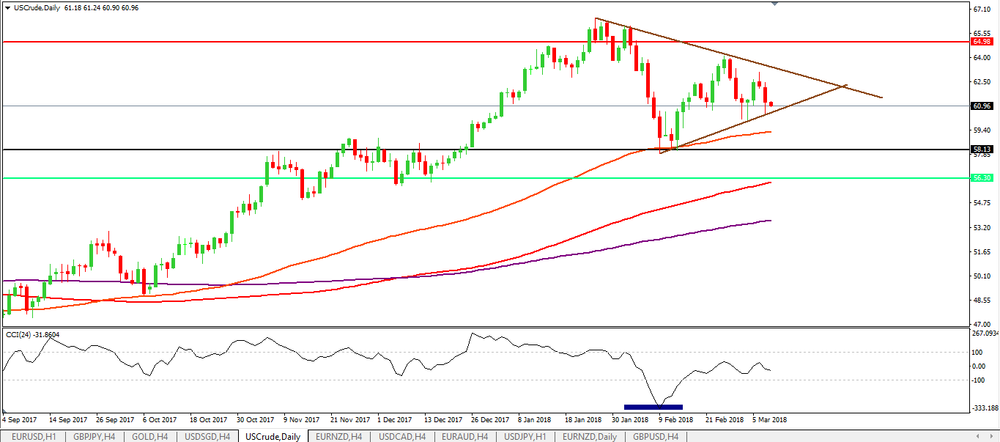
Crude oil analysis
Crude oil on a daily chart, we can see that it is moving close to the upside trend of the chart pattern (Triangle).
If we watch the price rejecting new downside movements. in the smaller time frames, we might consider long entries in this commodity.
Therefore, our first target will be near to the downside trend and the second target could be slightly above it - speculating that the price will break above the chart pattern.
-
09:50
Análise Diária Petróleo Crude
Analisando o crude em gráfico diário podemos que se está a aproximar da linha ascendente do padrão gráfico (Triângulo).
Se assistirmos a rejeições por parte do preço, nos time frames mais pequenos, a novas descidas então poder-se-á ponderar entradas longas nesta commodity. Sendo que o primeiro target será perto da linha de tendência descendente e o segundo ligeiramente acima da mesma especulando já que o preço rompa e cumpra o padrão gráfico.

-