Notícias do Mercado
-
20:00
DJIA +1.59% 24,127.03 +377.27 Nasdaq +2.25% 8,906.71 +196.00 S&P +1.89% 2,896.34 +53.60
-
17:00
European stocks closed: FTSE 100 5,849.42 +95.64 +1.66% DAX 10,729.46 +262.66 +2.51% CAC 40 4,483.13 +104.90 +2.40%
-
15:25
U.S. non-manufacturing sector contacts in April for the first time since December 2009 - ISM
The Institute for Supply Management (ISM) reported on Tuesday its non-manufacturing index (NMI) came in at 41.8 in April, which was 10.7 percentage points lower than the March reading of 52.2 percent. The April reading pointed to the first contraction in the services sector since December 2009 and the steepest decline since March 2009.
A reading above 50 signals expansion, while a reading below 50 indicates contraction.
Of the 18 manufacturing industries, 16 reported decreases last month, the ISM said, adding that respondents were concerned about the continuing coronavirus impacts on the supply chain, operational capacity, human resources and finances, as well as the uncertain timelines for the resumption of business and a return to normality.
According to the report, the ISM's non-manufacturing business activity measure fell to its record low of 26 percent, 22 percentage points lower than the March reading. The new orders gauge came in at 39.2 percent, 20 percentage points below February's reading. The Employment Index fell by 17 percentage points to 30 percent from the February reading. The Prices Index of 50 percent was 0.8 percentage point lower than the February reading of 50.8 percent, indicating that prices were unchanged in March. Meanwhile, the Supplier Deliveries Index registered an all-time high of 78.3 percent, up 16.2 percentage points from the March reading, limiting the drop in the composite NMI
Commenting on the data, the Chair of the ISM Non-Manufacturing Business Survey Committee, Anthony Nieves, noted, "The past relationship between the NMI and the overall economy indicates that the NMI for April (41.8 percent) corresponds to a 2.3-percent decrease in real gross domestic product (GDP) on an annualized basis."
-
14:35
U.S. Stocks open: Dow +1.24%, Nasdaq +1.38%, S&P +1.26%
-
14:29
Before the bell: S&P futures +1.33%, NASDAQ futures +1.33%
U.S. stock-index futures rose on Tuesday, as oil prices demonstrated recovery and major economies around the world began reopening.
Global Stocks:
Index/commodity
Last
Today's Change, points
Today's Change, %
Nikkei
-
-
-
Hang Seng
23,868.66
+254.86
+1.08%
Shanghai
-
-
-
S&P/ASX
5,407.10
+87.30
+1.64%
FTSE
5,849.42
+95.64
+1.66%
CAC
4,461.47
+83.24
+1.90%
DAX
10,637.52
+170.72
+1.63%
Crude oil
$23.12
+13.39%
Gold
$1,700.20
-0.76%
-
14:28
S&P 500: Rebound to be capped at the 2912 resistance – Credit Suisse
FXStreet reports that analysts at Credit Suisse apprise that the S&P 500 has again managed to hold support on a closing basis from its rising 13-day average, currently seen at 2831.
"Near-term, we see scope for a rebound to test resistance from the price gap seen Friday, seen starting at 2869 and stretching up to 2912."
"With the 63-day average also in this zone at 2874 and with the rally having essentially been capped as expected at the 61.8% retracement of the Q1 collapse at 2934, we continue to look for this to cap to add weight to our topping scenario."
"A close below the aforementioned 13-day average at 2831 is needed to add weight to this view with support then seen next at 2798, then 2776/75 - the 23.6% retracement of the entire March/April recovery. At the end of the day though, below 2733/27 remains needed to mark a more important top."
-
13:59
Wall Street. Stocks before the bell
(company / ticker / price / change ($/%) / volume)
3M Co
MMM
149.8
1.40(0.94%)
2643
ALCOA INC.
AA
8.04
0.24(3.08%)
49703
ALTRIA GROUP INC.
MO
38.49
0.48(1.26%)
8030
Amazon.com Inc., NASDAQ
AMZN
2,331.00
15.01(0.65%)
37186
American Express Co
AXP
88.65
2.27(2.63%)
24078
AMERICAN INTERNATIONAL GROUP
AIG
25.65
1.58(6.56%)
17147
Apple Inc.
AAPL
295.75
2.59(0.88%)
247012
AT&T Inc
T
29.92
0.32(1.08%)
78347
Boeing Co
BA
133.7
2.24(1.70%)
332806
Caterpillar Inc
CAT
109.3
1.58(1.47%)
160937
Chevron Corp
CVX
94.5
3.06(3.35%)
67154
Cisco Systems Inc
CSCO
41.7
0.35(0.85%)
25539
Citigroup Inc., NYSE
C
46.38
1.26(2.79%)
81108
Deere & Company, NYSE
DE
135.78
2.84(2.14%)
502
E. I. du Pont de Nemours and Co
DD
45.6
0.88(1.97%)
35738
Exxon Mobil Corp
XOM
46.34
1.46(3.25%)
192047
Facebook, Inc.
FB
207.55
2.29(1.12%)
93571
FedEx Corporation, NYSE
FDX
117.98
2.13(1.84%)
2193
Ford Motor Co.
F
4.98
0.12(2.47%)
813116
Freeport-McMoRan Copper & Gold Inc., NYSE
FCX
8.9
0.20(2.30%)
36474
General Electric Co
GE
6.29
0.08(1.29%)
1271628
General Motors Company, NYSE
GM
21.2
0.45(2.17%)
31432
Goldman Sachs
GS
178.72
2.69(1.53%)
11737
Google Inc.
GOOG
1,341.00
14.20(1.07%)
7507
Hewlett-Packard Co.
HPQ
15.15
0.25(1.68%)
2456
Home Depot Inc
HD
223.64
1.80(0.81%)
9621
HONEYWELL INTERNATIONAL INC.
HON
138.21
3.01(2.22%)
1026
Intel Corp
INTC
58.8
0.81(1.40%)
44455
International Business Machines Co...
IBM
123.98
2.30(1.89%)
18818
International Paper Company
IP
34
0.63(1.89%)
11027
Johnson & Johnson
JNJ
148.62
0.35(0.24%)
149818
JPMorgan Chase and Co
JPM
94
1.86(2.02%)
65886
McDonald's Corp
MCD
183.24
1.37(0.75%)
6929
Merck & Co Inc
MRK
77.4
0.54(0.70%)
9770
Microsoft Corp
MSFT
181.3
2.46(1.38%)
377642
Nike
NKE
86.6
0.85(0.99%)
49789
Pfizer Inc
PFE
38.35
0.73(1.94%)
291005
Procter & Gamble Co
PG
116.37
0.60(0.52%)
5826
Starbucks Corporation, NASDAQ
SBUX
74.67
2.78(3.87%)
70363
Tesla Motors, Inc., NASDAQ
TSLA
782.75
21.56(2.83%)
309068
The Coca-Cola Co
KO
45.45
0.31(0.69%)
49373
Travelers Companies Inc
TRV
97.44
0.53(0.55%)
1339
Twitter, Inc., NYSE
TWTR
28.65
0.42(1.49%)
121619
UnitedHealth Group Inc
UNH
289.48
1.94(0.67%)
2036
Verizon Communications Inc
VZ
56.6
0.36(0.64%)
32410
Visa
V
178.4
2.25(1.28%)
42835
Wal-Mart Stores Inc
WMT
123.66
-0.04(-0.03%)
15163
Walt Disney Co
DIS
102.48
-0.70(-0.68%)
173904
Yandex N.V., NASDAQ
YNDX
38.4
0.40(1.05%)
2116
-
13:37
U.S. trade deficit widens slightly more than expected in March
The U.S. Commerce Department reported on Tuesday that U.S. the goods and services trade deficit widened to $44.4 billion in March from a revised $39.8 billion in the previous month (originally a gap of $39.9 billion).
Economists had expected a deficit of $44.0 billion.
According to the report, the March advance in the goods and services deficit reflected an increase in the goods deficit of $4.6 billion to $65.6 billion and a decline in the services surplus of $0.1 billion to $21.2 billion.
Exports of goods and services from the U.S. fell 9.6 percent m-o-m to $187.7 billion in March, while imports dropped 6.2 percent m-o-m to $232.2 billion, in part, due to the impact of COVID-19, as many businesses were operating at limited capacity or ceased operations completely, and the movement of travelers across borders was restricted.
Year-to-date, the goods and services deficit tumbled 17.8 percent from the same period in 2019. Exports decreased 3.5 percent, while imports dropped 6.4 percent.
-
13:11
Company News: Fiat Chrysler (FCAU) reports surprise quarterly loss
Fiat Chrysler (FCAU) reported Q1 FY 2020 loss of EUR0.30 per share (versus earnings of EUR0.36 per share in Q1 FY 2019), worse than analysts' consensus estimate of earnings of EUR0.05 per share.
The company's quarterly revenues amounted to EUR20.567 bln (-16.0% y/y), missing analysts' consensus estimate of EUR21.121 bln.
FCAU rose to $8.37 (+0.84%) in pre-market trading.

-
12:23
S&P 500: Bears and bulls running at full speed – Charles Schwab
FXStreet reports that according to Liz Ann Sonders from Charles Schwab, the ‘dumb money’ and the ‘smart money’ are beginning to converge and would represent a risk if they continue to reach opposite extremes again.
“The stock market’s rally has been fueled by Fed-provided liquidity, but the 62% retracement between March 23 and April 29 suggests stocks were pricing in a V-shaped recovery in the economy. That is unlikely.”
“In contrast to the more bullish outlook being expressed by the ‘dumb money’ and the still fairly bullish positioning of the ‘smart money,’ investor sentiment in opinion surveys is significantly more subdued.”
“From an investor perspective, unlike consumer confidence vs. consumer spending, investors are saying they’re more bearish, but acting more bullish.”
“The percentage of S&P 500 stocks trading above their 200-day moving average remains extremely low at only 20%. That is significantly lower than 70-80% at this point last year (when the S&P was at about the same level as today).”
-
11:14
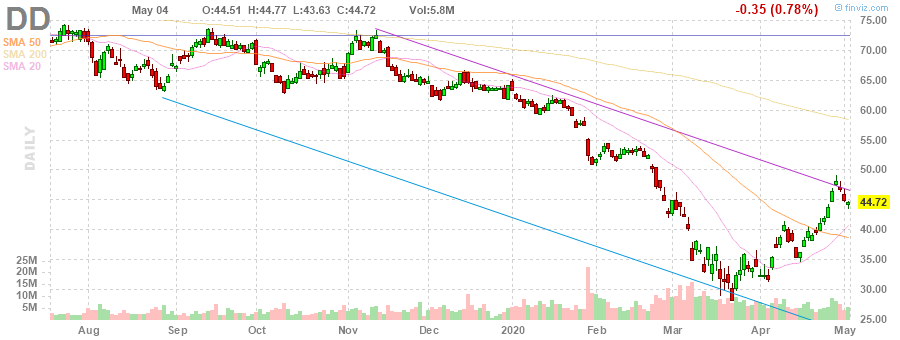
Company News: DuPont (DD) quarterly results beat analysts’ expectations
DuPont (DD) reported Q1 FY 2020 earnings of $0.84 per share, beating analysts' consensus estimate of $0.77 per share.
The company's quarterly revenues amounted to $5.221 bln (-3.6% y/y), beating analysts' consensus estimate of $5.143 bln.
DD rose to $45.15 (+0.96%) in pre-market trading.
-
11:09
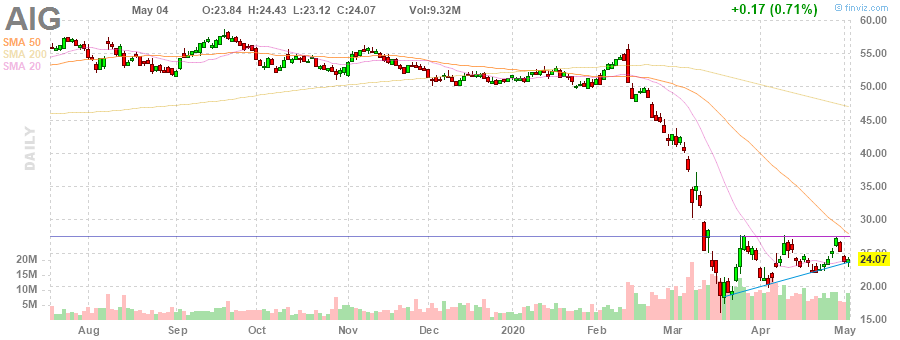
Company News: American Intl (AIG) quarterly earnings miss analysts’ forecast
American Intl (AIG) reported Q1 FY 2020 earnings of $0.11 per share (versus $1.58 per share in Q1 FY 2019), missing analysts' consensus estimate of $0.82 per share.
The company withdrew its previously issued guidance as the COVID-19 crisis had created significant uncertainty, and it would take time to understand its broader ramifications.
AIG closed Monday's trading session at $24.07 (+0.71%).
-
01:30
Stocks. Daily history for Monday, May 4, 2020
Index Change, points Closed Change, % Hang Seng -1029.79 23613.8 -4.18 KOSPI -52.19 1895.37 -2.68 ASX 200 73.9 5319.8 1.41 FTSE 100 -9.28 5753.78 -0.16 DAX -394.84 10466.8 -3.64 CAC 40 -193.95 4378.23 -4.24 Dow Jones 26.07 23749.76 0.11 S&P 500 12.03 2842.74 0.42 NASDAQ Composite 104.82 8709.77 1.22 -