Notícias do Mercado
-
20:01
DJIA -0.07% 23,865.51 -17.58 Nasdaq +1.18% 8,913.19 +104.07 S&P +0.08% 2,870.83 +2.39
-
17:00
European stocks closed: FTSE 100 5,853.76 +4.34 +0.07% DAX 10,606.20 -123.26 -1.15% CAC 40 4,433.38 -49.75 -1.11%
-
16:06
S&P 500: Price action fatigue will begin to set in – TDS
FXStreet reports that according to analysts at TD Securities, in the S&P 500 chart, 2880 is a notable technical threshold as it coincides with a cluster of pivots.
“Even though the S&P 500 closed in the green, it was below the 2880 level which appears like a notable pivot as it broadly coincides with a multitude of pivots (the Oct 3, 2019 low, Aug 2019 congestion zone, Feb 28, 2020 low, April 17, 2020, high).”
“The S&P 500 overall remains below its 200-dma which sit just a hair above 3k.”
“If the pivots are to be respected, the S&P 500 might be in the process of a head and shoulders formation as well. If validated, support levels we have our eye on are 2773 and 2650 (which could be neckline support).”
-
14:33
U.S. Stocks open: Dow +0.71%, Nasdaq +0.96%, S&P +0.75%
-
14:25
Before the bell: S&P futures +0.51%, NASDAQ futures +0.64%
U.S. stock-index futures rose moderately on Wednesday, paring earlier gains after ADP's private-sector employment report showed a devastating situation in the U.S. jobs market. Investors also assessed the consequences of the economy reopening and Q1 earnings reports.
Global Stocks:
Index/commodity
Last
Today's Change, points
Today's Change, %
Nikkei
-
-
-
Hang Seng
24,137.48
+268.82
+1.13%
Shanghai
2,878.14
+18.06
+0.63%
S&P/ASX
5,384.60
-22.50
-0.42%
FTSE
5,873.37
+23.95
+0.41%
CAC
4,459.86
-23.27
-0.52%
DAX
10,686.89
-42.57
-0.40%
Crude oil
$22.91
-6.72%
Gold
$1,701.50
-0.53%
-
13:57
Wall Street. Stocks before the bell
(company / ticker / price / change ($/%) / volume)
3M Co
MMM
148
0.57(0.39%)
1452
ALCOA INC.
AA
7.91
0.10(1.28%)
11550
ALTRIA GROUP INC.
MO
37.05
0.25(0.68%)
19161
Amazon.com Inc., NASDAQ
AMZN
2,324.31
6.51(0.28%)
13077
American Express Co
AXP
86.8
0.06(0.07%)
4721
AMERICAN INTERNATIONAL GROUP
AIG
25
-0.06(-0.24%)
8766
Apple Inc.
AAPL
299.26
1.70(0.57%)
222005
AT&T Inc
T
29.91
0.17(0.57%)
57243
Boeing Co
BA
126.23
0.83(0.66%)
164362
Caterpillar Inc
CAT
109.2
0.29(0.27%)
137967
Chevron Corp
CVX
93.05
0.16(0.17%)
96687
Cisco Systems Inc
CSCO
41.48
0.02(0.05%)
8502
Citigroup Inc., NYSE
C
44.2
0.25(0.57%)
88866
E. I. du Pont de Nemours and Co
DD
45
0.31(0.69%)
1520
Exxon Mobil Corp
XOM
44.98
0.15(0.33%)
600326
Facebook, Inc.
FB
208.03
0.96(0.46%)
43014
FedEx Corporation, NYSE
FDX
118.3
0.63(0.54%)
5440
Ford Motor Co.
F
5.04
0.07(1.41%)
387137
Freeport-McMoRan Copper & Gold Inc., NYSE
FCX
8.9
0.10(1.14%)
42126
General Electric Co
GE
6.21
0.01(0.16%)
357094
General Motors Company, NYSE
GM
22.73
1.47(6.91%)
740936
Goldman Sachs
GS
179.54
1.24(0.70%)
4812
Google Inc.
GOOG
1,360.00
8.89(0.66%)
6807
Hewlett-Packard Co.
HPQ
14.91
0.10(0.68%)
3957
Home Depot Inc
HD
226.5
0.89(0.39%)
6403
Intel Corp
INTC
58.8
0.38(0.65%)
19632
International Business Machines Co...
IBM
123.25
0.67(0.55%)
12067
Johnson & Johnson
JNJ
150.25
0.75(0.50%)
114956
JPMorgan Chase and Co
JPM
92.46
0.46(0.50%)
49799
McDonald's Corp
MCD
180.18
0.94(0.52%)
7146
Merck & Co Inc
MRK
78.45
0.44(0.56%)
1490
Microsoft Corp
MSFT
181.55
0.79(0.44%)
104270
Nike
NKE
87.7
0.50(0.57%)
109354
Pfizer Inc
PFE
38.89
0.38(0.99%)
75753
Procter & Gamble Co
PG
115.64
-0.37(-0.32%)
124148
Starbucks Corporation, NASDAQ
SBUX
73.61
0.71(0.97%)
43877
Tesla Motors, Inc., NASDAQ
TSLA
776
7.79(1.01%)
86991
Travelers Companies Inc
TRV
97.01
0.16(0.17%)
730
Twitter, Inc., NYSE
TWTR
28.15
0.08(0.29%)
49308
Verizon Communications Inc
VZ
56.52
0.01(0.02%)
60070
Visa
V
179.02
0.58(0.33%)
178890
Wal-Mart Stores Inc
WMT
125.2
0.47(0.38%)
8169
Walt Disney Co
DIS
101.31
0.25(0.25%)
701587
Yandex N.V., NASDAQ
YNDX
38.03
-0.35(-0.91%)
3125
-
13:39
Downgrades before the market open
Downgrades before the market open
American Intl (AIG) downgraded to Mkt Perform from Outperform at William Blair
Dow (DOW) downgraded to Neutral from Buy at UBS; target lowered to $32
Snap (SNAP) downgraded to Sell from Neutral at Citigroup; target raised to $14
-
12:40
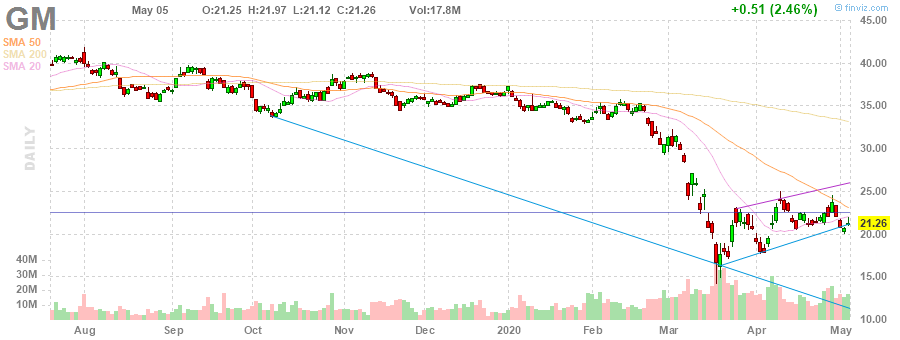
Company News: General Motors (GM) quarterly results beat analysts’ expectations
General Motors (GM) reported Q1 FY 2020 earnings of $0.62 per share (versus $1.41 per share in Q1 FY 2019), beating analysts' consensus estimate of $0.34 per share.
The company's quarterly revenues amounted to $32.709 bln (-6.2% y/y), beating analysts' consensus estimate of $31.367 bln.
GM rose to $22.25 (+4.66%) in pre-market trading.
-
12:16
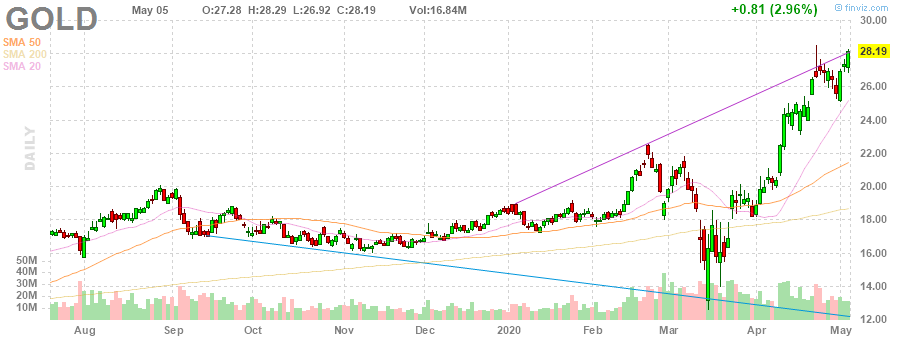
Company News: Barrick (GOLD) posts quarterly earnings in line with analysts' estimate
Barrick (GOLD) reported Q1 FY 2020 earnings of $0.16 per share (versus $0.11 per share in Q1 FY 2019), in line with analysts' consensus estimate of $0.16 per share.
The company's quarterly revenues amounted to $2.721 bln (+30.0% y/y), missing analysts' consensus estimate of $2.790 bln.
GOLD fell to $28.02 (-0.60%) in pre-market trading.
-
12:00
S&P 500: Resistance at 2934/3004 to cap and eventually form a top – Credit Suisse
S&P 500: Resistance at 2934/3004 to cap and eventually form a top – Credit Suisse
FXStreet reports that analysts at Credit Suisse note that the S&P 500 has been capped as expected at the upper end of the flagged resistance/recovery objective at 2883/2934 - the price gap from early March, 61.8% retracement of the Q1 collapse and falling 63-day average.
“With a bearish average ‘death cross’ in place, we maintain our base case scenario strength has been corrective only and we continue to look for a top here for an eventual resumption of the Q1 decline.”
“Below 2727 is now needed to mark a near-term top to add weight to our view, with critical then 200-week average at 2664.”
“A close above 2934 would suggest the recovery can extend yet further to the 200-day average and gap resistance at 2986/3004. We would look for a fresh attempt to set a top here.”
-
11:04
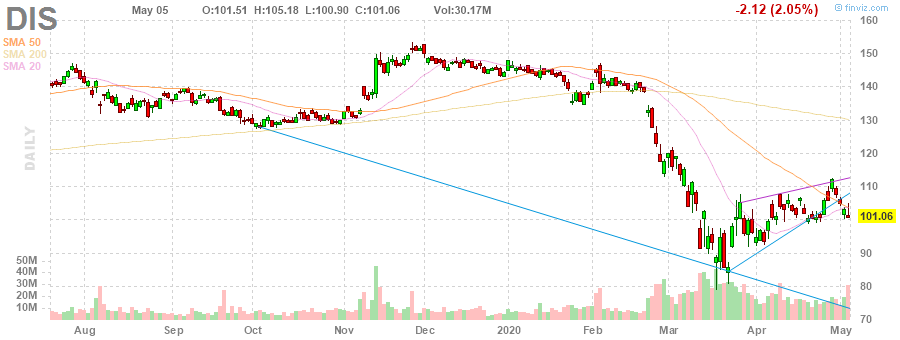
Company News: Walt Disney (DIS) posts mixed quarterly results
Walt Disney (DIS) reported Q2 FY 2020 earnings of $0.60 per share (versus $1.61 per share in Q2 FY 2019), missing analysts' consensus estimate of $0.90 per share.
The company's quarterly revenues amounted to $18.009 bln (+20.7% y/y), beating analysts' consensus estimate of $17.493 bln.
DIS fell to $99.33 (-1.71%) in pre-market trading.
-
01:30
Stocks. Daily history for Tuesday, May 5, 2020
Index Change, points Closed Change, % Hang Seng 254.86 23868.66 1.08 ASX 200 87.3 5407.1 1.64 FTSE 100 95.64 5849.42 1.66 DAX 262.66 10729.46 2.51 CAC 40 104.9 4483.13 2.4 Dow Jones 133.33 23883.09 0.56 S&P 500 25.7 2868.44 0.9 NASDAQ Composite 98.41 8809.12 1.13 -