Market news
-
23:29
Currencies. Daily history for Jan 10’2017:
(pare/closed(GMT +3)/change, %)
EUR/USD $1,0553 -0,19%
GBP/USD $1,2173 +0,11%
USD/CHF Chf1,0167 +0,15%
USD/JPY Y115,75 -0,22%
EUR/JPY Y122,17 -0,40%
GBP/JPY Y140,92 -0,11%
AUD/USD $0,7367 +0,20%
NZD/USD $0,6988 -0,37%
USD/CAD C$1,323 +0,12%
-
23:01
Schedule for today, Wednesday, Jan 11’2017 (GMT0)
05:00 Japan Coincident Index (Preliminary) November 113.5
05:00 Japan Leading Economic Index (Preliminary) November 100.8 102.6
09:30 United Kingdom Total Trade Balance November -1.97
09:30 United Kingdom Industrial Production (MoM) November -1.3% 0.8%
09:30 United Kingdom Industrial Production (YoY) November -1.1% 0.6%
09:30 United Kingdom Manufacturing Production (MoM) November -0.9% 0.5%
09:30 United Kingdom Manufacturing Production (YoY) November -0.4% 0.4%
15:30 U.S. Crude Oil Inventories January -7.051 0.620
23:50 Japan Current Account, bln November 1720 1500
-
15:53
ING sees weaker GBP as markets price Brexit risk
-
15:41
Long HUF/PLN on political risks, says Nordea
-
15:17
US wholesale inventories rose more than expected in November
Total inventories of merchant wholesalers, except manufacturers' sales branches and offices, after adjustment for seasonal variations but not for price changes, were $595.3 billion at the end of November, up 1.0 percent (±0.2 percent) from the revised October level. Total inventories are up 1.4 percent (±1.1 percent) from the revised November 2015 level. The October 2016 to November 2016 percent change was revised from the advance estimate of up 0.9 percent (±0.2 percent) to up 1.0 percent (±0.2 percent).
-
15:15
The number of US job openings was little changed
The number of job openings was little changed at 5.5 million on the last business day of November, the U.S. Bureau of Labor Statistics reported today. Over the month, hires and separations were also little changed at 5.2 million and 5.0 million, respectively. Within separations, the quits rate was unchanged at 2.1 percent and the layoffs and discharges rate was unchanged at 1.1 percent. This release includes estimates of the number and rate of job openings, hires, and separations for the nonfarm sector by industry and by four geographic regions.
-
15:00
U.S.: Wholesale Inventories, November 1% (forecast 0.9%)
-
15:00
U.S.: JOLTs Job Openings, November 5.522 (forecast 5.555)
-
13:44
Option expiries for today's 10:00 ET NY cut
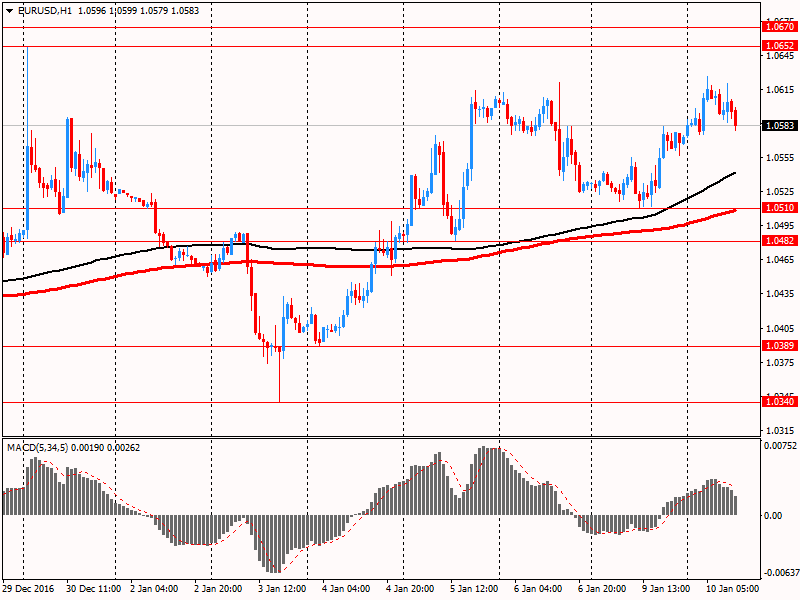
EUR/USD 1.0390-1.0405 (EUR 695 M) 1.0500-1.0510 (EUR 448 M) 1.0515-1.0525 (EUR 415 M) 1.0570-1.0575 (EUR 1,065 M) 1.0600-1.0610 (EUR 191 M) 1.0650-1.0660 (EUR 497 M) 1.0685-1.0700 (EUR 417 M) 1.0750 (EUR 534 M)
GBP/USD 1.2190 (GBP 288 M)
USD/JPY 113.95-114.00 (USD 324 M) 114.20 (USD 200 M) 115.50-115.60 (USD 350 M) 115.95-116.00 (USD 998 M) 117.40-117.50 (USD 658 M) 118.00 (USD 200 M)
AUD/USD 0.7200 (AUD 1,897 M) 0.7290-0.7300 (AUD 449 M) 0.7400 (AUD 595 M)
USD/CAD 1.3280-1.3285 (USD 295 M) 1.3395-1.3400 (USD 290 M)
NZD/USD 0.6900 (NZD 200 M)
-
13:41
Canadian housing starts kept a steady pace in December
The trend measure of housing starts in Canada was 198,053 units in December compared to 200,105 in November, according to Canada Mortgage and Housing Corporation (CMHC). The trend is a six-month moving average of the monthly seasonally adjusted annual rates (SAAR) of housing starts.
"December saw multi-unit construction slow for the third consecutive month in Canada, leading housing starts to trend down," said Bob Dugan, CMHC Chief Economist. "However, 2016 still counted more home starts than 2015. Increased demand for single-detached homes more than offset the decline we're seeing in multi-unit construction - a decline that's in response to efforts to manage current inventories."
-
13:30
Canada: Building Permits (MoM) , November -0.1% (forecast 2.4%)
-
13:14
Canada: Housing Starts, December 207 (forecast 187)
-
12:59
Orders
EUR/USD
Offers 1.0630 1.0650 1.0680 1.0700 1.0725-30 1.0750
Bids 1.0580 1.0560 1.0520 1.0500 1.0480 1.0450 1.0420 1.0400
GBP/USD
Offers 1.2160 1.2180 1.2200 1.2220 1.2250 1.2280 1.2300
Bids 1.2100 1.2080-85 1.2050 1.2030 1.2000 1.1980 1.1950
EUR/GBP
Offers 0.8780 0.8800 0.8830 0.8850 0.8875 0.8900
Bids 0.8700 0.8680-85 0.8660 0.8640 0.8620 0.8600
EUR/JPY
Offers 123.00 123.30 123.60 123.85 124.00-10 124.30 124.50
Bids 122.50 122.30 122.00 121.75 121.50 121.00
USD/JPY
Offers 116.00 116.20 116.50 116.80 117.00 117.20 117.50-55 117.80 118.00
Bids 115.50 115.20 115.00 114.80 114.50 114.30 114.00
AUD/USD
Offers 0.7380-85 0.7400 0.7420-25 0.7450 0.7475 0.7500
Bids 0.7330 0.7300 0.7280 0.7250 0.7230 0.7200
-
10:43
-
09:30
Turkish Lira hit record low around 3.7790 per USD in early trade
-
09:17
Goldman: China's Been Trying To Make Yuan Look Good Since Trump's Victory
-
07:48
Fench output bounced back markedly in the manufacturing industry - INSEE
In November 2016, output bounced back markedly in the manufacturing industry (+2.3% after −0.6%). It also grew sharply in the whole industry (+2.2% after −0.1%).
Over the past three months, output grew in the manufacturing industry (+0.6% q-o-q), as well as in the overall industry (+0.7% q-o-q).
Output increased in all branches. It rose sharply in mining and quarrying; energy; water supply (+1.9%), in the manufacture of transport equipment (+1.1%) and in the manufacture of food products and beverages (+0.9%). It soared in the manufacture of coke and refined petroleum products (+16.6%). Finally, it went up slightly in "other manufacturing" (+0.2%) and in the manufacture of machinery and equipment goods (+0.5%).
-
07:45
France: Industrial Production, m/m, November 2.2% (forecast 0.6%)
-
07:19
Options levels on tuesday, January 10, 2017
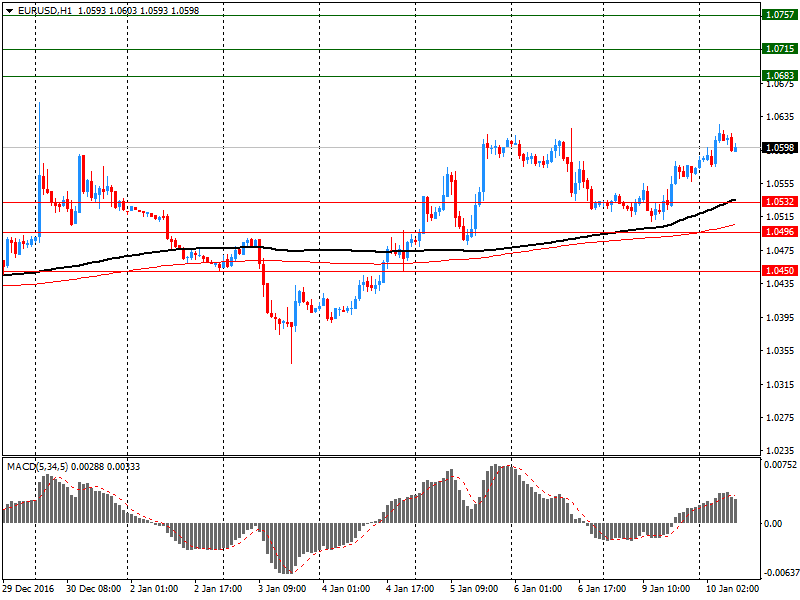
EUR/USD
Resistance levels (open interest**, contracts)
$1.0757 (2312)
$1.0715 (2281)
$1.0683 (356)
Price at time of writing this review: $1.0598
Support levels (open interest**, contracts):
$1.0532 (1104)
$1.0496 (1115)
$1.0450 (2414)
Comments:
- Overall open interest on the CALL options with the expiration date March, 13 is 52302 contracts, with the maximum number of contracts with strike price $1,1500 (3223);
- Overall open interest on the PUT options with the expiration date March, 13 is 59971 contracts, with the maximum number of contracts with strike price $1,0000 (5322);
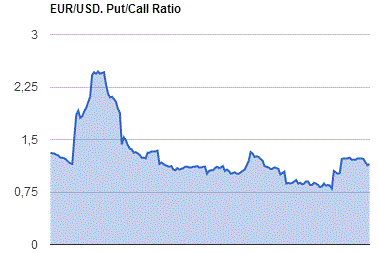
- The ratio of PUT/CALL was 1.15 versus 1.15 from the previous trading day according to data from January, 9
GBP/USD
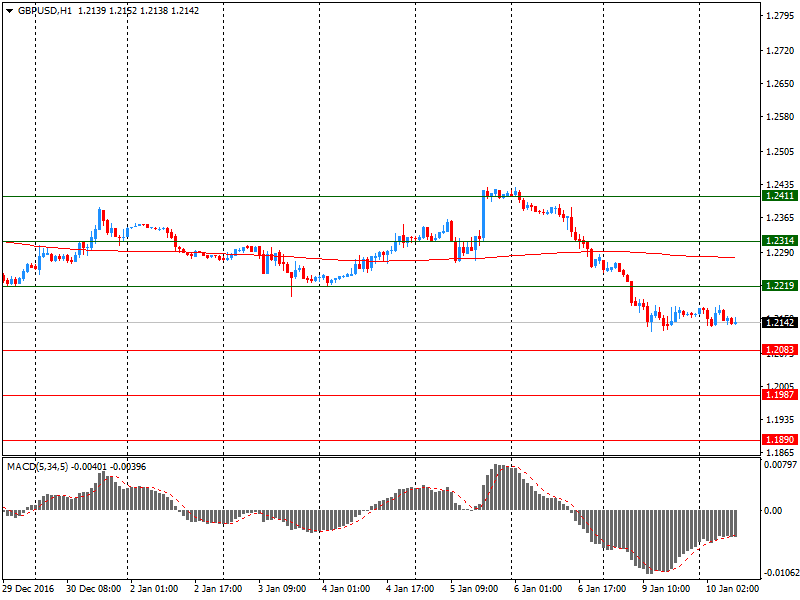
Resistance levels (open interest**, contracts)
$1.2411 (252)
$1.2314 (130)
$1.2219 (107)
Price at time of writing this review: $1.2142
Support levels (open interest**, contracts):
$1.2083 (447)
$1.1987 (1666)
$1.1890 (2874)
Comments:
- Overall open interest on the CALL options with the expiration date March, 13 is 15493 contracts, with the maximum number of contracts with strike price $1,2800 (3002);
- Overall open interest on the PUT options with the expiration date March, 13 is 19667 contracts, with the maximum number of contracts with strike price $1,1500 (3214);
- The ratio of PUT/CALL was 1.27 versus 1.20 from the previous trading day according to data from January, 9
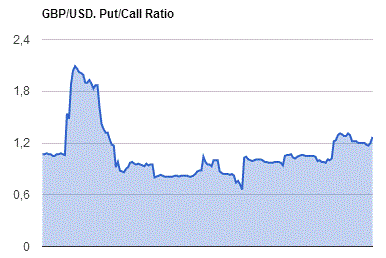
* - The Chicago Mercantile Exchange bulletin (CME) is used for the calculation.
** - Open interest takes into account the total number of option contracts that are open at the moment.
-
06:54
Swiss unemplyment rate rose 0.2% in December
Registered unemployment in December 2016 - According to the SECO surveys, at the end of December 2016 159'372 unemployed persons were registered with the Regional Employment Centers (RAV), 10,144 more than in the previous month. The unemployment rate thus rose from 3.3% in November 2016 to 3.5% in the reporting month. Compared to the previous month, unemployment increased by 743 persons (+ 0.5%). Note Media conversation At 10 o'clock in the SECO building at the Holzikofenweg 36 (room 2.U06) in Berne a media discussion takes place. The speakers will then be available for questions and interviews.
-
06:45
Switzerland: Unemployment Rate (non s.a.), December 3.5% (forecast 3.3%)
-
06:36
The growth of China's GDP in 2016 is likely to be about 6.7%
During today's press conference the head of the State Committee for National Development and Reform Commission Xu Shaoshi said that China's GDP growth in 2016 is likely to be about 6.7%. "The growth rate of China's economy in the current year will be from 6.7% up", - said Xu Shaoshi. He added that in the last year there was a difficult situation in the global economy as well as in China's, but in general, the Chinese economy continues to grow steadily due to the processes of structural change in industrial production.
-
06:31
US Dollar lower as investors cautious ahead of Trump news conference
-
06:29
Chinese CPI inflation fell slightly
The consumer price index, published by the State Statistical Office (GUS), China, in December, on an annualized basis, was 2.1%, lower than the previous value, and economists forecast of 2.3%. The calculation of this indicator includes the price of food, clothing, education, health care, transportation, utilities, leisure. The indicator is calculated monthly and is the main indicator of inflation.
Also, China's State Statistical Department reported that the growth of the producer price index that reflects changes in wholesale prices for goods and services in China, in December compared with the same period last year, touched the high for the last five years. PPI rose 5.5%, well above economists' forecast of 4.5% and the previous value of 3.3%.
-
06:25
Australian retail turnover rose 0.2 per cent in November
Australian retail turnover rose 0.2 per cent in November 2016, seasonally adjusted, according to the latest Australian Bureau of Statistics (ABS) Retail Trade figures.
This follows a rise of 0.5 per cent in October 2016.
In seasonally adjusted terms, there were rises in food retailing (0.4 per cent), clothing, footwear and personal accessory retailing (1.7 per cent) and household goods retailing (0.2 per cent). There were falls in cafes, restaurants and takeaway food services (-0.8 per cent), department stores (-0.3 per cent) and other retailing (-0.1 per cent).
-
05:02
Japan: Consumer Confidence, December 43.1 (forecast 41.3)
-
01:30
China: PPI y/y, December 5.5% (forecast 4.5%)
-
01:30
China: CPI y/y, December 2.1% (forecast 2.3%)
-
00:30
Australia: Retail Sales, M/M, November 0.2%
-
