Market news
-
23:27
Currencies. Daily history for Feb 15’2017:
(pare/closed(GMT +2)/change, %)
EUR/USD $1,0599 +0,22%
GBP/USD $1,2459 -0,06%
USD/CHF Chf1,0053 -0,08%
USD/JPY Y114,14 -0,09%
EUR/JPY Y121,00 +0,14%
GBP/JPY Y142,2 -0,15%
AUD/USD $0,7708 +0,61%
NZD/USD $0,7222 +0,78%
USD/CAD C$1,3077 +0,02%
-
23:00
Schedule for today, Thursday, Feb 16’2017 (GMT0)
00:00 Australia Consumer Inflation Expectation February 4.3%
00:30 Australia Unemployment rate January 5.8% 5.8%
00:30 Australia Changing the number of employed January 13.5 10
13:30 U.S. Continuing Jobless Claims 2078 2051
13:30 U.S. Building Permits January 1228 1230
13:30 U.S. Housing Starts January 1226 1222
13:30 U.S. Philadelphia Fed Manufacturing Survey February 23.6 18
13:30 U.S. Initial Jobless Claims 234 245
21:30 New Zealand Business NZ PMI January 54.5
21:45 New Zealand Retail Sales, q/q Quarter IV 0.9% 1%
21:45 New Zealand Retail Sales YoY Quarter IV 5.1%
-
21:01
U.S.: Total Net TIC Flows, December -42.8
-
21:01
U.S.: Net Long-term TIC Flows , December -12.9
-
15:30
U.S.: Crude Oil Inventories, February 9.527
-
15:06
US manufacturers and trade inventories in line with expectations in December
The combined value of distributive trade sales and manufacturers' shipments for December, adjusted for seasonal and trading-day differences but not for price changes, was estimated at $1,356.0 billion, up 2.0 percent from November 2016 and was up 5.2 percent (±0.4 percent) from December 2015.
Manufacturers' and trade inventories, adjusted for seasonal variations but not for price changes, were estimated at an end-of-month level of $1,835.7 billion, up 0.4 percent (±0.2 percent) from November 2016 and were up 2.0 percent (±0.5 percent) from December 2015.
-
15:00
U.S.: Business inventories , December 0.4% (forecast 0.4%)
-
15:00
U.S.: NAHB Housing Market Index, February 65 (forecast 67)
-
14:34
US Industrial production decreased 0.3 percent in January
Industrial production decreased 0.3 percent in January following a 0.6 percent increase in December. In January, manufacturing output moved up 0.2 percent, and mining output jumped 2.8 percent. The index for utilities fell 5.7 percent, largely because unseasonably warm weather reduced the demand for heating. At 104.6 percent of its 2012 average, total industrial production in January was at about the same level as it was a year earlier.
Capacity utilization for the industrial sector fell 0.3 percentage point in January to 75.3 percent, a rate that is 4.6 percentage points below its long-run (1972-2016) average.
-
14:15
U.S.: Industrial Production (MoM), January -0.3% (forecast 0.1%)
-
14:15
U.S.: Industrial Production YoY , January 0.0%
-
14:15
U.S.: Capacity Utilization, January 75.3% (forecast 75.5%)
-
13:45
Option expiries for today's 10:00 ET NY cut
EUR/USD: 1.0600-05 (EUR 693m) 1.0650 (955m) 1.0700 (887m) 1.0780 (1.33bln) 1.0950 (880m)
USD/JPY: 112.00 (USD 607m) 112.50 (350m) 114.00 (670m) 115.00 (465m)
GBP/USD: 1.2565-70 (GBP 437m) 1.2600 (469m)
AUD/USD: 0.7400 (AUD 571m)
USD/CAD 1.2975 (USD 485m)
-
13:42
All green for US economic data and the dollar is up 30-40 pips against the majors
-
13:39
Canadian manufacturing sales increased for the second consecutive month
Manufacturing sales increased for the second consecutive month, up 2.3% to $53.5 billion in December, following a revised increase of 2.3% in November. The growth was mainly the result of higher sales of transportation equipment, as well as petroleum and coal products.
Overall, sales were up in 8 of 21 industries, representing 41% of the manufacturing sector. Sales of durable goods rose 2.4%, while sales of non-durable goods increased 2.1%.
In constant dollars, sales were up 2.3%, indicating that higher volumes of manufactured goods were sold in December.
-
13:38
Strong start of the year for US retail sales
Advance estimates of U.S. retail and food services sales for January 2017, adjusted for seasonal variation and holiday and trading-day differences, but not for price changes, were $472.1 billion, an increase of 0.4 percent from the previous month, and 5.6 percent above January 2016. Total sales for the November 2016 through January 2017 period were up 4.6 percent (±0.7 percent) from the same period a year ago. The November 2016 to December 2016 percent change was revised from up 0.6 percent to up 1.0 percent (±0.2 percent).
Retail trade sales were up 0.2 percent (±0.5 percent)* from December 2016, and up 5.6 percent from last year. Gasoline Stations sales were up 14.2 percent from January 2016, while Nonstore Retailers were up 12.0 percent from last year.
-
13:36
Business activity expanded at a solid rate in New York State
Business activity expanded at a solid clip in New York State, according to firms responding to the February 2017 Empire State Manufacturing Survey. The headline general business conditions index rose twelve points to 18.7, its highest level in more than two years.
The new orders index climbed to 13.5, and the shipments index advanced to 18.2, pointing to substantial increases in both orders and shipments. The unfilled orders index rose above zero for the first time in more than five years.
Delivery times were reported as longer, and inventories increased. Labor market conditions improved, with both employment and hours worked moving higher. After reaching multiyear highs last month, the prices paid and prices received indexes were little changed. Indexes assessing the six-month outlook continued to convey a high degree of optimism about future conditions.
-
13:34
The largest US CPI Increase since February 2013
The Consumer Price Index increased 0.6 percent in January on a seasonally adjusted basis, the U.S. Bureau of Labor Statistics reported today. Over the last 12 months, the all items index rose 2.5 percent before seasonal adjustment.
The January increase was the largest seasonally adjusted all items increase since February 2013. A sharp rise in the gasoline index accounted for nearly half the increase, and advances in the indexes for shelter, apparel, and new vehicles also were major contributors.
The energy index increased 4.0 percent in January as the gasoline index advanced 7.8 percent and the index for natural gas also increased. The food index, which had been unchanged for 6 consecutive months, increased 0.1 percent. The food at home index was unchanged, while the index for food away from home rose 0.4 percent. -
13:31
U.S.: Retail sales excluding auto, January 0.8% (forecast 0.4%)
-
13:30
U.S.: Retail sales, January 0.4% (forecast 0.1%)
-
13:30
U.S.: NY Fed Empire State manufacturing index , February 18.7 (forecast 7)
-
13:30
U.S.: CPI excluding food and energy, m/m, January 0.3% (forecast 0.2%)
-
13:30
U.S.: CPI, Y/Y, January 2.5% (forecast 2.4%)
-
13:30
Canada: Manufacturing Shipments (MoM), December 2.3% (forecast 0.2%)
-
13:30
U.S.: CPI, m/m , January 0.6% (forecast 0.3%)
-
13:30
U.S.: CPI excluding food and energy, Y/Y, January 2.3% (forecast 2.1%)
-
13:30
U.S.: Retail Sales YoY, January 5.6%
-
13:03
Orders
EUR/USD
Offers: 1.0585 1.0600 1.0630 1.0650 1.0680 1.0700-05
Bids: 1.0550 1.0520 1.0500 1.0480-85 1.0450 1.0430 1.0400
GBP/USD
Offers: 1.2480 1.2500 1.2520 1.2550 1.2580 1.2600 1.2630 1.2650
Bids: 1.2450 1.2430 1.2400 1.2380 1.2345-50 1.2330 1.2300
EUR/GBP
Offers: 0.8500 0.8520 0.8535 0.8550-60 0.8600
Bids: 0.8450 0.8430 0.8400 0.8385 0.8350 0.8300
EUR/JPY
Offers: 121.00 121.35 121.50 121.80 122.00 122.50
Bids: 120.60 102.30 120.00 119.75 119.50 119.30 119.00
USD/JPY
Offers: 114.75-80 115.00 115.20 115.50 115.60-65 115.85 116.00
Bids: 114.20-25 114.00 113.80 113.50 113.20 113.00 112.80 112.50
AUD/USD
Offers: 0.7700 0.7730 0.7750 0.7780 0.7800
Bids: 0.7660 0.7620 0.7600 0.7580 0.7550
Информационно-аналитический отдел TeleTrade
-
11:30
Dollar gains ahead of US CPI data, +0.3% expected for January CPI and +0.2% Core. Eur/Usd trading at 5 weeks low
-
10:39
The pound fell to $ 1.2418 updating the session low,but recovered some ground, after mixed data on the employment in United Kingdom
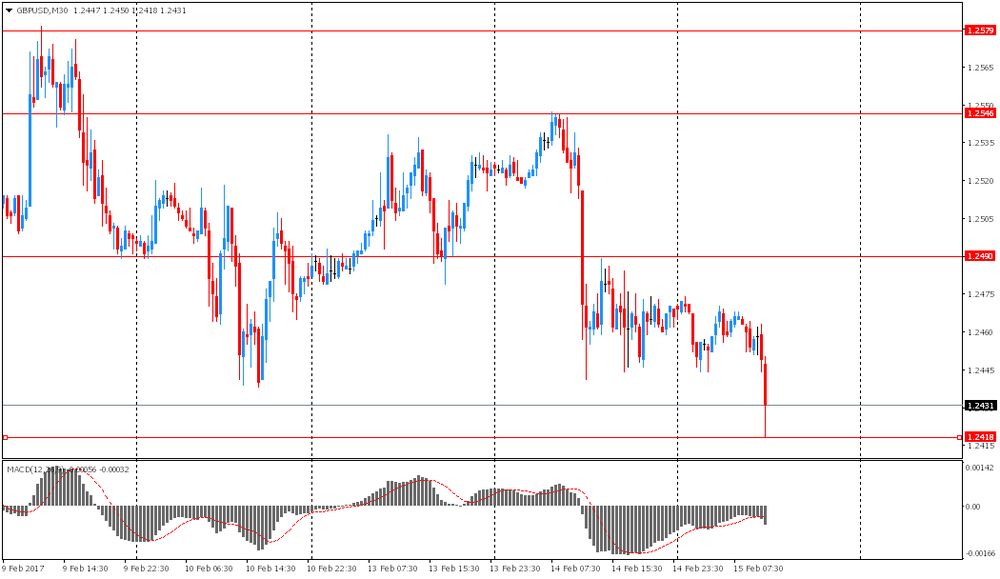
The December change in average earnings amounted to only + 2.6%, while the majority of analysts had forecast an increase of 2.8%.
-
10:02
The euro area recorded a €28.1 bn trade surplus in December
The first estimate for euro area (EA19) exports of goods to the rest of the world in December 2016 was €178.6 billion, an increase of 6% compared with December 2015 (€168.7 bn). Imports from the rest of the world stood at €150.5 bn, a rise of 4% compared with December 2015 (€144.4 bn).
As a result, the euro area recorded a €28.1 bn surplus in trade in goods with the rest of the world in December 2016, compared with +€24.4 bn in December 2015. Intra-euro area trade rose to €137.4 bn in December 2016, up by 5% compared with December 2015. These data are released by Eurostat, the statistical office of the European Union.
-
10:00
Eurozone: Trade balance unadjusted, December 28.1 (forecast 22.8)
-
09:46
United Kingdom: Claimant count , January -42.4 (forecast 0.8)
-
09:46
United Kingdom: ILO Unemployment Rate, December 4.8% (forecast 4.8%)
-
09:46
United Kingdom: Average Earnings, 3m/y , December 2.6% (forecast 2.8%)
-
09:46
United Kingdom: Average earnings ex bonuses, 3 m/y, December 2.6% (forecast 2.7%)
-
09:35
UK uneployment rate stable, average weekly earnings below estimates. GBP/USD moves lower
Estimates from the Labour Force Survey show that, between July to September 2016 and October to December 2016, the number of people in work increased, the number of unemployed people was little changed, and the number of people aged from 16 to 64 not working and not seeking or available to work (economically inactive) decreased.
The unemployment rate was 4.8%, down from 5.1% for a year earlier. It has not been lower since July to September 2005. The unemployment rate is the proportion of the labour force (those in work plus those unemployed) that were unemployed.
Latest estimates show that average weekly earnings for employees in Great Britain in nominal terms (that is, not adjusted for price inflation) increased by 2.6%, both including and excluding bonuses, compared with a year earlier.
-
09:00
Riksbank has decided to hold the repo rate at −0.50, says economic activity is strengthening
Economic activity is strengthening, but there is considerable political uncertainty abroad and the risks of setbacks have increased. For inflation to stabilise around 2 per cent, a continued strong level of economic activity and a krona that does not appreciate too rapidly are required. Monetary policy therefore still needs to remain expansionary.
The Executive Board of the Riksbank has decided to hold the repo rate at −0.50 per cent and there is still a greater probability that the rate will be cut than that it will be raised in the near term. The purchases of government bonds will continue for the first six months of 2017, as was decided in December. The Executive Board has also taken a decision to extend the mandate that facilitates a quick intervention on the foreign exchange market.
-
07:33
Options levels on wednesday, February 15, 2017
EUR/USD
Resistance levels (open interest**, contracts)
$1.0724 (2922)
$1.0660 (2922)
$1.0620 (1501)
Price at time of writing this review: $1.0572
Support levels (open interest**, contracts):
$1.0523 (5199)
$1.0496 (4966)
$1.0463 (5284)
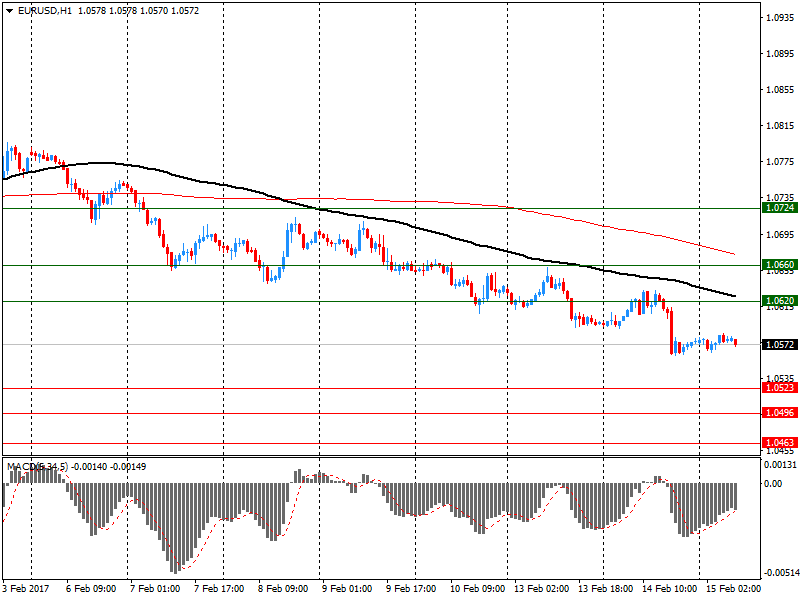
Comments:
- Overall open interest on the CALL options with the expiration date March, 13 is 69273 contracts, with the maximum number of contracts with strike price $1,0800 (5108);
- Overall open interest on the PUT options with the expiration date March, 13 is 83719 contracts, with the maximum number of contracts with strike price $1,0500 (5284);
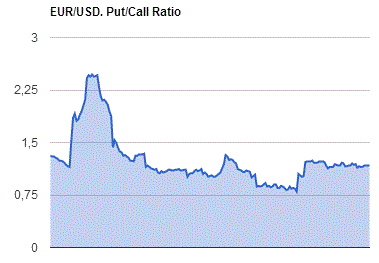
- The ratio of PUT/CALL was 1.21 versus 1.18 from the previous trading day according to data from February, 14
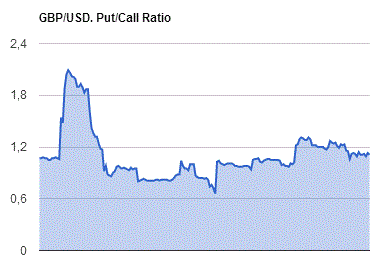
GBP/USD
Resistance levels (open interest**, contracts)
$1.2702 (2264)
$1.2605 (2149)
$1.2509 (3529)
Price at time of writing this review: $1.2456
Support levels (open interest**, contracts):
$1.2393 (1939)
$1.2296 (3608)
$1.2198 (1630)
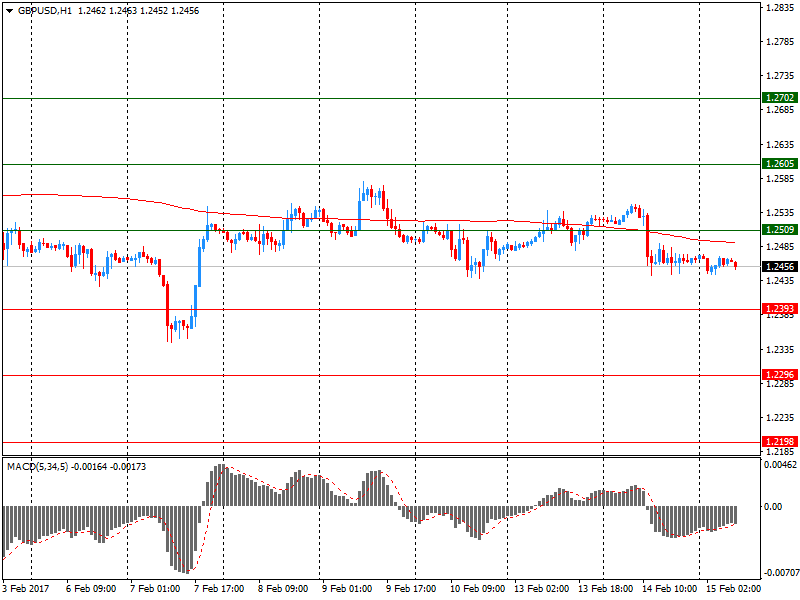
Comments:
- Overall open interest on the CALL options with the expiration date March, 13 is 33249 contracts, with the maximum number of contracts with strike price $1,2500 (3529);
- Overall open interest on the PUT options with the expiration date March, 13 is 37183 contracts, with the maximum number of contracts with strike price $1,2300 (3608);
- The ratio of PUT/CALL was 1.12 versus 1.12 from the previous trading day according to data from February, 14
* - The Chicago Mercantile Exchange bulletin (CME) is used for the calculation.
** - Open interest takes into account the total number of option contracts that are open at the moment.
-
07:08
The index of consumer confidence from Westpac Australia increased in February
Consumer confidence index of Australia from Westpac, published by the Faculty of Economics and Commerce at the University of Melbourne, increased by 2.3% in February after +1% in January. This indicator reflects the level of public confidence in the economy by means of ratings by respondents into categories such as personal financial situation in the past year and the outlook for next year, expectations about the economic situation in the 1 and 5 year term, as well as the current consumer climate in terms of households readiness to commit large purchases. In general, high levels are considered to be a positive factor for the Australian currency and AUD / USD rose slightly after the publication of the data.
Westpac noted that for the week ending February 11, 1200 people were interviewed and the result is an encouraging sign that the weak performance at the end of last year, especially in retail, will last in 2017.
-
07:06
NAB has reduced its expectations for the RBA interest rates in 2017
According to the latest news from the National Australia Bank, the bank now expect one interest rate cut from the Reserve Bank of Australia's current 1.5% to 1.25% in November 2017. Note that earlier NAB forecast two rate cuts of 25 bps on the central bank's meetings in June and September.
The NAB note:
-
Economic activity is likely to be strong, judging by how Australia begins 2017.
-
Real GDP in the 4th quarter of 2016 probably increased 0.9% q / q.
-
The pace of growth in the 3rd quarter of 2017 may increase by 3%.
-
The average annual growth rate for 2017 will be slightly lower at 2.3%.
-
Investment in the mining industry decline
-
-
07:04
Australian new motor vehicle sales rose more than expected in January
The January 2017 trend estimate (97,231) decreased by 0.2% when compared with December 2016.
When comparing national trend estimates for January 2017 with December 2016, sales for Sports utility and Other vehicles decreased by 0.7% and and 0.4% respectively. By contrast, sales for Passenger vehicles increased by 0.4%.
The largest downward movement across all states and territories, on a trend basis, was in Tasmania (-1.8%).
The largest upward movement across all states and territories, on a trend basis, was in the Australian Capital Territory (1.0%), continuing an upward trend which commenced in September 2016.
-
07:01
Kuroda: Inflation Is Still Distant From 2 Pct So Will Maintain Powerful Monetary Easing Under Current Framework @Livesquawk
-
00:33
Australia: New Motor Vehicle Sales (YoY) , January -0.9%
-
00:31
Australia: New Motor Vehicle Sales (MoM) , January 0.6% (forecast 0.2%)
-