Market news
-
23:31
Australia: Leading Index, October 0.1%
-
23:28
Currencies. Daily history for Nov 15’2016:
(pare/closed(GMT +3)/change, %)
EUR/USD $1,0722 -0,15%
GBP/USD $1,2454 -0,28%
USD/CHF Chf1,0016 +0,37%
USD/JPY Y109,19 +0,71%
EUR/JPY Y117,07 +0,58%
GBP/JPY Y135,97 +0,43%
AUD/USD $0,7557 +0,08%
NZD/USD $0,7099 -0,23%
USD/CAD C$1,3446 -0,81%
-
23:00
Schedule for today, Wednesday, Nov 16’2016
00:30 Australia New Motor Vehicle Sales (MoM) October 2.5%
00:30 Australia New Motor Vehicle Sales (YoY) October 0.8%
00:30 Australia Wage Price Index, q/q Quarter III 0.5% 0.5%
00:30 Australia Wage Price Index, y/y Quarter III 2.1% 2.0%
09:30 United Kingdom Average Earnings, 3m/y September 2.3% 2.4%
09:30 United Kingdom Average earnings ex bonuses, 3 m/y September 2.3% 2.4%
09:30 United Kingdom Claimant count October 0.7 2.0
09:30 United Kingdom ILO Unemployment Rate September 4.9% 4.9%
10:00 Switzerland Credit Suisse ZEW Survey (Expectations) November 5.2
13:30 Canada Manufacturing Shipments (MoM) September 0.9% 0.1%
13:30 U.S. PPI excluding food and energy, m/m October 0.2% 0.2%
13:30 U.S. PPI excluding food and energy, Y/Y October 1.2% 1.5%
13:30 U.S. PPI, m/m October 0.3% 0.3%
13:30 U.S. PPI, y/y October 0.7% 1.2%
14:15 U.S. Capacity Utilization October 75.4% 75.5%
14:15 U.S. Industrial Production (MoM) October 0.1% 0.2%
14:15 U.S. Industrial Production YoY October -1%
15:00 U.S. NAHB Housing Market Index November 63 63
15:30 U.S. Crude Oil Inventories November 2.432
21:00 U.S. Total Net TIC Flows September 73.8
21:00 U.S. Net Long-term TIC Flows September 48.3
21:45 New Zealand Retail Sales, q/q Quarter III 2.3%
21:45 New Zealand Retail Sales YoY Quarter III 6%
21:45 New Zealand PPI Input (QoQ) Quarter III 0.9%
21:45 New Zealand PPI Output (QoQ) Quarter III 0.2%
-
15:55
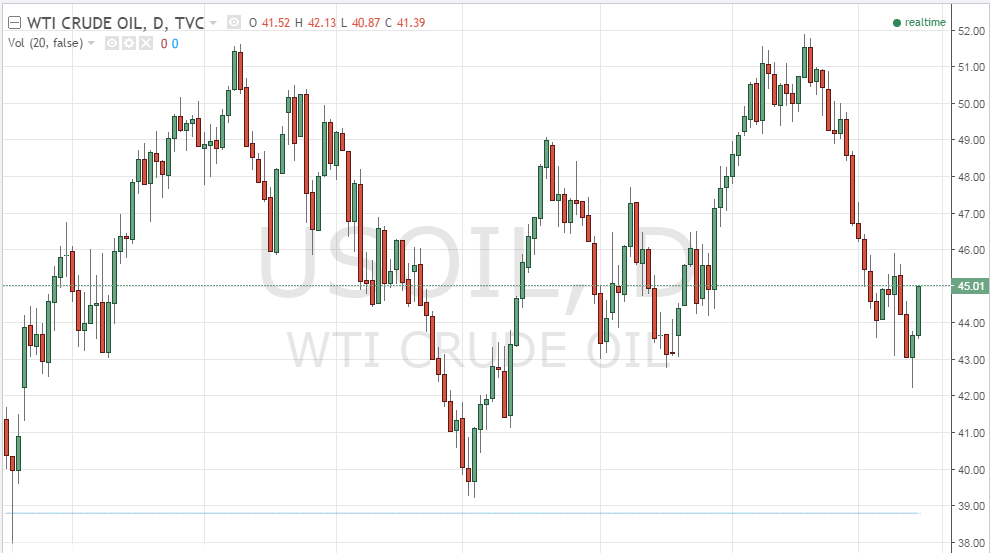
Oil rallied amid renewed expectations that OPEC will agree to cut production
Crude oil rallied, rebounding from significant recent losses amid renewed expectations that OPEC will agree to cut production.
Dire warnings from the IEA about the worsening global supply glut may compel Iran and others to go along will some output quotas.
Iran has balked at joining major producers Saudi Arabia and Russia in making meaningful cuts, but with oil heading near $40 it is thought Tehran will soon budge.
WTI light sweet crude oil for December was down $1.38 to $44.72 a barrel.
The American Petroleum Institute delivers its U.S. inventories survey this afternoon. The past few weeks have shown stockpiles rising at a troubling pace.
-
15:00
U.S.: Business inventories , September 0.1% (forecast 0.1%)
-
14:56
Fed's Tarullo does not see recession risk particularly high
-
14:54
Change in GDT Price Index from previous event +4.5%. NZD/USD unchanged
-
Average price (USD/MT, FAS: )$3,519
-
-
14:22
December FED Rate-Hike Odds Rise to 91%
-
13:50
Option expiries for today's 10:00 ET NY cut
EURUSD 1.0880 (EUR 1.12bn) 1.0900 (874m) 1.1000 (1.41bn) 1.1045-50 (E1.1bn)
USDJPY 106.00 (683m) 108.00 (990m) 108.50(490m)
GBPUSD 1.2500 (GBP 562m) 1.2550 (285m) 1.3000 (400m)
EURGBP 0.8540 (EUR 332m)
USDCHF 0.9800 (USD 200m) 0.9900 (305m 0.9950 (230m)
AUDUSD 0.7460 (AUD 225m) 0.7500 (383m) 0.7610 (210m) 0.7650 (336m) 0.7750 (658m)
USDCAD 1.3500 (632m) 1.3600 (241m) 1.3775 (200m)
NZDUSD 0.7075 (NZD 247m)
EURJPY 116.25 (EUR 279m)
AUDJPY 82.00 (AUD 902m)
EUR/SEK: 9.7700 (EUR 200m)
USDSGD 1.4150 (USD 425m) 1.4200 (600m)
-
13:40
US export prices up 0.5% due to higher agricultural and nonagricultural prices
U.S. import prices advanced 0.5 percent in October, the U.S. Bureau of Labor Statistics reported today, after a 0.2-percent increase in September. The October increase was driven by higher fuel prices which more than offset declining nonfuel prices. The price index for U.S. exports increased 0.2 percent in October following a 0.3-percent advance the previous month.
U.S. export prices increased 0.2 percent in October following a 0.3-percent advance in September. In October, higher agricultural and nonagricultural prices both contributed to the overall advance. Despite the recent increases, prices for U.S. exports fell over the past year, declining 1.1 percent.
The over-the-year drop in export prices was the smallest 12-month decrease since the index fell 0.7 percent in October 2014. -
13:38
Manufacturing activity in the NY region improves
Business activity stabilized in New York State, according to firms responding to the November 2016 Empire State Manufacturing Survey. The headline general business conditions index climbed out of negative territory for the first time in four months, rising eight points to 1.5.
The new orders and shipments indexes also turned positive, rising to 3.1 and 8.5, respectively. Labor market conditions remained weak, with the number of employees and average workweek indexes both at -10.9. The inventories index fell eleven points to -23.6, pointing to a marked decline in inventory levels.
Although price indexes were lower, they remained positive, suggesting a slower pace of growth in both input prices and selling prices. Indexes for the six-month outlook conveyed somewhat less optimism about future conditions than in October.
-
13:36
-
13:34
US retail sales beat expectations. Core up 0.8% in October
The U.S. Census Bureau announced today that advance estimates of U.S. retail and food services sales for October, adjusted for seasonal variation and holiday and trading-day differences, but not for price changes, were $465.9 billion, an increase of 0.8 percent (±0.5%) from the previous month, and 4.3 percent (±0.9%) above October 2015.
Total sales for the August 2016 through October 2016 period were up 3.3 percent (±0.7%) from the same period a year ago. The August 2016 to September 2016 percent change was revised from up 0.6 percent (±0.5%) to up 1.0 percent (±0.1%).
Retail trade sales were up 1.0 percent (±0.5%) from September 2016, and up 4.3 percent (±0.7%) from last year. Nonstore retailers were up 12.9 percent (±1.6%) from October 2015, while Miscellaneous stores retailers were up 9.5 percent (±4.2%) from last year.
-
13:30
U.S.: Import Price Index, October 0.5% (forecast 0.4%)
-
13:30
U.S.: Retail sales, October 0.8% (forecast 0.5%)
-
13:30
U.S.: Retail sales excluding auto, October 0.8% (forecast 0.4%)
-
13:30
U.S.: Retail Sales YoY, October 4.3%
-
13:30
U.S.: NY Fed Empire State manufacturing index , November 1.5 (forecast -3)
-
13:03
Fed's Rosengren: Right Now, a December Rate Rise Looks 'Plausible'
-
13:00
Orders
EUR/USD
Offers 1.0825-30 1.0850 1.0865 1.0900 1.0925-30 1.0950 1.0980-85 1.1000
Bids 1.0780 1 .0750 1.0720 1.0700 1.0680 1.0650 1.0630 1.0600
GBP/USD
Offers 1.2480 1.2500 1.2530 1.2550 1.2580-85 1.2600 1.2620 1.2650 1.2685 1.2700
Bids 1.2450 1.2420 1.2400 1.2375-80 1 .2350 1.2330 1.2300
EUR/GBP
Offers 0.8680-85 0.8700 0.8730 0.8750 0.8785 0.8800
Bids 0.8650 0.8630 0.8600 0.8580-85 0.8550 0.8500 0.8450
EUR/JPY
Offers 117.00 117.30 117.50 118.00 118.45-50 119.00
Bids 116.50 116.30 116.00 115.80 115.60 115.30 115.00 114.80 114.50
USD/JPY
Offers 108.35 108.50-55 109.00 109.15-20 109.50 110.00
Bids 107.70-75 107.50 107.30 107.00106.80-75106.50 106.20106.00105.75-80105.50
AUD/USD
Offers 0.7570 0.7585 0.7600 0.7630 0.7660 0.7685 0.7700 0.7730 0.7750
Bids 0.7530 0.7500 0.7475-80 0.7450 0.7420-25 0.7400
-
11:27
Bank of England Carney: Interest rates in the UK may rise or fall depending on the situation
-
The Bank of England is ready to provide support for a technocratic government regarding Brexit
-
Downside and upside risks for the economy
-
Now we can not give clear guidance on the future direction of monetary policy
-
Society needs a clear policy in the crucial moments for the economy
-
The views of MPC members on the factors affecting the economy do not coincide
-
-
10:53
Oil buying intensifies
This morning, the New York futures for Brent rose 1.85% to $ 45.25 and WTI rose 2.33% to $ 44.33 per barrel. Thus, the black gold is trading in the green zone on the background of the US Energy Ministry forecast that show a decrease of production in December. US could reduce the amount of shale oil extraction on the fields of the largest oil and gas regions by 20 thousand barrels per day from November's level - 4.498 million barrels per day. So production could fall near the 2016 lows.
-
10:42
BOE Governor Mark Carney will step down in June 2019. Inflation report hearings
-
Blaming Monetary Policy for Inequality 'A Massive Blame-Deflection Exercise'
-
Prime Minister's Conference Speech Had No Bearing on Decision on Term of Office
-
-
10:40
EU ZEW Economic Sentiment improves
The ZEW Indicator of Economic Sentiment for Germany has increased substantially in November 2016. The index has improved by 7.6 points compared to October, now standing at 13.8 points (long-term average: 24.0 points).
The ZEW Indicator of Economic Sentiment has increased the fourth time in a row - not least due to the positive economic figures seen in the US and China. The renewed increase is indicative of a stronger economic growth in the coming six months. The election of Donald Trump as US President and the resulting political and economic uncertainties, however, have made an impact.
-
10:11
Euro Zone trade balance surplus continue to rise
The first estimate for euro area (EA19) exports of goods to the rest of the world in September 2016 was €176.7 billion, an increase of 2% compared with September 2015 (€173.2 bn). Imports from the rest of the world stood at €150.2 bn, a fall of 2% compared with September 2015 (€154.0 bn). As a result, the euro area recorded a €26.5 bn surplus in trade in goods with the rest of the world in September 2016, compared with +€19.2 bn in September 2015. Intra-euro area trade remained nearly stable at €148.3 bn in September 2016, compared with September 2015. These data are released by Eurostat, the statistical office of the European Union.
-
10:08
Euro Area GDP rose in line with expectations in Q3. EUR/USD still trading under the important weekly open
Seasonally adjusted GDP rose by 0.3% in the euro area (EA19) and by 0.4% in the EU28 during the third quarter of 2016, compared with the previous quarter, according to a flash estimate published by Eurostat, the statistical office of the European Union.
In the second quarter of 2016, GDP also grew by 0.3% and 0.4% respectively. Compared with the same quarter of the previous year, seasonally adjusted GDP rose by 1.6% in the euro area and by 1.8% in the EU28 in the third quarter of 2016, after +1.6% and +1.8% respectively in the previous quarter.
During the third quarter of 2016, GDP in the United States increased by 0.7% compared with the previous quarter (after +0.4% in the second quarter of 2016). Compared with the same quarter of the previous year, GDP grew by 1.5% (after +1.3% in the previous quarter).
-
10:01
Eurozone: ZEW Economic Sentiment, November 15.8 (forecast 14.3)
-
10:00
Eurozone: GDP (QoQ), Quarter III 0.3% (forecast 0.3%)
-
10:00
Eurozone: GDP (YoY), Quarter III 1.6% (forecast 1.6%)
-
10:00
Germany: ZEW Survey - Economic Sentiment, November 13.8 (forecast 8.1)
-
10:00
Eurozone: Trade balance unadjusted, September 26.5 (forecast 22.5)
-
09:34
UK producer prices rose in October
The price of goods bought and sold by UK manufacturers, as estimated by the Producer Price Index, rose again in the year to October 2016. This is the fourth consecutive increase following 2 years of falls and the largest increase since April 2012. Between September and October, total output prices rose 0.6%, compared with an increase of 0.3% the previous month.
Factory gate prices (output prices) for goods produced by UK manufacturers rose 2.1% in the year to October 2016, compared with a rise of 1.3% in the year to September 2016.
Core factory gate prices, which exclude the more volatile food, beverage, tobacco and petroleum products, rose 1.9% in the year to October 2016, compared with a rise of 1.4% in the year to September 2016. -
09:32
UK consumer inflation disappoints
The Consumer Prices Index (CPI) rose by 0.9% in the year to October 2016, compared with a 1.0% rise in the year to September.
Although the rate was slightly lower than in September 2016, it remained higher than the rates otherwise seen since late 2014.
The main downward contributors to the change in the rate were prices for clothing and university tuition fees, which rose by less than they did a year ago, along with falling prices for certain games and toys, overnight hotel stays and non-alcoholic beverages.
These downward pressures were offset by rising prices for motor fuels, and by prices for furniture and furnishings, which fell by less than they did a year ago.
CPIH (not a National Statistic) rose by 1.2% in the year to October 2016, unchanged from September.
-
09:31
United Kingdom: Producer Price Index - Output (MoM), October 0.6% (forecast 0.3%)
-
09:31
United Kingdom: Producer Price Index - Input (MoM), October 4.6% (forecast 2.1%)
-
09:30
United Kingdom: HICP, Y/Y, October 0.9% (forecast 1.1%)
-
09:30
United Kingdom: HICP, m/m, October 0.1% (forecast 0.3%)
-
09:30
United Kingdom: HICP ex EFAT, Y/Y, October 1.2% (forecast 1.5%)
-
09:30
United Kingdom: Producer Price Index - Input (YoY) , October 12.2% (forecast 9.1%)
-
09:30
United Kingdom: Retail prices, Y/Y, October 2.0% (forecast 2.2%)
-
09:30
United Kingdom: Retail Price Index, m/m, October 0.0% (forecast 0.1%)
-
09:30
United Kingdom: Producer Price Index - Output (YoY) , October 2.1% (forecast 1.7%)
-
09:05
Option expiries for today's 10:00 ET NY cut
EUR/USD 1.0800 (EUR 985m) 1.0900 (544m) 1.0925 (297m) 1.0945-50 (799m),1.1000 (1.2bn) 1.1020 (1.03bn) 1.1025,(429m) 1.1045-50 (574m), 1.1075 (477m)1.1200 (535m) 1.1230 (572m) 1.1250 (1.62bn)
USD/JPY 103.00 (1.11bn) 104.10 (360m) 104.10-20 (840m), 105.00 (1.03bn) 106.00 (560m) 106.50 (646m)
GBP/USD 1.2500 (GBP 216m) 1.2560 (303m) 1.2625 (356m)
USD/CHF 0.9600 (USD 286m)
AUD/USD 0.7400 (500m) 0.7475 (218m) 0.7600 (308m) 0.7700 (352m)
USD/CAD 1.3200 (540m) 1.3350 (239m) 1.3400 (220m), 1.3600 (431m) 1.3800 (600m)
NZD/USD 0.7200 (NZD 300m) 0.7300 (400m)
EUR/JPY 116.25 (EUR 279m)
-
08:44
ECB, Lautenschlaeger: Excessive Search for Yield Could Lead to New Troubles for Finacial System
-
Must Warn Banks Against Temptation of Propping Up Profits with Too Much Risk
-
Will Conduct Review of Internal Models for Next 3 Years
-
-
08:41
Anglo American Diamond Sales Fall in Line with Seasonal Demand
-
08:14
Today’s events
-
At 11:15 GMT RBA Governor Philip Lowe will deliver a speech
-
At 11:30 GMT ECB Member of the Executive Board Sabine Lautenshleger will deliver a speech
-
At 13:00 GMT the Bank of England Governor Mark Carney will deliver a speech
-
At 15:30 GMT FOMC member Eric Rosengren will give a speech
-
At 21:30 GMT the Federal Reserve Vice Chairman Stanley Fischer will deliver a speech
-
-
07:58
French CPI flat in October
In October 2016, the Consumer Prices Index (CPI) was stable over a month, after a downturn by 0.2% in September. Seasonally adjusted, it was unchanged too, after a slight rise in September. Year-on-year, the CPI grew by 0.4% as in the previous month.
This month-on-month stability came from an acceleration in energy prices, offset by a fall in food and services prices. Furthermore, manufactured product prices were unchanged.
-
07:35
Options levels on tuesday, November 15, 2016:
EUR/USD
Resistance levels (open interest**, contracts)
$1.1028 (2140)
$1.0951 (2018)
$1.0887 (936)
Price at time of writing this review: $1.0770
Support levels (open interest**, contracts):
$1.0711 (3358)
$1.0688 (4469)
$1.0652 (4207)
Comments:
- Overall open interest on the CALL options with the expiration date December, 9 is 63877 contracts, with the maximum number of contracts with strike price $1,1400 (6074);
- Overall open interest on the PUT options with the expiration date December, 9 is 56637 contracts, with the maximum number of contracts with strike price $1,0900 (4469);
- The ratio of PUT/CALL was 0.87 versus 0.92 from the previous trading day according to data from November, 14
GBP/USD
Resistance levels (open interest**, contracts)
$1.2803 (1223)
$1.2705 (1605)
$1.2608 (1336)
Price at time of writing this review: $1.2489
Support levels (open interest**, contracts):
$1.2391 (1394)
$1.2294 (3745)
$1.2196 (1117)
Comments:
- Overall open interest on the CALL options with the expiration date December, 9 is 34390 contracts, with the maximum number of contracts with strike price $1,3000 (2642);
- Overall open interest on the PUT options with the expiration date December, 9 is 35601 contracts, with the maximum number of contracts with strike price $1,2300 (3745);
- The ratio of PUT/CALL was 1.04 versus 1.02 from the previous trading day according to data from November, 14
* - The Chicago Mercantile Exchange bulletin (CME) is used for the calculation.
** - Open interest takes into account the total number of option contracts that are open at the moment.
-
07:34
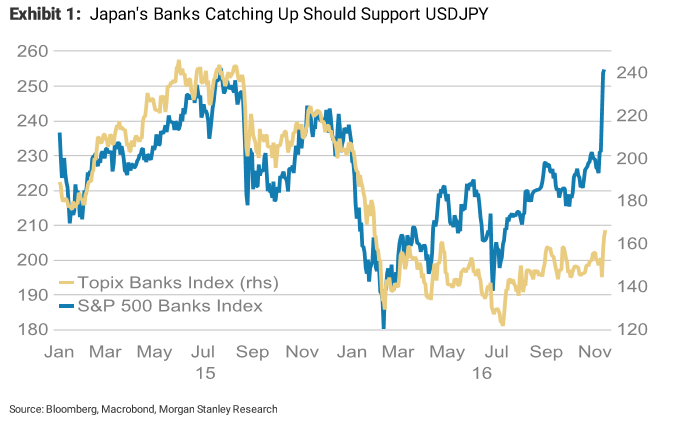
USD/JPY Towards 112 Initial Target; EUR/USD: 1.07 Key Now - Morgan Stanley
"USDJPY support from all sides:
Crossing through a previous high at 107.49, we foresee an initial target of 112. We have often said that higher inflation expectations or steeper yield curves would have been required for USDJPY to turn around. However, the reason for steepening didn't need to come from the Japanese side. The correlation between global bond markets is high, meaning the US 2s10s curve hitting the highest level this year has spilled over into the Japanese curve steepening too. Steepness has been focused on the shorter end of the curve (<10y) as the BoJ's QE purchases are likely to be largest here, adding to JPY weakness.
The Exhibit below shows that Japan's TOPIX banks index still doesn't reflect this new curve dynamic and has been underperforming US banks. Japan's 3Q GDP beating market expectations, rising by 0.5%Q (0.2%Q expected) due to stronger net exports, suggests that a recovery is under way here, which counterintuitively is negative for the currency as more capital is exported abroad. Japan's 10y real yield falling from -0.28% for -0.47% today while US real yields rise has supported USDJPY too.
EURUSD downside limited:
As the market prices in a faster pace of Fed hikes due to expectations of higher growth and inflation, there could also be debates forming about whether the ECB will need to extend its QE programme beyond next year. The US 5y5y inflation swap has hit the highest level this year at 2.47%, allowing the eurozone's equivalent measure to also rise to 1.55%. We expect EURUSD to find support around 1.07.
The real yield differential between the eurozone and the US remains relatively supported, which we think should limit outflows from the eurozone".
Copyright © 2016 Morgan Stanley, eFXnews
-
07:10
Fed's Lacker: Fiscal Stimulus 'Would Bolster Case for Raising Rates'
-
07:10
Fed's Williams Hopes U.S. Continues Current Course of Free Trade
-
07:06
German GDP rose less than expected in Q3
German economic growth is losing some momentum. In the third quarter of 2016, the gross domestic product (GDP) rose 0.2% on the second quarter of 2016 after adjustment for price, seasonal and calendar variations; this is reported by the Federal Statistical Office (Destatis). In the first half of the year, the GDP had increased somewhat more, by 0.4% in the second quarter and 0.7% in the first quarter.
In a quarter-on-quarter comparison (adjusted for price, seasonal and calendar variations), positive contributions were made mainly by domestic final consumption expenditure. The final consumption expenditure of both households and government continued to increase. According to provisional results, fixed capital formation in machinery and equipment was somewhat lower and in construction somewhat higher than in the previous quarter. The development of foreign trade had a downward effect on growth. Exports were slightly down while imports were slightly up compared with the second quarter of 2016.
Economic growth decelerated somewhat also in a year-on-year comparison. The price-adjusted GDP was up by 1.5% in the third quarter of 2016 (1.7% when calendar-adjusted), following a 3.1% increase in the second quarter and a 1.5% increase in the first quarter of 2016 (1.8% and 1.9%, respectively, when calendar-adjusted).
-
07:00
Germany: GDP (QoQ), Quarter III 0.2% (forecast 0.3%)
-
07:00
Germany: GDP (YoY), Quarter III 1.5% (forecast 1.8%)
-
06:51
Consumer confidence in Australia rose
According to data from the ANZ released today, the consumer confidence index in Australia rose this week to the level of 118.2 against 117.8 the previous week. Thus the index rose by + 3.2%. According to the data:
-
it is expected that over the next 12 months the economic situation of households will improve by + 1.2%
-
general economic conditions over the next 5 years to improve by + 3.5%
-
the overall financial situation compared with the previous year worsened to -0.8%
-
-
06:49
Minutes of the November meeting of the Reserve Bank of Australia: Core inflation is expected to return to a normal level
-
Risk assessment around the inflation forecast was "broadly balanced"
-
The likelihood of economic growth in the next few quarters rising
-
The growth of the Australian dollar may complicate economic growth
-
Commodity prices have increased significantly
-
Upward revision of trade prospects are positive for the economy
-
The expected rate of unemployment decreased, but underemployment is still elevated
-
Some signs of rising wages stabilized, but there is considerable uncertainty about the strength of the labor market
-
Much of the uncertainty surrounding the consumption of households, especially the heavily indebted
-
Housing prices have increased markedly in Sydney and Melbourne
-
Sales of housing and lending slowed
-
-