Market news
-
23:50
Japan: Trade Balance Total, bln, March 615 (forecast 575.8)
-
22:46
New Zealand: CPI, y/y, Quarter I 2.2% (forecast 2%)
-
22:45
New Zealand: CPI, q/q , Quarter I 1.0% (forecast 0.8%)
-
22:27
Currencies. Daily history for Apr 19’2017:
(pare/closed(GMT +2)/change, %)
EUR/USD $1,0710 -0,19%
GBP/USD $1,2781 -0,48%
USD/CHF Chf0,998 +0,20%
USD/JPY Y108,84 +0,38%
EUR/JPY Y116,57 +0,20%
GBP/JPY Y139,11 -0,09%
AUD/USD $0,7494 -0,84%
NZD/USD $0,7002 -0,51%
USD/CAD C$1,348 +0,75%
-
21:59
Schedule for today, Thursday, Apr 20’2017 (GMT0)
01:30 Australia NAB Quarterly Business Confidence 5
06:00 Germany Producer Price Index (MoM) March 0.2% 0.1%
06:00 Germany Producer Price Index (YoY) March 3.1% 3.2%
12:00 U.S. FOMC Member Jerome Powell Speaks
12:30 U.S. Continuing Jobless Claims 2028 2020
12:30 U.S. Philadelphia Fed Manufacturing Survey April 32.8 25
12:30 U.S. Initial Jobless Claims 234 242
14:00 Eurozone Consumer Confidence (Preliminary) April -5 -4.8
14:00 U.S. Leading Indicators March 0.6% 0.2%
15:30 United Kingdom BOE Gov Mark Carney Speaks
17:15 U.S. Treasury Sec Mnuchin Speaks
-
14:35
US crude oil inventories decreased by 1.0 million barrels from the previous week
U.S. commercial crude oil inventories (excluding those in the Strategic Petroleum Reserve) decreased by 1.0 million barrels from the previous week. At 532.3 million barrels, U.S. crude oil inventories are near the upper limit of the average range for this time of year.
Total motor gasoline inventories increased by 1.5 million barrels last week, and are near the upper limit of the average range. Finished gasoline inventories decreased while blending components inventories increased last week.
Distillate fuel inventories decreased by 2.0 million barrels last week but are in the upper half of the average range for this time of year. Propane/propylene inventories fell 0.7 million barrels last week and are in the lower half of the average range. Total commercial petroleum inventories decreased by 1.7 million barrels last week.
-
14:30
U.S.: Crude Oil Inventories, April -1.034 (forecast -1.500)
-
14:01
May wins U.K. Parliament vote to allow June 8 snap election @zerohedge
-
13:41
Option expiries for today's 10:00 ET NY cut
EURUSD: 1.0600 (EUR 545m) 1.0650 (665m) 1.0685 (600m) 1.0700 (1.3bln) 1.0750 (986m) 1.0770 (1.55bln) 1.0800 (1.15bln)
USDJPY: 108.00 (USD 370m) 108.50 (250m) 109.50 (260m) 110.00 (660m)
GBPUSD: 1.2750 (GBP 365m)
AUDUSD: 0.7450 (AUD 443m) 0.7575 (AUD 504m) 0.7680-90 (1.1bln)
USDCAD: 1.3250-60 (USD 285m) 1.3330-40 (425m) 1.3500 (326m)
EURJPY: 116.25-35 (EUR 375m) 117.50 (200m)
-
13:13
Ecb's Coeure says personally don't see risks as tilted to downside
-
Taking support away would change picture
-
Still have to be convinced that return of inflation to 2 pct is sustainable
-
Not much discussion today about adding to ecb balance sheet
-
Says that european and french people want to keep the euro
-
-
12:41
IMF says U.S companies may be tempted to channel cash from Trump tax cuts into financial risk-taking, not capital investments
-
12:01
Orders
EUR/USD
Offers: 1.0750 1.0780 1.0800 1.0830 1.0850
Bids: 1.0700 1.0680-85 1.0650 1.0635 1.0620 1.0600
GBP/USD
Offers: 1.2850 1.2880 1.2900 1.2920 1.2950-60 1.2975 1.3000
Bids: 1.2800 1.2775-80 1.2760 1.2750 1.2720 1.2700 1.2680 1.2650
EUR/JPY
Offers: 116.85 117.00 117.30 117.50 117.80 118.00
Bids: 116.50 116.30 116.00 115.80-85 115.50 115.20 115.00
EUR/GBP
Offers: 0.8380 0.8400 0.8425-30 0.8445-50 0.8480 0.8500-05
Bids: 0.8335 0.8320 0.8300 0.8280 0.8260 0.8200
USD/JPY
Offers: 109.00 109.20-25 109.50 109.80110.00 110.30 110.50
Bids: 108.50 108.30 108.00 107.80 107.50 107.00
AUD/USD
Offers: 0.7530 0.7550 0.7580 0.7600 0.7620 0.7650
Bids: 0.7500 0.7480-85 0.7465 0.7450 0.7400
-
11:05
Poland expects gdp growth at 3.6 pct in 2017, 3.8 pct in 2018, 3.9 pct in 2019 in EU convergence plan update
-
Expects its fiscal deficit at 2.9 pct/gdp in 2017, 2.5 pct in 2018, 2.0 pct in 2019 in eu convergence plan update
-
Expects annual average cpi at 1.8 pct in 2017, 2.3 pct in 2018, 2.3 pct in 2019 in eu convergence plan update
-
Public debt at 55.3 pct/gdp in 2017, 54.8 pct in 2018, 54.0 pct in 2019, 52.1 pct in 2020 - Finance Ministry
-
-
10:13
Ecb's Hansson says need more incoming data before considering concrete policy action
-
09:45
Euro area trade balance surplus continued to rise
The first estimate for euro area (EA19) exports of goods to the rest of the world in February 2017 was €170.3 billion, an increase of 4% compared with February 2016 (€163.2 bn). Imports from the rest of the world stood at €152.6 bn, a rise of 5% compared with February 2016 (€144.9 bn). As a result, the euro area recorded a €17.8 bn surplus in trade in goods with the rest of the world in February 2017, compared with +€18.2 bn in February 2016. Intra-euro area trade rose to €149.1 bn in February 2017, up by 5% compared with February 2016. These data are released by Eurostat, the statistical office of the European Union.
-
09:04
Euro area annual inflation was 1.5% in March 2017
Euro area annual inflation was 1.5% in March 2017, down from 2.0% in February. In March 2016 the rate was 0.0%. European Union annual inflation was 1.6% in March 2017, down from 2.0% in February. A year earlier the rate was 0.0%. These figures come from Eurostat, the statistical office of the European Union. The lowest annual rates were registered in Romania (0.4%), Ireland and the Netherlands (both 0.6%). The highest annual rates were recorded in Latvia (3.3%), Lithuania (3.2%) and Estonia (3.0%). Compared with February 2017, annual inflation fell in seventeen Member States, remained stable in six and rose in five. The largest upward impacts to euro area annual inflation came from fuels for transport (+0.48 percentage points), heating oil (+0.11 pp) and vegetables (+0.08 pp), while telecommunication and package holidays (-0.09 pp each), and garments (-0.05 pp) had the biggest downward impacts.
-
09:01
Eurozone: Harmonized CPI ex EFAT, Y/Y, March 0.7% (forecast 0.7%)
-
09:01
Eurozone: Trade balance unadjusted, February 17.8 (forecast 16.2)
-
09:00
Eurozone: Harmonized CPI, Y/Y, March 1.5% (forecast 1.5%)
-
09:00
Eurozone: Harmonized CPI, March 0.8% (forecast 0.8%)
-
08:38
Turkish prime minister Yildirim says appeals against referendum results are a right, but calling people to the streets in protest is not
-
08:36
Italian trade balance surplus lower than expected in Feb
In February 2017 seasonally-adjusted data, compared to January 2017, decreased by 2.0% for outgoing flows while increased by 1.3% for incoming flows. The decrease of exports is the result of an increase for EU countries (+0.3%) and a decrease for non EU countries (-4.7%). The increase of imports is the result of an increase for EU countries (+2.5%) and a drop for non EU countries (-0.4%). Over the last three months, seasonally-adjusted data, in comparison with the previous three months, showed a growth of 3.7% for exports and of 5.6% for imports.
In February 2017, compared with the same month of the previous year, exports and imports increased (+2.3% and +9.1% respectively). Outgoing flows increased by 1.3% for EU countries and by 3.6% for non EU countries. Incoming flows increased by 7.3% for EU area and by 11.9% for non EU area. The trade balance in February amounted to +1.9 billion Euros (+0.2 billion Euros for EU area and +1,7 billion Euros for non EU countries).
-
08:00
British PM May says there will be no second referendum on EU membership
-
We won't be doing television debates in election campaign
-
-
07:21
British PM Theresa May says this election will allow us to strengthen our position in EU talks - BBC interview
-
Says holding election now will provide stability for longer period
-
Planned 2020 election would have clashed with crunch time in EU talks
-
-
06:40
Options levels on wednesday, April 19, 2017
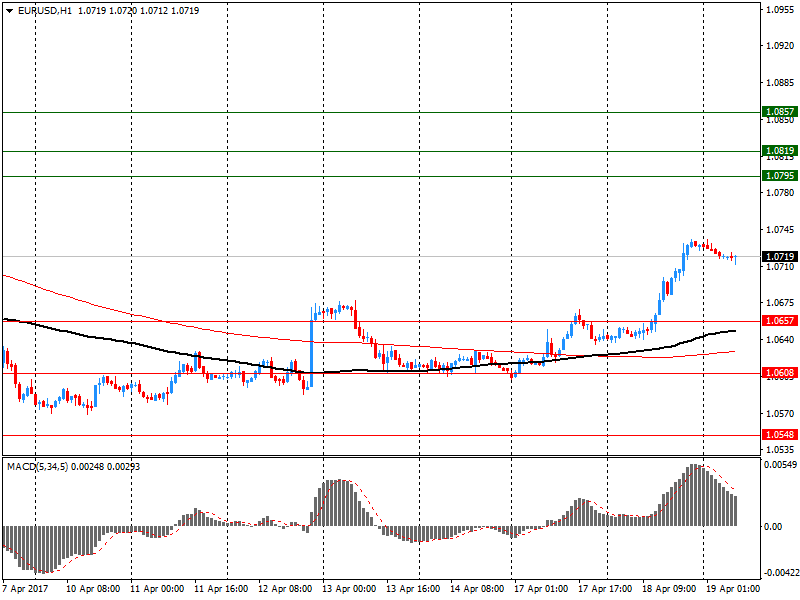
EUR/USD
Resistance levels (open interest**, contracts)
$1.0857 (1052)
$1.0819 (455)
$1.0795 (166)
Price at time of writing this review: $1.0719
Support levels (open interest**, contracts):
$1.0657 (531)
$1.0608 (757)
$1.0548 (1947)
Comments:
- Overall open interest on the CALL options with the expiration date June, 9 is 60413 contracts, with the maximum number of contracts with strike price $1,1100 (5074);
- Overall open interest on the PUT options with the expiration date June, 9 is 60770 contracts, with the maximum number of contracts with strike price $1,0400 (5229);
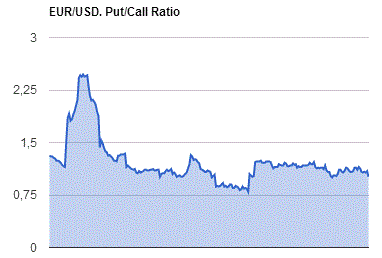
- The ratio of PUT/CALL was 1.01 versus 1.09 from the previous trading day according to data from April, 18

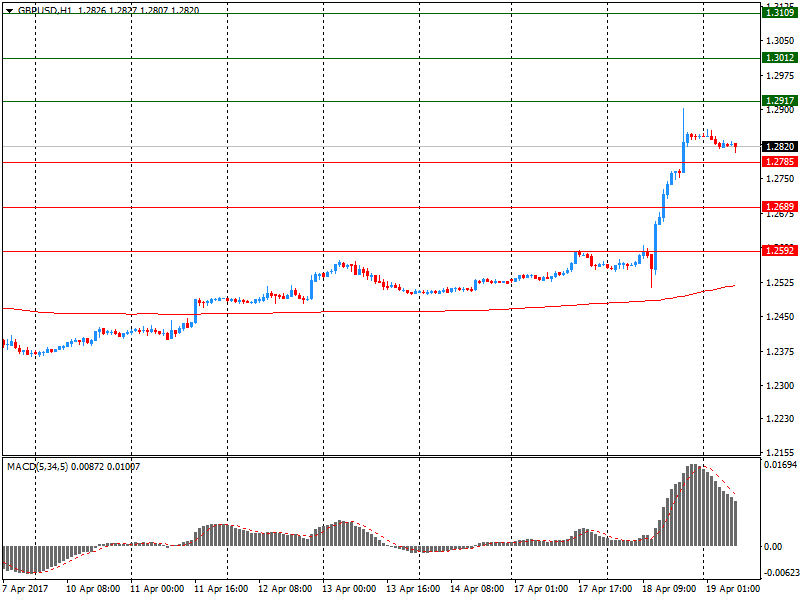
GBP/USD
Resistance levels (open interest**, contracts)
$1.3109 (720)
$1.3012 (1249)
$1.2917 (970)
Price at time of writing this review: $1.2820
Support levels (open interest**, contracts):
$1.2785 (305)
$1.2689 (221)
$1.2592 (437)
Comments:
- Overall open interest on the CALL options with the expiration date June, 9 is 18056 contracts, with the maximum number of contracts with strike price $1,2800 (2216);
- Overall open interest on the PUT options with the expiration date June, 9 is 20503 contracts, with the maximum number of contracts with strike price $1,1500 (3064);
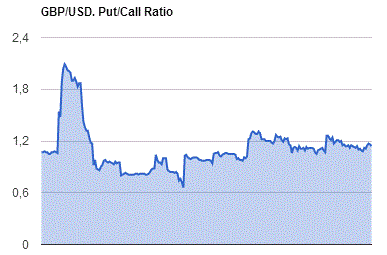
- The ratio of PUT/CALL was 1.14 versus 1.16 from the previous trading day according to data from April, 18

* - The Chicago Mercantile Exchange bulletin (CME) is used for the calculation.
** - Open interest takes into account the total number of option contracts that are open at the moment.
-
06:29
U.S vice president Pence: U.S policy on North Korea will be to work with allies and China on economic and diplomatic pressure
-
U.S will protect freedom of navigation and overflight in South China sea, will ensure unimpeded flow of lawful commerce
-
Those who would challenge our resolve should know we will defeat any attack with overwhelming response
-
-
06:27
Fitch - forecast two more US rate hikes in 2017, and another four in 2018
-
US tightening, trade risks weigh on APAC growth outlook
-
-
06:23
Australian new motor vehicle sales up 1.9% in March
The March 2017 trend estimate (96,023) decreased by 0.3% when compared with February 2017.
When comparing national trend estimates for March 2017 with February 2017, sales for Sports utility vehicles and Other vehicles increased by 0.2%and 0.5% respectively. By contrast, sales for Passenger vehicles decreased by 1.3%.
The largest downward movement across all states and territories, on a trend basis, was in Tasmania (-1.9%), continuing a downward trend that began in November 2016.
The Northern Territory was the only jurisdiction not to record a decrease in sales.
-
06:21
Trump says will stand up for Wisconsin dairy farmers against Canadian trade practices - Reuters
-
01:31
Australia: New Motor Vehicle Sales (MoM) , March 1.9%
-
01:31
Australia: New Motor Vehicle Sales (YoY) , March -3.0%
-

