Market news
-
23:50
Japan: Trade Balance Total, bln, March 615 (forecast 575.8)
-
22:46
New Zealand: CPI, y/y, Quarter I 2.2% (forecast 2%)
-
22:45
New Zealand: CPI, q/q , Quarter I 1.0% (forecast 0.8%)
-
22:28
Commodities. Daily history for Apr 19’02’2017:
(raw materials / closing price /% change)
Oil 50.58 +0.28%
Gold 1,282.00 -0.11%
-
22:27
Stocks. Daily history for Apr 19’2017:
(index / closing price / change items /% change)
Nikkei +13.61 18432.20 +0.07%
TOPIX -0.11 1471.42 -0.01%
Hang Seng -98.66 23825.88 -0.41%
CSI 300 -16.55 3446.08 -0.48%
Euro Stoxx 50 +11.21 3420.99 +0.33%
FTSE 100 -33.14 7114.36 -0.46%
DAX +16.01 12016.45 +0.13%
CAC 40 +13.48 5003.73 +0.27%
DJIA -118.79 20404.49 -0.58%
S&P 500 -4.02 2338.17 -0.17%
NASDAQ +13.56 5863.04 +0.23%
S&P/TSX -69.69 15552.88 -0.45%
-
22:27
Currencies. Daily history for Apr 19’2017:
(pare/closed(GMT +2)/change, %)
EUR/USD $1,0710 -0,19%
GBP/USD $1,2781 -0,48%
USD/CHF Chf0,998 +0,20%
USD/JPY Y108,84 +0,38%
EUR/JPY Y116,57 +0,20%
GBP/JPY Y139,11 -0,09%
AUD/USD $0,7494 -0,84%
NZD/USD $0,7002 -0,51%
USD/CAD C$1,348 +0,75%
-
21:59
Schedule for today, Thursday, Apr 20’2017 (GMT0)
01:30 Australia NAB Quarterly Business Confidence 5
06:00 Germany Producer Price Index (MoM) March 0.2% 0.1%
06:00 Germany Producer Price Index (YoY) March 3.1% 3.2%
12:00 U.S. FOMC Member Jerome Powell Speaks
12:30 U.S. Continuing Jobless Claims 2028 2020
12:30 U.S. Philadelphia Fed Manufacturing Survey April 32.8 25
12:30 U.S. Initial Jobless Claims 234 242
14:00 Eurozone Consumer Confidence (Preliminary) April -5 -4.8
14:00 U.S. Leading Indicators March 0.6% 0.2%
15:30 United Kingdom BOE Gov Mark Carney Speaks
17:15 U.S. Treasury Sec Mnuchin Speaks
-
20:05
Major US stock indices showed mixed dynamics
The major US stock indexes finished trading in different directions, responding to a new portion of corporate reporting and the collapse of oil quotations.
In the focus of investors' attention were shares of companies such as IBM (IBM), Yahoo! (YHOO), Morgan Stanley (MS), which published their quarterly reports.
The cost of oil decreased by almost 4%, which was due to the growth of the US dollar and an ambiguous report from the US Energy Ministry, which pointed to less than expected reduction in oil reserves, along with an unexpected increase in gasoline stocks. The US Energy Ministry reported that in the week of April 8-14, oil reserves fell by 1 million barrels to 532.3 million barrels. Analysts had expected a drop of 1.5 million barrels. Gasoline stocks increased by 1.5 million barrels to 237.7 million barrels. A decrease of 2 million barrels was expected. Distillate stocks fell by 2 million barrels to 148.3 million barrels. The utilization factor of oil refining capacity increased by 1.9%, to 92.9%. Meanwhile, oil production increased to 9.252 million barrels per day from 9.235 million barrels a day a week earlier.
A small influence on the course of trading was provided by the Fed's Beige Book. The report noted that economic activity grew in all 12 districts, while the growth rate varied from modest to moderate. Also in the Beige Book, it was reported that improving the labor market conditions in the US exerts upward pressure on wages, as companies are increasingly reporting difficulties in To find low-skilled employees. Meanwhile, companies expect that the price increase in the next few months will be from small to moderate
Most components of the DOW index recorded a decline (23 out of 30). The shares of International Business Machines Corporation (IBM, -5.19%) fell more than others. The leader of growth was shares of Intel Corporation (INTC, + 0.48%).
The S & P indexes closed mostly in negative territory. Most of all, the main materials sector fell (-1.6%). The leader of growth was the healthcare sector (+ 0.2%).
At closing:
DJIA -0.59% 20,402.57 -120.71
Nasdaq + 0.23% 5,863.03 +13.56
S & P -0.18% 2,337.97 -4.22
-
19:00
DJIA -0.53% 20,415.24 -108.04 Nasdaq +0.28% 5,865.69 +16.22 S&P -0.15% 2,338.77 -3.42
-
16:00
European stocks closed: FTSE 100 -33.14 7114.36 -0.46% DAX +16.01 12016.45 +0.13% CAC 40 +13.48 5003.73 +0.27%
-
14:35
US crude oil inventories decreased by 1.0 million barrels from the previous week
U.S. commercial crude oil inventories (excluding those in the Strategic Petroleum Reserve) decreased by 1.0 million barrels from the previous week. At 532.3 million barrels, U.S. crude oil inventories are near the upper limit of the average range for this time of year.
Total motor gasoline inventories increased by 1.5 million barrels last week, and are near the upper limit of the average range. Finished gasoline inventories decreased while blending components inventories increased last week.
Distillate fuel inventories decreased by 2.0 million barrels last week but are in the upper half of the average range for this time of year. Propane/propylene inventories fell 0.7 million barrels last week and are in the lower half of the average range. Total commercial petroleum inventories decreased by 1.7 million barrels last week.
-
14:30
U.S.: Crude Oil Inventories, April -1.034 (forecast -1.500)
-
14:01
May wins U.K. Parliament vote to allow June 8 snap election @zerohedge
-
13:41
Option expiries for today's 10:00 ET NY cut
EURUSD: 1.0600 (EUR 545m) 1.0650 (665m) 1.0685 (600m) 1.0700 (1.3bln) 1.0750 (986m) 1.0770 (1.55bln) 1.0800 (1.15bln)
USDJPY: 108.00 (USD 370m) 108.50 (250m) 109.50 (260m) 110.00 (660m)
GBPUSD: 1.2750 (GBP 365m)
AUDUSD: 0.7450 (AUD 443m) 0.7575 (AUD 504m) 0.7680-90 (1.1bln)
USDCAD: 1.3250-60 (USD 285m) 1.3330-40 (425m) 1.3500 (326m)
EURJPY: 116.25-35 (EUR 375m) 117.50 (200m)
-
13:32
U.S. Stocks open: Dow +0.08%, Nasdaq +0.49%, S&P +0.38%
-
13:22
Before the bell: S&P futures +0.35%, NASDAQ futures +0.46%
U.S. stock-index rose as investors moved on to the next set of financial reports, a day after Wall Street lost some ground due to weak quarterly results from some corporate heavyweights.
Stocks:
Nikkei 18,432.20 +13.61 +0.07%
Hang Seng 23,825.88 -98.66 -0.41%
Shanghai 3,171.31 -25.41 -0.79%
FTSE 7,118.73 -28.77 -0.40%
CAC 5,000.85 +10.60 +0.21%
DAX 12,015.23 +14.79 +0.12%
Crude $52.35 (-0.11%)
Gold $1,286.60 (-0.58%)
-
13:13
Ecb's Coeure says personally don't see risks as tilted to downside
-
Taking support away would change picture
-
Still have to be convinced that return of inflation to 2 pct is sustainable
-
Not much discussion today about adding to ecb balance sheet
-
Says that european and french people want to keep the euro
-
-
12:57
Wall Street. Stocks before the bell
(company / ticker / price / change ($/%) / volume)
ALCOA INC.
AA
32
0.24(0.76%)
21038
ALTRIA GROUP INC.
MO
72.5
0.16(0.22%)
244
Amazon.com Inc., NASDAQ
AMZN
908.73
4.95(0.55%)
99750
American Express Co
AXP
76
0.21(0.28%)
28775
AMERICAN INTERNATIONAL GROUP
AIG
59.59
0.09(0.15%)
176
Apple Inc.
AAPL
141.89
0.69(0.49%)
936579
AT&T Inc
T
40.32
0.07(0.17%)
8209
Barrick Gold Corporation, NYSE
ABX
19.54
-0.17(-0.86%)
23131
Caterpillar Inc
CAT
94.86
0.47(0.50%)
48255
Cisco Systems Inc
CSCO
32.75
0.08(0.24%)
846101
Citigroup Inc., NYSE
C
58.8
0.38(0.65%)
26159
Exxon Mobil Corp
XOM
81
-0.05(-0.06%)
28254
Facebook, Inc.
FB
141.91
0.95(0.67%)
439493
Ford Motor Co.
F
11.19
0.05(0.45%)
59562
Freeport-McMoRan Copper & Gold Inc., NYSE
FCX
12.57
0.10(0.80%)
16535
General Electric Co
GE
29.9
0.06(0.20%)
229085
General Motors Company, NYSE
GM
33.79
0.10(0.30%)
816
Goldman Sachs
GS
217
1.41(0.65%)
59218
Google Inc.
GOOG
841.37
4.55(0.54%)
58806
Hewlett-Packard Co.
HPQ
18.48
0.26(1.43%)
38120
Home Depot Inc
HD
147.5
-0.26(-0.18%)
27772
Intel Corp
INTC
35.88
0.12(0.32%)
800596
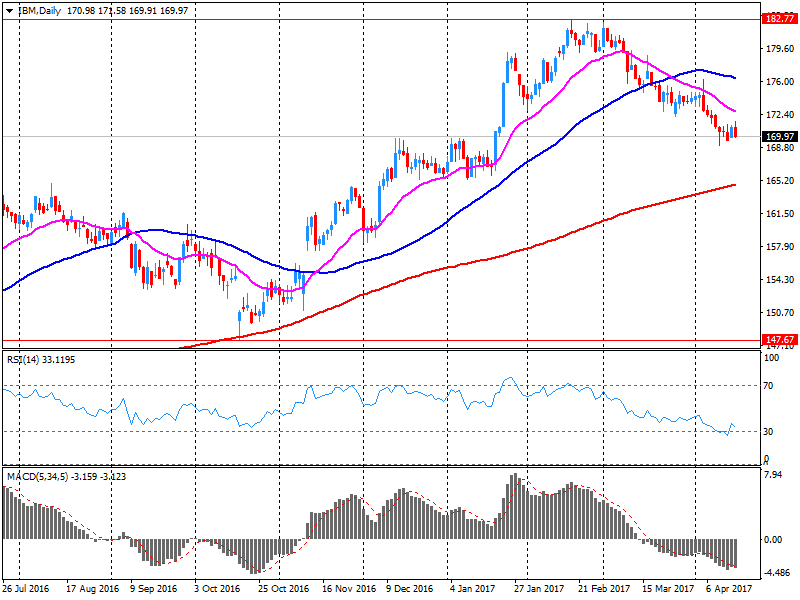
International Business Machines Co...
IBM
160.89
-9.16(-5.39%)
291027
International Paper Company
IP
51.8
0.35(0.68%)
592
Johnson & Johnson
JNJ
121.99
0.17(0.14%)
29840
JPMorgan Chase and Co
JPM
85.7
0.54(0.63%)
50197
Microsoft Corp
MSFT
65.53
0.14(0.21%)
1289934
Nike
NKE
56.02
-0.09(-0.16%)
29020
Pfizer Inc
PFE
33.99
0.15(0.44%)
28681
Procter & Gamble Co
PG
90.29
0.18(0.20%)
30483
Starbucks Corporation, NASDAQ
SBUX
58.27
-0.08(-0.14%)
237850
Tesla Motors, Inc., NASDAQ
TSLA
303.65
3.40(1.13%)
47962
The Coca-Cola Co
KO
43.73
0.25(0.58%)
110892
Twitter, Inc., NYSE
TWTR
14.49
0.05(0.35%)
4674
UnitedHealth Group Inc
UNH
169.1
0.51(0.30%)
28169
Verizon Communications Inc
VZ
49.38
0.16(0.33%)
28599
Visa
V
89.99
0.26(0.29%)
4411
Wal-Mart Stores Inc
WMT
74.11
0.22(0.30%)
28126
Walt Disney Co
DIS
114.49
0.30(0.26%)
28194
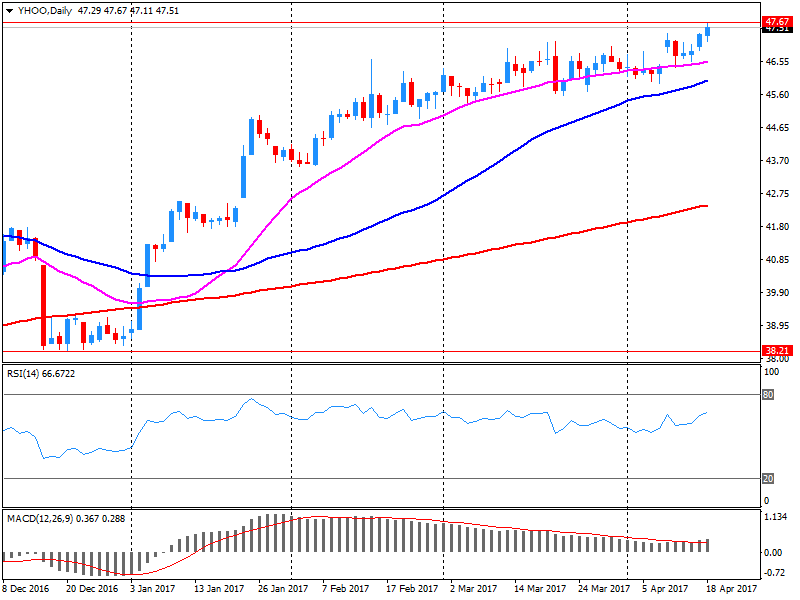
Yahoo! Inc., NASDAQ
YHOO
47.75
0.19(0.40%)
157225
-
12:54
Upgrades and downgrades before the market open
Upgrades:
Coca-Cola (KO) upgraded to Outperform from Neutral at Credit Suisse
Int'l Paper (IP) upgraded to Outperform at RBC Capital Mkts; target raised to $56
Goldman Sachs (GS) upgraded to Neutral from Sell at Citigroup
HP (HPQ) upgraded to Overweight from Equal Weight at Barclays
Downgrades:
Other:
IBM (IBM) target lowered to $180 from $185 at RBC Capital Mkts
Goldman Sachs (GS) target lowered to $240 from $250 at RBC Capital Mkts
AT&T (T) initiated with a Hold at SunTrust
Verizon (VZ) with a Hold at SunTrust
-
12:41
IMF says U.S companies may be tempted to channel cash from Trump tax cuts into financial risk-taking, not capital investments
-
12:15
Company News: Yahoo! (YHOO) posts better-than-expected quarterly results
Yahoo! (YHOO) reported Q1 FY 2017 earnings of $0.18 per share (versus $0.08 in Q1 FY 2016), beating analysts' consensus estimate of $0.14.
The company's quarterly revenues amounted to $0.834 bln (-2.9% y/y), beating analysts' consensus estimate of $0.814 bln.
YHOO rose to $47.90 (+0.71%) in pre-market trading.
-
12:08
Company News: IBM (IBM) reports worse-than-expected quarterly revenues
IBM (IBM) reported Q1 FY 2017 earnings of $2.38 per share (versus $2.35 in Q1 FY 2016), beating analysts' consensus estimate of $2.35.
The company's quarterly revenues amounted to $18.155 bln (-2.8% y/y), slightly missing analysts' consensus estimate of $18.371 bln.
The company reaffirmed guidance for FY 2017, projecting EPS of at least $13.80 versus analysts' consensus estimate of $13.78.
IBM fell to 161.52 (-5.02%) in pre-market trading.
-
12:01
Orders
EUR/USD
Offers: 1.0750 1.0780 1.0800 1.0830 1.0850
Bids: 1.0700 1.0680-85 1.0650 1.0635 1.0620 1.0600
GBP/USD
Offers: 1.2850 1.2880 1.2900 1.2920 1.2950-60 1.2975 1.3000
Bids: 1.2800 1.2775-80 1.2760 1.2750 1.2720 1.2700 1.2680 1.2650
EUR/JPY
Offers: 116.85 117.00 117.30 117.50 117.80 118.00
Bids: 116.50 116.30 116.00 115.80-85 115.50 115.20 115.00
EUR/GBP
Offers: 0.8380 0.8400 0.8425-30 0.8445-50 0.8480 0.8500-05
Bids: 0.8335 0.8320 0.8300 0.8280 0.8260 0.8200
USD/JPY
Offers: 109.00 109.20-25 109.50 109.80110.00 110.30 110.50
Bids: 108.50 108.30 108.00 107.80 107.50 107.00
AUD/USD
Offers: 0.7530 0.7550 0.7580 0.7600 0.7620 0.7650
Bids: 0.7500 0.7480-85 0.7465 0.7450 0.7400
-
11:05
Poland expects gdp growth at 3.6 pct in 2017, 3.8 pct in 2018, 3.9 pct in 2019 in EU convergence plan update
-
Expects its fiscal deficit at 2.9 pct/gdp in 2017, 2.5 pct in 2018, 2.0 pct in 2019 in eu convergence plan update
-
Expects annual average cpi at 1.8 pct in 2017, 2.3 pct in 2018, 2.3 pct in 2019 in eu convergence plan update
-
Public debt at 55.3 pct/gdp in 2017, 54.8 pct in 2018, 54.0 pct in 2019, 52.1 pct in 2020 - Finance Ministry
-
-
10:13
Ecb's Hansson says need more incoming data before considering concrete policy action
-
09:45
Euro area trade balance surplus continued to rise
The first estimate for euro area (EA19) exports of goods to the rest of the world in February 2017 was €170.3 billion, an increase of 4% compared with February 2016 (€163.2 bn). Imports from the rest of the world stood at €152.6 bn, a rise of 5% compared with February 2016 (€144.9 bn). As a result, the euro area recorded a €17.8 bn surplus in trade in goods with the rest of the world in February 2017, compared with +€18.2 bn in February 2016. Intra-euro area trade rose to €149.1 bn in February 2017, up by 5% compared with February 2016. These data are released by Eurostat, the statistical office of the European Union.
-
09:04
Euro area annual inflation was 1.5% in March 2017
Euro area annual inflation was 1.5% in March 2017, down from 2.0% in February. In March 2016 the rate was 0.0%. European Union annual inflation was 1.6% in March 2017, down from 2.0% in February. A year earlier the rate was 0.0%. These figures come from Eurostat, the statistical office of the European Union. The lowest annual rates were registered in Romania (0.4%), Ireland and the Netherlands (both 0.6%). The highest annual rates were recorded in Latvia (3.3%), Lithuania (3.2%) and Estonia (3.0%). Compared with February 2017, annual inflation fell in seventeen Member States, remained stable in six and rose in five. The largest upward impacts to euro area annual inflation came from fuels for transport (+0.48 percentage points), heating oil (+0.11 pp) and vegetables (+0.08 pp), while telecommunication and package holidays (-0.09 pp each), and garments (-0.05 pp) had the biggest downward impacts.
-
09:01
Eurozone: Harmonized CPI ex EFAT, Y/Y, March 0.7% (forecast 0.7%)
-
09:01
Eurozone: Trade balance unadjusted, February 17.8 (forecast 16.2)
-
09:00
Eurozone: Harmonized CPI, Y/Y, March 1.5% (forecast 1.5%)
-
09:00
Eurozone: Harmonized CPI, March 0.8% (forecast 0.8%)
-
08:38
Turkish prime minister Yildirim says appeals against referendum results are a right, but calling people to the streets in protest is not
-
08:36
Italian trade balance surplus lower than expected in Feb
In February 2017 seasonally-adjusted data, compared to January 2017, decreased by 2.0% for outgoing flows while increased by 1.3% for incoming flows. The decrease of exports is the result of an increase for EU countries (+0.3%) and a decrease for non EU countries (-4.7%). The increase of imports is the result of an increase for EU countries (+2.5%) and a drop for non EU countries (-0.4%). Over the last three months, seasonally-adjusted data, in comparison with the previous three months, showed a growth of 3.7% for exports and of 5.6% for imports.
In February 2017, compared with the same month of the previous year, exports and imports increased (+2.3% and +9.1% respectively). Outgoing flows increased by 1.3% for EU countries and by 3.6% for non EU countries. Incoming flows increased by 7.3% for EU area and by 11.9% for non EU area. The trade balance in February amounted to +1.9 billion Euros (+0.2 billion Euros for EU area and +1,7 billion Euros for non EU countries).
-
08:00
British PM May says there will be no second referendum on EU membership
-
We won't be doing television debates in election campaign
-
-
07:59
The main stock markets in Europe trading mixed: FTSE 7138.91 -8.59 -0.12%, DAX 12011.11 +10.67 + 0.09%, CAC 4988.26 -1.99 -0.04%
-
07:21
British PM Theresa May says this election will allow us to strengthen our position in EU talks - BBC interview
-
Says holding election now will provide stability for longer period
-
Planned 2020 election would have clashed with crunch time in EU talks
-
-
06:51
Mixed start of trading expected on the main European stock exchanges: DAX -0.1%, CAC40 flat, FTSE -0.5%
-
06:40
Options levels on wednesday, April 19, 2017
EUR/USD
Resistance levels (open interest**, contracts)
$1.0857 (1052)
$1.0819 (455)
$1.0795 (166)
Price at time of writing this review: $1.0719
Support levels (open interest**, contracts):
$1.0657 (531)
$1.0608 (757)
$1.0548 (1947)
Comments:
- Overall open interest on the CALL options with the expiration date June, 9 is 60413 contracts, with the maximum number of contracts with strike price $1,1100 (5074);
- Overall open interest on the PUT options with the expiration date June, 9 is 60770 contracts, with the maximum number of contracts with strike price $1,0400 (5229);
- The ratio of PUT/CALL was 1.01 versus 1.09 from the previous trading day according to data from April, 18
GBP/USD
Resistance levels (open interest**, contracts)
$1.3109 (720)
$1.3012 (1249)
$1.2917 (970)
Price at time of writing this review: $1.2820
Support levels (open interest**, contracts):
$1.2785 (305)
$1.2689 (221)
$1.2592 (437)
Comments:
- Overall open interest on the CALL options with the expiration date June, 9 is 18056 contracts, with the maximum number of contracts with strike price $1,2800 (2216);
- Overall open interest on the PUT options with the expiration date June, 9 is 20503 contracts, with the maximum number of contracts with strike price $1,1500 (3064);
- The ratio of PUT/CALL was 1.14 versus 1.16 from the previous trading day according to data from April, 18
* - The Chicago Mercantile Exchange bulletin (CME) is used for the calculation.
** - Open interest takes into account the total number of option contracts that are open at the moment.
-
06:29
U.S vice president Pence: U.S policy on North Korea will be to work with allies and China on economic and diplomatic pressure
-
U.S will protect freedom of navigation and overflight in South China sea, will ensure unimpeded flow of lawful commerce
-
Those who would challenge our resolve should know we will defeat any attack with overwhelming response
-
-
06:27
Fitch - forecast two more US rate hikes in 2017, and another four in 2018
-
US tightening, trade risks weigh on APAC growth outlook
-
-
06:23
Australian new motor vehicle sales up 1.9% in March
The March 2017 trend estimate (96,023) decreased by 0.3% when compared with February 2017.
When comparing national trend estimates for March 2017 with February 2017, sales for Sports utility vehicles and Other vehicles increased by 0.2%and 0.5% respectively. By contrast, sales for Passenger vehicles decreased by 1.3%.
The largest downward movement across all states and territories, on a trend basis, was in Tasmania (-1.9%), continuing a downward trend that began in November 2016.
The Northern Territory was the only jurisdiction not to record a decrease in sales.
-
06:21
Trump says will stand up for Wisconsin dairy farmers against Canadian trade practices - Reuters
-
05:38
Global Stocks
European stocks moved sharply lower on Tuesday, with U.K. stocks leading the charge south after U.K. Prime Minister Theresa May unexpectedly called an early general election. A slump in commodity shares and nerves ahead of the first round of voting in France's presidential election on Sunday also added selling pressure on European equity benchmarks.
U.S. stocks on Tuesday finished squarely in negative territory, but off session lows, as a spate of tepid corporate earnings weighed on the broader market. A decline in shares of Goldman Sachs Group Inc. GS, -4.72% shaved more than 70 points off the Dow industrials after the investment bank's first-quarter results missed Wall Street expectations.
Equities investors in Asia tempered their risk appetite on Wednesday, tracking declines in the U.S., as geopolitical concerns continued to weigh on markets. British Prime Minister Theresa May's announcement of a general election in June, aimed at shoring up her mandate to take Britain out of the EU, added to already simmering market worries around North Korea, Syria and Russia.
-
01:31
Australia: New Motor Vehicle Sales (MoM) , March 1.9%
-
01:31
Australia: New Motor Vehicle Sales (YoY) , March -3.0%
-