Market news
-
22:29
Commodities. Daily history for Apr 20’02’2017:
(raw materials / closing price /% change)
Oil 50.73 +0.04%
Gold 1,283.60 -0.02%
-
22:28
Stocks. Daily history for Apr 20’2017:
(index / closing price / change items /% change)
Nikkei -1.71 18430.49 -0.01%
TOPIX +1.39 1472.81 +0.09%
Hang Seng +231.10 24056.98 +0.97%
CSI 300 +16.01 3462.09 +0.46%
Euro Stoxx 50 +19.04 3440.03 +0.56%
FTSE 100 +4.18 7118.54 +0.06%
DAX +10.87 12027.32 +0.09%
CAC 40 +74.18 5077.91 +1.48%
DJIA +174.22 20578.71 +0.85%
S&P 500 +17.67 2355.84 +0.76%
NASDAQ +53.74 5916.78 +0.92%
S&P/TSX +72.68 15625.56 +0.47%
-
22:27
Currencies. Daily history for Apr 20’2017:
(pare/closed(GMT +2)/change, %)
EUR/USD $1,0712 +0,02%
GBP/USD $1,2807 +0,20%
USD/CHF Chf0,9984 +0,04%
USD/JPY Y109,28 +0,40%
EUR/JPY Y117,06 +0,42%
GBP/JPY Y139,95 +0,60%
AUD/USD $0,7525 +0,41%
NZD/USD $0,7009 +0,10%
USD/CAD C$1,3469 -0,08%
-
22:00
Schedule for today, Friday, Apr 21’2017 (GMT0)
00:30 Japan Manufacturing PMI (Preliminary) April 52.4
04:30 Japan Tertiary Industry Index February 0.0%
07:00 France Manufacturing PMI (Preliminary) April 53.3 53
07:00 France Services PMI (Preliminary) April 57.5 57.1
07:30 Germany Services PMI (Preliminary) April 55.6 55.5
07:30 Germany Manufacturing PMI (Preliminary) April 58.3 58
08:00 Eurozone Current account, unadjusted, bln February 2.5
08:00 Eurozone Manufacturing PMI (Preliminary) April 56.2 56
08:00 Eurozone Services PMI (Preliminary) April 56 56
08:30 United Kingdom Retail Sales (MoM) March 1.4% -0.2%
08:30 United Kingdom Retail Sales (YoY) March 3.7% 3.4%
11:45 United Kingdom MPC Member Saunders Speaks
12:30 Canada Consumer Price Index m / m March 0.2% 0.4%
12:30 Canada Consumer price index, y/y March 2% 1.8%
12:30 Canada Bank of Canada Consumer Price Index Core, y/y March 1.7%
13:30 U.S. FOMC Member Kashkari Speaks
13:45 U.S. Manufacturing PMI (Preliminary) April 53.3 53.5
13:45 U.S. Services PMI (Preliminary) April 52.8 53
14:00 U.S. Existing Home Sales March 5.48 5.6
17:00 U.S. Baker Hughes Oil Rig Count April 683
-
20:08
The main US stock indices increased significantly as a result of today's trading
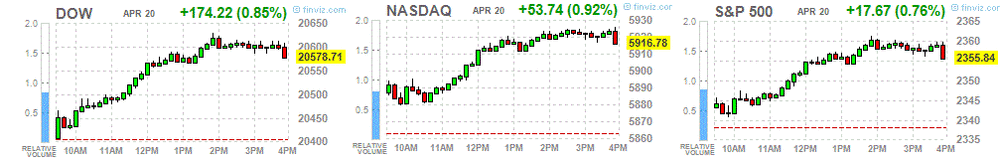
Major US stock indices added about a percentage on Thursday, mainly due to the growth of shares in the conglomerate sector and financial segment.
In addition, as it became known today, new applications for unemployment benefits in the US rose slightly more than expected last week, but the number of Americans who continue to receive unemployment benefits fell to a 17-year low, indicating a tightening of the labor market. Initial claims for unemployment benefits increased by 10,000 and, taking into account seasonal fluctuations, reached 244,000 for the week ending April 15. This increase followed a three-week decline. Economists predicted that primary treatment will grow to 242,000 people. The average four-week moving average of calls, which is considered to be the best indicator of labor market trends, fell by 4,250 to 243,000 last week. The report also showed that the number of repeated applications for unemployment benefits decreased by 49,000 to 1.98 million in the week to April 8. This was the lowest rate since April 2000.
At the same time, the report submitted by the Federal Reserve Bank of Philadelphia showed that the index of business activity in the production sector fell in April to 22 points from 32.8 points in March. Economists had expected a decline to 25 points. The employment index rose to 19.9 from 17.5 in March, while the index of new orders fell to 27.4 from 38.6 in March.
Oil futures fell a little on Thursday, Negative impact on prices was provided by evidence of an increase in oil production in the US, but further drop in quotes held back comments from the leading oil producers in the Gulf of Mexico regarding the extension of the current agreement to reduce oil production.
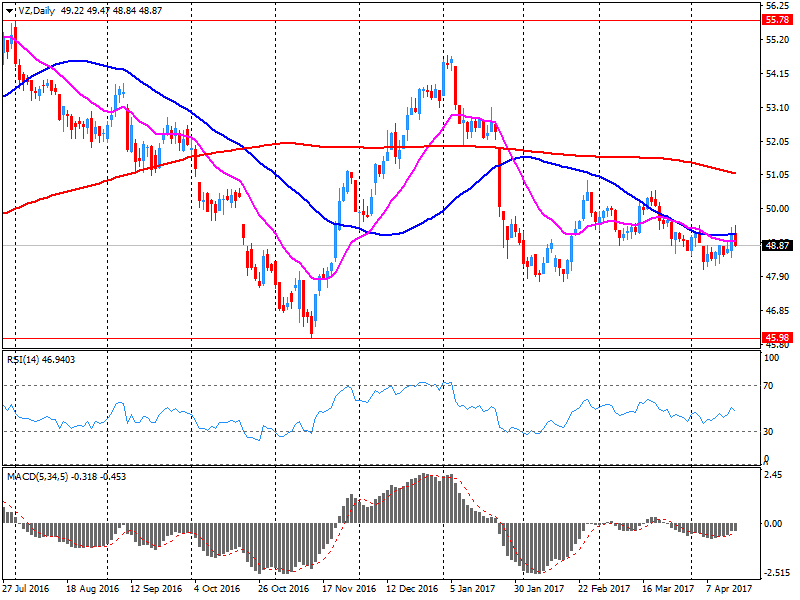
Most components of the DOW index finished trading in positive territory (26 out of 30). More fell shares Verizon Communications Inc. (VZ, -1.35%). The leader of growth was shares of American Express Company (AXP, + 6.12%).
Almost all sectors of the S & P index showed a positive trend. The leader of growth was the conglomerate sector (+ 1.7%). Only the utilities sector fell (-0.3%).
At closing:
DJIA + 0.86% 20.579.26 +174.77
Nasdaq + 0.92% 5,916.78 +53.75
S & P + 0.76% 2,355.92 +17.75
-
19:00
DJIA +0.97% 20,602.46 +197.97 Nasdaq +1.04% 5,923.91 +60.88 S&P +0.87% 2,358.61 +20.44
-
16:00
European stocks closed: FTSE 100 +4.18 7118.54 +0.06% DAX +10.87 12027.32 +0.09% CAC 40 +74.18 5077.91 +1.48%
-
14:44
Euro area consumer confidence improved sligthly in April
In April 2017, the DG ECFIN flash estimate of the consumer confidence indicator increased markedly in the euro area (by 1.4 points to -3.6) and, to a somewhat lesser extent, in the EU (by 0.8 point to -3.4) compared to March.
-
14:00
Eurozone: Consumer Confidence, April -3.6 (forecast -4.8)
-
14:00
U.S.: Leading Indicators , March 0.4% (forecast 0.2%)
-
13:45
Option expiries for today's 10:00 ET NY cut
EURUSD: 1.0500-10 (EUR 1.42bln) 1.0570-80 (790m) 1.0600 (643m) 1.0650-60 (790m)1.0700-05 (490m) 1.0720-25 (1.4bln) 1.0750-55 (440m) 1.0780 (480m) 1.0800 (410m) 1.0830 (785m)
USDJPY: 108.00 (USD 1.1bln) 108.50-60 (1.4bln) 108.85 (240m) 109.00 (2.5bln) 109.25 (415m) 109.50 (502m) 110.00 (1.1bln)
GBPUSD 1.2500 (GBP 725m) 1.2620 (198m)
EURGBP 0.8500 (EUR 230m)
USDCHF 0.9920 (USD 215m) 0.9975 (240m) 1.0055 (210m) 1.0090-1.0100 (655m)
AUDUSD 0.7450 (475m) 0.7470 (200m) 0.7500 (300m) 0.7590-0.7600 (522m) 0.7660 (743m)
USDCAD 1.3340-50 (USD 545m) 1.3500 (381m)
NZDUSD 0.7025-30 (NZD 257m)
-
13:33
U.S. Stocks open: Dow +0.30%, Nasdaq +0.48%, S&P +0.31%
-
13:28
Before the bell: S&P futures +0.26%, NASDAQ futures +0.37%
U.S. stock-index rose amid increased optimism around the first-quarter earnings season, while oil prices kept above $50 level.
Stocks:
Nikkei 18,430.49 -1.71 -0.01%
Hang Seng 24,056.98 +231.10 +0.97%
Shanghai 3,172.59 +1.90 +0.06%
FTSE 7,110.50 -3.86 -0.05%
CAC 5,046.67 +42.94 +0.86%
DAX 12,018.06 +1.61 +0.01%
Crude $50.74 (-0.22%)
Gold $1,282.10 (-0.10%)
-
12:58
US Philly manufacturing index rose less then expected in April. Regional manufacturing activity continued to expand, but at a slower pace
Results from the April Manufacturing Business Outlook Survey suggest that regional manufacturing activity continued to expand, but at a slower pace than last month. The diffusion indexes for general activity, new orders, and shipments remained positive but fell from their readings in March. The current employment index, however, improved slightly and continues to suggest expanding employment in the manufacturing sector. The survey's future indicators continued to reflect general optimism but retreated from their high readings in the first three months of the year.
The index for current manufacturing activity in the region decreased from a reading of 32.8 in March to 22.0 this month.
-
12:58
Wall Street. Stocks before the bell
(company / ticker / price / change ($/%) / volume)
ALTRIA GROUP INC.
MO
71.6
-0.51(-0.71%)
2745
Amazon.com Inc., NASDAQ
AMZN
898.5
-0.70(-0.08%)
46970
American Express Co
AXP
77.3
1.75(2.32%)
9226
Apple Inc.
AAPL
141.2
0.52(0.37%)
44780
AT&T Inc
T
40.01
-0.24(-0.60%)
109961
Barrick Gold Corporation, NYSE
ABX
19.05
0.14(0.74%)
50830
Caterpillar Inc
CAT
93.1
0.40(0.43%)
2522
Cisco Systems Inc
CSCO
32.74
0.09(0.28%)
1751
Citigroup Inc., NYSE
C
58.03
0.30(0.52%)
5678
Deere & Company, NYSE
DE
107.9
-0.32(-0.30%)
1611
Exxon Mobil Corp
XOM
80.65
0.16(0.20%)
5117
Facebook, Inc.
FB
142.61
0.34(0.24%)
54343
Ford Motor Co.
F
11.23
0.04(0.36%)
13275
Freeport-McMoRan Copper & Gold Inc., NYSE
FCX
12.45
0.10(0.81%)
9518
General Electric Co
GE
30.04
0.04(0.13%)
2079
General Motors Company, NYSE
GM
33.9
0.11(0.33%)
1129
Goldman Sachs
GS
214.9
0.81(0.38%)
11403
Hewlett-Packard Co.
HPQ
18.37
-0.01(-0.05%)
250
Intel Corp
INTC
36.01
0.10(0.28%)
1342
International Business Machines Co...
IBM
161.5
-0.19(-0.12%)
12053
Johnson & Johnson
JNJ
121.05
-0.32(-0.26%)
229
JPMorgan Chase and Co
JPM
84.85
0.39(0.46%)
15320
Microsoft Corp
MSFT
65.28
0.24(0.37%)
2192
Nike
NKE
55.92
0.06(0.11%)
31640
Starbucks Corporation, NASDAQ
SBUX
59.9
0.86(1.46%)
23035
Tesla Motors, Inc., NASDAQ
TSLA
306.58
1.06(0.35%)
19842
The Coca-Cola Co
KO
43.3
0.07(0.16%)
242
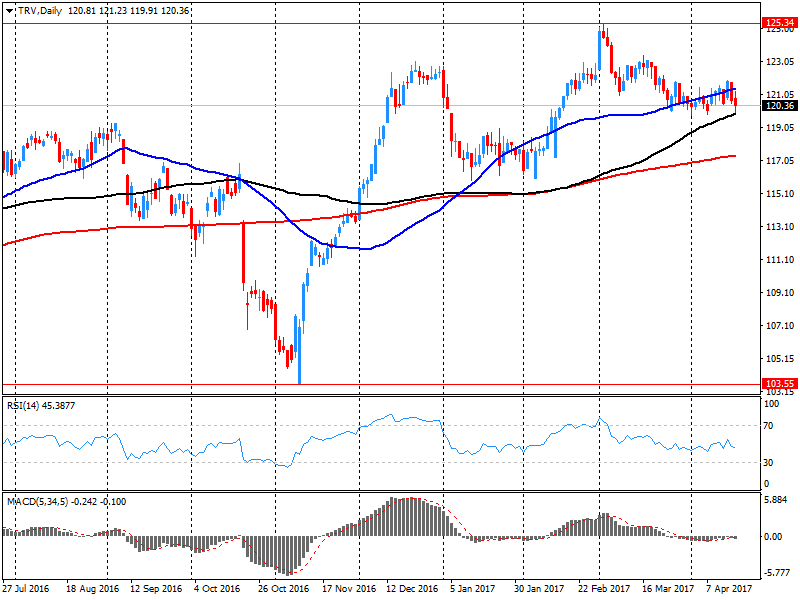
Travelers Companies Inc
TRV
117.95
-2.45(-2.03%)
84297
Twitter, Inc., NYSE
TWTR
14.58
0.04(0.28%)
11338
Verizon Communications Inc
VZ
47.84
-1.10(-2.25%)
564791
Visa
V
90.26
0.51(0.57%)
6035
Wal-Mart Stores Inc
WMT
74.15
0.08(0.11%)
514
Walt Disney Co
DIS
114.02
0.29(0.26%)
706
Yahoo! Inc., NASDAQ
YHOO
47.2
0.20(0.43%)
630
Yandex N.V., NASDAQ
YNDX
23.41
0.09(0.39%)
5800
-
12:56
US initial jobless claims a little higher than expected
In the week ending April 15, the advance figure for seasonally adjusted initial claims was 244,000, an increase of 10,000 from the previous week's unrevised level of 234,000. The 4-week moving average was 243,000, a decrease of 4,250 from the previous week's unrevised average of 247,250.
-
12:51
Upgrades and downgrades before the market open
Upgrades:
Goldman Sachs (GS) upgraded to Overweight from Neutral at Atlantic Equities
Starbucks (SBUX) upgraded to Buy from Hold at Stifel
Downgrades:
Other:
Amazon (AMZN) target raised to $1000 from $940 at Maxim Group
-
12:30
U.S.: Initial Jobless Claims, 244 (forecast 242)
-
12:30
U.S.: Continuing Jobless Claims, 1979 (forecast 2020)
-
12:30
U.S.: Philadelphia Fed Manufacturing Survey, April 22 (forecast 25)
-
12:09
Company News: Verizon (VZ) posts worse-than-expected quarterly results
Verizon (VZ) reported Q1 FY 2017 earnings of $0.95 per share (versus $1.06 in Q1 FY 2016), missing analysts' consensus estimate of $0.96.
The company's quarterly revenues amounted to $29.814 bln (-7.3% y/y), missing analysts' consensus estimate of $30.411 bln.
VZ fell to $48.05 (-1.82%) in pre-market trading.
-
12:05
Orders
EUR/USD
Offers: 1.0750-60 1.0780 1.0800 1.0830 1.0850
Bids: 1.0720 1.0700 1.0680-85 1.0650 1.0635 1.0620 1.0600
GBP/USD
Offers: 1.2850 1.2880 1.2900 1.2920 1.2950-60 1.2975 1.3000
Bids: 1.2800 1.2770-75 1.2760 1.2750 1.2720 1.2700 1.2680 1.2650
EUR/JPY
Offers: 117.00 117.30 117.50 117.80 118.00 118.50
Bids: 116.50 116.30 116.00 115.80-85 115.50 115.20 115.00
EUR/GBP
Offers: 0.8385 0.8400 0.8425-30 0.8445-50 0.8480 0.8500-05
Bids: 0.8360 0.8350 0.8335 0.8320 0.8300 0.8280 0.8260 0.8200
USD/JPY
Offers: 109.00 109.20 109.50 109.80 110.00 110.30 110.50
Bids: 108.70 108.50 108.30 108.00 107.80 107.50 107.00
AUD/USD
Offers: 0.7520 0.7530 0.7550 0.7580 0.7600
Bids: 0.7480-85 0.7465 0.7450 0.7400
-
12:04
Company News: Travelers (TRV) quarterly results miss analysts’ expectations
Travelers (TRV) reported Q1 FY 2017 earnings of $2.16 per share (versus $2.33 in Q1 FY 2016), missing analysts' consensus estimate of $2.38.
The company's quarterly revenues amounted to $6.183 bln (+3.4% y/y), missing analysts' consensus estimate of $6.252 bln.
TRV fell to $119.00 (-1.16%) in pre-market trading.
-
12:01
Company News: American Express (AXP) quarterly results beat analysts’ estimates
American Express (AXP) reported Q1 FY 2017 earnings of $1.34 per share (versus $1.45 in Q1 FY 2016), beating analysts' consensus estimate of $1.27.
The company's quarterly revenues amounted to $7.889 bln (-2.5% y/y), beating analysts' consensus estimate of $7.764 bln.
The company also reaffirmed guidance for FY 2017, projecting EPS of $5.60-5.80 versus analysts' consensus estimate of $5.65.
AXP rose to $77.50 (+2.58%) in pre-market trading.
-
11:28
Centrist candidate Macron to get 23 pct (unchanged) in 1st round of French election, Le Pen 22 pct (unchanged), Fillon 20 pct (unchanged), Melenchon 19 pct (unchanged) - Opinionway poll
-
Fillon would beat Le Pen in run-off vote by 57 pct to 43 pct if Fillon made it through to second round
-
Macron seen beating Le Pen in run-off vote by 65 pct to
-
-
10:46
Russia Central Bank head Nabiullina says short-term inflationary risks related to state fx purchases have not materialised. Central Bank may cut rate next week by up to 50 pct
-
Sovereign treasury bonds in yuan will set benchmark for companies
-
Fx state purchases have limited impact on rouble
-
Monetary policy to remain moderately tight to stabilise inflation near 4 pct
-
Inflation reached 4.1 pct as of april 17
-
-
09:51
Bulgaria jan-feb current account posts surplus of 0.7 pct/gdp vs surplus of 0.2 pct/gdp yr ago- Central Bank
-
08:47
Forex option contracts rolling off today at 14.00 GMT:
EURUSD: 1.0500-10 (EUR 1.42bln) 1.0570-80 (790m) 1.0600 (643m) 1.0650-60 (790m)1.0700-05 (490m) 1.0720-25 (1.4bln) 1.0750-55 (440m) 1.0780 (480m) 1.0800 (410m) 1.0830 (785m)
USDJPY: 108.00 (USD 1.1bln) 108.50-60 (1.4bln) 108.85 (240m) 109.00 (2.5bln) 109.25 (415m) 109.50 (502m) 110.00 (1.1bln)
GBPUSD 1.2500 (GBP 725m) 1.2620 (198m)
EURGBP 0.8500 (EUR 230m)
USDCHF 0.9920 (USD 215m) 0.9975 (240m) 1.0055 (210m) 1.0090-1.0100 (655m)
AUDUSD 0.7450 (475m) 0.7470 (200m) 0.7500 (300m) 0.7590-0.7600 (522m) 0.7660 (743m)
USDCAD 1.3340-50 (USD 545m) 1.3500 (381m)
NZDUSD 0.7025-30 (NZD 257m)
-
08:32
Turkish presidential adviser Ertem says 2017 economic growth to be 4-4.5 percent with fund contributing 1-1.5 percentage points
-
Q1 growth to be somewhat better than q4
-
Banks provide credit under guarantee fund at average rate of 14 percent, expects rate to fall
-
Aims for credit guarantee fund to reach volume of 180-200 bln lira by end-year
-
Says 137.3 bln lira of loans have been provided under credit guarantee fund
-
-
07:47
Major European stock exchanges trading in the green zone: FTSE 7126.45 +12.09 + 0.17%, DAX 12019.81 +3.36 + 0.03%, CAC 5029.16 +25.43 + 0.51%
-
07:46
Saudi energy minister Falih says there is initial agreement that we may need to extend oil cuts but more talks needed
-
07:14
Bank of France's Villeroy says any temptation to go back on tighter banking regulation would increase risk of another financial crisis
-
Attitude of new US administration will be key regarding financial regulation
-
-
07:13
Iraq supports extension of OPEC oil supply cuts, may ask for exemption, says leader of Iraqi ruling coalition
-
06:50
Mixed start of trading expected on the main European stock exchanges: DAX -0.1%, CAC40 flat, FTSE -0.5%
-
06:38
Options levels on thursday, April 20, 2017
EUR/USD
Resistance levels (open interest**, contracts)
$1.0846 (1052)
$1.0808 (466)
$1.0785 (177)
Price at time of writing this review: $1.0724
Support levels (open interest**, contracts):
$1.0688 (590)
$1.0651 (504)
$1.0603 (817)
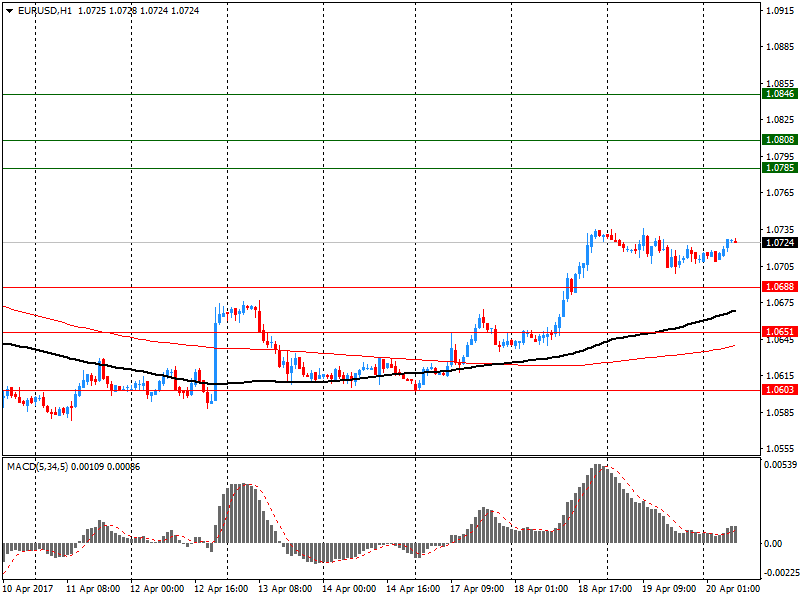
Comments:
- Overall open interest on the CALL options with the expiration date June, 9 is 61508 contracts, with the maximum number of contracts with strike price $1,1100 (5052);
- Overall open interest on the PUT options with the expiration date June, 9 is 63087 contracts, with the maximum number of contracts with strike price $1,0400 (5169);
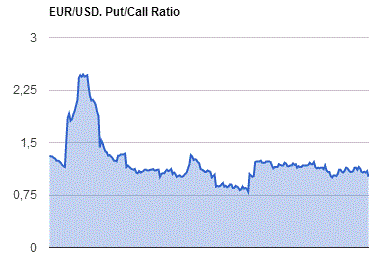
- The ratio of PUT/CALL was 1.03 versus 1.01 from the previous trading day according to data from April, 19
GBP/USD
Resistance levels (open interest**, contracts)
$1.3107 (1935)
$1.3009 (1330)
$1.2913 (1039)
Price at time of writing this review: $1.2819
Support levels (open interest**, contracts):
$1.2687 (218)
$1.2590 (1194)
$1.2493 (4601)
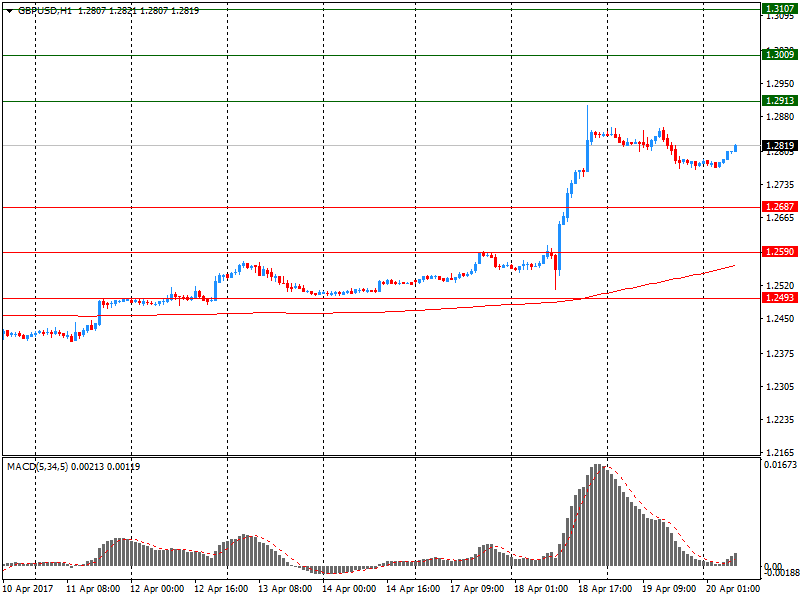
Comments:
- Overall open interest on the CALL options with the expiration date June, 9 is 19893 contracts, with the maximum number of contracts with strike price $1,2800 (2252);
- Overall open interest on the PUT options with the expiration date June, 9 is 25858 contracts, with the maximum number of contracts with strike price $1,2500 (4601);
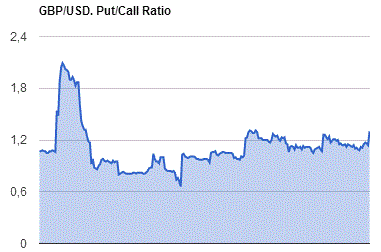
- The ratio of PUT/CALL was 1.30 versus 1.14 from the previous trading day according to data from April, 19
* - The Chicago Mercantile Exchange bulletin (CME) is used for the calculation.
** - Open interest takes into account the total number of option contracts that are open at the moment.
-
06:17
Japanese trade balance surplus tops expectations
Japan had a merchandise trade surplus of 614.722 billion yen in March, the Ministry of Finance said, cited by rttnews.
That was shy of forecasts for a surplus of 605.6 billion yen following the upwardly revised 813.5 billion yen surplus in February (originally 813.389 billion yen).
Exports climbed 12.0 percent on year to 7.229 trillion yen, beating forecasts for an increase of 6.2 percent following the 11.3 percent jump in the previous month.
Imports added an annual 15.8 percent to 6.614 trillion yen versus expectations for a gain of 10.2 percent after adding just 1.2 percent a month earlier.
-
06:11
New Zeeland CPI rose more than expected in March. Highest in five years
The consumers price index (CPI) increased 2.2 percent in the year to the March 2017 quarter, Stats NZ said today. This is the highest annual increase since the September 2011 quarter, the last quarter affected by the rise in GST from 12.5 to 15 percent.
"Rising petrol prices along with the annual rise in cigarette and tobacco tax lifted inflation," prices senior manager Jason Attewell said. "Petrol prices in New Zealand are closely linked to global oil prices, and cigarettes and tobacco taxes rise in the March quarter each year".
Housing-related prices continued to increase, up 3.3 percent in the March 2017 year. Prices increased for newly built houses, excluding land (up 6.7 percent), and for housing rentals (up 2.3 percent). Newly built houses, excluding land, were up 8.0 percent in Auckland and 3.6 percent in Christchurch.
Transport prices (up 3.5 percent) made the second largest upward contribution, with petrol (up 12 percent) partially offset by falls in other private transport services (vehicle relicensing fees).
Prices fell for broadband and cellphone plans, as well as handsets. Improvements to speed and data capacity improved the quality of the service, which is reflected as a price fall.
Excluding petrol, and cigarettes and tobacco, the CPI showed a 1.5 percent increase.
-
06:08
German producer prices for industrial products rose by 3.1%
In March 2017 the index of producer prices for industrial products rose by 3.1% compared with the corresponding month of the preceding year. Also in February 2017 the annual rate of change all over had been 3.1%, as reported by the Federal Statistical Office.
Compared with the preceding month February 2017 the overall index did not change in March 2017 (0.2% in February and 0.7% in January).
In March 2017 the price indices of all main industrial groups rose compared with March 2016: Energy prices increased by 4.5%, though prices of the different energy carriers diverged. Prices of petroleum products increased by 16.2%, whereas prices of natural gas (distribution) decreased by 7.2%. Prices of intermediate goods rose by 3.9%, prices of non-durable consumer goods by 2.7%. Prices of durable consumer goods increased by 1.2% and prices of capital goods by 1.0%.
-
06:00
Germany: Producer Price Index (MoM), March 0.0% (forecast 0.1%)
-
06:00
Germany: Producer Price Index (YoY), March 3.1% (forecast 3.2%)
-
05:32
Global Stocks
European stocks finished with moderate gains Wednesday, as investors assessed a stack of earnings reports a day after the market suffered its worst session in five months.
European stocks finished with moderate gains Wednesday, as investors assessed a stack of earnings reports a day after the market suffered its worst session in five months.
Asian stocks posted broad early gains Thursday after wide weakness Wednesday as investors eased up on worries. Some so-called havens - including sovereign debt, gold and the yen - pulled back overnight. That sentiment carried over into Asia.
-
01:31
Australia: NAB Quarterly Business Confidence, 6
-