Market news
-
15:40
Goldman Sachs (GS) can get a $ 2 billion profit for the assets in South Korea
One of the world's largest investment banks, Goldman Sachs Group (GS) can get a great return on the investment of $ 400 million in the manufacturer of industrial gases.
The bank is going to sell its stake in one of the largest industrial gas producers in South Korea. A potential deal could bring $ 2 billion, according to The Wall Street Journal, citing a person familiar with the details of the transaction.
Goldman, which owns a controlling stake in Daesung Industrial Gases, sent out the financial details of the operation to potential buyers, including private equity firms, the South Korean conglomerate and global competitors in the production of industrial gases, to assess the interest in the asset.
The purchase of this business is an intriguing prospect for private equity firms in Asia as controlling stakes in companies operating in high-yielding sectors are rarely put up for sale in this region. South Korean banks are also willing to finance the deal with high levels of profitability and low interest rates.
-
15:12
The impact on financial markets of a victory for far-right candidate Marine Le Pen in next year's French presidential elections would be a far more seismic event than the Brexit vote or Donald Trump winning the U.S. presidency, analysts say
-
14:51
U.S. service sector companies reported another robust increase - Markit
Adjusted for seasonal influences, the Markit Flash U.S. Services PMI Business Activity Index1 registered 54.7 in November. This was down only fractionally from 54.8 in October and the secondstrongest seen over the past 12 months. As a result, the average reading so far in Q4 points to the fastest upturn in business activity since the final quarter of 2015.
Commenting on the flash PMI data, Chris Williamson, Chief Business Economist at IHS Markit said: "The November PMI surveys provide the first snapshot of US business conditions in the wake of the surprise election result, and show a reassuring picture of sustained solid economic expansion and hiring. "With businesses in the vast service sector also showing improved confidence about the year ahead as election uncertainty cleared, the surveys give a clear green light for the Fed to hike interest rates in December".
-
14:46
U.S.: Services PMI, November 54.7 (forecast 54.8)
-
13:45
Option expiries for today's 10:00 ET NY cut
EUR/USD 1.0600 (EUR 1.82bln) 1.0650 (756m) 1.0700 (510m) 1.0800 (1.03bln)
USD/JPY 110.50 (USD 1.06bln)
USD/CAD 1.3500 (USD 867m)
-
13:38
Mixed US data: trade balance little changed, wholesale inventories improved
The international trade deficit was $62.0 billion in October, up $5.5 billion from $56.5 billion in September. Exports of goods for October were $122.1 billion, $3.4 billion less than September exports. Imports of goods for October were $184.1 billion, $2.1 billion more than September imports.
Advance Wholesale Inventories Wholesale inventories for October, adjusted for seasonal variations but not for price changes, were estimated at an end-of-month level of $586.9 billion, down 0.4 percent (±0.4 percent) from September 2016, and were down 0.5 percent (±1.4 percent)* from October 2015. The August 2016 to September 2016 percentage change was revised from up 0.1 percent (±0.2 percent)* to down 0.1 percent (±0.2 percent)
-
13:11
Fitch improved the outlook for the Russian transportation sector to "stable"
The international rating agency Fitch revised its outlook for the Russian rail sector and ratings of companies in the sector for 2017 to "stable" from "negative."
"The outlook revision is supported by our expectations of improving economic conditions and acceptable financial position of most rated companies in the sector".
-
13:09
U.K. post-Brexit economic data shows growth
According to Dow Jones, British firms appeared largely unfazed by the prospect of the U.K.'s exit from the European Union, official data showed Friday, with business investment slowing only slightly in the three months following June's Brexit vote.
The figures add to signs that the U.K. economy held up better than many had anticipated after the referendum, offering the first solid answer to fears that British companies would hold the economy back by scrapping or delaying their investment plans. But officials and analysts warn that a slowdown may still be in the cards when the U.K. launches official divorce proceedings early next year as planned.
-
12:52
Orders
EUR/USD
Offers : 1.0620-25 1.0645-50 1.0665 1.0685 1.0700 1.0730 1.0750
Bids : 1.0580 1.0560 1.0530 1.0515 1.0500 1.0475-80 1.0450 1.0400
GBP/USD
Offers : 1.2450-55 1.2470 1.2485 1.2500 1.2520 1.2535 1.25501.2570 1.2585 1.2600
Bids : 1.2400 1.2380 1.2360 1 .2340 1.2315-20 1.2300 1.2285 1.2250
EUR/GBP
Offers : 0.8550 0.8580-85 0.8600 0.8630-35 0.8650
Bids : 0.8520 0.8500 0.8475-80 0.8450 0.8420 0.8400 0.8380-85 0.8350
EUR/JPY
Offers : 119.850 120.00 120.45-50 121.00 121.50-55
Bids : 119.30 119.00 118.80 118.50 118.00 117.80 117.60 117.30 117.00
USD/JPY
Offers : 113.60 113.80 114.00 114.20 114.50 114.85 115.00 115.55-60
Bids : 113.20 113.00 112.80-85 112.50-60 112.20 112.00 111.85 111.50 111.30 111.00
AUD/USD
Offers : 0.7445-50 0.7475-80 0.7500-05 0.7520 0.7545-50 0.7580 0.7600
Bids : 0.7420 0.7400 0.7370 0.7355-60 0.7325-30 0.7300 0.7285 0.7250
-
11:07
UK retail sales volumes well above average - CBI
The survey of 126 firms, of which 61 were retailers, showed that sales volumes for the time of year were considered well above average and are expected to grow at a broadly similar pace in December.
The volume of orders placed upon suppliers inched up for the first time in eight months with a further slight increase expected for the year to December.
The increase in retail sales volumes was driven by the clothing and non-store goods sectors, as well hardware and DIY. Growth in internet sales volumes increased at a healthy pace over the same period, with expectations for growth in the year to December the strongest for two years.
-
11:00
United Kingdom: CBI retail sales volume balance, November 26 (forecast 12)
-
10:17
Italian retail trade index decreased by 0.6%
In September 2016 the seasonally adjusted retail trade index decreased by 0.6% with respect to August 2016 (-0.3% for food goods and -0.8% for non-food goods). The average of the last three months decreased with respect to the previous three months (-0.4%). The unadjusted index decreased by 1.4% with respect to September 2015
-
10:15
Renzi: Technocratic government is not in Italy's interest
-
Will not be available for talks with Berlusconi if he loses the vote
-
2017 will be a key year for Europe with issues on immigration and economic policy which have not been dealt with properly
-
Referendum vote is not about my future
-
-
09:36
UK business investment improves above expectations
Gross fixed capital formation (GFCF), in volume terms, was estimated to have increased by 1.1% to £79.0 billion between Quarter 2 (Apr to June) 2016 and Quarter 3 (July to Sept) 2016.
Between Quarter 2 2016 and Quarter 3 2016, business investment, in volume terms, was estimated to have increased by 0.9%, from £43.8 billion to £44.2 billion.
Between Quarter 3 2015 and Quarter 3 2016, GFCF was estimated to have increased by 1.2%, from £78.0 billion to £79.0 billion.
-
09:35
UK index of services rose 2.9% y/y. GBP/USD little changed
This release shows that services output increased by 0.2% between August 2016 and September 2016. The Index of Services was estimated to have increased by 2.9% in September 2016 compared with September 2015. All of the 4 main components of the services industries increased in the most recent month compared with the same month a year ago.
The 0.2% growth in services between August 2016 and September 2016 follows growth of 0.3% between July 2016 and August 2016, which is revised up 0.1 percentage points from the previous estimat
-
09:33
UK Q3 GDP unrevised at the second estimate
UK GDP in volume terms was estimated to have increased by 0.5% between Quarter 2 (Apr to June) 2016 and Quarter 3 (July to Sept) 2016, unrevised from the preliminary estimate of gross domestic product published on 27 October 2016. This is the 15th consecutive quarter of positive growth since Quarter 1 (Jan to Mar) 2013.
The reporting period for this release covers Quarter 3 2016, and therefore includes data for the whole period after the EU referendum. Since the result, growth in gross domestic product (GDP) has been in line with recent trends. This suggests limited effect so far from the referendum.
Between Quarter 3 2015 and Quarter 3 2016, GDP in volume terms increased by 2.3%, unrevised from the previously published estimate
-
09:30
United Kingdom: GDP, q/q, Quarter III 0.5% (forecast 0.5%)
-
09:30
United Kingdom: GDP, y/y, Quarter III 2.3% (forecast 2.3%)
-
09:10
Italian industrial sales decline significantly in September
In September 2016 the seasonally adjusted turnover index decreased by -4.6% compared to the previous month (-5.5% in domestic market and -2.8% in non-domestic market). The percentage change of the average of the last three months compared to the previous three months was +2.3% (+2.5% in domestic market and +1.8% in non-domestic market).
In September 2016 the seasonally adjusted industrial new orders index decreased by -6.8% compared with August 2016 (-9.3% in domestic market and -3.1% in non-domestic market). The percentage change of the average of the last three months compared to the previous three months was +1.7% (+6.6% in domestic market and -4.4% in non-domestic market).
-
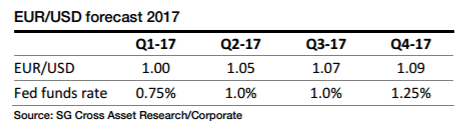
07:53
Societe Generale says its now or never for EUR/USD parity
"The bullish US macro-economic 'reset' following the election success of Donald Trump has governed financial markets and sparked the bond market rout and USD buying but it is the threat of political tail risk and splintering of Europe that could decide if EUR/USD tests parity for the first time since 2002.
1. Same place, different time The election victory of Trump was the catalyst for EUR/USD to retreat below 1.06 and close in on levels only observed three times since early 2015. EUR/USD traded at a 1.0458 low shortly after the ECB launched the first purchases of government bonds in March 2015. This marked a bottom that would be followed by a rise to 1.1467 in May. The 1.05 level was revisited in the lead-up to the ECB meeting nearly a year ago on 3 December when President Draghi had signalled strong policy action. In the event, the ECB disappointed and EUR/USD shot up from a 1.0524 low to a high of 1.1376 in February.
2. Parallels with 2013 Italian election? The last leg of EUR/USD to below 1.06 coincided with the widening of 10y Italian BTP/Bund yields to just over 180bp on Friday, the highest level since May 2014. This coincided with a rise in the co-movement (Rsq) between the two variables to 0.44. This compares with an Rsq of just 0.15 for EUR/USD and the 10y US/EUR IRS spread. Closer analysis shows that 10y Italian yields became unstuck and started moving away from 1.40% towards 2.10% two weeks before the US election, but this was not picked up by EUR/USD as it rallied from 1.0880 to 1.1140 before the US election on 7 November. However, this has changed over the past week.
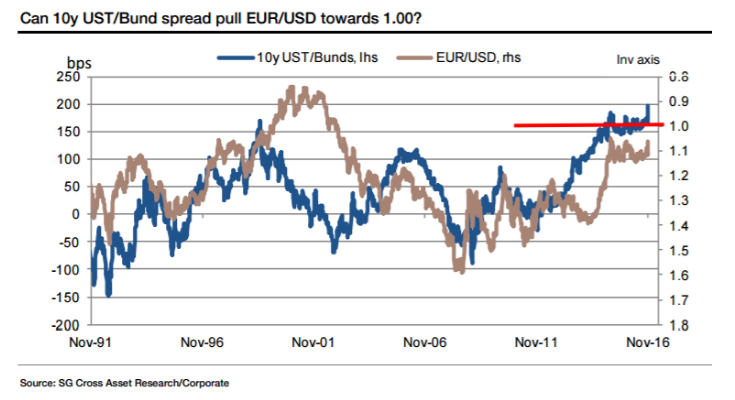
3. And then there is the US The timing and scale of the USD upswing caught virtually everyone by surprise. A clear out of dollar assets was anticipated on a Trump victory, but the U-turn we got instead was not pencilled in until later once the administration had laid out the specifics of its pro-growth and low-tax election agenda.
We expect EUR/USD to touch parity in 1Q 2017 before rising back to 1.09 by the end of 2017. The forecast is based on two rate increases by the Fed next year, but this comes with the risk of more. Before the election of Trump we had anticipated a peak for the Fed funds rate this cycle of 1.25%-1.50%, but we now look for 1.75%-2.0%. For the ECB, our economists believe tapering will start in March with the objective of ending asset purchases in early 2018, market conditions permitting".
Copyright © 2016 Societe Generale, eFXnews™
-
07:48
Option expiries for today's 10:00 ET NY cut
EUR/USD 1.0600 (EUR 1.82bln) 1.0650 (756m) 1.0700 (510m) 1.0800 (1.03bln)
USD/JPY 110.50 (USD 1.06bln)
USD/CAD 1.3500 (USD 867m)
-
07:23
Whether EUR/USD Will Hit Parity Depends on ECB's QE Pace - Mizuho Bank
-
07:21
Dairy products led a rise in total exports from New Zeeland
Dairy products led a rise in total exports in October, but meat and offal exports were down from the same month last year, Statistics New Zealand said today.
In October 2016, total goods exports rose $85 million (2.2 percent). Dairy exports rose $122 million (13 percent) to $1.1 billion. Butter rose $61 million (29 percent) and milk powder rose $57 million (12 percent).
"We exported more butter for a higher price this month than October last year," international statistics manager Jason Attewell said. "We also exported more milk powder, but prices were similar."
In October, meat and edible offal exports, our second-largest export commodity group, fell $71 million (18 percent) from October 2015. Beef and lamb exports to the key market of China were down.
Other significant commodity group changes were forestry products, up $74 million (25 percent), and fruit, up $42 million (40 percent), led by kiwifruit (up $33 million).
-
07:17
Japan national consumer price index higher than expected
The National Consumer Price Index published by the Statistics Bureau of Japan, rose 0.1% in October, higher than the forecast of 0.0% and the previous value of -0.5% year on year. This indicator reflects the assessment of price movements obtained by comparison of the retail prices of the relevant basket of goods and services and is the most important barometer of changes in purchasing trends.
Also, core CPI was in line with expectations and amounted to -0.4%. The previous value 0.5%. As can be seen from the data, inflation in Japan was ultimately a little better than expected. Some of the readings in line with expectations, some of them up, no one below.
-
06:10
Options levels on friday, November 25, 2016:
EUR/USD
Resistance levels (open interest**, contracts)
$1.0829 (3533)
$1.0753 (1375)
$1.0691 (993)
Price at time of writing this review: $1.0569
Support levels (open interest**, contracts):
$1.0467 (3539)
$1.0413 (4418)
$1.0346 (2013)
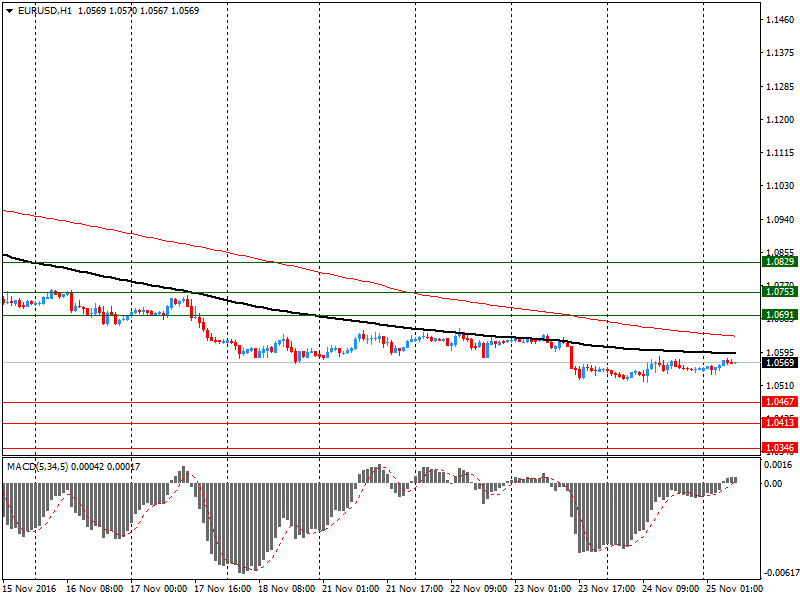
Comments:
- Overall open interest on the CALL options with the expiration date December, 9 is 76698 contracts, with the maximum number of contracts with strike price $1,1400 (6331);
- Overall open interest on the PUT options with the expiration date December, 9 is 64829 contracts, with the maximum number of contracts with strike price $1,0500 (4418);
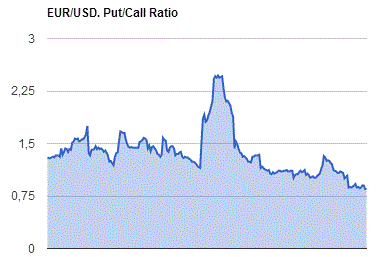
- The ratio of PUT/CALL was 0.85 versus 0.85 from the previous trading day according to data from November, 23
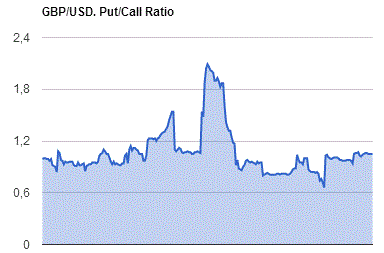
GBP/USD
Resistance levels (open interest**, contracts)
$1.2702 (1854)
$1.2604 (1495)
$1.2508 (1800)
Price at time of writing this review: $1.2447
Support levels (open interest**, contracts):
$1.2392 (1405)
$1.2295 (4023)
$1.2197 (1099)
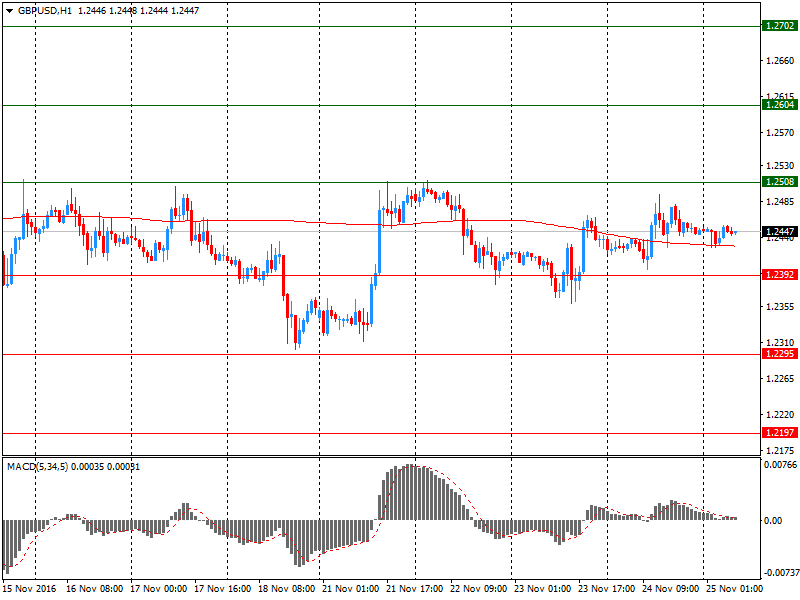
Comments:
- Overall open interest on the CALL options with the expiration date December, 9 is 35053 contracts, with the maximum number of contracts with strike price $1,3400 (2560);
- Overall open interest on the PUT options with the expiration date December, 9 is 36717 contracts, with the maximum number of contracts with strike price $1,2300 (4023);
- The ratio of PUT/CALL was 1.05 versus 1.05 from the previous trading day according to data from November, 23
* - The Chicago Mercantile Exchange bulletin (CME) is used for the calculation.
** - Open interest takes into account the total number of option contracts that are open at the moment.
-