Market news
-
23:29
Commodities. Daily history for Mar 22’02’2017:
(raw materials / closing price /% change)
Oil 48.17 +0.27%
Gold 1,247.80 -0.15%
-
23:29
Stocks. Daily history for Mar 22’2017:
(index / closing price / change items /% change)
Nikkei -414.50 19041.38 -2.13%
TOPIX -33.22 1530.20 -2.12%
Hang Seng -272.71 24320.41 -1.11%
CSI 300 -16.30 3450.05 -0.47%
Euro Stoxx 50 -8.92 3420.70 -0.26%
FTSE 100 -53.62 7324.72 -0.73%
DAX -58.01 11904.12 -0.48%
CAC 40 -7.73 4994.70 -0.15%
DJIA -6.71 20661.30 -0.03%
S&P 500 +4.43 2348.45 +0.19%
NASDAQ +27.82 5821.64 +0.48%
S&P/TSX +35.33 15348.46 +0.23%
-
23:27
Currencies. Daily history for Mar 22’2017:
(pare/closed(GMT +2)/change, %)
EUR/USD $1,0792 -0,13%
GBP/USD $1,2478 +0,03%
USD/CHF Chf0,9916 -0,22%
USD/JPY Y111,25 -0,47%
EUR/JPY Y120,07 -0,59%
GBP/JPY Y138,81 -0,43%
AUD/USD $0,7673 -0,14%
NZD/USD $0,7040 -0,01%
USD/CAD C$1,3331 -0,16%
-
22:58
Schedule for today,Thursday, Mar 23’2017 (GMT0)
07:00 Germany Gfk Consumer Confidence Survey April 10.0 10
09:00 Eurozone ECB Economic Bulletin
09:15 United Kingdom MPC Member Dr Ben Broadbent Speaks
09:30 United Kingdom Retail Sales (MoM) February -0.3% 0.4%
09:30 United Kingdom Retail Sales (YoY) February 1.5% 2.6%
11:00 United Kingdom CBI retail sales volume balance March 9 5
12:30 U.S. Continuing Jobless Claims 2030 2035
12:30 U.S. Initial Jobless Claims 241 240
12:45 U.S. Fed Chairman Janet Yellen Speaks
14:00 Belgium Business Climate March -1.1 -0.3
14:00 U.S. New Home Sales February 555 565
15:00 Eurozone Consumer Confidence (Preliminary) March -6.2 -5.7
16:30 U.S. FOMC Member Kashkari Speaks
21:45 New Zealand Trade Balance, mln February -285 160
23:00 U.S. FOMC Member Kaplan Speak
-
20:06
The main US stock indexes finished trading mostly in positive territory

The main stock indexes mainly grew, as the decline of the conglomerate sector was offset by the growth of shares of technology companies.
At the same time, market participants are increasingly doubting that Trump will be able to quickly and fully agree on all the promised reforms in Congress.
The focus was also on statistics for the United States. In January, housing prices remained at the same level in accordance with the monthly housing price index (HPI) of the Federal Housing Finance Agency. HPI reflects positive monthly increases from the beginning of 2012, with the exception of November 2013 and January 2017. The previously reported increase of 0.4% in December was confirmed. From January 2016 to January 2017, house prices rose 5.7%.
Meanwhile, the National Association of Realtors reported that in the US, home sales in the secondary market fell more than expected in February amid a continuing shortage of homes in the market. Sales of housing on the secondary market decreased by 3.7 percent and, taking into account seasonal fluctuations, reached an annual level of 5.48 million units. The pace of sales in January was not revised and remained at the level of 5.69 million units, which was the highest since February 2007. Economists predicted that sales would fall 2.0 percent to 5.57 million units. Sales increased 5.4 percent compared to February 2016, which underlines the sustainability of the housing market recovery, despite the growth in mortgage rates. Demand for housing is currently supported by the labor market, which has reached almost full employment. But home sales continue to be constrained by the shortage of homes available for sale, which leads to higher prices. The average price of the house increased by 7.7 percent compared to a year earlier to $ 228,400 in February. This marked the 60th consecutive month of annual growth in prices.
The components of the DOW index have mostly grown (19 out of 30). More shares fell NIKE, Inc. shares. (NKE, -6.94%). The leader of growth was shares of Microsoft Corporation (MSFT, + 1.31%).
The S & P sector finished the session mostly in positive territory. The conglomerate sector fell most of all (-0.4%). The leader of growth was the technological sector (+ 0.5%).
At closing:
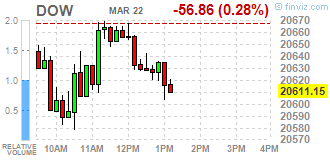
Dow -0.03% 20.661.37 -6.64
Nasdaq + 0.48% 5,821.64 +27.81
S & P + 0.19% 2,348.45 +4.43
-
20:00
New Zealand: RBNZ Interest Rate Decision, 1.75% (forecast 1.75%)
-
19:00
DJIA -0.08% 20,651.03 -16.98 Nasdaq +0.38% 5,815.60 +21.77 S&P +0.14% 2,347.37 +3.35
-
17:16
Wall Street. Major U.S. stock-indexes little changed
Major U.S. stock-indexes little changed on Wednesday as investors sought bargains a day after the major indexes posted their biggest one-day loss since before the election.


Dow stocks mixed (15 in positive area, 15 in negative area). Top loser - NIKE, Inc. (NKE-6.38%). Top gainer - Microsoft Corporation (MSFT, +1.06%).
S&P sectors also mixed. Top loser - Conglomerates (-0.6%). Top gainer - Utilities (+0.4%).
At the moment:
Dow 20560.00 -67.00 -0.32%
S&P 500 2339.00 -3.25 -0.14%
Nasdaq 100 5353.25 +15.00 +0.28%
Oil 47.81 -0.43 -0.89%
Gold 1249.00 +2.50 +0.20%
U.S. 10yr 2.40 -0.04
-
17:00
European stocks closed: FTSE 100 -53.62 7324.72 -0.73% DAX -58.01 11904.12 -0.48% CAC 40 -7.73 4994.70 -0.15%
-
15:27
Hearing Reports Of Gunshots Outside UK Parliament - Reuters
-
15:26
Given Britain's intention to leave the single market and customs union, new partnership with Britain will never generate same benefits as EU membership - Barnier says
-
EU agrees with Britain's May in desire to have a bold and ambitious free trade agreement
-
Calls for continued EU-British cooperation on security and defence, security cannot be bargaining chip in trade talks
-
EU does not entertain scenario of no deal on future partnership with Britain after Brexit
-
There can be no "a la carte" participation in single market for Britain
-
Market access and trading will continue, will need to be based on a level playing field
-
Particularly concerned to clear up uncertainties about Irish-British border, wants to support good-friday agreement in Ireland
-
-
15:10
EU's chief Brexit negotiator Barnier outlines conditions necessary for reaching an agreement with Britain on exit from EU
-
14:35
U.S. commercial crude oil inventories increased by 5.0 million barrels from the previous week, more than expected
U.S. commercial crude oil inventories (excluding those in the Strategic Petroleum Reserve) increased by 5.0 million barrels from the previous week. At 533.1 million barrels, U.S. crude oil inventories are at the upper limit of the average range for this time of year.
Total motor gasoline inventories decreased by 2.8 million barrels last week, but are near the upper half of the average range. Finished gasoline inventories remained unchanged while blending components inventories decreased last week.
Distillate fuel inventories decreased by 1.9 million barrels last week but are in the upper half of the average range for this time of year. Propane/propylene inventories fell 0.1 million barrels last week but are in the middle of the average range. Total commercial petroleum inventories increased by 1.3 million barrels last week
-
14:30
U.S.: Crude Oil Inventories, March 4.954 (forecast 2801)
-
14:22
US existing-home sales slid in February - National Association of Realtors
After starting the year at the fastest pace in almost a decade, existing-home sales slid in February but remained above year ago levels both nationally and in all major regions, according to the National Association of Realtors.
Total existing-home sales, which are completed transactions that include single-family homes, townhomes, condominiums and co-ops, retreated 3.7 percent to a seasonally adjusted annual rate of 5.48 million in February from 5.69 million in January. Despite last month's decline, February's sales pace is still 5.4 percent above a year ago.
-
14:00
U.S. house prices remained flat in January according to the Federal Housing Finance Agency
U.S. house prices remained flat in January according to the Federal Housing Finance Agency (FHFA) seasonally adjusted monthly House Price Index (HPI). The HPI has reflected positive monthly increases since early 2012, except for November 2013 and January 2017, when house prices were flat on a month-over-month basis. The previously reported 0.4 percent increase in December remains unrevised.
The FHFA monthly HPI is calculated using home sales price information from mortgages sold to, or guaranteed by, Fannie Mae and Freddie Mac. From January 2016 to January 2017, house prices were up 5.7 percent.
-
14:00
U.S.: Existing Home Sales , February 5.48 (forecast 5.57)
-
13:40
Option expiries for today's 10:00 ET NY cut
EURUSD: 1.0680 (EUR 850m) 1.0720-25 (380m) 1.0740-50 (735m) 1.0775 (386m)
USDJPY: 112.00 (USD 250m) 112.40 (260m) 112.75 (282m) 113.00 (613m) 113.50 (680m)
AUDUSD: 0.7480 (AUD 670m) 0.7500 (920m) 0.7550 (180m) 0.7685-90 (520m) 0.7750 (1.1bln)
USDCAD 1.3200 (USD 200m) 1.3275 (305m) 1.3325 (425m) 1.3350 (300m) 1.3380 (635m) 1.3400 (220m)
NZDUSD: 0.7000 (NZD 227m) 0.7100 (372m)
EURJPY: 122.50 (EUR 270m)
-
13:32
U.S. Stocks open: Dow -0.13%, Nasdaq -0.03%, S&P -0.08%
-
13:17
Before the bell: S&P futures -0.05%, NASDAQ futures -0.04%
U.S. stock-index futures were flat amid rising worries about the ability of President Donald Trump to deliver on his campaign promises of cutting taxes.
Global Stocks:
Nikkei 19,041.38 -414.50 -2.13%
Hang Seng 24,320.41 -272.71 -1.11%
Shanghai 3,245.45 -16.16 -0.50%
FTSE 7,317.21 -61.13 -0.83%
CAC 4,979.75 -22.68 -0.45%
DAX 11,903.82 -58.31 -0.49%
Crude $47.57 (-1.39%)
Gold $1,247.00 (+0.04%)
-
13:00
U.S.: Housing Price Index, m/m, January 0.0% (forecast 0.4%)
-
12:59
Orders
EUR/USD
Offers: 1.0820 1.0830 1.0850 1.0880 1.0900
Bids: 1.0780 1.0750 1.0730 1.0700 1.0680 1.0650
GBP/USD
Offers: 1.2500-05 1.2520 1.2550-55 1.2580 1.2600
Bids: 1.2465 1.2450 1.2425-30 1.2400 1.2380 1.2360 1.2335-40 1.2320 1.2300
EUR/JPY
Offers: 120.25 120.50 12.85 121.00 121.50 121.85 122.00
Bids: 119.75-80 119.50 119.30 119.00 118.80 118.65 118.50
EUR/GBP
Offers: 0.8670 0.8685 0.8700 0.8725-30 0.8750 0.8780-85 0.8800
Bids: 0.8630-35 0.8600 0.8580-85 0.8550 0.8530 0.8500
USD/JPY
Offers: 111.65 111.80 112.00 112.25 112.50 112.80 113.00 113.25-30 113.50
Bids: 111.20-25 111.00 110.80 110.65 110.50 110.35 110.20 110.00
AUD/USD
Offers: 0.7680-85 0.7700 0.7720 0.0.7735 0.7750
Bids: 0.7645-50 0.7625 0.7600 0.7580 0.7565 0.7550 0.7500
-
12:51
Wall Street. Stocks before the bell
(company / ticker / price / change ($/%) / volume)
3M Co
MMM
192.49
0.36(0.19%)
208
ALCOA INC.
AA
33.3
0.08(0.24%)
6178
ALTRIA GROUP INC.
MO
75.57
-0.36(-0.47%)
425
Amazon.com Inc., NASDAQ
AMZN
841.24
-1.96(-0.23%)
11358
American Express Co
AXP
77.4
-0.13(-0.17%)
295
AMERICAN INTERNATIONAL GROUP
AIG
61.65
-0.11(-0.18%)
100
Apple Inc.
AAPL
139.52
-0.32(-0.23%)
174737
AT&T Inc
T
42.12
0.04(0.10%)
2909
Barrick Gold Corporation, NYSE
ABX
19.62
0.17(0.87%)
61753
Boeing Co
BA
175.51
-0.45(-0.26%)
1060
Caterpillar Inc
CAT
92.35
-0.08(-0.09%)
6043
Chevron Corp
CVX
107.59
-0.45(-0.42%)
3458
Cisco Systems Inc
CSCO
33.62
-0.26(-0.77%)
8377
Citigroup Inc., NYSE
C
57.8
-0.24(-0.41%)
31686
Exxon Mobil Corp
XOM
81.6
-0.23(-0.28%)
1210
Facebook, Inc.
FB
138.29
-0.22(-0.16%)
72455
FedEx Corporation, NYSE
FDX
196.5
4.66(2.43%)
41789
Ford Motor Co.
F
11.78
0.06(0.51%)
51667
Freeport-McMoRan Copper & Gold Inc., NYSE
FCX
12.7
0.13(1.03%)
64740
General Electric Co
GE
29.48
0.09(0.31%)
37302
General Motors Company, NYSE
GM
34.5
-0.05(-0.14%)
32004
Goldman Sachs
GS
232
-1.00(-0.43%)
13238
Google Inc.
GOOG
828.85
-1.61(-0.19%)
1812
Hewlett-Packard Co.
HPQ
17
-0.15(-0.87%)
1039
Home Depot Inc
HD
146.58
-0.03(-0.02%)
1863
Intel Corp
INTC
35.11
0.07(0.20%)
7001
International Business Machines Co...
IBM
174.11
0.23(0.13%)
686
Johnson & Johnson
JNJ
126.87
-0.38(-0.30%)
1679
JPMorgan Chase and Co
JPM
87.1
-0.29(-0.33%)
70052
McDonald's Corp
MCD
127.98
-0.54(-0.42%)
463
Merck & Co Inc
MRK
63.5
-0.41(-0.64%)
2058
Microsoft Corp
MSFT
64.05
-0.16(-0.25%)
11524
Nike
NKE
54.83
-3.18(-5.48%)
786595
Pfizer Inc
PFE
34.05
-0.20(-0.58%)
4035
Starbucks Corporation, NASDAQ
SBUX
55.34
-0.20(-0.36%)
4715
Tesla Motors, Inc., NASDAQ
TSLA
252.02
1.34(0.53%)
21906
The Coca-Cola Co
KO
42.64
0.14(0.33%)
436
Twitter, Inc., NYSE
TWTR
14.58
0.04(0.28%)
41344
Verizon Communications Inc
VZ
50.1
-0.06(-0.12%)
1509
Visa
V
87.6
-0.46(-0.52%)
1314
Walt Disney Co
DIS
111.3
-0.45(-0.40%)
1097
Yahoo! Inc., NASDAQ
YHOO
45.56
-0.21(-0.46%)
1512
Yandex N.V., NASDAQ
YNDX
22.2
0.02(0.09%)
5500
-
12:49
Upgrades and downgrades before the market open
Upgrades:
Freeport-McMoRan (FCX) upgraded to Hold from Sell at Berenberg
Downgrades:
Other:
Nike (NKE) target lowered to $66 from $68 at Stifel
-
12:21
Company News: Nike (NKE) reported mixed quarterly results
Nike reported Q3 FY 2017 earnings of $0.68 per share (versus $0.55 in Q3 FY 2016), beating analysts' consensus estimate of $0.53.
The company's quarterly revenues amounted to $8.432 bln (+5% y/y), generally in-line with analysts' consensus estimate of $8.467 bln.
The company also revealed its worldwide futures were down 4% in Q3 and announced it expected its revenues to grow in the mid-single digit range in Q4 (slightly below Q3 reported rate of growth).
NKE fell to $54.76 (-5.60%) in pre-market trading.

-
12:18
Company News: FedEx (FDX) posts mixed quarterly results
FedEx reported Q3 FY 2017 earnings of $2.35 per share (versus $2.51 in Q3 FY 2016), missing analysts' consensus estimate of $2.62.
The company's quarterly revenues amounted to $15.00 bln (+18.1% y/y), being in-line with analysts' consensus estimate.
The company also reaffirmed guidance for FY 2017, projecting EPS of $11.85-12.35 versus analysts' consensus estimate of $11.93.
FDX rose to $197.24 (+2.81 %) in pre-market trading.

-
11:55
ECB's Lautenschlaeger: there will be a transitional period in which new euro area entities might use internal models that have not yet been approved by the ECB
-
The transitional period will cease as soon as we have approved or rejected the bank's model application
-
Eurogroup head Dijsselbloem's comments on southern countries were "wrong"
-
We are aware that it is a burden for UK banks to apply for a new licence in the EU
-
With a view to internal models, we would aim to be accommodating regarding the timing
-
-
11:32
Fillon would beat Le Pen in run-off vote by 56 pct to 44 pct if Fillon made it through to second round - Opinionway poll
-
Macron seen beating Le Pen in run-off vote by 62 pct
-
Far-right's Le Pen to get 26 pct (-1) in 1st round of French election, Macron 24 pct (unchanged), Fillon 19 pct (+1)
-
-
11:01
CIB Research expects the RBNZ to leave rates on hold this week, unlikely for the central bank to move to an easing bias that could weigh on NZD
Credit Agricole CIB Research expects the RBNZ to leave rates on hold this week arguing that it's unlikely for the central bank to move to an easing bias that could weigh on NZD.
CACIB outlines 5 reasons behind this view:
1- Governor Graeme Wheeler said two weeks ago said that "the risks around the OCR are equally weighted."
2- The RBNZ is likely to wait for an MPS and forecast review to do change its bias; this week is a simple OCR review.
3- The TWI has averaged below where the RBNZ had forecast for the quarter and has responded to weaker dairy prices.
4- Fonterra had kept its forecast pay out to dairy farmers for 2016/2017 constant for several months
5- Inflation expectations have jumped back up to 1.92% and close to the center of the RBNZ's inflation targeting band.
Source: Credit Agricole CIB Research, efxnews.
-
10:29
Protectionist trade policies may increase, rather than reduce, a country's trade deficit - ECB study
-
09:57
Bank of England agents report: fall in sterling was being passed through into higher manufacturing output and consumer goods price inflation
-
moderate rates of uk economic activity growth had continued overall
-
Retail sales expected to slow due to weaker sterling, exports had risen
-
Growth in labour costs per employee had remained subdued, pay settlements around 2-2.5 pct
-
Investment intentions had picked up, pointing to modest growth in spending in the year ahead
-
-
09:38
Britain's FTSE 100 extends losses, now down 0.9 percent at a two-week low
-
09:10
Clearly Not The Time For ECB To Stop Pursuing Accommodative Policies - Villeroy on Reuters
-
09:09
The current account of the euro area recorded a surplus of €24.1 billion in January 2017
The current account of the euro area recorded a surplus of €24.1 billion in January 2017. This reflected surpluses for goods (€24.1 billion), primary income (€12.1 billion) and services (€3.5 billion), which were partly offset by a deficit for secondary income (€15.5 billion).
The 12-month cumulated current account for the period ending in January 2017 recorded a surplus of €357.9 billion (3.3% of euro area GDP), compared with one of €321.6 billion (3.1% of euro area GDP) for the 12 months to January 2016. This was due to increases in the surpluses for goods (from €346.8 billion to €366.3 billion), primary income (from €42.5 billion to €59.3 billion) and services (from €58.6 billion to €68.5 billion). These were partly offset by an increase in the deficit for secondary income (from €126.3 billion to €136.3 billion).
-
09:00
Eurozone: Current account, unadjusted, bln , January 2.5
-
08:38
The main European stock exchanges started trading in the red zone: FTSE 7336.85 -41.49 -0.56%, DAX 11878.88 -83.25 -0.70%, CAC 4973.47 -28.96 -0.58%
-
08:05
Hungary Central Bank's parragh says price developments should be monitored, but sees no inflation pressure that would limit room for monetary policy manoeuvre - Vilaggazdasag
-
07:52
Negative start of trading expected on major European stock markets: DAX -0.7%, CAC 40 -0.6%, FTSE -0.6%
-
07:34
Options levels on wednesday, March 22, 2017
EUR/USD
Resistance levels (open interest**, contracts)
$1.0947 (794)
$1.0923 (989)
$1.0878 (47)
Price at time of writing this review: $1.0798
Support levels (open interest**, contracts):
$1.0731 (663)
$1.0686 (388)
$1.0633 (608)
Comments:
- Overall open interest on the CALL options with the expiration date June, 9 is 41469 contracts, with the maximum number of contracts with strike price $1,1450 (3954)
- Overall open interest on the PUT options with the expiration date June, 9 is 44796 contracts, with the maximum number of contracts with strike price $1,0350 (4047);
- The ratio of PUT/CALL was 1.08 versus 1.11 from the previous trading day according to data from March, 21
GBP/USD
Resistance levels (open interest**, contracts)
$1.2713 (817)
$1.2617 (322)
$1.2522 (769)
Price at time of writing this review: $1.2478
Support levels (open interest**, contracts):
$1.2383 (540)
$1.2287 (245)
$1.2190 (428)
Comments:
- Overall open interest on the CALL options with the expiration date June, 9 is 14749 contracts, with the maximum number of contracts with strike price $1,3000 (1191);
- Overall open interest on the PUT options with the expiration date June, 9 is 17052 contracts, with the maximum number of contracts with strike price $1,1500 (3088);
- The ratio of PUT/CALL was 1.16 versus 1.15 from the previous trading day according to data from March, 21
* - The Chicago Mercantile Exchange bulletin (CME) is used for the calculation.
** - Open interest takes into account the total number of option contracts that are open at the moment.
-
07:31
Japan's trade balance surplus declined slightly in February
Japan had a merchandise trade surplus of 813.389 billion yen in February, the Ministry of Finance cited by rttnews.
That surpassed expectations for 807.2 billion yen following the downwardly revised 1,087.9 billion yen deficit (originally -1,086.9 billion yen) in January.
Exports jumped 11.3 percent on year, beating forecasts for 10.1 percent following the 1.3 percent gain in the previous month.
Imports added an annual 1.2 percent, missing expectations for 1.3 percent and down from 8.5 percent a month earlier.
-
07:30
South Korea says North Korea's latest missile test has ended in failure @AP
-
07:24
UK Prime Minister May rejects demands for Scots Referendum -Times
-
07:22
Bank of Japan meeting minutes
"The Bank, in accordance with the short-term policy interest rate of minus 0.1 percent and the target level of the long-term interest rate, both decided at the previous meeting on December 19 and 20, 2016, had been providing funds through purchases of Japanese government bonds (JGBs) and other measures.6 In this situation, 10-year JGB yields had been at around 0 percent, and the shape of the JGB yield curve had been consistent with the guideline for market operations.
In the money market, interest rates on both overnight and term instruments had generally been in negative territory. The uncollateralized overnight call rate had been in the range of around minus 0.03 to minus 0.06 percent. As for interest rates on term instruments, yields on three-month treasury discount bills (T-Bills) had been at around minus 0.3 percent recently. The Nikkei 225 Stock Average had fallen somewhat since the start of the year, reflecting the yen's appreciation against the U.S. dollar, but rebounded thereafter and had been more or less flat throughout the intermeeting period. In the foreign exchange market, the yen had been appreciating against the U.S. dollar since the start of the year, partly due to the decline in U.S. interest rates. Meanwhile, the yen had been essentially flat against the euro".
-
07:19
German Chancellor Merkel's Conservatives up 1% at 34%, rival Social Democrats (SPD) Down 1% at 31% @LiveSquawk
-
06:36
Global Stocks
European stocks finished with losses Tuesday, with French equities surrendering gains that came after respondents in a poll viewed center-right politician Emmanuel Macron as the winner of the first presidential debate ahead of this spring's elections.
U.S. stocks sank Tuesday as the Dow and the Nasdaq logged their worst daily drops since September, while the S&P 500 also tumbled the most in a single session in five months.
Stock markets pulled back as in early Asian trade on Wednesday following declines in stocks, the dollar and bond yields overnight, as investors re-evaluated their optimism around the 'Trump trade.'
-
04:36
Japan: All Industry Activity Index, m/m, January 0.1% (forecast 0.1%)
-
00:00
Commodities. Daily history for Mar 21’02’2017:
(raw materials / closing price /% change)
Oil 48.19 -0.10%
Gold 1,244.90 -0.13%
-