Noticias del mercado
-
21:01
U.S.: Consumer Credit , June 12.32 (forecast 17)
-
17:29
Gold daily overview: a substantially decline today
Gold price fallen by about $ 25, updating August lowa, move caused by a sharp strengthening of the US currency in response to the strong data on the US labor market.
The Labor Department said that employment in the US rose more than expected in July, which should support expectations of faster economic growth and increase the chance of the Fed raising interest rates this year. According to the data, the number of people employed in non-agricultural sector increased in July by 255 000 people, after rising 292,000 by the end of June. The unemployment rate remained unchanged at 4.9 percent, as more people entered the labor market. Economists had forecast that the number of people employed will increase by 180,000 in July and the unemployment rate will drop to 4.8 percent. Strong job growth should strengthen the Fed's confidence in the labor market, which officials see as at or near full employment. Fed Chair Yellen stated that the economy needs to create a little less than 100 000 jobs a month to keep up with population growth.
Futures on interest rates suggest that the market is now pricing in a 18% probability of a rate hike in September (from 9% yesturday) and 47% in December (last probability was 32%).
Deutsche Bank analyst Michael Xue said that investors will now control the movement of real return on 10-year US bonds, against which gold look overpriced. The Deutsche Bank expects that this year the Fed will increase interest rates once.
Physical gold sales in Asia remained sluggish this week, but the appetite is expected to increase with the approach to the festive season in India and China.
In addition, it became known that the gold reserves in the largest investment fund SPDR Gold Trust rose on Thursday to 0.37 percent, to 973.21 tonnes.
The cost of the August gold futures on COMEX fell to $ 1335.80 per ounce.
-
16:22
Canada: Ivey PMI rose sharply in July
The research results presented by the Association of purchasing managers in Canada and the Richard Ivey School of Business, have shown that the index of business activity incrased more than the experts' assessments.According to the report, the July business activity index rose to 57, compared with 51.7 in the previous month. Analysts had expected a value of 50.9 points.Recall, the indicator shows the level of business activity of the industrial sector. More than 150 managers from different regions and sectors are invited to assess the level of purchases compared to the previous month (above, below or at the same level). A reading above 50 indicates an increase in purchases, and a value below 50 indicates a decrease in volume.
In addition, more detailed information is shown:
- employment sub-index rose to 59.5 in June from 52.5, indicating that the activity was higher than in the previous month;
- inventories rose to 55.4 from 55.1, an increase of stocks compared to the previous month;
- prices fell to 57.5 from 59.7.
- delivery times fell to 44.7 from 47.3, indicating that the delivery times were longer than the previous month.
All figures are based on seasonally adjusted.
-
16:00
Canada: Ivey Purchasing Managers Index, July 57 (forecast 50.9)
-
14:59
US trade deficit higher than forecasts
The U.S. Census Bureau and the U.S. Bureau of Economic Analysis, through the Department of Commerce, announced today that the goods and services deficit was $44.5 billion in May, up $3.6 billion from $41.0 billion in May, revised. June exports were $183.2 billion, $0.6 billion more than May exports. June imports were $227.7 billion, $4.2 billion more than May imports.
The June increase in the goods and services deficit reflected an increase in the goods deficit of $3.8 billion to $66.0 billion and an increase in the services surplus of $0.3 billion to $21.5 billion.
Year-to-date, the goods and services deficit decreased $5.8 billion, or 2.3 percent, from the same period in 2015. Exports decreased $54.2 billion or 4.7 percent. Imports decreased $60.0 billion or 4.3 percent. -
14:45
Canadian trade deficit increased in June
Canada's imports increased 0.8% to $45.0 billion in June. Import volumes were up 0.7% and prices rose 0.2%. Exports increased 0.6% to $41.4 billion, as prices were up 2.0%, while volumes fell 1.4%. As a result, Canada's merchandise trade deficit with the world widened from $3.5 billion in May to a record $3.6 billion in June.
In the second quarter, imports decreased 1.4% to $134.7 billion. Exports dropped 4.7% to $124.0 billion, the largest decline since the second quarter of 2009. Consequently, Canada's quarterly trade deficit with the world widened from $6.4 billion in the first quarter of 2016 to a record $10.7 billion in the second quarter.
-
14:42
-
14:41
Canadian employment declined in July
After three months of little change, employment declined by 31,000 (-0.2%) in July. The unemployment rate increased 0.1 percentage point to 6.9%.
Full-time employment fell by 71,000 from June to July, while part-time work was up by 40,000.
Compared with 12 months earlier, total employment increased by 71,000 or 0.4%, with all of the growth in part-time work. Over the same period, the total number of hours worked rose by 0.4%.
In July, employment decreased among youths aged 15 to 24, while it was little changed for the other demographic groups.
Employment declined in Ontario and Newfoundland and Labrador, and increased in British Columbia and New Brunswick.
Fewer people were employed in public administration in July, while employment in health care and social assistance increased.
The number of public sector employees fell in July, and there was little change in the number of private sector employees and self-employed workers.
-
14:36
Dollar bid after better employment report
Total nonfarm payroll employment rose by 255,000 in July, and the unemployment rate was unchanged at 4.9 percent, the U.S. Bureau of Labor Statistics reported today. Job gains occurred in professional and business services, health care, and financial activities. Employment in mining continued to trend down.
The average workweek for all employees on private nonfarm payrolls increased by 0.1 hour to 34.5 hours in July. In manufacturing, the workweek was unchanged at 40.7 hours, while overtime increased by 0.1 hour to 3.3 hours. The average workweek for production and nonsupervisory employees on private nonfarm payrolls also increased by 0.1 hour to 33.7 hours.
In July, average hourly earnings for all employees on private nonfarm payrolls increased by 8 cents to $25.69. Over the year, average hourly earnings have risen by 2.6 percent. Average hourly earnings of private-sector production and nonsupervisory employees increased by 7 cents to $21.59 in July. -
14:31
Canada: Employment , July -31.2 (forecast 10)
-
14:31
U.S.: Average workweek, July 34.5 (forecast 34.4)
-
14:31
U.S.: Nonfarm Payrolls, July 255 (forecast 180)
-
14:30
U.S.: International Trade, bln, June -44.51 (forecast -43.1)
-
14:30
U.S.: Unemployment Rate, July 4.9% (forecast 4.8%)
-
14:30
Canada: Trade balance, billions, June -3.63 (forecast -2.84)
-
14:30
Canada: Unemployment rate, July 6.9% (forecast 6.9%)
-
14:30
U.S.: Average hourly earnings , July 0.3% (forecast 0.2%)
-
14:14
Today at 12:30 GMT the NFP will be published. Will it move the markets?
Private payrolls procesed by ADP, rose by 179,000 while employment remains the strongest pillar of the US economic recovery, despite the weak report in May. The market expects the US economy to add 150K-180K new jobs after a 287K gain in June. Improvements in wage growth and lower unemployment are also expected, which would boost the USD.
NFP expectations are lower than six months average, the most optimistic estimates around 180K, but jobs creation was steady despite other parts of the economy.
Remains to be seen if the report will move the markets or if the fundamentals are not in focus right now.
-
14:05
Orders
EUR/USD
Offers : 1.1250 1.1220 1.1200 1.1190 1.1180 1.1150
Bids: 1.1130 1.1115/20 1.1100 1.1070 1.1050 1.1030 1.1020
GBP/USD
Offers : 1.3300 1.3275/80 1.3260 1.3250 1.3220 1.3200 1.3180 1.3150
Bids: 1.3120 1.3100 1.3070 1.3050 1.3030 1.3020 1.3000
EUR/GBP
Offers : 0.8600 0.8580 0.8550 0.8540 0.8530 0.8500 0.8490
Bids: 0.8470 0.8450 0.8420 0.8400 0.8380 0.8360 0.8350
EUR/JPY
Offers : 114.00 113.50 113.00 112.90 112.70
Bids: 112.40 112.20 112.00/10 111.50 111.20 111.00
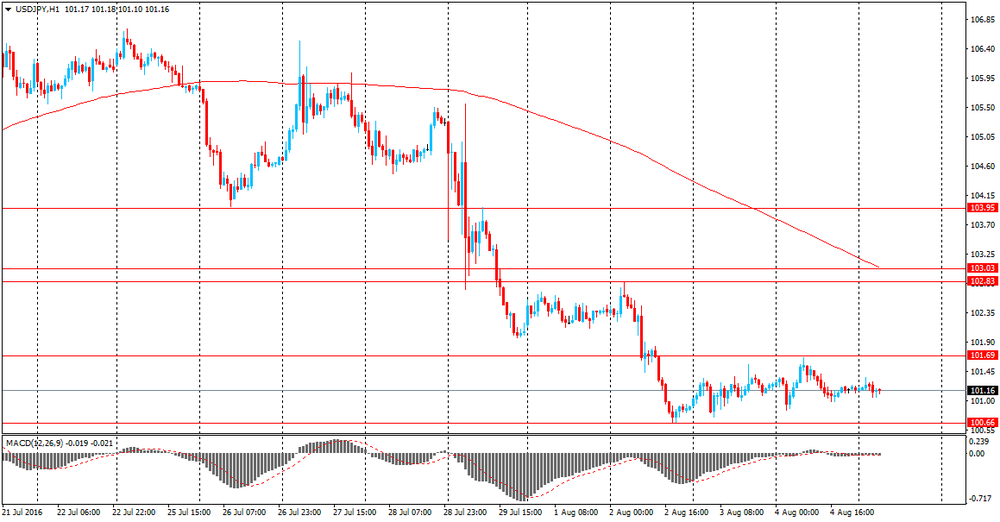
USD/JPY
Offers : 102.00 101.90 101.70 101.50 101.40 101.30 101.20
Bids: 100.80 100.65/70 100.50 100.40 100.30 100.15/20 100.00
AUD/USD
Offers : 0.7800 O.7780 0.7750 0.7740 0.7725 0.7700 0.7680 0.7670
Bids: 0.7640 0.7620 0.7590 0.7575 0.7550 0.7530 0.7510 0.7500
-
11:56
The demand for Russian bonds on the foreign market enables RF to raise $ 1.25 billion by year's end
Rusian Economic Development Minister Alexei Ulyukayev said that the demand on the foreign market for Russian bonds allows to raise $ 1.25 billion by year's end.
"On the foreign market, too, there is an appetite for risk, and 1.25 billion USD can be raised and it is possible to increase next year's borrowing. It is quite possible investors remain interested in investing in Russian assets", - said Ulyukayev.
-
11:18
The Wall Street Journal: China's foreign trade declined
According to the forecast of economists surveyed by The Wall Street Journal, China's foreign trade in goods is reduced and will be further reduced due to the ongoing weakness in external demand. Experts point out that exports and imports will decrease. According to the median forecast of analysts, exports probably fell by 3.6% compared with the same period of last year, after falling 4.8% in June. At the same time the volume of imports is likely to fall by 8.9% after falling 8.4% in June.
It is expected that the surplus of China's trade balance in July, probably fell to 48.00 billion dollars.
-
10:20
Italian industrial production down 0.4% in June
In June 2016 the seasonally adjusted industrial production index decreased by 0.4% compared with the previous month. The percentage change of the average of the last three months with respect to the previous three months was -0.4.
The calendar adjusted industrial production index decreased by 1.0% compared with June 2015 (calendar working days in June 2016 being the same as in June 2015); in the period January-June 2016 the percentage change was +0.8 compared with the same period of 2015.
-
10:20
Option expiries for today's 10:00 ET NY cut
EUR/USD 1.0900 (682m), 1.0930, 1.0980/85/90/95/1.1000 (964m) 1.1075/80/85/90 (680m) 1.1100, 1.1145/50, 1.1185 1.1200 (1.14bn), 1.1240, 1.1250/55 (811m), 1.1285/90/95/1.1300 (1.02bn)
USD/JPY 97.00 (739m),98.00,99.00 (709m),100.00, 100.15/20, 100.55 (530m),101.00 (600m), 101.15, 101.50, 101.70/75, 101.90,102.00/05 (952m), 102.25/30/35 (545m), 102.50, 102.75,103.00, 103.25, 103.60
104.00 (725m), 104.30/35, 104.50, 104.80 (2.41bn),105.00
GBP/USD 1.2925, 1.2945/50,1.3075,1.3100, 1.3175,1.3250,1.3300,1.3450,1.3500
AUD/USD 0.7345,0.7400, 0.7425, 0.7440/45/50, 0.7475,0.7500 (715m), 0.7550,0.7600 (1.23bn), 0.7610, 0.7650, 0.7660,0.7700, 0.7765
NZD/USD 0.7000,0.7150
AUD/NZD 1.0670/80
USD/CAD 1.2820/25/30 (581m),1.2900, 1.2985,1.3000/05/10/15 (863m),1.3025/30, 1.3075,1.3100 (540m), 1.3125, 1.3145/50, 1.3200 (624m), 1.3250,1.3300
-
09:40
USD Into NFP - BofA Merrill
"Nonfarm payroll growth likely slowed to a still healthy 165,000 for the month of July, down from the robust 287,000 clip in June. Our forecast would leave the 3-mo moving average at 154,000, indicating progress in the labor market, albeit at a slower pace. Recent low readings for initial jobless claims and the improvement in the conference board labor differential (jobs plentiful - hard to get) are supportive. Looking at the various goods sectors, we expect a rebound in construction jobs, supported by momentum in the housing market, while mining and manufacturing should remain soft. Services sector hiring likely remained solid. The recent volatility in the nonfarm payrolls data has been unusual. Part of the big swing from May to June owed to the end of the Verizon strike. There was also a 5-week gap between survey periods, which is perceived to create an upward bias. In prior analysis, we found a small difference supporting the claim, but it was not statistically significant. In our view, the strong June reading was primarily a positive payback after abysmal job growth in May, and we should see a return to a more sustainable clip this month.
We anticipate no change in the unemployment rate at 4.9%. The risk is that we see further recovery in labor force participation, which increased to 62.7% from 62.6% in the last report, thereby putting upward pressure on the unemployment rate. We also think we are due for stronger growth in household jobs given the last few months of weak readings. Average hourly earnings should rise 0.3% mom in July, accelerating from 0.1% in June. Yoy wage growth would be unchanged at 2.6%.
FX: Fed cautious optimism USD-supportive, helped by overseas easing
The Fed's incremental optimism in the July FOMC statement will help to protect but not extend dollar gains since the June meeting, in our view. The diminished risks the Committee sees and improved commentary on the economic outlook suggests September remains a live meeting in contrast to market pricing. While the USD sold off in the wake of the statement, we think the USD will remain supported with the market underpricing the risk of a September hike, assuming global financial conditions remain subdued. The coming two employment reports will be key in this regard.
The healthy 165,000 print we see in this week's report will leave the 3mma at a still robust 154,000. Combined with a stable unemployment rate and robust 0.3% average hourly earnings, the report will confirm the Fed's view that continued labor market tightening supports gradual policy normalization. The USD will respond positively with the market currently pricing a 20% chance of a September hike".
Copyright © 2016 BofAML, eFXnews™
-
09:37
UK house price index fell more than expected in July
Martin Ellis, Halifax housing economist, said: "House prices in the three months to July were 1.6% higher than in the previous quarter; up from 1.1% in June but comfortably lower than earlier in the year. The annual rate of growth was unchanged at 8.4%; the lowest since July 2015. "There are signs that house price growth is slowing with a deceleration in both the annual and quarterly rates of increase in the past few months. Nonetheless, the current rates remain robust. "July's monthly decline largely offsets June's increase. The month-on-month changes, however, can be erratic and falls often occur within an upward trend. Overall, it remains too early to determine if there has been any impact on the housing market as a result of June's EU referendum result."
-
09:33
Bank of England, Broadbent: We did not spend a lot of time considering whether our actions could hurt confidence in the economy
-
Surveys are not just about confidence but actual activity and jobs
-
We did not spend a lot of time considering whether our actions could hurt confidence in the economy
-
Sterling only saw a relatively small move after the announcement
-
BOE action do not send out a message of panic
-
The flexibility in the UK economy is not enough on its own to stop a slowdown
-
Is pretty confident BOE action will have some effect
-
Quite a number of indicators dropped markedly before our decision
*via forexlive -
-
09:30
United Kingdom: Halifax house price index, July -1% (forecast -0.2%)
-
09:30
United Kingdom: Halifax house price index 3m Y/Y, July 8.4% (forecast 8.5%)
-
08:47
Asian session review: the Australian dollar has strengthened
The US dollar traded in a narrow range against the euro and the yen, however, the US currency may depend on the number of jobs created in July (NFP), which will be released later today.. Some investors believe that Friday's employment data will be strong, so that the Federal Reserve in the next few months will be able to produce a rise in interest rates. Today, the futures on interest rates suggest that the market is priced in a 18% probability of rate hikes in September and 39% in December.
Today was publised positive data on changes in wage levels in Japan. As reported by the Ministry of Health, Labour and Welfare of Japan sjowed that in the period from January to June wages increased by 1.3%, after declining during the same period of the previous year -0.1%. Analysts had expected the index to rise to 0.4%. The increase in June was the first in the last three months. This indicator takes into account compensation for overtime work and bonuses, but do not take into account the income received in the form of interest on financial assets or capital gains. Earnings growth contributes to consumption, and therefore the upward trend index of wages is considered to be an inflationary factor for the Japanese economy. Real cash incomes increased to its highest level since September 2010 and + 1.8% on an annualized basis. Higher wages are one of the main goals of the Japanese administration, and today's data look better.
The Australian dollar rose, reaching a new three-month high contrary to RBA views that inflation may remain below the target until the end of 2018 and that is likely a further decrease in interest rates. So today, the Reserve Bank of Australia extended forecast for inflation at 1.5% -2.5% at the end of 2018. Core inflation will also remain at 1.5% -2.5% at the end of 2018
The forecast for GDP growth has remained almost unchanged. With regard to the labor market, the RBA expects only a slight decline in unemployment
According to the Central Bank, a lower rate of the Australian dollar, eventually, will support inflation.
Also today it became known that the index of activity in the construction sector of Australia HIA / AiG in July was 51.6 points and lower than the previous value of 53.2.
The index of activity in the construction sector based on a survey of 120 companies published by Australia Industry Group and Housing Industry Association. This indicator reflects the conditions in the construction sector in the short and medium term. Companies respond to questions relating to production, employment, supplier prices, stocks and new orders.
The index decreased for the second month in a row, but remained above 50, which is positive for the Australian currency. New orders and employment are growing against the background of softer rates. however, the activity of sub-indices declined slightly. Also there was uncertainty associated with the federal election in Australia on July 2 contributed to slower growth in the industry.
EUR / USD: during the Asian session, the pair was trading in the $ 1.1125-40 range
GBP / USD: during the Asian session, the pair was trading in the $ 1.3110-30 range
USD / JPY: during the Asian session, the pair was trading in Y101.05-10 range
-
08:45
France: Trade Balance, bln, June -3.4 (forecast -3.9)
-
08:45
France: Trade Balance, bln, June -3.4 (forecast -3.9)
-
08:35
Mixed start expected on the major stock exchanges in Europe: DAX + 0.2%, CAC40 + 0.1%, FTSE -0.1%
-
08:31
Japan's leading index little changed in June
Japan's leading index held steady in June, defying economists' expectations for an increase, preliminary survey data from the Cabinet Office showed Friday.
The leading index that signals the future economic activity, came in at 98.4 in June, the same reading as in the previous month. Meanwhile, it was forecast to climb to 99.7.
The coincident index that reflects the current economic activity rose to 110.5 in June from 109.2 in May. However, the score was below the expected level of 111.3.
Similarly, the lagging index that indicates the past economic activity, increased from 111.5 to 112.0 in June.
-
08:27
ECB member and Governor of the Bank of Italy, Visco: It would be wise to be prepared for possible public aid for Italian banks
-
Monti Del Paschi rescue plan is challenging but conditions are there for it to succeed
-
Banks must continue to reduce branches
-
It may be necessary to consider special measures beside current welfare support to cut staff
-
Seriousness of economic crisis Italy experienced can justify state support for banks
-
Expects government to continue to stick to commitment to reduce debt burden over output
-
Nominal rates to remain low until Eurozone inflation is back in line with our price stability goal
-
-
08:24
RBA statement on monetary policy: expansion in resource exports
RBA says in its 78 pages statement:
Growth in economic activity in Australia's major trading partners has remained a little below average over the first half of 2016. Despite this, commodity prices overall have increased since the beginning of the year, partly because of reductions in supply by some high-cost producers of commodities, including iron ore and coal. The outlook for overall growth in Australia's major trading partners and the outlook for the terms of trade are little changed from three months ago. The terms of trade are forecast to remain close to current levels over the next couple of years. This is around 35 per cent lower than their peak in late 2011, but still well above levels that prevailed prior to the mining boom.
In China, subdued growth in private sector investment has been only partially offset by additional policy measures to support demand.
In Australia, low interest rates and the depreciation of the Australian dollar exchange rate since early 2013 are continuing to support the rebalancing of economic activity towards non-resource sectors. Growth in GDP was stronger than expected in the March quarter, in large part because of a substantial rise in resource exports, which were boosted by unusually favourable weather conditions. More recent data suggest that real GDP growth was more moderate in the June quarter, as expected. The unemployment rate has remained at around 5¾ per cent over 2016, which is around ½ percentage point lower than a year or so ago.
-
08:24
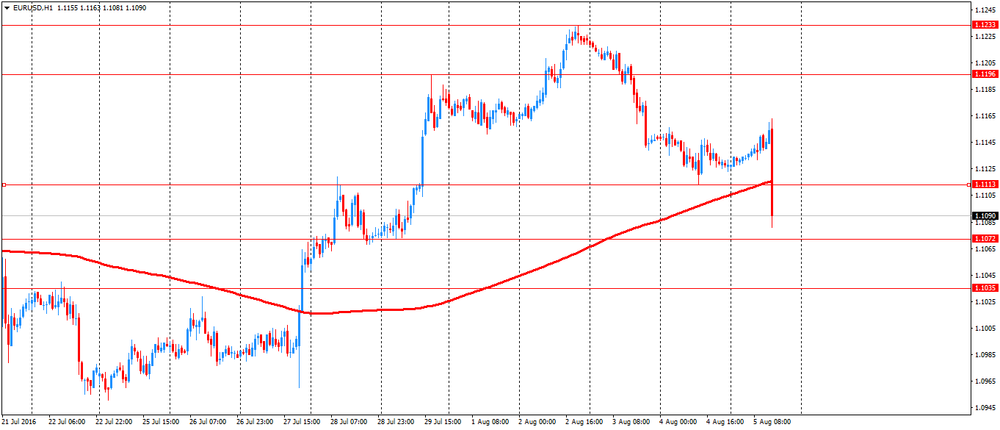
Options levels on friday, August 5, 2016:
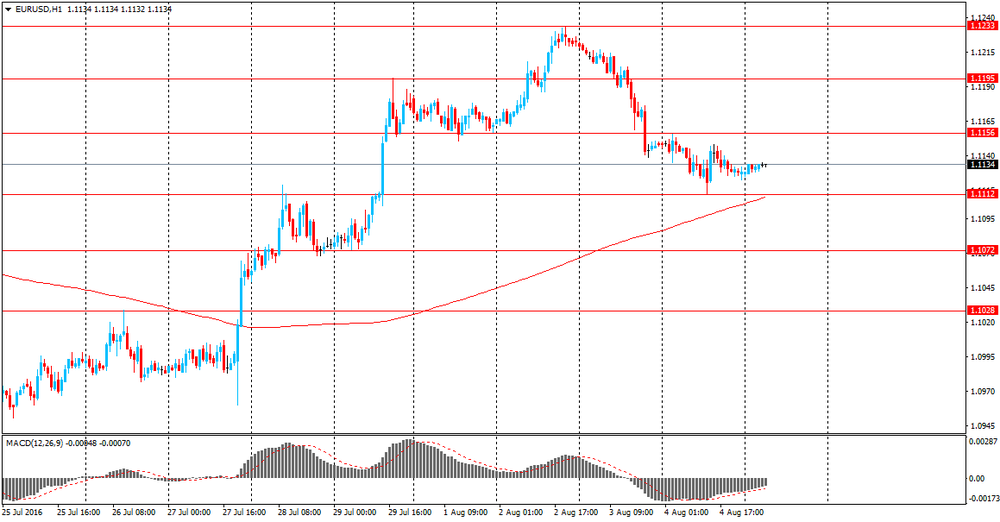
EUR/USD
Resistance levels (open interest**, contracts)
$1.1254 (2665)
$1.1212 (3460)
$1.1182 (2560)
Price at time of writing this review: $1.1142
Support levels (open interest**, contracts):
$1.1086 (3215)
$1.1045 (3454)
$1.0998 (4608)
Comments:
- Overall open interest on the CALL options with the expiration date August, 5 is 38435 contracts, with the maximum number of contracts with strike price $1,1300 (3769);
- Overall open interest on the PUT options with the expiration date August, 5 is 51401 contracts, with the maximum number of contracts with strike price $1,0900 (5439);
- The ratio of PUT/CALL was 1.34 versus 1.33 from the previous trading day according to data from August, 4
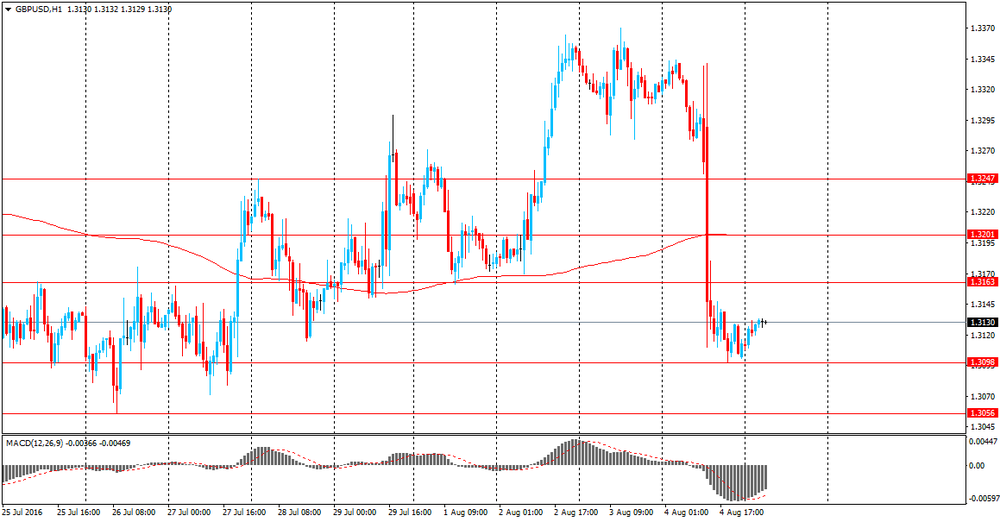
GBP/USD
Resistance levels (open interest**, contracts)
$1.3400 (2084)
$1.3300 (1924)
$1.3202 (1016)
Price at time of writing this review: $1.3133
Support levels (open interest**, contracts):
$1.3096 (2719)
$1.2999 (1335)
$1.2900 (1039)
Comments:
- Overall open interest on the CALL options with the expiration date August, 5 is 28169 contracts, with the maximum number of contracts with strike price $1,3500 (2163);
- Overall open interest on the PUT options with the expiration date August, 5 is 26840 contracts, with the maximum number of contracts with strike price $1,2950 (3229);
- The ratio of PUT/CALL was 0.95 versus 0.95 from the previous trading day according to data from August, 4
* - The Chicago Mercantile Exchange bulletin (CME) is used for the calculation.
** - Open interest takes into account the total number of option contracts that are open at the moment.
-
08:16
German new orders in manufacturing had decreased in June
Based on provisional data, the Federal Statistical Office (Destatis) reports that price-adjusted new orders in manufacturing had decreased in June 2016 a seasonally and working-day adjusted 0.4% on May 2016. For May 2016, revision of the preliminary outcome resulted in an increase of 0.1% compared with April 2016 (primary 0.0%). Price-adjusted new orders without major orders in manufacturing had increased in June 2016 a seasonally and working-day adjusted 0.9% on May 2016.
In June 2016, domestic orders increased by 0.7%, while foreign orders decreased by 1.2% on the previous month. New orders from the euro area were down 8.5% on the previous month, while new orders from other countries increased by 3.8% compared to May 2016.
In June 2016 the manufacturers of intermediate goods recorded decreases in new orders of 0.7% and the manufacturers of capital goods showed a decrease of 0.2% on the previous month. For consumer goods, a decrease in new orders of 0.7% was recorded.
-
08:00
Germany: Factory Orders s.a. (MoM), June -0.4% (forecast 0.6%)
-
07:04
Japan: Leading Economic Index , June 98.4 (forecast 99.6)
-
07:04
Japan: Coincident Index, June 110.5
-
02:01
Japan: Labor Cash Earnings, YoY, June 1.3% (forecast 0.4%)
-
01:32
Australia: AiG Performance of Construction Index, July 51.6
-
00:36
Currencies. Daily history for Aug 04’2016:
(pare/closed(GMT +3)/change, %)
EUR/USD $1,1128 -0,18%
GBP/USD $1,3113 -1,56%
USD/CHF Chf0,974 +1,13%
USD/JPY Y101,17 -0,08%
EUR/JPY Y112,57 -0,28%
GBP/JPY Y132,65 -1,65%
AUD/USD $0,7625 +0,54%
NZD/USD $0,7169 +0,25%
USD/CAD C$1,3019 -0,41%
-
00:01
Schedule for today, Friday, Aug 05’2016:
(time / country / index / period / previous value / forecast)
00:00 Japan Labor Cash Earnings, YoY June -0.2% 0.4%
01:30 Australia RBA Monetary Policy Statement
05:00 Japan Leading Economic Index (Preliminary) June 99.7 99.6
05:00 Japan Coincident Index (Preliminary) June 109.9
06:00 Germany Factory Orders s.a. (MoM) June 0.0% 0.6%
06:45 France Trade Balance, bln June -2.8 -3.9
07:30 United Kingdom Halifax house price index July 1.3% -0.2%
07:30 United Kingdom Halifax house price index 3m Y/Y July 8.4% 8.5%
12:30 Canada Trade balance, billions June -3.28 -2.84
12:30 Canada Unemployment rate July 6.8% 6.9%
12:30 Canada Employment July -0.7 10
12:30 U.S. Average workweek July 34.4 34.4
12:30 U.S. International Trade, bln June -41.14 -43.1
12:30 U.S. Average hourly earnings July 0.1% 0.2%
12:30 U.S. Unemployment Rate July 4.9% 4.8%
12:30 U.S. Nonfarm Payrolls July 287 180
14:00 Canada Ivey Purchasing Managers Index July 51.7 50.9
19:00 U.S. Consumer Credit June 18.56 17
-