Noticias del mercado
-
17:46
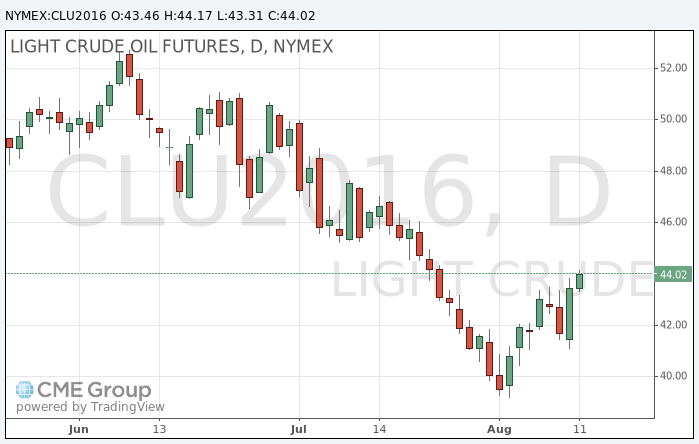
Falling dollar support oil prices
Oil prices have risen due to the weakening US dollar, which keeps the prices close to the previous day's high.
The dollar began to lose ground after the release of data on US retail sales, which showed a flat trend in July, contrary to the expectations.
Quotes of oil holds near 3-week intraday high after the day intentions of Saudi Arabia to cooperate with other oil-producing countries to stabilize prices was made public.
Saudi Minister of Energy Khaled Al-Falih said Thursday that, together with other members of OPEC and oil-producing countries that are not members of the cartel, "will take any steps to help" the oil market. His statements were perceived by some as a sign of readiness to support the coordinated production limitation.
However, many traders and analysts are skeptical about the willingness of Saudi Arabia to restrict production, as the volume of oil production in the country in July has reached record levels.
"It does not look like the action of a country that is going to stop the fight for market share".
OPEC said that next month will hold a meeting in Algeria. In April this year a meeting of oil-producing countries to discuss the possibility of production constraints, failed.
Analysts at RBC Capital Markets believe that OPEC countries are unlikely to make any real steps. "The action plan is likely to be purely symbolic and aimed rather at changing market sentiment than any real action".
On Thursday, the International Energy Agency reported that abundant world oil reserves may be reduced in the second half of the year, as production has not kept pace with demand.
Traders also await weekly data from Baker Hughes oilfield on the number of rigs operating in the USA. This index has shown growth for several consecutive weeks, giving rise to concerns about the fact that oil prices are already high enough to lead to production growth in the United States and preserve the excess supply in the market. Energy Information Administration recently raised its forecast for oil production in the country for the current and next year.
The cost of the September futures on US light crude oil WTI rose to 44.17 dollars per barrel.
September futures price for North Sea petroleum mix of Brent crude rose to 46.66 dollars a barrel on the London Stock Exchange ICE Futures Europe.
-
16:21
Credit Suisse selling GBP/USD, Levels & Targets
"GBPUSD has completed a bearish "pennant" formation on last week's break below former trendline/range support now at 1.3200.
We look for a test of the July 2016 low at 1.2798 next. However, bigger picture we look for an eventual break below here to then test our next target at the 78.6% retracement of the 1985/2007 rise at 1.2752. We would expect this to hold initially, but below it can target pattern objectives at 1.2433 then 1.2000, with scope for 1.1855
Resistance shows at 1.3155/85 initially then 1.3373. Above 1.3413/82 is needed for a base.
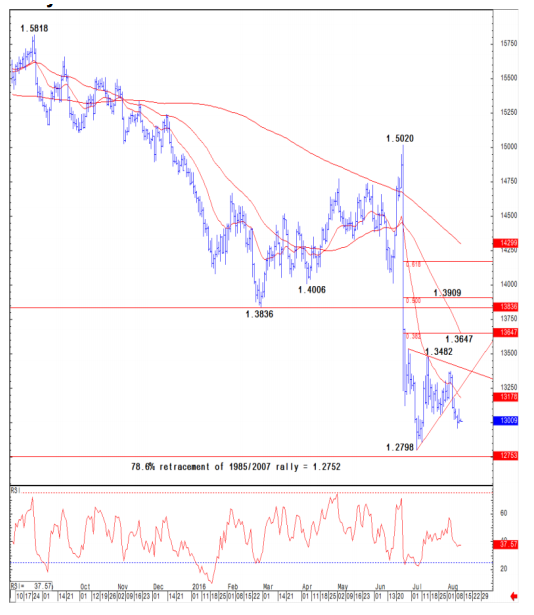
*CS maintains a limit order to sell GBP/USD at 1.3155 targeting 1.2752.
GBPJPY remains under heavy pressure and given that we also remain bullish JPY (c.f. JPY remain in a core bull trend 5th Aug 2016) we expect to see further weakness to retest this year's low at 128.81. Capitulation beneath here can see the core downtrend resume for 118.80 initially, with the major 2011 low at 116.84 expected to provide a floor.
Resistance moves to 136.26 then 139.93/140.15 with a bigger barrier seen at 1422.22/143.93. Selling is expected at the latter level and above it is needed to set a base again and open up strength to 146.36.
EURGBP has extended its rally from support at .8252/43 and we remain bullish for a break above the July 2016 high at .8640 to test the 61.8% retracement of the 2008/15 fall at .8706, potentially .8816. We would expect a cap at the latter level.
Below .8252/43 can see a retreat back to 8120/18, potentially .8000/.7995, but with a floor expected here.
*CS booked profit today on its long EUR/GBP from 0.8380 at 0.8620".
Copyright © 2016 Credit Suisse, eFXnews™
-
16:11
US: The Index of Consumer Sentiment hit 90.4 in August
A key measure of consumers' attitudes is slightly higher so far this month, but didn't rise as much as expected, according to preliminary data released Friday. The Index of Consumer Sentiment hit 90.4 in August, the University of Michigan said. Economists expected the consumer sentiment index to hit 91.5, versus 90 in July's final reading, according to a Thomson Reuters consensus estimate. The monthly survey of 500 consumers measures attitudes toward topics like personal finances, inflation, unemployment, government policies and interest rates - CNBC.
-
16:00
U.S.: Reuters/Michigan Consumer Sentiment Index, August 90.4 (forecast 91.5)
-
16:00
U.S.: Business inventories , June 0.2% (forecast 0.1%)
-
15:51
Conference Board Leading Index down 0.3% in June
The research results published by Conference Board showed that at the end of June the leading economic index for the UK fell by 0.3 per cent, to a level of 113.7 points (2010 = 100), after falling 0.2 percent in May and -0.1 per cent in April. Within six months (from December 2015 to June 2016) the index decreased by 0.1 percent compared with a growth of 0.6 percent in the previous six-month.
The leading economic index is a weighted average, which is calculated based on a number of macroeconomic indicators. The index characterizes the development of the economy over the next 6 months. There is also a rule of thumb that the output value of the indicator in the negative area for three months in succession is an indication of slowing down of the economy.
-
15:51
Option expiries for today's 10:00 ET NY cut
EURUSD 1.1100 (EUR 513m)
USDJPY 102.00 (USD 615m) 102.50 (USD 1.79bln)
AUDNZD 1.0900 (AUD 1.48bln)
-
14:41
US retail sales lower than forecasts - Bloomberg
According to Bloomberg, sales at U.S. retailers were little changed in July as Americans flocked to auto dealers at the expense of other merchants.
"After three upside surprises, we see some downside risk," Jim O'Sullivan, chief U.S. economist at High Frequency Economics Ltd in Valhalla, New York, said in a research note before the report. At the same time, "most important is the improving labor market, including what is probably just the start of a pickup in wage gains."
Estimates in the Bloomberg survey ranged from no change to a 0.9 percent gain. June's reading was revised from an initially reported 0.6 percent increase.
Gasoline service station receipts dropped 2.7 percent, while sales weakened at sporting goods and hobby outlets, department stores, clothing merchants and restaurants.
-
14:35
-
14:33
US: The Producer Price Index decreased 0.4 percent in July
The Producer Price Index for final demand decreased 0.4 percent in July, seasonally adjusted, the U.S. Bureau of Labor Statistics reported today. Final demand prices rose 0.5 percent in June and 0.4 percent in May. On an unadjusted basis, the final demand index moved down 0.2 percent for
the 12 months ended in July.
In July, the decline in the final demand index was led by prices for final demand services, which fell 0.3 percent. The index for final demand goods decreased 0.4 percent.
Prices for final demand less foods, energy, and trade services were unchanged in July after rising 0.3 percent in June. For the 12 months ended in July, the index for final demand less foods, energy, and trade services increased 0.8 percent. -
14:31
U.S.: Retail Sales YoY, July 2.3%
-
14:30
U.S.: Retail sales, July 0% (forecast 0.4%)
-
14:30
U.S.: PPI excluding food and energy, m/m, July -0.3% (forecast 0.2%)
-
14:30
U.S.: PPI, m/m, July -0.4% (forecast 0.1%)
-
14:30
U.S.: Retail sales excluding auto, August -0.3% (forecast 0.2%)
-
14:30
U.S.: PPI excluding food and energy, Y/Y, July 0.7% (forecast 1.2%)
-
14:30
U.S.: PPI, y/y, July -0.2% (forecast 0.2%)
-
14:00
Orders
EUR/USD
Offers 1.1160 1.1175-80 1.1200 1.1230 1.1250 1.1280 1.1300
Bids 1.1130 1.1115 1.1100 1.1070 1.1050-55 1.1020-25 1.1000-05
GBP/USD
Offers 1.2980 1.3000 1.3020-25 1.3065 1.3080 1.3095-05 1.3130 1.3150
Bids 1.2930 1.2900 1.2880 1.2850 1.2830 1.2800 1.2780 1.2750
EUR/GBP
Offers 0.8625-30 0.8655-60 0.8685 0.8700
Bids 0.8585 0.8570 0.8550 0.8535 0.8520 0.8500 0.8475-80 0.8450
EUR/JPY
Offers 114.00 114.50 114.80 115.00 115.30 115.50
Bids 113.50 113.00 112.80-85 112.50 112.00-10 111.85 111.50
USD/JPY
Offers 102.20-25 102.50 102.80-85 103.00 103.50
Bids 102.00 101.80 101.60 101.30 101.10 101.00 100.70-75 100.50
AUD/USD
Offers 0.7700 0.7720 0.7750-55 0.7785 0.7800 0.7835 0.7850 0.7900
Bids 0.7680 0.7660 0.7620 0.7600 0.7585 0.7565 0.7570 0.7550
-
12:11
The International Monetary Fund reached a three-year funding deal with Egypt
The International Monetary Fund reached a three-year funding deal with Egypt on Thursday, which is set to support the government's economic reform program and improve the functioning of the foreign exchange markets.
The $12 billion agreement is subject to approval by the IMF's Executive Board.
Egypt is a strong country with great potential but it has some problems that need to be fixed urgently, the lender said.
The IMF said the program aims to improve the functioning of the forex markets and bring down the budget deficit and government debt.
It will also raise growth and create jobs, especially for women and young people and strengthen the social safety net to protect the vulnerable during the process of adjustment, the lender said.
Financial sector policies will be geared toward safeguarding the strength and stability of the banking system, Chris Jarvis, who led an IMF mission to Cairo said - RTT.
-
11:17
Industrial production in Euro Zone up 0.6% due to capital goods and durable goods
In June 2016 compared with May 2016, seasonally adjusted industrial production rose by 0.6% in the euro area (EA19) and by 0.5% in the EU28, according to estimates from Eurostat, the statistical office of the European Union. In May 2016 industrial production fell by 1.2% and 1.1% respectively. In June 2016 compared with June 2015, industrial production increased by 0.4% in the euro area and by 0.5% in the EU28.
The increase of 0.6% in industrial production in the euro area in June 2016, compared with May 2016, is due to production of capital goods rising by 1.3%, durable consumer goods by 1.0% and non-durable consumer goods by 0.7%, while production of intermediate goods fell by 0.2% and energy by 0.6%. In the EU28, the increase of 0.5% is due to production of capital goods rising by 1.3%, durable consumer goods by 0.9% and non-durable consumer goods by 0.1%, while production of intermediate goods fell by 0.1% and energy by 0.5%. Among Member States for which data are available, the highest increases in industrial production were registered in Ireland (+7.1%), Bulgaria (+3.9%) and Greece (+3.8%), and the largest decreases in Estonia (-3.1%), Hungary (-2.3%) and Malta (-1.6%).
-
11:15
GDP rose by 0.3% in the euro area
Seasonally adjusted GDP rose by 0.3% in the euro area (EA19) and by 0.4% in the EU28 during the second quarter of 2016, compared with the previous quarter, according to a flash estimate published by Eurostat, the statistical office of the European Union. In the first quarter of 2016, GDP grew by 0.6% and 0.5% respectively.
Compared with the same quarter of the previous year, seasonally adjusted GDP rose by 1.6% in the euro area and by 1.8% in the EU28 in the second quarter of 2016, after +1.7% and +1.8% respectively in the previous quarter.
During the second quarter of 2016, GDP in the United States increased by 0.3% compared with the previous quarter (after +0.2% in the first quarter of 2016). Compared with the same quarter of the previous year, GDP grew by 1.2% (after +1.6% in the previous quarter).
-
11:00
Eurozone: GDP (QoQ), Quarter II 0.3% (forecast 0.3%)
-
11:00
Eurozone: GDP (YoY), Quarter II 1.6% (forecast 1.6%)
-
11:00
Eurozone: Industrial Production (YoY), June 0.4% (forecast 0.7%)
-
11:00
Eurozone: Industrial production, (MoM), June 0.6% (forecast 0.5%)
-
10:36
UK: the output in the construction industry was estimated to have decreased by 0.7% q/q
The reporting period for this release covers the second quarter of 2016 plus the calendar month of June 2016, and therefore includes data for a short period after the EU referendum. There is very little anecdotal evidence at present to suggest that the referendum has had an impact on output.
In Quarter 2 (Apr to June) 2016, output in the construction industry was estimated to have decreased by 0.7% compared with Quarter 1 (Jan to Mar) 2016.
Downward pressure on the quarter came from all new work, which decreased by 0.8%, and repair and maintenance (R and M), which decreased by 0.5%.
Between Quarter 2 2016 and Quarter 2 2015, output was estimated to have decreased by 1.4%.
In June 2016, construction output decreased by 0.9% compared with May 2016.
-
10:22
Car sales in China up 26%
The volume of cars sold in China has increased in July by 26% compared to the previous year.
According to data released today by the China Association of Automobile Manufacturers, the volume of cars sold in China has increased by 26% compared to the same month last year. Chinese and foreign automakers sold 1.6 million passenger cars vs 1.27 million vehicles in July last year, demonstrating the fastest growth rate since 2013. Experts point out that the tax measures have contributed to this. After the fall of auto sales in October, the government in Beijing halved the purchase tax on small cars to 5%.
-
10:20
Italian GDP unchanged in Q2
In the second quarter of 2016 the seasonally and calendar adjusted, chained volume measure of Gross Domestic Product (GDP) resulted unchanged with respect to the first quarter of 2016 and increased by 0.7 per cent in comparison with the second quarter of 2015.
-
10:15
Option expiries for today's 10:00 ET NY cut
EUR/USD 1.0920-25 (EUR 773m) 1.0940-50 (913m) 1.1050 (334m) 1.1100 (574m) 1.1130-35 (522m) 1.1190-1.1200 (1.045bln)
USD/JPY 100.00 (USD 410m) 101.00 (781m) 102.00 (270m) 102.25 (300m) 102.45-55 (500m) 103.00 (1.52bln) 103.50 (1.27bln) 104.00 (590m)
GBP/USD 1.2995-1.3000 (GBP 473m) 1.3180 (210m)
AUD/USD 0.7420 (AUD 288m) 0.7600 (376m)
USD/CAD 1.2975 (USD 260m) 1.3000 (345m) 1.3025 (316m) 1.3115-20 (450m)
NZD/USD 0.7075 (NZD 200m) 0.7200 (287m)
AUD/NZD 1.0700 (AUD 318m) 1.0750 (AUD 636m)
-
09:37
Major stock markets were traded slightly lower: FTSE: -0.1%, DAX -0.2%, CAC40 -0.1%, FTMIB flat, IBEX -0.1%
-
08:50
France: In Q2 2016 payroll employment increased once again (flash estimate)
In Q2 2016, payroll employment continued to increase in non-farm market sectors (+0.2%). With 24,100 jobs created, it increased slightly less than in the previous quarter (+37,300 jobs). Year-on-year, it rose by +0.9% (+143,300 jobs).
Employment continued to drop in industry in Q2 2016 (-0.3%, i.e -9,700 jobs). In construction, job losses resumed (-0.3%, i.e. -3,500 jobs after +0.1% in the previous quarter). Year-on-year, industry shed more jobs (-33,900) than construction (-13,400).
-
08:48
Asian session review: Australian and New Zealand dollar fell
The following data was published:
2:00 China Investment in fixed assets in July 9.0% 8.8% 8.1%
2:00 China Retail sales, y / y in July 10.6% 10.5% 10.2%
2:00 China Industrial Production y / y in July 6.2% 6.1% 6.0%
6:00 Germany Consumer Price Index m / m (final data) July 0.1% 0.3% 0.3%
6:00 Germany CPI, y / y CPI, y / y
(Final data) July 0.3% 0.4% 0.4%
6:00 Germany GDP q / q (preliminary data) II quarter 0.7% 0.2% 0.4%
6:00 Germany GDP y / y (preliminary data) II quarter 1.3% 1.5% 3.1%
Australian and New Zealand dollars fell from the beginning of the session on weaker-than-expected macroeconomic data from China. As reported today by the National Bureau of Statistics of China, industrial production in the period from January to July increased by 6% compared to the same period of the previous year (+6.2%). Economists had expected an increase of 6.1%. Compared with the previous month, industrial production increased by 0.52% after rising 0.47% in June.
The official representative Sheng Layyun said that in July, due to flooding in a number of provinces, as well as high temperature and the low level of external demand growth has slowed a number of indicators. At the same time, he noted that in general the overall state of the Chinese economy is stable.
Chinese retail sales in July increased by 10.2% compared to the same period of the previous year, after rising 10.6% in June. The indicator was lower than the forecast, which anticipated an increase of 10.5%. Compared with June sales increased by 0.75% after rising 0.92% a month earlier.
The volume of investments in fixed assets in China, with the exception of agriculture, on an annualized basis, increased by 8.1%. Economists had expected agrowth rate of 8.8%, after rising by 9.0% a year earlier.
Investment in China's mining industry grew by 20.6%. In the industrial sector investment rose by 3.5%. In the service sector the inflow of investments in the first quarter of 2016 grew by 10.8%, more than in 2015.
In China, there is a slowdown in the growth of investment in fixed assets. According to the forecast of the Chinese government, this year the volume of investments in fixed assets, with the exception of agriculture, increase by 10.5%.
Also, retail sales in New Zealand in the second quarter increased by 2.3%, after rising 0.8% in the first quarter. Analysts had expected an increase of 1.0%. In annual terms, retail sales increased by 6%. Retail sales excluding auto sales rose 2.6%, higher than the forecast of 1.1%.
According to the report total retail sales growth was at a record high in dollar terms. Twelve of the 15 sectors were higher.
The index of business activity in the manufacturing sector of New Zealand, assessing conditions in the business environment of the country in July was 55.8 points, lower than the previous value, revised from 57.7 to 57.7 points. Manufacturing PMI is considered an important indicator of overall economic conditions. Despite the slight decline, the result above 50 indicates growth in activity and is a positive factor for the New Zealand currency.
The US dollar traded in a narrow range against the euro in the absence of new orientations regarding the future prospects of monetary policy the US. Disappointing data on the performance and growth of the US economy, published last week, triggered a weakening dollar.
Minutes of the July meeting of the Fed will be presented next week, and Fed Chairman Janet Yellen will speak at Jackson Hole later this month, which can also cause investors to reconsider expectations for a rate hike prospects.
The market saw a 12% chance of Fed raising rates in September and 39% probability in December, according to the CME Group.
The next test of strength for the dollar will be the publication of the report on retail sales. The indicator will be published today at 12:30 GMT. Retail sales rose 0.6% in June, after finishing a strong second quarter. It is expected that data for July will be strong, and with a monthly growth of 0.4%.
EUR / USD: during the Asian session, the pair was trading in the $ 1.1130-40 range
GBP / USD: during the Asian session, the pair was trading in the $ 1.2945-60 range
USD / JPY: during the Asian session, the pair was trading in Y101.75-102.10 range
-
08:45
France: Non-Farm Payrolls, Quarter II 0.2%
-
08:31
Turning Bullish AUD & Bearish CAD - Morgan Stanley
AUD: Bullish Following Rate Cut.
We have turned bullish AUD in the near term and believe it can continue to rally following the RBA's rate cut. AUD's reaction to the rate cut is telling, given it ended the day over 1% higher against USD despite the rate cut not being fully priced in. As the hunt for yield remains strong and the RBA's lack of an easing bias indicates no easing catalyst any time soon, we expect AUD to appreciate (particularly against USD). RBA Gov. Stevens' outgoing speech also gave no indication that further easing is imminent. Our long-term bearish view remains, but is contingent on the housing cycle turning and slowing growth in China forcing the RBA to cut 50bp further in 1H17.
CAD: Bearish Following Weak Data.
We have turned bearish CAD last week following the week employment and trade data, expecting it to underperform other commodity currencies in coming weeks. On the trade side, the nominal deficit was the largest in history, at C$3.63b, with export volumes falling 1.4%. The details were also weak . Non-commodity export volumes fell once again (by 0.4%), bringing them nearly 9% below their January peak. The BoC lowered its forecasts for non-commodity export growth this year, but these figures are still disappointing and support our view that the BoC is too optimistic about an export-led recovery. These figures, along with the weak May retail sales volumes and GDP growth, mean the BoC's 2Q GDP forecast of -1% is probably too optimistic. Friday's employment data, which has been relatively resilient amidst Canada's tepid growth in recent years, was also disappointing. We may not get a shift in tone yet from the BoC but in an environment of commodity currencies receiving support (most with improving data), we think there is scope to price a higher probability of cuts in Canada curve.
Copyright © 2016 Morgan Stanley, eFXnews
-
08:29
Options levels on friday, August 12, 2016:
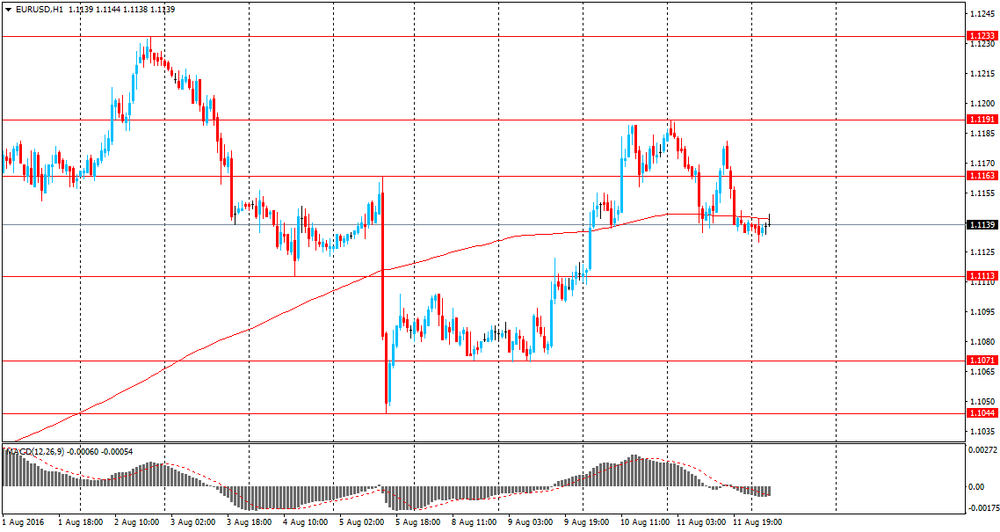
EUR/USD
Resistance levels (open interest**, contracts)
$1.1303 (5052)
$1.1246 (3336)
$1.1208 (2202)
Price at time of writing this review: $1.1142
Support levels (open interest**, contracts):
$1.1087 (2157)
$1.1034 (3931)
$1.1001 (4569)
Comments:
- Overall open interest on the CALL options with the expiration date September, 9 is 48984 contracts, with the maximum number of contracts with strike price $1,1250 (5052);
- Overall open interest on the PUT options with the expiration date September, 9 is 54943 contracts, with the maximum number of contracts with strike price $1,1000 (5609);
- The ratio of PUT/CALL was 1.12 versus 1.13 from the previous trading day according to data from August, 11
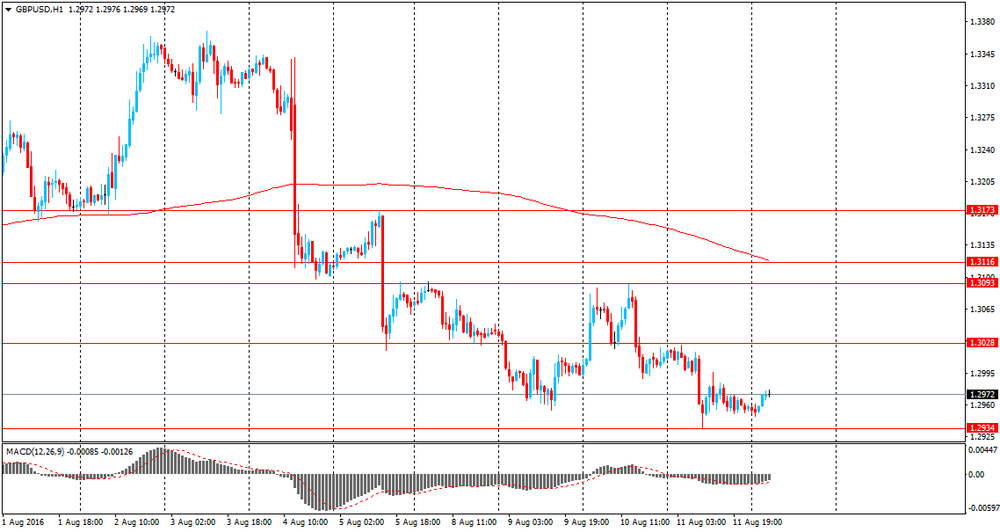
GBP/USD
Resistance levels (open interest**, contracts)
$1.3205 (2147)
$1.3108 (1255)
$1.3012 (663)
Price at time of writing this review: $1.2960
Support levels (open interest**, contracts):
$1.2890 (2028)
$1.2794 (2284)
$1.2696 (1061)
Comments:
- Overall open interest on the CALL options with the expiration date September, 9 is 30747 contracts, with the maximum number of contracts with strike price $1,3300 (2478);
- Overall open interest on the PUT options with the expiration date September, 9 is 25065 contracts, with the maximum number of contracts with strike price $1,2800 (2284);
- The ratio of PUT/CALL was 0.82 versus 0.83 from the previous trading day according to data from August, 11
* - The Chicago Mercantile Exchange bulletin (CME) is used for the calculation.
** - Open interest takes into account the total number of option contracts that are open at the moment.
-
08:28
China's economic activity weakened in July
China's economic activity weakened in July as industrial production, retail sales and investment all registered weak growth.
Industrial production grew 6 percent year-on-year in July, slower than the 6.2 percent increase seen in June. The annual growth was expected to remain unchanged at 6.2 percent.
On a monthly basis, industrial output gained 0.52 percent.
At the same time, retail sales climbed 10.2 percent on a yearly basis, following a 10.6 percent rise in June. Sales were forecast to grow 10.5 percent.
In the January to July period, fixed asset investment moved up 8.1 percent compared to a 9 percent expansion seen during January to June. Economists had forecast 8.9 percent growth.
Julian Evans-Pritchard at Capital Economics, said the downbeat investment figures raise questions over the efficacy of the recent policy easing - RTT.
-
08:21
Better Q2 retail sales in New Zeeland
Robust spending in most of the retail trade industries has boosted total sales for the June 2016 quarter, Statistics New Zealand said today. A strong increase this quarter follows a more subdued rise in the March 2016 quarter.
After adjusting for seasonal effects, the total volume of retail trade sales had a record rise in dollar terms for the June 2016 quarter. This quarter's sales volumes rose 2.3 percent - the largest percentage increase since the December 2006 quarter. This quarter's increase follows a 1.0 percent rise in the March 2016 quarter.
"Consumer spending is humming along, with DIY and trade staff customers boosting sales in the hardware and building supply trades. Strong vehicle sales also continued," business indicators senior manager Neil Kelly said.
"Twelve of the 15 industries had higher sales volumes this quarter, with some Auckland retailers in particular saying they had an extremely busy quarter," Mr Kelly added.
-
08:18
Germany: Selling prices in wholesale trade decreased by 1.4% in July
As reported by the Federal Statistical Office (Destatis), the selling prices in wholesale trade decreased by 1.4% in July 2016 from the corresponding month of the preceding year. In June and in May 2016 the annual rates of change were -1.5% and -2.3%, respectively. From June 2016 to July 2016 the index rose by 0.2%
-
08:16
German GDP growth exceed forecasts monthly and yearly
The German economy continues to grow. In the second quarter of 2016, the gross domestic product (GDP) rose 0.4% on the first quarter of the year after adjustment for price, seasonal and calendar variations. At the beginning of the year 2016, a strong GDP growth of 0.7% had been recorded.
The quarter-on-quarter comparison (upon adjustment for price, seasonal and calendar variations) shows that positive contributions came especially from the balance of exports and imports. According to provisional results, exports were up, while imports were slightly down compared with the first quarter of 2016. Both household final consumption expenditure and government final consumption expenditure supported growth, too. However, growth was slowed by weak gross capital formation. After a strong first quarter, a decline was recorded especially in gross fixed capital formation in machinery and equipment and in construction.
Economic growth accelerated year on year, too. The price-adjusted GDP rose 3.1% in the second quarter of 2016, which was the largest increase in five years. Adjusted for the exceptionally high calendar effect, the GDP growth was 1.8% after 1.9% (unadjusted 1.5%) in the first quarter of 2016.
The economic performance in the second quarter of 2016 was achieved by 43.5 million persons in employment in the domestic territory, which was an increase of 529,000 or 1.2% on a year earlier.
-
08:12
Consumer prices in Germany were 0.4% higher in July
Consumer prices in Germany were 0.4% higher in July 2016 compared with July 2015. The inflation rate as measured by the consumer price index increased slightly for the third consecutive month. This year, a somewhat higher rate than in July 2016 was measured in January (+0.5%). Compared with the previous month, the consumer price index rose by 0.3% in July 2016. The Federal Statistical Office (Destatis) thus confirms its provisional overall results of 28 July 2016.
The development of energy prices (-7.0%) had a marked downward effect on the overall rise in prices in July 2016, as had been the case in the preceding months. Compared with the last few months, the decrease of energy prices accelerated slightly year on year, in June 2016 it had stood at -6.4%. Consumers benefitted especially from the prices of mineral oil products, which were down in July 2016 on a year earlier (-12.8%, of which heating oil: -18.0%, and motor fuels: -11.5%). The prices of other energy products were also below the level of a year earlier (for example, charges for central and district heating: -8.9%; gas: -2.9%). Only electricity prices were up on a year earlier (+0.7%). Excluding energy prices, the inflation rate in July 2016 would have been +1.3%.
-
08:01
Germany: GDP (YoY), Quarter II 3.1% (forecast 1.5%)
-
08:01
Germany: GDP (QoQ), Quarter II 0.4% (forecast 0.2%)
-
08:01
Germany: GDP (QoQ), Quarter II 0.4% (forecast 0.2%)
-
08:01
Germany: GDP (YoY), Quarter II 3.1% (forecast 1.5%)
-
08:00
Germany: CPI, y/y , July 0.4% (forecast 0.4%)
-
08:00
Germany: CPI, m/m, July 0.3% (forecast 0.3%)
-
04:00
China: Fixed Asset Investment, July 8.1% (forecast 8.8%)
-
04:00
China: Retail Sales y/y, July 10.2% (forecast 10.5%)
-
00:59
Currencies. Daily history for Aug 11’2016:
(pare/closed(GMT +3)/change, %)
EUR/USD $1,1140 -0,38%
GBP/USD $1,2958 -0,42%
USD/CHF Chf0,9753 +0,09%
USD/JPY Y101,91 +0,73%
EUR/JPY Y113,54 +0,35%
GBP/JPY Y131,06 -0,43%
AUD/USD $0,7697 -0,16%
NZD/USD $0,7207 -0,86%
USD/CAD C$1,2987 -0,69%
-
00:45
New Zealand: Retail Sales YoY, Quarter II 6%
-
00:45
New Zealand: Retail Sales, q/q, Quarter II 2.3% (forecast 1%)
-
00:30
New Zealand: Business NZ PMI, July 55.8
-
00:07
Schedule for today, Friday, Aug 12’2016
(time / country / index / period / previous value / forecast)
02:00 China Fixed Asset Investment July 9.0%
02:00 China Retail Sales y/y July 10.6% 10.5%
02:00 China Industrial Production y/y July 6.2% 6.1%
06:00 Germany CPI, m/m (Finally) July 0.1% 0.3%
06:00 Germany CPI, y/y (Finally) July 0.3% 0.4%
06:00 Germany GDP (QoQ) (Preliminary) Quarter II 0.7% 0.2%
06:00 Germany GDP (YoY) (Preliminary) Quarter II 1.3% 1.5%
06:45 France Non-Farm Payrolls (Preliminary) Quarter II 0.3%
09:00 Eurozone Industrial production, (MoM) June -1.2% 0.4%
09:00 Eurozone Industrial Production (YoY) June 0.5% 0.7%
09:00 Eurozone GDP (QoQ) (Revised) Quarter II 0.6% 0.3%
09:00 Eurozone GDP (YoY) (Revised) Quarter II 1.7% 1.6%
12:30 U.S. Retail sales July 0.6% 0.4%
12:30 U.S. Retail Sales YoY July 2.7%
12:30 U.S. Retail sales excluding auto August 0.7% 0.2%
12:30 U.S. PPI excluding food and energy, m/m July 0.4% 0.2%
12:30 U.S. PPI excluding food and energy, Y/Y July 1.3% 1.2%
12:30 U.S. PPI, m/m July 0.5% 0.1%
12:30 U.S. PPI, y/y July 0.3% 0.2%
14:00 U.S. Reuters/Michigan Consumer Sentiment Index (Preliminary) August 90 91.5
14:00 U.S. Business inventories June 0.2% 0.1%
-