Noticias del mercado
-
20:25
American focus: dollar regained lost ground
The US dollar rose against most major currencies after a decline earlier in the session. Support for US currency had data on initial applications for unemployment benefits. The number of Americans who first applied for unemployment benefits decreased last week, indicating that the labor market recovery. This was reported in the Labor Department report. The number of initial applications for unemployment benefits fell by 1,000 to a seasonally adjusted, reaching 264,000 in the week ended May 9th. Economists had expected 275,000 new claims. We also add the figure for the previous week has not been revised. Meanwhile, it became known that the moving average for 4 weeks, which smooths the volatile weekly data, fell by 7750 - up to 271,750 (the lowest value since April 2000). Meanwhile, the number of people who continue to receive unemployment benefits has not changed and amounted to 2.229 million. For the week ended April 18. Recall data on re-treatment come with a week delay.
In addition, the prices of US manufacturers decreased by the end of last month, a sign of stable low inflation in the economy. The Labor Department said the seasonally adjusted producer price index fell in April by 0.4%, offsetting an increase of 0.2% in the previous month. The main index, which excludes prices of food and energy, also fell 0.2%. Excluding food, energy, and trade services, producer price index rose 0.1%. Economists had expected an overall increase of 0.2%, while the main index - 0.1%. Compared to April last, producer prices fell by 1.3% and the core index rose by 0.8%. Recall, the producer price index, as well as most of the indicators of inflation, declining fairly steadily since the middle of last year. The drop mainly reflects cheaper oil, the cost of which exceeded $ 100 in the summer, but then fell below $ 50 earlier this year. Now oil is trading near $ 60. The report also reported that producer prices of energy decreased by 2.9% compared to March and by 24% per annum. Gasoline prices fell 4.7% last month, while the cost of food fell by 0.9% in monthly terms and by 4.2% per annum. Also, the data showed that the price index for intermediate demand, which tracks the cost of commodities used as raw materials for production, fell by 1.1% in April, recording the ninth monthly decline in a row. Compared to the previous year index decreased by 7.8% (maximum rate in September 2009).
The pound rose against the dollar earlier, approaching at the same time to a maximum of 27 November. Experts note that the pound managed to survive the dovish tone of the Quarterly inflation report the Bank of England, published yesterday, and now records the growth for the second week in a row. Investors pay attention to the statements of the Bank of England manager Mark Carney. Asked in an interview with BBC radio about changing the record low interest rates by this time next year, Carney said: "It's possible, but it depends on the evolution of the economy. We're not going to raise interest rates too early or too fast and slow down the economy" . Also, Carney said that the low productivity in the UK - one of the consequences of the financial crisis - will gradually rise. CB Chairman noted that the British economy will continue to be faced with "headwinds" from the weak global economic growth, the fiscal policy of the government and the strengthening of the pound sterling.
-
15:50
Option expiries for today's 10:00 ET NY cut
EUR/USD: $1.1300(E499mn), $1.1350(E225mn), $1.1400-10(E640mn), $1.1440-50(E650mn), $1.1500(E577mn)
USD/JPY: Y118.85($419mn), Y119.00($472mn), Y119.10($650mn), Y119.50($600mn), Y120.00($2.4bn)
GBP/USD: $1.5570(Gbp203mn)
EUR/GBP: Gbp0.7255(E200mn), Gbp0.7290(E405mn)
AUD/USD: $0.8030(A$200mn), $0.8075(A$217mn)
NZD/USD: $0.7600(NZ$267mn)
-
14:30
U.S.: PPI excluding food and energy, Y/Y, April 0.8% (forecast 1.1%)
-
14:30
U.S.: Initial Jobless Claims, May 264 (forecast 275)
-
14:30
Canada: New Housing Price Index, MoM, March 0% (forecast 0.1%)
-
14:30
U.S.: PPI excluding food and energy, m/m, April -0.2% (forecast 0.1%)
-
14:30
U.S.: Continuing Jobless Claims, 2229 (forecast 2240)
-
14:30
U.S.: PPI, m/m, April -0.4% (forecast 0.2%)
-
14:30
U.S.: PPI, y/y, April -1.3% (forecast -0.8%)
-
14:00
Orders
EUR/USD
Offers 1.1435 1.1450 1.1470 1.1485 1.1500 1.1550
Bids 1.1385 1.1360 1.1340 1.1300 1.1280 1.1250
GBP/USD
Offers 1.5800 1.5830 1.5850 1.5870 1.5885 1.5900
Bids 1.5750 1.5730 1.5700 1.5680 1.5655-60 1.5630 1.5600
EUR/GBP
Offers 0.7255-60 0.7280 0.7300
Bids 0.7200 0.7150 0.7130 0.7100 0.7085 0.7060
EUR/JPY
Offers 136.50 136.80 137.00 137.50
Bids 135.50 135.25 135.00 134.60 134.40 134.20 134.00
USD/JPY
Offers 119.30 119.60 119.80 120.00 120.25-30 120.50
Bids 118.85 118.65 118.50 118.35 118.00
AUD/USD
Offers 0.8100 0.8125 0.8150 0.8165 0.8180 0.8200
Bids 0.8060 0.8040 0.8025 0.8000 0.7985 0.7960 0.7930 0.7900-10
-
11:20
Option expiries for today's 10:00 ET NY cut
EUR/USD: $1.1300(E499mn), $1.1350(E225mn), $1.1400-10(E640mn), $1.1440-50(E650mn), $1.1500(E577mn)
USD/JPY: Y118.85($419mn), Y119.00($472mn), Y119.10($650mn), Y119.50($600mn), Y120.00($2.4bn)
GBP/USD: $1.5570(Gbp203mn)
EUR/GBP: Gbp0.7255(E200mn), Gbp0.7290(E405mn)
AUD/USD: $0.8030(A$200mn), $0.8075(A$217mn)
NZD/USD: $0.7600(NZ$267mn)
-
08:31
Japan: Prelim Machine Tool Orders, y/y , April 10.4%
-
08:27
Options levels on thursday, May 14, 2015:
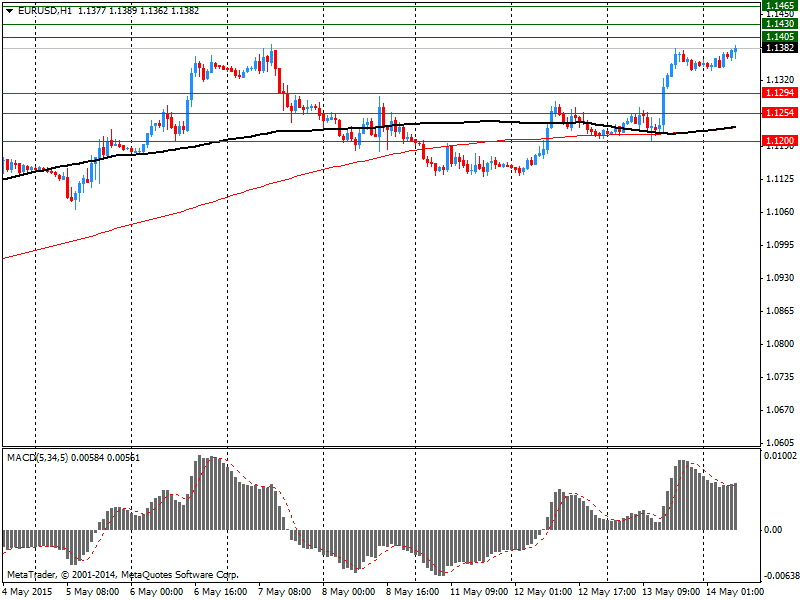
EUR / USD
Resistance levels (open interest**, contracts)
$1.1465 (4962)
$1.1430 (4491)
$1.1405 (3099)
Price at time of writing this review: $1.1382
Support levels (open interest**, contracts):
$1.1294 (1553)
$1.1254 (1023)
$1.1200 (4627)
Comments:
- Overall open interest on the CALL options with the expiration date June, 5 is 102555 contracts, with the maximum number of contracts with strike price $1,1500 (6249);
- Overall open interest on the PUT options with the expiration date June, 5 is 120327 contracts, with the maximum number of contracts with strike price $1,0800 (7594);
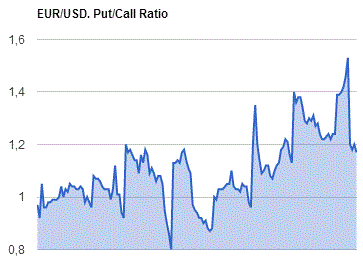
- The ratio of PUT/CALL was 1.17 versus 1.20 from the previous trading day according to data from May, 13

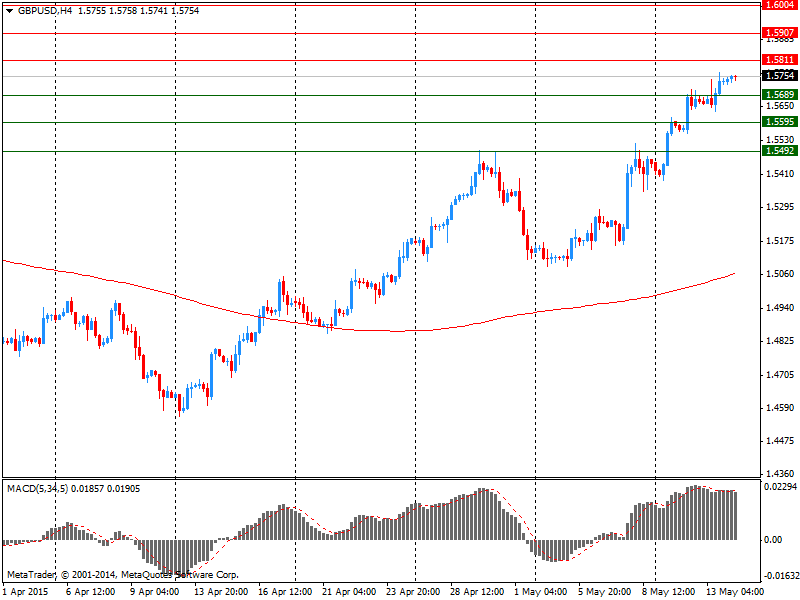
GBP/USD
Resistance levels (open interest**, contracts)
$1.6004 (1188)
$1.5907 (1326)
$1.5811 (1244)
Price at time of writing this review: $1.5754
Support levels (open interest**, contracts):
$1.5689 (336)
$1.5592 (905)
$1.5495 (1833)
Comments:
- Overall open interest on the CALL options with the expiration date June, 5 is 34379 contracts, with the maximum number of contracts with strike price $1,5700 (2620);
- Overall open interest on the PUT options with the expiration date June, 5 is 48337 contracts, with the maximum number of contracts with strike price $1,5000 (3316);
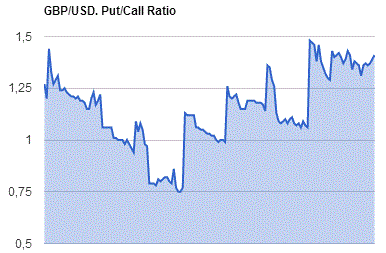
- The ratio of PUT/CALL was 1.41 versus 1.39 from the previous trading day according to data from May, 13

* - The Chicago Mercantile Exchange bulletin (CME) is used for the calculation.
** - Open interest takes into account the total number of option contracts that are open at the moment.
-
08:20
Foreign exchange market. Asian session
(Time/ Region/ Event/ Period/ Previous/ Forecast/ Actual)
The dollar was almost flat against the yen and the euro in directionless Asia trade Thursday, with disappointing U.S. retail sales data overnight keeping a lid on any strong gains in the greenback. But the U.S. currency's downside was well supported from dip buying from Japanese corporate investors.
The New Zealand dollar was sharply higher after getting an overnight lift from a weaker U.S. dollar and after strong domestic retail sales numbers. It got another good boost from New Zealand's first-quarter retail sales data, he said. Retail spending beat expectations to rise strongly in the first quarter, driven by a sharp increase in sales of electrical and electronic goods retailing. The volume of real retail sales in the first quarter rose 2.7% from the prior quarter. When the effect of price changes is included, adjusted retail sales rose 1.7% in the first quarter, according to Statistics New Zealand on Thursday. The median forecasts in a Wall Street Journal poll of 10 economists was for rises of 1.6% and 1.0%, respectively.
EUR / USD: during the Asian session the pair rose to $ 1.1375
GBP / USD: during the Asian session, the pair was trading in the $ 1.5725-55
USD / JPY: during the Asian session the pair traded in the range Y119.10-35
-
01:28
Currencies. Daily history for May 13’2015:
(pare/closed(GMT +3)/change, %)
EUR/JPY $1,1349 +1,13%
GBP/USD $1,5738 +0,44%
USD/CHF Chf0,9171 -1,24%
USD/JPY Y119,17 -0,55%
EUR/JPY Y135,25 +0,58%
GBP/JPY Y187,54 -0,11%
AUD/USD $0,8102 +1,46%
NZD/USD $0,7492 +1,13%
USD/CAD C$1,1957 -0,37%
-
00:46
New Zealand: Retail Sales YoY, Quarter I 5.1% (forecast 4.9%)
-
00:45
New Zealand: Retail Sales, q/q, Quarter I 2.7% (forecast 1.5%)
-
00:32
New Zealand: Business NZ PMI, April 51.8
-
00:00
Schedule for today, Thursday, May 14’2015:
(time / country / index / period / previous value / forecast)
06:00 France Bank holiday
06:00 Germany Bank Holiday
06:00 Japan Prelim Machine Tool Orders, y/y April 14.6%
06:00 Switzerland Bank holiday
12:30 Canada New Housing Price Index, MoM March 0.2% 0.1%
12:30 U.S. PPI, y/y April -0.8% -0.8%
12:30 U.S. PPI excluding food and energy, Y/Y April 0.9% 1.1%
12:30 U.S. Initial Jobless Claims May 265 275
12:30 U.S. Continuing Jobless Claims 2228 2240
12:30 U.S. PPI, m/m April 0.2% 0.2%
12:30 U.S. PPI excluding food and energy, m/m April 0.2% 0.1%
14:30 Canada Bank of Canada Review
-

