Noticias del mercado
-
16:17
Business inventories in the United States flat in July
The U.S. Census Bureau announced today that the combined value of distributive trade sales and manufacturers' shipments for July, adjusted for seasonal and trading-day differences but not for price changes, was estimated at $1,303.6 billion, down 0.2 percent (±0.1%) from June 2016 and was down 0.8 percent (±0.4%) from July 2015.
Inventories. Manufacturers' and trade inventories, adjusted for seasonal variations but not for price changes, were estimated at an end-of-month level of $1,813.2 billion, virtually unchanged (±0.1%)* from June 2016, but were up 0.5 percent (±0.6%)* from July 2015.
Inventories/Sales Ratio. The total business inventories/sales ratio based on seasonally adjusted data at the end of July was 1.39. The July 2015 ratio was 1.37.
-
16:00
U.S.: Business inventories , July 0.0% (forecast 0.1%)
-
15:50
Option expiries for today's 10:00 ET NY cut
EUR/USD: 1.1100 (EUR 974m) 1.1165 (333m) 1.1175 (319m) 1.1185 (331m) 1.1200 (1.13bln) 1.1245 (523m) 1.1260-65 (768m) 1.1275-85 (2.18bln) 1.1287 (390m) 1.1300 (373m) 1.1325 (555m) 1.1350 (580m) 1.1365 (503m)
USD/JPY: 100.00-05 (1.45bln) 101.00 (565m) 101.20 (489m) 102.00 (1.1bln) 102.20-25 (1.55bln) 103.00 (1.2bln) 103.50 (600m)
GBP/USD 1.3295-1.3300 (GBP 640m)
USD/CHF 0.9900 (USD 450m)
AUD/USD: 0.7388 (AUD 238m) 0.7500 (915m) 0.7530 (250m) 0.7600 (593m) 0.7676 (463m)
USD/CAD: 1.3150 (246m) 1.3400 (300m)
AUD/JPY 74.00 (AUD 450m) 75.00 (305m) 75.50 (500m) 78.50 (441m)
USD/SGD 1.3520 (543m) 1.3540 (2.95bln)
-
15:31
US Industrial production decline more than expected
Industrial production decreased 0.4 percent in August after rising 0.6 percent in July. Manufacturing output also declined 0.4 percent in August, reversing its increase in July; the level of the index in August is little changed from its level in March. Following two consecutive monthly increases, the index for utilities fell back 1.4 percent in August. Even so, the index was 1.7 percent above its year-earlier level, as hot temperatures this summer boosted the usage of air conditioning.
The output of mining moved up 1.0 percent in August, its fourth consecutive monthly increase following an extended downturn; the index, however, was still about 9 percent below its year-ago level. At 104.4 percent of its 2012 average, total industrial production in August was 1.1 percent lower than its year-earlier level. Capacity utilization for the industrial sector decreased 0.4 percentage point in August to 75.5 percent, a rate that is 4.5 percentage points below its long-run (1972-2015) average.
-
15:15
U.S.: Industrial Production (MoM), August -0.4% (forecast -0.3%)
-
15:15
U.S.: Capacity Utilization, August 75.5% (forecast 75.7%)
-
15:15
U.S.: Industrial Production YoY , August -1.1%
-
14:44
US regional manufacturing conditions continued to improve in September
Results from the Manufacturing Business Outlook Survey suggest that regional manufacturing conditions continued to improve in September. Indicators for general activity and new orders were positive and increased from their readings last month. Indicators for shipments and employment, however, were negative, suggesting weaker performance for the sector. Firms remain optimistic about growth over the next six months and were more positive about increasing employment.
The index for current manufacturing activity in the Philadelphia region increased 11 points to 12.8. For the first time since August of last year, the index has registered two consecutive positive readings.
-
14:41
US initial unemployment claims continue to decline
In the week ending September 10, the advance figure for seasonally adjusted initial claims was 260,000, an increase of 1,000 from the previous week's unrevised level of 259,000. The 4-week moving average was 260,750, a decrease of 500 from the previous week's unrevised average of 261,250.
There were no special factors impacting this week's initial claims. This marks 80 consecutive weeks of initial claims below 300,000, the longest streak since 1970.
-
14:38
US retail sales were down 0.3% in August
The U.S. Census Bureau announced today that advance estimates of U.S. retail and food services sales for August, adjusted for seasonal variation and holiday and trading-day differences, but not for price changes, were $456.3 billion, a decrease of 0.3 percent (±0.5%)* from the previous month, and 1.9 percent (±0.7%) above August 2015. Total sales for the June 2016 through August 2016 period were up 2.4 percent (±0.5%) from the same period a year ago.
The June 2016 to July 2016 percent change was revised from virtually unchanged (±0.5%)* to up 0.1 percent (±0.2%)*. Retail trade sales were down 0.5 (±0.5%)* from July 2016, and up 1.4 percent (±0.7%) from last year. Nonstore retailers were up 10.9 percent (±1.4%) from August 2015, while Health and Personal Care Stores were up 7.8 percent (±2.3%) from last year.
-
14:36
US Producer Price Index for final demand was unchanged in August
The Producer Price Index for final demand was unchanged in August, seasonally adjusted, the U.S. Bureau of Labor Statistics reported today. Final demand prices declined 0.4 percent in July and rose 0.5 percent in June. On an unadjusted basis, the final demand index was unchanged for the 12 months ended in August.
In August, a 0.1-percent advance in the index for final demand services offset a 0.4-percent decrease in prices for final demand goods.
Prices for final demand less foods, energy, and trade services increased 0.3 percent in August after no change in July. For the 12 months ended in August, the index for final demand less foods, energy, and trade services moved up 1.2 percent, the largest rise since climbing 1.3 percent for the 12 months ended December 2014. -
14:31
U.S.: Current account, bln, Quarter II -119.9 (forecast -120.5)
-
14:31
U.S.: Retail Sales YoY, August 1.9%
-
14:31
U.S.: Retail sales excluding auto, August -0.1% (forecast 0.2%)
-
14:30
U.S.: Initial Jobless Claims, 260 (forecast 265)
-
14:30
U.S.: PPI excluding food and energy, Y/Y, August 1.0% (forecast 1%)
-
14:30
U.S.: PPI excluding food and energy, m/m, August 0.1% (forecast 0.1%)
-
14:30
U.S.: Retail sales, August -0.3% (forecast -0.1%)
-
14:30
U.S.: Continuing Jobless Claims, 2143 (forecast 2140)
-
14:30
U.S.: PPI, m/m, August 0.0% (forecast 0.1%)
-
14:30
U.S.: PPI, y/y, August 0.0% (forecast 0.1%)
-
14:30
U.S.: NY Fed Empire State manufacturing index , September -1.99 (forecast -1)
-
14:30
U.S.: Philadelphia Fed Manufacturing Survey, September 12.8 (forecast 1.0)
-
14:24
European session review: the euro rebounded against the US dollar
The following data was published:
(Time / country / index / period / previous value / forecast)
7:30 Switzerland decision of the Swiss National Bank's base rate -0.75% -0.75% -0.75%
07:30 Meeting of Switzerland Swiss National Bank on Monetary Policy
8:30 UK Retail Sales m / m 1.9% Revised August from 1.4% -0.4% -0.2%
8:30 UK Retail sales, y / y in August to 6.3% Revised 5.9% 5.4% 6.2%
9:00 Eurozone Consumer Price Index m / m in August -0.6% 0.1% 0.1%
9:00 Eurozone Consumer Price Index y / y (final data) August 0.2% 0.2% 0.2%
09:00 Eurozone Consumer Price Index, the base value, y / y (final data) June 0.9% 0.8% 0.8%
9:00 The Eurozone trade balance, without seasonal adjustments in July 29.2 25 25.3
11:00 UK program volume BoE decision on asset purchases 435,435
11:00 UK Bank of England Minutes of the meeting
11:00 UK Bank of England Interest Rate Decision 0.25% 0.25%
The euro rebounded to the opening level against the US dollar after data on inflation and trade balance. Eurozone annual inflation was 0.2% in August 2016, stable compared with July. In August 2015, this figure was 0.1%. In the European Union annual inflation was 0.3% in August 2016, compared with 0.2% in July. A year earlier the rate was 0.0%. These figures are from Eurostat In August 2016 were reported negative rates in twelve Member States.
The lowest annual rates were recorded in Croatia (-1.5%), Bulgaria (-1.1%) and Slovakia (-0.8%). The highest rates were recorded in Belgium (2.0%), Sweden (1.2%) and Estonia (1.1%). Compared with July 2016, annual inflation fell in seven Member States, remained stable in six and rose in fifteen. The largest upward impact on the annual inflation in the euro area came from restaurants & cafés (+0.10 percentage points), fruits and vegetables (+0.07 percentage points), while fuels for transport (-0.35 p. n.), heating oil and gas (-0.12 percentage points) were the biggest downward impacts.
The British pound declined with delay after the Bank of England kept interest rates and quantitative easing program unchanged.
The statement was ambiguous, as the central bank's leaders recognized that a number of short-term economic indicators in some ways turned out to be stronger than expected. Also, they expect at least a significant slowdown in economic growth in the second half of the year.
The Bank of England left its key interest rate unchanged, but signaled its readiness to reduce it again later in the year if the UK's economic growth will continue to slow in line with expectations.
According to the text of the monthly statements of the Bank of England, all nine members of the Monetary Policy Committee at the September meeting unanimously voted to keep the key rate at 0.25%. In August, the rate was reduced to 0.25%.
The decision on lowering rates was part of a package of measurea to which the bank has resorted to support the economy after the unexpected results of the referendum on the UK's membership of the EU. The Bank of England also renewed an invalid bond purchase program and corporate securities included in the list of allowed for purchase.
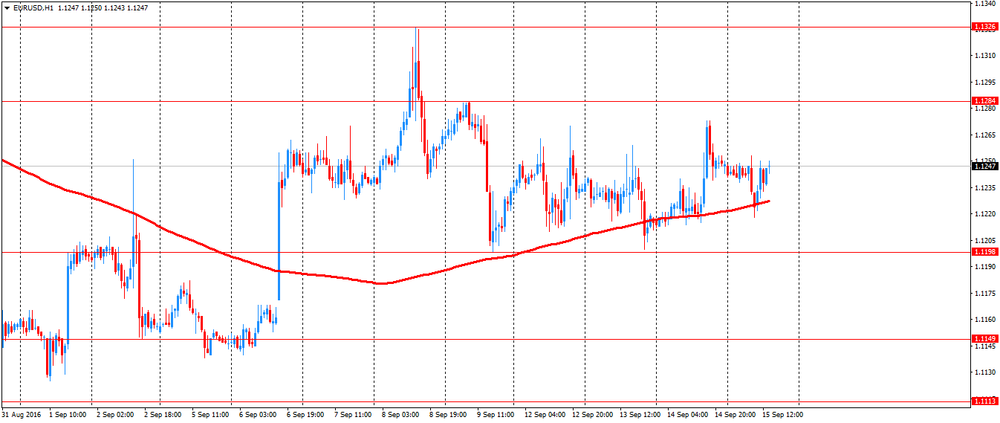
EUR / USD: during the European session the pair fell to $ 1.1218 and retreated
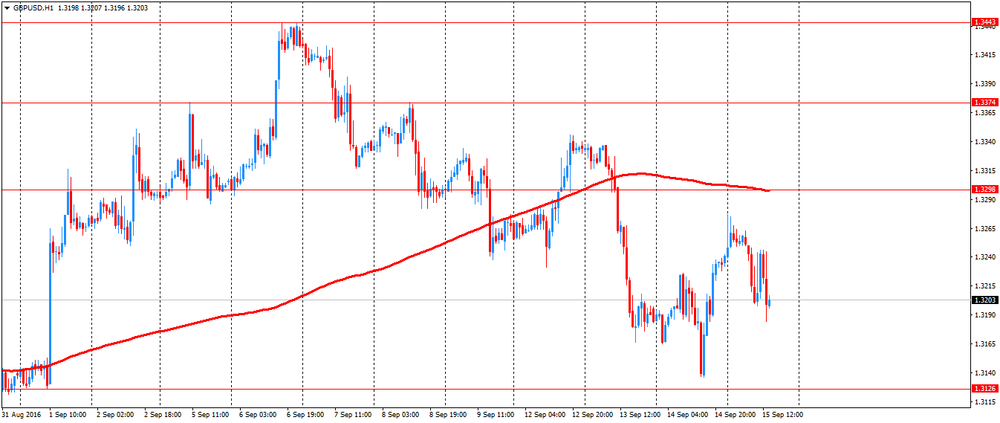
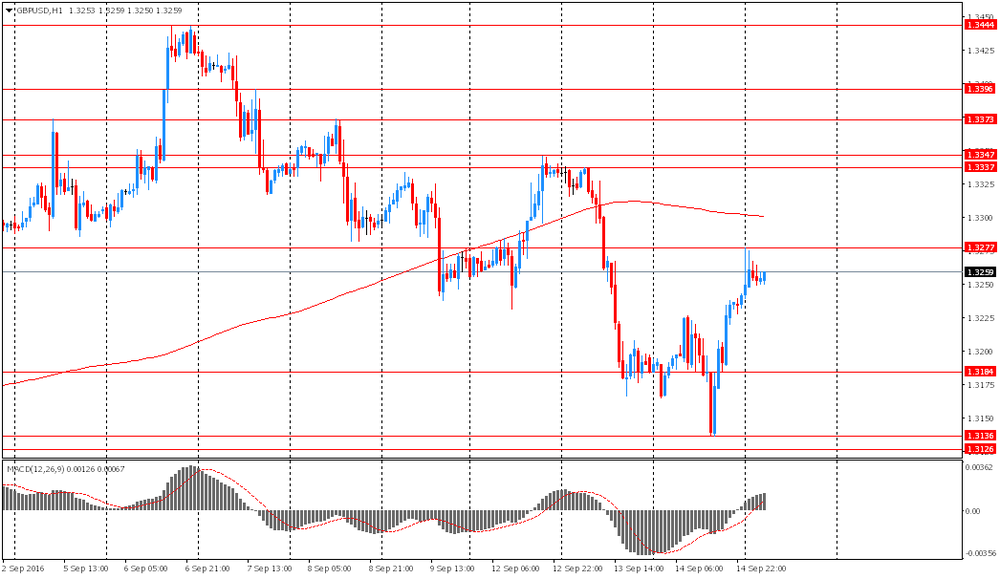
GBP / USD: during the European session, the pair fell to $ 1.3184
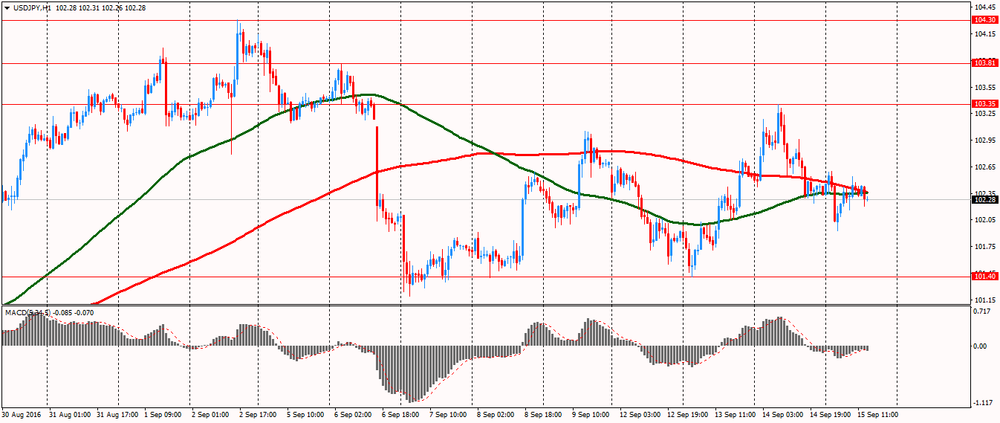
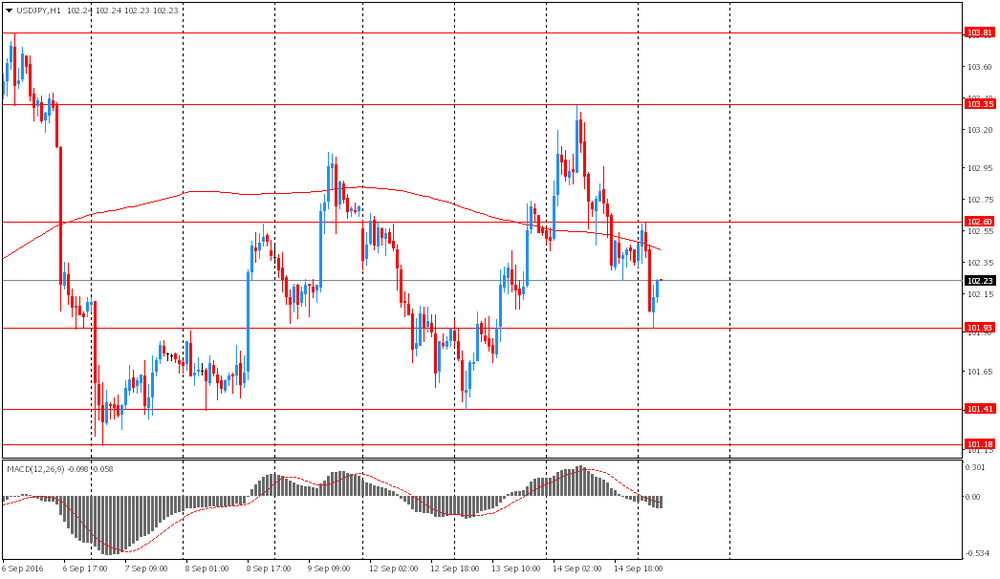
USD / JPY: during the European session, the pair rose to Y102.54
-
13:50
Orders
EUR/USD
Offers : 1.1250-55 1.1270 1.1285 1.1300 1.1325-30 1.1350 1.1365 1.1380 1.1400
Bids : 1.1215 1.1200 1.1185 1.1170 1.1145-50 1.1120 1.1100
GBP/USD
Offers : 1.3250 1.3280 1.3300 1.3335 1.3350-55 1.3380 1.3400
Bids : 1.3200 1.3180 1.3165 1.3150 1.3130 1.3100 1.3080 1.3050 1.3030 1.3000
EUR/GBP
Offers : 0.8525 0.8540 0.8560-65 0.8580 0.8600
Bids : 0.8480 0.8450 0.8420 0.8400 0.8385 0.8365 0.8350
EUR/JPY
Offers : 115.20-25 115.50 115.80 116.00 116.30 116.50
Bids : 114.80 114.65 114.50 114.20 114.00
USD/JPY
Offers : 102.60 1020.80-85 103.00 103.35 103.50 103.75 104.00
Bids : 102.20 102.00 101.75-80 101.60 101.40 101.20 101.00
AUD/USD
Offers : 0.7500 0.7520 0.7535 0.7550 0.7560 0.7580 0.7600 0.7630 0.7655-60
Bids : 0.7445-50 0.7420-25 0.7400 0.7385 0.7365 0.7350
-
13:09
The Bank of England holds rates and QE, the pound little changed so far
The Bank of England's Monetary Policy Committee (MPC) sets monetary policy to meet the 2% inflation target and in a way that helps to sustain growth and employment. At its meeting ending on 14 September 2016, the MPC voted unanimously to maintain Bank Rate at 0.25%. The Committee voted unanimously to continue with the programme of sterling non-financial investment-grade corporate bond purchases totalling up to £10 billion, financed by the issuance of central bank reserves. The Committee also voted unanimously to continue with the programme of £60 billion of UK government bond purchases.
-
13:00
United Kingdom: BoE Interest Rate Decision, 0.25% (forecast 0.25%)
-
13:00
United Kingdom: Asset Purchase Facility, 435 (forecast 435)
-
11:07
Eurozone trade balance improves slightly
The first estimate for euro area (EA19) exports of goods to the rest of the world in July 2016 was €167.2 billion, a decrease of 10% compared with July 2015 (€185.4 bn). Imports from the rest of the world stood at €142.0 bn, a fall of 8% compared with July 2015 (€154.4 bn). As a result, the euro area recorded a €25.3 bn surplus in trade in goods with the rest of the world in July 2016, compared with +€31.1 bn in July 2015. Intra-euro area trade fell to €137.3 bn in July 2016, down by 7% compared with July 2015.
These data are released by Eurostat, the statistical office of the European Union
-
11:05
Euro zone CPI stable at +0.2% y/y
Euro area annual inflation was 0.2% in August 2016, stable compared with July. In August 2015 the rate was 0.1%. European Union annual inflation was 0.3% in August 2016, up from 0.2% in July. A year earlier the rate was 0.0%. These figures come from Eurostat, the statistical office of the European Union. In August 2016, negative annual rates were observed in twelve Member States.
The lowest annual rates were registered in Croatia (-1.5%), Bulgaria (-1.1%) and Slovakia (-0.8%). The highest annual rates were recorded in Belgium (2.0%), Sweden (1.2%) and Estonia (1.1%). Compared with July 2016, annual inflation fell in seven Member States, remained stable in six and rose in fifteen.
The largest upward impacts to euro area annual inflation came from restaurants & cafés (+0.10 percentage points), fruit and vegetables (both +0.07 pp), while fuels for transport (-0.35 pp), heating oil and gas (both -0.12 pp) had the biggest downward impacts.
-
11:01
Eurozone: Harmonized CPI ex EFAT, Y/Y, August 0.8% (forecast 0.8%)
-
11:00
Eurozone: Trade balance unadjusted, July 25.3 (forecast 25)
-
11:00
Eurozone: Harmonized CPI, Y/Y, August 0.2% (forecast 0.2%)
-
11:00
Eurozone: Harmonized CPI, August 0.1% (forecast 0.1%)
-
10:36
UK retail sales surge 6.2% on year
According to ONS, in August 2016, the quantity bought (volume) of retail sales is estimated to have increased by 6.2% compared with August 2015; all store types except textile, clothing and footwear, and household goods showed growth with the main contribution coming from food stores.
The quantity bought decreased by 0.2% compared with July 2016; the largest contribution to the decrease came from non-food stores which was offset by increases in non-store retailing, predominantly food stores and petrol stations.
The underlying pattern in the retail sector is still one of growth with the 3 month on 3 month movement in the quantity bought increasing by 1.6%.
The amount spent (value) in the retail industry increased by 4.1% compared with August 2015 and decreased by 0.5% compared with July 2016.
The amount spent online increased by 18.5% compared with August 2015 and increased by 0.4% compared with July 2016.
Non-seasonally adjusted average store prices (including petrol stations) fell by 1.9% in August 2016 compared with August 2015.
-
10:30
United Kingdom: Retail Sales (MoM), August -0.2% (forecast -0.4%)
-
10:30
United Kingdom: Retail Sales (YoY) , August 6.2% (forecast 5.4%)
-
10:19
Option expiries for today's 10:00 ET NY cut
EUR/USD: 1.1100 (EUR 974m) 1.1165 (333m) 1.1175 (319m) 1.1185 (331m) 1.1200 (1.13bln) 1.1245 (523m) 1.1260-65 (768m) 1.1275-85 (2.18bln) 1.1287 (390m) 1.1300 (373m) 1.1325 (555m) 1.1350 (580m) 1.1365 (503m)
USD/JPY: 100.00-05 (1.45bln) 101.00 (565m) 101.20 (489m) 102.00 (1.1bln) 102.20-25 (1.55bln) 103.00 (1.2bln) 103.50 (600m)
GBP/USD 1.3295-1.3300 (GBP 640m)
USD/CHF 0.9900 (USD 450m)
AUD/USD: 0.7388 (AUD 238m) 0.7500 (915m) 0.7530 (250m) 0.7600 (593m) 0.7676 (463m)
USD/CAD: 1.3150 (246m) 1.3400 (300m)
AUD/JPY 74.00 (AUD 450m) 75.00 (305m) 75.50 (500m) 78.50 (441m)
USD/SGD 1.3520 (543m) 1.3540 (2.95bln)
-
09:39
Interest on sight deposits at the SNB is to remain at –0.75%
The Swiss National Bank (SNB) is maintaining its expansionary monetary policy. Interest on sight deposits at the SNB is to remain at -0.75% and the target range for the three-month Libor is unchanged at between -1.25% and -0.25%. At the same time, the SNB will remain active in the foreign exchange market, as necessary. The negative interest rate and the SNB's willingness to intervene in the foreign exchange market are intended to make Swiss franc investments less attractive, thereby easing upward pressure on the currency. The Swiss franc is still significantly overvalued.
The SNB's expansionary monetary policy is aimed at stabilising price developments and supporting economic activity. The new conditional inflation forecast has been revised slightly downwards compared to the June forecast. Up to the first quarter of 2017, the path of inflation remains almost the same. Thereafter, the slightly less favourable global economic outlook dampens inflation in Switzerland. For 2016, the inflation forecast remains unchanged at -0.4%. For 2017, the SNB expects inflation of 0.2%, compared to 0.3% forecast in the last quarter, while for 2018, the forecast has fallen from 0.9% to 0.6%. The conditional inflation forecast is based on the assumption that the three-month Libor remains at -0.75% over the entire forecast horizon. - SNB
-
09:29
Switzerland: SNB Interest Rate Decision, -0.75% (forecast -0.75%)
-
09:07
Today’s events
At 07:30 GMT the SNB decision on intrest rate
At 08:30 GMT Spain will hold an auction of 10-year bonds
At 11:00 GMT Bank of England's decision on intrest rate
Also today, China celebrates Mid-Autumn Festival
-
08:29
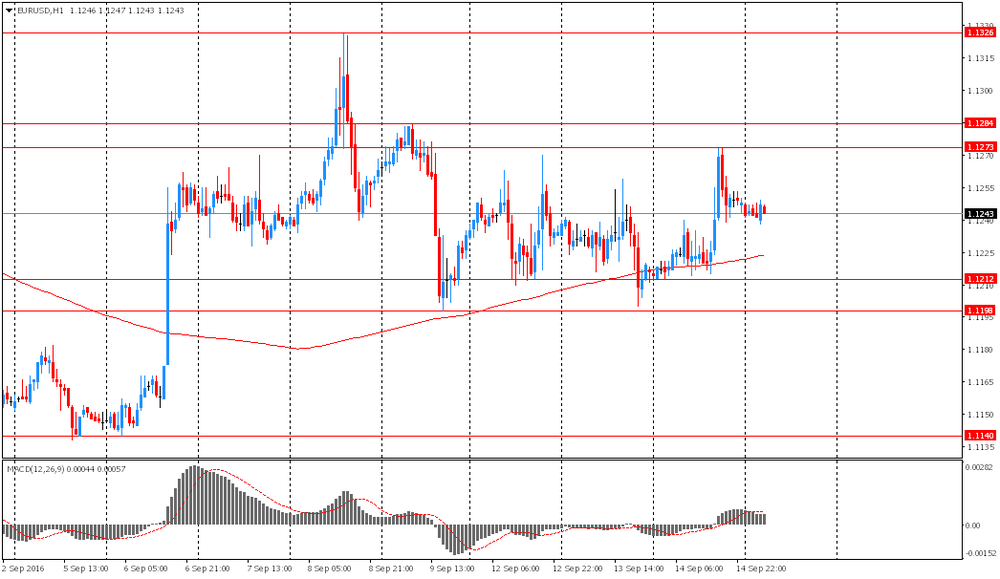
Options levels on thursday, September 15, 2016:
EUR/USD
Resistance levels (open interest**, contracts)
$1.1383 (2246)
$1.1342 (2080)
$1.1306 (425)
Price at time of writing this review: $1.1246
Support levels (open interest**, contracts):
$1.1183 (3119)
$1.1151 (3822)
$1.1115 (3658)
Comments:
- Overall open interest on the CALL options with the expiration date October, 7 is 35923 contracts, with the maximum number of contracts with strike price $1,1500 (5321);
- Overall open interest on the PUT options with the expiration date October, 7 is 38109 contracts, with the maximum number of contracts with strike price $1,1100 (5464);
- The ratio of PUT/CALL was 1.06 versus 1.06 from the previous trading day according to data from September, 14
GBP/USD
Resistance levels (open interest**, contracts)
$1.3504 (1805)
$1.3407 (2022)
$1.3310 (1063)
Price at time of writing this review: $1.3247
Support levels (open interest**, contracts):
$1.3190 (1962)
$1.3094 (803)
$1.2996 (3341)
Comments:
- Overall open interest on the CALL options with the expiration date October, 7 is 21967 contracts, with the maximum number of contracts with strike price $1,3450 (2773);
- Overall open interest on the PUT options with the expiration date October, 7 is 20797 contracts, with the maximum number of contracts with strike price $1,3000 (3341);
- The ratio of PUT/CALL was 0.95 versus 0.95 from the previous trading day according to data from September, 14
* - The Chicago Mercantile Exchange bulletin (CME) is used for the calculation.
** - Open interest takes into account the total number of option contracts that are open at the moment.
-
08:28
Asian session review: The Australian dollar accumulates
The Australian dollar little changed on the conflicting data from the labor market in Australia. As reported today by the Australian Bureau of Statistics the unemployment rate in August, seasonally adjusted, increased by 5.6%, below the growth in July and economists forecast of 5.7%. Also became known that the number of employees in August decreased by 3,900, while economists had expected growth to 15 000. The number of jobs to full-time employment increased in August by 11,500, while the number of jobs with part-time employment decreased by 15 400. The Bureau reported that that adjusted for seasonal variations in the percentage of the economically active population was 64.7% in August vs July .
The New Zealand dollar declined from the beginning of the session, after data on the GDP. New Zealand's GDP in the second quarter grew by 0.9%, which coincided with an increase in the first quarter, but was lower than economists' forecast of 1.1%. Compared with the same period of the previous year, GDP grew by 3.6%, after rising by 3.0%, which is well below the forecast of 3.7%. Exports increased 4.0%, the largest quarterly increase in nearly 20 years. This growth was driven by exports of dairy products, meat and fruit. Services sector continues to grow, with an increase of 0.7%.
Today, the focus is on the US economic statistics and Bank of England. Analysts predict that by the end of August, US retail sales decreased by 0.1%, while industrial production fell by 0.3%. As for inflation, it is expected that the CPI rose in August by 0.1% after flat in July. If these estimates are correct, this data is likely to increase the chances of a Fed hike in September.
EUR / USD: during the Asian session, the pair was trading in the $ 1.1240-50 range
GBP / USD: during the Asian session, the pair was trading in the $ 1.3240-75 range
USD / JPY: it fell to Y101.95
-
08:20
The big day for the pound is here. Retail sales and Bank of England’s decision on interest rate in a few hours. Hawkish? GBP/USD price action seems to favor optimism from BoE
-
08:06
Trading The SNB & The BoE - Views From Major Banks
"SNB Sep Meeting: Thurs Sep 15 - 3:30 AM ET.
Morgan Stanley: Bullish CHF On SNB Inaction; A Buy On Crosses.
We remain bullish on CHF and like buying crosses such as against CAD, AUD and JPY. This week, the SNB rates decision will be the main idiosyncratic risk event. Markets are pricing for a dovish SNB and a further 4bp rate cut by December, but we do not expect the SNB to change its policy. This gives potential for CHF to rally as markets get disappointed and adjust their rate expectations. Coupled with rising real yields, Switzerland's 10% of GDP current account surplus, and weak banks' balance sheets reducing the export of long-term capital, we think CHF has more room to the upside
Credit Agricole: SNB On Hold; CHF Remain The Most Overvalued G10 Currency.
CHF remains the most overvalued G10 currency and we expect it to underperform from here. For now the currency remains mainly driven by global risk sentiment. This is unlikely to change unless there is rising scope of the SNB considering additional policy action. Regardless of still muted price developments, it appears unlikely that the central bank will consider additional policy steps as soon as this week. This is especially true as global conditions have been pretty stable owing to, among others, less adverse contagion from the Brexit vote than initially feared. Nevertheless, as the overvalued currency is keeping monetary conditions too tight and as forward looking indicators such as the KOF leading one paint a more lacklustre picture, there is no scope of them considering a less dovish stance neither. If anything the central bank should stick to a policy mix consisting of negative interest rates and currency intervention and such prospects should keep the franc's safe haven appeal relatively low. Still, risk sentiment will stay an important driver. As a result to the above outlined conditions we expect crosses such as EUR/CHF to remain well supported.
Barclays: No Change From The SNB; EUR/CHF Neutral.
We expect the SNB to keep its policy settings unchanged at its September meeting (Thursday) including its policy rate at -0.75%, the target range for the three-month Libor at -1.25/-0.25% and the exemption from negative deposit rates it gives on the majority of domestic banks' reserves. Subdued market volatility since Brexit, has implied a c.1.6% CHF REER depreciation, which in addition to a modest improvement in Swiss data, should keep the SNB comfortably on hold, in our view. Reduced pressure for the SNB to act can also be implied by the decline in our estimates of FX intervention since June (Figure 5). We expect the policy announcement to be neutral for EURCHF.
BoE Sep Meeting: Thurs Sep 15 - 7:00 AM ET.
Credit Suisse: BoE To Tweak Dovish Tone; GBP/USD A Buy.
We expect BoE to marginally tweak down its dovish tone this week, which should give a brief lift to the pound.We see little incentive for the MPC to be any more dovish than the market is already pricing in for the remainder of the year (around 7bp of cuts). In fact, at this point the BoE may now even want to avoid raising the market's expectations for additional easing, given some of the glitches it has had with QE bond shortages and the uncertainty of whether it needs to save ammunition for a 'hard-Brexit'. The MPC may take advantage of the stretch of recent data to paint a more balanced 'wait-and-see' message - perhaps by sounding encouraged by the pass-through of the recent rate cut or more concerned about the upside inflation risks. While FX markets do not seem to be pricing in a particularly eventful or dovish MPC meeting, positioning remains highly short in GBP, and the pound has not hesitated to rally in response to local data and MPC guidance.
Credit Agricole: Limited Scope For A Surprise; Limited GBP Upside From Here.
When it comes to the BoE, we see limited scope for a surprise. If anything, the central bank should leave all options open when it comes to the need for further policy measures, as overall uncertainty - for instance, related to next year's Brexit negotiations - should persist. Such an outcome would be fully in line with last week's testimony in front of parliament. If anything, one should therefore expect central bank rate expectations to remain strongly capped and such prospects are likely to prevent the currency from facing more sustainable upside from the current levels. This is especially true as speculative short positioning may be less elevated as for instance suggested by IMM data alone.
Barclays: BoE On Hold On Thurs; GBP/USD En-Route To 1.27 By Year-End.
This week's BoE meeting (Thursday) will be the key event risk for GBP and we expect no change in the MPC's monetary policy settings. We look for unanimous voting in favour of the status quo for the current APF (9-0) but do believe that dovish Committee member Gertjan Vlieghe is likely to dissent and vote for a cut (8-1). Moreover, we expect the minutes to echo the testimony of Governor Mark Carney and Committee members Jon Cunliffe, Kristin Forbes, and Gertjan Vlieghe to the Treasury Select Committee and think the MPC is comfortable with its recently announced easing package. A confirmation of this and openness towards further easing, should downside risks to the economy materialize, will likely keep GBPUSD under pressure, in our view. Barclays targets GBP/USD at 1.27 by the end of the year".
Copyright © 2016 eFXplus™
-
08:01
Van Rompuy: Brexit talks unlikely to start much before end-2017
-
substantive Brexit talks between the UK and the rest of the EU are unlikely to start much before the end of 2017
-
negotiations were unlikely until a new German government was formed after next September's election
-
UK's decision to leave the EU was a "political amputation"
Former European Council president, Van Rompuy.*via forexlive -
-
07:46
New Zeeland’s GDP growth this quarter is being driven by strong domestic and export demand
Gross domestic product increased 0.9 percent in the June 2016 quarter, following a revised increase of 0.9 percent in the March 2016 quarter, Statistics New Zealand said today.
" Growth this quarter is being driven by strong domestic and export demand," national accounts senior manager Gary Dunnet said. "Household spending was up 1.9 percent, with Kiwis spending more on going away, eating out, and furnishing their houses."
Strong international demand saw exports increase 4.0 percent, with exports of goods posting its biggest quarterly increase in nearly 20 years. This increase was driven by exports of dairy products, meat, and fruit.
"Eleven of the 16 industries were up this quarter, with construction once again providing a boost to production."
Construction grew 5.0 percent, with all construction sub-industries showing increases. This growth also reflected higher construction-related investment, with investment in residential building strongly increasing.
Service industries continued to grow, with a 0.7 percent increase. The main drivers were rental, hiring, and real estate services; retail trade; and health care.
GDP per capita increased 0.5 percent this quarter, following a 0.3 percent increase in the March quarter.
Annual GDP growth for the year ended June 2016 increased to 2.8 percent. The size of the economy in current prices was $252 billion.
-
07:39
Mixed data from Australian labor force
- Employment increased 9,900 to 11,965,100.
- Unemployment decreased 400 to 721,000.
- Unemployment rate remained steady at 5.7%.
- Participation rate remained steady at 64.8%.
- Monthly hours worked in all jobs increased 1.7 million hours to 1,657.1 million hours.
- Employment decreased 3,900 to 11,963,700. Full-time employment increased 11,500 to 8,166,100 and part-time employment decreased 15,400 to 3,797,700.
- Unemployment decreased 10,500 to 713,300. The number of unemployed persons looking for full-time work increased 14,900 to 496,900 and the number of unemployed persons only looking for part-time work decreased 25,400 to 216,400.
- Unemployment rate decreased 0.1 pts to 5.6%.
- Participation rate decreased 0.2 pts to 64.7%.
- Monthly hours worked in all jobs decreased 3.9 million hours to 1,656.0 million hours.
-
03:32
Australia: New Motor Vehicle Sales (MoM) , August 0.1%
-
03:32
Australia: New Motor Vehicle Sales (YoY) , August 2.9%
-
03:30
Australia: Changing the number of employed, August -3.9 (forecast 15)
-
03:30
Australia: Unemployment rate, August 5.6% (forecast 5.7%)
-
03:02
Australia: Consumer Inflation Expectation, 3.3%
-
00:46
New Zealand: GDP q/q, Quarter II 1.2% (forecast 1.1%)
-
00:45
New Zealand: GDP y/y, Quarter II 2.8% (forecast 3.7%)
-
00:30
New Zealand: Business NZ PMI, August 55.1
-
00:29
Currencies. Daily history for Sep 14’2016:
(pare/closed(GMT +3)/change, %)
EUR/USD $1,1248 +0,29%
GBP/USD $1,3241 +0,43%
USD/CHF Chf0,9728 -0,44%
USD/JPY Y102,33 -0,21%
EUR/JPY Y115,12 +0,10%
GBP/JPY Y135,5 +0,23%
AUD/USD $0,7473 -2,52%
NZD/USD $0,7292 +0,59%
USD/CAD C$1,3194 +0,25%
-
00:06
Schedule for today,Thursday, Sep 15’2016
01:00 Australia Consumer Inflation Expectation 3.7%
01:30 Australia New Motor Vehicle Sales (MoM) August -1.3%
01:30 Australia New Motor Vehicle Sales (YoY) August 1.6%
01:30 Australia RBA Bulletin
01:30 Australia Changing the number of employed August 26.2 15
01:30 Australia Unemployment rate August 5.7% 5.7%
07:30 Switzerland SNB Interest Rate Decision -0.75% -0.75%
07:30 Switzerland SNB Monetary Policy Assessment
08:30 United Kingdom Retail Sales (MoM) August 1.4% -0.4%
08:30 United Kingdom Retail Sales (YoY) August 5.9% 5.4%
09:00 Eurozone Harmonized CPI August -0.6% 0.1%
09:00 Eurozone Harmonized CPI, Y/Y (Finally) August 0.2% 0.2%
09:00 Eurozone Harmonized CPI ex EFAT, Y/Y (Finally) August 0.9% 0.8%
09:00 Eurozone Trade balance unadjusted July 29.2 25
11:00 United Kingdom Asset Purchase Facility 435 435
11:00 United Kingdom Bank of England Minutes
11:00 United Kingdom BoE Interest Rate Decision 0.25% 0.25%
12:30 U.S. Continuing Jobless Claims 2144 2140
12:30 U.S. Current account, bln Quarter II -124.7 -120.5
12:30 U.S. Retail sales August 0% -0.1%
12:30 U.S. Retail Sales YoY August 2.3%
12:30 U.S. Retail sales excluding auto August -0.3% 0.2%
12:30 U.S. NY Fed Empire State manufacturing index September -4.21 -1
12:30 U.S. Initial Jobless Claims 259 265
12:30 U.S. Philadelphia Fed Manufacturing Survey September 2 1.0
12:30 U.S. PPI, m/m August -0.4% 0.1%
12:30 U.S. PPI, y/y August -0.2% 0.1%
12:30 U.S. PPI excluding food and energy, m/m August -0.3% 0.1%
12:30 U.S. PPI excluding food and energy, Y/Y August 0.7% 1%
13:15 U.S. Capacity Utilization August 75.9% 75.7%
13:15 U.S. Industrial Production (MoM) August 0.7% -0.3%
13:15 U.S. Industrial Production YoY August -0.5%
14:00 U.S. Business inventories July 0.2% 0.1%
-