Noticias del mercado
-
23:57
Schedule for today, Wednesday, May 18’2016:
(time / country / index / period / previous value / forecast)
01:00 Australia RBA Assist Gov Debelle Speaks
01:30 Australia Wage Price Index, q/q Quarter I 0.5% 0.5%
01:30 Australia Wage Price Index, y/y Quarter I 2.2% 2.2%
08:30 United Kingdom Average Earnings, 3m/y March 1.8% 1.7%
08:30 United Kingdom Average earnings ex bonuses, 3 m/y March 2.2% 2.3%
08:30 United Kingdom ILO Unemployment Rate March 5.1% 5.1%
08:30 United Kingdom Claimant count April 6.7 4
09:00 Eurozone Harmonized CPI ex EFAT, Y/Y (Finally) April 1% 0.7%
09:00 Eurozone Harmonized CPI April 1.2%
09:00 Eurozone Harmonized CPI, Y/Y (Finally) April 0.0% -0.2%
11:00 U.S. MBA Mortgage Applications May 0.4%
12:30 Canada Foreign Securities Purchases March 15.94
14:30 U.S. Crude Oil Inventories May -3.41
18:00 U.S. FOMC meeting minutes
23:50 Japan Core Machinery Orders, y/y April -0.7% 0.8%
23:50 Japan Core Machinery Orders March -9.2% 0.5%
-
21:02
DJIA 17516.66 -194.05 -1.10%, NASDAQ 4715.00 -60.45 -1.27%, S&P 500 2045.79 -20.87 -1.01%
-
18:17
European stocks close: stocks traded mixed on falling shares of the automobile manufacturers
Stock closed mixed on a drop in shares of the automobile manufacturers.
Market participants also eyed the trade data from the Eurozone. Eurostat released its trade data for the Eurozone on Tuesday. Eurozone's unadjusted trade surplus climbed to €28.6 billion from €19.0 billion in February.
Exports fell at an unadjusted annual rate of 3.0% in March, while imports dropped 8.0%.
The Office for National Statistics (ONS) released the consumer price inflation data for the U.K. on Tuesday. The U.K. consumer price index fell to 0.3% year-on-year in April from 0.5% in March. Analysts had expected to remain unchanged at 0.5%.
The decrease was mainly driven by declines in air fares and prices for clothing, vehicles and social housing rent.
On a monthly basis, U.K. consumer prices increased 0.1% in April, missing expectations for a 0.3% gain, after a 0.4% rise in March.
Consumer price inflation excluding food, energy, alcohol and tobacco prices declined to 1.2% year-on-year in April from 1.5% in March, missing expectations for a decrease to 1.4%.
The U.K. house price index increased at a seasonally adjusted rate of 2.5% in March, after a 0.2% gain in February.
On a yearly basis, the U.K. house price index increased at a seasonally adjusted rate of 9.0% in March, after a 7.6% rise in February. It was the biggest rise since March 2015.
Indexes on the close:
Name Price Change Change %
FTSE 100 6,167.77 +16.37 +0.27 %
DAX 9,890.19 -62.71 -0.63 %
CAC 40 4,297.57 -14.71 -0.34 %
-
18:03
New motor vehicle sales in Australia slide 2.5% in April
The Australian Bureau of Statistics released its new motor vehicle sales data on Tuesday. New motor vehicle sales in Australia slid 2.5% in April, missing expectations for a 0.5% fall, after a 2.2% rise in March.
Sales of passenger vehicles declined 1.2% in April, sales of sports utility vehicles were down 2.6%, while sales of other vehicles plunged 4.8%.
On a yearly basis, new motor vehicle sales climbed 2.4% in April, after a 4.2% increase in February.
-
18:02
European stocks closed: FTSE 6167.77 16.37 0.27%, DAX 9890.19 -62.71 -0.63%, CAC 40 4297.57 -14.71 -0.34%
-
17:55
Reserve Bank of New Zealand’s inflation expectations for the next 12 months rise to 1.22% in the three months to May
According to the Reserve Bank of New Zealand's survey published on Tuesday, New Zealand's inflation expectations for the next 12 months rose to 1.22% in the three months to May from 1.09% the previous quarter.
Inflation expectations for the next 24 months were up to 1.64% from 1.63%.
-
17:46
Final industrial production in Japan climbs 3.8% in March
Japan's Ministry of Economy, Trade and Industry released its final industrial production data on Tuesday. Final industrial production in Japan climb 3.8% in March, up from the preliminary estimate of a 3.6% rise, after a 5.2% decrease in February.
Industrial shipments rose 1.8% in March, while inventories jumped 2.9%.
On a yearly basis, Japan's industrial production was up 0.2% in March, up from the preliminary estimate of a 0.1% gain, after a 1.2% drop in February.
-
17:37
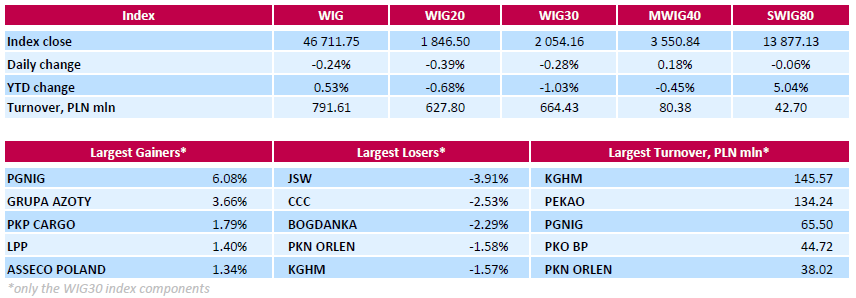
WSE: Session Results
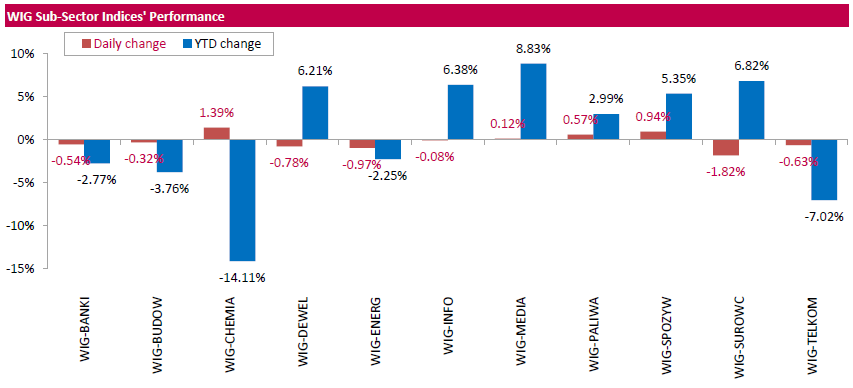
Polish equity market closed lower on Tuesday. The broad market benchmark, the WIG Index, lost 0.24%. Within the WIG index performance was mixed, with chemicals (+1.39%) outperforming and materials (-1.82%) lagging.
The large-cap stocks' measure, the WIG30 Index, fell by 0.28%. The decliners were led by coking coal producer JSW (WSE: JSW), which corrected downwards by 3.91% after two consecutive sessions of growth. Other major laggards were footwear retailer CCC (WSE: CCC), thermal coal miner BOGDANKA (WSE: LWB), oil refiner PKN ORLEN (WSE: PKN) and copper producer KGHM (WSE: KGH), which plunged by 2.53%, 2.29%, 1.58% and 1.57% respectively. On the other side of the ledger, oil and gas producer PGNIG (WSE: PGN) recorded the strongest daily result, climbing by 6.08% on analyst upgrade. It was followed by chemical producer GRUPA AZOTY (WSE: ATT) and railway freight transport operator PKP CARGO (WSE: PKP), advancing 3.66% and 1.79% respectively.
-
17:26
Bundesbank’s monthly report: Germany's economy is expected to lose momentum in spring
Germany's Bundesbank released its monthly report on Tuesday. The central bank said that Germany's economy was expected to lose momentum in spring.
"The consistently upbeat labour market, rising income expectations along with stable prices will keep consumption activity buoyant, they write, but the unlikely prospect of a further drop in oil prices leads them to believe that the sizeable purchasing power gains in the past two quarters will dwindle," the report said.
"The solid underlying cyclical trend would probably remain intact into the second quarter," Bundesbank added.
-
17:16
European Central Bank Governing Council member Jens Weidmann: the government bonds purchases by the ECB are problematic
The European Central Bank (ECB) Governing Council member and Bundesbank President Jens Weidmann said in an interview with German newspaper Die Welt that he thought the government bonds purchases by the ECB were problematic as central bank become the biggest creditors that states.
He also said that the criticism on the recent stimulus measures by the ECB was driven by some measures that blurred the lines between monetary and fiscal policy.
-
16:59
Wall Street. Major U.S. stock-indexes slightly fell
Major U.S. stock-indexes lower on Tuesday as data showed U.S. consumer prices recorded their biggest increase in more than three years in April, raising the chances of an interest rate hike this year. The Labor Department said the Consumer Price Index increased 0,4% last month, the largest gain since February 2013, after rising 0,1% in March. That took the year-on-year increase in the CPI to 1,1% from 0,9% in March.
Most of Dow stocks in negative area (24 of 30). Top looser - Microsoft Corporation (MSFT, -1,97). Top gainer - E. I. du Pont de Nemours and Company (DD, +0,78%).
Most of S&P sectors also in negative area. Top looser - Consumer goods (-1,0%). Top gainer - Basic Materials (+0,6%).
At the moment:
Dow 17607.00 -57.00 -0.32%
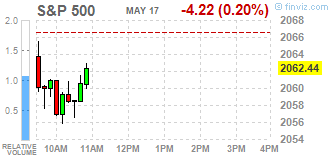
S&P 500 2056.50 -6.25 -0.30%
Nasdaq 100 4353.50 -21.75 -0.50%
Oil 48.13 +0.41 +0.86%
Gold 1282.90 +8.70 +0.68%
U.S. 10yr 1.75 -0.01
-
16:31
Italian economy is expected to expand 1.1% in 2016
The Italian statistical office Istat released its gross domestic product (GDP) forecast data for Italy on Tuesday. The Italian GDP is expected to rise 1.1% this year, down from the previous forecast of 1.4% growth, after a 0.8% rise last year.
According to the Istat, domestic demand is expected to rise 1.3% this year, residential households consumption expenditure to increase 1.4%, while exports to climb 1.7% and imports to jump 2.3%.
-
16:10
Italy’ trade surplus widens to €5.36 billion in March
The Italian statistical office Istat released its trade data for Italy on Tuesday. Italy' trade surplus widened to €5.36 billion in March from €3.86 billion in February.
Exports fell 1.1% year-on-year in March, while imports decreased 5.9%.
On a monthly basis, exports declined a seasonally-adjusted 1.4% in March, while imports were down 2.4%.
The seasonally-adjusted trade surplus with the EU was €1.18 billion in March, while the trade surplus with non-EU countries was €3.50 billion.
-
15:55
U.S. weekly earnings rise 0.2% in April
The U.S. Labor Department released its real earnings data on Tuesday. Average weekly earnings rose 0.2% in April, after a 0.1% increase in March. March's figure was revised down from a 0.2% gain.
Average hourly earnings decreased 0.1% in April, after a 0.2% rise in March.
On a yearly basis, real average weekly earnings increased 1.3% in April, while hourly earnings rose 1.3%.
-
15:55
Option expiries for today's 10:00 ET NY cut
USDJPY 107.50 (USD 243m) 108.70-75 (343m) 109.30 (USD 576m) 110.00 (607m) 110.50 (600m)
EURUSD: 1.1275-80 (EUR 640m) 1.1295-1.1300 (290m) 1.1450 (1.19bln) 1.1500 (779m)
USDCHF 0.9630 (USD 200m)
USDCAD 1.2500 (USD 800m) 1.2695-1.2700 (563m) 1.2840 (370m) 1.2880 (630m) 1.2990 (410m) 1.3195-1.3200 (600m)
-
15:43
WSE: After start on Wall Street
In the afternoon we met data from the US economy. Marginally higher CPI m / m and stronger data from the construction market. Good was also information on industrial production. Market participants have now a number of arguments from the publication for the dollar being pushed in the direction of strengthening (better data = risk of tightening Fed policy). That has not happening yet.
U.S. Stocks open: Dow -0.20%, Nasdaq -0.12%, S&P -0.19%
The very beginning of the session in the US is declining.
-
15:37
U.S. industrial production rises 0.7% in April
The Federal Reserve released its industrial production report on Tuesday. The U.S. industrial production rose 0.7% in April, exceeding expectations for a 0.3% increase, after a 0.9% drop in March. March's figure was revised down from a 0.6% decrease.
The increase was mainly driven by a rise in utilities. Mining output fell 2.3% in April, while utilities production climbed 5.8%.
Manufacturing output was up 0.3% in April, after a 0.3% increase in March.
Capacity utilisation rate increased to 75.4% in April from 74.9% in March, beating expectations for a rise to 75.0%. March's figure was revised up from 74.8%.
-
15:33
U.S. Stocks open: Dow -0.20%, Nasdaq -0.12%, S&P -0.19%
-
15:27
Before the bell: S&P futures -0.23%, NASDAQ futures -0.14%
U.S. stock-index futures fell.
Global Stocks:
Nikkei 16,652.8 +186.40 +1.13%
Hang Seng 20,118.8 +234.85 +1.18%
Shanghai Composite 2,843.73 -7.13 -0.25%
FTSE 6,161.67 +10.27 +0.17%
CAC 4,294.85 -17.43 -0.40%
DAX 9,891.44 -61.46 -0.62%
Crude $47.87 (+0.31%)
Gold $1275.80 (+0.13%)
-
15:15
U.S.: Industrial Production (MoM), April 0.7% (forecast 0.3%)
-
15:15
U.S.: Capacity Utilization, April 75.4% (forecast 75%)
-
15:15
U.S.: Industrial Production YoY , April -1.1%
-
15:01
U.S. consumer price inflation rises 0.4% in April
The U.S. Labor Department released consumer price inflation data on Tuesday. The U.S. consumer price inflation rose 0.4% in April, exceeding expectations for a 0.3% gain, after a 0.1% increase in March.
The index was mainly driven by higher energy prices, which climbed 3.4% in April.
Shelter costs climbed 0.3% in April, medical care costs were up 0.3%, while food prices increased 0.2%.
On a yearly basis, the U.S. consumer price index increased to 1.1% in April from 0.9% in March, in line with expectations.
The U.S. consumer price inflation excluding food and energy gained 0.2% in April, in line with expectations, after a 0.1% increase in March.
The increase was mainly driven by rises in shelter, medical care, motor vehicle insurance, airline fares, recreation, and education costs.
On a yearly basis, the U.S. consumer price index excluding food and energy fall to 2.1% in April from 2.2% in March, in line with forecasts.
The consumer price index is not preferred Fed's inflation measure.
-
14:55
Wall Street. Stocks before the bell
(company / ticker / price / change ($/%) / volume)
ALCOA INC.
AA
9.29
0.01(0.1078%)
36594
Amazon.com Inc., NASDAQ
AMZN
709.17
-1.49(-0.2097%)
5162
AMERICAN INTERNATIONAL GROUP
AIG
55.7
0.42(0.7598%)
5029
Apple Inc.
AAPL
94.13
0.25(0.2663%)
317965
AT&T Inc
T
39.33
0.05(0.1273%)
2804
Barrick Gold Corporation, NYSE
ABX
18.93
0.02(0.1058%)
80481
Caterpillar Inc
CAT
70.7
-0.00(-0.00%)
257
Chevron Corp
CVX
101.08
-0.14(-0.1383%)
8146
Cisco Systems Inc
CSCO
26.97
-0.00(-0.00%)
12166
Citigroup Inc., NYSE
C
42.95
-0.20(-0.4635%)
6819
Exxon Mobil Corp
XOM
89.35
-0.22(-0.2456%)
3641
Facebook, Inc.
FB
118.6
-0.07(-0.059%)
63798
Ford Motor Co.
F
13.24
-0.08(-0.6006%)
89512
Freeport-McMoRan Copper & Gold Inc., NYSE
FCX
11.26
0.22(1.9928%)
320549
General Electric Co
GE
29.95
-0.01(-0.0334%)
13264
General Motors Company, NYSE
GM
30.45
-0.22(-0.7173%)
15814
Hewlett-Packard Co.
HPQ
11.7
0.06(0.5155%)
4502
Home Depot Inc
HD
134.2
-1.14(-0.8423%)
484951
Intel Corp
INTC
30.4
0.01(0.0329%)
9214
International Paper Company
IP
42
-0.21(-0.4975%)
1900
JPMorgan Chase and Co
JPM
61.46
-0.20(-0.3244%)
1825
Microsoft Corp
MSFT
51.45
-0.02(-0.0389%)
10220
Nike
NKE
57.2
0.06(0.105%)
3271
Pfizer Inc
PFE
33.45
0.07(0.2097%)
767
Procter & Gamble Co
PG
81.89
0.26(0.3185%)
300
Starbucks Corporation, NASDAQ
SBUX
55.54
0.01(0.018%)
273
Tesla Motors, Inc., NASDAQ
TSLA
208.5
0.21(0.1008%)
9249
The Coca-Cola Co
KO
45.75
0.13(0.285%)
2273
Twitter, Inc., NYSE
TWTR
14.21
-0.08(-0.5598%)
18058
Verizon Communications Inc
VZ
51.21
-0.02(-0.039%)
360
Visa
V
77.8
0.00(0.00%)
250
Wal-Mart Stores Inc
WMT
66.09
0.07(0.106%)
886
Walt Disney Co
DIS
100.7
0.34(0.3388%)
5304
Yahoo! Inc., NASDAQ
YHOO
37.46
-0.02(-0.0534%)
7361
Yandex N.V., NASDAQ
YNDX
19.55
-0.26(-1.3125%)
1400
-
14:52
Housing starts in the U.S. climb 6.6% in April
The U.S. Commerce Department released the housing market data on Tuesday. Housing starts in the U.S. climbed 6.6% to 1.172 million annualized rate in April from a 1.099 million pace in March, exceeding expectations for an increase to 1.130 million. March's figure was revised up from 1.089 million units.
The increase was driven by rises in starts of single-family and multi-family homes.
Housing market benefits from the strengthening of the labour market.
Building permits in the U.S. rose 3.6% to 1.116 million annualized rate in April from a 1.077 million pace in March, missing expectations for a 1,140 million pace. March's figure was revised up from 1.076 million units.
Starts of single-family homes rose 3.3% in April. Building permits for single-family homes were up 1.5%.
Starts of multi-family buildings jumped 13.9% in April. Permits for multi-family housing climbed 8.0%.
-
14:43
Upgrades and downgrades before the market open
Upgrades:
Freeport-McMoRan (FCX) upgraded to Buy from Hold at Jefferies
Downgrades:
Other:
Intel (INTC) initiated with an Underperform at Credit Agricole
AT&T (T) target raised to $44 from $42 at DA Davidson
-
14:40
Canadian manufacturing shipments drop 0.9% in March
Statistics Canada released manufacturing shipments on Tuesday. Canadian manufacturing shipments declined 0.9% in March, beating expectations for a 1.8% decrease, after a 4.0% drop in February. February's figure was revised down from a 3.3% fall.
The decrease was mainly driven by lower sales of transportation equipment and primary metals. Transportation equipment sales plunged 3.4% in March, while sales of petroleum and coal products dropped 5.6%.
Inventories decreased 0.4% in March, driven by drops in aerospace product and parts, primary metals, and wood product industries inventories.
-
14:31
U.S.: Building Permits, April 1116 (forecast 1140)
-
14:31
U.S.: CPI, m/m , April 0.4% (forecast 0.3%)
-
14:31
U.S.: CPI excluding food and energy, Y/Y, April 2.1% (forecast 2.1%)
-
14:30
Canada: Manufacturing Shipments (MoM), March -0.9% (forecast -1.8%)
-
14:30
U.S.: CPI, Y/Y, April 1.1% (forecast 1.1%)
-
14:30
U.S.: CPI excluding food and energy, m/m, April 0.2% (forecast 0.2%)
-
14:30
U.S.: Housing Starts, April 1172 (forecast 1130)
-
14:19
Foreign exchange market. European session: the British pound traded lower against the U.S. dollar on the weak consumer price inflation data from the U.K.
Economic calendar (GMT0):
(Time/ Region/ Event/ Period/ Previous/ Forecast/ Actual)
01:30 Australia New Motor Vehicle Sales (MoM) April 2.2% -0.5% -2.5%
01:30 Australia New Motor Vehicle Sales (YoY) April 4.2% 2.4%
01:30 Australia RBA Meeting's Minutes
04:30 Japan Industrial Production (MoM) (Finally) March -5.2% 3.6% 3.8%
04:30 Japan Industrial Production (YoY) (Finally) March -1.2% 0.1% 0.2%
07:15 Switzerland Producer & Import Prices, m/m April 0% 0.1% 0.3%
07:15 Switzerland Producer & Import Prices, y/y April -4.7% -2.4%
08:30 United Kingdom Producer Price Index - Output (MoM) April 0.3% 0.2% 0.4%
08:30 United Kingdom Producer Price Index - Output (YoY) April -0.9% -0.8% -0.7%
08:30 United Kingdom Producer Price Index - Input (MoM) April 2.2% Revised From 2.0% 1.1% 0.9%
08:30 United Kingdom Producer Price Index - Input (YoY) April -6.5% -6.7% -6.5%
08:30 United Kingdom Retail Price Index, m/m April 0.4% 0.3% 0.1%
08:30 United Kingdom Retail prices, Y/Y April 1.6% 1.5% 1.3%
08:30 United Kingdom HICP, m/m April 0.4% 0.3% 0.1%
08:30 United Kingdom HICP, Y/Y April 0.5% 0.5% 0.3%
08:30 United Kingdom HICP ex EFAT, Y/Y April 1.5% 1.4% 1.2%
09:00 Eurozone Trade balance unadjusted March 19.3 Revised From 19 22.5 28.6
10:00 Germany Bundesbank Monthly Report
The U.S. dollar traded higher against the most major currencies ahead of the release of the U.S. economic data from the U.S. The U.S. consumer price inflation is expected to rise to 1.1% year-on-year in April from 0.9% in March.
The U.S. consumer price index excluding food and energy is expected to decline to 2.1% year-on-year in April from 2.2% in March.
Housing starts in the U.S. are expected to rise to 1.130 million units in April from 1.089 million units in March.
The number of building permits is expected to increase to 1.140 million units in April from 1.076 million units in March.
The U.S. industrial production is expected to climb to 0.3% in April, after a 0.6% fall in March.
The euro traded lower against the U.S. dollar despite the positive trade data from the Eurozone. Eurostat released its trade data for the Eurozone on Tuesday. Eurozone's unadjusted trade surplus climbed to €28.6 billion from €19.0 billion in February. Exports fell at an unadjusted annual rate of 3.0% in March, while imports dropped 8.0%.
The British pound traded lower against the U.S. dollar on the weak consumer price inflation data from the U.K. The Office for National Statistics (ONS) released the consumer price inflation data for the U.K. on Tuesday. The U.K. consumer price index fell to 0.3% year-on-year in April from 0.5% in March. Analysts had expected to remain unchanged at 0.5%.
The decrease was mainly driven by declines in air fares and prices for clothing, vehicles and social housing rent.
On a monthly basis, U.K. consumer prices increased 0.1% in April, missing expectations for a 0.3% gain, after a 0.4% rise in March.
Consumer price inflation excluding food, energy, alcohol and tobacco prices declined to 1.2% year-on-year in April from 1.5% in March, missing expectations for a decrease to 1.4%.
The U.K. house price index increased at a seasonally adjusted rate of 2.5% in March, after a 0.2% gain in February.
On a yearly basis, the U.K. house price index increased at a seasonally adjusted rate of 9.0% in March, after a 7.6% rise in February. It was the biggest rise since March 2015.
The Canadian dollar traded lower against the U.S. dollar ahead of the release of the manufacturing shipments data from Canada. Canadian manufacturing shipments are expected to drop 1.8% in March, after a 3.3% fall in February.
The Swiss franc traded lower against the U.S. dollar. The Federal Statistical Office released its producer and import prices data on Tuesday. Switzerland's producer and import prices rose 0.3% in April, beating expectations for a 0.1% gain, after a flat reading in March. The rise was driven by higher prices for petroleum products.
On a yearly basis, producer and import prices plunged 2.4% in April, after a 4.7% drop in March.
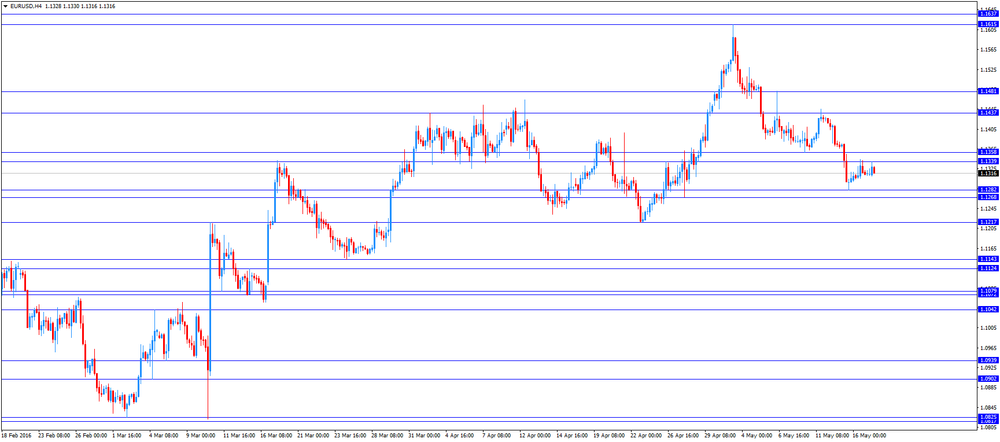
EUR/USD: the currency pair fell to $1.1316
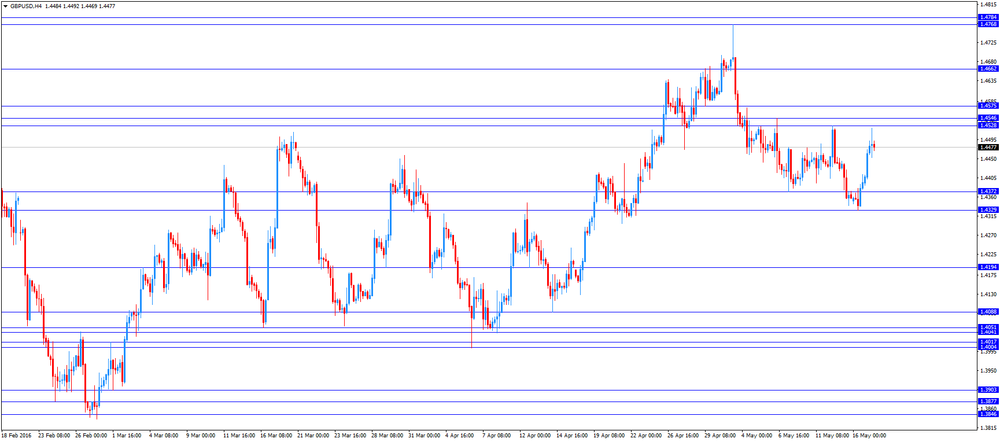
GBP/USD: the currency pair declined to $1.4453
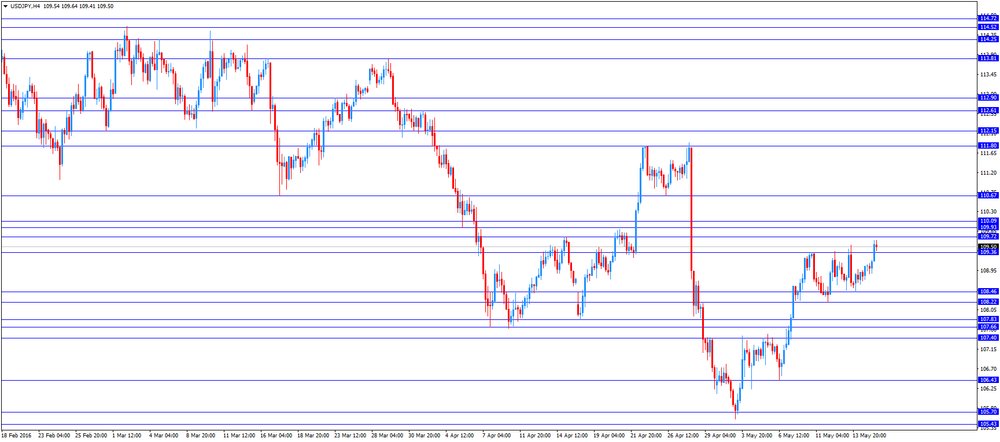
USD/JPY: the currency pair climbed to Y109.64
The most important news that are expected (GMT0):
12:30 Canada Manufacturing Shipments (MoM) March -3.3% -1.8%
12:30 U.S. Housing Starts April 1089 1130
12:30 U.S. Building Permits April 1076 1140
12:30 U.S. CPI, m/m April 0.1% 0.3%
12:30 U.S. CPI excluding food and energy, Y/Y April 2.2% 2.1%
12:30 U.S. CPI, Y/Y April 0.9% 1.1%
12:30 U.S. CPI excluding food and energy, m/m April 0.1% 0.2%
13:15 U.S. Capacity Utilization April 74.8% 75%
13:15 U.S. Industrial Production (MoM) April -0.6% 0.3%
13:15 U.S. Industrial Production YoY April -2%
22:45 New Zealand PPI Input (QoQ) Quarter I -1.2%
22:45 New Zealand PPI Output (QoQ) Quarter I -0.8%
23:50 Japan GDP, q/q (Preliminary) Quarter I -0.3% 0.1%
23:50 Japan GDP, y/y (Preliminary) Quarter I -1.1% 0.2%
-
14:12
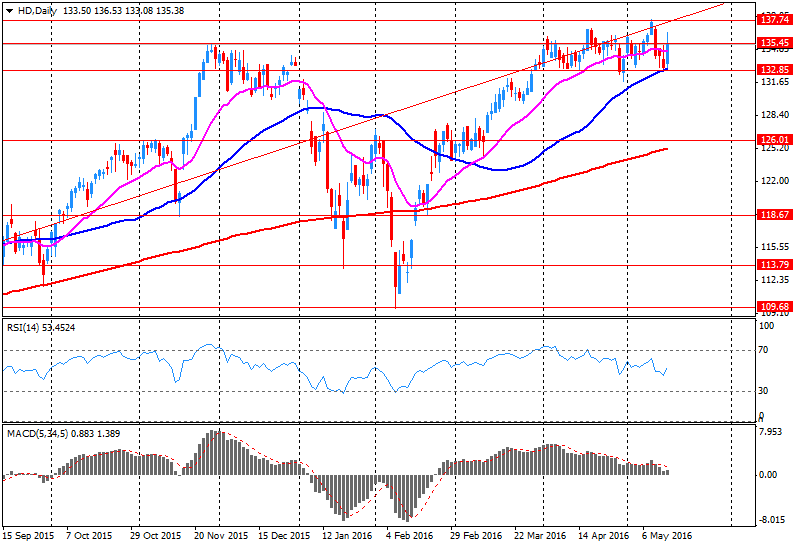
Company News: Home Depot (HD) Q1 results beat analysts’ expectations
Home Depot reported Q1 FY 2016 earnings of $1.44 per share (versus $1.16 in Q1 FY 2015), beating analysts' consensus of $1.35.
The company's quarterly revenues amounted to $22.762 bln (+9% y/y), beating consensus estimate of $22.389 bln.
Home Depot issued raised guidance for FY 2016, increasing EPS forecast to $6.27 from $6.12-6.18 (versus analysts' consensus estimate of $6.22) and revenues forecast to $94.095 bln (+6.3% y/y) from $93.03-93.83 bln (versus analysts' consensus estimate of $93.84 bln).
HD fell to $134.55 (-0.58%) in pre-market trading.
-
14:01
Orders
EUR/USD
Offers 1.1355-60 1.1380 1.1400 1.14301.1450-60 1.1475-80 1.1500
Bids 1.1300 1.1280-85 1.1270 1.1250 1.1230 1.1200 1.1185 1.1165 1.1150
GBP/USD
Offers 1.4530 1.4550 1.4570 1.4585 1.4600 1.4630 1.4650 1.4680 1.4700
Bids 1.4475-80 1.4450 1.4420.25 1.4400 1.4385 1.4350 1.4330 1.4300-10
EUR/GBP
Offers 0.7820 0.7835 0.7850 0.7880 0.7900 0.7920 0.7930 0.7950
Bids 0.7800 0.7780 0.7760 0.7735 0.7700
EUR/JPY
Offers 124.00 124.30 124.50 124.70-75 125.00 125.30 125.50 126.00
Bids 123.50 123.30 123.00 122.80 122.50 122.00 121.70 121.50
USD/JPY
Offers 109.50109.80110.00 110.30 110.50
Bids 109.00 108.80 108.50 108.30 108.20 108.00 107.85 107.60
AUD/USD
Offers 0.7365-70 0.7385 0.7400 0.7420-25 0.7450
Bids 0.7330 0.7300 0.7280 0.7270 0.7250 0.7200
-
13:14
WSE: Mid session comment
Today's session shows that, on the one hand in terms of activity we may feel the "effect of Moody's" after the return of the full global players, but on the other, from the point of view of the direction, disappears the yesterday's relative strength and we start to diligently observe behavior of Euroland.
With respect to the whole index, situation of bulls clearly complicated. The beginning of today's session promised to be a positive after growth impulse from mining and commodity even financial companies. Successive bars however, were marked by systematic return of output from the first hours. It seems that the morning increases launched a selling site, which uses the opportunity to exit at favorable prices.
At the halfway point of the session the WIG20 index was at 1,852 points (-0.06%) with the turnover of slightly over PLN 400 mln.
-
12:02
European stock markets mid session: stocks traded higher on the Eurozone’s trade data
Stock indices traded higher on the positive trade data from the Eurozone. Eurostat released its trade data for the Eurozone on Tuesday. Eurozone's unadjusted trade surplus climbed to €28.6 billion from €19.0 billion in February.
Exports fell at an unadjusted annual rate of 3.0% in March, while imports dropped 8.0%.
The Office for National Statistics (ONS) released the consumer price inflation data for the U.K. on Tuesday. The U.K. consumer price index fell to 0.3% year-on-year in April from 0.5% in March. Analysts had expected to remain unchanged at 0.5%.
The decrease was mainly driven by declines in air fares and prices for clothing, vehicles and social housing rent.
On a monthly basis, U.K. consumer prices increased 0.1% in April, missing expectations for a 0.3% gain, after a 0.4% rise in March.
Consumer price inflation excluding food, energy, alcohol and tobacco prices declined to 1.2% year-on-year in April from 1.5% in March, missing expectations for a decrease to 1.4%.
The U.K. house price index increased at a seasonally adjusted rate of 2.5% in March, after a 0.2% gain in February.
On a yearly basis, the U.K. house price index increased at a seasonally adjusted rate of 9.0% in March, after a 7.6% rise in February. It was the biggest rise since March 2015.
Current figures:
Name Price Change Change %
FTSE 100 6,199.47 +48.07 +0.78 %
DAX 9,984.12 +31.22 +0.31 %
CAC 40 4,335.85 +23.57 +0.55 %
-
11:46
Switzerland's producer and import prices rise in April
The Federal Statistical Office released its producer and import prices data on Tuesday. Switzerland's producer and import prices rose 0.3% in April, beating expectations for a 0.1% gain, after a flat reading in March.
The rise was driven by higher prices for petroleum products.
The Import Price Index increased 0.4% in April, while producer prices rose 0.2%.
On a yearly basis, producer and import prices plunged 2.4% in April, after a 4.7% drop in March.
The Import Price Index fell by 4.1% year-on year in April, while producer prices dropped 1.7%.
-
11:37
UK house price inflation increases 2.5% in March
The Office for National Statistics (ONS) released its house inflation data for the U.K. on Tuesday. The U.K. house price index increased at a seasonally adjusted rate of 2.5% in March, after a 0.2% gain in February.
On a yearly basis, the U.K. house price index increased at a seasonally adjusted rate of 9.0% in March, after a 7.6% rise in February. It was the biggest rise since March 2015.
The higher house price inflation England was mainly driven by an increase in prices in the East, the South East and London.
The average mix-adjusted house price was £292,000 in March, up from £284,000 in February.
-
11:29
UK consumer price inflation declines to 0.3% year-on-year in April
The Office for National Statistics (ONS) released the consumer price inflation data for the U.K. on Tuesday. The U.K. consumer price index fell to 0.3% year-on-year in April from 0.5% in March. Analysts had expected to remain unchanged at 0.5%.
The decrease was mainly driven by declines in air fares and prices for clothing, vehicles and social housing rent.
On a monthly basis, U.K. consumer prices increased 0.1% in April, missing expectations for a 0.3% gain, after a 0.4% rise in March.
Consumer price inflation excluding food, energy, alcohol and tobacco prices declined to 1.2% year-on-year in April from 1.5% in March, missing expectations for a decrease to 1.4%.
The Retail Prices Index decreased to 1.4% year-on-year in April from 1.6% in March, missing expectations for a fall to 1.5%.
The consumer price inflation is below the Bank of England's 2% target.
-
11:22
Eurozone's unadjusted trade surplus climbs €28.6 billion in March
Eurostat released its trade data for the Eurozone on Tuesday. Eurozone's unadjusted trade surplus climbed to €28.6 billion from €19.0 billion in February.
Exports fell at an unadjusted annual rate of 3.0% in March, while imports dropped 8.0%.
-
11:16
Fitch Ratings: Britain’s exit from the European Union will have a negative impact on ratings of the EU countries
Rating agency Fitch Ratings said on Monday that Britain's exit from the European Union (EU) would have a negative impact on ratings of the EU countries.
"An exit from the EU by the UK ('Brexit') would weigh on the economies of other EU countries and increase political risks in Europe," the agency said.
"Negative actions would become more likely in the medium term if the economic impact were severe or significant political risks materialised," Fitch added.
The agency noted that the economic impact would be lower for the EU than for the U.K.
Fitch also said that there could be risks that Scotland could leave the U.K. or Catalonia could leave Spain.
-
11:09
Richmond Fed President Jeffrey Lacker: an interest rate hike in June will be appropriate
Richmond Fed President Jeffrey Lacker said in an interview with the Washington Post on Monday that an interest rate hike in June would be appropriate as inflation was moving toward the Fed' 2% target, the labour market continued to strengthen and downside risks dissipated.
"To me that adds up to a pretty strong case for a June move," he said.
Lacker is not a voting member of the Federal Open Market Committee (FOMC) this year.
-
11:00
Eurozone: Trade balance unadjusted, March 28.6 (forecast 22.5)
-
10:51
ICM telephone poll: 47% of Britons support Britain’s membership in the European Union
According to ICM telephone poll published on Monday, 47% of Britons supported Britain's membership in the European Union (EU), 39% of Britons would vote for the exit from the EU, while 14% of Britons were undecided.
The poll was conducted on May 13-15 and surveyed 1,002 people.
-
10:45
NAHB housing market index remains unchanged at 58 in May
The National Association of Home Builders (NAHB) released its housing market index for the U.S. on Monday. The NAHB housing market index remained unchanged at 58 in May, missing expectations for an increase to 59.
A level above 50.0 is considered positive, below indicates a negative outlook.
The buyer traffic sub-index remained unchanged at 44 in May, the current sales conditions sub-index remained unchanged at 63, while the sub-index measuring sales expectations in the next six months increased to 65 from 62.
"Builder confidence has held steady at 58 for four straight months, which indicates that the single-family housing sector remains in positive territory," the NAHB Chairman Ed Brady.
"The fact that future sales expectations rose slightly this month shows that builders are confident that the market will continue to strengthen. Job creation, low mortgage interest rates and pent-up demand will also spur growth in the single-family housing sector moving forward," the NAHB Chief Economist Robert Dietz said.
-
10:31
United Kingdom: Producer Price Index - Output (MoM), April 0.4% (forecast 0.2%)
-
10:31
United Kingdom: Retail prices, Y/Y, April 1.4% (forecast 1.5%)
-
10:31
United Kingdom: Retail Price Index, m/m, April 0.1% (forecast 0.3%)
-
10:31
United Kingdom: Producer Price Index - Input (YoY) , April -6.5% (forecast -6.7%)
-
10:31
United Kingdom: Producer Price Index - Input (MoM), April 0.9% (forecast 1.1%)
-
10:30
United Kingdom: HICP, Y/Y, April 0.3% (forecast 0.5%)
-
10:30
United Kingdom: Producer Price Index - Output (YoY) , April -0.7% (forecast -0.8%)
-
10:30
United Kingdom: HICP, m/m, April 0.1% (forecast 0.3%)
-
10:30
United Kingdom: HICP ex EFAT, Y/Y, April 1.2% (forecast 1.4%)
-
10:15
May’s Reserve Bank of Australia monetary policy meeting: the outlook for economic activity or the unemployment rate does not changed
The Reserve Bank of Australia (RBA) released its minutes from May monetary policy meeting on Tuesday. The central bank noted that the economic activity and employment were little changed, while the exchange rate depreciation was supporting the economic growth.
The RBA also said that the economic growth was a bit stronger than expected over 2015.
Members noted that the outlook for economic activity or the unemployment rate did not changed, while the inflation forecast was downgraded.
The central bank said that next interest rate decision will depend on the incoming economic data.
The RBA lowered its interest rate to 1.75% from 2.00% in May.
-
10:00
Option expiries for today's 10:00 ET NY cut
USD/JPY 107.50 (USD 243m) 108.70-75 (343m) 109.30 (USD 576m) 110.00 (607m) 110.50 (600m)
EUR/USD: 1.1275-80 (EUR 640m) 1.1295-1.1300 (290m) 1.1450 (1.19bln) 1.1500 (779m)
USD/CHF 0.9630 (USD 200m)
USD/CAD 1.2500 (USD 800m) 1.2695-1.2700 (563m) 1.2840 (370m) 1.2880 (630m) 1.2990 (410m) 1.3195-1.3200 (600m)
-
09:15
WSE: After opening
The futures market (WSE: FW20M16) began trading with increase by 0.43% to 1,864 points. The contract on the DAX after Monday's break gained 1.4%, while contracts in the USA are on the green side. Means, the mood in the morning are quite good.
WIG20 index opened at 1859.85 points (+0.33%)*
WIG 46997.32 0.37%
WIG30 2069.27 0.46%
mWIG40 3548.56 0.11%
*/ - change to previous close
Among the blue chips the higher opening was recorded by KGHM, after which - like the entire market - caught a slight shortness of breath. We are in the vicinity of yesterday's highs. The German DAX gained more than 0.8%, so the environment has improved over the prior Friday afternoon.
-
09:15
Switzerland: Producer & Import Prices, y/y, April -2.4%
-
09:15
Switzerland: Producer & Import Prices, m/m, April 0.3% (forecast 0.1%)
-
08:27
Options levels on tuesday, May 17, 2016:
EUR / USD
Resistance levels (open interest**, contracts)
$1.1487 (4406)
$1.1423 (2882)
$1.1380 (1218)
Price at time of writing this review: $1.1313
Support levels (open interest**, contracts):
$1.1275 (3782)
$1.1228 (5670)
$1.1162 (9163)
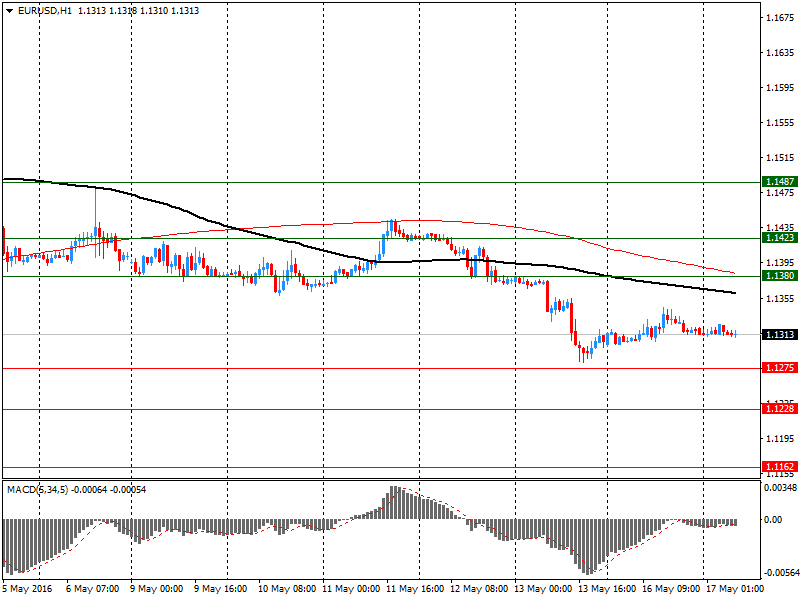
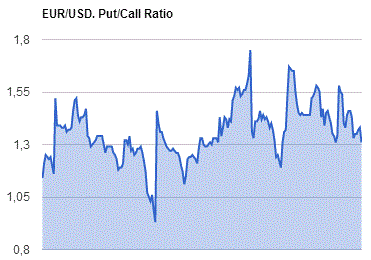
Comments:
- Overall open interest on the CALL options with the expiration date June, 3 is 68437 contracts, with the maximum number of contracts with strike price $1,1600 (5171);
- Overall open interest on the PUT options with the expiration date June, 3 is 88494 contracts, with the maximum number of contracts with strike price $1,1200 (9163);
- The ratio of PUT/CALL was 1.29 versus 1.31 from the previous trading day according to data from May, 16
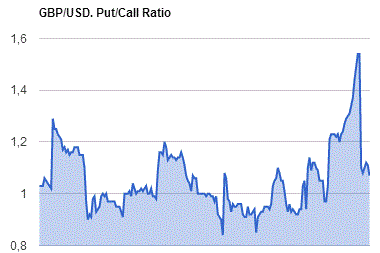
GBP/USD
Resistance levels (open interest**, contracts)
$1.4703 (1928)
$1.4605 (2365)
$1.4508 (2406)
Price at time of writing this review: $1.4477
Support levels (open interest**, contracts):
$1.4386 (1409)
$1.4291 (2351)
$1.4194 (2896)
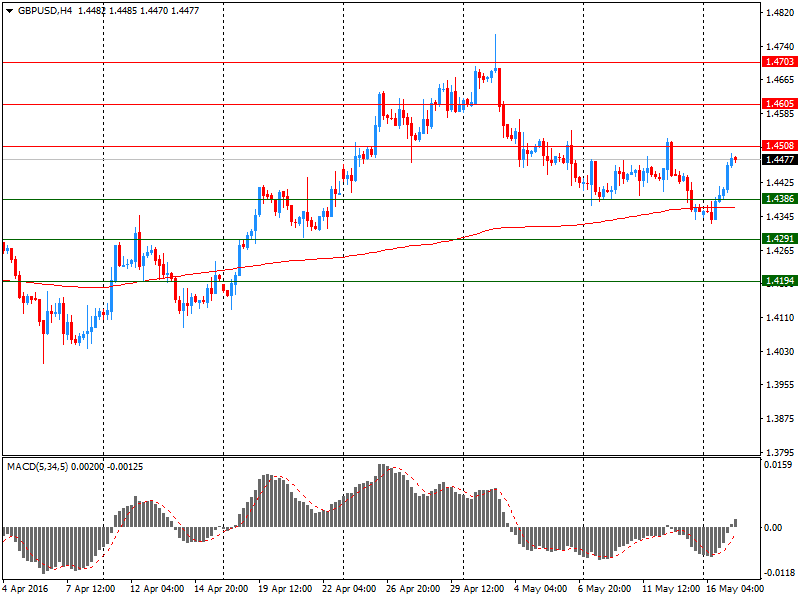
Comments:
- Overall open interest on the CALL options with the expiration date June, 3 is 30849 contracts, with the maximum number of contracts with strike price $1,4500 (2406);
- Overall open interest on the PUT options with the expiration date June, 3 is 32709 contracts, with the maximum number of contracts with strike price $1,4200 (2896);
- The ratio of PUT/CALL was 1.06 versus 1.07 from the previous trading day according to data from May, 16
* - The Chicago Mercantile Exchange bulletin (CME) is used for the calculation.
** - Open interest takes into account the total number of option contracts that are open at the moment.
-
08:22
WSE: Before opening
Before today's session we need to pay attention to the improvement in global sentiment due to good posture of Wall Street, where yesterday was the approach of 1%. Thus, the positive impulse on the WSE associated with leaving the rating by Moody's agency gets a chance to be continued through positive impulse from the environment, where the bulls defend the April's supports on the basis of increases recorded in the oil market (after the Goldman Sachs report,) and the increase of the Apple shares prices (sizable stake of the company was bought by the Warren Buffett fund). Not without significance are also new polls published in the UK, which shows the superiority of the percentage of people who want to vote for remaining the country in the framework of the EU. It will certainly act favorably on improving sentiment.
Among other important issues it is worth to mention about returning to trading in Frankfurt, which should improve the activity on the parquets. So it seems that the day promises to be more interesting than yesterday.
-
06:46
Japan: Industrial Production (MoM) , March 3.8% (forecast 3.6%)
-
06:46
Japan: Industrial Production (YoY), March 0.2% (forecast 0.1%)
-
06:43
Global Stocks
European stocks ended a volatile session almost flat Monday, as investors weighed disappointing Chinese data against a rally in oil prices. European shares had started in negative territory on Monday after data released over the weekend from China showed figures for industrial output, retail sales and fixed-asset income in April missed analyst expectations.
U.S. stocks closed higher Monday, rebounding after three straight weeks of declines, as a surge in oil prices and a rally in tech stocks overshadowed weaker-than-expected manufacturing data from the New York region.
Asian stocks rose for a second day, tracking a gain in U.S. equities as Apple Inc. jumped after Berkshire Hathaway Inc. disclosed a stake in the iPhone maker and oil companies climbed on higher crude prices. The pickup in commodity prices is helping a recovery in global equities, after weaker economic data and disappointing company earnings wiped out almost $2 trillion of value in the first two weeks of May. Oil traded near a six-month high after advancing 3.3 percent on Monday.
Based on MarketWatch materials
-
04:26
Nikkei 225 16,593.24 +126.84 +0.77 %, Hang Seng 19,897.2 +13.25 +0.07 %, Shanghai Composite 2,851.83 +0.96 +0.03 %
-
03:32
Australia: New Motor Vehicle Sales (YoY) , April 2.4%
-
03:31
Australia: New Motor Vehicle Sales (MoM) , April -2.5% (forecast -0.5%)
-
00:32
Commodities. Daily history for May 16’2016:
(raw materials / closing price /% change)
Oil 47.89 +0.36%
Gold 1,275.50 +0.10%
-
00:31
Stocks. Daily history for Sep Apr May 16’2016:
(index / closing price / change items /% change)
Nikkei 225 16,466.4 +54.19 +0.33 %
Hang Seng 19,883.95 +164.66 +0.84 %
S&P/ASX 200 5,358.95 +29.96 +0.56 %
Shanghai Composite 2,850.93 +23.83 +0.84 %
FTSE 100 6,151.4 +12.90 +0.21 %
CAC 40 4,312.28 -7.71 -0.18 %
Xetra DAX 9,952.9 +90.78 +0.92 %
S&P 500 2,066.66 +20.05 +0.98 %
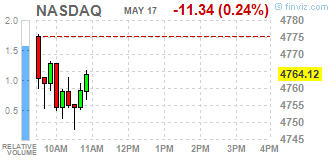
NASDAQ Composite 4,775.46 +57.78 +1.22 %
Dow Jones 17,710.71 +175.39 +1.00 %
-
00:30
Currencies. Daily history for May 16’2016:
(pare/closed(GMT +3)/change, %)
EUR/USD $ 1,1314 +0,07%
GBP/USD $1,4408 +0,35%
USD/CHF Chf0,9774 +0,21%
USD/JPY Y109,06 +0,40%
EUR/JPY Y123,39 +0,45%
GBP/JPY Y157,13 +0,75%
AUD/USD $0,7289 +0,30%
NZD/USD $0,6782 +0,24%
USD/CAD C$1,2893 -0,34%
-
00:01
Schedule for today, Tuesday, May 17’2016:
(time / country / index / period / previous value / forecast)
01:30 Australia New Motor Vehicle Sales (MoM) April 2.2%
01:30 Australia New Motor Vehicle Sales (YoY) April 4.2%
01:30 Australia RBA Meeting's Minutes
04:30 Japan Industrial Production (MoM) (Finally) March -5.2% 3.6%
04:30 Japan Industrial Production (YoY) (Finally) March -1.2% 0.1%
07:15 Switzerland Producer & Import Prices, m/m April 0%
07:15 Switzerland Producer & Import Prices, y/y April -4.7%
08:30 United Kingdom Producer Price Index - Output (MoM) April 0.3% 0.3%
08:30 United Kingdom Producer Price Index - Output (YoY) April -0.9% -0.8%
08:30 United Kingdom Producer Price Index - Input (MoM) April 2.0% 1.1%
08:30 United Kingdom Producer Price Index - Input (YoY) April -6.5%
08:30 United Kingdom Retail Price Index, m/m April 0.4%
08:30 United Kingdom Retail prices, Y/Y April 1.6% 1.5%
08:30 United Kingdom HICP, m/m April 0.4% 0.3%
08:30 United Kingdom HICP, Y/Y April 0.5% 0.5%
08:30 United Kingdom HICP ex EFAT, Y/Y April 1.5% 1.4%
09:00 Eurozone Trade balance unadjusted March 19 22.5
10:00 Germany Bundesbank Monthly Report
12:30 Canada Manufacturing Shipments (MoM) March -3.3% -1.3%
12:30 U.S. Housing Starts April 1089 1130
12:30 U.S. Building Permits April 1076 1140
12:30 U.S. CPI, m/m April 0.1% 0.3%
12:30 U.S. CPI excluding food and energy, Y/Y April 2.2% 2.1%
12:30 U.S. CPI, Y/Y April 0.9% 1.1%
12:30 U.S. CPI excluding food and energy, m/m April 0.1% 0.2%
13:15 U.S. Capacity Utilization April 74.8% 75%
13:15 U.S. Industrial Production (MoM) April -0.6% 0.3%
13:15 U.S. Industrial Production YoY April -2%
22:45 New Zealand PPI Input (QoQ) Quarter I -1.2%
22:45 New Zealand PPI Output (QoQ) Quarter I -0.8%
23:50 Japan GDP, q/q (Preliminary) Quarter I -0.3% 0.1%
23:50 Japan GDP, y/y (Preliminary) Quarter I -1.1% 0.2%
-