Notícias do Mercado
-
23:50
AUD/USD approaches 0.6670 key support with eyes on RBA, US NFP
- AUD/USD begins the key week on a softer footing as market’s risk-on mood fades.
- Weekend announcements of surprise OPEC+ Oil output cut, anticipated dovish hike from RBA weigh on Aussie price.
- Firmer sentiment, downbeat US data pushed US Dollar down for the third consecutive week.
- US jobs report will be crucial amid fresh talks of Fed’s policy pivot.
AUD/USD struggles to extend the previous weekly gains as it prints minor losses around 0.6680 during early Monday morning in the Asia-Pacific region.
Markets brace for a dovish hike from the Reserve Bank of Australia (RBA) after downbeat inflation and Retail Sales data. However, the RBA policymakers defended their hawkish moves and hence the Aussie pair traders are more cautious. Also challenging the risk-barometer pair is the downbeat mood and the presence of the US jobs report for March, up for publishing on Friday.
The last week’s downbeat Aussie Consumer Price Index (CPI) and Retail Sales data raised concerns about the RBA’s last rate hike and flag the fears of the AUD/USD bear’s return. However, the softer US data and receding hawkish concerns from the Federal Reserve (Fed), not to forget the presence of the US Nonfarm Payrolls (NFP) release keeps the Aussie pair traders on their toes.
On Friday, the US Core Personal Consumption Expenditures (PCE) Price Index, the Fed’s preferred gauge of inflation, for February declined to 4.6% YoY from 4.7% expected and prior. On a monthly basis, Core PCE inflation rose 0.3% while easing below the market expectation of 0.4% and a downwardly revised 0.5% previous reading. Further, the Chicago PMI reading for March came in stronger than expected at 43.8 while the final readings of the University of Michigan's (UoM) Consumer Confidence Index dropped to 62.0 in March, versus 63.4 flash estimations and 63.2 market forecasts. Current Economic Conditions fell from 70.7 in February to 66.3 and the Index of Consumer Expectations declined from 64.7 to 59.2.
It should be noted that the global central bankers and policymakers appear successfully routed the markets off the banking crisis as the bank shares have recently recovered after witnessing a bloodbath during mid-March, led by the Silicon Valley Bank’s (SVB) fallout.
Alternatively, a surprise output cut from the Organization of the Petroleum Exporting Countries (OPEC) and allies led by Russia, known collectively as OPEC+, joins fresh fears of the US-China tension weighing on the AUD/USD prices. On Friday, China's top diplomat Wang Yi said that the US and China relations are facing challenges and difficulties. “I urge the US to stop suppression, decoupling is wrong,” Wang added.
Amid these plays, Wall Street closed on the positive side but the yields are down, despite marking weekly gains.
Looking forward, AUD/USD traders may pay attention to US ISM Manufacturing PMI for March for intraday directions. However, Tuesday’s RBA and Friday’s US jobs report are the key events to watch for this week.
Technical analysis
An upward-sloping support line from March 10, around 0.6670 by the press time, restricts the short-term downside of the AUD/USD price.
-
23:41
Gold Price Forecast: XAU/USD slips to near $1,960 on hopes that fresh oil cut to keep Fed rates higher
- Gold price has dropped sharply to near $1,960.00 as a surprise production cut by the OPEC+ would propel US Inflation.
- The Fed could keep rates higher for a longer period to bring down fresh persistent inflation.
- A power-pack action in the USD Index would continue ahead of the release of the US ISM Manufacturing PMI data.
Gold price (XAU/USD) is facing immense pressure in early Asia as United States inflationary pressures have propelled after the announcement of a surprise production cut by the OPEC+ on weekend. The precious metal has dropped firmly to near $1,960.00 on hopes that the Federal Reserve (Fed) would keep rates higher for a longer period. Expectations of a fresh impulse in US inflation led by higher oil prices after a sudden production cut are going to phase out odds of a steady monetary policy by the Fed in May.
According to Reuters, the oil cartel will cut the overall oil production by around 1.16 million barrels/day (bpd), which will lead to the overall pledge of production cut to 3.66 million bpd.
The US Dollar Index (DXY) has extended its upside momentum above 102.70 on expectations of the continuation of the 25 basis points (bps) rate hike spell by the Federal Reserve (Fed). This would push interest rates to 5.00-5.25%. S&P500 futures have dropped heavily in early Asia after a decent winning spree, portraying a caution in the overall risk-appetite theme.
A power-pack action in the USD Index would continue ahead of the release of the US ISM Manufacturing PMI data. As per the estimates, the Manufacturing PMI is expected to decline marginally to 47.5 from the former release of 47.7. This could be the fifth consecutive figure below 50.0, which itself is considered a contraction in manufacturing activities.
Apart from that, the Manufacturing New Orders Index will be keenly watched. The economic data provide cues about forward demand for goods, which is likely to contract firmly to 44.6 vs. the prior release of 47.00. Subdued consensus for the US Manufacturing PMI could be the outcome of higher interest rates by the Fed for bringing down persistent inflation.
Gold technical analysis
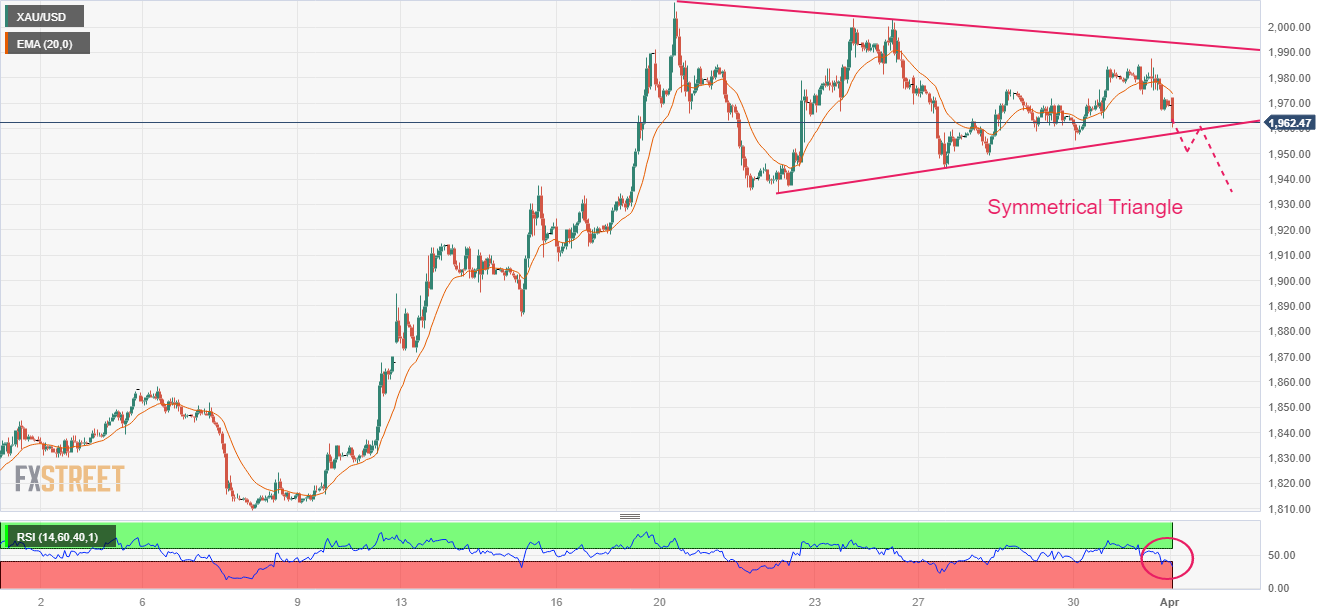
Gold price is hovering near the edge of the upward-sloping trendline of the Symmetrical Triangle chart pattern formed on an hourly scale. The upward-sloping trendline of the chart pattern is plotted from March 22 low at $1,934.34 while the downward-sloping trendline is placed from March 20 high at $2,009.88.
The Gold price has dropped below the 20-period Exponential Moving Average (EMA) at $1,974.10, which indicates that the short-term trend has turned bearish.
Meanwhile, the Relative Strength Index (RSI) (14) has slipped into the bearish range of 20.00-40.00, which indicates more weakness ahead.
Gold hourly chart
-
23:30
NZIER: Majority view an RBNZ OCR increase of 25 bps, given inflation pressures are still high
“Shadow Board members recommend a smaller hike in the Official Cash Rate (OCR) in the Reserve Bank’s upcoming April Monetary Policy Review,” said the latest New Zealand Institute of Economic Research (NZIER) report.
“The majority view was an OCR increase of 25 basis points, given inflation pressures are still high in the economy and inflation expectations remain above the Reserve Bank’s 1–3 percent inflation target band,” also mentions the NZIER report.
Key comments
However, two Shadow Board members recommended the Reserve Bank keep the OCR unchanged at 4.75 percent.
One of these members considered the OCR should have already peaked, while the other highlighted the increased risk of a recession looming.
Regarding where the OCR should be in a year, the Shadow Board’s core view ranged from 4.25 percent to 5.50 percent.
Some members recommend the Reserve Bank pause with OCR increases after April but keep it elevated for some time to bring inflation down.
There was one Shadow Board member in the business community who viewed the OCR should be lower in a year, given business profitability and finances are already hard hit by the interest rate increases to date.
NZD/USD drops
The news weighs on the NZD/USD prices, together with the sour sentiment, as the Kiwi pair drops to 0.6235, down 0.35% intraday at the latest by the press time.
-
23:10
USD/NOK drops heavily to near 10.40 on surprise OPEC+ production cut
- USD/NOK has delivered a gap-down open near 10.40 after a surprise oil production cut by OPEC+.
- Fresh pledge of cutting overall oil production by 1.16 million bpd has led to an overall cut of 3.66 million bpd.
- The odds for a further 25bp rate hike by the Fed remain solid despite softening of the US PCE Price Index.
The USD/NOK pair has witnessed an intense sell-off in the Asian session as investors discount the impact of the surprise drop in oil production announced by Saudi Arabia and other OPEC+ members. The oil cartel will cut the overall oil production by around 1.16 million barrels/day, which has strengthened the Norwegian Krone. Fresh pledge of cutting overall oil production by 1.16 million bpd has led to an overall cut of 3.66 million bpd.
The surprise move by OPEC+ in an attempt to support the oil price has strengthened the currencies of oil-exporting countries, which will receive more funds on exporting oil. Bloomberg reported that the surprise move by OPEC+ would increase the risk of higher inflationary pressures globally and might force central banks to keep policy rates higher for longer.
Meanwhile, S&P500 continued its winning spree on Friday in hopes of no further casualties to the United States banking sector, portraying a risk-on mood. However, fresh oil production cuts could spoil the market mood ahead, therefore, a cautionary approach would be advisable.
The US Dollar Index (DXY) recovered firmly on late Friday to near 102.60 despite more-than anticipated softening of US core Personal Consumption Expenditure (PCE) Price Index data. On a monthly basis, the US PCE Price Index accelerated by 0.3%, lower than the consensus of 0.4% and the former release of 0.5%. Also, the annual US PCE Inflation figure soften to 4.6% from the consensus and prior release of 4.7%. However, the move has not eased expectations of further 25 basis points (bps) rate hike by the Federal Reserve.
As per the CME Fedwatch tool, the odds for a 25bp rate hike to 5.00-5.25% for May monetary policy meeting stand more than 53%.
-
23:05
Breaking: WTI crude oil jumps 7.0% to $81.00 on surprise OPEC+ output cut
- WTI Crude oil marks a stellar run-up as OPEC+ shocks markets with surprise output cut.
- OPEC+ members announced voluntary production cut led by Saudi Arabia.
- Risk-on mood, softer US Dollar also propel WTI crude oil prices.
WTI crude oil begins the week with a huge price gap towards the north, jumping to $81.00 during the early hours of Monday’s Asian session. The black gold’s latest rally could be linked to the weekend announcements from the Organization of the Petroleum Exporting Countries (OPEC) and allies led by Russia, known collectively as OPEC+.
Also read: OPEC producers announce voluntary oil output cuts
The Oil cartel, led by Saudi Arabia, announced a total of around 1.16 million barrels a day of output cut during the weekend in a surprise move. Following the announcements, the US National Security Council said. “We don’t think cuts are advisable at this moment given market uncertainty - and we’ve made that clear."
Apart from the OPEC+ output cut, the US Dollar weakness and broad risk-on mood also allowed the WTI crude oil price to remain firmer. That said, the US Dollar Index (DXY) marked a three-week downtrend in the last whereas the receding fears of the banking crisis and the latest toll on the hawkish Fed bets allow the riskier assets to remain firmer.
Moving on, the US Nonfarm Payrolls (NFP) for March and the ISM PMIs for the stated month will be important to watch. Also, the US reaction to OPEC+ isn’t welcomed and hence more Strategic Petroleum Reserve (SPR) releases are likely on the way, suggesting a pullback in the Oil price.
Technical analysis
A clear upside break of the five-month-old descending resistance line, now support around $78.30, directs WTI crude oil buyers towards confronting the 200-DMA hurdle surrounding $83.35.
It’s worth noting that January’s high of around $82.70 can offer an immediate upside hurdle to the black gold.
Alternatively, the previous monthly high of nearly $81.00 and an ascending support line from March 20, close to $75.40, are extra filters towards the south.
WTI crude oil: Daily chart
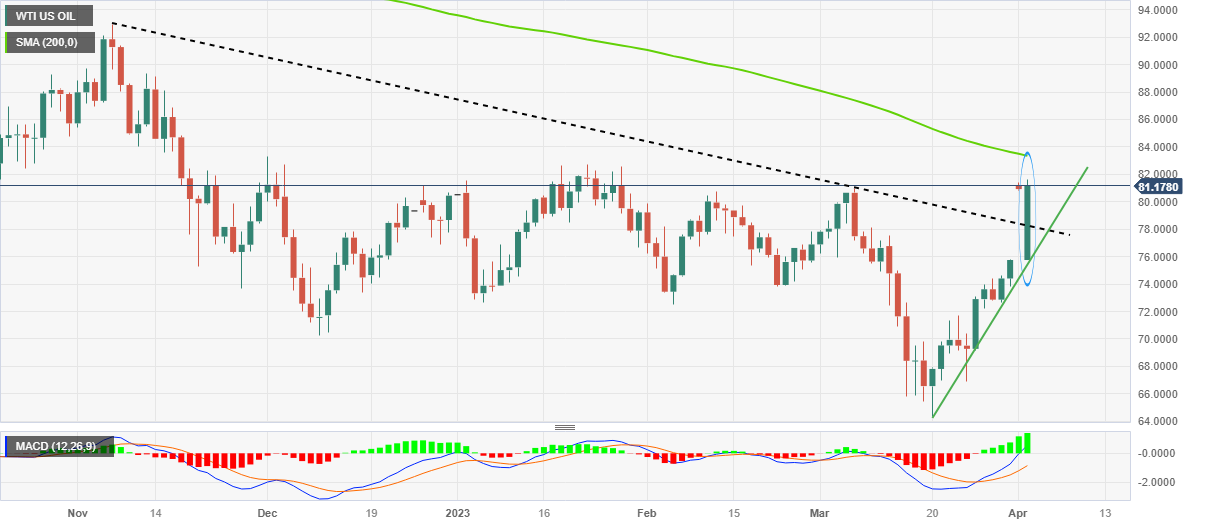
Trend: Further upside expected
-
22:55
EUR/USD Price Analysis: Bears lurking below key trendline support
- EUR/USD bears are moving in and testing structure.
- The daily trendline support has been broken.
EUR/USD is flat in the open following a negative day on Friday as the following technical analysis will illustrate. The bears are in the market and structures are being tested.
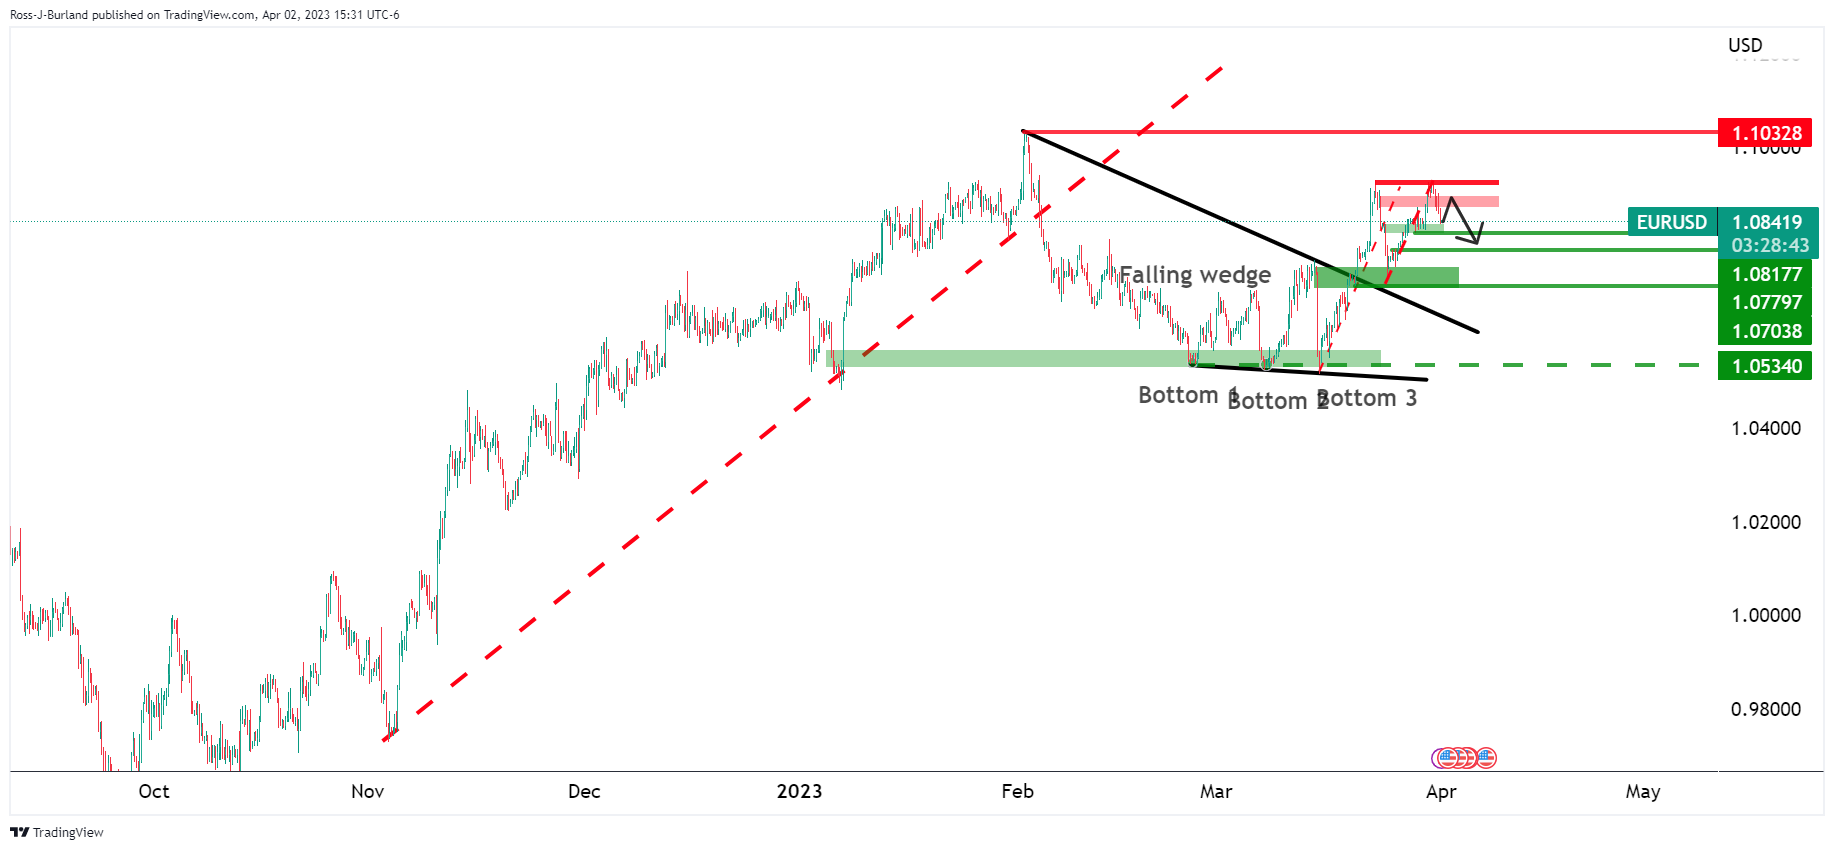
EUR/USD daily chart
EUR/USD´s daily chart shows a tweezer top, a bearish formation that would be expected to be followed by lower highs and lower closes for the week ahead, especially givent he bears are on on the backside of teh bullish trend.
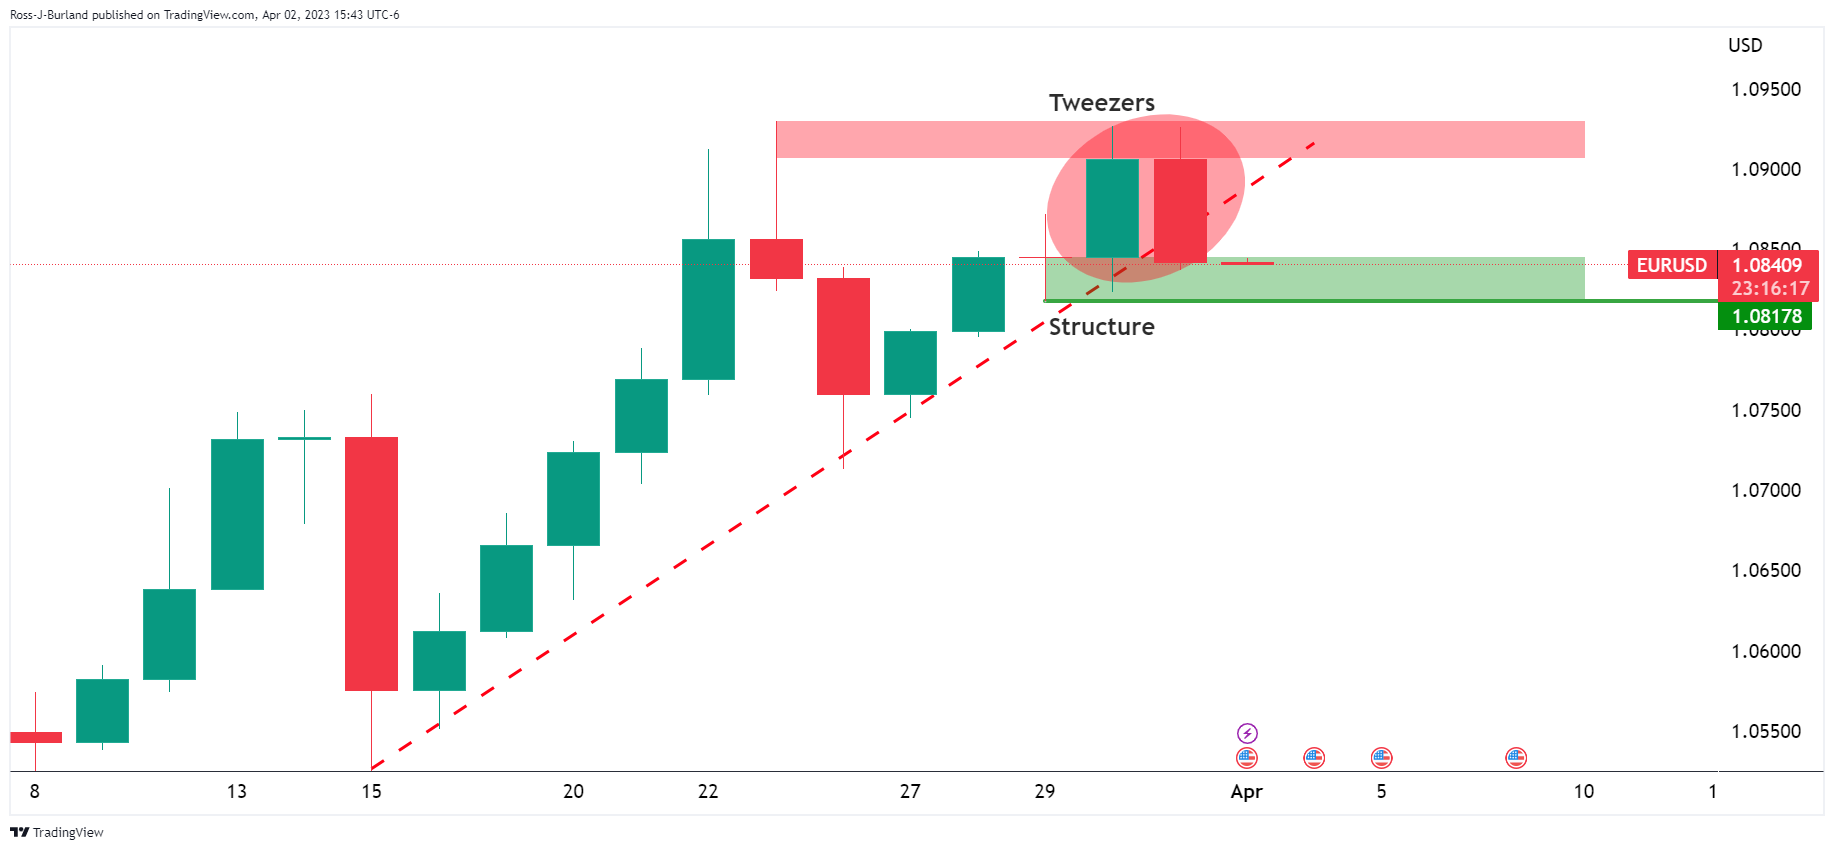
EUR/USD H4 charts
The 4-hour chart shows the price reaching out of the falling wedge, but the advance has been capped:
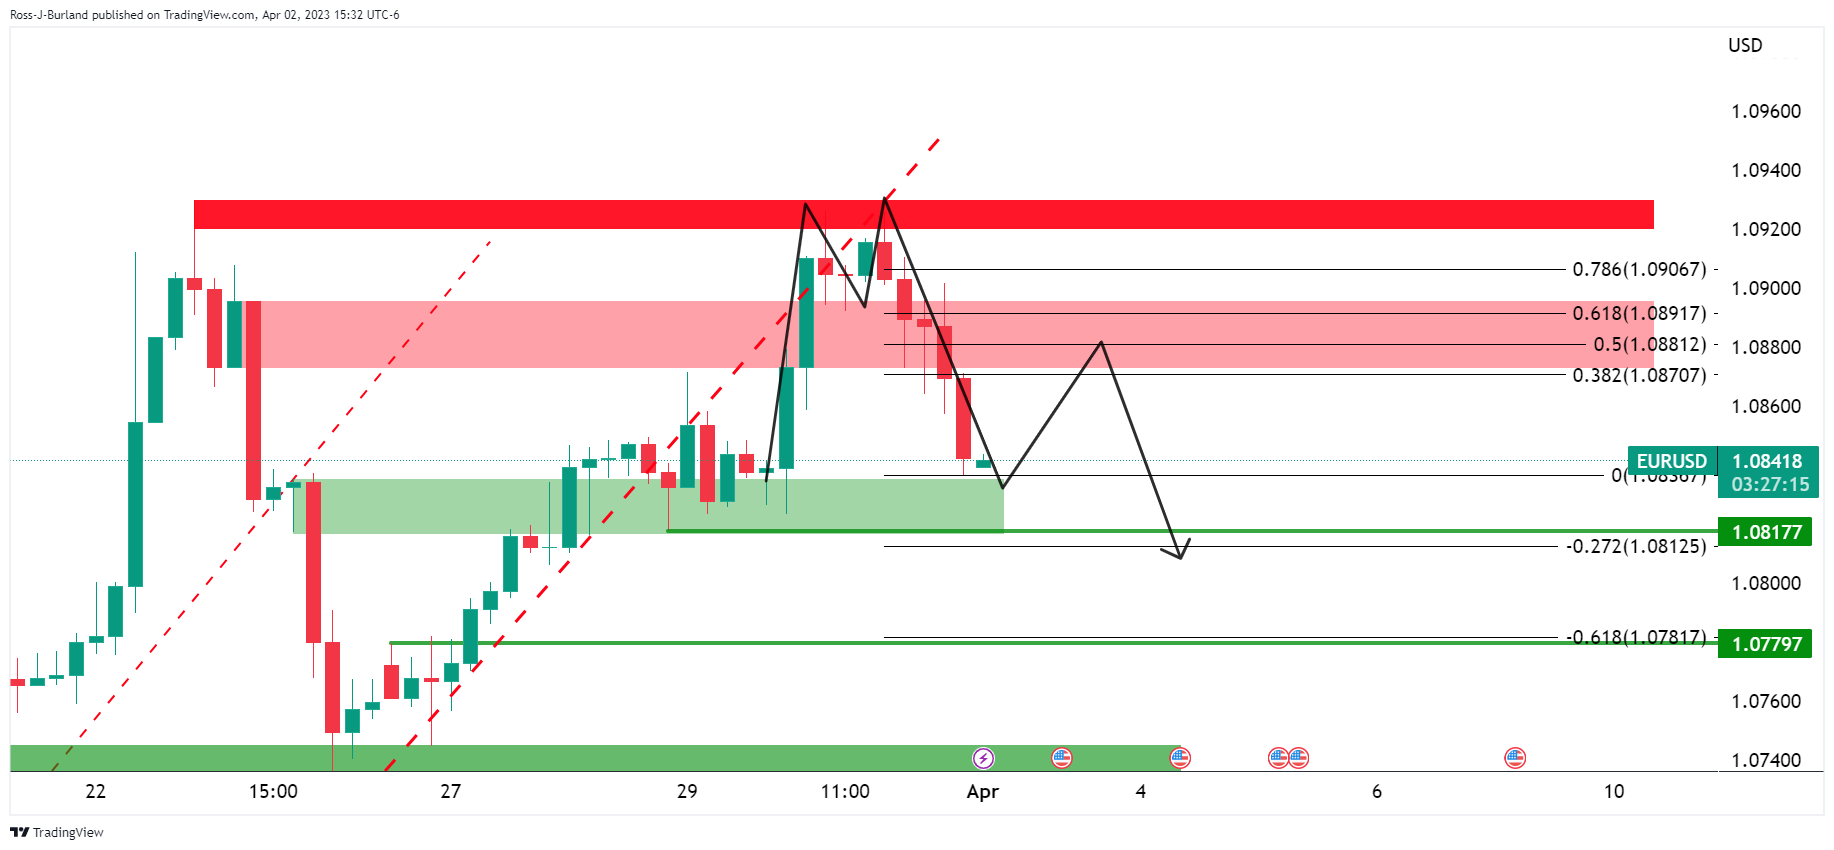
The M-formation is a topping pattern and a retest of the neckline could be on the cards prior to the next significant downside continuation for the days ahead.
-
21:36
USD/CAD bears lurking on OPEC news
- USD/CAD bears lurking for the open on OPEC news.
- OPEC producers announce voluntary oil output cuts.
USD/CAD ended Friday near flat but the Canadian Dollar edged lower against its US counterpart although it held near its strongest level in more than five weeks. The pair fell from a high of 1.3564 to a low of 1.3507 while the Canadian Dollar was supported by domestic data that pointed to stronger economic growth in the first quarter than the Bank of Canada has projected.
The Canadian economy expanded 0.5% in January, eclipsing the 0.3% increase economists had expected, while preliminary data for February showed Gross Domestic Product advancing by a further 0.3%. Meanwhile, slower US consumer spending growth boosted hopes the Federal Reserve would be less aggressive in hiking interest rates. The latest Personal Consumption Expenditure price index (PCE) also showed inflation is starting to slow in the US. The core price index lifted just 0.3% in February from 0.6% in January. Core inflation is now at 4.6% YoY and the headline level at 5.0% YoY. Personal income increased by 0.3% (from 0.6% in January) while personal spending dropped to 0.2% (from 2.0%).
Meanwhile, the price of oil, one of Canada's major exports, rose to the highest in three weeks on Friday touching $75.68 as a high in the spot market. The weekend news, OPEC producers announce voluntary oil output cuts, is anticipated to lift the price of oil which would be expected to be supportive of CAD.
-
20:44
OPEC producers announce voluntary oil output cuts
Saudi Arabia and other OPEC+ oil producers have announced further oil output cuts of around 1.16 million barrels per day.
Riyadh, Saudi Arabia’s capital and main financial hub, said it would cut output by 500,000 barrels per day, or bdp, from May until the end of 2023, state media reported. Russia’s deputy prime minister also said Moscow would extend a voluntary cut of 500,000 barrels a day until the end of 2023. The United Arab Emirates, Kuwait, Iraq, Oman and Algeria said they would voluntarily cut output over the same time period. The UAE said it would cut production by 144,000 bpd, Kuwait announced a cut of 128,000 bpd while Iraq said it would cut output by 211,000 bpd and Oman announced a cut of 40,000 bpd. Algeria said it would cut its output by 48,000 bpd.
In a statement, the Saudi energy ministry said that the kingdom’s voluntary cut was a precautionary measure aimed at supporting the stability of the oil market.
This is expected to cause an immediate rise in prices for the open. West Texas Intermediate, WTI, crude oil rose to the highest in three weeks on Friday touching $75.68 as a high in the spot market.
-
20:32
AUD/USD Price Analysis: Bears could be about to pounce
- AUD/USD´s bearish engulfment on the last 4-hour candle is eyed.
- Bears eye a break of 0.6661 with 0.6625 seen below there guarding the 0.6550s.
The Australian dollar traded around 30 pips on either side of around 0.67 the figure vs. the greenback on Friday and ended the month little changed, in a period marked by constantly shifting outlooks for interest rates and the banking sector globally.
Meanwhile, easing domestic inflationary pressures leave a question mark over the Reserve Bank of Australia´s interest rate meeting this week. The RBA stated in its latest minutes it would reconsider the case for a pause at the April fixing to reassess the economic outlook.
Looking at the technicals, there is also a downside bias as follows:
AUD/USD weekly chart

The bearish pennant is a compelling feature across the weekly and daily time frames.
AUD/USD daily chart
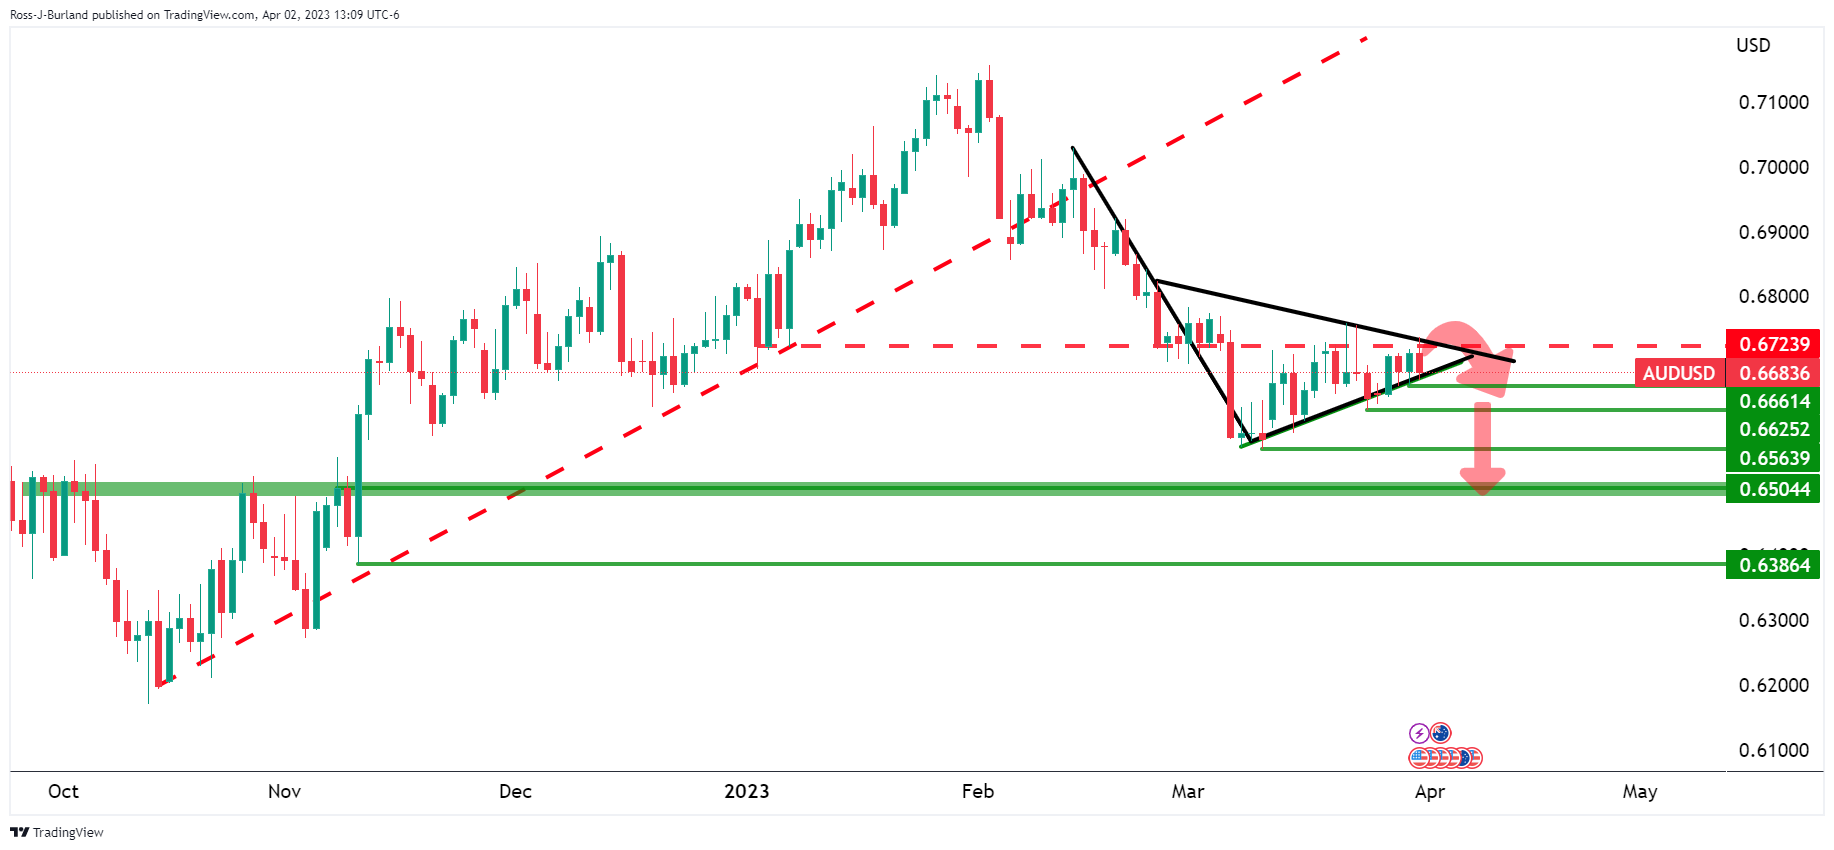
Failures below 0.6720 keep the bearish bias in place.
AUD/USD H4 chart
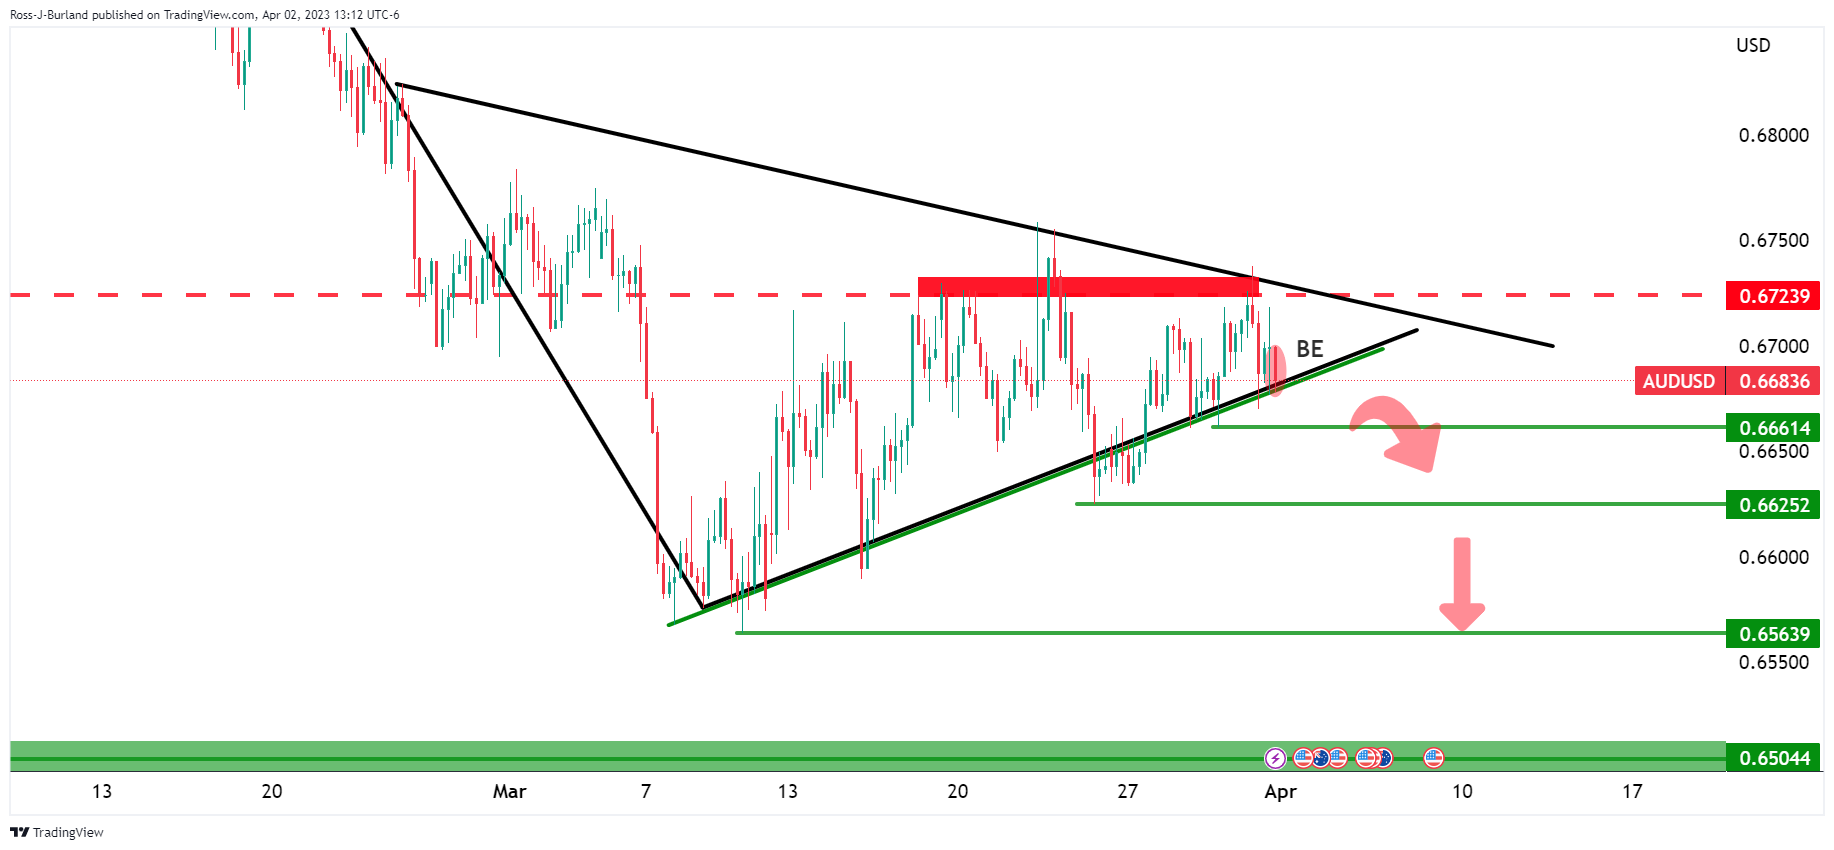
The bearish engulfment, BE, on the last 4-hour candle could be the catalyst for a firm break of structure for the opening sessions near 0.6661 with 0.6625 eyed below there guarding the 0.6550s.
-