Notícias do Mercado
-
23:52
US Treasury Secretary Yellen: OPEC+ oil production cut will add uncertainty to global growth outlook
“A surprise OPEC+ oil production cut is an ‘unconstructive act’ that will add uncertainty to the global growth outlook and to burdens on consumers at a time of high inflation,” US Treasury Secretary Janet Yellen on Monday per Reuters.
"I think it's a regrettable action that OPEC decided to take. I'm not sure yet just what the price impact will be. I think we need to wait a little longer for, you know, to really assess that," Yellen told reporters after an event at Yale University.
It’s worth noting that US President Joe Biden also reacted to the OPEC+ output cut while terming it as, “Not as bad as you think.”
Additional comments
Clearly, it's not a positive for global growth.
And it adds to uncertainty and burdens at a time when inflation is already high and holding prices down is a top priority.
A reduction in gasoline prices from last year's peaks had helped limit inflation and it would be detrimental if the trend were reversed.
Asked about the impact of the $60 per barrel price cap on Russian crude oil imports that Western allies imposed, she said she did not view the OPEC+ production cut plan as a significant factor to "have any impact on the appropriate level of the cap.
Coalition countries could revisit the price cap level if a change was deemed appropriate, ‘But I don't see that that's appropriate at this time.’
I want to withhold judgment now on just what impact this will have on oil prices, although I know there's been some reaction today," she said of the OPEC+ move.
Deposit outflows from small and medium-sized banks were diminishing, but I was watching the situation closely and was ‘not willing to allow contagious runs to develop’ in the US banking system.
Confidence in the banking system was strengthened by actions taken by the Treasury, Federal Reserve and Federal Deposit Insurance Corp after the failures of Silicon Valley Bank and Signature Bank.
My read is that outflows from smaller and medium-sized banks are diminishing, and matters are stabilizing, but it's a situation we're watching very closely.
We've focused on a range of issues including financial, risks and have not put all of our focus on climate risks.
I don't think there's a fundamental problem with the banking system.
Also read: Forex Today: Markets remain upbeat despite OPEC+ surprise output cut; RBA next
-
23:41
NZIER QSBO: RBNZ tightening looks to be gaining traction in dampening demand
“New Zealand's business confidence in the first quarter showed some positive developments with both business confidence and firms' own trading activity recovering slightly,” according to the latest New Zealand Institute of Economic Research (NZIER) Quarterly Survey of Business Opinion (QSBO).
The NZIER QSBO statement also said, “The tightening in monetary policy by the Reserve Bank since November 2021 looks to be gaining traction in dampening demand in the economy.”
Additional comments
A net 66% of firms surveyed expected general business conditions to deteriorate compared with 70% pessimism in the previous quarter.
On a seasonally adjusted basis, 61% expected business conditions to worsen, versus 74% pessimism recorded in the previous period.
The survey's measure of capacity utilization rose to 94.0%, from the previous quarter's 93.7%.
There are signs of capacity pressures easing in the New Zealand economy as demand continued to soften in the first quarter of 2023.
Builders were most downbeat in the March quarter. This reflects a continued weakening in demand, with more building sector firms reporting a decline in new orders and output.
NZD/USD grinds higher
The NZIER QSBO outcome failed to inspire NZD/USD bulls, even if they cheer the broad US Dollar weakness around 0.6300 by the press time.
Also read: NZD/USD Price Analysis: Bulls are in control but are flirting with key resistance
-
23:40
USD/CAD Price Analysis: Six-day losing spell to extend further below 1.3400
- USD/CAD has attempted a recovery after dropping to near 1.3410, however, the downside bias is still solid.
- The USD Index would extend its downside journey on expectations of an early pause in the rate-hiking spell by the Fed.
- Solid oil prices are expected to keep the Canadian Dollar on the front foot.
The USD/CAD pair has attempted a recovery after dropping to near 1.3410 in the early Asian session. The recovery move by the Loonie asset is expected to turn into a short-lived pullback as the US Dollar Index (DXY) would extend its downside journey on expectations of an early pause in the rate-hiking spell by the Federal Reserve (Fed).
The Loonie asset has registered a six-day losing spell and more downside is in pipeline amid expectations for a further jump in oil prices. It is worth noting that Canada is the leading exporter of oil to the United States and higher oil prices will strengthen the Canadian Dollar.
Going forward, the street is expected to keep its focus on the United States Automatic Data Processing (ADP) Employment Change (March) data, which is scheduled for Wednesday. The economic data is seen lower at 205K vs. the prior release of 242K.
On a four-hour scale, the Loonie asset has shifted below the 61.8% Fibonacci retracement (plotted from February 02 low at 1.3262 to March 10 high at 1.3862) at 1.3493. The major will likely retrace its entire move.
Downward-sloping 10-and 20-period Exponential Moving Averages (EMAs) at 1.3474 and 1.3511 respectively indicate that the bearish momentum is extremely strong.
The Relative Strength Index (RSI) (14) is oscillating in the bearish range of 20.00-40.00, showing active downside momentum, however, an oversold situation cannot be ruled out.
A mean-reversion to near the 10-EMA would offer a bargain sell for investors and the major would continue its downside move toward February 16 low at 1.3357 and February 02 low at 1.3262.
In an alternate scenario, an upside move above the psychological resistance of 1.3500 will shift traction in the favor of US Dollar bulls, which will drive assets towards 50% and 38.2% Fibo retracements at 1.3563 and 1.3633 respectively.
USD/CAD four-hour chart

-
23:36
USD/CHF slides towards 0.9100 despite softer Swiss inflation on SNB, Fed talks
- USD/CHF holds lower grounds after downbeat start to the NFP week.
- Swiss inflation came in softer but SNB’s Schlegel sounds hawkish.
- Fed’s Cook fail to gain accolades for hawkish remarks on softer data, downbeat interest rate futures.
- Risk catalysts are crucial for clear directions amid a light calendar for the day.
USD/CHF remains pressured around 0.9125, following a downbeat start to the key week, as bears struggle to keep the reins amid a light calendar on Tuesday. Even so, the broad US Dollar weakness joins receding hawkish Fed bets and downbeat US data to weigh on the Swiss currency pair. With this, the quote ignores downbeat Swiss inflation and activity data.
On Monday, the Swiss Consumer Price Index (CPI) for March dropped to 0.2% MoM versus 0.4% expected and 0.7% prior while the YoY figures eased to 2.9% from 3.4% previous readings and 3.2% market consensus. Further, SVME Purchasing Managers’ Index (PMI) for March also eased to 47 from 48.9 initial forecasts.
On the other hand, the US ISM Manufacturing PMI dropped to the lowest levels since May 2020 in March, to 46.3 versus 47.5 expected and 47.7 prior. On the same line, the final readings of March’s S&P Global Manufacturing PMI eased to 49.2 compared to 49.3 initial estimations.
Softer US PMIs joined the market’s lack of inflation fears from the OPEC+ supply cuts and the resulting Oil price run-up to weigh on the yields. With this, the CME’s FedWatch Tool marked nearly 43% market bets on the Fed’s 0.25% rate hike in May, versus 52% expected on Friday.
Elsewhere, Swiss National Bank (SNB) Vice Chairman Martin Schlegel told Swiss broadcaster SRF in an interview broadcast on Monday that they will do everything it can to bring inflation down. The policymaker also added that he can't make any forecasts while adding, “But you can see our inflation forecasts are higher now than they were in December," he told SRF. "That means, that if necessary we will continue to raise interest rates."
It should be noted that US Federal Reserve Board Governor Lisa Cook also spoke on Monday and tried to defend the Fed’s hawkish bias by saying that the US has low unemployment and high inflation. Thus the Fed is focused on inflation at present and the disinflationary process is underway but we are not there yet.
Against this backdrop, Wall Street closed mixed and the yields were down while the US Dollar Index (DXY) dropped the most in a fortnight the previous day to test the lowest levels in two months.
Looking forward, a light calendar may allow the Cable pair to remain firmer for the day. However, Wednesday’s US ADP Employment Change, ISM Services PMI and Friday’s US Nonfarm Payrolls (NFP) are the keys for the GBP/USD pair traders to watch for clear directions.
Technical analysis
A daily closing below 0.9120 becomes necessary for the USD/CHF bears to approach a two-month-old ascending support line, close to 0.9080 at the latest. Alternatively, recovery remains elusive below a downward-sloping resistance line from early March, close to 0.9180.
-
23:29
AUD/JPY Price Analysis: Test three-week highs, but retreats below the 50-DMA
- AUD/JPY pair tests 50-DMA but fails to hold gains, capped by technical resistance.
- AUD/JPY must break through 50-day EMA and 90.00 figure for bullish continuation.
- For a bearish scenario, the AUD/JPY must reclaim the 20-DMA at 89.04.
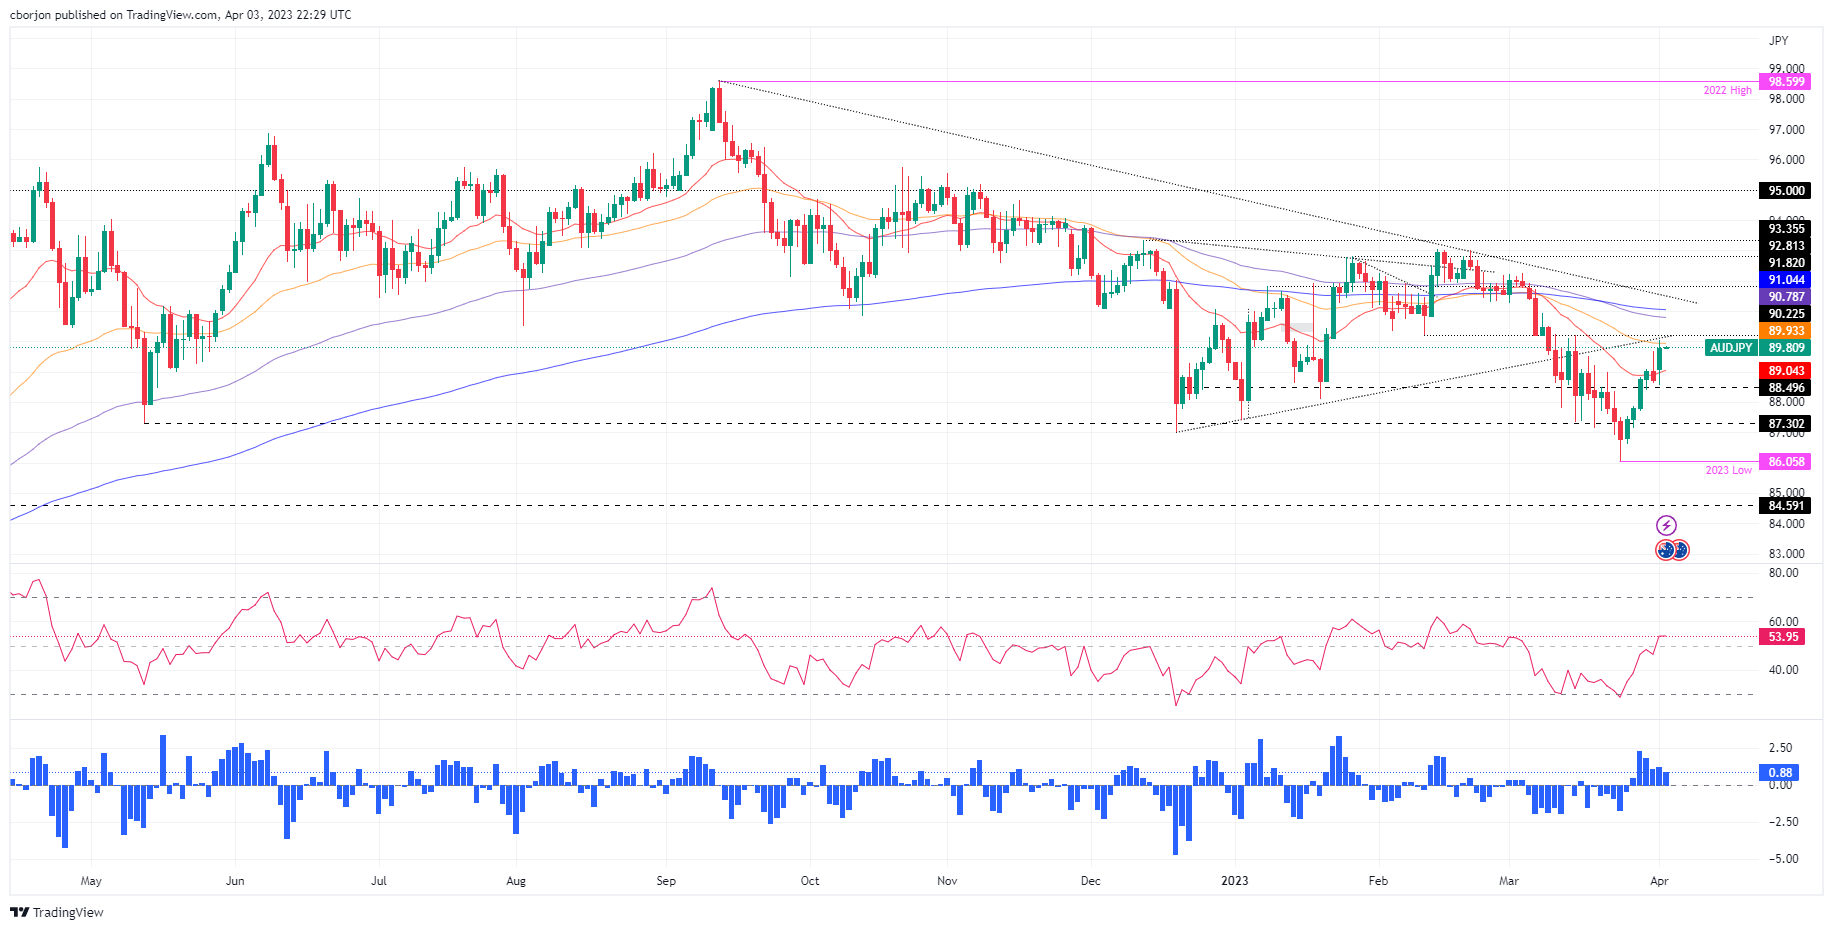
The AUD/JPY rallied sharply on upbeat market sentiment and hit a three-week high at 90.05 but retreated somewhat towards the end of Monday’s session. As the Asian session begins, the AUD/JPY is trading at 89.81
AUD/JPY Price action
On Monday, the AUD/JPY pair tested the 50-day Exponential Moving Average (EMA)at 89.93 but could not hold to its gains above the latter. Additionally, it tested an upslope previous support trendline and turned resistance, which capped AUD/JPY’s upward move. Oscillators like the Relative Strength Index (RSI) at bullish territory shifted flat, suggesting buyers are taking a respite. The Rate of Change (RoC) portrays that buying pressure is cooling. Hence, the AUD/JPY might consolidate in the near term.
The AUD/JPY must crack the 50-day EMA and the 90.00 figure for a bullish continuation. Once cleared, the AUD/JPY could test the 100-day EMA at 90.78 before approaching the 200-day EMA at 91.04. In an alternate scenario, a bearish one, the AUD/JPY first support would be the 20-day EMA at 89.04. Break below, and the AUD/JPY will head toward the week’s low of 88.55, ahead of challenging 88.00.
AUD/JPY chart
AUD/JPY Technical levels
-
23:26
Gold Price Forecast: XAU/USD bulls in town on lower Fed bets
- Gold price is on the front foot to test into the $2,000 on US Dollar weakness.
- US Dollar weighed by poor US data, weighing on Federal Reserve hawkish sentiment.
Gold price rallied on Monday and took out the $2,000 mark with a slump in the US Dollar on the back of bond yields falling on expectations a surprise cut in The Organization of the Petroleum Exporting Countries, OPEC+, production will spur inflation. This was dimming hopes the Federal Reserve will cut interest rates this year.
The rise in the yellow metal comes after The Organization of the Petroleum Exporting Countries, OPEC+, on Sunday made an unexpected 1.1-million-barrel per day cut to production to support prices and reduce global inventories, raising the cost of oil and adding inflationary pressure as the Fed and other central banks raise interest rates to slow their economies to check rising prices.
United States of America data pulls US Dollar lower
The US data on Monday added to the narrative that the Federal Reserve is near the end of its rate-hike cycle. March Manufacturing ISM dropped 1.4pts in March to 46.3, its lowest reading since May 2020. ´´A weakening trend has been in place since May last year (56.1), but recent banking turmoil may have dented confidence further,´´ analysts at ANZ Bank said.
´New orders fell to 44.3 vs 47.0. Manufacturing is one of the most rate-sensitive sectors of the economy as goods like autos are primarily bought on credit. There continues to be encouraging news on goods inflation. Supplier delivery times fell 0.4 to 44.8, its lowest level since March 2009, and the prices sub-index fell 2.1pts to 49.2.´´
Federal funds futures are now pricing in a 60% chance of another 25 basis-point (bp) rate hike by the Fed in May, down around 5% on the back of today´s manufacturing data. Moreover, futures traders have also factored in a pause in June and rate cuts by December. Traders will now await the Services data tomorrow. ´´We look for the ISM Services index to retreat after showing signs of stabilization at a still-firm level of ~55 in Jan-Feb,´´ analysts at TD Securities said.
The US Dollar moved down to test below 102 the figure, DXY, while the US 10-year note was down 3.9 basis points to 3.432%. The two-year note was down 2.1 basis points to 4.007%.
Nonfarm Payrolls on the cards
Looking ahead, the focus this week will be on Friday's Nonfarm Payrolls jobs report, although many markets will be closed for the Easter holiday.
´´US Nonfarm Payrolls payrolls likely stayed firm at a still above-trend pace in March, though slowing from stronger prints in Jan-Feb,´´ the analysts at TD Securities explained.
´´We also look for the Unemployment Rate to stay unchanged at 3.6%, and wage growth to print a firm 0.3% MoM.´´
Gold technical analysis
As per the pre-market open weekly Gold price analysis, Gold, Chart of the Week: XAU/USD bulls remain in control, the Gold price indeed rallied:
Prior Gold price analysis
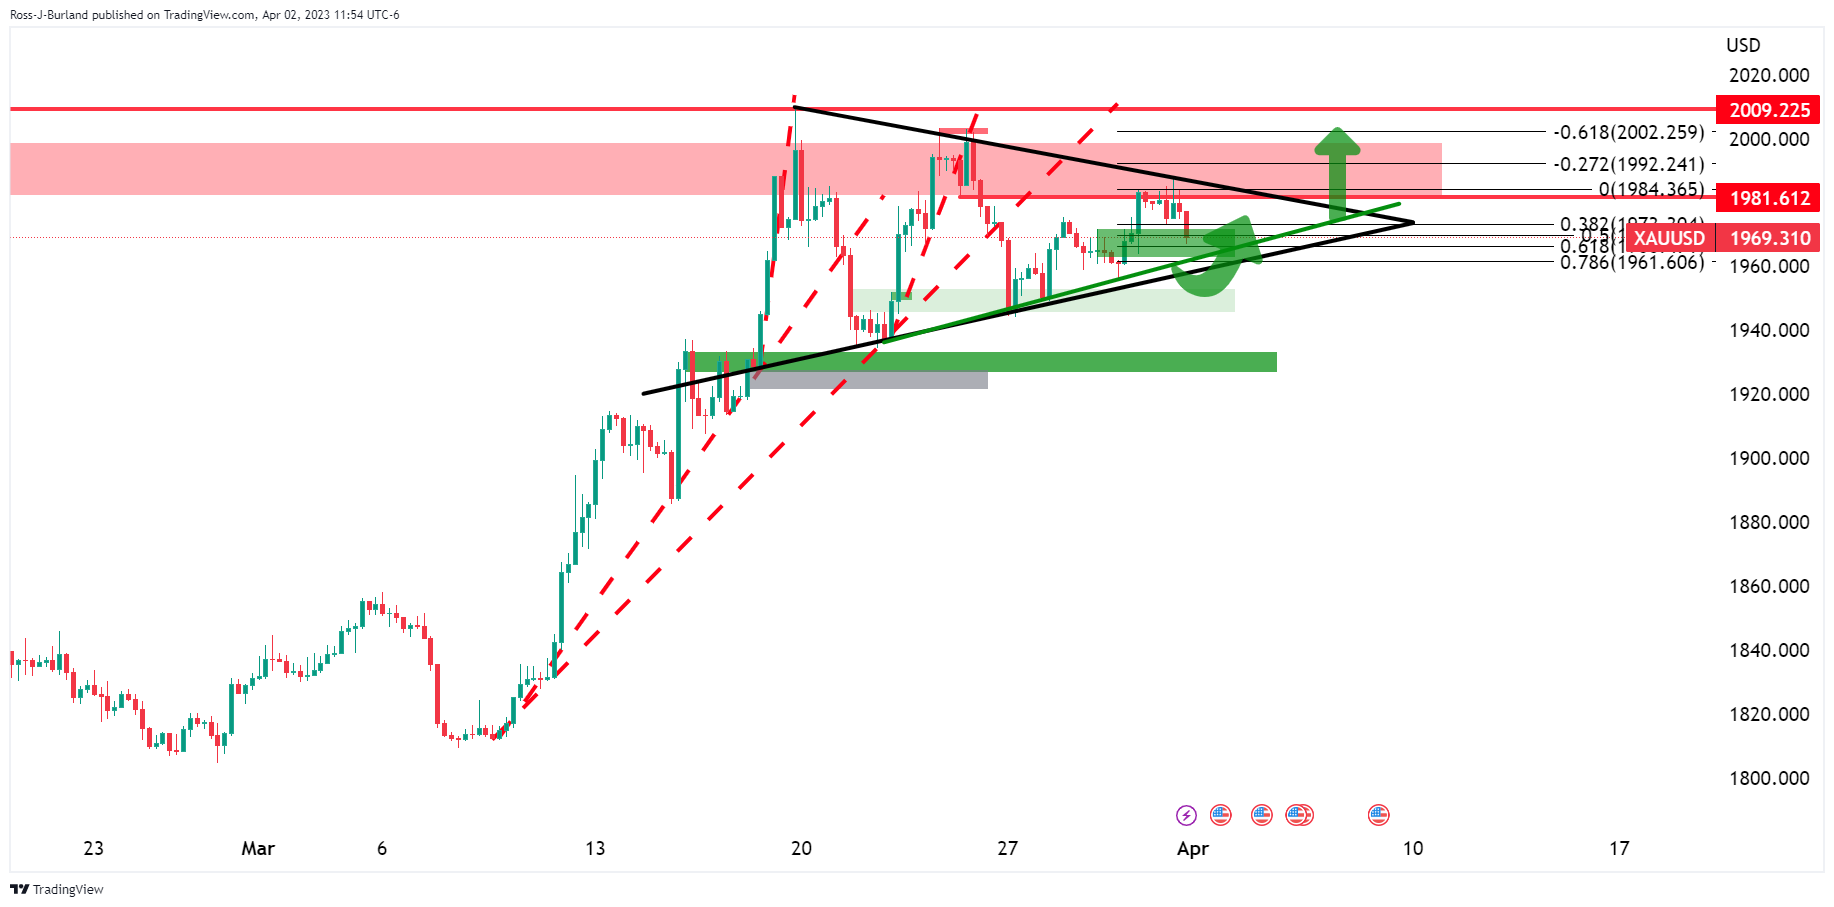
We have a bullish pennant on the daily and 4-hour charts:
Gold price update

The Gold price bulls are back in the market after an anticipated drive from around the supporting area. The Gold price bulls need to commit at this juncture to get and stay above $2,010.
-
23:13
GBP/USD bulls cheer US Dollar weakness, Fed hawks’ retreat above 1.2400
- GBP/USD grinds higher after an upbeat start to the key week.
- OPEC+ verdict fails to underpin US Dollar despite fueling Oil prices.
- Cable ignore Brexit criticism, downbeat UK inflation expectations amid broad US Dollar.
- Softer US data, yields join receding hawkish Fed bets to weigh GBP/USD price.
GBP/USD remains firmer around 1.2420 during early Tuesday in Asia as bulls approach the multi-day-old resistance area amid broad US Dollar weakness. In doing so, the Cable pair ignores downbeat inflation forecasts and Brexit concerns at home amid optimistic comments from the Bank of England (BoE) Officials.
That said, the US Dollar Index (DXY) dropped the most in a fortnight the previous day to test the lowest levels in two months as downbeat US data and yields weigh on the Federal Reserve (Fed) bets.
On Monday, US ISM Manufacturing PMI dropped to the lowest levels since May 2020 in March, to 46.3 versus 47.5 expected and 47.7 prior. On the same line, the final readings of March’s S&P Global Manufacturing PMI eased to 49.2 compared to 49.3 initial estimations.
Softer US PMIs joined the market’s lack of fears from the OPEC+ supply cuts and the resulting Oil price run-up to weigh on the yields. That said, the US 10-year Treasury bond yields printed a four-day downtrend to 3.41% at the latest.
With this, the CME’s FedWatch Tool marked nearly 43% market bets on the Fed’s 0.25% rate hike in May, versus 52% expected on Friday.
At home, Bank of England (BoE) Chief Economist Huw Pill crossed wires via Reuters while saying, “The UK banking system is well capitalized.” The policymaker also said that the Well-capitalized banks help combat inflation, though inflation is still far too high.
Further, the latest monthly survey from Citi and YouGov, published on Monday, said the UK public's inflation expectations eased in March after edging a tad higher in February. ‘For 12 months ahead, the UK public inflation expectations eased to 5.4% in March from 5.6% in February,” states the survey details.
It should be noted that No10’s confirmation that the traffic jam at Dover port was due to Brexit and political chaos around grooming gangs prod the GBP/USD buyers.
Amid these plays, Wall Street closed mixed while the riskier assets cheered the US Dollar’s weakness.
Moving on, a light calendar may allow the Cable pair to remain firmer for the day. However, Wednesday’s US ADP Employment Change, ISM Services PMI and Friday’s US Nonfarm Payrolls (NFP) are the keys for the GBP/USD pair traders to watch for clear directions.
Technical analysis
GBP/USD approaches the 1.2445-50 key resistance area comprising multiple tops marked since early December 2022. It’s worth noting that the RSI (14) conditions are firmer this time, suggesting brighter chances of the quote’s run-up beyond the critical upside hurdle. Meanwhile, the Cable sellers need validation from February’s high of 1.2270.
-
23:04
EUR/USD reclaims 1.0900 after a V-shape recovery inspired by weak US Manufacturing PMI
- EUR/USD has reclaimed the 1.0900 resistance after a V-shape recovery amid the risk-on mood.
- Weak US Manufacturing PMI data has advocated the need for an early pause in the Fed’s policy-tightening spell.
- US Manufacturing PMI has registered a fifth straight figure below 50.0.
The EUR/USD pair has recaptured the round-level resistance of 1.0900 in the early Asian session. The major currency pair showed a V-shape recovery after dropping below 1.0800. The rationale behind the bumper recovery in the shared currency pair was the release of the weak United States ISM Manufacturing PMI data, which conveys that the US growth rate is expected to show a crackdown quarterly.
S&P500 settled Monday’s session with marginal gains after a volatile trade as the Federal Reserve (Fed) is expected to pause the policy-tightening spell early to avoid a contraction in the growth rate, portraying a risk-on mood. The US Dollar Index (DXY) reported a vertical fall after a recovery move to near 103.00. The USD Index has reverted to near its weekly low around 102.00 as Fed chair Jerome Powell has to prioritize economic conditions before addressing the stubborn inflation.
Coming back to the US Manufacturing PMI data, the economic data contracted to 46.3 from the consensus of 47.5 and the former release of 47.7. This was the fifth straight figure below 50.0 and a figure of 50.0 acts as a silver line for a growth contraction.
Also, New Orders Index contracted to 44.3 from the expectations of 44.6, which indicates that forward demand is expected to remain subdued. Therefore, the Fed could consider a pause in the policy-tightening spell ahead.
On the Eurozone front, rising inflationary pressures led by a shortage of labor are bolstering the need of more rate hikes from the European Central Bank (ECB). And now fresh rise in the oil price along with expectations of more gains have added fuel to the fire. ECB President Christine Lagarde is expected to continue the rate-hiking spell as a rebound in headline Eurozone inflation is highly anticipated.
-
23:00
New Zealand NZIER Business Confidence (QoQ) climbed from previous -70% to -66% in 1Q
-
22:53
United States Total Vehicle Sales down to 14.8M in March from previous 14.9M
-
22:46
USD/MXN reclaims 18.0000 after testing a four-week low, post weak US PMIs
- US Manufacturing PMI data reveals recessionary signs as business activity contracts.
- US Treasury bond yields fall sharply as odds for another rate hike remain uncertain.
- Strong PMI reading indicates continued growth in Mexico’s manufacturing sector.
USD/MXN climbs back above the 18.0000 thresholds after testing four-week lows around 17.9644 in the early North American session. Despite broad US Dollar (USD) weakness, outward flows from the emerging markets currency weakened the Mexican Peso (MXN). At the time of writing, the USD/MXN is trading at 18.0420.
US Manufacturing PMI data reveals recessionary signs as business activity contracts
Wall Street closed with gains, except for the heavy tech Nasdaq 100. US Treasury bond yields fell sharply, as odds for another rate hike lie at 52.4%. However, money market futures are already pricing in two rate cuts by the end of 2023.
Earlier data showed a slew of Manufacturing PMI data for the United States (US) flashed recessionary signs in the US. The S&P Global and ISM revealed that business activity contracted, with the latter decreasing to 46.3 in March, below the forecast of around 47.5. The gauge plummeted to its lowest since May 2020, weighed by worse-than-estimated new orders and employment measures.
The greenback continued to extend its losses, as the US Dollar Index fell 0.52% to 102.063. US
Consequently, the greenback erased some of its earlier gains, bolstered by higher oil prices. The US Dollar Index (DXY), which tracks the buck’s value vs. a basket of six currencies, slides from 103.05 to 102.20, down 0.38%.
On the Mexican front, Business Confidence in Mexico rose to 52.9, above February’s 52.1. The S&P Global Manufacturing PMI for March registered 51.6 points. In the last 32 months (since August 2020), the indicator has been above 50 points, which is still the expansion zone.
USD/MXN Technical analysis
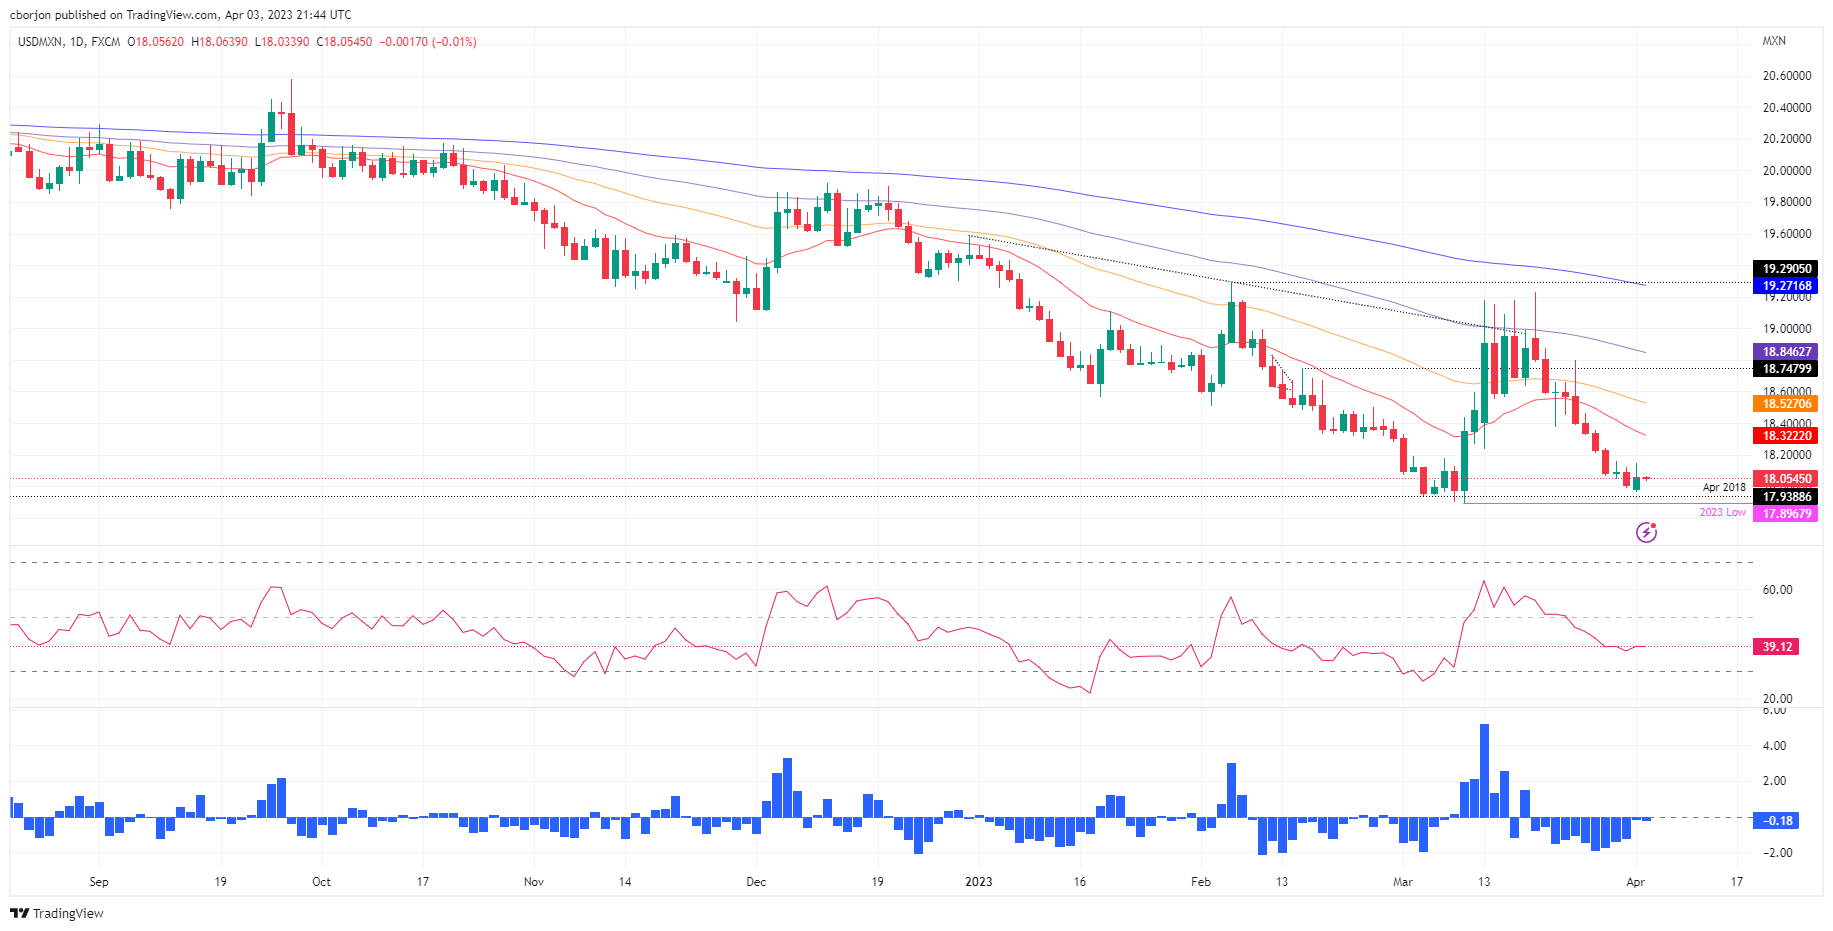
From a technical perspective, the USD/MXN remains neutral to downward biased. Although Monday’s price action was bullish, an inverted hammer, preceded by a downtrend and a daily close around the previous candle mid-point, could open the door for further downside. Therefore, the USD/MXN first support would be the 18.0000 mark. Breach of the latter will expose the YTD low of 17.8968, followed by 17.5000.
-
22:40
SNB´s Schlegel: Will do everything it can to bring inflation down
The Swiss National Bank will do everything it can to bring inflation down, Vice Chairman Martin Schlegel told Swiss broadcaster SRF in an interview broadcast on Monday including hiking interest rates further as well as selling foreign currencies.
Key comments
"Our mandate is crystal clear, and that is price stability."
"And we're going to do everything we can to get inflation back to the target range of 0 to 2%."
"Of course I can't make any forecasts, but you can see our inflation forecasts are higher now than they were in December," he told SRF. "That means, that if necessary we will continue to raise interest rates."
´´We don't see any signs at the moment that that could threaten financial stability in Switzerland."
"We said quite clearly at the last assessment that we are also prepared to sell foreign currencies, to actually strengthen the franc."
"That's what we did in the last quarter, to the tune of 27 billion. That's quite a big number. We look at the exchange rate and will intervene if necessary."
USD/CHF update
USD/CHF is flat on the new day on Tuesday but was pressured on Monday as the US dollar slumped. The price dropped to a low of 0.9115.
-
22:30
Fed´s Cook: US has low unemployment and high inflation
US Federal Reserve Board Governor Lisa Cook on Monday said that the US has low unemployment and high inflation. Thus the Fed is focused on inflation at present and the disinflationary process is underway but we are not there yet. On Friday, when she last spoke publically, she said that she was watching credit conditions closely and will factor in potential economic headwinds from recent banking sector turmoil as she weighs the right level of interest rates to deal with high and persistent inflation.
US Dollar update
S bond yields fell further last night following soft ISM data, dragging the US dollar lower to test belñow 102 the fiogure, DXY.
-
21:47
AUD/USD bulls move in for the kill but bears are lurking ahead of RBA
- AUD/USD jump on the US Dollar´s weakness.
- The RBA will be the key event for the day ahead.
- AUD/USD´s bearish pennant is still in play.
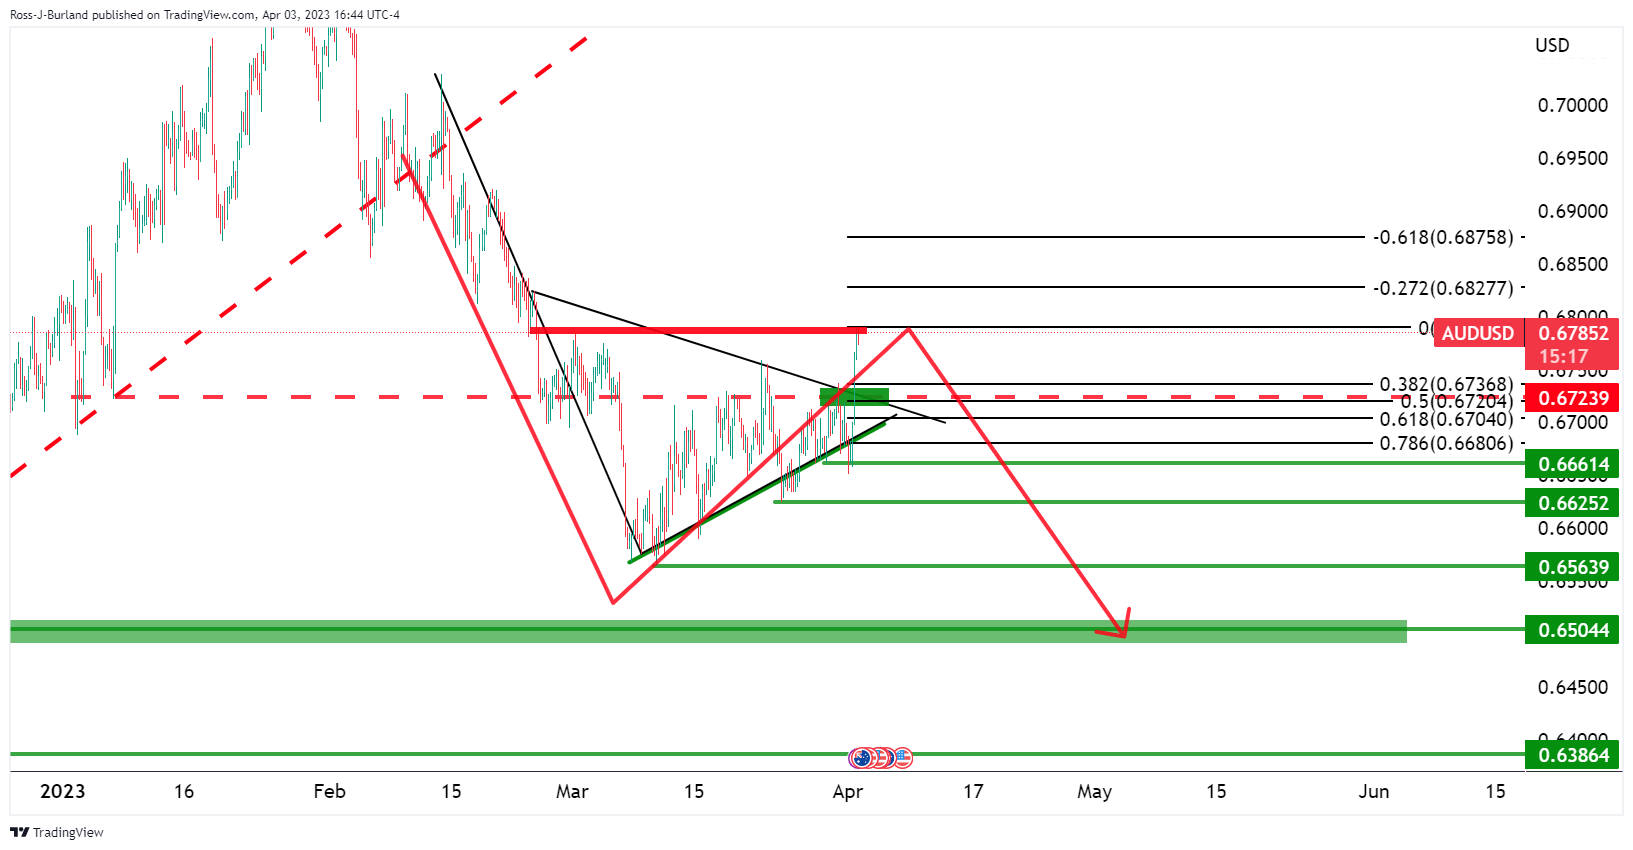
AUDUSD increased to a 4-week high of 0.67585 as the US Dollar slumped on Monday, surrendering earlier gains following unexpected oil output cuts from OPEC+. US data showed that the US economy continued to slow with declines in manufacturing and construction spending.
The data on Monday added to the narrative that the Federal Reserve is near the end of its rate-hike cycle. March manufacturing ISM dropped 1.4pts in March to 46.3, its lowest reading since May 2020. ´´A weakening trend has been in place since May last year (56.1), but recent banking turmoil may have dented confidence further,´´ analysts at ANZ Bank said.
´´New orders fell to 44.3 vs 47.0. Manufacturing is one of the most rate-sensitive sectors of the economy as goods like autos are primarily bought on credit. There continues to be encouraging news on goods inflation. Supplier delivery times fell 0.4 to 44.8, its lowest level since March 2009, and the prices sub-index fell 2.1pts to 49.2.´´
Meanwhile, the Reserve Bank of Australia will be the highlight for today in Asia. ´´We expect a 25bp hike in the cash rate from the RBA today, but the decision will be finely balanced,´´ analysts at ANZ Bank said. ´´ Looking at the four data releases Governor Lowe highlighted as guiding the decision, we see ongoing resilience: unemployment fell back to 3.5%; NAB business conditions remain robust, price and cost growth remained elevated and firms are still in hiring mode; retail sales were softer at +0.2% m/m, but services spending remained solid; and finally, the monthly Consumer Price Index showed inflation momentum is not slowing as much as the fall in annual inflation would suggest.´´
The analysts concluded all of the above and said, ´´the probability of a pause is the highest it’s been in some time.´´
AUD/USD technical analysis
Ahead of the event, the pair broke the resistance of the bearish pennant. While this is going against the grain, it is not uncommon to see such a move for the price only to reverse and eventually break out and not come back in the direction of the chart pattern. However, in the meantime, the bias is bullish while above 0.6700:
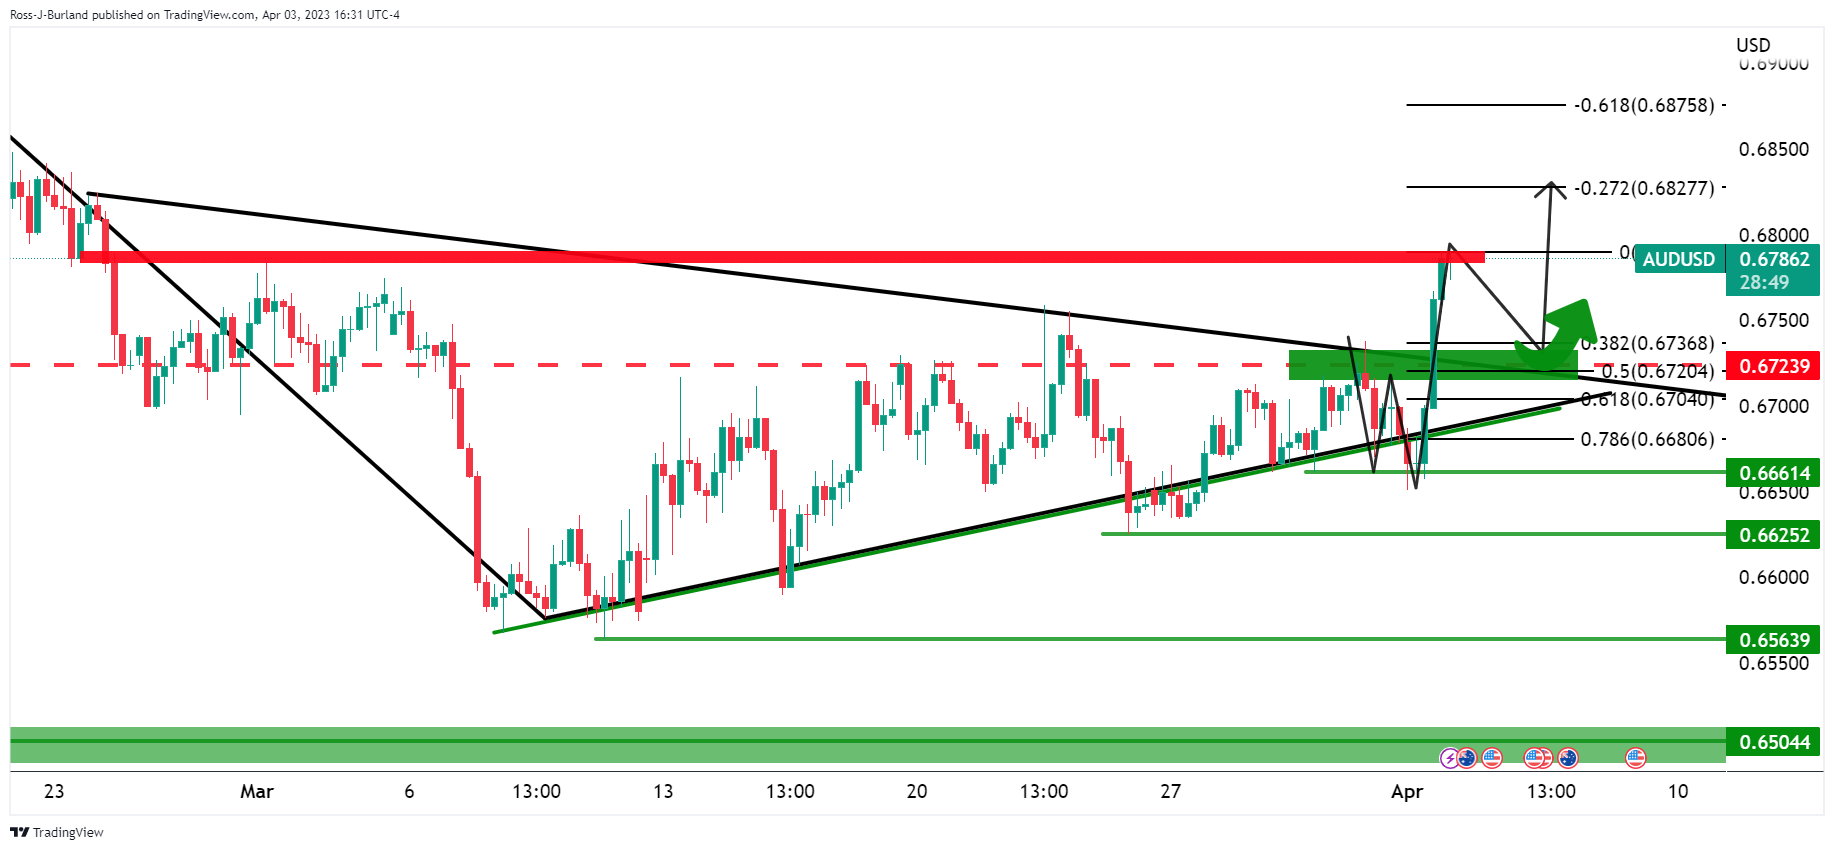
The W-formation would be expected to pull on the price towards support as illustrated. If the bulls commit to the trajectory, then a break of 0.6800 is needed to expel the downside bias of the overriding long-term chart pattern:
-
21:38
Forex Today: Markets remain upbeat despite OPEC+ surprise output cut; RBA next
The OPEC+ shocked markets on Monday, sending crude oil prices sharply higher, but Wall Street kept rallying. On Tuesday, attention will be back on the usual suspects. The Reserve Bank of Australia (RBA) will have its monetary policy meeting, and more inflation numbers are due in the Eurozone with the February Producer Price Index. Markets start getting ready for US employment numbers.
Here is what you need to know on Tuesday, April 4:
A surprise voluntary cut (a million barrels per day off starting in May) from the Organization of the Petroleum Exporting Countries and its allies (OPEC+) boosted sharply crude oil prices at the beginning of the week. The WTI barrel price jumped more than 5%, reaching the highest level since mid-January, above $80.00.
After the decision of the OPEC+, Wall Street indexes reached fresh monthly highs. The Dow Jones gained almost 1%, the S&P 500 rose by 0.37%, but the Nasdaq dropped 0.25%. If crude oil prices continue to increase, it will revive inflation concerns and mount pressure on central banks.
The US Dollar lost ground on Monday, affected by risk appetite and lower US yields on the back of softer-than-expected US Economic data. The ISM Manufacturing PMI came in at 46.3 in March versus the 47.5 expected. The ISM Service PMI and the ADP Employment report are due on Wednesday.
US yields tumbled, with the 10-year dropped to 3.41%, posting the lowest close in a week. The US Dollar Index is hovering around 102.00, looking at March lows. The Japanese Yen benefited from lower yields. USD/JPY reversed from weekly highs, falling to 132.40.
AUD/USD jumped, approaching 0.6800 as the Aussie outperformed. The Reserve Bank of Australia will announce its monetary policy decision. Consensus has changed from a no hike to a 25 basis points rate hike. The decision and the guidance will be relevant for the Australian Dollar.
EUR/USD rebounded sharply from under 1.0800, reaching levels above 1.0900. The area around 1.0930 continues to be the critical resistance. On Tuesday, the Eurozone will release the February Producer Price Index. GBP/USD resumed the upside, and is near the Year-to-Date high above 1.2400.
USD/CHF dropped to 0.9120, while EUR/CHF posted gains on Monday and settled at 0.9950. Switzerland reported inflation with the Consumer Price Index at 2.9% YoY, below the 3.2% of market consensus.
Gold rose more than $30 from the daily lows, finding resistance at $1,990. Silver is moving sideways around $24.00. Cryptocurrencies lost grond; Bitcoin was unable to remain above $28,000. Dogecoin surged more than 35% and then pulled back after Twitter changed the logo to the Doge meme.
Like this article? Help us with some feedback by answering this survey:
Rate this content -
20:54
NZD/USD Price Analysis: Bulls are in control but are flirting with key resistance
- NZD/USD is rising the US Dollar´s weakness at the start of the week.
- NZD/USD bulls need to commit on the front side of the trend.
NZD/USD rallied on the back of a weaker US Dollar in the wake of soft ISM data. At the same time, the commodities sector bounced, led by oil which was supportive of the Kiwi.
´´ The question now is; will a hawkish RBNZ tomorrow give the Kiwi the “escape velocity” it needs to break above 0.63? It may well do, especially if US bond yields continue to fall and markets there fret about financial instability,´´ analysts at ANZ bank argued.
Meanwhile, the technical picture is a short-term bearish, medium-term bullish, but back to bearish again longer term as per the following analysis:
NZD/USD daily chart
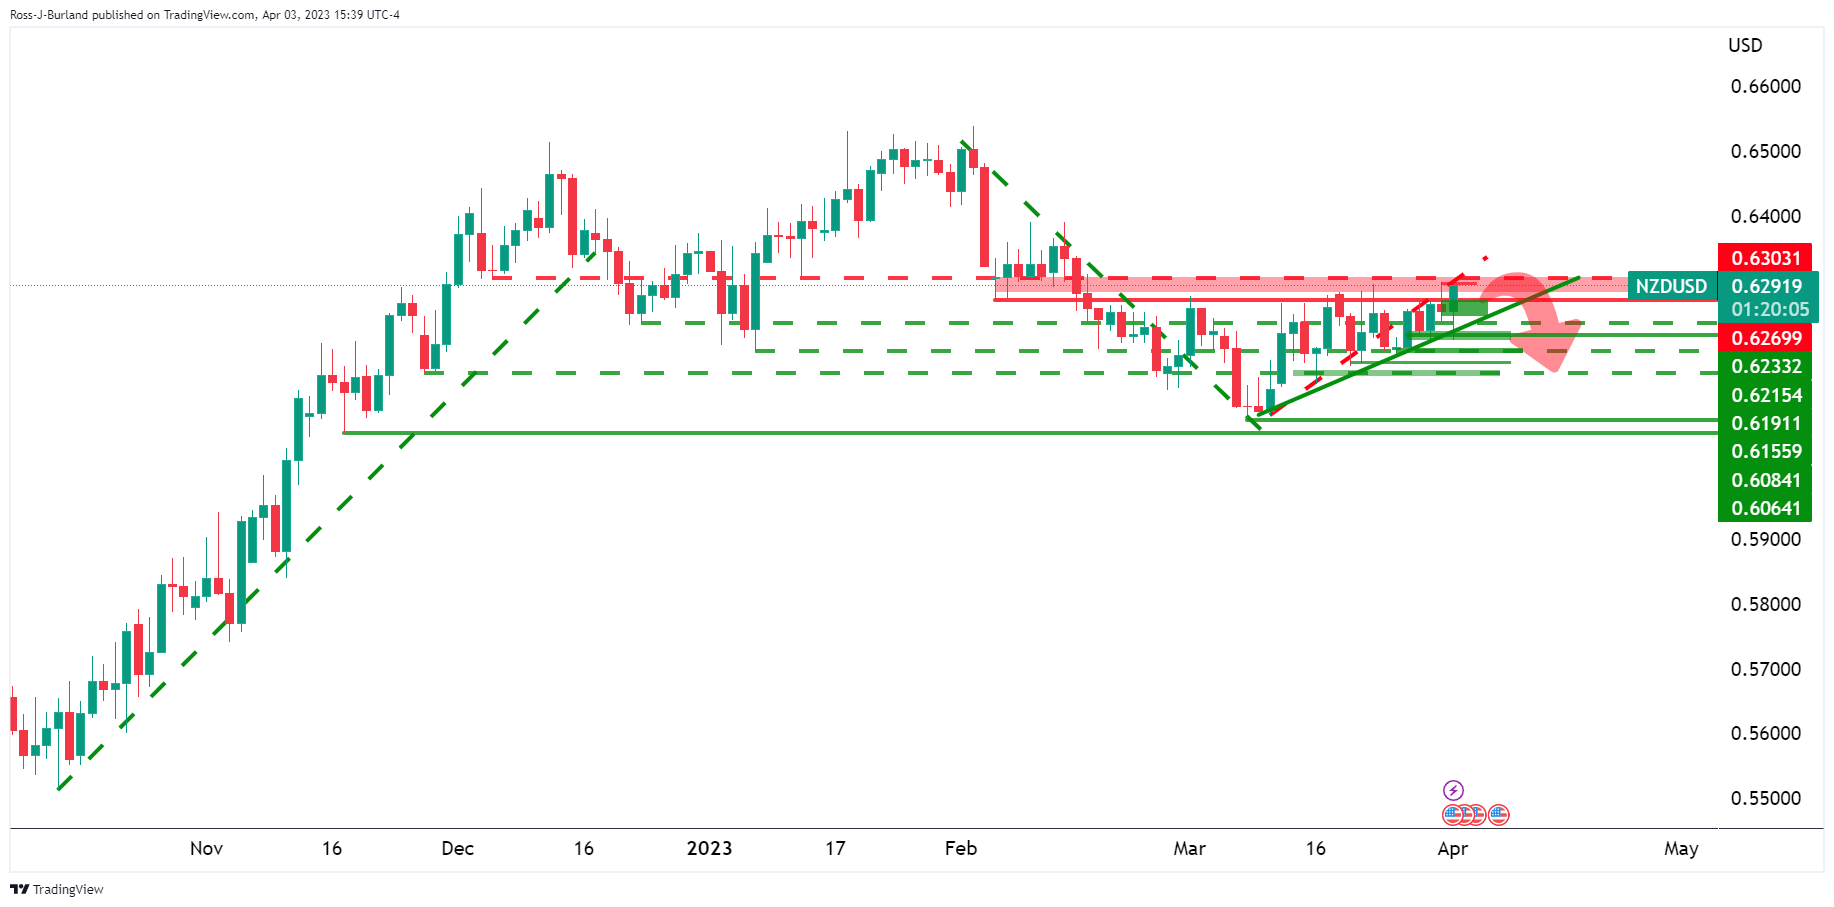
The Kiwi is bullish while on the front side of the trendline but it is running into an area of resistance as per the daily chart above. A break of the trendline support would be a significant bearish development if it occurs after failures above 0.6300 resistance.
NZD/USD H4 charts
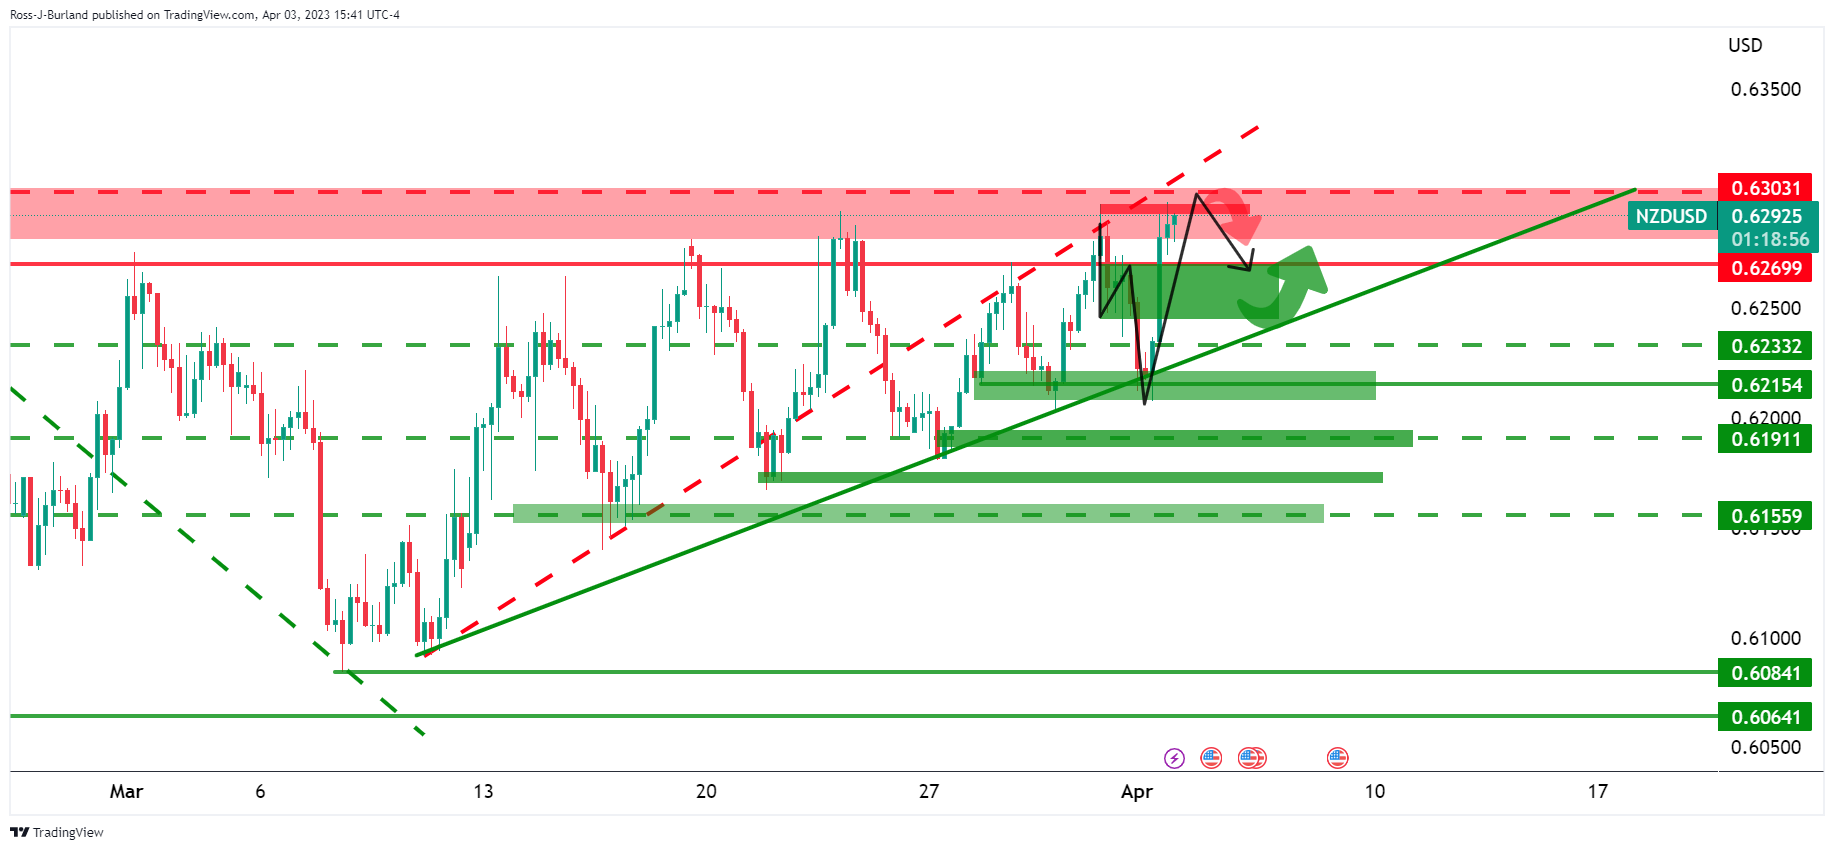
The 4-hour chart has left a W-formation at what could be the top of the bullish cycle. This is a reversion pattern and would be expected to be a pull on the price at resistance.
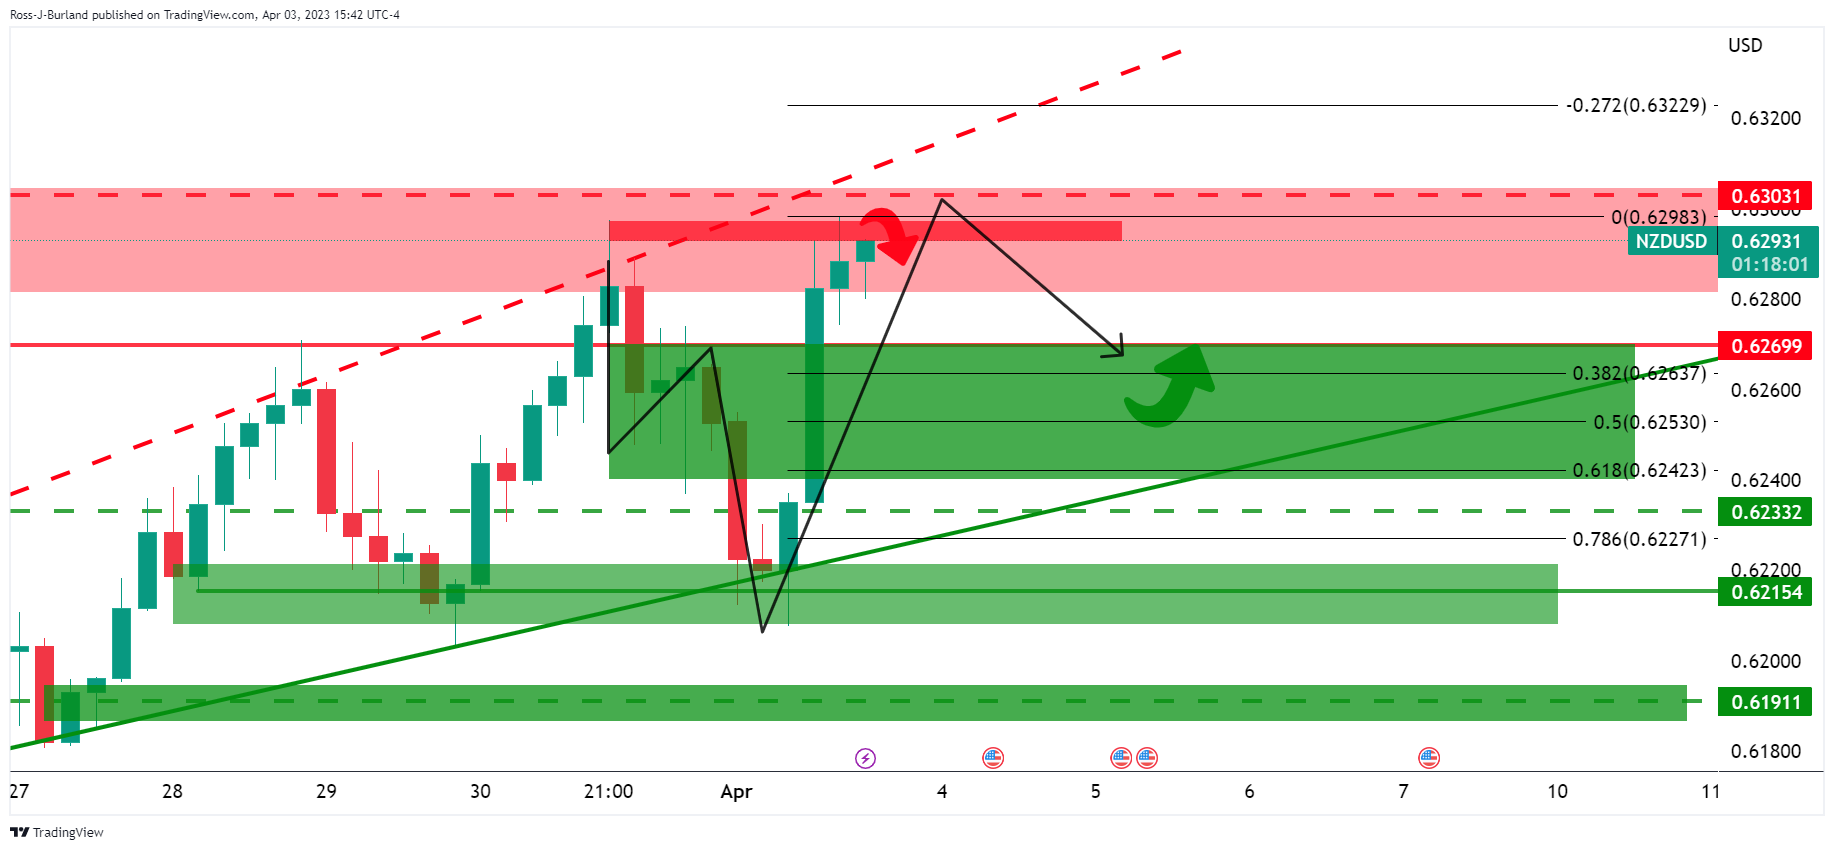
Zooming in, however, should the bulls commit on the front side of the trend and within the Fibonacci scale, then there will be prospects of another test of the resistance area and a break thereof would open the doors for a bullish continuation, on the front side of the bullish trend.
-
20:40
United States Total Vehicle Sales dipped from previous 14.9M to 13.3M in March
-
20:05
WTI bulls stay in control above the opening gap on OPEC production cut
- West Texas Intermediate holds in the bullish territory above the gap.
- OPEC+ cartel surprised the market with a 1.1-million barrel per day cut to production to support prices.
West Texas Intermediate WTI crude oil rose 6.3% on Monday and is trading at $80.44 at the time of writing. The high of the day was $81.51 while the low of the day is at $79.05. The rally in the oil price came after the OPEC+ cartel surprised the market with a 1.1-million barrel per day cut to production to support prices with the cartel saying it will reduce output ahead of the group's ministerial meeting scheduled for Monday.
It has been said that Saudi Arabia will make the bulk of the cuts, reducing output by 0.5-million barrels per day, with Russia and other members also agreeing to lower exports. ´´While the surprise production cuts from OPEC+ sent crude prices rallying, it appears unlikely to induce a further bid from CTAs just yet, with momentum signals needing prices to increase north of $85/bbl and $88/bbl for WTI and Brent crude respectively,´´ analysts at TD Securities said.,
According to the International Energy Agency, the cuts come as global inventories were on the rise, with production seen exceeding demand in the first half of the year. Meanwhile, the agency expects demand to rise above production in the second half of the year.
Nonetheless, the analysts at TD Securities explained that CTA positioning remains skewed short which suggests there is plenty of dry powder for additional buying as physical markets are now likely to tighten quicker than previously anticipated.
´´Indeed,´´ the analysts added,´´time spreads have signaled tighter markets in the aftermath of the production cuts, and on a longer-term horizon, demand expectations remain optimistic as Chinese re-opening demand takes hold.´´
The analysts concluded that ´´this could again see speculative long exposure built back up as the year progresses, which in turn could be the catalyst to kickstart further short covering from CTAs.´´
-
19:53
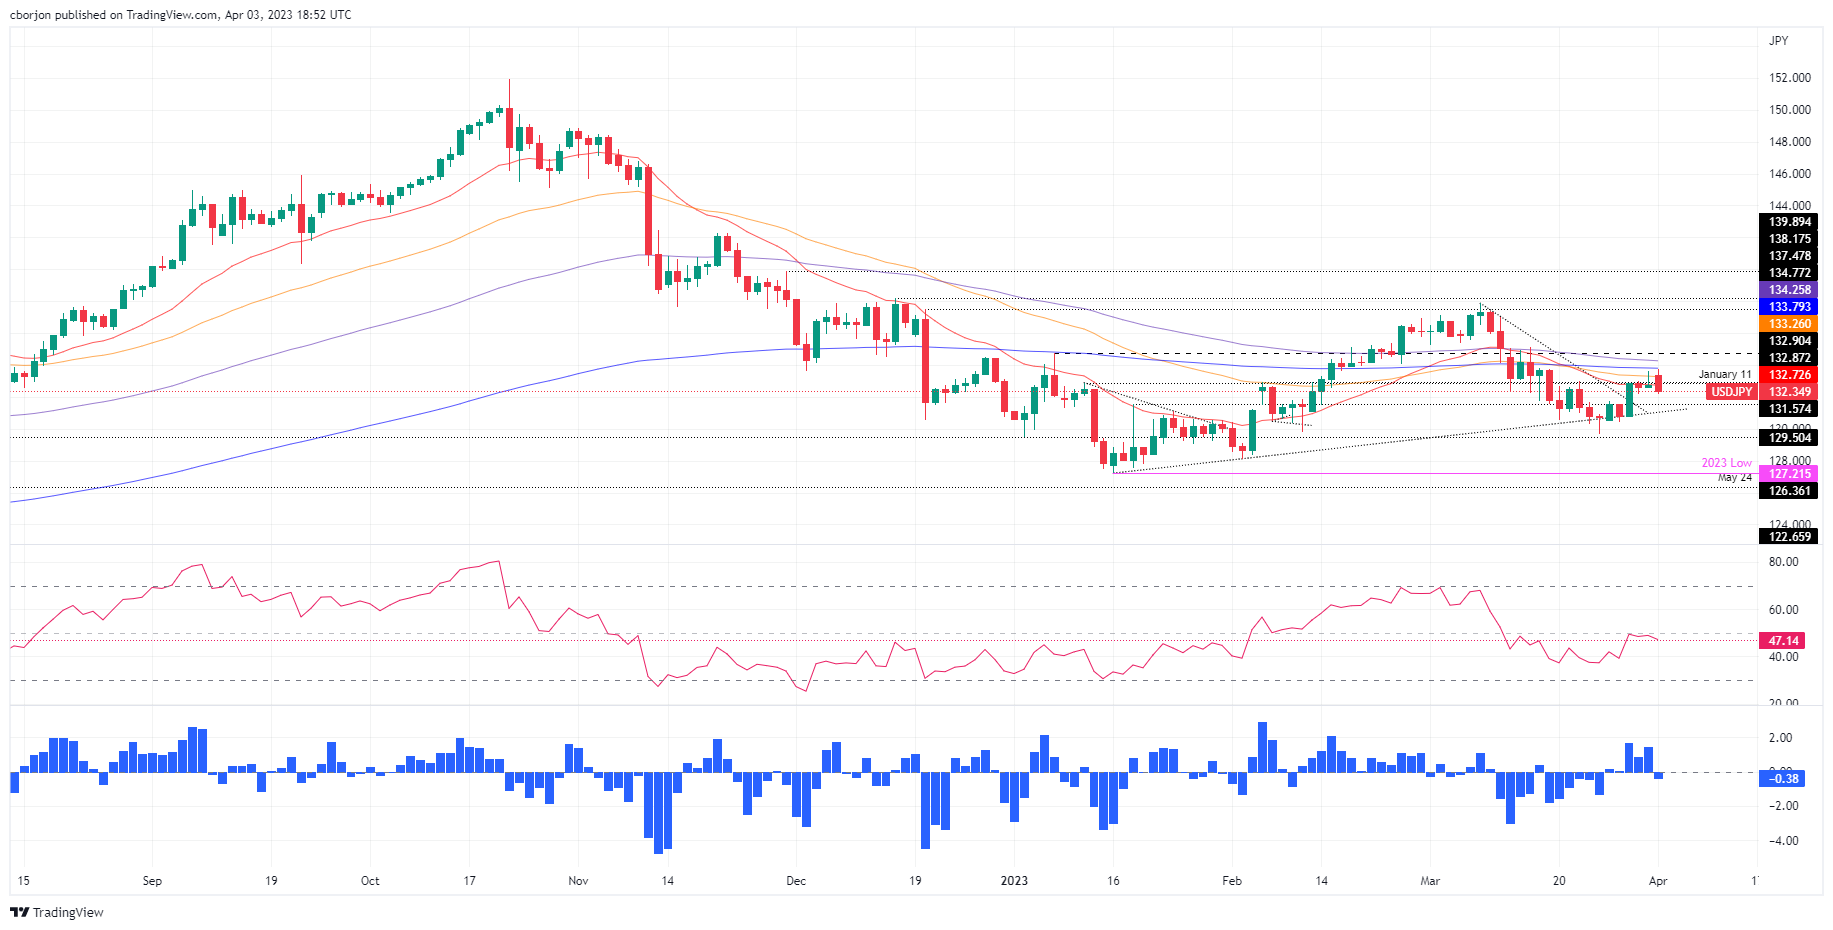
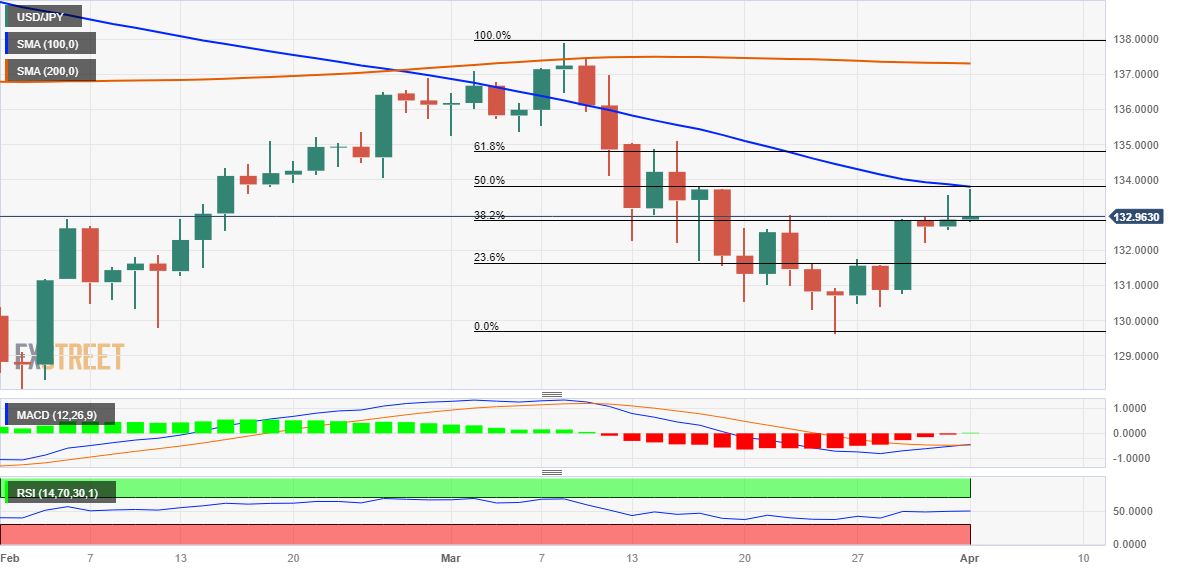
USD/JPY Price Analysis: Retraces after failing to crack the 200-DMA
- Bullish momentum faded after the USD/JPY could not break resistance at the 200-DMA.
- USD/JPY path of least resistance is downwards, with first support at 132.00.
- A fall beyond 132.00, and the USD/JPY could test 131.00.
USD/JPY retraces from two-week highs at around 133.75 and extends its losses below the 50-day Exponential Moving Average (EMA) at 133.25 after failing to pierce the 200-day EMA at 133.79. At the time of writing, the USD/JPY is exchanging hands at 132.28, down 0.33%.
USD/JPY Price action
From the daily chart perspective, the USD/JPY bullish momentum waned after the pair fell shy of cracking the 200-day EMA. That would’ve exposed the 134.00 figure on the upside, followed by the 100-day EMA at 134.25.
Hence, the USD/JPY resumed its downtrend direction, exacerbated by back-to-back breaks of essential support levels, like the 50 and 20-day EMAs, at 133.25 and 132.72. Additionally, the Relative Strength Index (RSI) failed to crack the 50-mid-line and headed downwards, while the Rate of Change (RoC) began to portray that sellers were gathering momentum.
Therefore, the USD/JPY path of least resistance is downwards. That said, the USD/JPY first support would be 132.00. A breach of the latter will expose the March 27 high at 131.76, followed by an upslope support trendline drawn from January lows that passes around 131.10-20. Once cleared, 131.00 would be next.
USD/JPY Daily chart
USD/JPY Technical levels
-
19:11
US: ISM signaling theme preceding recession – Wells Fargo
The ISM Manufacturing PMI Index dropped from 47.7 in February to 46.3 in March. Analysts at Wells Fargo point out that while some parts of the service sector demonstrate resilience to the fastest rate hikes in a generation, the message from today's ISM manufacturing index is that the factory sector is reeling.
Key Quotes:
“The ISM manufacturing report for March was a dud. Not only was the headline index at its lowest since 2020, every sub-component was below the breakeven 50 for the first time since 2009. All but two (production and customer inventories) were lower versus the prior month.”
“The closest thing we get to good news in today's report is that the slowing in the factory sector is pushing prices lower and supply chains are continuing to heal, benefiting from the slack.”
“The rest of the themes were those that often precede an economic recession: new orders and production are contracting, so much so that production is being transitioned to deal with backlogs.”
“We expect tighter financial conditions and growing uncertainty around recession are weighing on firms' desires to invest. The recent stress in the banking sector led to a sharp tightening in financial conditions, and we expect banks will tighten lending standards as a result. Manufacturing activity was slowing before the recent stress, and we expect tighter conditions will contribute further to that slowdown in investment spending.”
-
19:01
Brazil Trade Balance registered at 10.956B above expectations (9.05B) in March
-
19:01
Brazil Trade Balance registered at 10.9B above expectations (9.05B) in March
-
18:59
GBP/USD bulls step in on US Dollar weakness
- GBP/USD bulls take advantage of a weaker US Dollar in Monday's US trade.
- The focus will shift to the US NFP report on Good Friday.
GBP/USD was up some 0.54% in mid-morning US session trade on Monday, traveling from a low of 1.2274 to score a high of 1.2420 after the US Dollar fell sharply during the Wall Street opening hours.
The greenback was heavily dented by Monday's economic reports that showed US manufacturing activity in March slumped to its lowest level in nearly three years as new orders continued to contract. The Institute for Supply Management (ISM) reported that its Manufacturing PMI fell to 46.3 last month. This was the worst since May 2020, from 47.7 in February.
Meanwhile, last week’s PCE data, the Federal Reserve´s preferred inflation measure, were mixed. While headline and core both came in a tick lower than expected, super core accelerated for a second straight month to 4.63% YoY and is the highest since October. ´´This is not the direction that the Fed desires and so we look for the hawkish tilt in Fed comments to continue,´´ analysts at Brown Brothers Harriman explained.
Nevertheless, federal funds futures are now pricing in a 60% chance of another 25 basis-point (bp) rate hike by the Fed in May, down around 5% on the back of today´s manufacturing data. Moreover, futures traders have also factored in a pause in June and rate cuts by December. Traders will now await the Services data tomorrow. ´´We look for the ISM Services index to retreat after showing signs of stabilization at a still-firm level of ~55 in Jan-Feb,´´ analysts at TD Securities said.
BoE in focus
Domestically, with regards to the Bank of England, May's Monetary Policy Committee decision is likely to be ´´finely balanced´´, analysts at TD Securities argued.
´´Any early sight on how the (especially) centrist and hawkish MPC members are positioning themselves will be important,´´ the analysts said.
On Monday, the Bank of England Chief Economist Pill stressed that policy remains data-dependent. He said inflation remains too high but stuck with the bank’s forecast that it will fall sharply this year.
“We raised rates by 400 bp. These measures take up to eighteen months to take effect. Should more be done? We will have to see how inflation evolves.”
He added that “the UK banking system is well capitalized and that well-capitalized banks help combat inflation, though inflation is still far too high.”
“For inflation to return to its target, developments in the labor market, which remains tight, will also be decisive,´´ he said.
Analysts at Brown Brothers Harriman said that the BoE tightening expectations remain subdued. ´´The next policy meeting is May 11 and WIRP suggests around 75% odds of a 25 bp hike, with odds of another 25 bp hike topping out near 75% in Q3. As a result, the peak policy rate is now seen between 4.50-4.75%, up from 4.25% during the height of the banking panic,´´ the analysts explained.
NFP eyed as key event
Looking ahead, the focus this week will be on Friday's jobs report, although many markets will be closed for the Easter holiday.
´´US payrolls likely stayed firm at a still above-trend pace in March, though slowing from stronger prints in Jan-Feb,´´ the analysts at TD Securities explained.
´´We also look for the Unemployment Rate to stay unchanged at 3.6%, and wage growth to print a firm 0.3% MoM.´´
-
18:58
USD/CHF falls on weaker US Manufacturing PMIs, soft Swiss inflation data
- S&P Global and ISN Manufacturing PMIs entered the recessionary territory as economic conditions in the US tightened.
- US Treasury bond yields and USD plummet following poor US manufacturing data.
- USD/CHF Price Analysis: A symmetrical triangle in downtrend warrants further low prices.
USD/CHF tumbles 0.17% after hitting a daily high of 0.9196 on softer-than-expected inflation in Switzerland. Nevertheless, a weaker manufacturing activity report from the US reversed the USD/CHF pair course, as investors estimated the US Federal Reserve (Fed) would pause raising rates. At the time of typing, the USD/CHF is trading at 0.9137.
Swiss Franc Bolstered as US Manufacturing Data Misses Estimates
The Swiss Franc (CHF) got bolstered after US economic data, namely the S&P Global and ISM Manufacturing PMIs, came worse than estimated. The S&P Global Manufacturing PMI for March was 49.2, below 49.3 estimates. Later, the Institute for Supply Management (ISM) revealed its Manufacturing PMI, which plunged to 46.3, below the 47.5 foresaw and below February’s data.
Consequently, US Treasury bond yields and the US Dollar (USD) plunged. The USD/CHF extended its losses past the 0.9150 area, hitting a low of 0.9115.
The US Dollar Index (DXY), which tracks the performance of six currencies vs. the US Dollar, drops 0.39%, down to 102.196. the US 2 and 10-year Treasury bond yields are dropping two and four basis points each, at 4.005% and 3.430%, respectively.
Inflation in Switzerland came softer thane expected, with headline data at 2.9% YoY vs. 3.2% estimates. Core inflation rose by 2.2% YoY, below the 2.5% foreseen in February. In March, the Swiss National Bank (SNB) lifted rates by 50 bps to 1.50%, and its Governor, Thomas Jordan, said, “ It cannot be ruled out that additional rises in the SNB policy rate will be necessary to ensure price stability over the medium term.”
USD/CHF Technical analysis
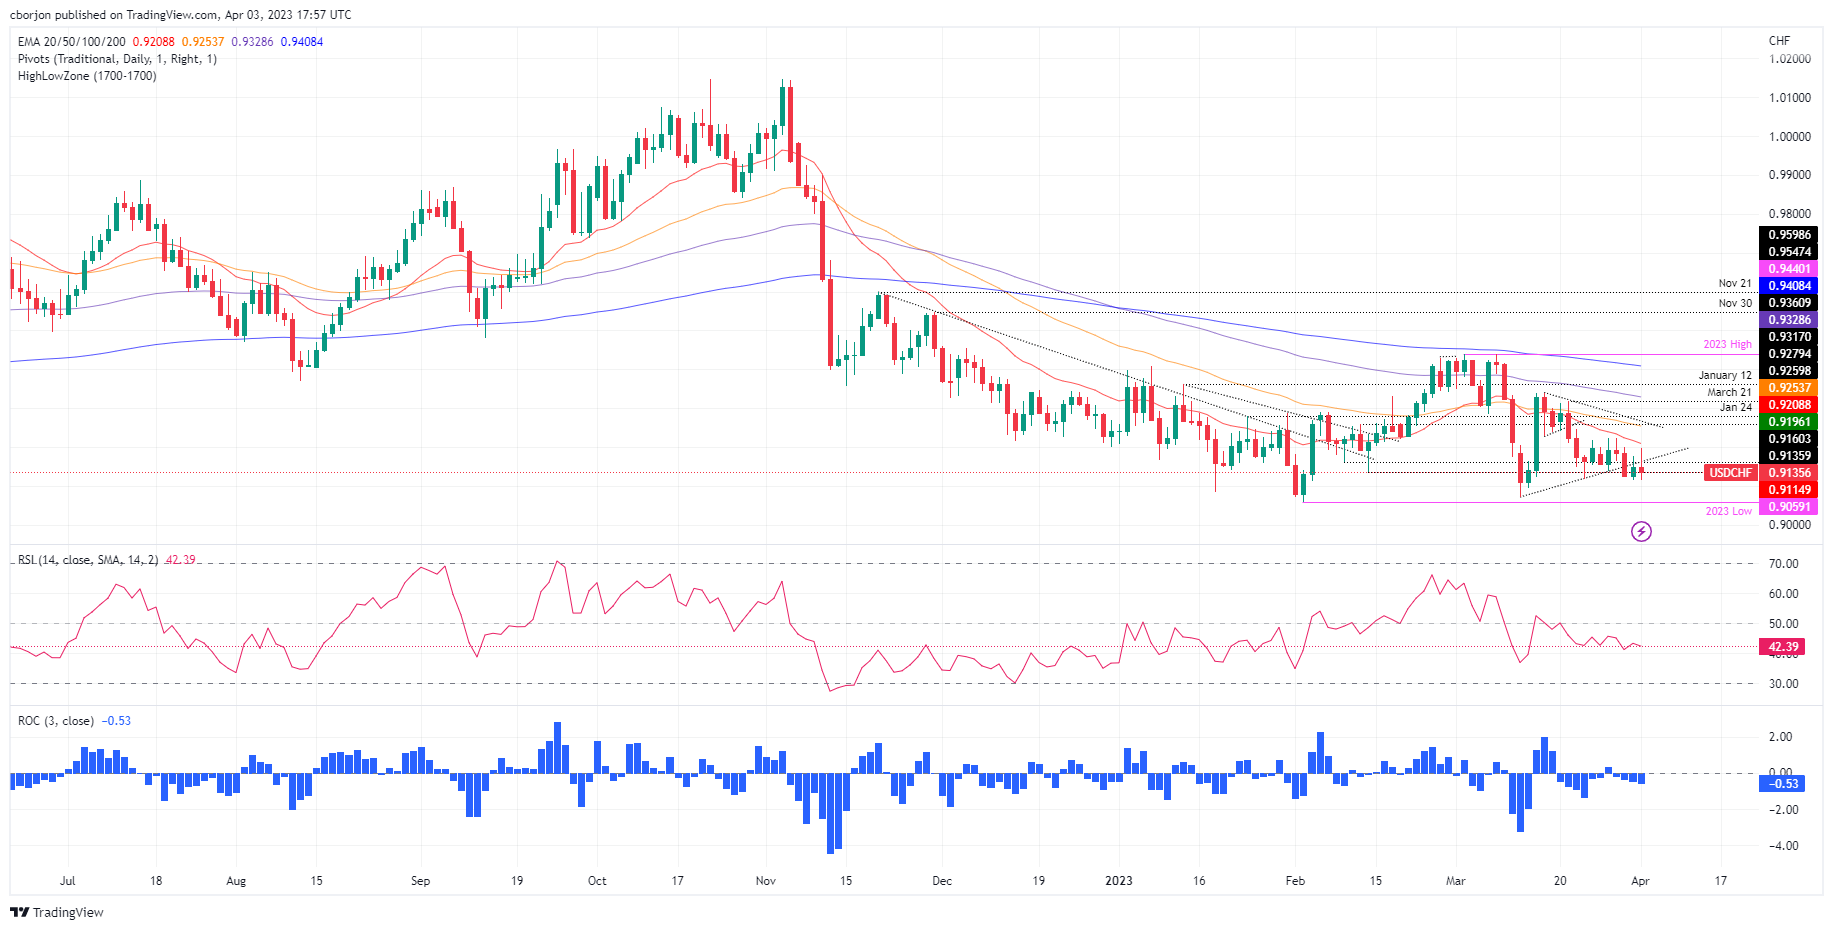
From a daily chart perspective, the USD/CHF is extending its downtrend. After forming a descending triangle in a downtrend, the USD/CHF broke below its bottom trendline, suggesting that further downside is expected. Therefore, the USD/CHF first support would be 0.9115. A breach of the latter will expose the figure at 0.9100, immediately followed by 0.9059.
-
17:22
Silver Price Forecast: XAG/USD stays above $24 despite retreating from weekly highs
- Silver price dips but staus nearby YTD highs as the US Dollar weakens.
- XAG/USD is underpinned as US Treasury bond yields collapse with investors pricing a less aggressive Fed.
- St Louis Fed President Bullard forecasts rates above 5%, says OPEC’s oil production cut will make Fed’s work “difficult.”
Silver price is trading below its opening price by around 0.37%, though it stays above the $24.00 threshold. Falling US Treasury bond yields and a soft US Dollar (USD) are two reasons for XAG/USD’s rise. At the time of writing, the XAG/USD exchanges hands at $24.01.
The sentiment is deteriorating. US equities fluctuated after the S&P and the ISM Manufacturing PMIs, showing that business activity in the US is contracting. Recessionary fears are rising, and tighter lending conditions are weighing on businesses.
Therefore, safe-haven flows towards the precious metal segment, maintaining Silver prices nearby yearly highs. US Treasury bond yields are collapsing as investors have begun to price in a less aggressive US Federal Reserve (Fed), even though an official estimates rates above 5%.
The St Louis Fed President James Bullard said that the Fed needs to raise rates above 5% and emphasized that his forecast is above the median. Bullard commented that OPEC’s cutting oil output would make the Fed’s work “difficult.”
The US Dollar Index, a measure of the buck’s performance vs. six peers, tumbles 0.41%, at 102.168.
Another reason that keeps the commodity prices higher is the Organization of Petroleum Exporting Countries and its allies’ (OPEC+) decision to reduce oil production by 1 million barrels, which led to a boost in oil prices.
XAG/USD Technical analysis
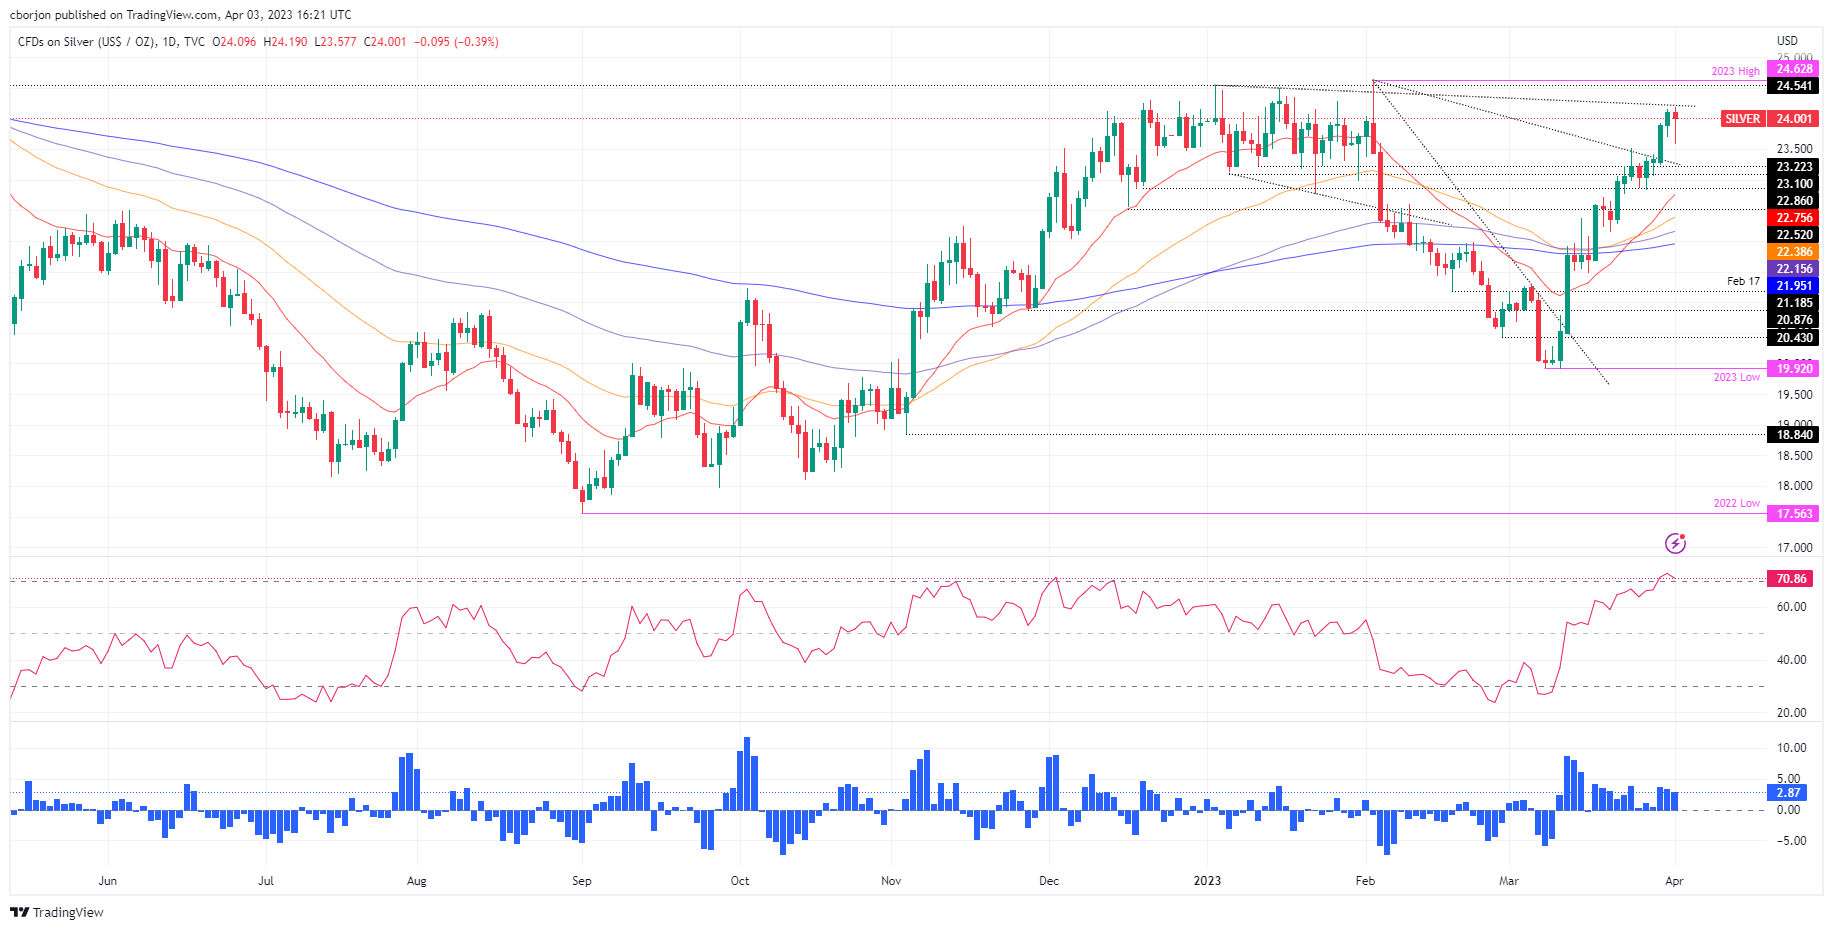
Silver’s uptrend remains intact, though testing a four-month-old resistance trendline that passes around $24.20-30. Although it opened the door for a pullback, oscillators suggest the bias remains bullish. The Relative Strength Index (RSI) is exiting overbought conditions, giving buyers a respite. At the same time, the Rate of Change (RoC), portrays that buyers remain in control but take a pause.
IF the XAG/USD breaks $24.20, it will exacerbate a test of the YTD high at $24.63, followed by the $25.00 figure. On the other hand, a daily close below $24.00 could open the door for a pullback toward the March 24 high of $23.52.
-
17:05
Gold Price Forecast: Climbs to one-week highs, eyes $2,000
- Weaker Dollar and lower Treasury yields boosts the yellow metal.
- XAU/USD up by $40 from Monday’s low, approaches $2,000.
Gold price is up by almost 1% on Monday, after rising more than $40 from the daily low. XAU/USD bottomed on Asian hours at $1,949 and then reversed it course. Recently reached at $1,990 the highest level in a week. It remains near the high, with a positive tone as the US Dollar tumbles.
After a negative weekly opening market by the shock from the OPEC+ unexpected production cut, gold stabilize and on European hours started to move higher. It accelerated after the beginning of the American session. It is hovering around $1,990 looking at the $2,000 area.
The yellow metal gained momentum amid a slide in US yields, a weaker US Dollar and risk appetite. The US 10-year yield fell to 3.40% after the release of the US ISM Manufacturing PMI. The US Dollar Index is down by 0.45%, hovering around 102.15, after reaching levels under 102.00. In Wall Street the Dow Jones is gaining by 0.68% and the S&P 500 is flat.
The positive tone in XAU/USD could trigger more gains and a test of the $2,000 area. A daily close above would point to further gains. Another failure at current levels could trigger a bearish correction. Large price swing could continue, taking into account what’s ahead in the economic calendar. After today’s softer ISM Manufacturing PMI, attention turns to Wednesday’s ADP Private Employment and ISM Service PMI; on Friday the official employment report is due.
Technical levels
-
16:30
USD/CAD declines as Canadian Dollar strengthens on weak USD, OPEC’s decision
- US factory activity shows signs of decline in March.
- The Canadian Dollar appreciated due to OPEC’s announcing a cut in oil production.
- USD/CAD Price Analysis: To stay downward biased below 1.3500; otherwise, expect a rally to 1.3600.
USD/CAD trades south of the 100-day Exponential Moving Average (EMA) as the Canadian Dollar (CAD) appreciated on oil supply shortages and a soft US Dollar (USD). The USD/CAD is exchanging hands at 1.3450 after hitting a daily high of 1.3536.
Dampened business activity in the US spurred recessionary fears
Wall Street portrays an upbeat sentiment. Two measures of factory activity in the United States (US), deteriorated, meaning a deeper economic slowdown is around the corner. The S&P Global Manufacturing PMI for March was 49.2, below 49.3 estimates. Later, the Institute for Supply Management (ISM) revealed its Manufacturing PMI, which plunged to 46.3, below the 47.5 foresaw and below February’s data.
Consequently, the greenback erased some of its earlier gains, bolstered by higher oil prices. The US Dollar Index (DXY), which tracks the buck’s value vs. a basket of six currencies, slides from 103.05 to 102.20, down 0.38%.
Hence, the USD/CAD dropped from around 1.3500 and registered a daily low of 1.3424 as traders began to price in a less aggressive US Federal Reserve (Fed).
The Organization of Petroleum Exporting Countries and its allies (OPEC+) announced over the weekend the cut of 1 million barrels of oil gave oil prices a leg up. WTI jumped over $6.00 from its Friday close at $75.68 to $81.00 a barrel.
The latest round of Fed speakers, led by the St. Louis Fed President James Bullard, said that OPEC’s decision would make the Fed’s job more difficult. Bullard reiterated that the Fed needs to raise rates above 5% and emphasized that his forecast is above the median.
On the Canadian front, the S&P Global Manufacturing PMI plummeted to 48.6 from the prior’s figure of 52.4, painting a gloomy economic outlook for Canada’s economy. Of late, the Bank of Canada’s (BoC) Business Outlook Survey (BOS) showed that around half of the firms surveyed expect the country to be in a mild recession. Additionally, 59% of businesses expect inflation above 2% until at least 2025.
USD/CAD Technical analysis
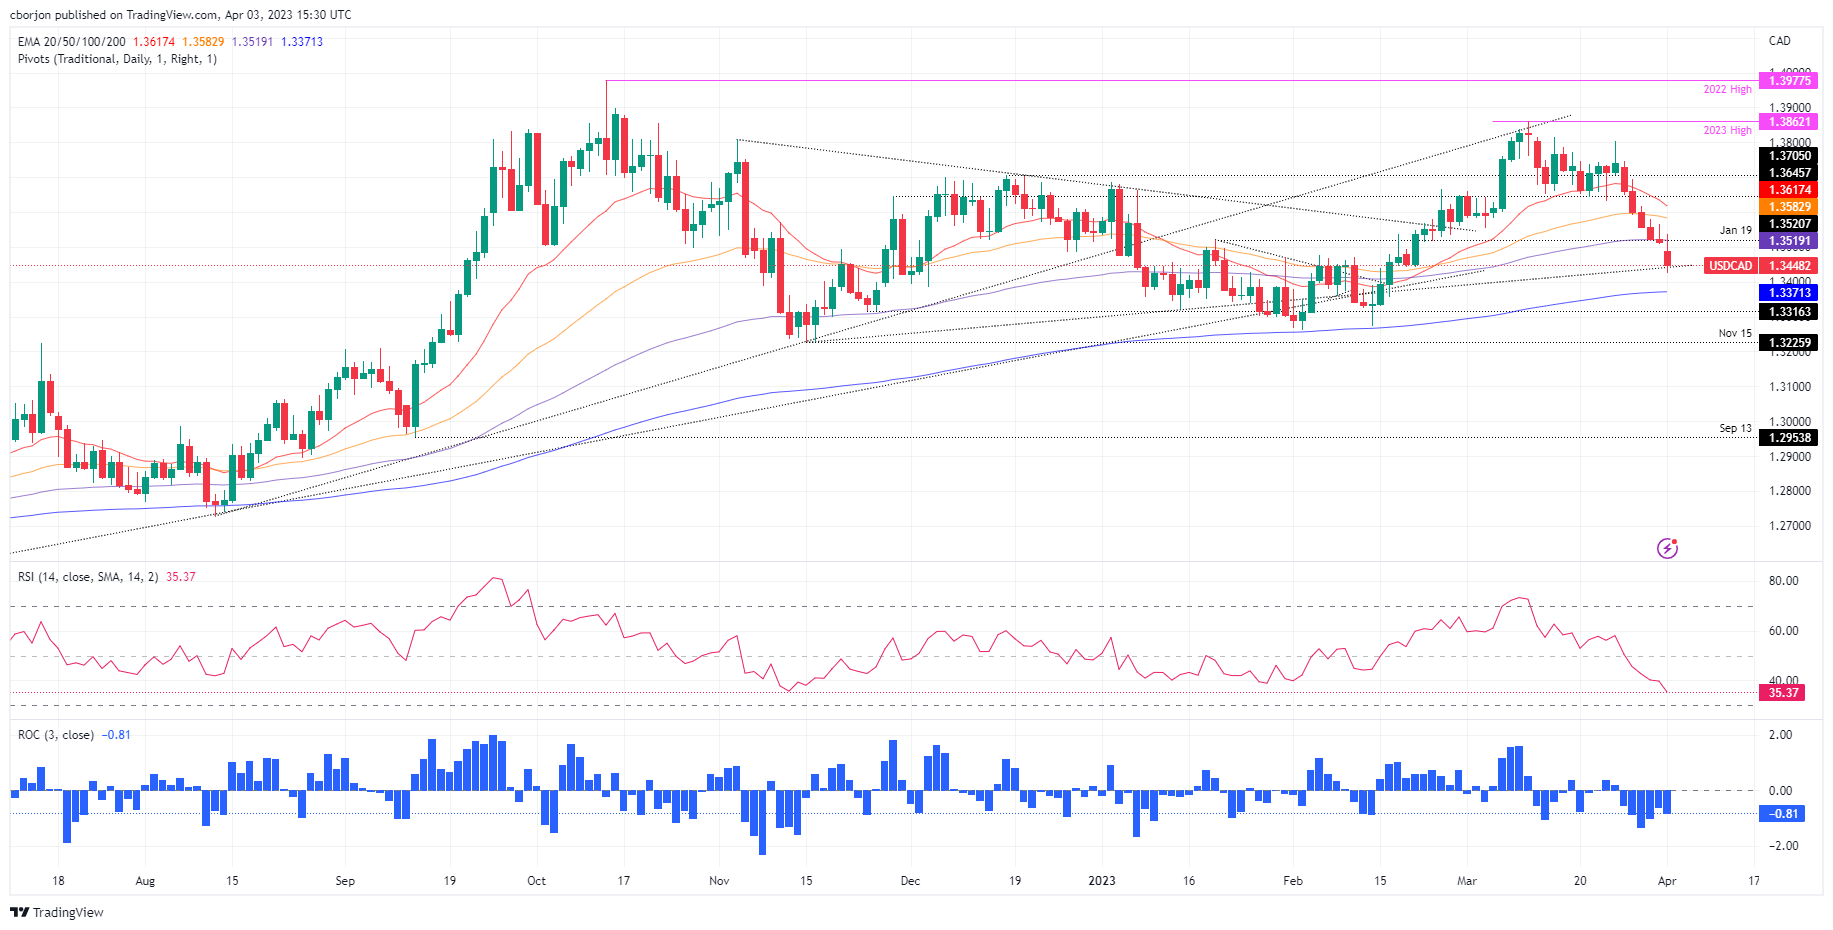
The USD/CAD tumbled below 1.3519, the 100-day EMA, which exacerbated a break below 1.3500. Although the USD/CAD pair reached a weekly low of 1.3424, the pair has recovered some ground as sentiment continues to deteriorate amidst recessionary scenarios. The USD/CAD neutral to downwards trend will continue if the pair stays below the 100-day EMA. A breach of the 1.3400 figure will expose the 200-day EMA At 1.3371. On the flip side, buyers reclaiming 1.3500 would pave the way to recover the 100-day EMA and beyond.
-
16:07
EUR/USD hits fresh highs above 1.0900 after US ISM Manufacturing PMI
- US Data: March ISM Manufacturing PMI and February Construction Spending below expectations.
- US Dollar Index tumbles as US yields sank.
- EUR/USD looking to test March highs at 1.0925/30.
The EUR/USD rose further following the release of US Economic data and printed a fresh daily high at 1.0916. It then pulled back to 1.0885. The US Dollar is under pressure amid lower yields and risk appetite.
The US Dollar Index is falling 0.50% and is about to test last week's lows near 102.00. The US 10-year dropped to 3.41%, the lowest level in a week. The lower gained momentum after the release of the US ISM Manufacturing report.
Data showed that economic activity in the US manufacturing sector continued to contract with the ISM Manufacturing PMI falling to 46.3 from 47.7 in February, below the market consensus of 47.5. Ahead of the ADP and the NFP, the Employment index fell to 46.9 from 49.1. A different report showed Construction Spending declined by 0.1% in February.
European Central Bank Robert Holzmann said a half-point hike is still on the cards for May. According to him, it the central bank slows down rate hikes to 25 bps it would be hard to go back.
The 1.0930 zone back in the radar
The EUR/USD approached the 1.0925/30 key resistance area. That zone capped the upside during the last two weeks. A break higher would strengthen the outlook for the Euro. A failure could clear the way for a bearish correction. Support levels might be located at 1.0855 and 1.0815.
Technical levels
-
15:59
USD Index likely to test YTD lows in the weeks ahead – HSBC
Sustained further USD gains would require hawkish US data surprises or tangible signs of financial sector frailties but both rates and risk appetite should point to a weaker USD over the near term, in the view of economists at HSBC.
Banking on a weaker USD
“While the USD may continue to enjoy bouts of support when concerns about financial sector frailties are prominent, we believe the bigger picture is likely to drive the USD weaker over the near term.”
“US data generally point to reasonable US economic activity and retreating inflationary pressures, but it would only take an unexpectedly strong US employment report (7 April) or a punchy CPI reading (12 April) to bring back thoughts of a more hawkish Fed.”
“We think that a test of year-to-date lows on the DXY is likely in the weeks ahead.”
-
15:48
IEA: OPEC+ cuts risk exacerbating strained market
In a statement published on Monday, the International Energy Agency (IEA) said that OPEC+ decision to cut oil output risks exacerbating a strained market by pushing up oil prices amid inflationary pressures, per Reuters.
Global oil markets were already set to tighten in the second half of 2023 with a potential for substantial supply deficit, the IEA further noted.
Market reaction
This headline doesn't seem to be having a noticeable impact on crude oil prices. As of writing, the barrel of West Texas Intermediate (WTI) was trading at $80.30, rising 6.1% on a daily basis.
-
15:37
BOC Survey: Half of firms expect Canada to be in mild recession over next year
In its quarterly Business Outlook Survey published on Monday, the Bank of Canada said about half of polled firms expect Canada to go into a mild recession over the next year, down from roughly two-thirds in the previous survey, per Reuters.
Additional takeaways
"79% of firms expect inflation to remain above 3% for the next two years, down from 84% in Q4."
"59% of firms expect inflation to stay well above 2% until at least 2025."
"For 5th consecutive quarter, businesses anticipate sales growth to slow; slowdown follows period of exceptional strength over the past year."
"Businesses link expectations of weaker sales growth to rate hikes, high inflation and concern over a recession."
"Although surveys were conducted before global banking stresses emerged in early March, evidence suggests business sentiment has not changed much since then."
"Firms continue to view labor market as tight, although labor shortages and wage growth pressure have eased."
"Firms expect size and pace of output prices to moderate; this suggests firms are gradually shifting closer to normal price-setting practices."
"Separate BOC Q1 survey on consumer expectations shows 20.3% of Canadians expect significant economic decline in next 12 months, 37.7% expect small decline."
"Expectations for 1-year ahead inflation fell to 6.03% from 7.18% in Q4; 2-years ahead inflation expectations drop to 4.27% from 5.14%."
"Expectations for 5-year ahead inflation have edged down to 2.92% from 3.10%."
Market reaction
The USD/CAD stays under bearish pressure and was last seen losing 0.6% on the day at 1.3437.
-
15:36
RBA Preview: Forecasts from nine major banks, another 25 bp rate hike, but risk is for a pause
The Reserve Bank of Australia (RBA) will announce its next monetary policy decision on Tuesday, April at 04:30 GMT and as we get closer to the release time, here are the forecasts by the economists and researchers of nine major banks regarding the upcoming central bank's decision.
The RBA is set to deliver another 25 basis points rate hike in April, lifting the Official Cash Rate (OCR) from 3.60% to 3.85%. A pause also seems prudent considering the inflation trend and the uncertainty.
Rabobank
“It remains our view that the RBA will hike by a further 25 bps in April to take the cash rate to 3.85% ahead of a possible pause in May. The softer headline inflation print for February will not be sufficient for the RBA to abandon their tightening bias as labour market indicators, forward indicators and the still comparatively high level of inflation all point to the need for further tightening.”
ANZ
“While our central case is for a 25 bps hike in April, the probability of a pause is the highest it’s been in some time. The RBA may take this option to assess the impact of rate hikes so far, given the ‘long and variable’ lags in monetary policy, along with recent global developments. We still see the question as not one of ‘where’ the cash rate peaks at (we still favour 4.1%), but ‘when’.”
ING
“We believe the RBA will leave the cash rate target unchanged at 3.6%. The RBA hinted at its most recent rate-setting meeting that it was looking at a possible pause in rates, and these inflation numbers provide the perfect excuse. We are reserving judgement on whether this marks the peak for cash rates in this cycle. Other data, including from the labour market, could swing this decision one way or the other. Markets are, however, currently betting that 3.6% marks the peak.”
Standard Chartered
“We expect the RBA to hike again by 25 bps to 3.85%. That said, the risk of a pause has risen substantially since the last March meeting. With the policy rate at only 3.6%, we may not even get to a real positive real rate by the end of 2023. Hence, we maintain our rate hike call for April.”
TDS
“We now expect the Bank to pause at the April meeting given the lower Jan-Feb CPI prints and uncertainty over the outlook from the banking turmoil in the near-term.”
SocGen
“We expect the RBA to hold the cash rate target unchanged at 3.60%. The RBA will likely say that it is appropriate to pause interest rate increases to allow more time to assess the state of the economy, mentioning the recent development in the macroeconomic data and the global economy.”
NAB
“We think the data justifies another 25 bps hike, but acknowledge it is a line ball decision with the RBA having signalled that they would ‘reconsider’ the case for a pause. The risk is the RBA pauses and retains a hiking bias, preferring to err on the side of a more protracted battle against inflation until or unless its hand is forced by the data. Governor Lowe is speaking on Wednesday, an opportunity to explain the decision.”
Citi
“For the first time since the beginning of its hiking cycle in May 2022, we expect the RBA to leave the cash rate unchanged. The shift in the view largely stems from softer-than-expected monthly CPI for both January and February. The official quarterly inflation reading will be reported at the end of April, and given the two soft monthly inflation indicator prints, we believe the Bank will now take the option to pause hiking and re-assess the inflation over the next month. However, even with a pause in April, we still expect the Governor’s statement to maintain a tightening bias.”
Wells Fargo
“Given the recent decline in inflation as well as previous dovish RBA comments, we expect a pause.”
-
15:17
USD/JPY: Weaker Yen momentum is set to fade – MUFG
USD/JPY’s rally is at risk of running out of steam. Year-end foreign bond buying might have fuelled some of this move higher and that is unlikely to be sustained while the scale of the drop in US yields still points to downside USD/JPY risks, economists at MUFG Bank report.
JPY weakness may not be sustained
“The scale of foreign bond buying in recent weeks ahead of the end of the fiscal year is unlikely to be sustained going forward and hence one feature of support for USD/JPY may fade as we move into April. Even if the macro backdrop favours buying it will unlikely be on the same scale.”
“In addition, the substantial increase in JPY short positions amongst Leveraged Funds could be a catalyst for a retracement lower in USD/JPY if the move to the upside begins to fade.”
“US yields could still grind higher from here but USD/JPY has already jumped by more than implied by short-term yields and hence the influence on lifting USD/JPY further from here is likely to diminish.”
-
15:05
US: ISM Manufacturing PMI declines to 46.3 in March vs. 47.5 expected
- US ISM Manufacturing PMI continued to decline in March.
- US Dollar Index extends its daily slide toward 102.00.
The economic activity in the US manufacturing sector continued to contract at an accelerating pace in March with the ISM Manufacturing PMI dropping to 46.3 from 47.7 in February. This reading came in worse than the market expectation of 47.5.
Further details of the publication revealed that the New Orders Index declined to 44.3 from 47 and the Employment Index edged lower to 46.9 from 49.1. Finally, the inflation component, Prices Paid Index, fell to 49.2 from 51.3, compared to analysts' estimate of 53.8.
Commenting on the report, "with Business Survey Committee panelists reporting softening new order rates over the previous 10 months, the March composite index reading reflects companies continuing to slow outputs to better match demand for the first half of 2023 and prepare for growth in the late summer/early fall period," said Timothy R. Fiore, Chair of the Institute for Supply Management.
Market reaction
The US Dollar came under renewed selling pressure after this data and the US Dollar Index was last seen losing 0.5% on the day at 102.12.
-
15:00
United States ISM Manufacturing PMI came in at 46.3, below expectations (47.5) in March
-
15:00
United States ISM Manufacturing Prices Paid below expectations (53.8) in March: Actual (49.2)
-
15:00
United States ISM Manufacturing Employment Index registered at 46.9, below expectations (49.8) in March
-
15:00
United States Construction Spending (MoM) came in at -0.1%, below expectations (0%) in February
-
15:00
United States ISM Manufacturing New Orders Index registered at 44.3, below expectations (44.6) in March
-
14:57
Renewed USD losses are ahead – Scotiabank
USD fails to hold early gains. Economists at Scotiabank expect the greenback to continue slipping.
There is some calendar risk ahead for markets this week
“The USD’s broader drop back from its early session highs leaves a negative look to the short-term chart and rather suggests that after the modest gains seen in the USD generally through month and quarter-end Friday, renewed USD losses are ahead.”
“Note that there is some calendar risk ahead for markets this week. The Good Friday holiday is not observed in the US, where the Federal government will remain open. That means that the NFP release will be out Friday morning, as usual, when many trading centers elsewhere in the world will be closed.”
-
14:45
United States S&P Global Manufacturing PMI below forecasts (49.3) in March: Actual (49.2)
-
14:45
Canada: S&P Global Manufacturing PMI declines to 48.6 in March vs. 51.7 expected
- Canadian manufacturing sector went into contraction in March.
- USD/CAD trades in negative territory at around 1.3450.
Business activity in the Canadian manufacturing sector contracted in March with S&P Global Manufacturing PMI declined to 48.6 from 52.4 in February. This reading came in below the market expectation of 51.7.
Commenting on the survey's findings, "the recovery of Canada’s manufacturing economy stalled during March, with renewed falls in both production and new orders signalled," said Paul Smith, Economics Director at S&P Global Market Intelligence.
"Broader macroeconomic uncertainty, and the negative impact of rising prices on client purchasing power were key factors that weighed on market demand," Smith further noted.
Market reaction
USD/CAD stays under bearish pressure despite the disappointing data and was last seen losing 0.5% on the day at 1.3452.
-
14:44
USD/JPY Price Analysis: Hangs near daily low, just below 133.00 amid modest USD weakness
- USD/JPY retreats from over a two-week high touched earlier this Monday.
- The emergence of fresh selling around the USD exerts downward pressure.
- The 100-day SMA and 50% Fibo. confluence hurdle holds the key for bulls.
The USD/JPY pair attracts some sellers after touching over a two-week high on Monday and trades just below the 133.00 round-figure mark during the early North American session.
The US Dollar (USD) struggles to capitalize on its intraday gains amid the uncertainty over the Fed's rate-hike path, which turns out to be a key factor exerting some downward pressure on the USD/JPY pair. The downside, however, seems limited, at least for the time being, amid a generally positive risk tone, which tends to undermine the traditional safe-haven Japanese Yen (JPY).
From a technical perspective, the USD/JPY pair faces rejection near the 133.75 confluence hurdle, comprising the 50% Fibonacci retracement level of the March downfall and the 100-day Simple Moving Average (SMA). The said area should now act as a pivotal point, which if cleared will set the stage for an extension of the recent move-up witnessed over the past week or so.
That said, oscillators on the daily chart are yet to confirm a bullish outlook, making it prudent to wait for a move beyond the aforementioned barrier before positioning for any further gains. The USD/JPY pair might then aim to surpass the 134.00 round-figure mark and accelerate the momentum towards testing the 61.8% Fibo. level resistance, around the 134.75-134.80 region.
On the flip side, any further slide below the 132.80 area, or the 38.2% Fibo. level, is likely to find decent support near the 132.25 region ahead of the 132.00 mark and the 23.6% Fibo. level, around the 131.60-131.55 zone. A convincing break below the latter could drag the USD/JPY pair below the 131.00 mark, towards the next relevant support near the 130.55-130.50 region.
USD/JPY daily chart
Key levels to watch
-
14:40
Australia: RBA predicted to hike the OCR by 25 bps – UOB
Economist at UOB Group Lee Sue Ann suggests the RBA could raise the policy rate by 25 bps at its event on April 4.
Key Takeaways
“At this juncture, we are keeping our view of one more 25bps hike in Apr, which will take the cash rate target to 3.85%. There is some near-term downside risk to this view as uncertainty remains elevated.”
“This is highlighted by the recent problems in the banking sectors in the US and Europe, with potential spill overs for Australia via lending conditions and confidence.”
-
14:31
S&P 500 Index: Next objectives at 4195 and 4270/4320 – SocGen
S&P 500 eventually defended the multi-month trend line and low of December near 3800/3760 in recent pullback. Economists at Société Générale expect the index to target 4195 and 4270/4320.
200-DMA at 3930 should be a short-term support
“S&P 500 has reestablished above both 50-DMA and 200-DMA and has also confirmed an Inverse Head and Shoulders pointing towards regain of upward momentum.”
“The index is expected to head higher towards 4195 and target of the pattern near 4270/4320.” “The 200-DMA at 3930 should be a short-term support.”
-
14:30
Canada S&P Global Manufacturing PMI came in at 48.6, below expectations (51.7) in March
-
14:19
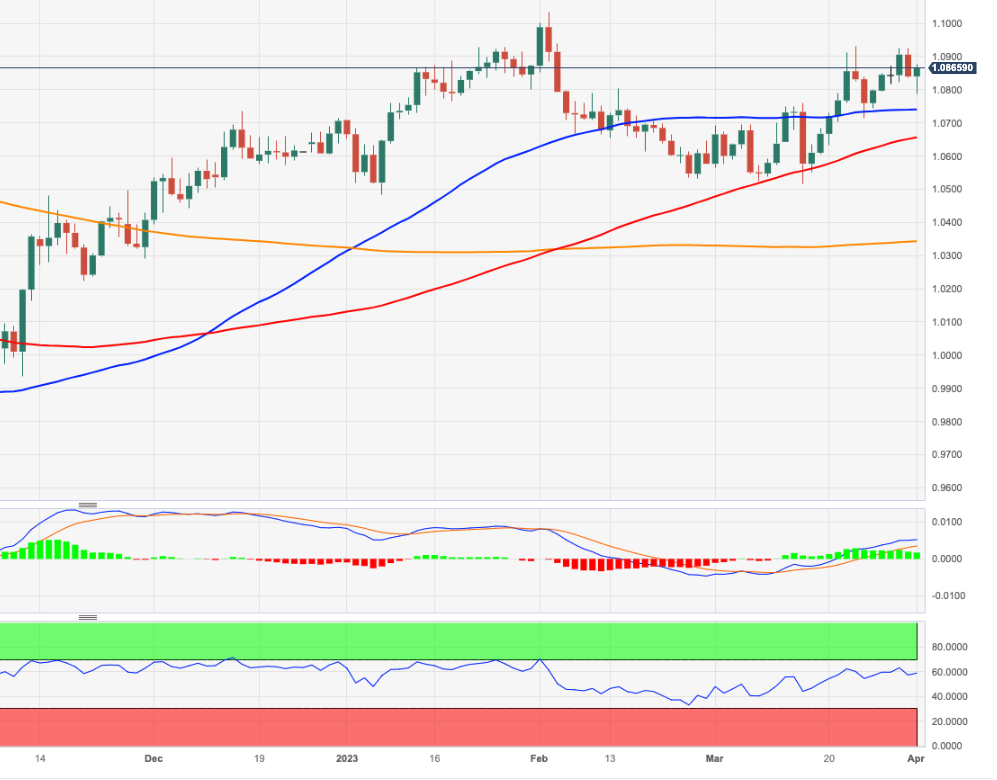
EUR/USD Price Analysis: A solid resistance emerges around 1.0930
- EUR/USD leaves behind the earlier drop to the sub-1.0800 region.
- Further gains continue to target monthly peaks in the 1.0930 area.
EUR/USD bounces off earlier lows in the proximity of 1.0790 and regains the 1.0880 region in a volatile start of the new trading week.
The likelihood of extra advances appears favoured for the time being. Against that, the pair could now set sail to the March peak at 1.0929 (March 23) prior to a potential test of the 2023 high at 1.1032 (February 2).
Looking at the longer run, the constructive view remains unchanged while above the 200-day SMA, today at 1.0341.
EUR/USD daily chart
-
14:02
RBA Preview: Two scenarios and their implications for AUD/USD – TDS
Economists at TD Securities discuss the Reserve Bank of Australia (RBA) interest rate decision and its implications for the AUD/USD pair.
Hike +25 bps (40% prob)
“The motivation for the RBA to hike would be 1) It would be highly unlikely 1 month will be enough time for the RBA to assess the impact of its hikes since May'22. So why stop in April?; 2) The RBA could hike in April noting inflation is still high but signaling it's moving in the right direction leaving scope to pause in May following monthly inflation data for Jan and Feb suggesting Q1'23 CPI comes in below the RBA's implied 1.5% QoQ forecast; 3) The RBA pausing in April and then hiking in May potentially adds more confusion to the RBA's message. Historically once the RBA has paused on rate hikes, it has done so for a few months. AUD/USD 0.6720.”
Base Case: Pause (60% prob)
“The case for pausing is strong: 1) The Bank clearly stated a pause would be discussed at the Apr meeting in the Mar Minutes; 2) Discussing a pause for the Apr meeting suggests the appetite to hike in BOTH April and May is low, supporting a pause in April, but leaving open the possibility of hiking in May if CPI exceeds RBA forecasts; 3) Mention of the monthly inflation series was elevated to the top of the Mar Statement and the print for Feb published last week came in below expectations following a soft Jan print – both outcomes provide the RBA with room to pause; 4) The four data points the Governor cited – inflation, employment, retail sales and business activity do not collectively support a hike. AUD/USD 0.6630.”
-
14:00
Singapore Purchasing Managers Index came in at 49.9 below forecasts (50.2) in March
-
14:00
Brazil S&P Global Manufacturing PMI registered at 47, below expectations (48.4) in March
-
13:57
When is the US ISM Manufacturing PMI and how could it affect EUR/USD?
US ISM Manufacturing PMI overview
The Institute of Supply Management (ISM) will release its latest manufacturing business survey result, also known as the ISM Manufacturing PMI for March at 14:00 GMT this Monday. The index is expected to remain in contraction territory for the fifth straight month and come in at 47.5 for March. Given that the Fed looks more at inflation than growth, investors will keep a close eye on the Prices Paid sub-component, which is anticipated to rise to 53.8 from 51.3 in February.
How could it affect EUR/USD?
Ahead of the key release, the risk-on mood weighs on the safe-haven US Dollar (USD) and assists the EUR/USD pair to stage a goodish rebound from sub-1.0800 levels, or a one-week low touched earlier this Monday. A weaker-than-expected ISM Manufacturing PMI will be seen as another sign of a slowdown in the US economy and reaffirm expectations that the Federal Reserve (Fed) might soon pause the rate-hiking cycle. This could exert additional downward pressure on the Greenback and allow the major to build on its intraday rally of around 90 pips.
Conversely, a stronger print is unlikely to provide any respite to the USD, suggesting that the path of least resistance for the USD is to the downside and supports prospects for a further near-term appreciating move for the EUR/USD pair. That said, any immediate market reaction is likely to be limited as the focus remains on this week's release of the closely-watched US monthly employment details - popularly known as the NFP report - on Friday. Nevertheless, the broader fundamental backdrop and the intraday price action support prospects for a further near-term appreciating move for the major.
Eren Sengezer, European Session Lead Analyst at FXStreet, offers a brief technical overview and outlines important technical levels to trade the EUR/USD pair: “With the latest rebound, the Relative Strength Index (RSI) indicator on the four-hour chart rose to 50, suggesting that sellers are struggling to stay in control. On the downside, 1.0820 (Fibonacci 23.6% retracement of the latest uptrend) aligns as key support level. If the pair falls below that level and starts using it as resistance, it is likely to meet interim support at 1.0790 (static level) before testing 1.0760 (100-period Simple Moving Average (SMA), Fibonacci 38.2% retracement).”
“On the other hand, 1.0860 (static level, 20-period SMA) is the first resistance ahead of 1.0900 (psychological level) and 1.0930 (static level, March 23 high),” Eren adds further.
Key Notes
• ISM Manufacturing PMI Preview: Three reasons for an upside surprise
• EUR/USD Forecast: Euro manages to hold above key support for now
• EUR/USD: New cycle highs above 1.0930 needed to give a bit more lift – Scotiabank
About the US ISM manufacturing PMI
The Institute for Supply Management (ISM) Manufacturing Index shows business conditions in the US manufacturing sector. It is a significant indicator of the overall economic condition in the US. A result above 50 is seen as positive (or bullish) for the USD, whereas a result below 50 is seen as negative (or bearish).
-
13:43
USD/IDR: A drop to 14,925 should not be ruled out – UOB
A decline to the 14,925 region appears in the pipeline ahead of some stabilization in USD/IDR, notes Markets Strategist Quek Ser Leang at UOB Group.
Key Quotes
“We highlighted last Monday that ‘the sharp and rapid drop in USD/IDR has room to extend’. We added, ‘in view of the deeply oversold conditions, a sustained drop below the major support at 14,095 is unlikely’. USD/IDR dropped to a low of 14,945 before rebounding to end the week at 14,990 (-1.06%).”
“While conditions remain oversold, the weakness in USD/IDR has not stabilized. This week, barring a break above 15,230, USD/IDR could drop to 14,925 before stabilization is likely.”
-
13:37
USD/CAD: Losses to extend towards the 1.3375/1.3425 area – Scotiabank
USD/CAD breaks below 100-Day Moving Average (DMA). Economists at Scotiabank expect the pair to extend its decline toward the 1.3375/1.3425 area zone.
Firm resistance on USD rebounds to the 1.35 area
“Steady losses in USD/CAD through the past week leave the USD’s technical undertone looking soft and prone to more losses.”
“USD/CAD has broken below the 40 (1.3593) and 100 (1.3523) DMAs supports and trend oscillators are aligned bearishly for the USD on the intraday and daily charts.”
“We look for firm resistance on USD rebounds to the 1.35 area now and for USD losses to extend towards the 1.3375/1.3425 area.”
-
13:36
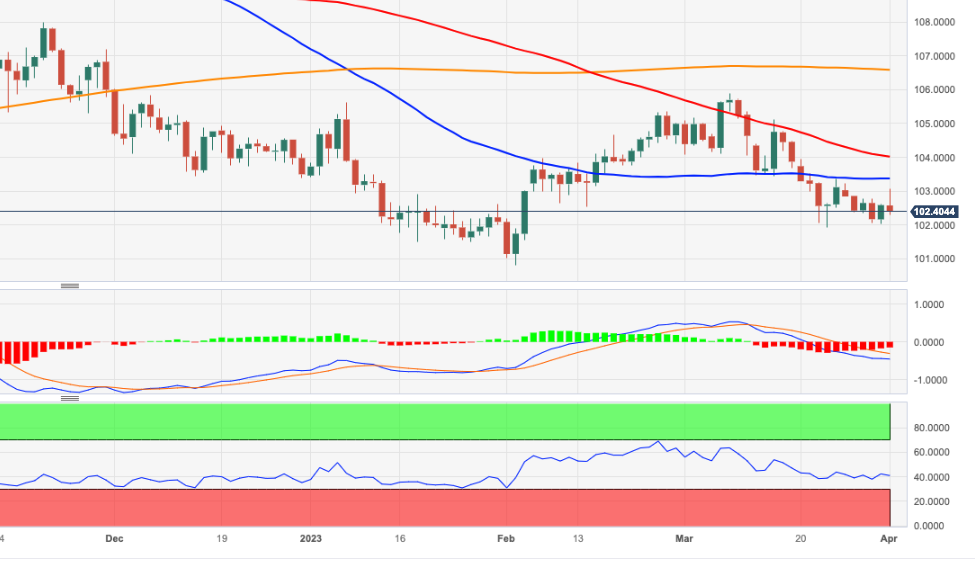
USD Index Price Analysis: Upside appears limited by the 55-day SMA
- DXY turns negative following a fruitless bull run above 103.00.
- The 55-day SMA near 103.40 caps the upside for the time being.
DXY comes under pressure after piercing the key barrier at the 103.00 level on Monday.
So far, it seems the index could extend the consolidative range amidst the broader bearish stance. That said, a drop below the monthly low at 101.91 (March 23) should open the door to a potential visit to the 2023 low around 100.80 (February 2). On the upside, the 55-day SMA, today at 103.36 continues to cap occasional bullish attempts.
Looking at the broader picture, while below the 200-day SMA, today at 106.54, the outlook for the index is expected to remain negative.
DXY daily chart
-
13:32
Chile IMACEC below forecasts (0.1%) in February: Actual (-0.5%)
-
13:22
South Africa Total New Vehicle Sales climbed from previous 45352 to 50157 in March
-
13:20
USD/MYR: Further range bound trade likely near term – UOB
In opinion of Markets Strategist Quek Ser Leang at UOB Group, USD/MYR is expected to keep the 4.3800-4.4350 range unchanged this week.
Key Quotes
“Last week, we expected USD/MYR to trade in a range between 4.4100 and 4.4700. However, USD/MYR dipped to 4.3800 before rebounding to end the week at 4.4100 (0.36%).”
“Despite the decline, there is no significant improvement in downward momentum. We continue to expect USD/MYR to trade in a range this week, likely between 4.3800 and 4.4350.”
-
13:18
AUD/USD jumps to nearly one-month top, above 200-day SMA ahead of US ISM PMI
- AUD/USD rallies over 100 pips intraday and touches a nearly one-month high on Monday.
- The risk-on mood weighs on the safe-haven USD and benefits the risk-sensitive Aussie.
- Traders now look to the US ISM PMI for some impetus ahead of the RBA on Tuesday.
The AUD/USD pair rebounds sharply from a four-day high, around the 0.6650 area touched earlier this Monday and builds on its solid intraday recovery through the mid-European session. Spot prices spike to the 0.6760 area, or a nearly one-month top in the last hour, with bulls making a fresh attempt to build on the momentum further beyond a technically significant 200-day Simple Moving Average (SMA).
As investors digest the potential inflationary impact of a sharp rise in Oil prices, the prevalent risk-on environment attracts fresh sellers around the safe-haven US Dollar (USD) and turns out to be a key factor that benefits the risk-sensitive Aussie. Apart from this, the AUD/USD pair's strong intraday rally could further be attributed to some short-covering ahead of the Reserve Bank of Australia (RBA) monetary policy meeting on Tuesday. The market optimism, however, is likely to be short-lived amid concerns about a deeper global economic downturn.
The worries resurfaced after data out of Asia on Friday showed that manufacturing activity in Japan contracted during March, while growth in China stalled during the reported month. Furthermore, fresh speculations that rising energy prices might force the Federal Reserve (Fed) to move back to its inflation-fighting rate hikes, which, in turn, favour the USD bulls and might cap the AUD/USD pair. the markets are now pricing in a greater chance of a 25 bps lift-off in May and the bets were lifted by a surprise production cut by OPEC+.
Hence, it will be prudent to wait for a strong follow-through buying around the AUD/USD pair before positioning for a further near-term appreciating move. Heading into the key central bank event risk, traders on Monday will take cues from the US ISM Manufacturing PMI, due later during the early North American session. This week's busy US economic docket also features the ADP report on private-sector employment and ISM Services PMI on Wednesday, followed by the crucial US monthly employment report - popularly known as NFP on Friday.
Technical levels to watch
-
13:09
EUR/JPY Price Analysis: Positive outlook remains in place
- EUR/JPY starts the week in a volatile fashion and revisits 145.00.
- The next up barrier of note comes at the December 2022 high.
EUR/JPY regains some composure and advances to the 145.00 region at the beginning of the week.
A daily close above the 2023 top at 145.67 (March 31) should motivate the cross to shift its focus to the December 2022 top around 146.70 (December 15) in the short-term horizon.
In the meantime, extra gains remain on the table while the cross trades above the 200-day SMA, today at 141.82.
EUR/JPY daily chart
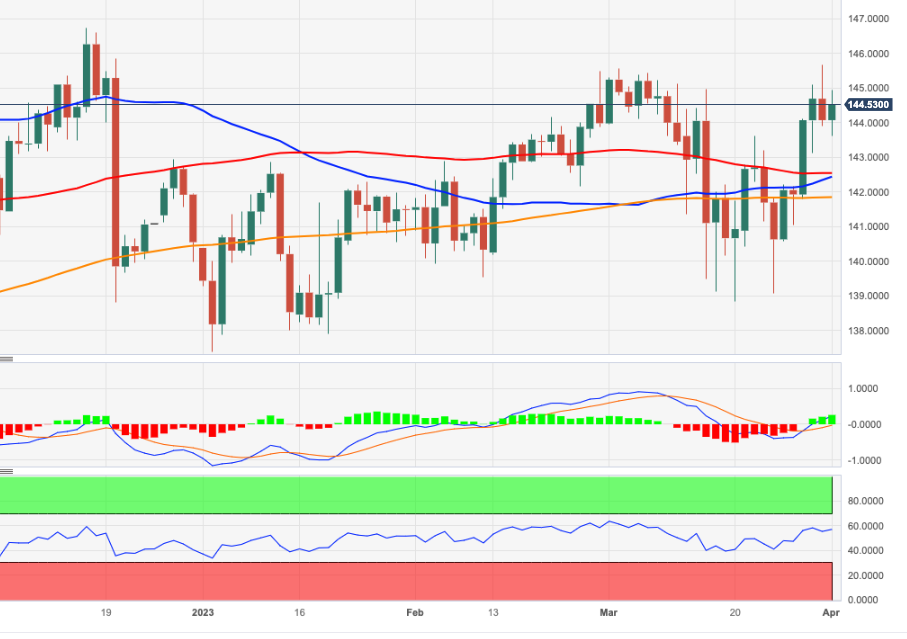
-
13:07
USD Index to head higher toward 50-DMA at 103.50/104 – SocGen
The US Dollar Index has recently carved out a higher trough at 101.90 as compared to the one in February at 100.80. Economists at Société Générale expect DXY to test the 103.50/104.00 zone.
Recent low of 101.90 is an important support
“Downward momentum is getting arrested. The index is attempting a break above the channel that has encompassed recent down move.”
“A revisit of 50-DMA at 103.50/104.00 is expected. Overcoming this could trigger an extended rebound towards March peak of 105.90.”
“Recent low of 101.90 is an important support.”
-
12:48
GBP/USD: Ongoing pressure for a retest of key resistance at 1.2445/50 – Scotiabank
GBP/USD bounces nicely from the 1.2275 area. Economists at Scotiabank expect the pair to pressure the 1.2445/50 resistance.
Bull trend holds
“Mar CIPS Manufacturing data was revised down slightly (47.9, from 48.0) but the data had little impact on the GBP which has traded steadily higher from the session low just under 1.23.”
“The Pound remains in a solid, short-term uptrend. Broader technical signals remain positive and underlying trend signals are aligned positively for the GBP. This implies limited downside for the GBP for the moment and ongoing pressure for a retest – at least – of key, medium-term resistance at 1.2445/50.”
-
12:41
EUR/USD: New cycle highs above 1.0930 needed to give a bit more lift – Scotiabank
EUR/USD rebounds from below 1.08. Still, a break past 1.0930 is needed to extend the rise, economists at Scotiabank report.
Key support is 1.0700
“EUR gains have lost some technical momentum on the short-term charts but the underlying trend higher remains intact.”
“Firm gains from below the 1.08 level suggest the undertone remains relatively constructive but new cycle highs (above 1.0930) are needed to give the EUR a bit more lift in the short run and drive gains on through 1.10+.”
“Support is 1.0800/25. Key support is 1.0700.”
-
12:32
USD/THB: Potential upside lies ahead – UOB
Markets Strategist Quek Ser Leang at UOB Group noted USD/THB could see its upside bias renewed in the near term.
Key Quotes
24-hour view: “We highlighted last Monday (27 Mar, spot at 34.27) that USD/THB ‘appears to have moved into a consolidation phase’ and we expected it to ‘trade in a range between 33.95 and 34.55’. Our view for consolidation was not wrong even though USD/THB traded in a narrower range than expected (34.02/34.55).”
“The underlying tone appears to have improved somewhat and USD/THB is likely to edge higher this week. However, a sustained advance above 34.55 is unlikely. The next resistance at 34.75 is not expected to come under threat. Support is at 34.20, a breach of 34.05 would indicate that the current mild upward pressure has eased.”
-
12:29
AUD/NZD: A serious test of parity cannot be ruled out this year – SocGen
Bond yields aren’t helping AUD much. NZD, on that basis, is a better choice, in the view of economists at Société Générale.
Frustration continues, Down Under
“The AUD remains incredibly frustrating. The RBA is considering a pause in monetary tightening, as a result of which relative rate expectations (and yields) have not really moved significantly in its favour.”
“China’s reopening and a less hawkish Fed ‘ought’ to be helping, but if rates remain firmly anchored, the impact will be softened.”
“We get a much more encouraging relative rate picture by looking at the RBNZ, even if New Zealand’s terms of trade and balance of payments are much less inspiring and its growth prospects took a weather-hit in recent months. Still, if we were to buy one of these two against a weakening Dollar, it would be the Kiwi, and a serious test of AUD/NZD parity can’t be ruled out this year.”
-
12:12
OPEC+ JMMC: Voluntary oil production cuts will be 1.66 million bpd
Following its meeting on Monday, the Joint Ministerial Monitoring Committee (JMMC) of the Organization of the Petroleum Exporting Countries and its allies (OPEC+) announced in a statement that the additional voluntary oil production cuts will amount to 1.66 million barrels per day, as reported by Reuters.
Market reaction
Following the sharp upsurge witnessed earlier in the day, crude oil prices had gone into a consolidation phase. This headline, however, seems to be helping oil prices regain traction. As of writing, the barrel of West Texas Intermediate (WTI) was up nearly 6% on the day at $80.10. Similarly, the barrel of Brent was last seen trading at $84.40, rising 5.9% on a daily basis.
-
12:00
OPEC+ announcement could provide the catalyst needed to trigger a correction higher for the NOK – MUFG
One of the main macro developments over the weekend has been the surprise decision by OPEC+ to reduce oil production by more than 1 million barrels/day. Will OPEC+ production cut provide the catalyst for NOK rebound? Economists at MUFG Bank report.
NOK has underperformed significantly at start of this year
“OPEC+’s decision to cut production has resulted in the price of Brent reversing most of last month’s losses and brings it back more into line with the average over the previous three months.”
“The higher price of oil should help to provide more support oil-related G10 currencies such as Canadian Dollar and Norwegian Krone.”
“The NOK has been hit particularly hard this year and is by some distance the worst performing G10 currency (-6.5% vs USD YTD & -7.2% vs. EUR YTD). According to our short-term valuation model that takes into account the price of oil, yields spreads and equity performance, the krone became significantly undervalued in March. The OPEC+ announcement could provide the catalyst needed to trigger a correction higher for the Krone.”
-
11:57
Gold Price Forecast: XAU/USD recovers early lost ground, climbs back above $1,970 level
- Gold price attracts some dip-buying and rebound from a one-week low touched on Monday.
- The US Dollar surrenders its modest intraday gains and lends some support to the XAU/USD.
- Rising bets for more rate hikes by the Federal Reserve cap any meaningful gains for the metal.
Gold price reverses an intraday fall to the $1,950 zone, or a four-day low touched earlier this Monday and builds on its intraday ascent through the first half of the European session. The XAU/USD is currently placed near the top end of its daily trading range, just above the $1,970 level, though the lack of follow-through buying warrants some caution for aggressive bullish traders.
The emergence of fresh US Dollar selling benefits Gold price
The US Dollar (USD) surrenders its intraday gains to a one-week high amid the uncertainty over the Federal Reserve's (Fed) rate-hike path and turns out to be a key factor driving flows towards the US Dollar-denominated Gold price. It is worth recalling that the Fed had signalled recently that it might soon pause the rate-hiking cycle in the wake of the turmoil in the banking sector. The bets were reaffirmed by the release of the Personal Consumption Expenditures (PCE) Price Index data from the United States (US) on Friday, which pointed to cooling inflation. Investors, however, seem worried that a surprise production cut by major oil producers will push inflation higher and force the Fed to move back to its inflation-fighting rate hikes.
Federal Reserve rate hike bets cap gains for Gold price
In fact, the Organization of the Petroleum Exporting Countries and their allies - known as OPEC+ - shook markets by announcing further production cuts of about 1.16 million barrels per day (bpd) on Sunday. This leads to a big bullish gap opening in Oil prices, reviving inflation fears and fueling speculations about further policy tightening by the Fed. The current market pricing indicates a greater chance of a 25 bps lift-off at the next Federal Open Market Committee (FOMC) monetary policy meeting in May. This, in turn, pushes the US Treasury bond yields higher, which could act as a tailwind for the Greenback and might hold back traders from placing aggressive bullish bets around the non-yielding Gold price, at least for now.
Trades look to key macro data from United States for fresh impetus
Market participants now look forward to important US macro data, scheduled at the beginning of a new month for some meaningful impetus. A rather busy week starts with the US ISM Manufacturing PMI, due later during the early North American session on Monday, which, along with the US bond yields, could drive the USD demand and allow traders to grab short-term opportunities around Gold price. Investors will further take cues from the ADP report on private-sector employment and ISM Services PMI on Wednesday, followed by the crucial US monthly employment report - popularly known as NFP on Friday. The latter will influence the near-term USD price dynamics and help determine the next leg of a directional move for the XAU/USD.
Gold price technical outlook
From a technical perspective, the range-bound price action witnessed over the past week or so constitutes the formation of a rectangle on the daily chart. Against the backdrop of a strong rally from the March swing low, this might still be categorized as a bullish consolidation phase and supports prospects for a further appreciating move for Gold price. Bulls, however, might wait for some follow-through buying beyond the $1,980-$1,982 supply zone before placing fresh bets. The XAU/USD might then aim to surpass the $2,000 psychological mark and retest a one-year high, around the $2,009-$2,010 zone touched in March.
On the flip side, the $1,950-$1,945 zone now seems to protect the immediate downside ahead of the $1,935 support zone and the $1,920-$1,918 region. A convincing break below the said support levels could negate the near-term positive outlook and prompt aggressive technical selling. The gold price might then weaken further below the $1,900 round-figure mark, towards an intermediate support near the $1,885 level and the $1,875-$1,870 area.
Key levels to watch
-
11:49
USD/JPY: Local factors should support the Yen later in the year – HSBC
The JPY is back as the “safe haven” of choice, as recent “risk off” periods have been associated with falling US yields. If banking-related anxiety does not intensify, this would point to a weaker JPY over the near term, but economists at HSBC believe local factors should provide support for the JPY later in the year.
Near-term sideways, but longer-term strength
“If banking-related anxiety does not intensify, this would point to a weaker JPY against ‘risk on’ currencies over the near term. However, it may be possible for local news to get some traction in the JPY. If the news flow on Japanese wages remains favourable, then this could counter some JPY downside. As such, we expect USD/JPY to move largely sideways in the weeks ahead.”
“Beyond the near-term movements, the rationale supporting the JPY’s appreciation later in the year remains intact. For example, compared to early January, more Japan economists now think that the Bank of Japan (BoJ) will modify its yield curve control (YCC) policy this year. Japan’s trade deficit widened to a record level in January 2023, but this was likely exacerbated by holiday-related distortions and a lagged pass-through of lower oil prices. Subsequent numbers should be better.”
-
11:30
Brent Crude Oil: Next potential hurdle is located at the falling 200-DMA near $90 – SocGen
Crude oil prices opened with a significant bullish gap. Brent Oil could test the $90 level, economists at Société Générale report.
Downtrend could resume on failure to hold support at $79
“Brent has gapped up above the trend line drawn since March 2022 and has extended the bounce towards February/March peaks of $87. Next potential hurdle is located at the falling 200-DMA near $90, it has failed to reclaim this MA since last September.”
“It would be interesting to see if Brent can hold above recent gap levels at $79. In case it establishes below this support, the downtrend could resume.”
-
11:02
USD Index: A move to 102.00 remains a tangible risk – ING
OPEC+ output cut gives Dollar a lifeline. However, economists at ING still see the US Dollar Index at risk of falling toward 102.00.
This week, focus will be on US data
“The OPEC+ move may have given the Dollar a temporary lifeline, but we still think that markets will want to hear more reassurance from Fed Chair Jerome Powell that the Fed will indeed go ahead with more tightening in spite of recent financial turmoil to allow the Dollar some more stabilisation.”
“In the coming week, the focus will be on data in the US, with ISM manufacturing today, ISM services (more important) on Wednesday and jobs figures on Friday as well as some Fedspeak.”
“Any signs of weakness in the data will likely push dovish bets back higher after the recent big unwinding of rate-cut bets.) Solid data and hawkish Fed comments may help reinforce May Fed hike expectations and help build a floor below DXY around 103.00/103.50.”
“Looking ahead, lacking a hawkish tilt in the Fed message, a move to 102.00 remains a tangible risk.”
-
11:01
USD/CNH now faces a mixed outlook – UOB
USD/CNH now appears to have moved into a consolidative phase within the 6.8500-6.9200 range, comment Markets Strategist Quek Ser Leang and Senior FX Strategist Peter Chia at UOB Group.
Key Quotes
24-hour view: “We expected USD to weaken last Friday but we were of the view that 6.8100 is unlikely to come into view. USD plummeted briefly to 6.8440 and then rebounded sharply to end the day little changed at 6.8750 (-0.01%). The sharp but short-lived swings have resulted in a mixed outlook. USD could trade in a choppy manner today, likely between 6.8600 and 6.8950.”
Next 1-3 weeks: “Last Friday (31 Mar, spot at 6.8550), we held the view that USD ‘is likely to head lower even though 6.8100 might not be easy to break’. USD dropped sharply to 6.8440 before rebounding strongly. While our ‘strong resistance’ level of 6.8900 is not breached, the build-up in downward momentum faded quickly. In other words, the downward pressure has fizzled out. The outlook for USD is mixed and it is likely to trade between 6.8500 and 6.9200 for now.”
-
11:00
US Dollar holds steady as fears over energy inflation return
- US Dollar stays resilient against its rivals to start the new week.
- EUR/USD bullish bias stays intact as the pair holds above key support area.
- ISM Manufacturing PMI survey is forecast to reveal an increase in input inflation.
Following the rebound witnessed on Friday, the US Dollar (USD) started the new week on a bullish note and the US Dollar Index recovered toward 103.00 during the Asian trading hours. Market participants reassess the US Federal Reserve’s (Fed) rate outlook amid renewed concerns over an uncomfortably high energy inflation. The ISM’s Manufacturing PMI survey could impact the USD valuation in the second half of the day on Monday.
Daily digest market movers: US Dollar reacts to Fed rate hike expectations
- The CME Group FedWatch Tool shows that markets are pricing in a more than 60% probability of the Fed raising its policy rate by 25 basis points (bps) in May.
- On Sunday, Saudi Arabia announced that several producers in OPEC+ will participate in voluntary output cuts from May to the end of the year. The group’s total output will be reduced by more than 1 million barrels per day in that period.
- The barrel of West Texas Intermediate (WTI) opened with a large bullish gap and touched its highest level since late January above $82.
- The ISM Manufacturing PMI survey is forecast to show ongoing contraction in the business activity of the United States (US) manufacturing sector in March.
- Prices Paid Index of the PMI survey is expected to 53.8 in March from 51.3 in February.
- Previewing the ISM survey, “if the headline figure beats estimates, the US Dollar would rise and stocks would decline as investors would give a higher chance to a rate hike in May,” said FXStreet Analyst Yohay Elam. “However, any such move would be short-lived. Even if the Fed were to raise borrowing costs next month, it would probably be the last.”
- NY Fed President John Williams reiterated on Friday that the Fed’s policy decisions will be driven by the incoming data and the progress toward employment and price stability mandates.
- Later in the week, the ISM Services PMI survey, ADP private sector employment data and the US Bureau of Labor Statistics’ March jobs report could influence the USD valuation.
Technical analysis: US Dollar struggles to gather strength against Euro
Despite the modest retreat witnessed at the beginning of the week, EUR/USD remains bullish in the near term. The Relative Strength Index (RSI) indicator on the daily chart stays near 60 and the pair holds comfortably above the 20-day and the 50-day SMA, which are about to make a bullish cross.
On the upside, EUR/USD faces first resistance at 1.0900 (psychological level, static level). If the pair manages to rise above that level and confirms it as support, it could extend its uptrend toward 1.1000 (end-point of the latest uptrend) and 1.1035 (multi-month high set in early February).
EUR/USD’s latest pullback confirmed 1.0800 (psychological level, static level) as support. A daily close below that level could open the door for further losses toward 1.0730 and the 1.0650/60 area, where the 100-day SMA and the Fibonacci 23.6% retracement of the latest uptrend align.
How does Fed’s policy impact US Dollar?
The US Federal Reserve (Fed) has two mandates: maximum employment and price stability. The Fed uses interest rates as the primary tool to reach its goals but has to find the right balance. If the Fed is concerned about inflation, it tightens its policy by raising the interest rate to increase the cost of borrowing and encourage saving. In that scenario, the US Dollar (USD) is likely to gain value due to decreasing money supply. On the other hand, the Fed could decide to loosen its policy via rate cuts if it’s concerned about a rising unemployment rate due to a slowdown in economic activity. Lower interest rates are likely to lead to a growth in investment and allow companies to hire more people. In that case, the USD is expected to lose value.
The Fed also uses quantitative tightening (QT) or quantitative easing (QE) to adjust the size of its balance sheet and steer the economy in the desired direction. QE refers to the Fed buying assets, such as government bonds, in the open market to spur growth and QT is exactly the opposite. QE is widely seen as a USD-negative central bank policy action and vice versa.
-
10:57
GBP/USD rebounds swiftly from one-week low, rallies back closer to mid-1.2300s
- GBP/USD reverses an intraday slide to a one-week low amid the emergence of some USD selling.
- A generally positive risk tone undermines the safe-haven buck and lends some support to the pair.
- Bets for more rate hikes by the Fed and the BoE warrant caution before placing directional bets.
The GBP/USD pair attracts some dip-buying buying near the 1.2275 area, or a one-week low touched earlier this Monday and builds on its intraday ascent through the first half of the European session. Spot prices climb to a fresh daily high, around the 1.2335-1.2340 region in the last hour and for now, seem to have stalled the retracement slide from over a two-month high set on Friday.
The US Dollar (USD) surrenders its intraday gains to a one-week high and turns out to be a key factor offering some support to the GBP/USD pair. The prevalent risk-on mood - as depicted by a generally positive tone around the equity markets - is seen weighing on traditional safe-haven assets, including the Greenback. Apart from this, the prospects for additional interest rate hikes by the Bank of England (BoE) underpins the British Pound and contributes to the pair's goodish intraday rally of around 65 pips.
It is worth recalling that BoE Governor Andrew Bailey said last week that interest rates may have to move higher if there were signs of persistent inflationary pressure. Adding to this, the final UK GDP print released on Friday showed that the economy expanded by 0.1% in Q4 and avoided a technical recession, reaffirming hawkish BoE expectations. The Federal Reserve (Fed), meanwhile, is also anticipated to stick to its inflation-fighting rate hikes amid worries that rising energy prices will push inflation higher.
In fact, the current market pricing indicates around a 60% chance of a 25 bps lift-off at the next FOMC monetary policy meeting in May. This is reinforced by a fresh leg up in the US Treasury bond yields, which could help limit the downside for the USD and keep a lid on any meaningful upside for the GBP/USD pair. Traders might also refrain from placing aggressive directional bets ahead of key US macro data scheduled at the beginning of a new month, warranting caution before positioning for further gains.
This week's rather busy US economic docket kicks off with the release of ISM Manufacturing PMI later during the early North American session on Monday. This will be followed by JOLTS Job Openings on Tuesday, the ADP report on private-sector employment and ISM Services PMI on Wednesday, and the crucial US monthly employment report - popularly known as NFP - on Friday. The latter will influence the near-term USD price dynamics and determine the next leg of a directional move for the GBP/USD pair.
Technical levels to watch
-
10:42
There is still time to prepare for JPY jumps – Commerzbank
Ulrich Leuchtmann, Head of FX and Commodity Research at Commerzbank, analyzes how the next Bank of Japan (BoJ) meetings could impact the Yen.
It would be desirable if the BoJ would communicate a possible reversal very gradually
“It would be desirable if the BoJ would communicate a possible reversal very gradually. But that is easier said than done.”
“All BoJ watchers are likely to weigh every word from the new BoJ squad very carefully and will try and read into that whether we will see a change in direction. That makes ‘gradual communication’ almost impossible. And as a result, it is perhaps best not to even try. Understandable from my point of view.”
“For all market participants with JPY exposure: things are going to get ‘jumpy’, in particular around the time of BoJ meetings. The next one (and thus the first one under new BoJ leadership) is at the end of the month, so there is still time to prepare for JPY jumps.”
-
10:17
RBA to hike OCR by 25 bps on Tuesday amid high inflation – Goldman Sachs
Economists at Goldman Sachs expect the Reserve Bank of Australia (RBA) to raise the official cash rate (OCR) by 25 basis points (bps) on Tuesday.
Key quotes
“The CPI is too high and that of the services sectors is accelerating.”
“Ultimately, Australian inflation is far too high.”
“Clearer signs of an acceleration from persistent sources in the services sector.”
Also read: Reserve Bank of Australia Preview: To pause or not to pause
-
10:11
Gold Price Forecast: XAU/USD looks to NFP to decide if it is the time to test recent highs near $2,000 – TDS
Friday's jobs report for March could trigger the next big action in the Gold price. XAU/USD could test recent highs this week, economists at TD Securities report.
Lower-than-expected PCE inflation and possible new economic weakness
“With investors continuing to worry that the recent bank industry crisis will reduce lending in the US, and interest rate sensitive sectors are set to experience a difficult period, investors decided that Gold is unlikely to drop lower.”
“Gold is set to test recent highs near $2,000 amid lower-than-expected PCE inflation and possible new economic weakness. However, the market looks to the March payrolls to decide if next week is the time to take Gold to recent highs.”
-
10:10
USD/CAD weakens back below 1.3500 mark, touches its lowest since February 21
- USD/CAD drops to its lowest level since February and is pressured by a combination of factors.
- Bullish Oil prices underpin the Loonie and exert pressure amid a modest intraday USD pullback.
- Bets for more rate hikes by the Fed, looming recession risk could limit losses for the greenback.
- Traders now look forward to the US ISM Manufacturing PMI for some short-term opportunities.
The USD/CAD pair attracts fresh sellers following a modest intraday bounce to the 1.3535 area on Monday and drops to a fresh low since February 21 during the first half of the European session. The pair is currently placed just below the 1.3500 psychological mark and seems vulnerable below the 100-day Simple Moving Average (SMA).
Crude Oil prices opened with a bullish gap on the first day of a new week in reaction to a surprise production cut by OPEC+, which, in turn, underpins the commodity-linked Loonie and acts as a headwind for the USD/CAD pair. It is worth recalling that major oil producers announced a further output cut of around 1.16 million bpd on Sunday - ahead of a virtual meeting of the OPEC+ ministerial panel - and led to a sharp rise of nearly 6% in the black liquid.
The US Dollar (USD), on the other hand, surrenders a major part of its intraday gains and further seems to exert some downward pressure on the USD/CAD pair. A generally positive risk tone dent demand for traditional safe-haven currencies, including the Greenback. That said, any optimism in the markets, is likely to be short-lived amid concerns about a deeper global economic downturn. The worries resurfaced after data out of Asia on Friday showed that manufacturing activity in Japan contracted during March, while growth in China stalled during the reported month.
Apart from this, fresh speculations about a further policy tightening by the Federal Reserve (Fed) should act as a tailwind for the Greenback and help limit the downside for the USD/CAD pair, at least for the time being. Investors now seem convinced that rising energy prices will push inflation higher and force the US central bank to move back to its inflation-fighting rate hikes. This is reinforced by a fresh leg up in the US Treasury bond yields, which, in turn, favours the USD bulls and supports prospects for the emergence of some dip-buying around the major.
From a technical perspective, acceptance below the 100-day SMA could be seen as a fresh trigger for bears, suggesting the path of least resistance for the USD/CAD pair. This might hold back traders from placing aggressive directional bets ahead of the US ISM Manufacturing PMI, due later during the early North American session. This week's busy US economic docket also features JOLTS Job Openings on Tuesday, the ADP report on private-sector employment and ISM Services PMI on Wednesday, followed by the US jobs report, or the NFP on Friday.
Investors will further take cues from the monthly Canadian employment details, due for release on Thursday. Apart from this, traders will take cues from Oil price dynamics to determine the next leg of a directional move for the USD/CAD pair.
Technical levels to watch
-
09:56
EUR/USD: Bulls would probably welcome the pair ending the week around 1.0850/1.0900 – ING
Economists at ING had called for EUR/USD to break 1.10 this week. This is still a possibility, but the surprise oil production cut announced by OPEC+ gives Dollar a lifeline.
Move to 1.10 delayed
“We had called for EUR/USD to break above 1.10 sometime this week, but the asymmetrically positive impact on the USD of the OPEC+ surprise cut means that such a call now likely requires some disappointing data out of the US, given the lack of Euro-specific drivers this week. This is not necessarily our base case, and EUR/USD bulls would probably welcome the pair ending the week around 1.0850/1.0900.”
“Strong US data and hawkish Fed commentary can see the pair test the 1.0700 and 1.0600 supports.”
-
09:41
BoE’s Pill: Well capitalized banks help combat inflation
Bank of England (BoE) Chief Economist Huw Pill made some comments on the UK banking system, in an appearance on Monday.
Key quotes
“The UK banking system is well capitalized.”
“Well-capitalized banks help combat inflation, though inflation is still far too high.”
Market reaction
GBP/USD is holding its recovery mode intact near 1.2315 on the above comments, losing 0.15% so far.
-
09:30
United Kingdom S&P Global/CIPS Manufacturing PMI below expectations (48) in March: Actual (47.9)
-
09:26
AUD/USD: Aussie to benefit if the RBA emphasizes the possibility of further hikes – Commerzbank
The Reserve Bank of Australia (RBA) will hold its monthly meeting on Tuesday. The key question is whether the RBA will take a break in its rate hike cycle and how it expects interest rates to develop in the near future, economists at Commerzbank report.
Will the RBA pause its rate hike cycle?
“There is certainly a risk that after a cumulative 350 basis points of rate hikes, the RBA will pause for now and wait for the quarterly price index and another labor market report.”
“Still, it could emphasize the possibility of further hikes and make them conditional on the next data releases. This would take some wind out of the market's rate cut expectations. The Aussie would certainly benefit from such an outcome.”
-
09:19
USD Index retreats for tops past the 103.00 mark
- The index trims earlier gains north of the 103.00 level.
- US yields regain some upside traction after Friday’s drop.
- US ISM Manufacturing, final PMI next of note in the docket.
The greenback, in terms of the USD Index (DXY), extends the optimism seen last Friday and briefly surpasses the 103.00 barrier on Monday.
USD Index appears bid ahead of data
The index could not sustain the initial bull run past the 103.00 hurdle amidst some recovery in the risk complex, although the risk-off mood appears to prevail so far in the European morning.
In the meantime, the uptick in the dollar looks underpinned by the, for now, mild recovery in US yields following Friday’s retracement, while some speculation pointing to a 25 bps rate hike at the May event also collaborates with the dollar’s upbeat mood at the beginning of the week.
Later in the session, all the attention will be on the release of the always relevant ISM Manufacturing seconded by the final Manufacturing PMI, both prints for the month of March. In addition, February’s Construction Spending and the speech by FOMC L. Cook (permanent voter, centrist) are also due.
What to look for around USD
The index regains the 103.00 region, as the risk-off sentiment seems to extend further into the European session on Monday.
Also weighing on the current bearish outlook for the dollar emerges the increasing likelihood that the Federal Reserve could pause its ongoing tightening stance, which has been propped up by persevering disinflation, nascent weakness in some key fundamentals and fresh concerns surrounding the banking sector
In addition, dwindling hawkishness from Fed rate setters also seems to have removed some strength from the greenback, particularly since the latest FOMC gathering and events around SVB and other medium-size US lenders.
Key events in the US this week: Final Manufacturing PMI, ISM Manufacturing, Construction Spending (Monday) – Factory Orders (Tuesday) – MBA Mortgage Applications, ADP Employment Change, Balance of Trade, Final Services PMI, ISM Non-Manufacturing (Wednesday) – Initial Jobless Claims (Thursday) – Non-Farm Payrolls, Unemployment Rate, Consumer Credit Change (Friday).
Eminent issues on the back boiler: Persistent debate over a soft/hard landing of the US economy. Terminal Interest rate near the peak vs. speculation of rate cuts in 2024. Fed’s pivot. Geopolitical effervescence vs. Russia and China. US-China trade conflict.
USD Index relevant levels
Now, the index is advancing 0.12% at 102.71 and faces the next resistance level at 103.37 (55-day SMA) followed by 104.01 (100-day SMA) and then 105.88 (2023 high March 8). On the other hand, the breach of 101.93 (monthly low March 23) would open the door to 100.82 (2023 low February 2) and finally 100.00 (psychological level).
-
09:12
Silver Price Analysis: XAG/USD keeps the red below $24.00, downside seems cushioned
- Silver comes under heavy selling pressure on Monday, though lacks follow-through.
- The technical setup still supports prospects for the emergence of some dip-buying.
- A convincing break below the $23.00 mark is needed to negate the positive outlook.
Silver kicks off the new week on a downbeat note and snaps a four-day winning streak to a nearly two-month high, around the $24.15 region touched on Friday. The white metal maintains its offered tone through the early part of the European session and trades around the $23.75 zone, down over 1.30% for the day.
From a technical perspective, the recent strong move up from the YTD low - levels just below the $20.00 psychological mark, stalls ahead of the $24.20-$24.25 static resistance, which should now act as a pivotal point. Some follow-through buying, leading to a subsequent strength beyond the multi-month peak, around the $24.60-$24.65 area touched in February, will b seen as a fresh trigger for bullish traders.
Given that oscillators on the daily chart have pulled back from overbought territory, the XAG/USD might then aim to reclaim the $25.00 psychological mark for the first time since April 2022. The upward trajectory could get extended further towards the next relevant hurdle near the $25.75-$25.80 region en route to the $26.00 round-figure mark and the April 2022 swing high, around the $26.20-$26.25 area.
On the flip side, the daily low, just ahead of the mid-$23.00s, now seems to protect the immediate downside. Any subsequent slide is more likely to attract fresh buyers near the $23.00 mark and remain limited near the $22.80-$22.75 region. That said, a convincing break below might prompt some technical selling and drag the XAG/USD towards the $22.25 intermediate support en route to the $22.00 round-figure mark.
Silver daily chart
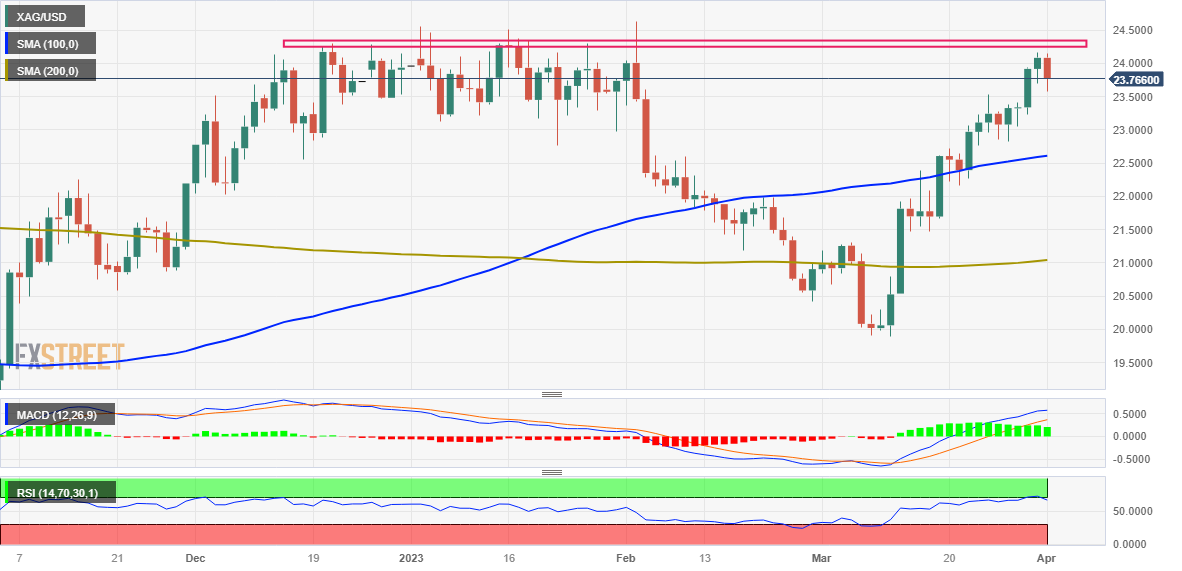
Key levels to watch
-
09:00
Greece S&P Global Manufacturing PMI: 52.8 (March) vs 51.7
-
09:00
European Monetary Union S&P Global Manufacturing PMI came in at 47.3, above forecasts (47.1) in March
-
08:57
EUR/GBP may keep hovering around 0.8800 this week – ING
Economists at ING expect the EUR/GBP pair to stablize around the 0.88 level in the next few days.
A quiet week in the UK
“The Pound should continue to move in tandem with the Euro, given few catalysts to drive a consistent divergence from the common currency and external (Dollar) factors dominating in FX. So, EUR/GBP may keep hovering around 0.8800 in a week where both the UK and Eurozone’s economic calendars are pretty much empty.”
“If a move to 1.10 in EUR/USD was delayed by OPEC+, the same could be said about a move to 1.25 for Cable.”
“The Dollar leg of GBP/USD will keep driving most moves in the pair this week and US data will be in focus.”
-
08:55
Germany S&P Global/BME Manufacturing PMI registered at 44.7 above expectations (44.4) in March
-
08:50
France S&P Global Manufacturing PMI came in at 47.3 below forecasts (47.7) in March
-
08:49
USD/JPY: A visit to 134.00 remains on the cards – UOB
Further upside in USD/JPY is still expected to retake the 134.00 region in the short-term horizon, note Markets Strategist Quek Ser Leang and Senior FX Strategist Peter Chia at UOB Group.
Key Quotes
24-hour view: “We highlighted last Friday that ‘a break of 133.50 will not be surprising but the major resistance at 134.20 could be just out of reach’. While USD took out 133.50, it dropped quickly from 133.59. Upward momentum has barely improved and USD is unlikely to advance much further. Today, USD is more likely to trade between 132.55 and 133.55.”
Next 1-3 weeks: “Last Friday (30 Mar, spot at 132.60), we highlighted that the recent USD weakness has ended and the rebound in USD could extend to 134.20. We continue to hold the same view. The current upside pressure will remain intact as long as USD stays above 131.90 (‘strong support’ level was at 131.70 last Friday).”
-
08:47
Natural Gas Futures: Scope for extra gains
Considering advanced prints from CME Group for natural gas futures markets, open interest extended the uptrend and rose by around 20.5K contracts on Friday. Volume rose by around 12.7K contracts after two consecutive daily pullbacks.
Natural Gas appears supported near $2.00
Prices of natural gas charted a decent bounce on Friday against the backdrop of increasing open interest and volume. That said, the commodity could extend the recovery in the very near term, while a firm support still emerges just below the $2.00 mark per MMBtu (February 22).
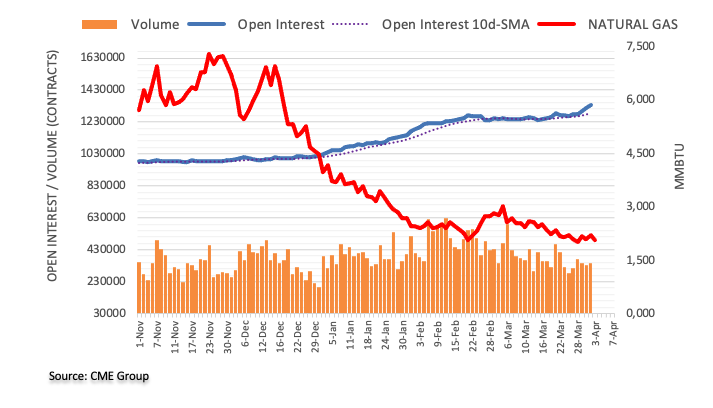
-
08:45
Italy S&P Global Manufacturing PMI registered at 51.1 above expectations (51) in March
-
08:34
Austria Unemployment Rate: 6.2% (March) vs previous 7%
-
08:34
Austria Unemployment fell from previous 294.1K to 259.4K in March
-
08:33
NZD/USD finds some support near 0.6200 mark, remains well offered below 200 DMA
- NZD/USD attracts aggressive sellers on Monday amid broad-based USD strength.
- A sharp rise in Oil prices lifts bets for more Fed rate hikes and boosts the buck.
- The market focus now shifts to this week’s US macro data and the RBNZ meeting.
The NZD/USD pair comes under heavy selling pressure on the first day of a new week and extends Friday's rejection slide from the vicinity of the 0.6300 mark, or its highest level since February 16. The pair, however, manages to rebound a few pips from the daily low and trades around the 0.6230 region during the early European session, still down nearly 0.50% for the day.
The US Dollar (USD) strengthens across the board amid fresh bets for further policy tightening by the Federal Reserve (Fed) and turns out to be a key factor weighing on the NZD/USD pair. Crude Oil prices rise sharply following a surprise production cut by the OPEC+ and fuel inflation fears, which might force the Federal Reserve to move back to its inflation-fighting rate hikes. In fact, the markets are now pricing in a greater possibility of a 25 bps lift-off at the next FOMC policy meeting in May. This pushes the US Treasury bond yields higher and acts as a tailwind for the Greenback.
That said, a stable performance around the equity markets acts as a headwind for the safe-haven buck and lends support to the risk-sensitive Kiwi, at least for the time being. Any optimism in the markets, however, is likely to be short-lived amid concerns about a deeper global economic downturn. The worries resurfaced after data out of Asia showed that manufacturing activity in Japan contracted during March, while growth in China stalled during the reported month. This might hold back traders from placing bullish bets around the NZD/USD pair and positioning for any meaningful upside.
Even from a technical perspective, the recent repeated failures to find acceptance above the very important 200-day Simple Moving Average (SMA) warrants some caution for bullish traders. Market participants now look to the US ISM Manufacturing PMI for some impetus later during the early North American session. This week's rather busy economic docket also features the Reserve Bank of New Zealand (RBNZ) monetary policy meeting on Wednesday and the US monthly employment data, or the NFP report on Friday, which will help determine the near-term trajectory for the NZD/USD pair.
Technical levels to watch
-
08:30
Switzerland SVME - Purchasing Managers' Index below expectations (48.9) in March: Actual (47)
-
08:28
AUD/USD: Further range bound likely near term – UOB
AUD/USD is now expected to trade between 0.6625 and 0.6735 in the next few weeks, suggest Markets Strategist Quek Ser Leang and Senior FX Strategist Peter Chia at UOB Group.
Key Quotes
24-hour view: “Our expectation for AUD to edge higher last Friday did not materialize as it traded between 0.6672 and 0.6738. AUD dropped sharply in early Asian trade today and could test 0.6645. The next support level at 0.6625 is not expected to come under threat. Resistance is at 0.6695, followed by 0.6710.”
Next 1-3 weeks: “We highlighted last Friday (31 Mar, spot at 0.6715) that while upward momentum has improved somewhat, AUD has to break clearly above 0.6760 before a sustained advance is likely. AUD subsequently rose to 0.6738 and then fell sharply. The build-up of upward momentum has faded. AUD is likely to trade in a range for the time being, expected to be between 0.6625 and 0.6735.”
-
08:23
US Dollar benefits from rising Oil price – Commerzbank
The decision of the OPEC+ countries to reduce the Oil production has caused Oil prices to jump. Within the G10 universe it was mainly the US Dollar that benefitted. Why? Ulrich Leuchtmann, Head of FX and Commodity Research at Commerzbank explains the USD reaction.
“Dollar dominance” is an economic concept not an accounting concept
“If US energy production becomes more valuable because in other places (in the OPEC countries) production is falling, Oil production in the US becomes a more profitable business and attracts capital and labor. In that sense everything else the US produces also becomes ‘more valuable’.”
“The burger in New York is more valuable because it has to be produced despite the fact that those frying it could get more lucrative jobs on the Oil fields and despite the fact that those providing the capital to set up the shop could just as easily invest in shale Oil firms. That makes the burger in New York more valuable than the same burger in Hamburg, Milan or Tokyo. If this change is not reflected exclusively by the USD price of burgers in New York rising (and the Fed will certainly try to prevent that!) the USD has to appreciate, bringing the relative valuation of US/German/Italian/ Japanese Burgers in line with these new fundamentals.”
“That is why the Dollar is currently appreciating and not because the Oil price on your screen is quoted in US Dollar.”
-
08:23
Crude Oil Futures: Door open to extra gains
CME Group’s flash data for crude oil future markets noted traders increased their open interest positions by around 20.3K contracts at the end of last week. In the same direction, volume reversed four consecutive daily drops and went up by around 151.7K contracts.
WTI: Next on the upside comes the 200-day SMA near $84.00
Price of the WTI extended the optimism seen in the second half of the week on Friday. The uptick was in tandem with rising open interest and volume and leaves the door open to extra gains in the very near term. The surpass of the key $80.00 mark per barrel should expose a probable move to the key 200-day SMA, today just above $84.00.
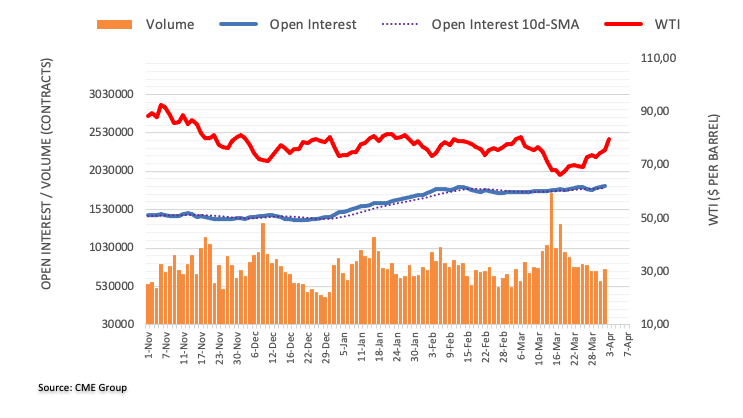
-
08:15
Spain S&P Global Manufacturing PMI came in at 51.3, above forecasts (50.3) in March
-
08:02
Turkey Consumer Price Index (MoM) came in at 2.29%, below expectations (2.85%) in March
-
08:01
Brent Crude Oil to average $101 over H2 as OPEC+ delivers surprise production cuts – ING
A number of OPEC+ members shocked the market over the weekend by announcing further voluntary supply cuts. Economists at ING have subsequently updated their oil forecasts.
OPEC+ shocks market with supply cuts
“A handful of OPEC+ members surprised the market over the weekend by announcing further voluntary cuts amounting to around 1.66m b/d from May to December 2023. These surprise cuts mean a tighter market this year. As a result, we have had to revise higher our oil forecasts for the remainder of 2023.”
“A tighter market means that we now expect higher oil prices. Prior to these announced cuts we were forecasting Brent to average $97/bbl over the second half of the year. However, we now expect the market to average $101/bbl over this period.”
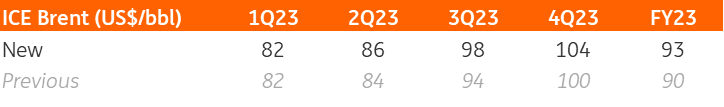
Source: ING Research
-
08:01
Turkey Producer Price Index (MoM) dipped from previous 1.56% to 0.44% in March
-
08:01
Turkey Producer Price Index (YoY): 62.45% (March) vs previous 76.61%
-
08:01
Turkey Consumer Price Index (YoY) below forecasts (51.33%) in March: Actual (50.51%)
-
08:00
Gold Price Forecast: XAU/USD pares intraday losses near $1,950 as US Dollar retreats amid pre-NFP anxiety
- Gold price picks up bids to consolidate recent losses near the lowest levels in one week.
- Markets dwindle amid downbeat Fed bets, inflation woes emanating from OPEC+ and mixed US data.
- US PMIs for March, ADP Employment Change can offer intermediate directions to Gold price ahead of Friday’s key jobs report.
Gold price (XAU/USD) trims intraday losses near $1,955 amid early Monday morning in Europe. In doing so, the bright metal rebounds from a one-week low marked earlier in the day as traders reassess the week-start challenges to the sentiment that initially favored the US Dollar strength.
US Dollar Index (DXY) retreats from an intraday high of 103.05 to 102.90 as the early-day risk aversion fades amid receding hawkish bets on the Federal Reserve (Fed). Also challenging the greenback’s gauge versus the six major currencies are the concerns suggesting China and Brazil’s dropping of the US Dollar for cross-border trade.
It’s worth noting that the Organization of the Petroleum Exporting Countries (OPEC) and its allies led by Russia, known as OPEC+, announced 1.16 million barrels per day of output cut and renewed inflation fears earlier in the day. The same exert downside pressure on the Gold price via a firmer US Dollar. However, easing hopes of another strong rate hike from the US Federal Reserve (Fed) seems to weigh on the US Dollar and allow the Gold price to lick its wounds.
As per the latest readings of CME’s FedWatch Tool, market players place nearly 42% probability on the 0.25% Fed rate hike in May, versus 52% marked on Friday.
Elsewhere, softer China Caixin Manufacturing PMI jostles with the Sino-American tension the market’s pre-NFP caution to challenge the XAU/USD traders.
Moving on, US ISM Manufacturing & S&P Global Manufacturing PMI could entertain Gold traders ahead of Friday’s US jobs report.
Gold price technical analysis
The RSI (14) rebound from oversold territory allows the Gold price to lick its wounds near the lowest levels in a week.
However, the bearish MACD signals and a clear downside break of a two-week-old ascending trend line, as well as the sustained trading below the 200-HMA and 100-HMA confluence, keep the Gold bears hopeful.
That said, the latest recovery remains elusive unless crossing the $1,960 support-turned-resistance line.
Even if the quote crosses the $1,960 immediate hurdle, the aforementioned HMA convergence, close to $1,970, appears a tough nut to crack for the XAU/USD bulls.
It’s worth noting that a downward-sloping resistance line from March 20, near $1,987 at the latest, restricts the short-term upside of the Gold price.
Meanwhile, a downside break of the latest swing low surrounding $1,950 could refresh the south-run targeting the 61.8% Fibonacci retracement level of the XAU/USD’s March 15-20 upside, near $1,933.
Overall, the Gold price remains on the bear’s radar despite the latest corrective bounce.
Gold price: Four-hour chart
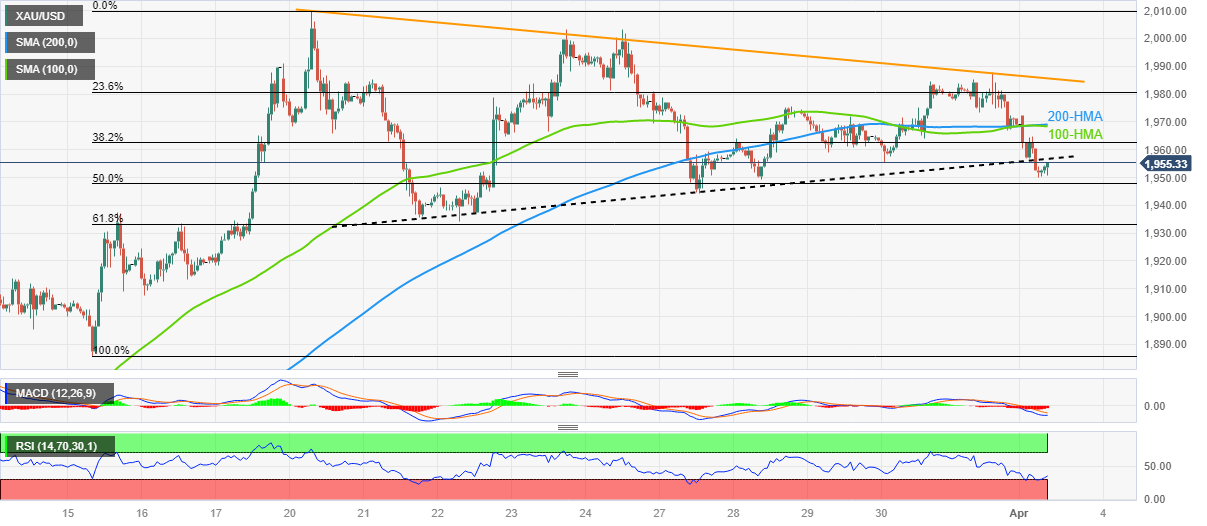
Trend: Limited recovery expected
-
08:00
Forex Today: Oil jumps on surprise output cut, US Dollar benefits from cautious mood
Here is what you need to know on Monday, April 3:
Markets have started the week on a cautious note and the US Dollar has kept its footing after having gathered strength against its major rivals on the last day of March. S&P Global will publish revisions to Manufacturing and Services PMI surveys for March and the ISM Manufacturing PMI will be featured in the US economic docket. The Bank of Canada (BOC) will also release its quarterly Business Outlook Survey.
Saudi Arabia, Russia, the United Arab Emirates and other OPEC+ producers have announced that they have agreed to cut oil output by a total of around 1.16 million barrels per day from May until the end of 2023. Crude oil prices opened with a significant bullish gap and the barrel of West Texas Intermediate reached its highest level since late January at $81.50 before retreating below $80 in the European morning. Rising energy prices seem to be weighing on market sentiment with US stock index futures trading deep in negative territory in the early European session. During the Asian trading hours, the data from China showed that Caixing Manufacturing PMI declined to 50 in March from 51.6 in February, compared to the market expectation of 51.7.
In the meantime, the US Dollar Index clings to modest daily gains at around 103.00 while the 10-year US Treasury bond yield rises more than 1% on the day above 3.5%.
ISM Manufacturing PMI Preview: Three reasons for an upside surprise.
AUD/USD stays under modest bearish pressure and trades at around 0.6670 in the European morning. In February, Building Permits in Australia grew by 4% but Home Loans declined by 1.2%. TD Securities Inflation declined to 5.7% on a yearly basis in March from 6.3% in February. In the early Asian session on Tuesday, the Reserve Bank of Australia (RBA) will announce its interest rate decision.
Despite the downward correction witnessed ahead of the weekend, EUR/USD managed to close the week in positive territory for the fifth straight time. The pair continues to stretch lower toward 1.0800 on Monday.
After having touched its highest level in nearly three months above 1.2400 on Thursday, GBP/USD fell sharply on Friday. The risk-averse market atmosphere caused the pair to edge lower during the Asian session and it was last seen trading a few pips below 1.2300.
Gold price extended its downward correction toward $1,950 early Monday. With the US T-bond yields pushing higher in the European morning, XAU/USD stays deep in negative territory despite having recovered toward $1,955.
USD/JPY opened with a bullish gap and climbed to the 133.50 area on Monday. The Japanese yen is struggling to take advantage of safe-haven flows amid rising US T-bond yields.
Following a quiet weekend, Bitcoin edged lower and was last seen trading slightly below $28,000 with a daily loss of around 1.5%. Ethereum fell more than 1% on Sunday and seems to have gone into a consolidation phase below $1,800 early Monday.
-
07:49
UK public inflation expectations for 12 months ahead fall to 5.4% in March – Citi/YouGov survey
The UK public's inflation expectations eased in March after edging a tad higher in February, a monthly survey conducted by Citi and YouGov showed on Monday.
Key takeaways
British public expectations for five to 10 years ahead slipped to 3.7% in March from 3.8% in February, still above the 3.0% to 3.4% range seen before the COVID-19 pandemic.
For 12 months ahead, the UK public inflation expectations eased to 5.4% in March from 5.6% in February.
Market reaction
GBP/USD is off the lows but remains pressured below 1.2300 amid the encouraging survey findings, which back the case for a Bank of England (BoE) rate hike pause. The pair is trading at 1.2290, down 0.34% on the day, as of writing.
-
07:49
GBP/USD now faces some consolidation in the short term – UOB
Markets Strategist Quek Ser Leang and Senior FX Strategist Peter Chia at UOB Group now see GBP/USD navigating within the 1.2190/1.2380 range in the next few weeks.
Key Quotes
24-hour view: “We highlighted that last Friday that ‘the chance of GBP breaking above 1.2400 is on the high side’. We added, ‘the next resistance at 1.2450 is a significant level and might not be easy to breach’. While our view was not wrong as GBP rose above 1.2400 (high of 1.2423), we did not anticipate the sharp drop from the high. GBP could continue to decline today but oversold conditions suggest it might not be able to maintain a foothold below 1.2260. Resistance is at 1.2330, a breach of 1.2355 would indicate that the current downward pressure has eased.”
Next 1-3 weeks: “Last Friday (31 Mar, spot at 1.2385), we held the view that GBP ‘is likely to head higher to 1.2450’. GBP rose to a high of 1.2423 and then dropped sharply from the high. In early Asian trade today, it took out our ‘strong support’ level of 1.2300. The breach of 1.2300 indicates that GBP is not strengthening further. While the immediate pressure is on the downside, we view any decline as part of a 1.2190/1.2380 range. In other words, we do not expect a clear break below 1.2190.”
-
07:45
France Budget Balance: €-52.32B (February) vs previous €-21.148B
-
07:44
Gold Futures: Extra decline appears not favoured
Open interest in gold futures markets resumed the downtrend and shrank by nearly 20K contracts on Friday according to preliminary readings from CME Group. Volume followed suit and dropped for the fifth session in a row, this time by around 16.8K contracts.
Gold: The $1935 region emerges as a decent support
Friday’s pullback in gold prices was on the back of shrinking open interest and volume and hints at the idea that a deeper retracement seems unlikely in the very near term. On the downside, the precious metal is expected to meet decent contention around $1935 region per ounce troy for the time being.
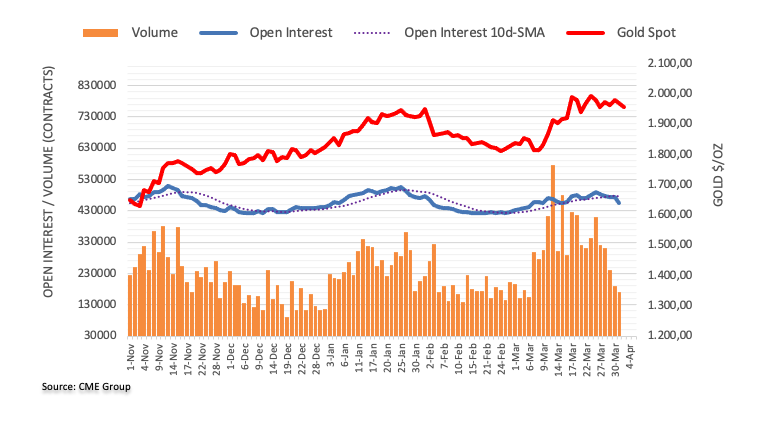
-
07:36
EUR/USD: Decline could extend to 1.0755 – UOB
In the opinion of Markets Strategist Quek Ser Leang and Senior FX Strategist Peter Chia, further losses could drag EUR/USD back to the mid-1.0700s in the near term.
Key Quotes
24-hour view: “We expected EUR to break 1.0930 last Friday. Our view was incorrect as EUR dropped sharply from 1.0925 to 1.0835. EUR continues to decline in early Asian trade and downward momentum is building rapidly. EUR could decline further even though the major support at 1.0755 is unlikely to come under threat today. Resistance is at 1.0835, followed by 1.0860.”
Next 1-3 weeks: “Last Friday (31 Mar, spot at 1.0905), we held the view that EUR ‘is likely to strengthen to 1.0970’. EUR rose to 1.0925 and then fell sharply. EUR continues to fall in early Asian trade and took out our ‘strong support’ level of 1.0820. Upward momentum has dissipated. The current price actions are likely part of a corrective pullback. The pullback could extend to 1.0755; the odds of a move to 1.0715 are not high for now. On the upside, the ‘strong resistance’ level at 1.0890 is likely to hold, at least for the next couple of days.”
-
07:35
FX option expiries for Apr 3 NY cut
FX option expiries for Apr 3 NY cut at 10:00 Eastern Time, via DTCC, can be found below.
- EUR/USD: EUR amounts
- 1.0850-55 672m
- 1.0900 1.1b
- 1.1000-10 1.1b)
- USD/JPY: USD amounts
- 128.00 1.5b
-
07:33
WTI crude oil pares OPEC+ led gains above $79.00 amid sluggish markets
- WTI crude oil retreats from nine-week high as energy markets stabilize after week-start jump.
- OPEC+ shocks Oil traders with a surprise output, US National Security Council criticizes the move.
- Downbeat Fed bets, mixed US data also challenge Oil price to pare the biggest daily gains in a year.
- US PMIs, jobs report will be crucial for clear directions.
WTI crude oil buyers take a breather, following the biggest jump since March 2022, as traders reassess the OPEC+ led moves ahead of the key US PMIs and jobs report during early Monday. With this, the black gold prints nearly 4.85% intraday gains around $79.40 by the press time.
It’s worth noting that downbeat prints of manufacturing numbers from China and Japan join the recently firmer US Dollar to challenge the WTI crude oil buyers. On the same line could be US President Joe Biden’s readiness for further release of Oil from the Strategic Petroleum Reserve (SPR) to tame the energy price run-up.
That said, the Organization of the Petroleum Exporting Countries (OPEC) and its allies led by Russia, known as OPEC+, announced a 1.16 million barrels per day of an output cut. The same renews inflation fears and allows the yields to pare recent losses.
On the same line could be the downbeat China Caixin Manufacturing PMI and Japan’s Tankan Large Manufacturing Index for the first quarter (Q1) of 2023, a closely observed output guide by the Bank of Japan (BoJ), which eased to 1.0 from 7.0 previous readings and 3.0 expected.
It should be observed that the fears of warmer weather in the West and fears of some more rate hikes from the top-tier central banks before they welcome the doves seem to also exert downside pressure on the WTI crude oil prices.
Looking forward, multiple top-tier central bank events and inflation numbers are up for publishing and can join Friday’s US jobs report to entertain Oil traders.
Technical analysis
A clear upside break of the 10-week-old descending resistance line surrounding $80.00, as well as a downward-sloping trend line from early November near $78.30, become necessary for the WTI crude oil buyers to keep the reins.
-
07:31
Sweden Purchasing Managers Index Manufacturing (MoM) below forecasts (45.9) in March: Actual (45.7)
-
07:31
Australia RBA Commodity Index SDR (YoY) above expectations (-9.3%) in March: Actual (-9.1%)
-
07:30
Switzerland Consumer Price Index (MoM) came in at 0.2%, below expectations (0.4%) in March
-
07:30
Switzerland Consumer Price Index (YoY) came in at 2.9%, below expectations (3.2%) in March
-
07:30
USD/INR: Rupee unlikely to appreciate significantly this year – ANZ
The Rupee could remain rangebound, tied to global risk mood swings and the RBI’s intervention, economists at ANZ Bank report.
Lower oil prices and narrowing trade deficit could keep INR supported over the medium term
“The Rupee remains tied to global risk sentiment, and financial flows have exhibited weakness amid market uncertainty.”
“Near-term turbulences aside, lower crude oil prices and a narrowing trade deficit could keep INR supported over the medium term. However, we expect limited appreciation in INR this year despite a softer Dollar because once inflows resume, the RBI will prefer to build back its FX reserves, a large part of which it expended in 2022.”
“On a REER basis, the Rupee also looks fairly valued.”
-
07:24
EUR/USD adds to recent losses and breaches 1.0800 ahead of data
- EUR/USD debilitates below the 1.0800 support on Monday.
- The greenback remains firm and climbs to multi-day highs.
- Final Manufacturing PMIs, ISM Manufacturing PMI next of note.
The single currency starts the new trading week on the defensive and drags EUR/USD back below the 1.0800 mark, or 5-day lows.
EUR/USD looks at data, ECB
EUR/USD retreats for the second session in a row and revisits the sub-1.0800 region at the beginning of the week amidst the continuation of the strong recovery in the dollar and a so far tepid bounce in US yields.
In the meantime, recent hawkish comments from Fed’s policymakers seem to have supported the upside momentum in the buck, putting the pair under pressure despite Friday’s PCE results showed the disinflation remains well in place in the US economy.
Later in the session, final Manufacturing PMIs are due on both sides of the Atlantic along with the key US ISM Manufacturing, Construction Spending and the speech by FOMC’s L.Cook (permanent voter, centrist).
What to look for around EUR
EUR/USD drops to multi-session lows below the 1.0800 mark amidst further weakness in the risk complex and the persistent risk-off trade.
In the meantime, price action around the single currency should continue to closely follow dollar dynamics, as well as the incipient Fed-ECB divergence when it comes to the banks’ intentions regarding the potential next moves in interest rates.
Moving forward, hawkish ECB-speak continue to favour further rate hikes, although this view appears in contrast to some loss of momentum in economic fundamentals in the region.
Key events in the euro area this week: Germany, EMU Final Manufacturing PMI (Monday) – Germany Balance of Trade, ECB Consumer Expectations Survey (Tuesday) - Germany, EMU Final Services PMI (Wednesday) – Germany Construction PMI (Thursday).
Eminent issues on the back boiler: Continuation, or not, of the ECB hiking cycle. Impact of the Russia-Ukraine war on the growth prospects and inflation outlook in the region. Risks of inflation becoming entrenched.
EUR/USD levels to watch
So far, the pair is retreating 0.34% at 1.0805 and faces the next contention at 1.0737 (55-day SMA) seconded by 1.0712 (low March 24) and finally 1.0654 (100-day SMA). On the upside, a break above 1.0929 (monthly high March 23) would target 1.1032 (2023 high February 2) en route to 1.1100 (round level).
-
07:16
USD/MXN Price Analysis: Licks its wounds around 18.00 within falling wedge
- USD/MXN remains pressured near three-week low, stays within fortnight-old bullish chart pattern.
- Oversold RSI, mildly upbeat MACD signals suggest that Mexican Peso pair bears are running out of steam.
- Multi-month low marked in March puts a floor under the USD/MXN prices.
USD/MXN struggles to push back the bears as it seesaws around the 18.00 round figure headlines into Monday’s European session.
In doing so, the Mexican Peso (MXN) pair pokes a one-week-old descending resistance line while staying inside a fortnight-long falling wedge bullish chart pattern.
It’s worth noting that the overbought RSI (14) and the recently bullish MACD signals tease short-term USD/MXN buyers. However, the aforementioned resistance line, close to 18.05 by the press time, precedes the stated wedge’s top line, near 18.15 at the latest, restricting the short-term upside of the pair.
In a case where the USD/MXN pair remains firmer past 18.15, the 200-SMA level of 18.40 can act as the last check for the bulls on their way to achieving the theoretical target of the falling wedge breakout, namely around 19.40.
That said, the previous monthly high of 19.23 also acts as an extra filter towards the north.
On the other hand, the falling wedge’s lower line near 17.94 puts a floor under the USD/MXN price ahead of the previous monthly low, also the lowest level since September 2017, close to 17.89.
In a case where USD/MXN remains bearish past 17.89, the July 2017 low near 17.45 may lure the bears.
Overall, USD/MXN stays inside a bullish chart pattern but the buyers need validation from 18.15 to retake the control.
USD/MXN: Four-hour chart
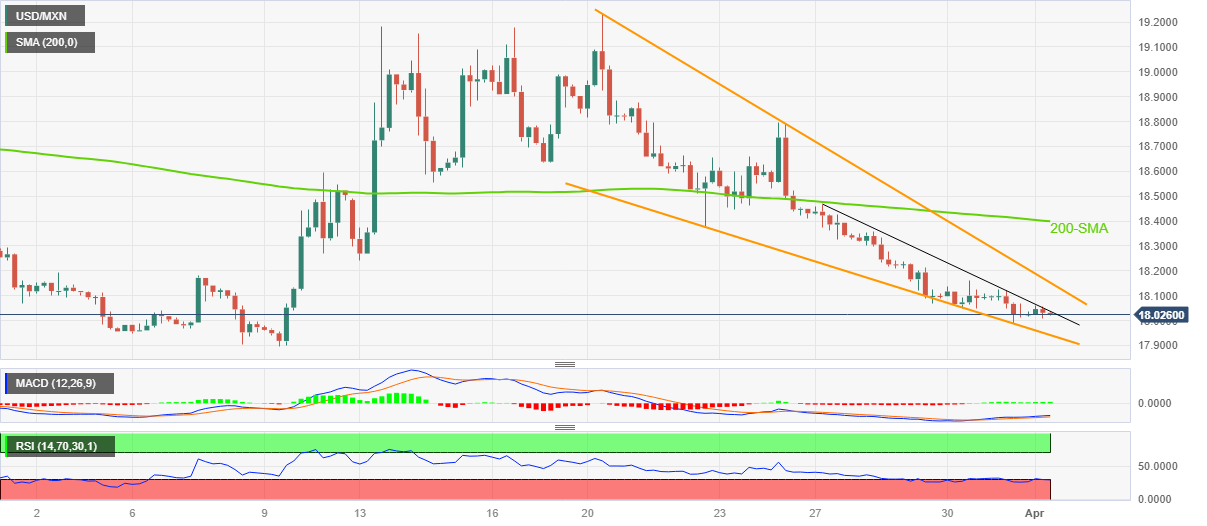
Trend: Limited downside expected
-
07:14
Japan's PM Kishida: Country’s financial system is generally stable
“Japan's financial system is generally stable,” the country’s Prime Minister Fumio Kishida said in a statement on Monday.
PM Kishida said, “we are to pay close attention to foreign and domestic markets.”
Market reaction
USD/JPY was last seen trading at 133.67, adding 0.67% on the day.
-
07:12
AUD/USD finds intermediate cushion near 0.6660, US PMI and RBA policy highs limelight
- AUD/USD has built an intermediate cushion near 0.6660, further downside looks likely.
- Federal Reserve is expected to remain hawkish as higher oil prices have propelled US inflation expectations.
- Reserve Bank of Australia is expected to hike rates further to 3.80% as inflation is extremely skewed from desired levels.
- AUD/USD has delivered a breakdown of the Head and Shoulder chart pattern whose neckline was placed from 0.6660.
AUD/USD has gauged an intermediate cushion around 0.6660 after a downside move in the Asian session. The Aussie asset has attempted a decent recovery but is likely to remain on the tenterhooks as investors are awaiting the release of United States ISM Manufacturing PMI data for fresh impetus. The Australian Dollar would face enormous volatility as investors are preparing for the interest rate decision by the Reserve Bank of Australia (RBA), which will be announced on Tuesday.
S&P500 futures are auctioning in a negative trajectory in the early European session amid higher oil prices propelled by fears of further oil production cuts by OPEC+, portraying a risk-aversion theme. The burden of higher oil prices will be transferred to producers, which will force them to hike the prices of offerings at factory gates. Eventually, households would be the major victim, which might result in weaker retail demand.
The demand for US government bonds has tumbled amid fresh fears of a rebound in global inflation inspired by higher oil prices. The 10-year US Treasury yields have scaled to near 3.52%.
US Dollar scales higher as Federal Reserve to remain hawkish ahead
A bumper upside move has been recorded in the US Dollar as heightened oil prices are likely to share serious consequences ahead. Various economies were struggling to get on track after a year of stubborn inflation. And now higher oil prices are expected to weaken the efforts yet made to tame sticky inflation. This has supported the US Dollar as the Federal Reserve (Fed) would look for continuing its policy-tightening program to neutralize oil-inspired inflationary pressures. As per the CME Fedwatch tool, the odds for a 25bp rate hike to 5.00-5.25% for May monetary policy meeting have soared above 61%.
Going forward, the US ISM Manufacturing PMI data will keep investors busy. According to the consensus, the Manufacturing PMI is expected to decline marginally to 47.5 from the former release of 47.7. Investors should be aware that the US Manufacturing PMI has remained below 50.0 consecutively in the past four months.
From the US Manufacturing PMI gamut, New Orders Index would hog the limelight as it provides cues about the manufacturing outlook. The forward demand for the manufacturing sector is expected to contract significantly to 44.6 vs. the prior release of 47.00.
One more 25 bps rate hike looks likely from Reserve Bank of Australia
The Australian Dollar remained volatile in the Asian session after the IHS Markit reported weak Caixin Manufacturing PMI data. The economic data has landed at 50.0, lower than the consensus of 51.7 and the former release of 51.5. Being the leading trading partner of China, the Australian Dollar was impacted by a decline in the scale of manufacturing activities in the Chinese economy.
For now, the spotlight has shifted to the interest rate decision by the Reserve Bank of Australia, which will be announced on Tuesday. Reserve Bank of Australia Governor Philip Lowe is expected to hike rates further by 25 basis points (bps) to 3.80%. Australian monthly inflation indicator has softened to 6.8% in February from its peak of 8.4% recorded in December. The presence of evidence conveying a sharp drop in Australian inflation won’t be sufficient to force RBA policymakers to go steady on interest rates.
AUD/USD technical outlook
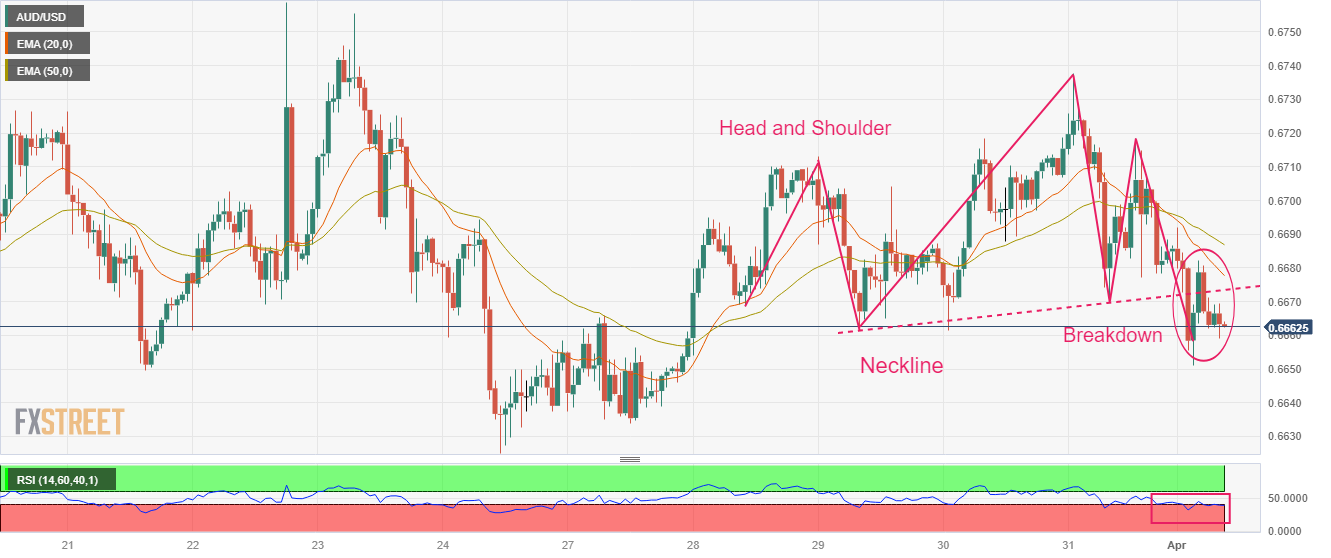
AUD/USD has delivered a breakdown of the Head and Shoulder chart pattern, which indicates an explosion of the prolonged consolidation and results in a bearish reversal, formed on an hourly scale. The neckline of the chart pattern is plotted from March 29 low at 0.6661 has been smashed.
A bear cross, represented by the 20-and 50-period Exponential Moving Average (EMA) at 0.6696 indicated more weakness ahead.
The Relative Strength Index (RSI) (14) has dropped into the bearish range of 20.00-40.00, showing no signs of divergence and no evidence of an oversold situation.
-
07:00
Russia S&P Global Manufacturing PMI dipped from previous 53.6 to 53.2 in March
-
07:00
Asian Stock Market: Trades mixed as NFP week begins with OPEC+ surprise
- Asia-Pacific equities grind lower as OPEC+ output cut renew inflation fears.
- Downbeat manufacturing numbers from Japan, China also challenge sentiment amid firmer yields.
- Pre-NFP consolidation allows US Dollar to remain firmer, WTI rose past $81.00 before paring gains to 4.50% intraday run-up.
Market sentiment in the Asia-Pacific region remains mixed as traders struggle to cheer receding hawkish Fed bets amid fresh inflation fears emanating from the Organization of the Petroleum Exporting Countries (OPEC) and its allies led by Russia, known as OPEC+. However, the mixed data at home and anxiety ahead of top-tier US jobs reports keep the buyers hopeful of late.
While portraying the mood, the MSCI’s index of Asia-Pacific shares outside Japan drops 0.60% intraday but Japan’s Nikkei 225 prints 0.50% intraday gains around 28,190 by the press time. On a broader front, the S&P 500 Futures snapped a three-day uptrend near the highest levels since mid-February while the US 10-year and two-year Treasury bond yields print mild gains near 3.52% and 4.11% respectively.
OPEC+ surprised markets by announcing 1.16 million barrels per day of output cut. The same renews inflation fears and allows the yields to pare recent losses. On the same line could be the downbeat China Caixin Manufacturing PMI and Japan’s Tankan Large Manufacturing Index for the first quarter (Q1) of 2023, a closely observed output guide by the Bank of Japan (BoJ), which eased to 1.0 from 7.0 previous readings and 3.0 expected.
With this, stocks in China join Indonesia’s IDX Composite, South Korea’s KOSPI and India’s BSE Sensex to print mild losses.
It’s worth noting that Australia’s TD Securities Inflation eased to 0.3% MoM and 5.7% YoY for March versus 0.4% and 6.3% respective priors, which in turn joins the previous week’s downbeat inflation and Retail Sales figures from the Pacific major to strengthen the dovish bias for the Reserve Bank of Australia’s (RBA) next move. As a result, Australia’s ASX prints mild gains of around 7,215 by the press time.
It’s worth noting that the shares in New Zealand remain downbeat as the latest New Zealand Institute of Economic Research (NZIER) report expects 0.25% rate hike to tame inflation woes.
Moving on, multiple top-tier central bank events and inflation numbers are up for publishing in the Asia-Pacific region during this week, which in turn can join Friday’s US jobs report to offer active days ahead.
Also read: S&P 500 Futures drop, yields grind higher as OPEC+ surprise renews inflation fears
-
06:59
Gold Price Forecast: XAU/USD to drop further on a daily close below critical support at $1,961
Gold price kicks off the week on the wrong foot. Daily close below the critical rising trendline support, now at $1,961, would trigger a fresh downswing, FXStreet’s Dhwani Mehta reports.
Tide turns in favor of XAU/USD bears
“Gold bears need a daily candlestick closing below critical rising trendline support at $1,961 to confirm a downside break from a two-week-old pennant formation. If that materializes, then a fresh downswing toward the previous week’s low of $1,944 cannot be ruled out. Further south, the static support at $1,935 will come into play.”
“In case the Gold price recovery is initiated, bulls will need to recapture the aforesaid trendline support at $1,961 on a sustained basis. The next upside target is seen at the $1,970 round figure. The falling trendline resistance at $1,993 will be a tough nut to crack for Gold optimists.”
-
06:35
USD/JPY marches to 133.50 as yields, US Dollar recover ahead of NFP
- USD/JPY renews intraday high near the highest levels in two weeks.
- Yields grind higher as OPEC+ renew inflation woes; US Dollar cheers pre-NFP rebound.
- Japan’s Tankan Large Manufacturing Index eased in Q1, Jibun Bank Manufacturing PMI improved in March.
- US PMIs, ADP data can entertain traders ahead of Friday’s jobs report.
USD/JPY takes the bids to refresh intraday high near 133.50 as bulls keep the reins after witnessing the first weekly gain in five.
The Yen pair’s latest gains could be linked to the firmer US Treasury bond yields, as well as the US Dollar, as markets await the all-important Nonfarm Payrolls (NFP), up for publishing on Friday. Adding strength to the USD/JPY pair’s run-up could be the latest challenges to the sentiment, mainly emanating from the Organization of the Petroleum Exporting Countries (OPEC) and its allies led by Russia, known as OPEC+. However, the mixed data at home and anxiety ahead of top-tier US statistics challenge the pair buyers of late.
Japan’s Tankan Large Manufacturing Index for the first quarter (Q1) of 2023, a closely observed output guide by the Bank of Japan (BoJ), eased to 1.0 from 7.0 previous readings and 3.0 expected. On the other hand, Japan’s Jibun Bank Manufacturing PMI for March improved to 49.2 from 48.6 previous. However, the below-50 figure suggests a contraction in private manufacturing activities.
On the other hand, the US Core Personal Consumption Expenditures (PCE) Price Index, the Fed’s preferred gauge of inflation, declined to 4.6% YoY in February from 4.7% expected and prior. On a monthly basis, Core PCE inflation rose 0.3% while easing below the market expectation of 0.4% and a downwardly revised 0.5% previous reading.
It’s worth observing that the receding hawkish calls surrounding the Bank of Japan (BoJ) also favor USD/JPY buyers. However, the recent easing calls of the Fed’s hawkish moves, as well as easing fears of the banking crisis, seem to gain little attention.
Against this backdrop, Japan’s Nikkei 225 rises 1.0% intraday to 28,041 by the press time but the S&P 500 Futures snapped a three-day uptrend near the highest levels since mid-February.
On the other hand, the US 10-year and two-year Treasury bond yields print mild gains near 3.52% and 4.11% while paring the latest losses. It should be noted that the benchmark US 10-year Treasury bond yields dropped for the past three weeks and the past three consecutive days.
Looking ahead, USD/JPY is likely to extend the latest rebound amid a light calendar and firmer yields. However, receding hawkish bets on the Fed may weigh on the US Dollar prices should the incoming PMIs and Nonfarm Payrolls (NFP) disappoint the greenback buyers.
Technical analysis
An upside break of 50-DMA, close to 133.00 at the latest, joins bullish MACD signals and firmer RSI (14), not overbought to direct USD/JPY buyers towards the 100-DMA hurdle of around 133.85.
-
06:21
GBP/USD Price Analysis: Bumpy ride ahead on a break of structure below 1.2300
- GBP/USD has faced barricades near 1.2300 after an attempt of recovery.
- S&P500 futures are holding onto losses generated in the Asian session, portraying a cautious market mood.
- The USD Index has refreshed its weekly high above 103.00 as higher US inflation expectations were prompted by upbeat oil prices.
The GBP/USD pair has slipped sharply below the round-level support of 1.2300 in the Asian session. The Cable went through turbulent times as investors shifted their funds into the US Dollar Index (DXY) in hopes that the Federal Reserve (Fed) will hike rates further dramatically.
The USD Index has refreshed its weekly high above 103.00 as higher United States inflation expectations were prompted by upbeat oil prices. Acceleration in the oil price is expected to fuel inflationary pressures as producers would offset the impact of costly oil by hiking prices of goods and services at factory gates.
S&P500 futures are holding onto losses generated in the Asian session, portraying a cautious market mood. The cable is expected to face sheer volatility ahead of the US ISM Manufacturing PMI data. The economic data provide cues about forward demand for goods, which is likely to contract firmly to 44.6 vs. the prior release of 47.00. Subdued consensus for the US Manufacturing PMI could be the outcome of higher interest rates by the Fed for bringing down persistent inflation.
GBP/USD started declining after observing the presence of responsive sellers around March 31 high at 1.2424. The higher High Higher Low structure in the GBP/USD pair has broken after slipping below March 30 low around 1.2300 and the Cable is expected to attract more downside bets ahead.
The Cable has also slipped firmly below the 20-and 50-period Exponential Moving Averages (EMAs) at 1.2327 and 1.2300 respectively, which indicates that the short-term trend has turned bearish.
Also, the Relative Strength Index (RSI) (14) has slipped into the bearish range of 20.00-40.00, which indicates that the downside momentum has been triggered.
Going forward, a break below March 23 low at 1.2261 will accelerate the downside in the Cable toward the round-level support at 1.2200 and March 10 high at 1.2113.
Alternatively, a move above March 29 high at 1.2362 would drive the Cable toward March 31 high at 1.2424 followed by the psychological resistance at 1.2500.
GBP/USD four-hour chart
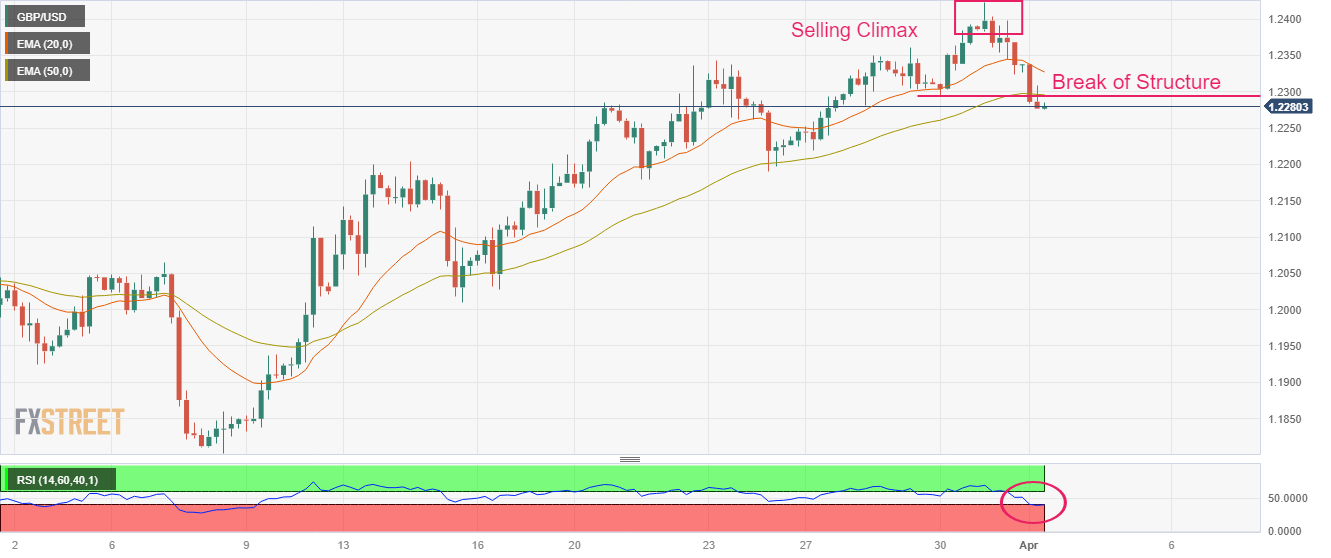
-
06:05
USD/IDR Price News: Rupiah slips from two-month high to 15,000 on downbeat Indonesia inflation
- USD/IDR rebounds from the lowest levels since early February, snaps five-day downtrend.
- Indonesia Inflation eases in March to 4.97% YoY versus 5.17% expected, 5.47% prior.
- US Dollar cheers risk-off mood as the NFP week begins.
- Receding hawkish Fed bets prod pair buyers; focus on US PMIs, jobs report.
USD/IDR prints the first daily gains in six around the 15,000 mark as softer Indonesia inflation numbers join the US Dollar’s rebound during early Monday. Adding strength to the Indonesia Rupiah (IDR) pair is the broad risk-off mood amid inflation woes, as well as anxiety ahead of Friday’s US employment report for May.
Indonesia Inflation drops to 4.97% YoY in March from 5.47% previous readings and 5.17% market forecasts. Further, the Core Inflation also declined during the stated month, to 2.94% versus 3.05% analysts’ estimations and 3.09% prior. It’s worth noting that the Inflation figures on monthly basis rose to 0.18% from 0.16% marked in February but lagged behind 0.29% consensus.
It’s worth noting that the fresh fears of higher inflation, mainly emanating from a surprise Oil output cut from the Organization of the Petroleum Exporting Countries (OPEC) and its allies led by Russia, known as OPEC+, weigh on market sentiment and propel the USD/IDR pair. The OPEC+ group announced nearly 1.16 million barrels per day output cut in a surprise move during the week. In doing so, the Oil cartel propels fears of more price pressure and hawkish central bank moves. Following the OPEC+ news, the US National Security Council said. “We don’t think cuts are advisable at this moment given market uncertainty - and we’ve made that clear."
Not only the OPEC+ moves but downbeat China PMI also favor the market’s risk-off mood and allow the US Dollar to the three-week downtrend. That said, China’s Caixin Manufacturing PMI for March drops to 50.0 from 51.6 prior and 51.7 market forecasts.
On the contrary, mixed US data and the Federal Reserve (Fed) policymakers’ inability to convince markets of their hawkish capacity join the easing fears of banking fallouts to exert downside pressure on the USD/IDR pair.
Against this backdrop, the S&P 500 Futures retreat from a 1.5-month high while printing the first daily loss in four, down 0.30% intraday near 4,125 by the press time. On the other hand, the US 10-year and two-year Treasury bond yields print mild gains near 3.52% and 4.11% while paring the latest losses.
Looking forward, US ISM Manufacturing PMI and S&P Global Manufacturing PMI for March can direct intraday moves but major attention should be given to Friday’s US Nonfarm Payrolls (NFP).
Technical analysis
A 13-day-old resistance line, around 15,015 by the press time, restricts the immediate upside of the USD/IDR pair, which in turn suggests another attempt to break an eight-month-old support line, close to 14,950 by the press time.
-
06:02
Netherlands, The Markit Manufacturing PMI declined to 46.4 in March from previous 48.7
-
05:36
Gold Price Forecast: XAU/USD sets for a breakdown below $1,950 as USD Index refreshes weekly high
- Gold price is likely to deliver a break below $1,950.00 amid rising hawkish Fed bets.
- The USD Index has printed a fresh weekly high above 103.00 as US inflation looks set for a rebound.
- Gold price has delivered a breakdown of the volatility contraction pattern.
Gold price (XAU/USD) is hovering near the edge of $1,950.00 after a sheer sell-off in the Asian session. The Gold price is expected to extend its losses as higher oil prices after OPEC+ decision of contracting production has renewed fears of a rebound in the United States inflation. Higher oil prices are likely to force factory owners to hike the prices of goods and services at factory gates, which will propel the Producer Price Index (PPI). Eventually, the US inflationary pressures would be fueled significantly.
The context of higher inflation expectations has infused fresh blood into the US Dollar Index (DXY). The USD Index has refreshed its weekly high above 103.00 as investors believe that the Federal Reserve (Fed) won’t have another alternative than to trigger rates higher. Fed Chair Jerome Powell might announce one more 25 basis points (bps) rate hike in May and will push rates above 5%.
Another catalyst that is weighing heavily on the Gold price is the easing of US banking jitters. Investors have digested the short-term panic produced after the collapse of three mid-size banks and hope that no further casualty will emerge ahead.
Meanwhile, S&P500 futures are failing to recover losses generated in the morning session as higher oil prices are likely to result in higher operating costs for oil-dependent firms. The alpha generated on 10-year Us Treasury yields has jumped above 3.52%.
Gold technical analysis
Gold price has delivered a breakdown of the Symmetrical Triangle chart pattern formed on an hourly scale. A breakdown of the aforementioned chart pattern results in wider ticks and heavy volatility as volatility gets exploded quickly.
The upward-sloping trendline of the Symmetrical Triangle plotted from the March 22 low at $1,934.34 will act as a major barricade for the Gold bulls.
The declining 21-period Exponential Moving Average (EMA) at $1,966.20 indicates more weakness ahead.
Adding to that, the Relative Strength Index (RSI) (14) has slipped into the bearish range of 20.00-40.00, which indicates that the downside momentum has been triggered.
Gold hourly chart
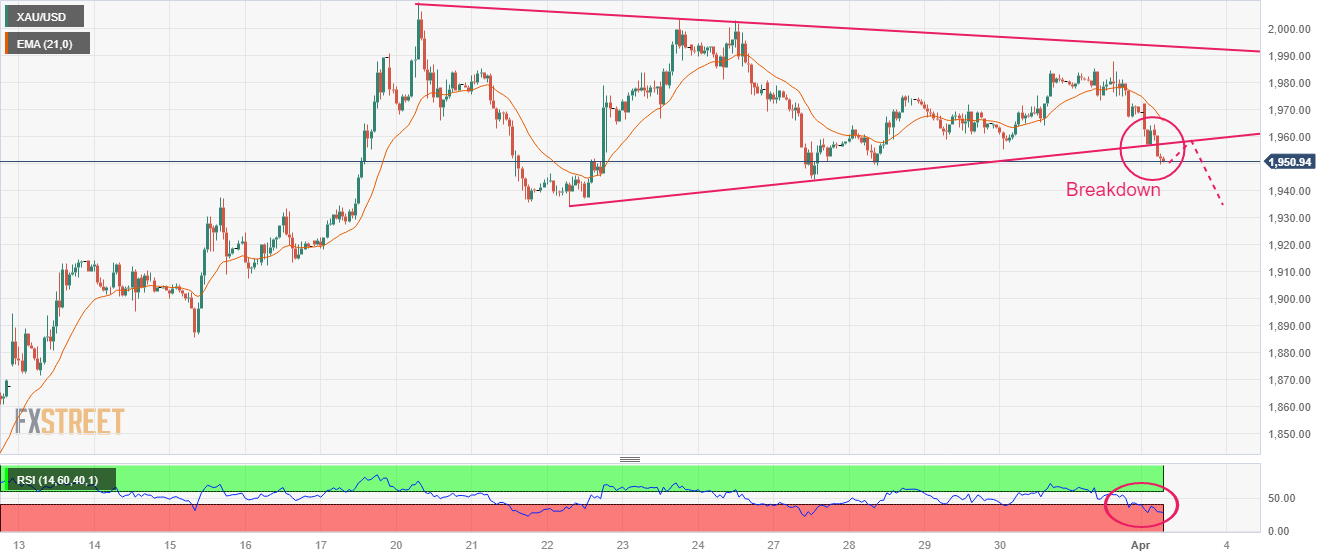
-
05:18
Indonesia Core Inflation (YoY) below forecasts (3.05%) in March: Actual (2.94%)
-
05:05
Indonesia Inflation (MoM) below forecasts (0.29%) in March: Actual (0.18%)
-
05:05
Indonesia Inflation (YoY) registered at 4.97%, below expectations (5.17%) in March
-
04:56
USD/INR Price Analysis: Indian Rupee sellers need validation from 82.55
- USD/INR extends the previous day’s rebound from 10-week-old ascending support line.
- Upside break of 200-SMA, firmer but not overbought RSI favor Indian Rupee sellers.
- Convergence of 13-day-old resistance line, 23.6% Fibonacci retracement challenges USD/INR bulls.
USD/INR prints the biggest daily gains in more than two weeks as it rises to 82.45 during early Monday.
In doing so, the Indian Rupee (INR) pair justifies the previous day’s rebound from a 2.5-month-long ascending support line while crossing the 200-bar Simple Moving Average (SMA).
It’s worth noting that the firmer RSI (14) line, not overbought, also underpins the bullish bias about the USD/INR pair.
However, a convergence of the downward-sloping resistance line from mid-March joins the 23.6% Fibonacci retracement level of the pair’s January-February upside to highlight the 82.55 level as a tough nut to crack for the USD/INR bulls.
Should the Indian Rupee pair remains firmer past 82.55 hurdle, a quick run-up toward the 83.00 round figure can’t be ruled out. Though, the yearly high of around 83.10, as well as the record top of 83.42 marked in October 2022, could challenge the pair’s further upside.
Alternatively, pullback moves remain elusive unless the quote offers decisive trading below the 200-bar SMA level surrounding 82.40.
Even so, the USD/INR bears are likely to remain cautious beyond the aforementioned multi-day-old support line, close to 82.10 by the press time.
In a case where the Indian Rupee buyers break the 82.10 support, the odds of witnessing a slump toward the 61.8% Fibonacci retracement level and then toward the previous monthly low, respectively near 81.70 and 81.50, can be expected.
USD/INR: Four-hour chart
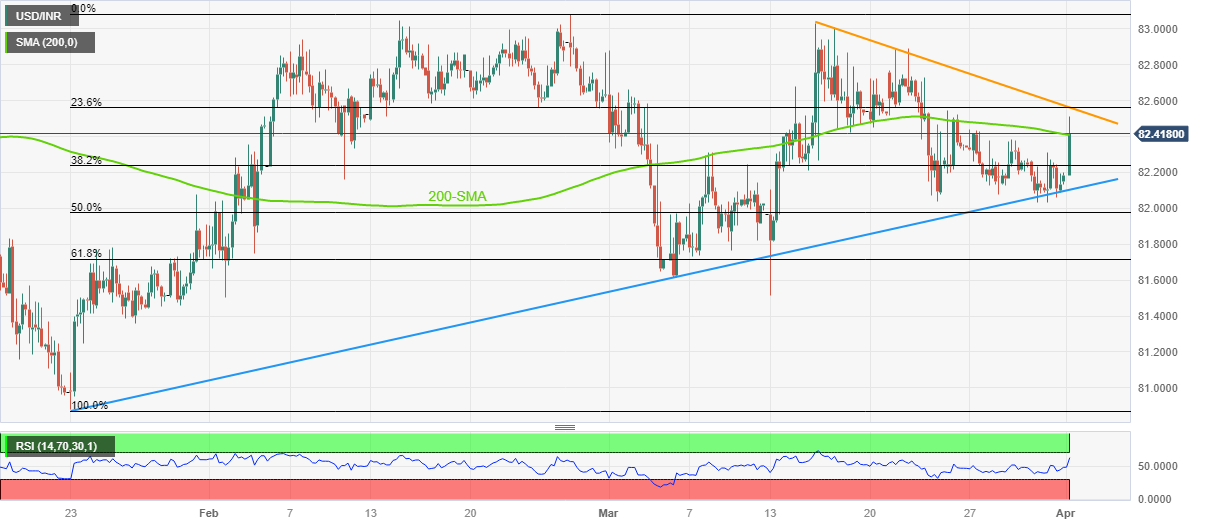
Trend: Limited upside expected
-
04:36
Natural Gas fails to trace firmer Oil price, renews 33-month low near $2.13
- Natural Gas drops to the fresh low since August 2020, grinds near multi-day bottom of late.
- XNG/USD drops as US Dollar cheers fresh risk-off mood, pre-NFP anxiety to pare recent losses.
- Downbeat China Caixin Manufacturing PMI adds strength to bearish bias.
Natural Gas (XNG/USD) price ignores the Oil’s rally and drops to a fresh 33-month low around $2.13 during early Monday. The energy instrument’s latest weakness could be linked to concerns surrounding warmer weather in the West, as well as the US Dollar’s latest rebound ahead of the key jobs report for March.
That said, the Organization of the Petroleum Exporting Countries (OPEC) and its allies led by Russia, known as OPEC+, renewed inflation woes by announcing a surprise 1.16 million barrels per day of an output cut. With this, the traders may reassess the previous optimism suggesting easy inflation days to come, which in turn favors the central policymakers to defend their hawkish bias and allow the US Dollar to lick its wounds. That said, the US Dollar Index (DXY) is by 0.33% intraday near 102.32 by the press time.
Not only the OPEC+ induced inflation fears and the firmer US dollar but the downbeat PMI data from China also weighed on the XNG/USD prices.
As per the latest readings, China’s Caixin Manufacturing PMI for March drops to 50.0 from 51.6 prior and 51.7 market forecasts.
On a different page, talks of warmer weather in the West joins more gas supplies from Germany also exert downside pressure on the XNG/USD prices.
Amid these plays, the Natural Gas price may remain pressured toward the levels marked in the year 2020 surrounding $1.53. However, today’s US ISM Manufacturing PMI and S&P Global Manufacturing PMI for March can offer intraday directions to the commodity prices ahead of Friday’s US Nonfarm Payrolls (NFP).
Technical analysis
Unless crossing a two-month-old horizontal resistance area surrounding $2.40, the Natural Gas price becomes vulnerable to test the April 2020 high of $2.10 and then fall to the $2.00 psychological magnet.
-
04:17
EUR/USD Price Analysis: Bears appear well-set to prod 1.0730 support as NFP week begins
- EUR/USD extends pullback from 10-week-old horizontal resistance, renews intraday low of late.
- Downside break of 13-day-old support line, easing bullish bias of MACD signals add strength to bearish view.
- Convergence of 50-DMA, 21-DMA joins RSI (14) retreat to challenge EUR/USD bears.
- Receding hawkish hopes from Fed, recently mixed US data prod Euro pair sellers.
EUR/USD takes offers to renew intraday low around 1.0790 as it extends the previous U-turn from a short-term key hurdle during early Monday. Adding strength to the downside bias is the clear break of a two-week-old support line, now resistance, as well as the receding bullish bias of the MACD. It should be observed that the RSI (14) line retreats towards the 50 level, which in turn suggests further grinding towards the south.
Hence, the EUR/USD price is well-set to test the 1.0730 support confluence including the 50-DMA and 21-DMA as traders begin the key week.
Also read: EUR/USD sellers attack 1.0800 as risk aversion joins consolidation ahead of US PMI, NFP
In a case where the Euro pair remains weaker past 1.0730, the 1.0700 threshold may act as an intermediate halt before directing the major currency pair towards the previous monthly low surrounding 1.0520-15.
On the flip side, the support-turned-resistance line and the aforementioned horizontal resistance area, respectively near 1.0880 and 1.0930, challenge the EUR/USD pair buyers.
Following that, the 1.1000 psychological magnet may act as an intermediate halt before directing the Euro bulls towards the February 2023 high of around 1.1035.
Overall, EUR/USD is likely to decline further but the downside room below 1.0730 appears limited.
EUR/USD: Daily chart
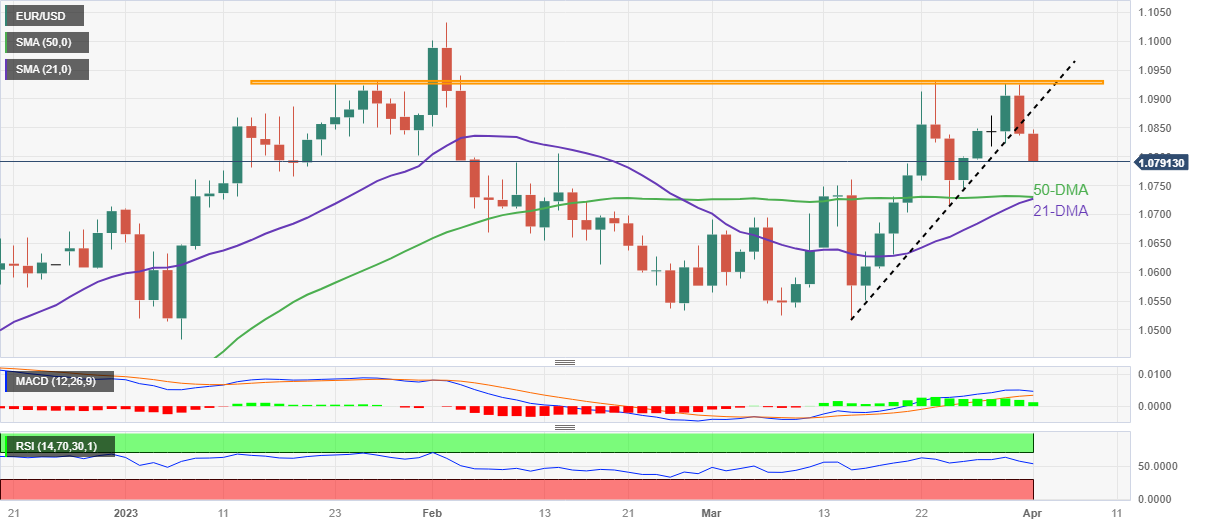
Trend: Limited downside expected
-
03:59
S&P 500 Futures drop, yields grind higher as OPEC+ surprise renews inflation fears
- Market sentiment sours as OPEC+ shocks traders with surprise output cut.
- Downbeat China PMI, Sino-American tension joins pre-NFP anxiety to weigh on risk appetite.
- S&P 500 Futures retreat from six-week high, snap three-day uptrend.
- US 10-year and two-year Treasury bond yields consolidate recent losses.
Risk profile fades the previous optimism as the all-important US jobs report week begins with negative news from the Organization of the Petroleum Exporting Countries (OPEC) and its allies led by Russia, known as OPEC+. Adding strength to the risk-off mood could be the downbeat China activity data, as well as recent hawkish comments from the Federal Reserve (Fed) officials.
While portraying the mood, the S&P 500 Futures retreat from a 1.5-month high while printing the first daily loss in four, down 0.30% intraday near 4,125 by the press time. On the other hand, the US 10-year and two-year Treasury bond yields print mild gains near 3.52% and 4.11% while paring the latest losses. It should be noted that the benchmark US 10-year Treasury bond yields dropped for the past three weeks and the past three consecutive days.
That said, the OPEC+ group announced nearly 1.16 million barrels per day of output cut in a surprise move during the week. In doing so, the Oil cartel propels fears of more price pressure and hawkish central bank moves. Following the OPEC+ news, the US National Security Council said. “We don’t think cuts are advisable at this moment given market uncertainty - and we’ve made that clear."
Elsewhere, China’s Caixin Manufacturing PMI for March drops to 50.0 from 51.6 prior and 51.7 market forecasts.
It should be noted that the recently hawkish comments from the Federal Reserve (Fed) officials and mixed US data also weigh on the market sentiment ahead of the key US employment report for March. That said, Federal Reserve Bank of Boston President Susan Collins and New York Fed President John C. Williams cited easing in inflation but highlighted the incoming data to determine the Fed’s next moves. Previously, Fed Chair Jerome Powell signaled one more rate hike but failed to offer a tailwind to the US Dollar Index (DXY), up 0.33% intraday near 102.32 by the press time.
Talking about the data, the US Core Personal Consumption Expenditures (PCE) Price Index, the Fed’s preferred gauge of inflation, declined to 4.6% YoY in February from 4.7% expected and prior. On a monthly basis, Core PCE inflation rose 0.3% while easing below the market expectation of 0.4% and a downwardly revised 0.5% previous reading. Further, the Chicago PMI reading for March was stronger than expected at 43.8pts, but this is still a relatively weak level and consistent with the slowing of the manufacturing sector in the US. On the same line, the final readings of the University of Michigan's (UoM) Consumer Confidence Index dropped to 62.0 in March, versus 63.4 flash estimations and 63.2 market forecasts. Current Economic Conditions fell from 70.7 in February to 66.3 and the Index of Consumer Expectations declined from 64.7 to 59.2.
The UoM report mentioned regarding inflation that the year-ahead expectations “receded from 4.1% in February to 3.6%, the lowest reading since April 2021, but remained well above the 2.3-3.0% range seen in the two years prior to the pandemic.” Five-year expectations came in at 2.9% for the fourth consecutive month.
Alternatively, receding fears of bank crisis join the easing hawkish bets on the Fed’s next moves to challenge the pessimists. As per the latest readings of CME’s FedWatch Tool, market players place nearly 45% probability on the 0.25% Fed rate hike in May, versus 52% marked on Friday.
Moving on, US ISM Manufacturing PMI and S&P Global Manufacturing PMI for March can direct intraday moves but major attention should be given to Friday’s US Nonfarm Payrolls (NFP).
Also read: Forex Today: Focus shifts to US employment data
-
03:57
Fonterra cuts farmgate milk price midpoint by 20 cents to $8.30/kgMS
Fonterra Cooperative Group Ltd., New Zealand’s dairy giant, announced on Monday, a reduction to its 2022/23 forecast farmgate milk price midpoint by 20 cents to $8.30/kgMS from $8.50, in part due to weaker-than-expected Chinese demand and and increased US and Eurozone milk production.
Key quotes
“Since our last update in February, prices for our products on Global Dairy Trade have either declined or remained flat.
“There are two main drivers behind this. The first is demand from China for whole milk powder has not yet returned to expected levels.”
“The second is Northern Hemisphere milk production, and therefore skim milk powder stocks, are increasing as they head into their Spring flush."
Market reaction
The above news could be partly attributed to steep losses in the NZD/USD pair alongside risk aversion. The pair was last seen trading at 0.6217, down 0.60% on the day.
-
03:40
USD/CHF faces barricades around 0.9170 ahead of US ISM PMI and Swiss Inflation data
- USD/CHF is facing hurdles near 0.9170 as the USD Index is having a smooth ride for a fresh weekly high.
- S&P500 futures have extended losses witnessed as investors could cut longs in equities due to a significant rise in the oil price.
- Higher inflation is weighing on the pockets of households, which could be impacting the retail demand.
The USD/CHF pair is sensing resistance near 0.9170 in the Asian session after a marginal recovery. The Swiss franc asset is expected to continue its downside journey as the US Dollar index (DXY) looks set to refresh its weekly high above 102.95 ahead. Rising expectations for a rebound in global inflation led by higher oil prices after the announcement of oil production cuts by OPEC+ has infused fresh blood into the USD Index.
S&P500 futures have extended losses witnessed in the Asian session on hopes that investors could cut longs in equities due to a significant rise in the oil price. United States equities are struggling to firm their feet, portraying a risk-aversion theme. The demand for US government bonds has been sluggish as the Federal Reserve (Fed) is expected to raise rates further. This has led to a rise in the yields offered on 10-year US Treasury bonds to 3.51%.
On Monday, the USD Index is expected to remain extremely volatile amid the release of the US ISM Manufacturing PMI (March) data. The consensus shows a marginal drop to 47.5 from the former release of 47.7. Other than the PMI figure, New Orders Index will be keenly watched. The forward-looking economic indicator for Manufacturing PMI is expected to contract dramatically to 44.6 vs. the prior release of 47.0. It seems that higher inflation is weighing on the pockets of households, which could be impacting the retail demand.
The Swiss Franc asset will remain in action ahead of Consumer Price Index (CPI) data. Inflationary pressures in the Swiss zone have remained higher and the Swiss National Bank (SNB) has already left room open for more rate hikes.
-
03:35
USD/CAD Price Analysis: Bears take a breather on their way to 1.3470 support
- USD/CAD pares intraday losses at the lowest levels in six weeks.
- Clear downside break of two-month-old ascending trend line, 100-DMA favor sellers.
- 61.8% Fibonacci retracement level lures sellers amid bearish MACD signals.
- Loonie pair buyers should remain cautious below 1.3650-55.
USD/CAD licks its wounds around 1.3500 after refreshing the 1.5-month low early Monday.
In doing so, the Loonie pair sellers take a breather after breaking the short-term key support line, now resistance, as well as the 100-DMA. Not only the DMA and support line break but the bearish MACD signals also keep the USD/CAD pair sellers hopeful.
That said, the quote is on the way to testing the 61.8% Fibonacci retracement level of its November 2022 to March 2023 upside, near 1.3470. However, the RSI (14) slides below the 50 level and suggest dip-buying at lower levels, which in turn can test the USD/CAD bears afterward.
Should the quote remains bearish past 1.3470, multiple levels around 1.3390 and 1.3320 can test the USD/CAD sellers before highlighting an upward-sloping support line from November 15, 2022, close to 1.3300 by the press time.
Meanwhile, the 100-DMA and the previous support line restrict short-term USD/CAD rebound near 1.3525 and 1.3565 in that order.
However, a horizontal area comprising multiple levels marked since late February 2023, near 1.3650-55, appears a tough nut to crack for the USD/CAD, a break of which could push back the bearish hopes, at least for a while
USD/CAD: Daily chart
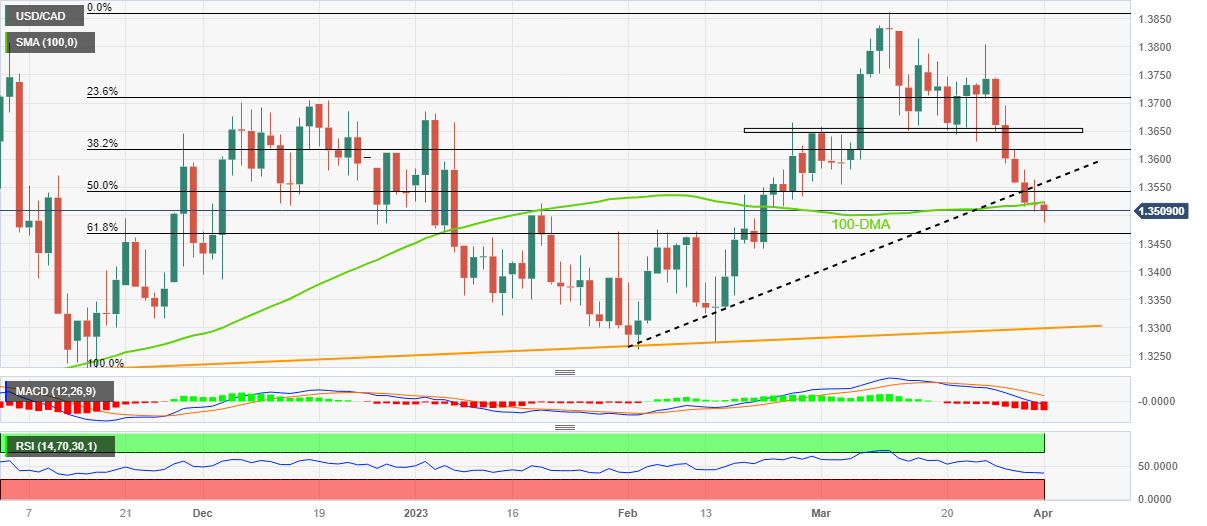
Trend: Further downside expected
-
03:17
Goldman Sachs raises Brent oil price forecasts after OPEC+ output cuts
Goldman Sachs (GS) revised up its Brent Oil price forecast for December 2023 by $5 to $95 a barrel, as well as increasing the December 2024 forecast by $3 to $100 a barrel, in their research note published on Sunday. The latest upward revision of GS’ oil forecasts could be linked to a surprise output cut from the Organization of the Petroleum Exporting Countries (OPEC) and allies led by Russia, known collectively as OPEC+.
Also read: Breaking: WTI crude oil jumps 7.0% to $81.00 on surprise OPEC+ output cut
Key findings
Today's surprise (production) cut is consistent with the new OPEC+ doctrine to act preemptively because they can without significant losses in market share.
The risks around cutting production have become asymmetric given how short positioning has become, and because price increases in response to tightening events can be stronger when the market is short.
While the move was surprising, the decision reflects important economic and likely political considerations.
Output reduction could provide a 7% boost to oil prices, contributing to higher Saudi Arabia and OPEC+ oil revenue.
The refusal to refill the US SPR (Strategic Petroleum Reserve (SPR) in fiscal year 2023, although (US benchmark) WTI lows that were previously characterized as sufficient to refill, may have contributed to the OPEC+ decision to cut too.
Also read: WTI Price Analysis: Corrects to $80.00 after a gap-up move, volatility to remain high
-
03:09
NZD/USD Price Analysis: Grinds lower within rising wedge on softer China PMI, 0.6210 eyed
- NZD/USD stays defensive as it attacks short-term key support confluence inside bearish chart formation.
- China PMIs drop in March, NZIER hints at 0.25% RBNZ rate hike.
- 200-SMA, rising wedge’s support line challenge sellers even as bearish MACD signals keep them hopeful.
- Bulls need successful break of 0.6300 to retake control.
NZD/USD grinds near the intraday low surrounding 0.6210 as bears attack a short-term key support confluence on downbeat China data during early Monday.
That said, China’s Caixin Manufacturing PMI for March drops to 50.0 from 51.6 prior and 51.7 market forecasts.
Not only downbeat China PMIs but hopes of a dovish hike from the Reserve Bank of New Zealand (RBNZ), signaled by the latest New Zealand Institute of Economic Research (NZIER) report, also exert downside pressure on the NZD/USD prices.
With this, the Kiwi pair pokes a convergence of the 200-bar SMA and lower line of a one-month-old rising wedge bearish chart pattern. Adding strength to the downside bias are the bearish MACD signals.
Hence, the quote is likely to break the 0.6210 nearby support, which in turn opens the door for the NZD/USD pair’s theoretical slump towards the 0.6000 psychological magnet. However, multiple levels around 0.6140, the 0.6100 round figure and the previous monthly low of 0.6085 can test the Kiwi pair sellers between 0.6210 and 0.6000.
On the contrary, recovery moves may initially aim for 0.6270 hurdle before poking the stated wedge’s top line surrounding 0.6295.
However, the recent swing high around the 0.6300 round figure can act as the last defense of the NZD/USD bears before directing the quote towards the double tops marked in February around 0.6390.
NZD/USD: Four-hour chart
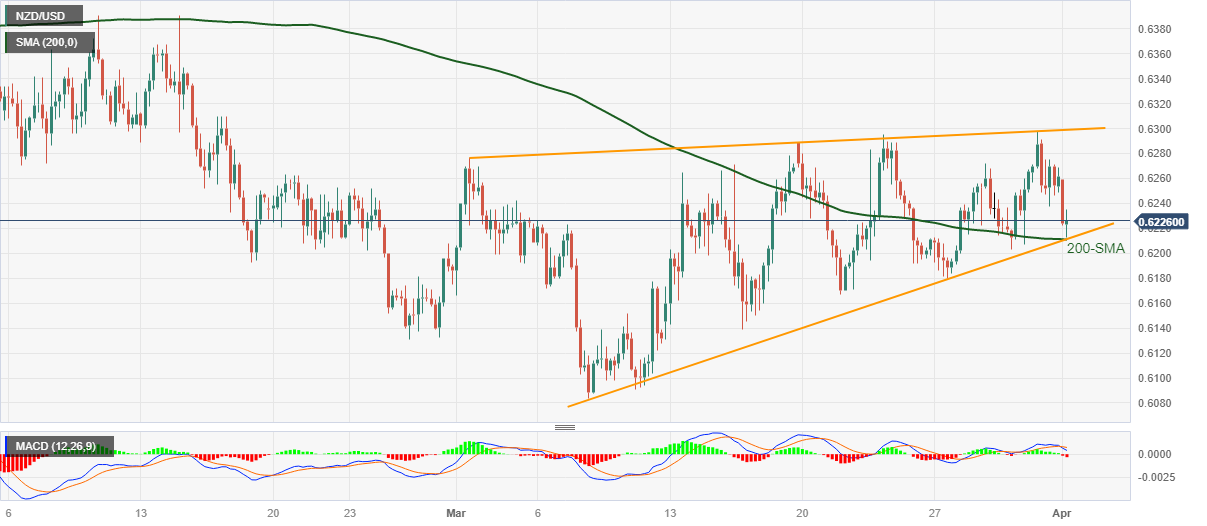
Trend: Further downside expected
-
02:58
USD/CNH eyes 6.90 on downbeat Caixin Manufacturing PMI
- USD/CNH is having a smooth ride towards 6.90 on weaker-than-anticipated Caixin Manufacturing PMI data.
- The Chinese Yuan is expected to remain on the backfoot as oil prices have soared dramatically.
- Higher oil prices are expected to spur the prices of goods and services at factory gates ahead.
The USD/CNH pair has turned speedy towards the immediate resistance of 6.90 as the IHS Markit has reported a downbeat Caixin Manufacturing PMI data. The economic data has landed at 50.0, lower than the consensus of 51.7 and the former release of 51.5.
The Chinese Yuan is expected to remain on the backfoot as oil prices have raised dramatically after OPEC+ announced a further increase in production cuts to support oil prices. According to Reuters, the oil cartel will cut the overall oil production by around 1.16 million barrels/day (bpd), which will lead to the overall pledge of production cut to 3.66 million bpd.
It is worth noting that higher oil prices will significantly weigh on the oil price as China is the largest importer of oil in the world. Higher oil prices would result in more outflows from the Chinese current account for refilling oil.
S&P500 futures have generated some losses in the Asian session in hopes that higher oil prices would propel inflation risk again, portraying a decline in the risk appetite of the market participants.
The US Dollar Index (DXY) has resumed its upside journey after a marginal correction to near 102.80. The USD Index is expected to reclaim its weekly high of 102.95. More gains for the USD Index are in pipeline as fears of renewed United States inflation have strengthened. Higher oil prices are expected to spur the prices of goods and services at factory gates to offset the impact of the former, which would propel inflationary pressures ahead.
The Federal Reserve (Fed) is expected to continue its policy tightening process further to tame the stubborn inflation. As per the CME Fedwatch tool, the odds for a 25bp rate hike to 5.00-5.25% for May monetary policy meeting have escalated to 57%.
-
02:51
AUD/USD stays depressed below 0.6700 on downbeat China Caixin Manufacturing PMI
- AUD/USD remains pressured around one week low, fades bounce off intraday low of late.
- China Caixin Manufacturing PMI for March ease to 50.0 versus 51.7 expected and 51.6 prior.
- Australia Building Permits for February prod AUD/USD sellers.
- Sour sentiment, pre-NFP anxiety joins dovish bias for RBA to weigh on the Aussie pair.
AUD/USD struggles to overcome intraday losses as the latest statistics from China and Australia join sour sentiment during early Monday. That said, the Aussie pair holds lower ground near 0.6665 by the press time amid fears of RBA’s dovish hike and softer US data surrounding activities and employment.
That said, China’s Caixin Manufacturing PMI for March drops to 50.0 from 51.6 prior and 51.7 market forecasts.
Further, Australia’s TD Securities Inflation eased to 0.3% MoM and 5.7% YoY for March versus 0.4% and 6.3% respective priors, which in turn joins the previous week’s downbeat inflation and Retail Sales figures from the Pacific major to strengthen the dovish bias for the Reserve Bank of Australia’s (RBA) next move.
Earlier in the day, news surrounding the OPEC+ output cut weighed on the sentiment and the AUD/USD prices as less energy output suggests a further increase in the Oil price and more pressure on Inflation.
It's worth observing that the CME’s FedWatch Tool recently suggests an increase in the hawkish bias for the Federal Reserve’s (Fed) 0.25% rate hike in May, versus less than 50% chances supporting the event seems in the last week., which in turn weigh on the AUD/USD prices.
Given the risk-off mood and mixed signals, AUD/USD pair may remain pressured around the short-term key support line. However, Monday’s US ISM PMI and Tuesday’s RBA Interest Rate Decision will be the key event for the Aussie pair traders to watch for clear directions.
Also read: AUD/USD approaches 0.6670 key support with eyes on RBA, US NFP
Technical analysis
Recently steady RSI (14) and bullish MACD signals join a three-week-old ascending support line to challenge AUD/USD bears near 0.6670, a break of which can direct AUD/USD bears towards the previous monthly low surrounding 0.6560. Meanwhile, recovery remains elusive unless crossing the 200-DMA hurdle of near 0.6750 by the press time.
-
02:46
Caixin China Manufacturing PMI misses the mark and nudges AUD/USD lower
Caixin China Manufacturing PMI has been released as follows:
- 50 vs 51.7 expected and 51.6 prior.
AUD/USD update
In the pre-open analysis, the article explained ´´the bearish engulfment, BE, on the last 4-hour candle could be the catalyst for a firm break of structure for the opening sessions near 0.6661 with 0.6625 eyed below there guarding the 0.6550s.´´
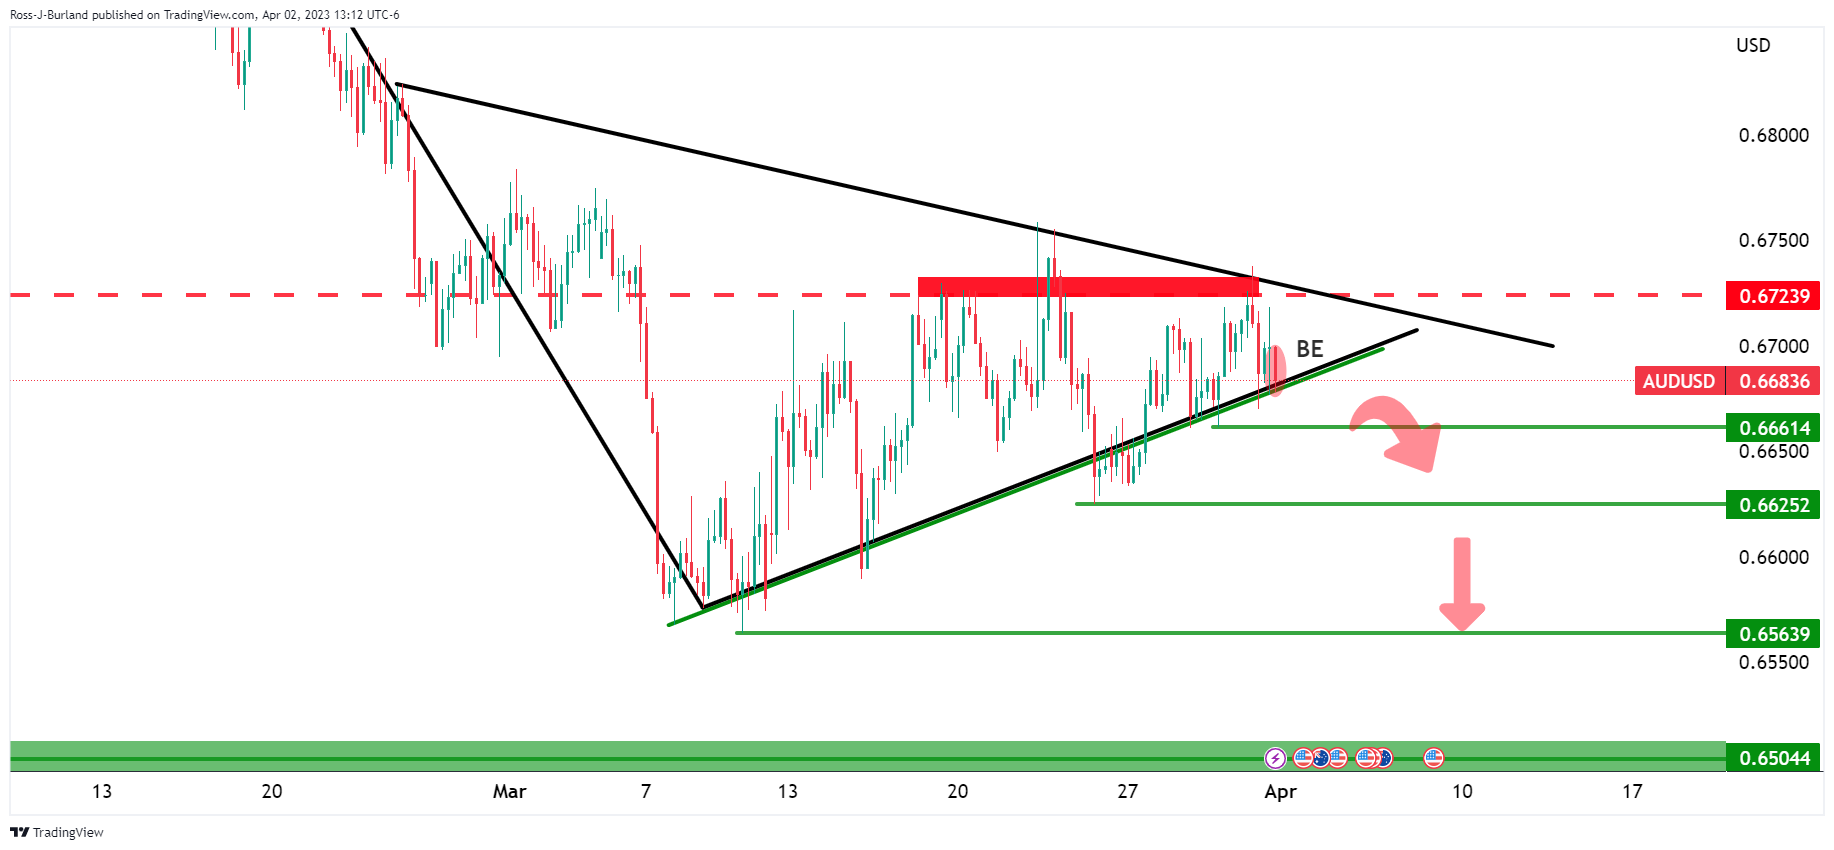
Meanwhile, we have seen the price move lower into test the 0.6661 structure as follows:
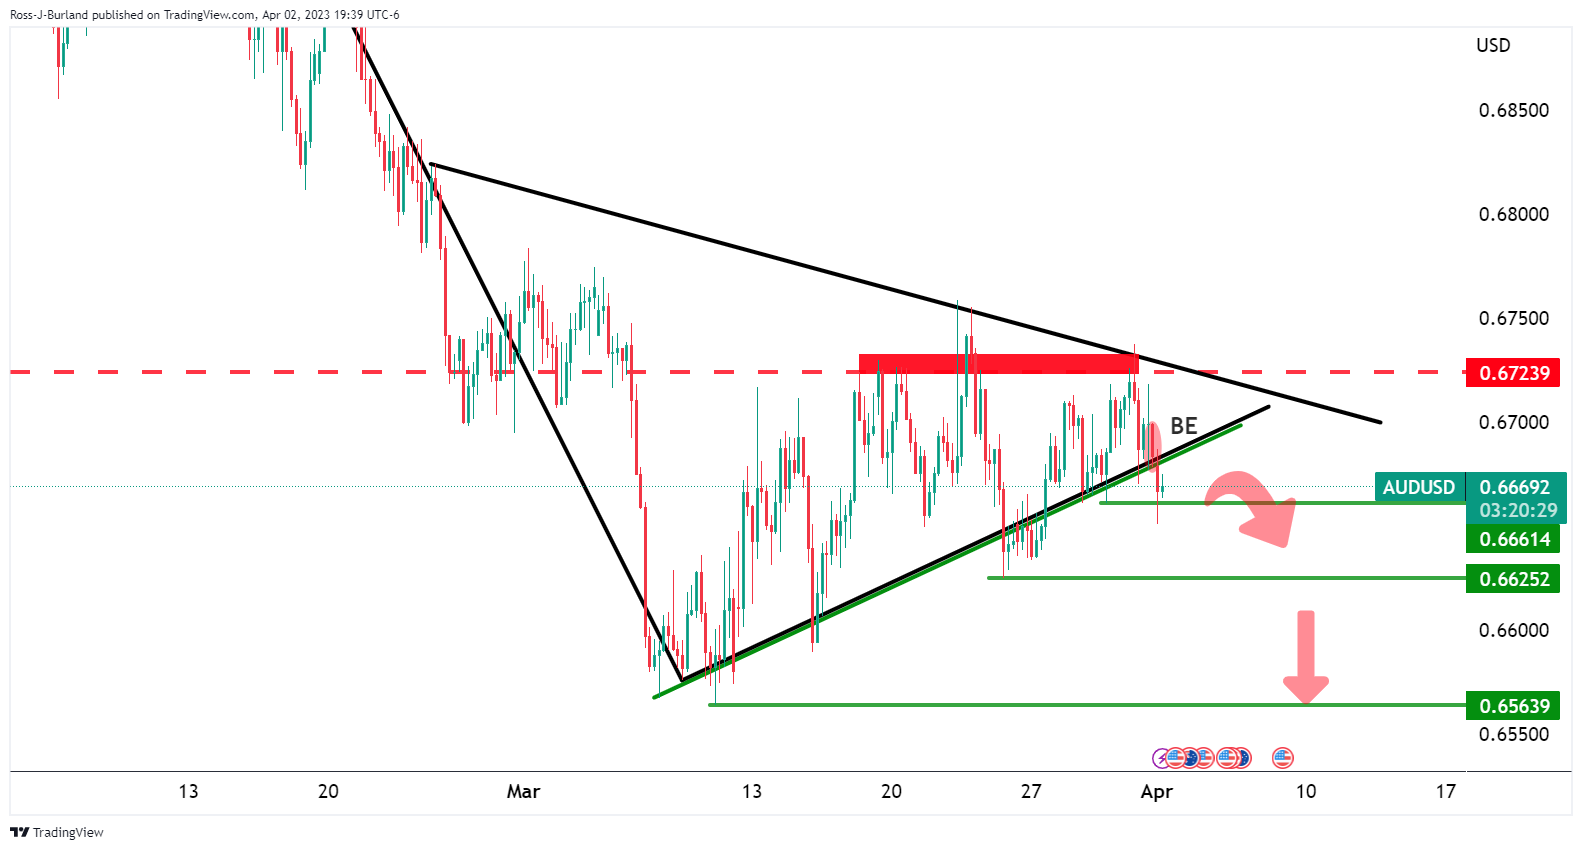
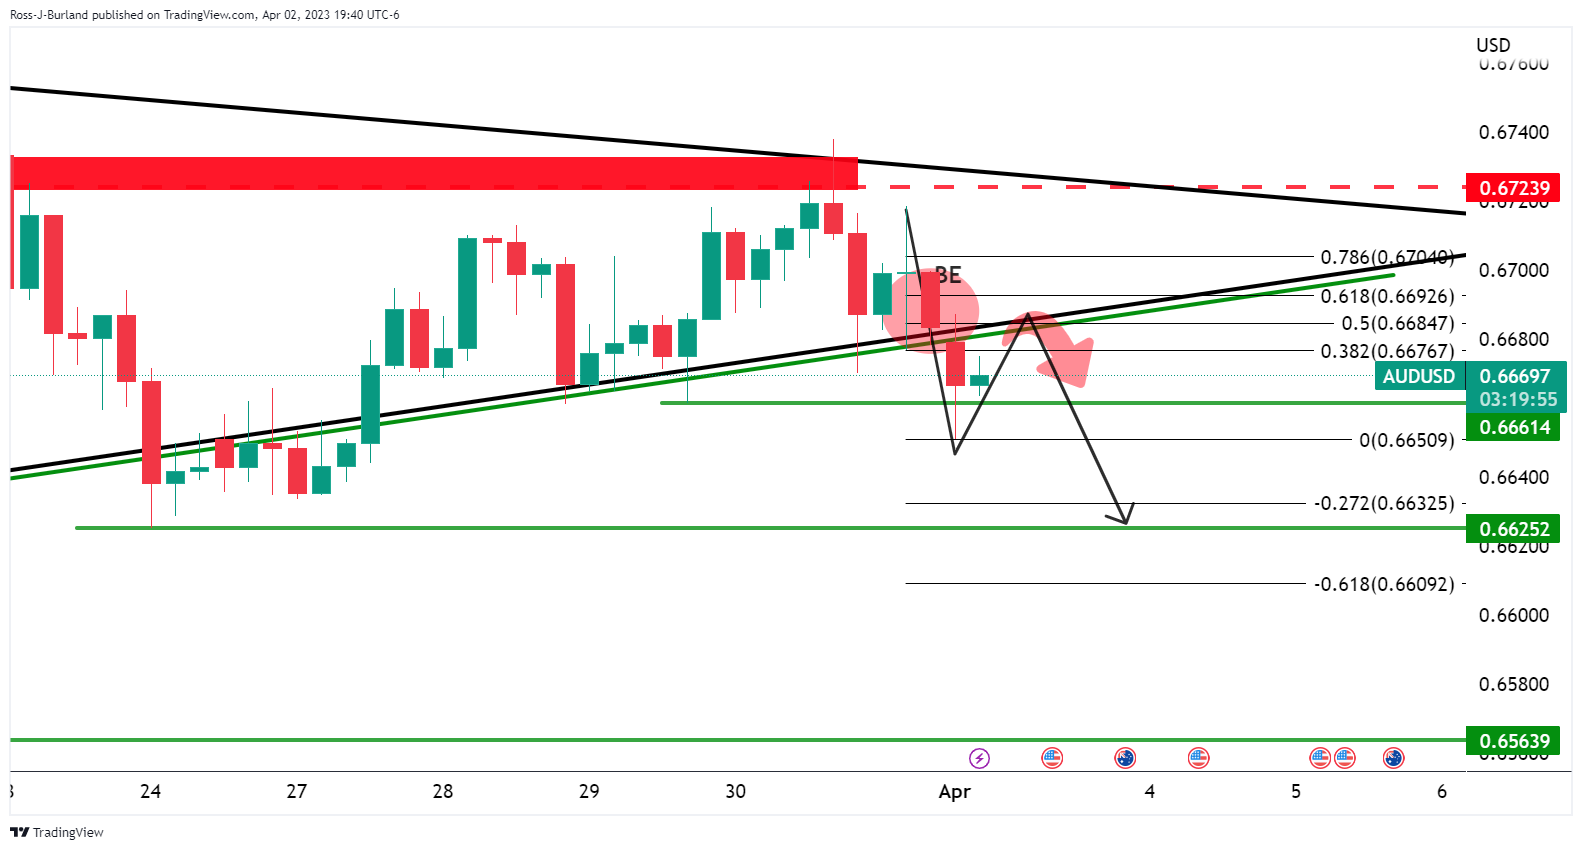
The price pierced the level but has failed to close below there so far. So long as the bears commit below 0.6700, then there will be a strong probability of the market heading lower and the China data plays into the bearish bias.
About Caixin China Manufacturing PMI
The Caixin China Manufacturing PMI™, released by Markit Economics, is based on data compiled from monthly replies to questionnaires sent to purchasing executives in over 400 private manufacturing sector companies.
-
02:45
China Caixin Manufacturing PMI came in at 50 below forecasts (51.7) in March
-
02:35
GBP/USD attempts to defend 1.2300, market mood remains jittery on upbeat oil prices
- GBP/USD has rebounded in an attempt to defend the 1.2300 support.
- S&P500 futures have reported significant losses as higher oil prices would accelerate input costs.
- The Fed would look for raising rates further in May if inflation gets exploded with solid oil prices.
The GBP/USD pair is making efforts in defending its round-level support of 1.2300 in the Asian session. The Cable witnessed a sheer decline in the early Tokyo session as investors discounted the impact of higher oil prices after an announcement of further oil production cuts by OPEC+. A significant jump in the oil price has renewed fears of a rebound in inflationary pressures globally. Therefore, central banks might be required to continue higher rates for a lengthy period.
S&P500 futures have reported significant losses in the Asian session after a spree of bullish sessions last week as higher oil prices would accelerate input costs for firms banking on oil for transportation and manufacturing. The market sentiment has turned negative and risk-perceived assets have taken the bullet.
The US Dollar Index (DXY) is showing minor correction after printing a fresh weekly high at 102.95. The upside in the USD Index looks favored as renewed inflation hopes in the United States due to higher oil prices have faded the impact of the deceleration in the US core Personal Consumption Expenditure (PCE) Price Index data.
On a monthly basis, the US PCE Price Index accelerated by 0.3%, lower than the consensus of 0.4% and the former release of 0.5%. Also, the annual US PCE Inflation figure soften to 4.6% from the consensus and prior release of 4.7%.
The Federal Reserve (Fed) would look for raising rates further in May if inflation gets exploded with solid oil prices.
On the Pound Sterling front, rising inflationary pressures are creating more troubles for the Bank of England (BoE). United Kingdom’s shop price inflation has soared further as food prices are escalating further. Apart from that, shortages of labor continue to propel inflation expectations. However, BoE policymakers are confident that UK inflation will start declining quickly.
-
02:32
Australia Home Loans: -1.2% (February) vs -4.9%
-
02:31
Australia Investment Lending for Homes: -0.5% (February) vs -6%
-
02:30
Australia Building Permits (YoY) down to -31.1% in February from previous -8.4%
-
02:30
Australia Building Permits (MoM) above expectations (-2.6%) in February: Actual (4%)
-
02:20
USD/CNY fix: 6.8805 vs. the prior closing of 6.8745
In recent trade today, the People’s Bank of China (PBOC) set the yuan at 6.8805 vs. the prior closing of 6.8745.
About the fix
China maintains strict control of the yuan’s rate on the mainland.
The onshore yuan (CNY) differs from the offshore one (CNH) in trading restrictions, this last one is not as tightly controlled.
Each morning, the People’s Bank of China (PBOC) sets a so-called daily midpoint fix, based on the yuan’s previous day's closing level and quotations taken from the inter-bank dealer.
-
02:20
Gold Price Forecast: XAU/USD bears struggle to keep the reins ahead of US Nonfarm Payrolls
- Gold price pares intraday losses after falling in the last two consecutive weeks.
- US Dollar hesitantly cheers risk-off mood, recovery in United States Treasury bond yields and puts a floor under the XAU/USD prices.
- United States Nonfarm Payrolls eyed to confirm recently easing hawkish bias among Fed policymakers and can propel the Gold price.
- Headlines about China, banking also become important for XAU/USD traders.
Gold Price (XAU/USD) consolidates intraday losses around $1,963 as US Dollar retreats from a daily high, despite sour sentiment and firmer yields, as markets brace for the key US Nonfarm Payrolls (NFP).
It’s worth noting that the Gold price dropped in the last two consecutive weeks, even as the US Dollar remained pressured, amid easing fears of the banking crisis and downbeat headlines surrounding the major XAU/USD consumer China. The latest fears in the market, however, allowed the greenback to pare previous losses as the key week comprising United States activity data and the jobs report for March begins.
Gold price fails to cheer US Dollar weakness
Gold price remains despite the latest rebound in Gold price, the precious metal remained downbeat in the last two consecutive weeks even as the US Dollar dropped. The reason could be linked to the easing banking fears and downbeat headlines about one of the world’s biggest Gold consumers, namely China. Though, the latest price fears emanating from the Organization of the Petroleum Exporting Countries (OPEC) and allies led by Russia, known as OPEC+, prod the XAU/USD bulls.
That said, OPEC+ announced a surprise output cut and offered an upbeat start to the US Dollar Index (DXY), up 0.25% near 102.85 at the latest. However, the easing fears of the banking crisis and the mixed US data join easing hawkish bias on the Federal Reserve’s (Fed) moves to weigh on the US Dollar and keep the Gold buyers hopeful.
Talking about the data, the US Core Personal Consumption Expenditures (PCE) Price Index, the Fed’s preferred gauge of inflation, declined to 4.6% YoY in February from 4.7% expected and prior. On a monthly basis, Core PCE inflation rose 0.3% while easing below the market expectation of 0.4% and a downwardly revised 0.5% previous reading. Further, the Chicago PMI reading for March was stronger than expected at 43.8pts, but this is still a relatively weak level and consistent with the slowing of the manufacturing sector in the US. On the same line, the final readings of the University of Michigan's (UoM) Consumer Confidence Index dropped to 62.0 in March, versus 63.4 flash estimations and 63.2 market forecasts. Current Economic Conditions fell from 70.7 in February to 66.3 and the Index of Consumer Expectations declined from 64.7 to 59.2.
The UoM report mentioned regarding inflation that the year-ahead expectations “receded from 4.1% in February to 3.6%, the lowest reading since April 2021, but remained well above the 2.3-3.0% range seen in the two years prior to the pandemic.” Five-year expectations came in at 2.9% for the fourth consecutive month.
Previously, the final readings of the US fourth quarter (Q4) Gross Domestic Product (GDP), also known as the Real GDP, marked an easy Annualized growth number of 2.6% versus 2.7% previous forecasts. Though, the data published by the Conference Board showed that the Consumer Confidence Index in the US improved slightly to 104.2 in March from 103.4 in February.
Following the data, US President Joe Biden delivered a statement following the February PCE report, highlighting the progress in the “fight against inflation”. On the same line, Federal Reserve Bank of Boston President Susan Collins and New York Fed President John C. Williams cited easing in inflation but highlighted the incoming data to determine the Fed’s next moves.
Elsewhere, China's top diplomat Wang Yi said on Friday that the US and China relations are facing challenges and difficulties. “I urge the US to stop suppression, decoupling is wrong,” Wang added. The world’s top two economies previously argued about the US links with Taiwan and the dragon nation’s ties with Russia.
Amid these plays, the CME’s FedWatch Tool suggests near 52% chances of the Fed’s 0.25% rate hike in May and puts a floor under the Gold price. On the other hand, the S&P 500 Futures print mild losses while the United States Treasury bond yields consolidate the latest losses and challenge the XAU/USD bulls.
United States Purchasing Managers’ Indexes, Employment report eyed
Looking ahead, Gold price will depend on the United States Purchasing Managers’ Indexes, employment data for March, not to forget headlines surrounding China and banking. Given the fresh hopes of firmer inflation, mainly due to the OPEC+ moves, the incoming data may weigh on the Gold price should they print strong numbers and allow the US Dollar to keep the latest gains.
Also read: Gold Price Weekly Forecast: XAU/USD could break out of range on NFP
Gold price technical analysis
Gold price stays depressed in the last two consecutive weeks after witnessing rejection from the $2,000 threshold. The metal’s latest weakness, however, justifies a downside break of of the 50-bar Exponential Moving Average (EMA), as well as a three-week-old ascending trend line.
It’s worth noting that the bearish signals from the Moving Average Convergence and Divergence (MACD) indicator join downbeat prints of the Relative Strength Index (RSI) line, placed at 14, to keep Gold sellers hopeful.
However, the 100-EMA level surrounding $1,943 and the $1,900 round figure could test the XAU/USD bears during the quote’s latest weakness, not to forget mentioning the latest swing low surrounding $1,957.
On the contrary, the 50-EMA and support-turned-resistance line, respectively near $1,965 and $1,970, guard the quote’s immediate upside ahead of a fortnight-long horizontal area surrounding $1,985-87. Following that, the all-important $2,000 mark will gain the Gold buyer’s attention.
In a case where the XAU/USD remains firmer past $2,000, the previous monthly high of around $2,010 and the $2,050 threshold could test the Gold buyers before directing them to the last yearly peak of around $2,070.
Gold price: Four-hour chart
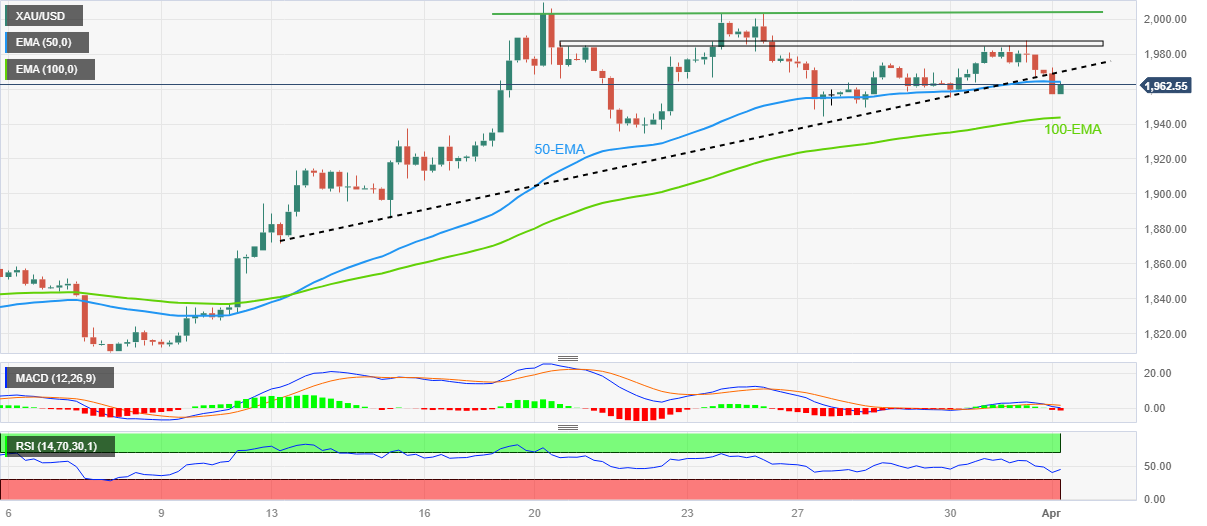
Trend: Further downside expected
-
02:05
WTI Price Analysis: Corrects to $80.00 after a gap-up move, volatility to remain high
- The oil price has corrected marginally after a gap-up opening above $81.00.
- OPEC+ will cut oil production further by around 1.16 million bpd.
- The USD Index has been driven higher amid renewed fears of a rebound in inflation.
West Texas Intermediate (WTI), futures on NYMEX, have shown some correction after failing to sustain above $81.00 in the Asian session. The oil price had a stellar gap-up opening above $81.00, 7% higher from Friday’s closing inspired by the announcement of further production cuts by OPEC+ this weekend.
According to Reuters, the oil cartel will cut the overall oil production by around 1.16 million barrels/day (bpd), which will lead to the overall pledge of production cut to 3.66 million bpd.
Meanwhile, the US Dollar index (DXY) has printed a fresh weekly high at 102.95 as higher oil prices are expected to fuel up global inflationary pressures. This might force the Federal Reserve (Fed) to continue its policy-tightening spell further.
On the daily scale, the oil price has sensed some long-liquidations after a solid gap-up move post facing barriers near the horizontal resistance plotted from March 07 high around $81.00. Upward-sloping 10-period Exponential Moving Average (EMA) at $74.20 indicates that the upside momentum is extremely solid.
The Relative Strength Index (RSI) (14) has climbed above 60.00 for the first time in the past three months, showing no signs of divergence and any evidence of an overbought situation.
Should the oil price break above April 03 high near $81.60, bulls will drive the asset towards December 01 high at $83.30 followed by October 21 high at $85.66.
On the flip side, a downside move below March 31 low at $73.31 would drag the asset toward March 23 high at $71.69. A break below the latter would further drag the oil price toward March 27 low at $69.18.
WTI daily chart
-638160806793815653.png)
-
02:03
Australia TD Securities Inflation (YoY): 5.7% (March) vs previous 6.3%
-
02:03
Australia TD Securities Inflation (MoM) fell from previous 0.4% to 0.3% in March
-
01:40
USD/JPY Bears step in to close the opening gap
- USD/JPY bears move in from key resistance.
- All eyes will turn to the NFP report on Friday.
USD/JPY is higher by some 0.2% which has rallied from a low of 132.98 to a high of 133.38 so far. The pair has jumped into last week´s resistance although only to meet supply again, putting the pair back under pressure in Tokyo.
There has been a slew of data from the Bank of Japan´s first-quarter Tankan survey showing a small rise in inflation expectations and Japanese Jibun Bank Manufacturing PMI actual coming in at 49.2 vs. the previous 48.6.
Meanwhile, risk-off markets are kicking in t the start of the week due to the weekend news regarding the oil production cut and soaring oil prices. Saudi Arabia and other OPEC+ oil producers have announced further oil output cuts of around 1.16 million barrels per day. In a statement, the Saudi energy ministry said that the kingdom’s voluntary cut was a precautionary measure aimed at supporting the stability of the oil market. Consequently, WTI crude oil opened for the week with a significant price gap to print $81.51 during the early hours of Monday’s Asian session.
Looking ahead, the March jobs report Friday will be the data highlight in the Nonfarm Payrolls. The consensus stands at 240k vs. 311k in February, while the Unemployment Rate is seen steady at 3.6%. Average hourly earnings are expected to slow to 4.3% for the year vs. 4.6% in February.
´´It's worth noting that the data will come on Good Friday. With markets likely to be very thin, we could get some outsize movements from the numbers, whether good or bad,´´ analysts at Brown Brothers Harriman explained. ´´Ahead of NFP, ADP reports its private sector jobs estimate Wednesday and is expected at 210k vs. 242k in February. Other key labor market data will be reported this week. February JOLTS job openings will be reported Tuesday and is expected at 10.500 mln vs. 10.824 mln in February. March Challenger jobs cuts and weekly jobless claims will be reported Thursday.´´
-
01:37
Silver Price Analysis: XAG/USD retreats from key resistance, further downside hinges on $23.50 break
- Silver price takes a U-turn from a one-year-old descending resistance line, reverses from two-month high.
- Overbought RSI (14) suggest the XAG/USD’s further downside but bullish MACD signals, 12-day-old support line challenge bears.
- Silver buyers need validation from February’s high to retake control.
Silver price (XAG/USD) drops to $23.90 as it snaps a three-week uptrend during early Monday. In doing so, the bright metal reverses from a downward-sloping resistance line from April 2022. Adding strength to the XAG/USD pullback is the overbought RSI (14) line.
However, the bullish MACD signals and a two-week-old ascending support line, close to $23.50 by the press time, restrict the short-term downside of the Silver price.
Following that, the 61.8% Fibonacci retracement level of the metal’s April-September 2022 downturn, near $22.90, could lure the XAG/USD bears.
It’s worth noting, though, that a convergence of the 21-DMA and 50-DMA, around $22.20 by the press time, appears a tough nut to crack for the Silver bears.
In a case where the Silver price remains weak past $22.20, the 22.00 and 50% Fibonacci retracement level around $21.90 act as the last defenses of the XAG/USD buyers.
Meanwhile, an upside clearance of the one-year-long resistance line, close to $24.05 at the latest, isn’t an open invitation to the Silver buyers as February 2023 tops surrounding $24.65 challenges the XAG/USD bulls before directing them to the April 2022 high of near $26.25.
Should the Silver price remains firmer past $26.25, the previous yearly high surrounding $27.300 will be in focus.
Silver Price: Daily chart
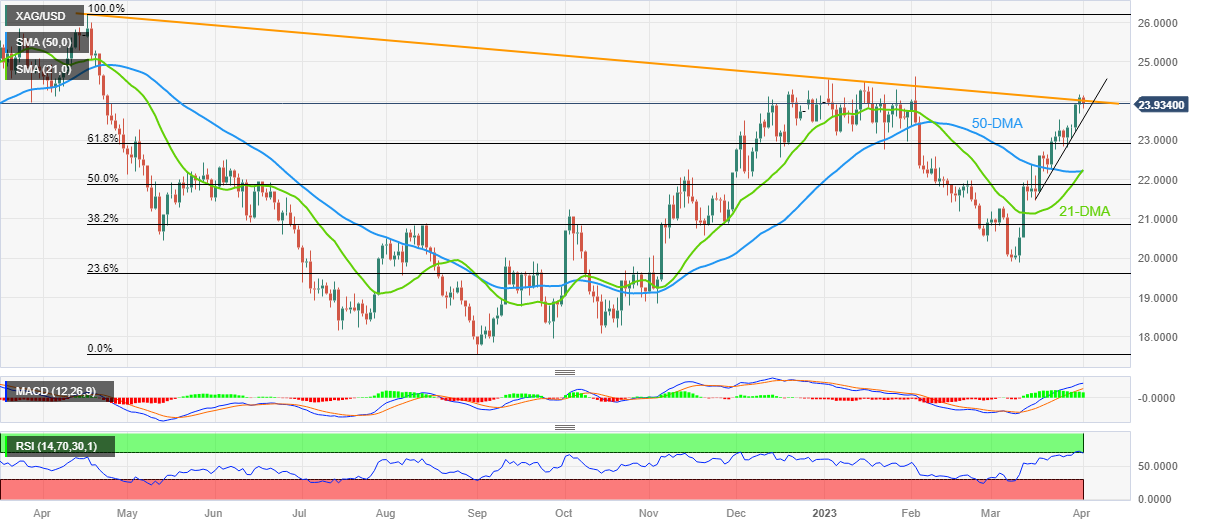
Trend: Limited downside expected
-
01:30
South Korea S&P Global Manufacturing PMI came in at 47.6 below forecasts (47.9) in March
-
01:30
Japan Jibun Bank Manufacturing PMI rose from previous 48.6 to 49.2 in March
-
01:15
Currencies. Daily history for Friday, March 31, 2023
Pare Closed Change, % AUDUSD 0.66859 -0.35 EURJPY 144.012 -0.42 EURUSD 1.08436 -0.55 GBPJPY 163.748 -0.33 GBPUSD 1.23293 -0.46 NZDUSD 0.62549 -0.12 USDCAD 1.35141 -0.04 USDCHF 0.91513 0.22 USDJPY 132.816 0.14 -
01:14
EUR/JPY Price Analysis: Retreats to near 144.00 despite hawkish ECB bets
- EUR/JPY has failed to capitalize on the Japanese Yen’s weakness inspired by upbeat oil prices.
- A surprise rise in the Eurozone inflation is expected to force the ECB to continue its policy-tightening spell.
- The cross has witnessed a correction after a strong upside, which would be a mean reversion move to near the 20-EMA.
The EUR/JPY pair has dropped sharply to near 144.00 after a short-lived pullback to 144.50 in the Asian session. In early Asia, the cross showed a severe bullish response to the headline of the surprise cut in oil production by OPEC+. However, the less-confident move has faded for now.
The Japanese Yen came under intense pressure after a stellar jump in the oil price, being Japan one of the leading importers of oil in the world.
On the Eurozone front, preliminary Harmonized Index of Consumer Prices (HICP) (March) data kept the Euro in action. The headline HICP softened to 6.9% from the consensus and the prior release of 7.1% and 8.5% respectively. However, the monthly figure elevated to 0.9% vs. the estimates and February’s figure of 0.8%. And, core monthly HICP figure soared to 1.2% from the expectations of 0.6%.
A surprise rise in the Eurozone inflation is expected to force the European Central Bank (ECB) to continue to announce more rates to tame the stubborn inflation.
On a four-hour scale, EUR/JPY has dropped strongly after facing tough barricades near the horizontal resistance plotted from February 28 high at 145.47. The cross has witnessed a correction after a strong upside, which is likely to be a mean reversion move to near the 20-period Exponential Moving Average (EMA) around 143.85.
The Relative Strength Index (RSI) (14) has slipped into the 40.00-60.00 range, which indicates a loss in the upside momentum, and the upside bias has not faded yet.
Going forward, a break above the intraday high at 144.58 would drive the asset towards March 31 high at 145.67 followed by December 16 high at 146.72.
On the flip side, a break below March 30 low at 143.13 would drag the cross toward March 14 low at 142.53 and March 13 low at 141.57.
EUR/JPY four-hour chart
-638160776041158609.png)
-
01:13
EUR/USD sellers attack 1.0800 as risk aversion joins consolidation ahead of US PMI, NFP
- EUR/USD takes offers to refresh intraday low, extends Friday’s losses after two-week uptrend.
- Softer Eurozone inflation numbers contrast with upbeat prints of monthly US Core PCE Price Index to weigh on Euro pair.
- OPEC+ production cut adds strength to inflation woes and propels US Dollar’s haven demand.
- US NFP will be crucial amid easing hawkish Fed bets, PMIs eyed too.
EUR/USD pares gains made in the last two consecutive weeks around 1.0800 as traders brace for the all-important US Nonfarm Payrolls (NFP) during early Monday. Adding strength to the pullback moves could be the recent fears of escalating pressure on prices and downbeat Eurozone inflation numbers versus firmer prints of the Federal Reserve’s (Fed) favorite inflation gauge.
The recent surprise supply cut from the Organization of the Petroleum Exporting Countries (OPEC) and allies led by Russia, known as OPEC+, renew inflation fears and propel the concerns of higher rates, which in turn underpinned the US Dollar’s haven demand.
Adding strength to the US Dollar could be the recently firmer inflation signals as the US Core Personal Consumption Expenditures (PCE) Price Index, the Fed’s preferred gauge of inflation, declined to 4.6% YoY in February from 4.7% expected and prior. On a monthly basis, Core PCE inflation rose 0.3% while easing below the market expectation of 0.4% and a downwardly revised 0.5% previous reading.
On the other hand, the Eurozone Harmonised Index of Consumer Prices (HICP), the European Central Bank’s (ECB) preferred version of inflation, eased to 6.5% YoY in March versus February’s 8.5% and 7.1% market forecasts. It’s worth noting, however, that the Core HICP matched 5.7% analysts’ estimations and 5.6% prior. The monthly figures were more interesting as the headline HICP rose by 0.9% in March vs. 0.8% expectations and 0.8% previous while the Core HICP jumped by 1.2% compared to 0.6% expected and 0.8% seen in February.
It should be noted that the latest comments from the European Central Bank (ECB) Officials, namely from Vice-President Luis de Guindos and policymaker Fabio Panetta hint at easing inflation pressure but defend the hawkish monetary policy bias. On the other hand, Fed Chairman Jerome Powell pushed for one more rate hike while Federal Reserve Bank of Boston President Susan Collins highlighted the importance of higher rates to tame inflation during her latest speeches. On the same line, Federal Reserve Bank of New York President John C. Williams said that he expects inflation to decline to around 3-1/4 percent this year, before moving closer to our longer-run goal in the next two years.
Against this backdrop, S&P 500 Futures print mild losses despite the upbeat closing of Wall Street whereas yields grind higher after a three-day downtrend.
Moving on, US ISM Manufacturing PMI and S&P Global Manufacturing PMI for March can direct intraday moves but major attention should be given to Friday’s US jobs report and headlines suggesting inflation woes.
Technical analysis
A clear downside break of a two-week-long ascending support line, now immediate resistance near 1.0910, directs EUR/USD bears towards the 50-DMA support of around 1.0730.
-
01:01
Ireland Purchasing Manager Index Manufacturing fell from previous 51.3 to 49.7 in March
-
00:53
US Dollar Index bulls prod 102.85 as NFP week begins with risk-off mood, focus on US PMI
- US Dollar Index picks up bids to extend Friday’s recovery, pares three-week downtrend.
- OPEC+ supply cuts join mixed US data and Fed’s hesitance in letting doves in put a floor under DXY prices.
- Sino-American tension, pre-NFP anxiety also allow US Dollar Index to pare recent losses.
US Dollar Index (DXY) kick-starts the NFP week on a firmer footing, after a three-week losing streak, as it marches to 102.83 during the early hours of Monday’s Asian trading session. In doing so, the greenback’s gauge versus the six major currencies cheers the market’s risk aversion, as well as cautious mood ahead of the key US activity data and jobs report for March.
DXY dropped in the last three consecutive weeks amid receding fears of witnessing a bank crisis and the downbeat US data. Also weighing on the US Dollar Index could be the Federal Reserve (Fed) policymakers’ inability to convince markets of their hawkish capacity. However, the weekend news of the oil supply cut from the Organization of the Petroleum Exporting Countries (OPEC) and allies led by Russia, known as OPEC+, renew inflation fears and propel the concerns of higher rates, which in turn underpinned the US Dollar’s haven demand.
Talking about the key data, Friday’s US Core Personal Consumption Expenditures (PCE) Price Index, the Fed’s preferred gauge of inflation, declined to 4.6% YoY in February from 4.7% expected and prior. On a monthly basis, Core PCE inflation rose 0.3% while easing below the market expectation of 0.4% and a downwardly revised 0.5% previous reading. It should be noted that the final readings of the US fourth quarter (Q4) Gross Domestic Product (GDP), also known as the Real GDP, marked an easy Annualized growth number of 2.6% versus 2.7% previous forecasts.
Even so, Fed Chairman Jerome Powell pushed for one more rate hike while Federal Reserve Bank of Boston President Susan Collins highlighted the importance of higher rates to tame inflation during her latest speeches. On the same line, Federal Reserve Bank of New York President John C. Williams said that he expects inflation to decline to around 3-1/4 percent this year, before moving closer to our longer-run goal in the next two years.
On the other hand, bank shares recover after upbeat banking sector performance and mixed US data, not to forget the firmer closing of Wall Street, as well as recovery in the US Treasury bond yields.
Moving on, US ISM Manufacturing PMI and S&P Global Manufacturing PMI for March can direct intraday moves of the US Dollar Index. However, major attention should be paid to the risk catalysts for clear directions. Among them, Friday’s US jobs report and headlines suggesting inflation woes will be in the spotlight.
Technical analysis
A 13-day-old descending trend line joins the 10-day Exponential Moving Average (EMA) to highlight 102.85 as a short-term key hurdle to watch for the US Dollar Index buyers.
-
00:51
Japan Tankan Large Manufacturing Outlook below forecasts (4) in 1Q: Actual (3)
-
00:51
NZD/USD bears move in on key daily support
- NZD/USD bears are in the market testing dynamic support.
- Risk-off tones due to higher oil prices are dominating ahead of RBNZ.
NZD/USD is lower on the day by some 0.3% after falling from a high of 0.6255 to a low of 0.6232 so far. Risk-off markets are kicking in on the back of the weekend news regarding the oil production cut and soaring oil prices.
Saudi Arabia and other OPEC+ oil producers have announced further oil output cuts of around 1.16 million barrels per day. In a statement, the Saudi energy ministry said that the kingdom’s voluntary cut was a precautionary measure aimed at supporting the stability of the oil market. Consequently, WTI crude oil opened for the week with a significant price gap to print $81.51 during the early hours of Monday’s Asian session.
Meanwhile, domestically, this week the focus shifts to the Reserve Bank of New Zealand. ´´While they’re likely to acknowledge risks around financial instability, NZ is remote from all that, and we think the inflation risks relating to the cyclone recovery in an already capacity-constrained economy are a bigger story,´´ analysts at ANZ Bank said, adding, ´´that could help the NZD this week.´´
Meanwhile, analysts at TD Securities noted that the February Monetary Policy Statement noted the Bank thinks further hikes are needed. ´´Aside from Gross Domestic Product, other data suggest the Bank will continue hiking. The Bank may acknowledge the turmoil in US and EU financials but conclude NZ banks are in good shape,´´ the analysts said. ´´To the extent, offshore lending standards tighten and our Fed terminal rate is now lower, this implies downside risk to our 5.50% terminal rate forecast,´´ the analysts concluded.
NZD/USD technical analysis

The price is testing the dynamic support line on the daily chart and the M-formation is in play. If the bulls commit, a retest of the neckline and prior support might be expected to result in a downside continuation to break the dynamic trendline support.
-
00:51
Japan Tankan Non - Manufacturing Outlook came in at 15, below expectations (16) in 1Q
-
00:50
Japan Tankan Non - Manufacturing Index in line with expectations (20) in 1Q
-
00:50
Japan Tankan Large Manufacturing Index below expectations (3) in 1Q: Actual (1)
-
00:50
Japan Tankan Large All Industry Capex came in at 3.2% below forecasts (9.9%) in 1Q
-
00:44
AUD/JPY drops below 89.00 as investors await Caixin Manufacturing PMI and RBA policy
- AUD/JPY has failed to sustain above 89.00 as investors turn anxious ahead of Caixin Manufacturing PMI data.
- RBA would continue its policy-tightening spell despite softening of Australian inflation.
- The Japanese Yen faced immense pressure led by a sharp jump in the oil price.
The AUD/JPY pair is struggling to keep itself above 89.00 after a decent opening in the early Asian session. The risk barometer witnessed a decent response from buyers as soaring oil prices weighed heavily on the Japanese Yen.
Investors discounted the surprise announcement of the oil production cut by OPEC+, made on weekend. Japan, being one of the leading importers of oil, witnessed intense selling pressure.
However, the Australian Dollar is getting volatile ahead of the release of the Caixin Manufacturing PMI data. The street is estimating a marginal rise in the economic data to 51.7 from the former release of 51.6. On Friday, official China’s Manufacturing PMI landed at 51.9, higher than the consensus of 51.5 but lower than the former release of 52.6.
It is worth noting that Australia is a leading trading partner of China and a higher Chinese Manufacturing PMI would also strengthen the Australian Dollar.
Going forward, volatility in the Australian Dollar is expected to remain high ahead of the interest rate decision by the Reserve Bank of Australia (RBA), which will be announced on Tuesday. Australian monthly inflation indicator has softened to 6.8% in the past two months from its peak of 8.4% recorded in December. Despite that, RBA Governor Philip Lowe is expected to hike rates further by 25 basis points (bps) to 3.80%.
There is no denying the fact that Australian inflation has softened firmly, however, the inflation rate is highly skewed from the desired inflation rate, which would force RBA policymakers to continue their tight monetary policy approach.
-
00:32
USD/CHF marches towards 0.9200 as US dollar licks its wounds, Swiss inflation, US NFP eyed
- USD/CHF extends Friday’s recovery from three-week low on DXY’s rebounds.
- Market sentiment sours on OPEC+ surprise output cut, cautious mood ahead of top tier data/events.
- Swiss CPI, US NFP will be the key, PMIs are also important to watch for clear directions.
USD/CHF picks up bids to renew intraday high around 0.9170 as it extends the previous day’s upside while consolidating the two-week downtrend during early Monday. In doing so, the Swiss Franc (CHF) pair justifies the market’s risk-off mood ahead of the key data/events amid fears of an additional toll on the global growth, mainly after the oil output cut from the Organization of the Petroleum Exporting Countries (OPEC) and allies led by Russia, known as OPEC+.
After multiple days of optimism, market sentiment sours during early Monday as an output cut from the global oil producers propels the odds of higher inflation and an additional burden on the economy, suggesting more chances of witnessing a recession. It’s worth noting that the cautious mood ahead of the Swiss Consumer Price Index (CPI) for March and the US Nonfarm Payrolls (NFP) for the said month also weigh on the risk appetite and fuel the USD/CHF prices.
It’s worth noting, however, that the receding hawkish bets on the Federal Reserve (Fed), especially after the previous week’s downbeat data, join the easing fears of the banking crisis to challenge the US Dollar bulls ahead of the key US jobs report.
As per the latest data, the US Core Personal Consumption Expenditures (PCE) Price Index, the Fed’s preferred gauge of inflation, for February declined to 4.6% YoY from 4.7% expected and prior. On a monthly basis, Core PCE inflation rose 0.3% while easing below the market expectation of 0.4% and a downwardly revised 0.5% previous reading. Further, the Chicago PMI reading for March came in stronger than expected at 43.8 while the final readings of the University of Michigan's (UoM) Consumer Confidence Index dropped to 62.0 in March, versus 63.4 flash estimations and 63.2 market forecasts. Additionally, Current Economic Conditions fell from 70.7 in February to 66.3 and the Index of Consumer Expectations declined from 64.7 to 59.2.
Amid these plays, S&P 500 Futures print mild losses despite the firmer closing of Wall Street while the US Treasury bond yields pause the three-day downtrend.
Moving on, the Swiss CPI and SVME Purchasing Managers’ Index for March will precede the US ISM Manufacturing PMI for the said month to direct intraday moves of the USD/CHF pair. However, major attention should be given to the risk catalysts and Friday’s US jobs report for a clear guide.
Technical analysis
A one-month-old descending resistance line, around 0.9180 by the press time, challenges USD/CHF bulls even if MACD and RSI suggest that the bears are running out of steam.
-
00:11
GBP/USD Price Analysis: Slides towards 1.2300 on trend line break
- GBP/USD bears are back in town after three-week uptrend as Cable news intraday low.
- Another failure to cross 1.2445-50 resistance zone, downside break of 13-day-old ascending support line lures sellers.
- Convergence of 50-DMA, 100-DMA appears the key support for bears to watch.
- Oscillators also suggest that buyers are running out of steam.
GBP/USD begins the week’s trading on a back foot after witnessing three consecutive weekly gains in the last, down 0.25% around 1.2310 by the press time.
In doing so, the Cable pair justifies the downside break of a two-week-old ascending support line, now resistance around 1.2365. Adding strength to the quote’s bearish bias is one more reversal from the 1.2445-50 resistance zone which has been restricting the quote’s upside since early December 2022.
Additionally, a looming bear cross on the MACD and a steady RSI (14) line also suggest that the GBP/USD pair could consolidate the latest weekly gains.
However, a convergence of the 50-DMA and 100-DMA, near 1.2140-45, appears a tough nut to crack for the Cable pair bears.
Following that, an upward-sloping support line from November, close to 1.1940 by the press time, can challenge the GBP/USD pair sellers.
Meanwhile, recovery moves not only need validation from the support-turned-resistance line of around 1.2365 but also need to provide a successful upside break of the 1.2445-50 area to convince the GBP/USD buyers.
Should the Cable pair manage to remain firmer past 1.2450, a run-up toward the May 2022 high of around 1.2665 can’t be ruled out.
GBP/USD: Daily chart
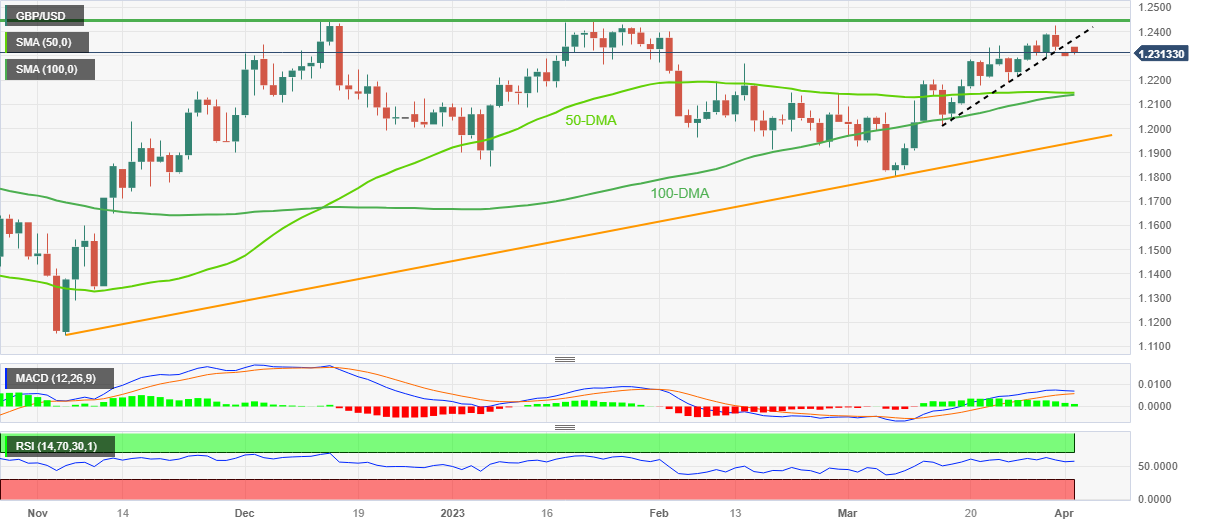
Trend: Further downside expected
-
00:09
USD/CAD retreats from 1.3500 as OPEC’s surprise cut drives oil price, US PMI eyed
- USD/CAD has failed to get accepted above 1.3500 as the higher oil price has strengthened the Canadian Dollar.
- The USD Index has scaled above 102.80 as higher oil prices would fuel persistent United States inflation.
- Canada’s upbeat January GDP data has trimmed the chances of reporting an overall quarterly contraction ahead.
The USD/CAD has retreated from 1.3520 after a rebound attempt followed by a gap-down opening from 1.3488 in the early Tokyo session. The Loonie asset has continued its downside journey as the oil price has soared dramatically after the announcement of a surprise cut in oil production by OPEC+. The oil cartel has decided to cut the oil production further by 1.16 million barrels each day, which has pushed the overall pledge of oil cut to 3.66 million bpd.
It is worth noting that Canada is the leading exporter of oil to the United States and significantly higher oil prices have infused fresh blood into the Canadian Dollar.
The Canadian Dollar remained in action on Friday after the release of upbeat monthly Gross Domestic Product (GDP) (Jan) data. The economic data landed at 0.5%, higher than the estimates of 0.3%. The GDP data was contracted by 0.1% in December and an optimist start of 2023 has trimmed chances of reporting an overall contraction ahead.
Meanwhile, S&P500 futures have recovered some of their losses posted in Asia, portraying recovery in the risk appetite of the market participants. It looks like investors have started digesting the consequences of higher oil prices. The US Dollar Index (DXY) has scaled above 102.80 as higher oil prices would fuel persistent United States inflation.
Going forward, the US ISM Manufacturing PMI data will be keenly watched. According to the consensus, the Manufacturing PMI is expected to decline marginally to 47.5 from the former release of 47.7. Investors should be aware that the US Manufacturing PMI has remained below 50.0 consecutively in the past four months.
From the US Manufacturing PMI gamut, New Orders Index would hog the limelight as it provides cues about the manufacturing outlook. The forward demand for the manufacturing sector is expected to contract significantly to 44.6 vs. the prior release of 47.00.
-
00:00
Australia S&P Global Manufacturing PMI: 49.1 (March) vs 48.7
-