Notícias do Mercado
-
22:41
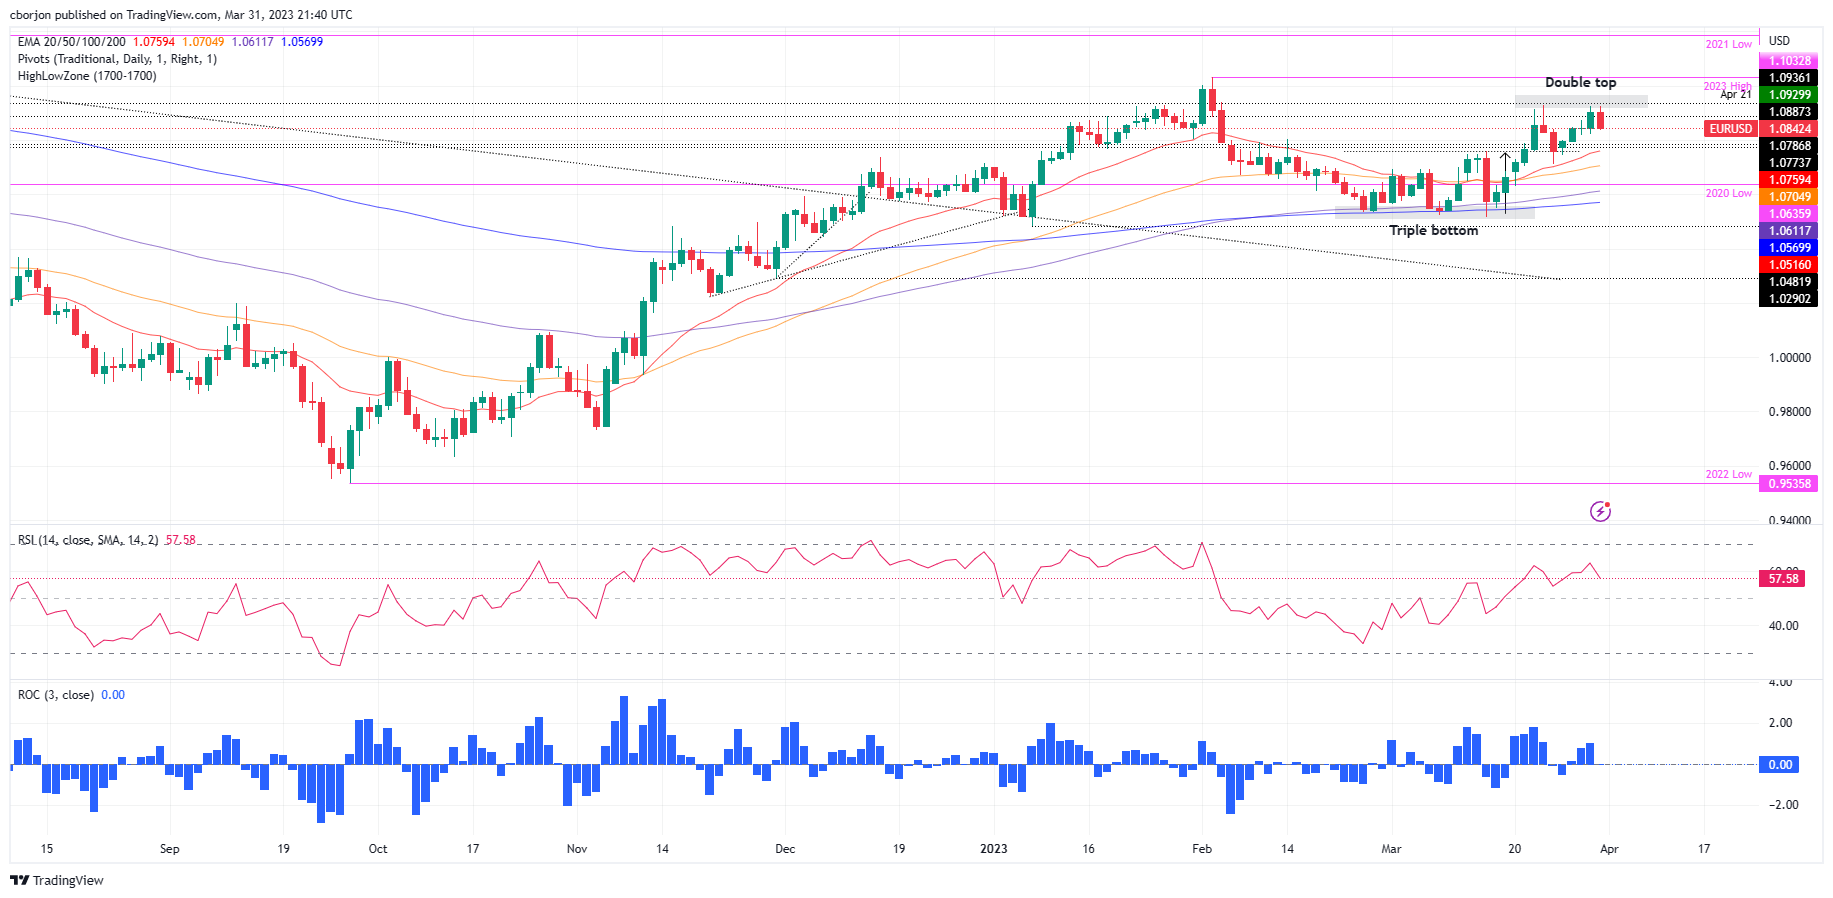
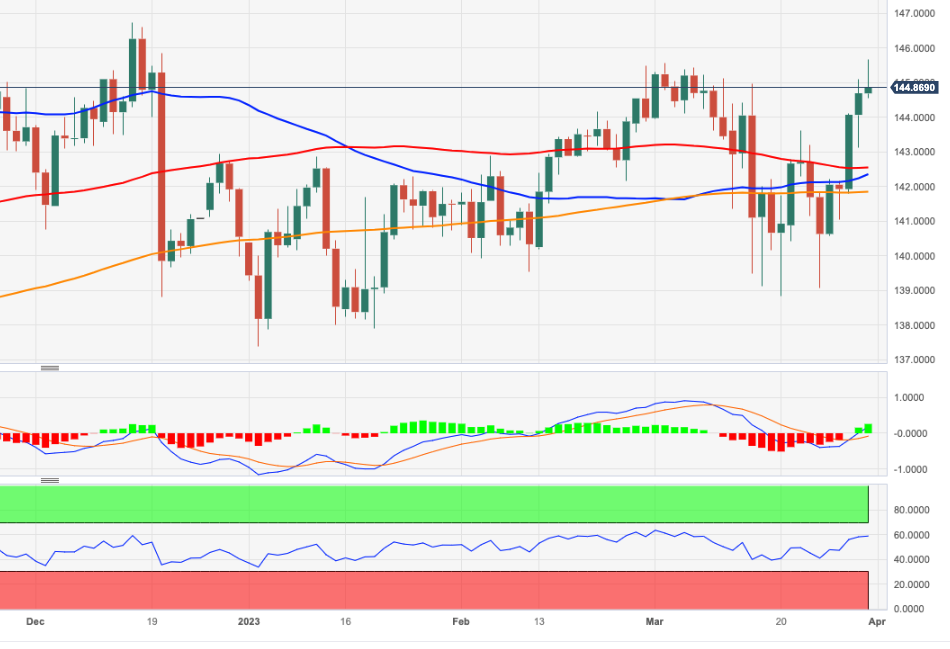
EUR/USD Price Analysis: Drops below 1.09 as double top forms, threatening to negate a triple bottom
- A triple bottom in the EUR/USD daily chart remains in play but at a brisk of being negated.
- EUR/USD’s price action during the last couple of weeks created a double top, which could shift the pair’s bias.
The Euro (EUR) drops from around weekly highs of 1.0925 on a buoyant US Dollar (USD) and on buyers’ failure to crack the YTD high at 1.0929. Nevertheless, a triple bottom in the daily chart is intact, at the brisk of being negated. At the time of writing, the EUR/USD is trading at 1.0842.
EUR/USD Price action
Failure to hold prices above the 1.0900 figure has exposed the EUR/USD to further selling pressure. A triple bottom in the daily chart remains in play. But, the upward movement was capped at around March’s 23 high of 1.0929, ahead of testing 1.1000.
For a bullish resumption, EUR/USD buyers must reclaim 1.0900, followed by 1.0929. Break above will expose the 1.1000 figure, followed by the YTD high at 1.1032.
Another scenario has developed in the last couple of weeks. Albeit a “triple bottom” is in place, the formation of a double top emerged. Hence, if the EUR/USD continues to dive further and achieves a daily close below the March 24 swing low of 1.0713, it would pave the way to test 1.0500.
Backing up the latter scenario are oscillators. The Relative Strength Index (RSI), although at bullish territory, its slope turned downwards, while the Rate of Change (RoC) shifted neutral.
EUR/USD Daily chart
EUR/USD Technical levels
-
21:56
WTI surges from YTD lows and gains more than 9% in the week
- US Department of Commerce reported that PCE was below estimates, spurring speculations for a Fed shift.
- Oil prices rise after output reduction at several oilfields in northern Iraq’s Kurdistan region.
Western Texas Intermediate (WT), the US crude oil benchmark, is set to finish the week with more than 9% gains after touching a YTD low of $64.41. On Friday, WTI is trading at $75.60 PB, above its opening price by 1.74%.
Wall Street finished the week with substantial gains. Inflation data in the United States (US) reported by the Department of Commerce showed that Personal Consumption Expenditure (PCE) Index rose below estimates. Headline inflation came at 5% YoY, below forecasts of 5.3%, and core PCE was 4.6% YoY, below estimates.
Hence, the odds that the US Federal Reserve (Fed) could pause tightening its policy increased. The CME FedWatch Tool shows that the odds for a pause lie at 49.6%. The latest round of inflation data pointing down improved investors’ mood, meaning that less aggressive rate hikes could keep the US Dollar in check.
Oil prices jumped since the halt of Kurdistan oil export through Turkey at the beginning of the week. The total amount of oil shortage was 450K BPD.
In the meantime, according to Reuters sources, the Organization of Petroleum Export Countries (OPEC) agreed to stick to its crude output production at a meeting on Monday.
According to a survey conducted by Reuters, OPEC’s crude oil production for the current month is estimated at 28.90 million barrels per day BPD, which is a decrease of 70K BPD compared to February. Moreover, the current output is more than 700K BPD lower than what was recorded in September.
WTI Technical levels
-
21:32
United States CFTC S&P 500 NC Net Positions: $-224.7K vs previous $-202.5K
-
21:31
Australia CFTC AUD NC Net Positions rose from previous $-38.5K to $-35.4K
-
21:31
European Monetary Union CFTC EUR NC Net Positions up to €145K from previous €144.8K
-
21:31
Japan CFTC JPY NC Net Positions climbed from previous ¥-66.3K to ¥-54K
-
21:31
United States CFTC Gold NC Net Positions climbed from previous $158.6K to $181.6K
-
21:30
United States CFTC Oil NC Net Positions: 181.1K vs 154.3K
-
21:30
United Kingdom CFTC GBP NC Net Positions: £-24.1K vs previous £-20.5K
-
21:23
US: PCE inflation is still hot enough to warrant another rate hike in May – Wells Fargo
After the release of the March Core Persona Consumption Expenditure Price Index, analysts at Wells Fargo still expect the Federal Reserve (Fed) to hike interest rates by 25 bps at its May monetary policy meeting.
Inflation moderates, but Fed's job not yet done
“Inflation is slowing, but only gradually. The core PCE deflator rose slightly less than expected, up just 0.3% in February, and inflation data for January were revised lower as well. This is a positive development, but a win can't yet be declared.”
“The Fed has further work to do to get inflation back to its 2% target. The core PCE deflator is still running well-above target at a 4.9% annualized rate the past three months. We'd summarize the inflation development as a step in the right direction, but we think the elevated readings keep the heat turned up on the Fed, and thus still expect the Fed to hike rates an additional 25 bps at its May monetary policy meeting.”
-
20:59
AUD/USD stumbles on expectations for a Fed pivot after softer US inflation data
- Buoyant US Dollar was the main reason for the AUD/USD’s fall.
- US inflation continues to cool down, while consumer sentiment deteriorated in March.
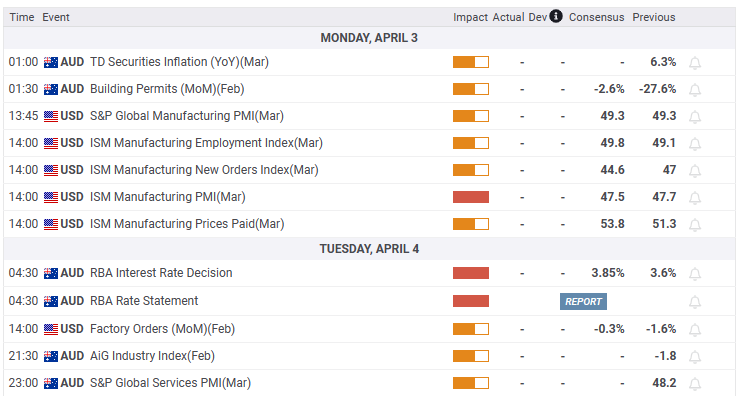
- TDS Analyst expects the RBA would keep rates on hold, on April’s meeting.
- AUD/USD Price Analysis: Subdued in the near term, awaiting for the RBA’s decision.
The Australian Dollar (AUD) retraces after hitting a weekly high of 0.6738, spurred on the American Dollar (USD) recovery as it got bolstered by weekly, monthly, and quarter-end flows. Wall Street is set to finish the week with gains, while US inflation data could cement the case for a pause in the Fed’s tightening cycle. The AUD/USD is trading at 0.6684, below its opening price by 0.43%.
AUD/USD dwindles below 0.6700 on a buoyant US Dollar
The Fed's preferred inflation gauge, the core PCE published by the US Department of Commerce, increased 4.6% YoY, lower than forecasts and beneath the previous month. Headline inflation was 5%, signaling that the Fed's tightening measures are still curbing inflation.
Susan Collins, President of the Federal Reserve Bank of Boston, expressed approval for the news but emphasized that the Fed still has work to accomplish.
The University of Michigan's (UoM) Consumer Sentiment on its final March reading was 62, worse than expected. At the same time, inflation expectations dropped. For the one-year horizon, American consumers forecast inflation at 3.6%, while for the 5-year horizon, inflation estimations dipped to 2.9%.
Of late, the New York Fed President John Williams said that an uncertain economic outlook and economic data would drive monetary policy. Williams expect inflation to drop to 3.5%, and the Gross Domestic Prodcut (GDP) to contract slightly before rebounding in 2024.
On inflation data, the AUD/USD reacted upwards to 0.6718 before reversing its course, fell sharply below the 0.6700 figure, and printed a daily low of 0.6670. Since then, the AUD/USD stabilized at around 0.6686.
On the Australian front, inflation data would give cues regarding the Reserve Bank of Australia’s (RBA) forward path. The TD Securities Inflation for February was 6.3% YoY, and any readings below the latter can discourage the RBA from continuing to tighten monetary conditions.
TDS expects an RBA’s pause on its tightening campaign
TD Securities Analysts in a note, “The Apr meeting is a close one, with analysts mixed about the RBA decision and markets pricing in no hike from the RBA. We now expect the Bank to pause at the April meeting given the lower Jan-Feb CPI prints and uncertainty over the outlook from the banking turmoil in the near-term.”
AUD/USD Technical analysis
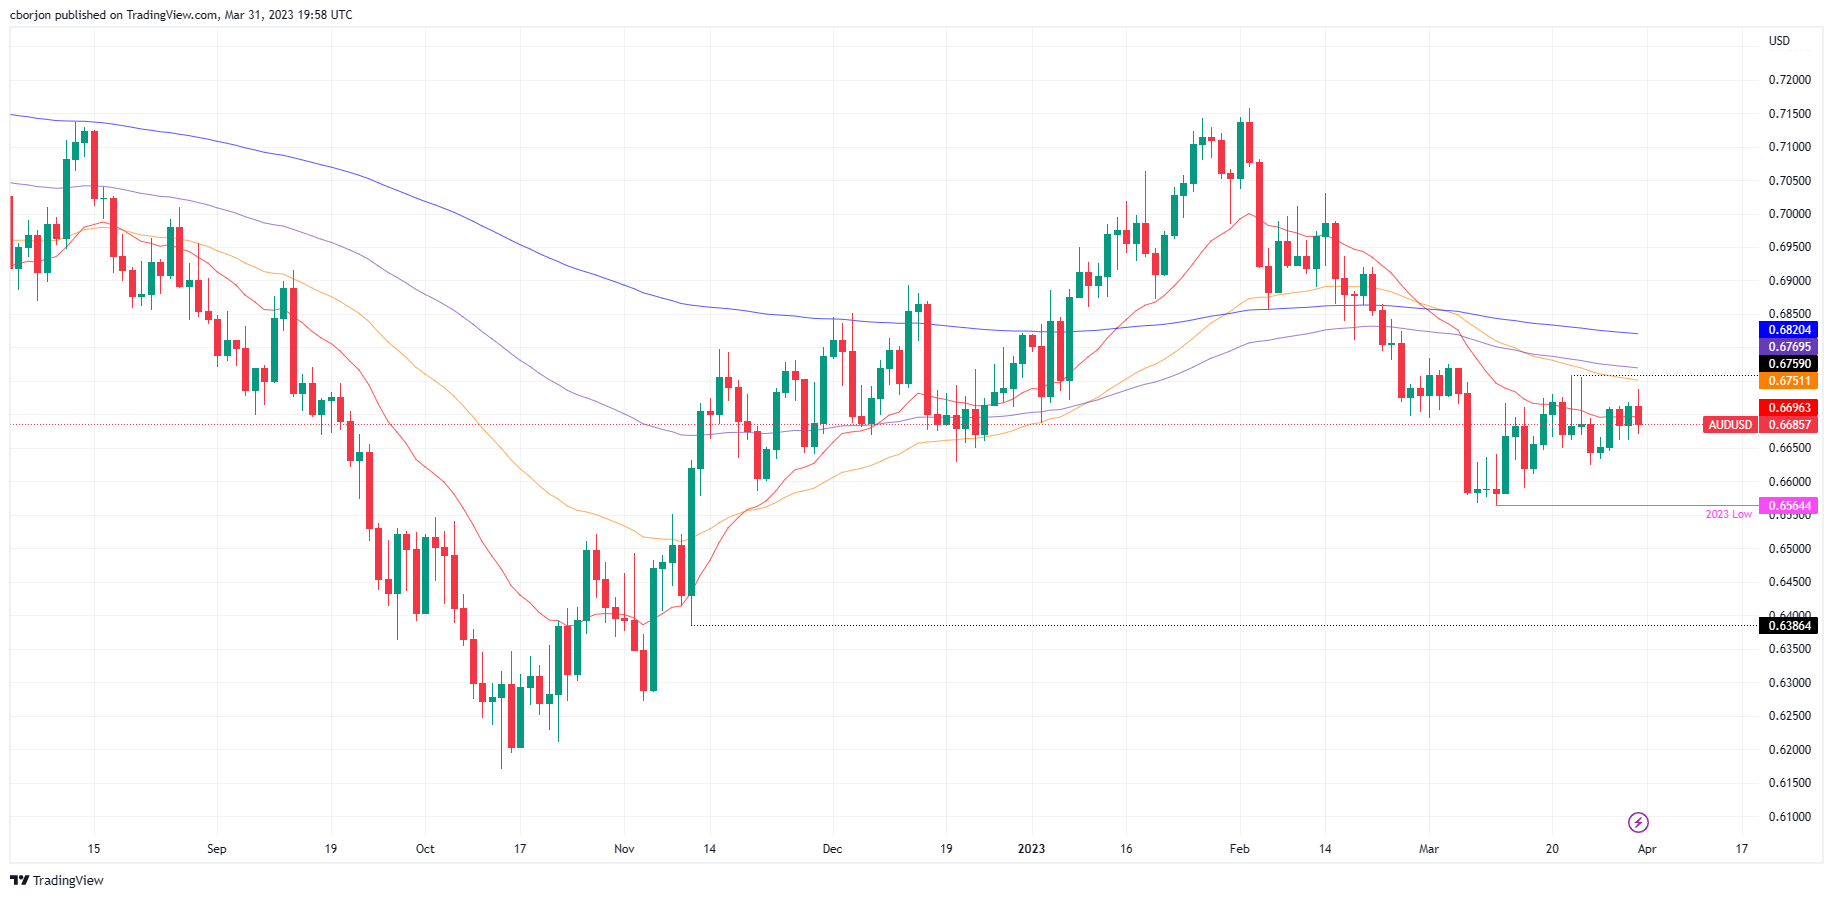
The AUD/USD is trading sideways, as shown by its daily chart, though tilted to the downside. For a bearish continuation, sellers need to reclaim the March 24 swing low at 0.6625, exposing the YTD lows at 0.6564. Once cleared, and the path towards November 10 at 0.6386 is on the cards. On the flip side, if buyers crack 0.6700, that could keep them hopeful that the AUD/USD could test 0.6800 in the near term.
What to watch?
-
20:56
Canada Employment: More modest gains in the coming months – NFB
Next Thursday, the Canadian employment report will be released. Analysts at National Bank of Canada expect a gain of 10,000 in jobs in March.
Key quotes:
“In Canada, March’s Labour Force Survey will be watched closely. The job market has been extraordinarily strong recently, with headcounts expanding by 350,000 over the past 6 months. And while signs of an upcoming reversal remain few and far between, we think such a pace is unsustainable in the medium term.”
“We thus expect more modest gains in the coming months, starting with a +10K result in March. Despite this gain, and assuming that the participation rate remained unchanged at 65.7%, the unemployment rate could still increase by one tenth to 5.1%, the result of yet another sharp expansion of the labor force.”
-
20:24
Fed’s Williams: Expects inflation to decline to around 3.25% this year
Federal Reserve Bank of New York President John C. Williams said in prepared remarks at the Housatonic Community College in Connecticut that the economic outlook is uncertain and that their decision will be driven by the data. He expects real GDP to grow modestly in 2023 and to pick up next year.
Key quotes:
“One aspect of inflation that’s important for achieving and sustaining price stability is the anchoring of inflation expectations. Various measures of longer-run inflation expectations have remained well anchored at levels consistent with our 2 percent goal.”
“While the FOMC has taken decisive steps to bring inflation down, lags exist between policy actions and their effects. It will take time for all of our inflation gears to move at a pace that takes us to our 2 percent target. I expect inflation to decline to around 3-1/4 percent this year, before moving closer to our longer-run goal in the next two years.”
“I expect real GDP to grow modestly this year and for growth to pick up somewhat next year. Slower growth and tighter monetary policy will likely lead to some softening in the labor market. So, I anticipate unemployment gradually rising to about 4-1/2 percent over the next year.”
“The economic outlook is uncertain, and our policy decisions will be driven by the data and the achievement of our maximum employment and price stability mandates. I am confident that our actions will bring inflation down to our 2 percent longer-run goal.”
-
20:09
Fed’s Collins: Tight monetary policy is key to lowering inflation
Federal Reserve Bank of Boston President Susan Collins reached the headlines again on Friday, this time in an interview with Reuters. She said that surprises makes it hard to predict what will happen at the next FOMC meeting in May.
The banking system is in “good shape” despite some “pockets” of trouble said Collins. According to her, actions have restored confidence in the sector. She thanked that the stigma tied to drawing on lending facilities have eased.
Regarding inflation, Collins welcomed the latest Core PCE report but warned that not enough progress has been made. Maintaining tight monetary policy is the key to lowering inflation, explained the Boston Fed President.
Fed's Collins: Need to balance risk that we don't do enough on inflation vs doing too much
-
19:33
Forex Today: Focus shifts to US employment data
A not-so-short week is ahead. Despite the Easter holidays, the US Employment report on Friday warrants action till the last day. The Dollar lost ground again in the last week of March, ending with losses in the first quarter. The short-term trend favors Dollar’s bears, but key data ahead could trigger a correction before it resumes the downside.
Here is what you need to know for next week:
US stocks finished the week, the month and the quarter on a positive note, with solid gains, something that seemed unlikely just three weeks ago when the Silicon Valley Bank (SVB) was closed by financial regulators.
The improvement in market sentiment weighed on the US Dollar, which lost ground across the board, at a moderate pace. Government bond yields rose as volatility eased in the Treasury market.
Higher yields and risk appetite sent the Japanese Yen sharply lower, which became the worst performer, falling even against the weak US Dollar. USD/JPY rose 250 pips, to the 20-week simple moving average at 133.50 that capped the upside.
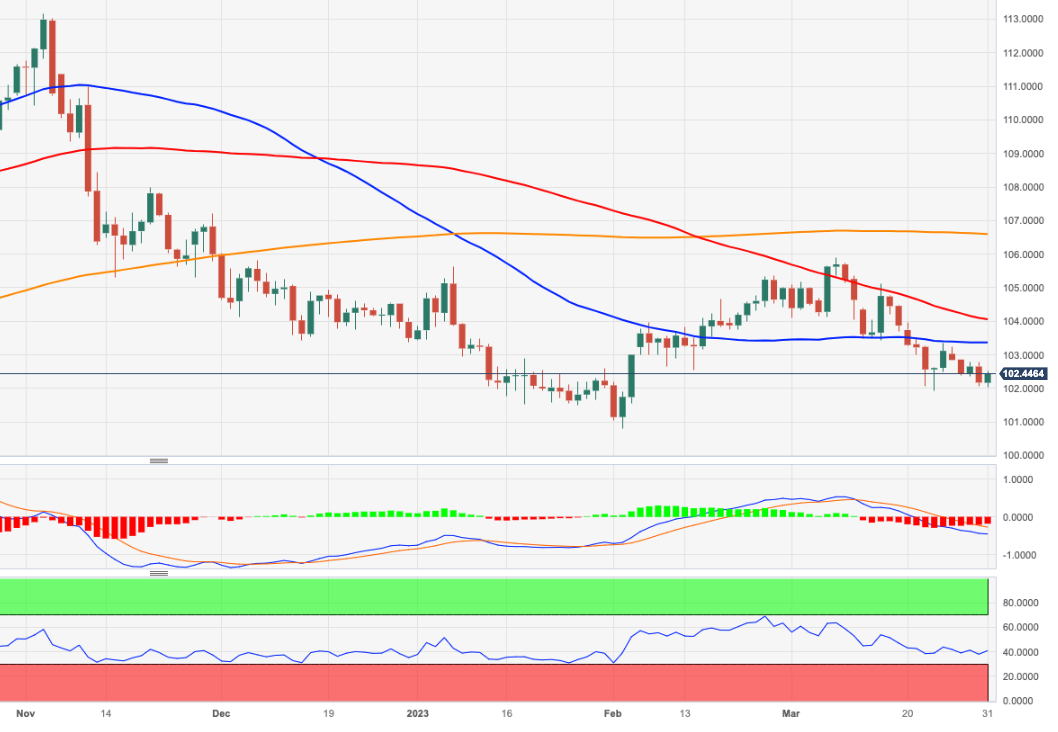
The rally in USD/JPY limited the downside in the US Dollar Index. The DXY posted the third weekly decline in a row and the lowest close since January, around 102.50.
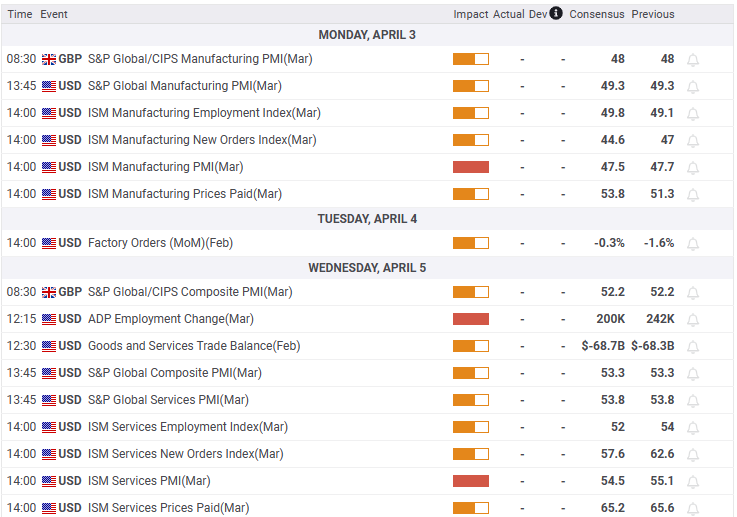
After an inflation-focused week, attention turns to activity and employment data. The March ISM report will help see how the US economy is performing, while the ADP private employment and Nonfarm Payrolls reports will show if the labor market remains tight. Market activity could be subdued because of Easter Holidays, particularly after Wednesday.
The Pound outperformed with GBP/USD rising for the third consecutive week and consolidating above 1.2300. Among the best trades of the week was going long GBP/JPY, which gained 2.50%.
It was a volatile week for the Swiss Franc. USD/CHF approached a key long-term support and then recovered some ground, rising to 0.9150. Next Monday, Switzerland will release inflation data.
AUD/USD posted a small weekly gain as it continued to move sideways. Australian inflation numbers boosted the odds that the Reserve Bank of Australia (RBA) will remain on hold next Tuesday.
NZD/USD rose during the week but once again found resistance around 0.6300. The Reserve Bank of New Zealand (RBNZ) will announce its monetary policy decision on Wednesday.
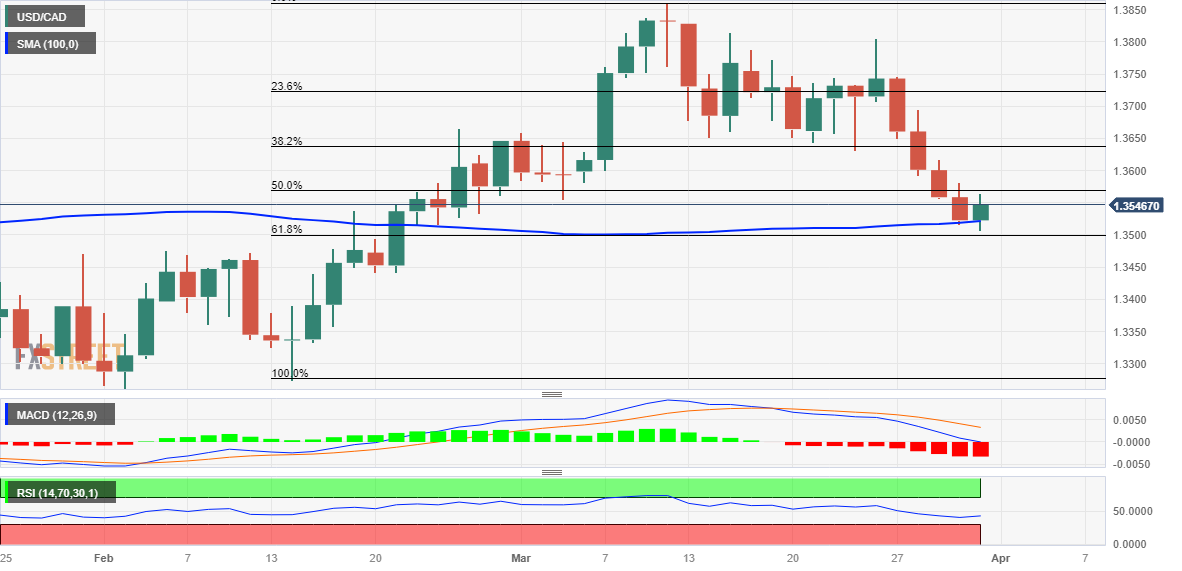
The Canadian Dollar caught up after lagging for weeks. USD/CAD lost 200 pips, to settle around 1.3540. CAD/JPY rose by 3.35%. Next Thursday, Canada will release its monthly jobs report.
Gold posted another weekly decline as the yellow metal struggles to reclaim the $2,000 level. On the contrary, Silver rose for the third consecutive week, reaching $24.00.
Like this article? Help us with some feedback by answering this survey:
Rate this content -
19:20
GBP/USD succumbs as market players buy US Dollars on weekly, quarter, and monthly-end flows
- Fed’s favorite inflation gauge signals that cumulative tightening continues to curb inflation.
- University of Michigan’s Consumer Sentiment was worse than expected, though inflation expectations cooled.
- GBP/USD Price Analysis: Above 1.2400 could challenge the YTD high; otherwise, it would remain sideways, at around 1.2300-1.2400.
The Pound Sterling (GBP) traded with decent losses in the mid-North American session, pressured by a resurgence of the US Dollar (USD), trimming its Thursday’s losses. Although inflation data could spur a pivot in the US Federal Reserve (Fed) policy stance, market participants buy the US Dollar as the weekly, monthly, and quarter-end looms. At the time of writing, the GBP/USD is trading at 1.2331.
US inflation edged lower, though Fed officials remain resilient in fighting inflation
US economic data from the Department of Commerce revealed that the Fed’s favorite inflation gauge, the core PCE rose 4.6% YoY, beneath forecasts and a prior’s month reading of 4.7%. Headline inflation was 5%, beneath January’s 5.3%, signaling that the cumulative tightening by the Fed continues to temper inflation.
The Fed Boston President Susan Collins welcomed the news but reiterated that the Fed has work to do. The New York Fed President, John Williams, will cross newswires later.
On other data, the University of Michigan (UoM) showed that Consumer Sentiment on its final March reading was 62, worse than expected. At the same time, inflation expectations dropped. For the one-year horizon, the estimated inflation rate is 3.6%, while for the 5-year horizon, consumers estimate inflation to be 2.9%.
After the US inflation data release, the GBP/USD hovered around 1.2400 before collapsing beneath the central pivot point at 1.2357 and extending its losses towards the 1.2340 area. However, an upward correction was capped at the former, and the GBP/USD resumed its downward trajectory, eyeing a test of the S1 pivot at 1.2320.
On the UK front, the economy expanded by 0.1% in Q4 2022, and by 0.6% YoY, according to data from the Office for National Statistics (ONS).
GBP/USD Technical analysis
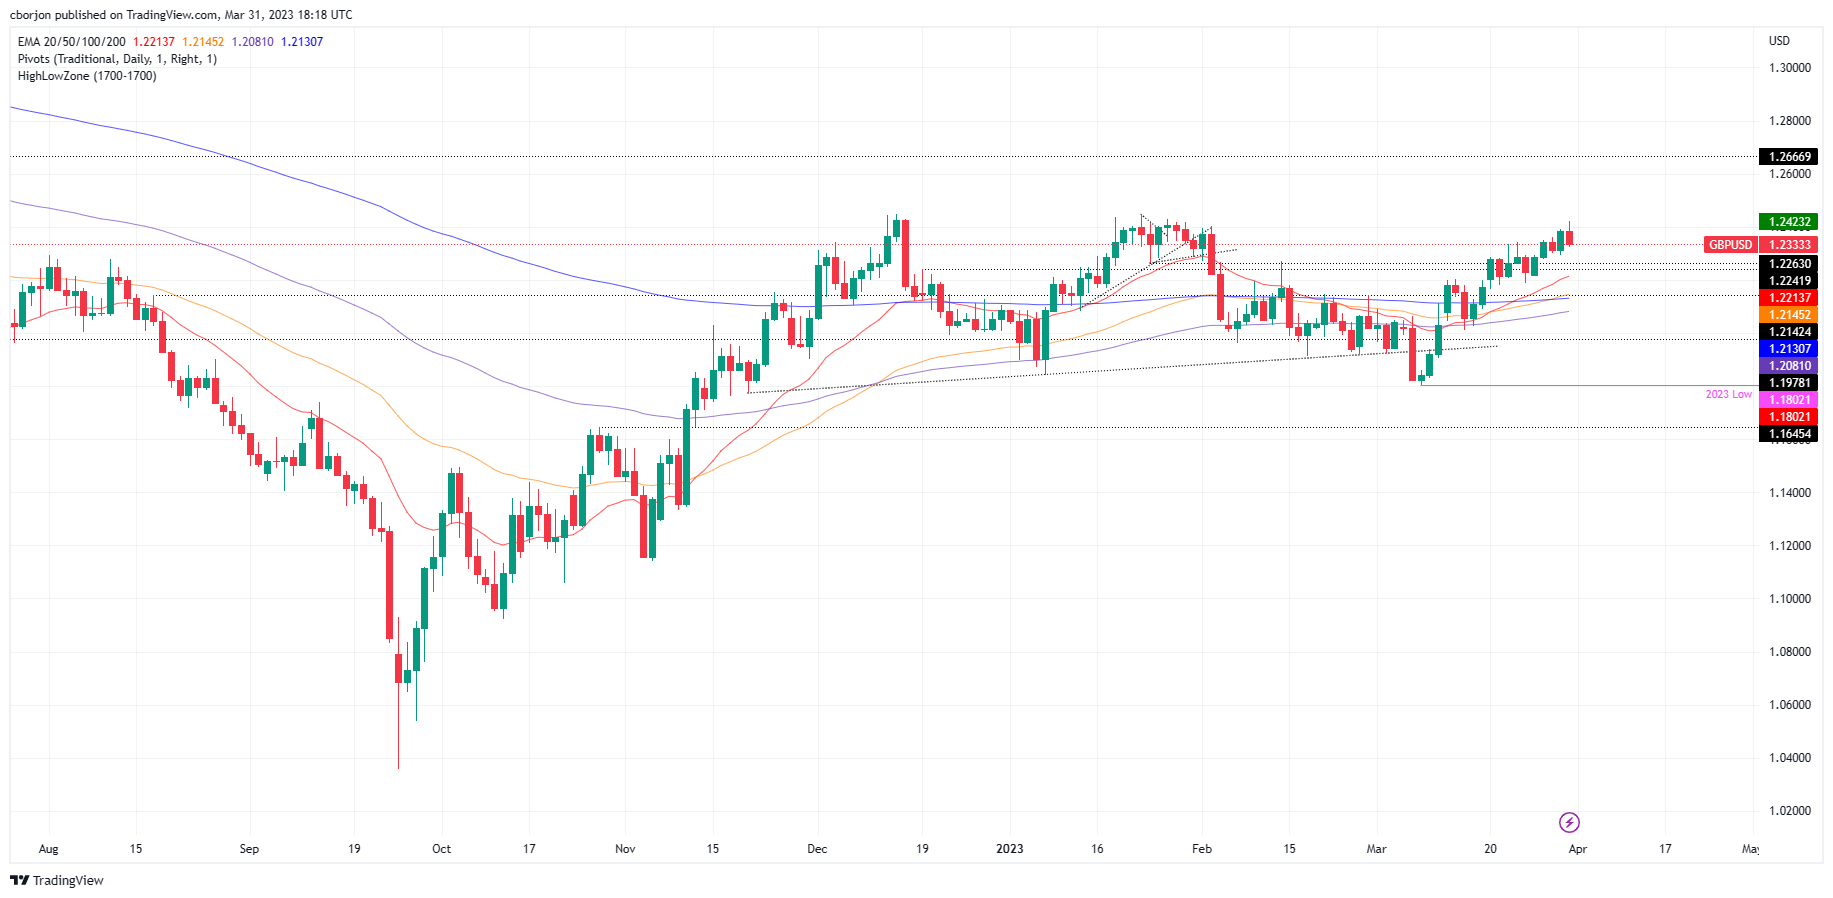
From a daily chart perspective, the GBP/USD would remain trading sideways after diving below 1.2400. However, the GBP/USD could consolidate in the 1.2300-1.2400 area before extending its recovery past the 1.2423 YTD high. That would pave the way towards 1.2500, with upside risks at a May 27 high of 1.2666. Otherwise, if the GBP/USD prints a close at around 1.2300, that could form a bearish engulfing candle pattern, setting the major for a pullback toward the 20-day Moving Average (MA) at 1.2213.
What to watch?
-
18:02
United States Baker Hughes US Oil Rig Count declined to 592 from previous 593
-
17:58
Silver Price Forecast: XAG/USD hits new monthly highs above $24.00, driven by falling US bond yields
- XAG/USD surpasses monthly highs amid positive market sentiment, despite the rising US Dollar.
- US Core PCE was below estimates, opening the door for a less aggressive Fed.
- XAG/USD Price Analysis: Expected to continue its rally and test the YTD high of $24.63
Silver price trades at new monthly highs above $24.00 a troy ounce, sponsored by falling US Treasury bond yields. Sentiment continues to be the main driver in the session, with US equities set to finish the month with gains. At the time of writing, the XAG/USD is trading at $24.10, gaining 0.89%.
Fed's Collins welcomed inflation data, but reiterated the Fed's has work left to do
Wall Street continues to print gains across the board. The greenback is pressured by data from the United States (US), which showed inflation tempering; therefore, less aggression by the US Federal Reserve (Fed) is needed.
The Department of Commerce (DoC) featured the Fed’s preferred gauge for inflation, the Core Personal Consumption Expenditure (PCE) for February, which rose by 4.6% YoY, below estimates of 4.7%, while the headline inflation dropped from 5.3% to 5% YoY.
Consequently, US Treasury bond yields edged lower, a tailwind for the white metal, which pushed through the $24.00 threshold for the first time since February 2. The US 10-year Treasury bond yield dropped four basis points (bps) at 3.516%, while US Real Yields stood at 1.26% as of March 30.
In the meantime, the University of Michigan (UoM) Consumer Sentiment for March was lower than expected, at 62, as opposed to the foreseen 67. Moreover, the survey updated that American consumers revised their inflation expectations downward. For the one-year horizon, the estimated inflation rate is 3.6%, while for the 5-year horizon, consumers estimate inflation to be 2.9%.
On the central bank side, Boston Fed’s President Susan Collins said that PCE inflation data is positive news, yet there’s still more work to do to bring inflation towards the 2% target.
XAG/USD Technical analysis
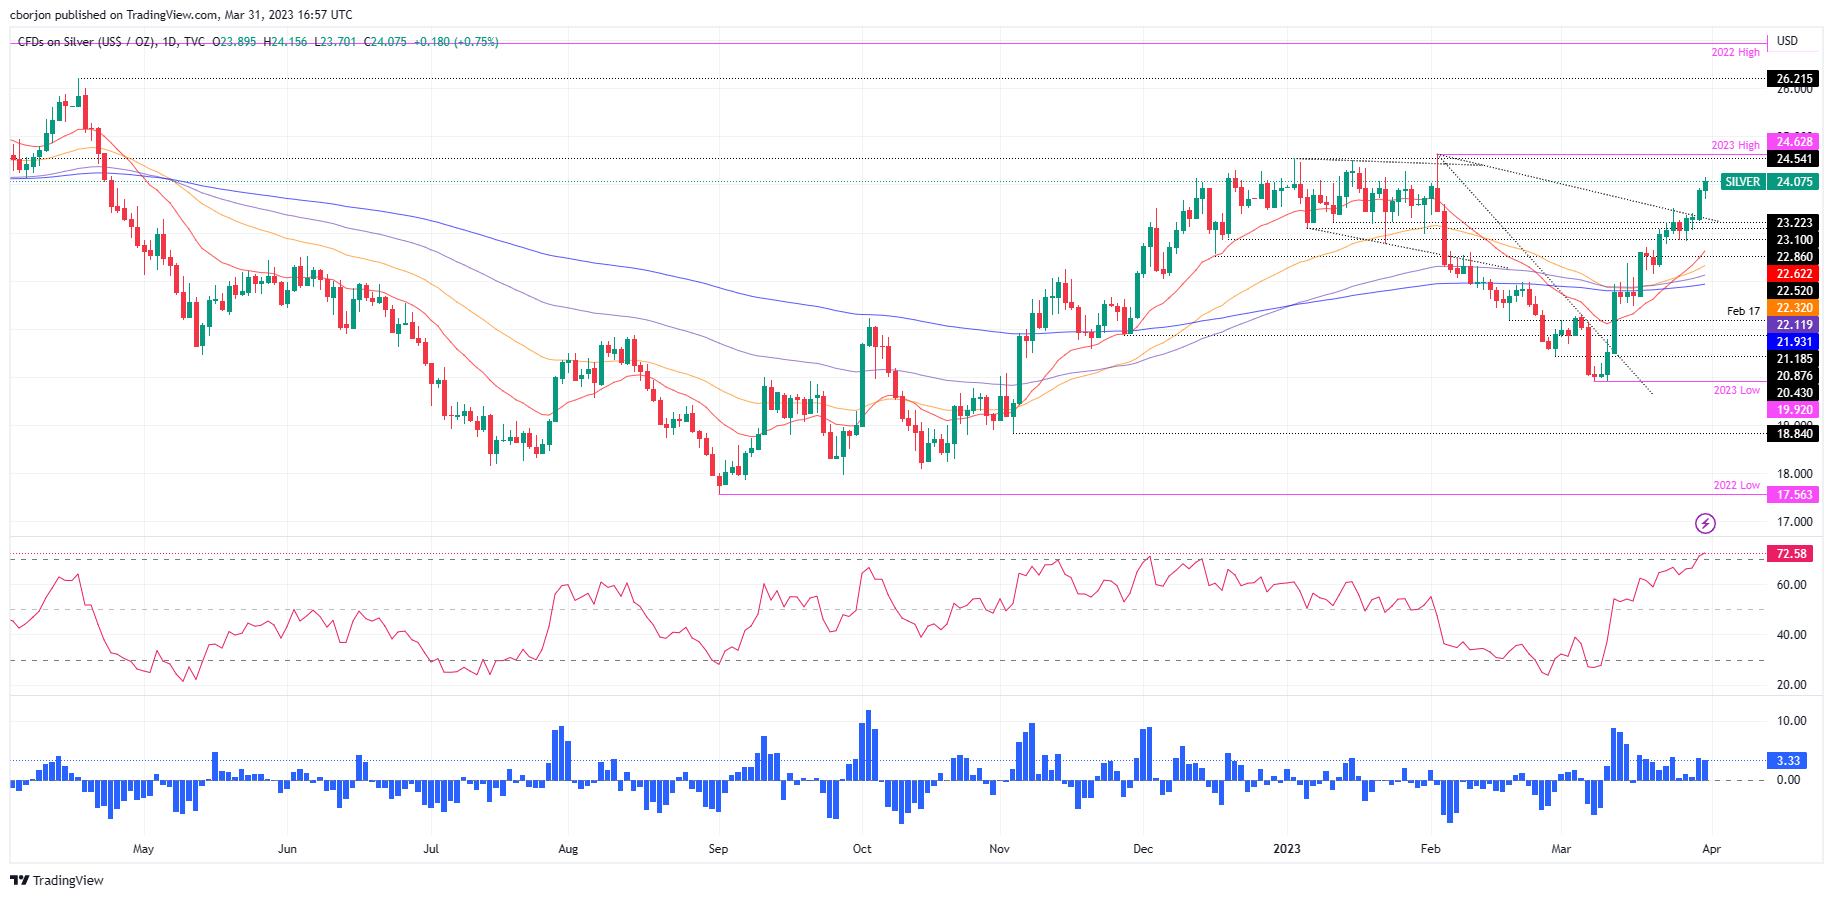
Given the backdrop, the XAG/USD is set to extend its rally and test the YTD high at $24.63. The Relative Strength Index (RSI), albeit at overbought conditions, backed the uptrend, while the Rate of Change (RoC) portrays buyers piled around the $22.00 area. The XAG/USD might consolidate as the RSI exits from overbought conditions, as buyers prepare to assault $25.00. if the XAG/USD clears $24.63, the psychological $25.00 barrier would be exposed. Once cleared, on April 18, 2022, resistance at $26.21 is next.
-
16:32
USD/CHF hits weekly low below 0.9120 as US inflation data cools
- USD/CHF drops as US core PCE rose by 4.6% YoY, below the previous month.
- The University of Michigan’s Consumer Sentiment was below expected.
- USD/CHF Price Analysis: Presses toward 0.9100, but sellers struggle to break that support below.
USD/CHF falls to a new weekly low below 0.9126, sponsored by economic data from the United States (US) showing that inflation is cooling down. Hence, bets that the US Federal Reserve (Fed) might pause its tightening cycle, increasing, meaning the greenback would be under pressure. At the time of writing, the USD/CHF is trading at 0.9127, below its opening price.
US core PCE edges lower, cementing the case for a Fed’s pause
The Federal Reserve’s preferred gauge for inflation, the core Personal Consumption Expenditure (PCE), rose by 4.6% YoY, below the previous month’s 4.7%. On a monthly basis, inflation that excludes food and energy rose by 0.3%, below estimates of 0.4%.
Of late, the University of Michigan’s (UoM) Consumer Sentiment was below estimates of 67 and came at 62. According to Joanne Hsu, director of the survey, said, “Overall, our data revealed multiple signs that consumers increasingly expect a recession ahead.” The same study showed that inflation expectations for one year stood at 3.6%, down from 3.8%, while for a 5-year horizon, consumers estimate inflation at 2.9%.
The USD/CHF extended its losses amidst positive news on the US front. Although the Boston Fed President Susan Collins welcomed the data, she said it hadn’t changed her outlook, adding that the Fed has more work to do.
On the Switzerland front, the Swiss National Bank (SNB) continued to tighten monetary conditions when it raised rates by 50 bps on March 23 toward the 1.50% area. Furthermore, Retail Sales in February rose by 0.3% compared with the previous year, giving a leg-down to the USD/CHF pair.
USD/CHF Technical analysis
Even though the USD/CHF continued to press towards the 0.9100 figure, the sellers could not register a decisive break below the latter. Technical indicators like the Relative Strength Index (RSI) and the Rate of Change (RoC) are flat, suggesting that sellers are jumping from the boat. However, if the USD/CHF dives below 0.9100, that would open the door to challenge the YTD low at 0.9059. On the flip side, buyers reclaiming 0.9150 could pave the way for a recovery to 0.9200 and beyond.
-
16:05
Colombia National Jobless Rate meets expectations (12.7%) in February
-
15:59
Gold Price Forecast: XAU/USD to hit $2,050 towards year-end – ANZ
Gold is supported by weaker USD and easing inflationary pressures. Economists at ANZ Bank forecast XAU/USD at $2,050 by the end of the year.
Silver to outperform Gold in a rising price environment
“We believe US recessionary fears, easing inflationary pressure and dovish monetary policy will drive Gold’s performance.”
“The macro backdrop will also remain supportive, so any price dips should be short lived, prompting opportunistic buying. We target gold at $2,050 towards year-end.”
“We expect Silver to outperform Gold in a rising price environment.”
-
15:33
EUR/GBP to revisit 0.90 as China reopening favor Euro relative to its European peers – TDS
Economists at TD Securities discuss GBP outlook and expect the EUR/BP pair to hit the 0.90 level.
Data trends favor EUR/GBP higher
“We upgraded our GBP view, underscoring the lift from a weaker USD profile. That said, we still think EUR/GBP revisits 0.90, as China reopening and relative Asian growth outperformance favor EUR relative to its European peers.”
“Domestic fragilities should keep GBP anchored relative to EUR and CHF at least.”
“GBP's growth and inflation mix is still poor relative to EUR, which gets a better terms of trade and China lift.”
-
15:31
US President Biden: We are making progress in the fight against inflation
US President Joe Biden delivered a statement following the February PCE report, highlighting the progress in the “fight against inflation”.
Quotes from the statement:
“We are making progress in the fight against inflation. Today’s report shows annual inflation down by nearly 30 percent from this summer, against a backdrop of low unemployment and steady growth. The fight against inflation isn’t over, and every day my Administration is working to give families more breathing room.”
“In February we saw the lowest food inflation in nearly two years.”
“We should continue to invest in America from the middle out and the bottom up. This is not the time to turn back to trickle-down economics by cutting American manufacturing and other critical programs American families count on, just to pay for tax cuts for the wealthy, Big Pharma, and Big Oil. The last thing our economy needs right now is the reckless threat of a chaotic default. Those threats must be taken off the table.”
-
15:23
US: UoM Consumer Confidence Index drops from 67.0 to 62.0 in March vs. 63.2 expected
- March UoM Consumer Confidence Index revised lower to 62.0 from 63.4 flash estimate.
- Limited impact from turmoil in the banking sector.
- DXY up 0.09% for the day, off highs.
Consumer sentiment in the US weakened in March more than what was previously reported, according to the University of Michigan's (UoM) Consumer Confidence report. The Consumer Sentiment Index was revised from the flash estimate of 63.4 to 62.0 in March, against the market expectation of 63.2. Current Economic Conditions fell from 70.7 in February to 66.3 and the Index of Consumer Expectations declined from 64.7 to 59.2.
“This month’s turmoil in the banking sector had limited impact on consumer sentiment, which was already exhibiting downward momentum prior to the collapse of Silicon Valley Bank. Overall, our data revealed multiple signs that consumers increasingly expect a recession ahead”, said Joanne Hsu, Surveys of Consumers Director.
Regarding inflation, year-ahead expectations “receded from 4.1% in February to 3.6%, the lowest reading since April 2021, but remained well above the 2.3-3.0% range seen in the two years prior to the pandemic.” Five-year expectations came in at 2.9% for the fourth consecutive month.
Market reaction
The US Dollar Index is rising modestly on Friday. It started to move off highs after the US Core PCE March report and it has been trending lower afterwards. As of writing trades at 102.25.
-
15:12
USD/JPY needs more BoJ action to justify a big move lower – SocGen
The Euro needs time, but the Yen still needs change, economists at Société Générale report.
EUR/USD: Waiting for things to calm down before rising
“If/when uncertainty about the global macro and geopolitical backdrop decreases, EUR/USD should move higher. USD/JPY on the other hand needs more BoJ action to justify a big move lower unless Fed easing becomes a realistic short-term prospect.”
“If the BoJ does nothing, and Treasury yields don’t fall, USD/JPY will probably rise. We expect the next policy move in June, which doesn’t really suggest that USD/JPY will break out of its 128-138 year-to-date range.”
“We haven’t changed our forecast of an eventual move to USD/JPY 125, but a more aggressive BoJ adjustment than we expect could see another sharp bout of Yen strength.”
-
15:00
United States Michigan Consumer Sentiment Index below expectations (63.2) in March: Actual (62)
-
15:00
United States UoM 5-year Consumer Inflation Expectation: 2.9% (March) vs 2.8%
-
14:56
USD/CAD: 1.35 support could face a serious test should US data print on the softer side in coming weeks – TDS
The Canadian economy saw a sharp rebound to begin the new year. CAD barely budged following the stronger data. 1.35 should offer key support but could face a serious test should US data falter in the coming weeks, economists at TD Securities report.
CAD GDP starts 2023 on an even stronger foot than expected
“The Canadian economy roared back to life in January with industry-level GDP exceeding the market consensus with a 0.5% gain. Details were even more upbeat, with broad-based growth and new projections for GDP to rise by 0.3% in February.”
“The CAD barely changed following the stronger GDP report. That may be muddled by quarter-end rebalancing flows. That said, USD/CAD has put in a decent reversal in rather short order from 1.38. So, insofar as this data has altered probabilities for BoC pricing, the pair may have already been priced in.”
“For now, we think 1.35 will be key support for USD/CAD but note that the pair still trades moderately rich. Should US data print on the softer side in the next couple of weeks, that support level could face a serious test.”
-
14:45
United States Chicago Purchasing Managers' Index registered at 43.8 above expectations (43.4) in March
-
14:43
GBP/USD recovers modest intraday losses post-US PCE Price Index, flat-lines below 1.2300
- GBP/USD attracts some dip-buying and remains closer to over a two-month high set on Friday.
- The USD pares intraday gains in reaction to softer inflation data and lends support to the pair.
- The fundamental backdrop favours bulls and supports prospects for a further appreciating move.
The GBP/USD pair reverses a dip to the 1.2355-1.2350 region and trades in the neutral territory during the early North American session on Friday. The pair, however, remains below over a two-month high touched this Friday and is currently placed around the 1.2380-1.2385 zone, nearly unchanged for the day.
The US Dollar (USD) trims a part of its intraday gains following the release of the Personal Consumption Expenditures (PCE) Price Index and turns out to be a key factor that assists the GBP/USD pair to attract fresh buyers at lower levels. In fact, the US Bureau of Economic Analysis reported that the headline PCE Price Index decelerated to a 5% YoY rate in February - the slowest pace of rise since September 2021. Adding to this, the Fed's favourite inflation indicator - Core PCE Deflator - edged down to 4.7% during the reported month against consensus estimates pointing to a steady reading of 4.7%.
The data fuels speculations that the Federal Reserve might soon pause the rate-hiking cycle in the wake of the turmoil in the banking sector, which is evident from a fresh leg down in the US Treasury bond yields. This, along with the prevalent risk-on mood, acts as a headwind for the safe-haven Greenback and lends support to the GBP/USD pair. The British Pound is further underpinned by the prospects for additional interest rate hikes by the Bank of England (BoE). The bets were reaffirmed by the UK GDP print, which showed that the economy expanded by 0.1% during the fourth quarter.
The fundamental backdrop favours bullish traders and suggests that the path of least resistance for the GBP/USD pair is to the upside. Hence, any meaningful pullback might still be seen as a buying opportunity and is more likely to remain limited, at least for the time being. Nevertheless, spot prices remain on track to register strong weekly gains and end in the green for the sixth successive week.
Technical levels to watch
-
14:38
Commodities prices to trend higher in 2023 and beyond – UBS
The global commodities sector has come under pressure in March. But strategists at UBS remain most preferred in this asset class.
Playing the long game in commodities
“We continue to see opportunities in longer-dated Brent Oil contracts with a price target of $100/bbl.”
“We also recommend a long Platinum trade, with a price target of $1,150 due to the metal’s close correlation to Gold.”
“We also see opportunities in selling the downside price risks in Crude oil, Copper, Nickel, Gold and Platinum.”
See – Gold Price Forecast: XAU/USD could reach end-March 2024 target of $2,100 earlier than expected – UBS
-
14:27
USD Index retreats from daily highs near 102.50 post-PCE
- The index loses momentum near the 102.50 region.
- US PCE showed further loss of traction in February.
- Final Consumer Sentiment comes next in the docket.
The greenback, in terms of the USD Index (DXY), gives away part of the earlier advance to daily highs in the 102.50/55 band.
USD Index trims gains post-PCE
Following the earlier move to daily peaks near 102.50, the index now comes under some selling pressure after the downtrend in US inflation figures was somewhat “confirmed” by the PCE results.
Indeed, prices tracked by the headline PCE rose 5.0% in the year to February and 4.6% when it comes to the Core PCE. Further data releases showed Personal Income rose 0.3% MoM and Personal Spending increased 0.2% vs. the previous month.
Later in the session, the final readings of the Michigan Consumer Sentiment for the month of March are due.
From the Fed’s backyard, Boston Fed S.Collins was again on the wires after suggesting that other sectors should respond to the tighter monetary conditions in the next quarters at the time when she noted that data indicating a slowing economy is welcomed by the Fed.
In the wake of the PCE release, the probability of a rate hike by the Fed at the May event is slightly favoured vs. a “no hike” according to CME Group’s FedWatch Tool.
What to look for around USD
The index rebounds markedly on the back of some hawkish comments from Fed rate setters as of late, although the persistent disinflation – this time via lower PCE figures – could lend support to a potential pivot in May and thus keep the buck under pressure.
So far, speculation of a potential impasse by the Fed in the short-term horizon should keep weighing on the dollar, although the resilience of the US economy and the hawkish narrative from Fed speakers are all seen playing against that view for the time being.
Key events in the US this week: PCE, Personal Income/Spending, Final Michigan Consumer Sentiment (Friday).
Eminent issues on the back boiler: Persistent debate over a soft/hard landing of the US economy. Terminal Interest rate near the peak vs. speculation of rate cuts in 2024. Fed’s pivot. Geopolitical effervescence vs. Russia and China. US-China trade conflict.
USD Index relevant levels
Now, the index is advancing 0.21% at 102.38 and faces the next resistance level at 103.36 (55-day SMA) followed by 104.05 (100-day SMA) and then 105.88 (2023 high March 8). On the other hand, the breach of 101.93 (monthly low March 23) would open the door to 100.82 (2023 low February 2) and finally 100.00 (psychological level).
-
14:20
EUR/USD to be at 1.14 at year-end as the ECB’s hawkish stance will provide a tailwind for the Euro – ANZ
Economists at ANZ Bank expect the EUR/USD pair to race higher toward 1.14 by the end of the year.
Relative fundamentals are positive for the EUR vs the USD
“The Euro remains under-valued based on our fair value models and as interest rates between the ECB and Fed narrow, we expect the EUR to outperform.”
“We forecast the EUR/USD to be at 1.14 at year-end as the ECB’s hawkish stance will provide a tailwind for the Euro.”
“While the EUR/USD pair might experience volatility due to the vulnerabilities in the global banking sector, we believe relative fundamentals are positive for the EUR vs the USD.”
-
14:06
USD/MXN to head gradually higher toward 18.70 in Q2 – TDS
Banxico delivered a 25 bps hike, in line with the forward guidance it offered in February. The MXN reacted with a 0.4% depreciation towards 18.12 immediately after the announcement. The decision is in line with TD Securities’ expectation of a weaker MXN in the three-month horizon.
Banxico delivered what was promised
“Banxico hiked the policy rate in 25 bps, in line with our expectation and its forward guidance offered in early February. Despite lack of explicit acknowledgment by the central bank, we think the central bank has reached terminal at 11.25%.”
“Looking forward, the combination of Banxico stopping its hiking cycle and a repricing of idiosyncratic factors is behind our USD/MXN expectation of gradual weakening towards 18.70 in Q2.”
-
14:01
EUR/USD rises toward 1.0900 after US Core PCE
- US February Core PCE inflation comes in at 4.6%, below 4.7% expected.
- US yields hits fresh daily lows, US Dollar weakens.
- EUR/USD erases most of it day’s losses after numbers.
The EUR/USD rose from 1.0866 to 1.0895 following the release of US Core Consumer inflation that came in slightly below expectations. The figures weighed on the US Dollar that lost ground across the board.
The Core Personal Consumption Expenditures Price Index rose 0.3% in February, less than the 0.4% of market consensus to an annual rate of 4.6%, below the 4.7% of January. The PCE Price Index rose 0.3% in February and 5% YoY. The same report showed that Personal income grew by 0.3%, above the 0.2% expected while Personal Spending rose by 0.5%, surpassing consensus of 0.3%
The numbers showed consumer inflation in the US falling slowly. The February core CPE matched the lowest reading in 15 months. Those numbers could be welcome by the Fed, but still shows inflation remains elevated. The Chicago PMI and University of Michigan’s Consumer Confidence will be released later on Friday.
In the Eurozone, the Harmonised CPI came in softer at 6.9% YoY in March, down from 8.5%, below expectations of a drop to 7.1%. The Core CPI steadied at 5.7% YoY.
The US Dollar fell moderately across the board after the report as US yields sank. The 10-year Treasury yield fell from 3.54% to 3.51%, the lowest since Tuesday. The DXY is still up for the day, but it moved off highs.
The EUR/USD moved to the upside, approaching 1.0900. Still it remains below that relevant area. Earlier it peaked at 1.0925, before turning to the downside. It bottomed at 1.0863. On a weekly basis, the pair is heading toward the highest close in a year.
In the short term, the pair is moving with a bullish bias but is being unable to break the 1.0925/30 resistance and shows difficulties holding above 1.0900. Downward correction could find support at 1.0855/60 and 1.0820.
Technical levels
-
14:00
Fed's Collins: Need to balance risk that we don't do enough on inflation vs doing too much
In an interview with Bloomberg TV on Friday, Federal Reserve Bank of Boston President Susan Collins said that they are likely to see at least some impact of banking stress on credit conditions, via Reuters.
Additional takeaways
"We need to balance risk that we don't do enough on inflation vs doing too much."
"Banking stress is certainly a factor."
"There's a pathway to bringing inflation down without a significant downturn."
There were mistakes made on Silicon Valley Bank by the Fed."
"It will still be some time but over coming quarters we should see other sectors responding to tighter monetary policy."
Market reaction
These comments failed to trigger a reaction and the US Dollar Index was last seen gaining 0.15% on a daily basis at 102.32.
-
13:55
USD/CHF to end the year lower at 0.90 – ANZ
Economists at ANZ Bank expect the Swiss Franc to recover and forecast the USD/CHF pair at 0.90 by the end of the year.
Potential to recover after the dust settles
“While the Swiss Franc has struggled in recent weeks, sound domestic fundamentals and a hawkish, activist central bank affords the currency the potential to recover after the dust settles.”
“We see the USD/CHF pair moving to 0.90 by the end of 2023.”
See: Franc is a “safe haven,” but not a perfect one – Commerzbank
-
13:44
USD/JPY retreats further from two-week high, slides below 133.00 post-US PCE Price Index
- USD/JPY retreats from a two-week high, though lacks follow-through selling.
- The USD pares intraday gains on softer inflation data and acts as a headwind.
- The risk-on environment undermines the safe-haven JPY and to lends support.
The USD/JPY pair surrenders a major part of its intraday gains to a two-week high and retreats below the 133.00 round-figure mark during the early North American session on Friday.
The modest intraday US Dollar (USD) uptick loses steam after the US Bureau of Economic Analysis reported that the Personal Consumption Expenditures (PCE) Price Index decelerated to a 5% YoY rate in February from 5.3% previous. Adding to this, the Core PCE Price Index - the Fed's preferred inflation gauge - unexpectedly edged lower to a 4.6% YoY rate from 4.7% in January. The data adds to the uncertainty about the Fed's rate-hike path, which acts as a headwind for the Greenback and prompts some intraday selling around the USD/JPY pair.
Bearish traders further took cues from a modest pullback in the US Treasury bond yields, which results in the narrowing of the US-Japan rate differential and benefits the Japanese Yen (JPY). That said, the underlying bullish tone around the global equity markets - amid easing fears of a full-blown banking crisis - continues to undermine the safe-haven JPY and remains supportive of a mildly positive tone around the USD/JPY pair. This, in turn, warrants caution for bearish traders and before positioning for any meaningful corrective pullback.
Friday's US economic docket also features the release of the Chicago PMI and revised Michigan Consumer Sentiment Index, though might do little to provide any meaningful impetus. Nevertheless, the USD/JPY pair still seems poised to register weekly gains for the first time in the previous five and remains at the mercy of the USD price dynamics heading into the weekend.
Technical levels to watch
-
13:43
Canada: Real GDP expands by 0.5% in January vs. 0.3% expected
- Canadian economy grew at a stronger pace than expected in January.
- USD/CAD clings to small daily gains slightly below 1.3550.
The real Gross Domestic Product (GDP) of Canada grew by 0.5% on a monthly basis in January, Statistics Canada reported on Friday. This reading followed December's contraction of 0.1% and came in better than the market expectation for an expansion of 0.3%.
"Advance information indicates that real GDP increased 0.3% in February," Statistics Canada further noted in its press release. "Increases in the mining, quarrying, and oil and gas extraction, manufacturing, and finance and insurance sectors were slightly offset by decreases in construction, wholesale trade, and accommodation and food services."
Market reaction
USD/CAD retreated from daily highs after this data and was last seen rising 0.17% on the day at 1.3543.
-
13:32
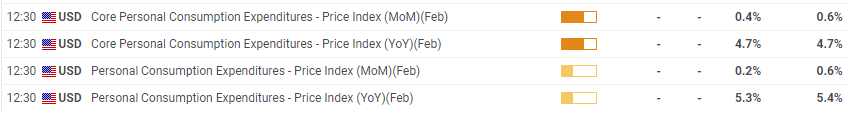
Breaking: US annual Core PCE inflation declines to 4.6% in February vs. 4.7% expected
Inflation in the US, as measured by the Personal Consumption Expenditures (PCE) Price Index, declined to 5% on a yearly basis in February from 5.3% in January, the US Bureau of Economic Analysis reported on Friday. This reading came in lower than the market expectation of 5.3%.
The annual Core PCE Price Index, the Federal Reserve's preferred gauge of inflation, edged lower to 4.6% from 4.7% in the same period, compared to analysts' forecast of 4.7%. On a monthly basis, Core PCE inflation and PCE inflation both rose 0.3%.
Further details of the publication revealed that Personal Income rose by 0.3% on a monthly basis in February and Personal Spending increased by 0.2%.
Market reaction
The US Dollar came under modest bearish pressure after these data and the US Dollar Index was last seen trading at 102.25, where it was still up 0.1% on a daily basis.
-
13:31
United States Personal Spending came in at 0.2%, below expectations (0.3%) in February
-
13:31
United States Core Personal Consumption Expenditures - Price Index (YoY) below forecasts (4.7%) in February: Actual (4.6%)
-
13:31
United States Personal Consumption Expenditures - Price Index (MoM) came in at 0.3%, above expectations (0.2%) in February
-
13:31
United States Core Personal Consumption Expenditures - Price Index (MoM) came in at 0.3% below forecasts (0.4%) in February
-
13:31
United States Personal Income (MoM) above expectations (0.2%) in February: Actual (0.3%)
-
13:31
United States Personal Consumption Expenditures - Price Index (YoY) registered at 5%, below expectations (5.3%) in February
-
13:30
Canada Gross Domestic Product (MoM) above forecasts (0.3%) in January: Actual (0.5%)
-
13:13
USD/CAD Price Analysis: Clings to recovery gains around 1.3550 ahead of US PCE Price Index
- USD/CAD stages a goodish rebound from a multi-week low amid a pickup in the USD demand.
- Bullish Crude Oil prices underpin the Loonie and act as a headwind amid a positive risk tone.
- Traders also seem reluctant to place bets ahead of the Canadian GDP and the US PCE inflation.
The USD/CAD pair shows resilience below the 100-day Simple Moving Average (SMA) and attracts some buying in the vicinity of the 1.3500 psychological mark, or a five-and-half-week low touched earlier Friday. The pair maintains its bid tone heading into the North American session and is currently placed around the 1.3550 area, just a few pips below the daily high.
The US Dollar (USD) regains some positive traction on the last day of the week and is seen as a key factor acting as a tailwind for the USD/CAD pair. That said, the prevalent risk-on mood keeps a lid on any meaningful upside for the safe-haven Greenback. Apart from this, the recent uptrend in Crude Oil prices, to a nearly three-week high, lends some support to the commodity-linked Loonie and contributes to capping gains for the major.
Traders also seem reluctant to place aggressive bets ahead of the release of the monthly Canadian GDP and the US Core PCE Price Index, the Fed's preferred inflation gauge. The USD/CAD pair, for now, seems to have stalled its intraday positive move near the 50% Fibonacci retracement level of the February-March rally. A sustained move beyond could lift spot prices beyond the 1.3600 mark, towards the 1.3640 region, or the 61.8% Fibo. level.
Some follow-through buying beyond mid-1.3600s will negate any near-term bearish bias and pave the way for a move towards the 1.3700 round figure en route to the 1.3720 zone, or the 23.6% Fibo. level.
On the flip side, the 1.3500 mark represents 61.8% Fibo. level and should now act as a pivotal point, which if broken will be seen as a fresh trigger for bearish traders. The USD/CAD pair might then turn vulnerable to accelerate the fall towards intermediate support near the 1.3455-1.3450 horizontal zone. Spot prices could eventually drop to the 1.3400 round figure en route to the next relevant support near the 1.3330-1.3325 region.
USD/CAD daily chart
Key levels to watch
-
13:07
Gold Price Forecast: XAU/USD to come under pressure as US NFP expected to be robust once again – Commerzbank
Gold price has defended most of the gains it accrued amid the market turmoil and is still trading at above $1,950. Market participants will presumably be focusing their attention on the US labour market next week, economists at Commerzbank report.
Market to correct its expectations of pronounced rate cuts later this year
“Gold market could see a more pronounced correction if the market saw itself forced by buoyant US labour market figures to scale back its expectations of rapid rate cuts before the year is out.”
“Since the beginning of March, the gold ETFs tracked by Bloomberg have registered inflows of 30 tons, meaning that they are likely to post monthly inflows again for the first time since April 2022.”
-
13:04
India Balance Payment $ increased to $0.9B in 4Q from previous $-30.4B
-
13:04
India Current Account Balance $ came in at $-18.2B, above forecasts ($-23B) in 4Q
-
13:04
India Trade Deficit – RBI: -72.7B (4Q) vs -83.5B
-
13:03
Chile Industrial Production (YoY) declined to -1.1% in February from previous 0.5%
-
13:01
South Africa Trade Balance (in Rands) above forecasts (-14.3B) in February: Actual (16.13B)
-
13:01
Mexico Jobless Rate below expectations (2.9%) in February: Actual (2.7%)
-
13:00
Mexico Jobless Rate s.a down to 2.8% in February from previous 2.9%
-
13:00
Brazil Unemployment Rate registered at 8.6%, below expectations (8.7%) in February
-
12:49
GBP/USD will likely simply track EUR/GBP and make its way slowly back to 1.30 – SocGen
Calmer times for Sterling. Economists at Société Générale expect GBP/USD to track EUR/GBP and move gradually higher toward 1.30.
EUR/GBP’s underlying trend remains upwards, slowly
“Since the start of November, Sterling has tracked five-year yield differentials, with a narrowing in the UK-German spread of nearly 110 bps in November-January taking EUR/GBP from 0.86 to almost 0.90.”
“Unless yield differentials narrow significantly from here, we may well find that EUR/GBP becomes dull for a while, trading at 0.87-0.92 over the coming months. Against that backdrop, GBP/USD will likely simply track EUR/GBP and make its way slowly back to 1.30.”
-
12:33
India Infrastructure Output (YoY) came in at 6%, above forecasts (4.6%) in February
-
12:32
India FX Reserves, USD: $578.78B (March 24) vs $572.8B
-
12:32
Brazil Primary Budget Surplus above forecasts (-30B) in February: Actual (-26.453B)
-
12:32
Brazil Nominal Budget Balance came in at -90.606B, below expectations (-36.559B) in February
-
12:25
USD/CAD: Losses through the low 1.35s target a test of long-term trend support at 1.3410/15 – Scotiabank
USD/CAD is trading higher for the first time this week. However, economists at Scotiabank expect the pair to continue moving lower as technicals suggest further downside pressure.
Gains on the day may already have peaked around 1.3565
“Steady losses in the USD since Monday, a break under the 40-Day Moving Average (1.3592 – now important resistance) and a bearish tilt in the intraday and daily trend intensity oscillators keep the focus on the downside for USD/CAD in the short run.”
“Modest USD gains on the day may already have peaked around 1.3565.”
“USD losses through the low 1.35s (100-DMA at 1.3519) target a test of long-term trend support at 1.3410/15.”
-
12:20
USD Index Price Analysis: No changes to the range bound theme
- DXY recoups part of the losses seen on Thursday.
- Decent support emerges at the 102.00/101.90 band.
DXY manages to regain some balance and bounces off the earlier retracement to the 102.00 neighbourhood.
So far, it seems the index could extend the consolidative range amidst the broader bearish stance. That said, a drop below the monthly low at 101.91 (March 23) should open the door to a potential visit to the 2023 low around 100.80 (February 2).
Looking at the broader picture, while below the 200-day SMA, today at 106.55, the outlook for the index is expected to remain negative.
DXY daily chart
-
12:14
EUR/JPY Price Analysis: Next on the upside now comes 146.70
- EUR/JPY extends the move higher and prints new 2023 highs.
- The December 2022 peak near 146.70 now emerges on the horizon.
EUR/JPY advances past the 145.00 hurdle to record new YTD peaks in the 145.65/70 band on Friday.
A daily close above the 2023 peak should motivate the cross to shift its focus to the December 2022 top around 146.70 (December 15) in the short-term horizon.
In the meantime, extra gains remain on the table while the cross trades above the 200-day SMA, today at 141.81.
EUR/JPY daily chart
-
12:12
GBP/USD: Clear push through 1.2445/50 to drive gains towards 1.2750/00 in the next few months – Scotiabank
Sterling gains peaked in the low 1.24 zone earlier but losses are showing signs of reversing from the mid/upper 1.23s, economists at Scotiabank report.
Firm tone persists
“Cable gains stalled – again – in the low/ mid 1.24 area. Spot losses have, however, held short-term trend support at 1.2340 and spot gains over the past couple of hours suggest that a low may be in for the GBP in the short-run, at least.”
“Trend signals are bullish for the GBP across multiple timeframes which support the outlook for limited losses and ongoing gains.”
“A clear push through 1.2445/50 would drive gains towards 1.2750/00 in the next few months.”
-
12:09
When is the US February PCE Price Index and how could it affect EUR/USD?
US PCE Price Index Overview
Friday's US economic docket highlights the release of the Personal Consumption Expenditure (PCE) Price Index, scheduled later during the early North American session at 12:30 GMT. The gauge is anticipated to have risen by 0.2% in February as compared to the 0.6% increase in the previous month. The yearly rate possibly edged lower to 5.3% from 5.4% in January. Meanwhile, the Core PCE Price Index - the Fed's preferred inflation measure - likely held steady at the 4.7% YoY rate and rose 0.4% in February.
Analysts at TD Securities (TDS) offer a brief preview of the report and write: “We expect core PCE price inflation to slow down from a robust 0.6% MoM in Jan to a still-strong 0.4% in Feb (also below core CPI's 0.5% MoM gain). The YoY rate likely rose a tenth to 4.8%, suggesting the path to normalization in price gains will be bumpy. Conversely, personal spending likely fell, but that would follow an eye-popping 1.8% surge in the prior month.”
How Could it Affect EUR/USD?
Ahead of key macro data, the US Dollar (USD) regains positive traction amid hopes that the Federal Reserve might shift back to its inflation-fighting interest rate hikes. A surprisingly stronger report will reaffirm hawkish Fed expectations and prompt some near-term USD short-covering move. This, in turn, will set the stage for some meaningful corrective pullback for the EUR/USD pair, from a nearly two-month high touched on Thursday.
Conversely, weaker PCE data will fuel fresh speculations that the US central bank might soon pause the rate-hiking cycle. This, along with the prevalent risk-on environment and easing fears of a full-blown banking crisis, should weigh on the safe-haven buck and provide a fresh lift to the EUR/USD pair. Apart from this, the prospects for additional rate hikes by the Europen Central Bank (ECB) suggest that the path of least resistance for spot prices is to the upside.
Eren Sengezer, Editor at FXStreet, offers a brief technical outlook for the major and writes: “EUR/USD has met resistance in the 1.0900/1.0910 (psychological level, end-point of the latest uptrend) area late Thursday, confirming that level as a significant resistance. The Relative Strength Index (RSI) indicator on the four-hour chart declined toward 60, pointing to a loss of bullish momentum.”
Eren also outlines important technical levels to trade the EUR/USD pair: “In case the pair manages to hold above 1.0860 (ascending trend line, 20-period Simple Moving Average (SMA)), however, buyers could remain interested. In that scenario, EUR/USD needs to rise above 1.0900/1.0910 and use that level as support to be able to clear 1.0930 (static level, March 23 high) and target 1.1000 (psychological level).”
“On the downside, a four-hour close below 1.0860 could attract sellers and cause the pair to decline to 1.0820 (Fibonacci 23.6% retracement of the latest uptrend, 50-period SMA) and 1.0800 (psychological level),” Eren adds further.
Key Notes
• US February PCE Inflation Preview: Bad news for the Dollar, good news for the Fed?
• US Core PCE: Banks Preview, inflation still too hot
• EUR/USD Forecast: Euro bulls stay on sidelines ahead of US inflation data
About the US PCE Price Index
The Personal Spending released by the Bureau of Economic Analysis, Department of Commerce is an indicator that measures the total expenditure by individuals. The level of spending can be used as an indicator of consumer optimism. It is also considered as a measure of economic growth: While Personal spending stimulates inflationary pressures, it could lead to raise interest rates. A high reading is positive (or Bullish) for the USD.
-
12:06
EUR/USD: Rebound back to and through 1.0930 needed to regain some positive traction – Scotiabank
EUR/USD edges back after another 1.0925 rejection but bull trend intact, economists at Scotiabank report.
Limited scope for EUR losses
“EUR gains peaked around 1.0925/30, setting up a minor double top reversal in price that was triggered by the EUR’s slip back under 1.0895 earlier. The pattern has more or less delivered on its bearish potential already, however.”
“While short-term patterns in the EUR look a little soft, spot is holding above key, short-term trend support at 1.0855 and trend strength oscillators are still aligned bullishly for the EUR, suggesting limited scope for EUR losses.”
“A rebound back to and through 1.0930 is needed for spot to regain some positive traction in the short run, however.”
-
11:59
Brent Oil: Failure to defend December trough of $75 to trigger next leg of downtrend – SocGen
Brent has staged an initial bounce after forming interim low near $70 earlier this month. But it could test this level again on failure to defend December trough of $75, strategists at Société Générale report.
Signals of a meaningful uptrend are not yet visible
“Daily MACD has started posting positive divergence however signals of a meaningful uptrend are not yet visible.”
“Trend line drawn since March 2022 at $83/84 which is also the 50-DMA is a short-term hurdle.”
“If Brent fails to defend December trough of $75, next leg of downtrend is likely to materialize towards $70 and $65/63, the 61.8% retracement of whole uptrend during 2020/2022.”
-
11:42
GBP/USD to reach 1.26 at year-end – ANZ
GBP/USD remained in a range of 1.19-1.24 in the first quarter of 2023. Economists at ANZ Bank expect the pair to edge higher toward 1.26 by the end of the year.
Higher interest rates are expected to be a feature of BoE meetings ahead
“While a recession may be avoided, UK inflation remains at multi-decade highs. Headline CPI in March was reported at 10.4%, with core CPI at 6.2%. Therefore, higher interest rates are expected to be a feature of BoE meetings ahead.”
“We think there is further upside and forecast GBP/USD to rise to 1.26 at end-2023.”
-
11:26
GBP/USD trades with modest losses, holds above mid-1.2300s ahead of US PCE Price Index
- GBP/USD pulls back from over a two-month high amid a modest pickup in the USD demand.
- The better-than-expected UK GDP reaffirms BoE rate hike bets and helps limit the downside.
- Traders also seem reluctant and prefer to wait for the release of the US Core PCE Price Index.
The GBP/USD pair comes under some selling pressure after touching over a two-month high, around the 1.2420-1.2425 area on Friday and maintains its offered tone through the first half of the European session. The pair is currently placed near the lower end of its daily trading range, around the 1.2370-1.2365 zone, down nearly 0.15% for the day.
A goodish pickup in the US Treasury bond yields helps revive the US Dollar (USD) demand on the last day of the week, which turns out to be a key factor dragging the GBP/USD pair lower. Hopes that a widespread banking crisis might have been averted fueled speculations that the US central bank might move back to its inflation-fighting interest rate hikes. Adding to this, three Fed officials on Thursday backed the case for more rate increases to lower high levels of inflation. This, in turn, acts as a tailwind for the US bond yields and lends some support to the Greenback.
Hence, the market focus will remain glued to the release of the US Core PCE Price Index, the Fed's preferred inflation gauge, due later during the early North American session. Heading into the key data risk, traders seem inclined to lighten their bullish bets around the GBP/USD pair, especially after this week's rally of over 200 pips. That said, the slightly better-than-expected UK GDP print reaffirms expectations for additional rate hikes by the Bank of England (BoE), which, in turn, holds back bearish traders from placing aggressive bets around the major, at least for now.
Apart from this, the prevalent risk-on mood - as depicted by an extension of the recent rally in the equity markets - keeps a lid on any meaningful gains for the safe-haven buck and contributes to limiting the downside for the GBP/USD pair. This makes it prudent to wait for strong follow-through selling before confirming that the upward trajectory witnessed since the first half of the current month has run out of steam and positioning for any meaningful depreciating move. Nevertheless, spot prices remain on track to end in positive territory for the sixth successive week.
Technical levels to watch
-
11:22
EUR/USD: Resilient US data next week could prompt a correction – MUFG
Economists at MUFG Bank analyze the two-year government bond spread between US and EU and discuss its implications for the EUR/USD pair.
Month-end FX flows today could spark some unpredictable moves
“We remain unconvinced that the ECB will have to tighten by a further 50 bps but expectations continue to grind higher with the 2yr government bond spread more indicative of EUR/USD trading up closer to 1.1500. But with the market still priced for about 50 bps of easing from the Fed by year-end, that spread looks set to continuing supporting EUR/USD for now. We remain wary over that spread dynamic remaining so compelling which could prompt a correction in EUR/USD – next week’s US data may be the catalyst for that if the data remains resilient.”
“Month-end (quarter-end and FY-end for Japan) FX flows today could also spark some unpredictable moves that could alter the complexion of the market ahead of the key data from the US next week.”
-
11:16
NOK to remain weak until the summer – Nordea
Economists at Nordea still see a weak Norwegian Krone (NOK) until the summer.
Lower rate differential against the Euro a key factor behind the weak NOK
“We expect the NOK to remain weak until the summer – with our view for EUR/NOK around 11.30 in 3M and 11.00 by year-end 2023.”
“Norges Bank’s NOK sales, low interest rate differentials and a high likelihood for risk-off all point to a NOK that will remain to be weak.”
“We expect that Norges Bank will gradually reduce their NOK sales going forward. That should support the NOK, in isolation. Yet, the NOK will likely remain weak because interest rate differentials will likely remain low for the time to come.”
“A lower rate differential against the Euro has been a key factor behind the weak NOK lately – and this is unlikely to change soon.”
-
10:55
The ECB is still under pressure to raise key rates further – Commerzbank
As expected, the inflation rate in the euro zone fell significantly from 8.5% to 6.9% in March. By contrast, underlying inflation increased further. In this respect, pressure on the ECB to raise key interest rates further remains high, economists at Commerzbank report.
Euro area inflation rate falls to 6.9%, but core rate continues to rise
“According to preliminary calculations by Eurostat, the inflation rate in the euro area fell by an impressive 1.6 percentage points to 6.9% in March. The core inflation rate – i.e. the year-on-year rate of change in the consumer price index excluding energy, food and beverages – rose by 0.1 percentage points to 5.7%.”
“The inflationary push from energy prices has run its course. In the coming months, energy prices are even likely to depress the inflation rate slightly. Food is also unlikely to boost inflation in the next few months. By contrast, underlying inflation is unlikely to ease much for the time being. The core inflation rate is not expected to reach its high point until July and will only decline slowly thereafter.”
“The ECB has repeatedly emphasized that it is currently focusing primarily on the core inflation rate. In this respect, the ECB is still under pressure to raise key rates further.”
-
10:48
USD/ZAR to head lower toward critical support zone at 17.40/30 – SocGen
USD/ZAR has returned below 18.00. The pair could challenge the critical support zone at 17.40/30, analysts at Société Générale report.
Neckline at 18.10 is first hurdle
“USD/ZAR failed to establish itself above the peak of last October near 18.58 and underwent a brief consolidation in the form of Head and Shoulders. It has breached the neckline (18.10) denoting possibility of short-term down move.”
“The pair is expected to head lower towards 17.64 and perhaps even towards the target of the pattern at 17.40/17.30 which is also the 200-DMA. This is a crucial support zone.”
“Neckline at 18.10 is first hurdle.”
-
10:41
EUR/USD to struggle around 1.05 in H1, rebounding toward 1.10 by year-end – BofA
Economists at the Bank of America Global Research expect the EUR/USD pair to remain under pressure in the first half of the year before recovering toward 1.10 by year-end.
Market has once again run ahead of itself
“We warn that the market has once again run ahead of itself, pricing early Fed cuts, with re-pricing likely to weigh on EUR/USD in the short term.”
“We continue to forecast EUR/USD at 1.05 in H1, appreciating to 1.10 by year-end and to 1.15 by end-2024, still below long-term equilibrium.”
“We assume that the worst of the recent bank turmoil is behind, but we remain concerned about two risks for the EUR in particular: the continued war in Ukraine and possible market pressure on Italy from the hawkish ECB.”
-
10:31
Malaysia: GDP expected to expand 4.0%-5.0% in 2023 – UOB
UOB Group’s Senior Economist Julia Goh and Economist Loke Siew Ting review the latest projections by the Bank Negara Malaysia (BNM).
Key Takeaways
“Bank Negara Malaysia (BNM) projects GDP growth to moderate to 4.0%-5.0% in 2023 (2022: 8.7%), driven by firm domestic demand amid slower global growth. The risks to growth are fairly balanced with downside risks primarily coming from external developments while there are upside risks from domestic factors including improved labor prospects, investments projects, and increasing tourism activity.”
“Headline and core inflation are expected to average above long-term averages at 2.8%-3.8% this year (2022: headline 3.3%, core 3.0%) after taking into account moderating global commodity prices, easing of supply constraints, and existing price controls and subsidies. Inflation is expected to stay elevated in 2023 owing to demand pressures and gradual subsidy rationalization.”
“On the path of interest rates, the current Overnight Policy Rate (OPR) of 2.75% remains supportive of growth and is just below our projected neutral level of ~3.00%. Given that growth is expected to be fairly robust while inflation risks are tilted higher, we expect one more 25bps hike at the next MPC meeting in May. On financial stability, Malaysia’s banking system remains resilient with strong capital ratios and liquidity buffers that are above the minimum requirements even under highly stressed scenarios.”
-
10:29
EUR/USD zeroing in on 1.10, GBP/USD should follow with a break above 1.25 – ING
The Pound is set to be the best-performing currency of the first quarter of 2023, having gained 2.5% against the Dollar. Economists at ING think EUR/USD may break 1.10 next week. If that is the case, Cable should follow with a break above 1.25.
No reasons to diverge from EUR
“We have been stressing how markets are rewarding currencies that can count on domestic tightening prospects despite financial turmoil, and the Pound is indeed one of those.”
“While our more dovish view for the BoE compared to the ECB keeps us bullish on EUR/GBP for the remainder of the year (we still target 0.90 in the second half of the year), there aren’t clear short-term drivers to buck the bullish GBP trend at the moment.”
“Cable is approaching some important levels. First of all, the 1.2426 December 2022 high, and then the key 1.2500 benchmark level. With no obvious catalyst driving divergence between EUR and GBP at the moment, a high chance of 1.1000 being tested next week in EUR/USD equals a high chance of 1.2500 being tested next week in Cable.”
-
10:20
Gold price uptrend limited ahead of crucial US PCE inflation
- Gold price uptrend continues despite shrinking volatility.
- US PCE inflation data on Friday has huge market implications.
- Federal Reserve future rate hike bets are shaping precious metal markets.
Gold price (XAU/USD) continues to trade within a solid uptrend, even in a calmer week in the financial markets. Things could get lively again on Friday as the market gets ready for the biggest data release of the week, the United States Personal Consumption Expenditures (PCE) inflation numbers, scheduled to be released at 12:30 GMT.
US PCE inflation numbers are crucial for Gold investors
US PCE data is the Federal Reserve’s preferred gauge of inflation, and the markets will scrutinize the numbers deeply to start figuring out the chances of another Fed interest rate hike in the next FOMC meeting on May 3. Market expectations for the March numbers are at 4.7% for the yearly core PCE measure, and 0.4% for the monthly change. Any relevant discrepancy from these figures will certainly have an impact on the financial market landscape.
US PCE inflation data consensus and previous numbers (source: FXStreet Economic Calendar)
Such development is crucial for Gold investors, as the bright metal moves the opposite direction to interest rates, which are highly correlated with US Treasury bond yields and the US Dollar. When yields and the Greenback are higher, that diminishes Gold value, as precious metals are yield-less and are priced in US Dollars.
Matías Salord, Senior Analyst at FXStreet, explains how a lower-than-expected PCE release could benefit Gold bulls, by damaging the US Dollar and US T-bond yields:
On the contrary, if the Core PCE eases, it would be great news for the Fed, but not for the Dollar. Signs that inflation continued to slowdown would alleviate the pressure for the Fed to do more. US bond yields could resume the slide and the US Dollar print fresh monthly lows.
Is Gold price capped despite recent rally?
Gold price uptrend has slowed down in the past days, but bulls still keep the edge, with the bright metal comfortably trading above $1,970 at the time of writing.
ANZ Bank strategists have analyzed the current Gold trend, and believe the bright metal is capped as they do expect the Federal Reserve to still hike interest rates one or two more times this year:
“Gold is well supported by US recession fears, easing inflationary pressure and more dovish monetary policy. Nevertheless, the upside looks limited in the near term amid easing banking risks and further Fed rate hikes.”
-
10:17
AUD/USD keeps the red below 0.6700 mark, focus remains on US PCE Price Index
- AUD/USD witnessed an intraday turnaround from over a one-week high touched on Friday.
- Rising US bond yields revive the USD demand and exert downward pressure on the major.
- The downside remains cushioned as traders keenly await the Fed’s preferred inflation data.
The AUD/USD pair retreats sharply from over a one-week high, around the 0.6735-0.6740 region touched earlier this Friday and continues losing ground through the first half of the European session. Spot prices reverse the previous day's positive move and drop to the 0.6670 area, or a fresh daily low in the last hour.
A goodish pickup in the US Treasury bond yields helps revive the US Dollar (USD) demand on the last day of the week, which, in turn, is seen as a key factor exerting downward pressure on the AUD/USD pair. That said, the prevalent risk-on mood - as depicted by a generally positive tone around the equity markets - could lend some support to the risk-sensitive Aussie. Against the backdrop of easing fears about a full-blown banking crisis, the better-than-expected Chinese PMI prints raise hopes for a strong recovery in the world's second-largest economy and boost investors' confidence.
Apart from this, the uncertainty over the Federal Reserve's (Fed) rate hike path could act as a headwind for the US bond yields, which might hold back the USD bulls from placing aggressive bets and contribute to limiting losses for the AUD/USD pair. It is worth recalling that the Fed had signalled recently that it might soon pause the rate-hiking cycle. That said, fading risk of bank contagion fueled speculations that the US central bank might shift back to its inflation-fighting rate hikes. Furthermore, three Fed officials on Thursday backed the case for more rate hikes to contain high inflation.
Hence, the market focus will remain glued to the release of the US Core PCE Price Index - the Fed's preferred inflation gauge - later during the early North American session. The data will play a key role in influencing market expectations about the next policy move. This, in turn, will drive the USD demand and help determine the next leg of a directional move for the AUD/USD pair. This, along with the emergence of some buying near the 0.6660 area over the past two trading sessions, warrants caution for aggressive bearish traders and before positioning for an extension of the intraday downfall.
Technical levels to watch
-
10:14
EUR/HUF's journey below 400 is not permanent and will reverse – TDS
In the view of economists at TD Securities, the Forint is too strong with EUR/HUF below 400. They, therefore, expect a sharp move higher in the pair.
May and June will likely be periods of increased EUR/HUF volatility
“We still think that EUR/HUF's journey below 400 is not permanent and will reverse.”
“May and June will likely be periods of increased EUR/HUF volatility as EU member states will need to extend the current sanctions on Russia related to the invasion of Ukraine. Hungary may use this opportunity to veto the extension unless it also receives part of frozen EU payouts from the Recovery Fund (RF).”
“The first batch of the RF payouts is due right around June 2023, so another open spat with the EU might be the card Hungary will choose to play.”
-
10:10
China's top envoy Wang: US-Sino relations are facing challenges and difficulties
China's top diplomat Wang Yi said on Friday that the US and China relations are facing challenges and difficulties.
“I urge the US to stop suppression, decoupling is wrong,” Wang added.
Market reaction
AUD/USD is under pressure below 0.6700, as the US Dollar stages a comeback ahead of the US PCE inflation data. Simmering US-Sino tensions are also weighing on the Aussie pair. At the time of writing, the major is trading 0.19% lower on the day at 0.6693.
-
10:02
Greece Retail Sales (YoY) climbed from previous -1.2% to 1.4% in January
-
10:02
USD/JPY to fall progressively toward 124 by year-end – ANZ
The concerns of financial instability saw an influx of safe haven buying for currencies such as the Japanese Yen. Economists at ANZ Bank expect the USD/JPY pair to move gradually lower toward 124 by the end of the year.
BoJ pivot still a key focus
“In the immediate term a policy shift looks unlikely. Incoming Governor Kazuo Ueda (whose term will start from 9 April), has publicly supported ultra-loose monetary policy even before his nomination.”
“ If a policy shift does materialise, which we anticipate being after Q2 this year, the JPY will rally on more favourable yield differentials.”
“We forecast USD/JPY to fall progressively to 124 by the end of the year.”
-
10:01
Breaking: Eurozone Preliminary HICP inflation declines to 6.9% YoY in March vs. 7.1% expected
The annualized Eurozone Harmonised Index of Consumer Prices (HICP) came in softer at 6.9% in March vs. February’s 8.5%, the latest data published by Eurostat showed on Friday. The market expected the inflation gauge to drop to 7.1% in the reported period.
The core HICP steadied at 5.7% YoY in March when compared to 5.7% expected and 5.6% recorded in the February clip.
On a monthly basis, the old continent’s HICP unexpectedly rose by 0.9% in March vs. 0.8% expectations and 0.8% previous. The core HICP arrived at 1.2% last month as against the 0.6% expected and 0.8% seen in February.
The Euro area inflation data is released a day after Germany’s annual HICP for March, which rose by 7.8%, beating 7.5% estimates while following a 9.3% advance seen in February.
Note that the European Central Bank’s (ECB) inflation target is 2%.
Investors closely scrutinize the bloc’s HICP figures to evaluate the ECB rate hike expectations. Markets are now pricing an 88% probability of a 25 basis points (bps) ECB rate increase in May.
Key details (via Eurostat)
“Looking at the main components of euro area inflation, food, alcohol & tobacco is expected to have the highest annual rate in March (15.4%, compared with 15.0% in February), followed by non-energy industrial goods (6.6%, compared with 6.8% in February), services (5.0%, compared with 4.8% in February) and energy (-0.9%, compared with 13.7% in February).”
EUR/USD reaction
The shared currency is unperturbed by the mixed Eurozone inflation data, as EUR/USD keeps its range near daily lows of 1.0872. The spot is down 0.22% on the day.
-
10:01
European Monetary Union Core Harmonized Index of Consumer Prices (MoM) came in at 1.2%, above expectations (0.6%) in March
-
10:01
European Monetary Union Core Harmonized Index of Consumer Prices (YoY) meets forecasts (5.7%) in March
-
10:01
European Monetary Union Harmonized Index of Consumer Prices (YoY) came in at 6.9% below forecasts (7.1%) in March
-
10:01
European Monetary Union Harmonized Index of Consumer Prices (MoM) came in at 0.9%, above forecasts (0.8%) in March
-
10:00
Italy Consumer Price Index (EU Norm) (YoY) came in at 8.2%, below expectations (8.9%) in March
-
10:00
Italy Consumer Price Index (EU Norm) (MoM) registered at 0.8%, below expectations (1.4%) in March
-
10:00
Italy Consumer Price Index (YoY) registered at 7.7%, below expectations (8.2%) in March
-
10:00
Italy Consumer Price Index (MoM) below expectations (0%) in March: Actual (-0.3%)
-
10:00
European Monetary Union Unemployment Rate came in at 6.6% below forecasts (6.7%) in February
-
10:00
Greece Unemployment Rate (MoM) up to 11.4% in February from previous 10.8%
-
09:50
Dollar to shrug off US Core PCE barring a major upside surprise – ING
The Dollar has continued to lose ground across the board. The focus will be on February’s PCE deflator, the Fed’s preferred measure of inflation. However, the greenback is unlikely to react to the figures unless the print surprises significantly to the upside, economists at ING report.
USD struggling to find support
“Barring a major upside surprise, we don’t expect a material impact on the Dollar from PCE data today.”
“As we have seen, higher chances of a May hike don’t automatically translate into a stronger Dollar in the current market environment.”
“We could see some Dollar stabilisation after a week of losses, but the short-term bias remains negative for the greenback.”
See – US Core PCE: Banks Preview, inflation still too hot
-
09:40
Natural Gas Futures: Room for further consolidation near term
Considering advanced figures from CME Group for natural gas futures markets, open interest rose for the fourth straight session on Thursday, this time by around 20.1K contracts. Volume, on the other hand, dropped for the second consecutive session, now by around 11.3K contracts.
Natural Gas could still retest the sub-$2.00 area
Prices of the natural gas charted a small drop on Thursday on the back of rising open interest and shrinking volume. That said, further range bound trade should remain in the pipeline in the very near term, while the next target on the downside still emerges at the 2023 low near $1.96 per MMBtu (February 22).
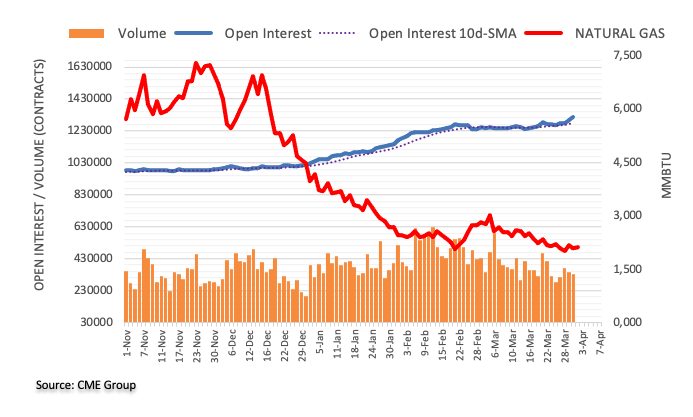
-
09:39
USD/JPY clings to gains near two-week high, around mid-133.00s ahead of US inflation data
- USD/JPY catches fresh bids on Friday and climbs to a two-week high.
- The recent risk-on rally undermines the JPY and lends some support.
- Rising US bond yields revive the USD demand and act as a tailwind.
- Traders now look to the US Core PCE Price Index for a fresh impetus.
The USD/JPY pair regains positive traction on the last day of the week and maintains its bid tone near a two-week high, just below mid-133.00s through the early part of the European session.
The recent risk-on rally across the global equity markets undermines the safe-haven Japanese Yen (JPY), which, along with the emergence of some US Dollar (USD) buying, acts as a tailwind for the USD/JPY pair. Investors now seem convinced that a widespread banking crisis might have been averted. Apart from this, hopes for a strong economic recovery in China further boost investors' confidence. In fact, the official Chinese PMI data showed that business activity in the services sector grew at its fastest pace in 12 years in March. Meanwhile, the growth in the manufacturing sector moderated a bit during the reported month, albeit at a smaller-than-expected pace.
The USD, on the other hand, draws some support from a modest uptick in the US Treasury bond yields, bolstered by fresh speculations that the Federal Reserve (Fed) might move back to its inflation-fighting interest rate hikes. Furthermore, three Fed officials on Thursday backed the case for more rate increases to lower high levels of inflation. The US central bank, however, had signalled recently that it might soon pause the rate-hiking cycle in the wake of the turmoil in the banking sector. This, in turn, could act as a headwind for the USD/JPY pair.
Traders also seem reluctant to place aggressive bets and might prefer to move to the sidelines ahead of the release of the US Core PCE Price Index - the Fed's preferred inflation gauge - later during the early North American session. The data will play a key role in influencing market expectations about the future rate hike path, which, in turn, will drive the USD demand and provide a fresh directional impetus to the USD/JPY pair. Nevertheless, spot prices remain on track to register strong weekly gains for the first time in the previous five.
Technical levels to watch
-
09:31
Hong Kong SAR Retail Sales came in at 31.3%, above expectations (3.9%) in February
-
09:24
Gold Price Forecast: XAU/USD’s upside looks capped in the near term – ANZ
With the Fed turning more dovish in the wake of the banking issues, US yields fell and the Gold price rose. Nevertheless, economists at ANZ Bank do not expect the yellow metal to extend its race higher for now.
Haven flows can continue into Gold if the situation worsens
“Further upside in the Gold price looks limited in the short term, as we see the federal fund rate at 5.5%.”
“Gold is well supported by US recession fears, easing inflationary pressure and more dovish monetary policy. Nevertheless, the upside looks limited in the near term amid easing banking risks and further Fed rate hikes.”
“Haven flows can continue into Gold if the situation worsens.”
See – Gold Price Forecast: XAU/USD year-end target raised to $2,000 – Commerzbank
-
09:17
USD/CNH could slip back to the 6.8100 region – UOB
Extra selling pressure could force USD/CNH to revisit the 6.8100 region in the short term, comment Markets Strategist Quek Ser Leang and Senior FX Strategist Peter Chia at UOB Group.
Key Quotes
24-hour view: “We expected USD to edge higher yesterday but we were of the view that ‘any advance is unlikely to break 6.9100’. While USD advanced more than expected, it fell sharply from a high of 6.9118. USD continues to fall in early Asian trade and the risk has shifted to the downside. However, the major support at 6.8100 is unlikely to come into view today (there is another support at 6.8300). On the upside, 6.8780 is a solid resistance level (minor level is at 6.8660).”
Next 1-3 weeks: “Our latest narrative was from Monday (27 Mar, spot at 6.8700) wherein we highlighted that the recent USD weakness has stabilized and that USD is likely to trade between 6.8100 and 6.9200 for now. USD fell sharply in early Asian trade today and downward momentum is building rapidly. The range-trading phase has ended and USD is likely to head lower even though 6.8100 might not be easy to break. The downside risk is intact as long as USD stays below 6.8900 (‘strong resistance’ level).”
-
09:14
EUR/USD comes under pressure and retreats below 1.0900 ahead of data, ECB
- EUR/USD reverses part of the recent multi-session upside.
- The greenback appears bid ahead of key data releases.
- EMY Flash inflation figures, ECB Lagarde, US PCE next of note.
The weekly uptrend in EUR/USD appears to have met a solid barrier around the monthly highs near 1.0930 on Friday.
EUR/USD looks at data, Lagarde
EUR/USD gives away some ground after four consecutive daily advances at the end of the week on the back of disappointing results from the German docket in combination with renewed buying interest in the greenback.
In the meantime, expectations for further rate hikes by the ECB as soon as at the May event continue to lend support to the upside momentum in the pair, particularly vs. rising speculation that the Federal Reserve might decide to keep rates on hold at its next gathering.
In the domestic calendar, Retail Sales in Germany contracted 7.1% in the year to February, while the March jobs report showed the Unemployment Change increased by 16K persons and the Unemployment Rate ticked higher to 5.6%. Later in the session, flash inflation figures in the euro area will take centre stage ahead of the speech by ECB Chairwoman C. Lagarde.
In the US, all the attention will be on the publication of the inflation measured by the PCE along with Personal Income/Spending and the final Michigan Consumer Sentiment.
What to look for around EUR
The weekly recovery in EUR/USD struggles to surpass the area of the March high around 1.0930.
In the meantime, price action around the European currency should continue to closely follow dollar dynamics, as well as the potential next moves from the ECB in a context still dominated by elevated inflation, although amidst dwindling recession risks for the time being.
Key events in the euro area this week: Germany Retail Sales/Labor Market Report, EMU Flash Inflation Rate/Unemployment Rate, France Flash Inflation Rate, Italy Flash Inflation Rate, ECB Lagarde (Friday).
Eminent issues on the back boiler: Continuation, or not, of the ECB hiking cycle. Impact of the Russia-Ukraine war on the growth prospects and inflation outlook in the region. Risks of inflation becoming entrenched.
EUR/USD levels to watch
So far, the pair is retreating 0.18% at 1.0884 and faces the next contention at 1.0738 (55-day SMA) seconded by 1.0712 (low March 24) and finally 1.0650 (100-day SMA). On the upside, a break above 1.0929 (monthly high March 23) would target 1.1032 (2023 high February 2) en route to 1.1100 (round level).
-
09:13
EUR/USD may break 1.10 next week before the US NFP – ING
Economists at ING have been calling for 1.10 in EUR/USD for some time now. They suggest a time for when that level will be reached.
A pause before another jump?
“We think today the risks are more skewed toward consolidation in the pair. EUR/USD may find some floor around 1.0870/1.0880 in the face of a potential Dollar recovery with eurozone-wide data confirming core inflation requires more ECB tightening.”
“Our bias remains bullish for EUR/USD, and we think that 1.1000 can be broken sometime next week, barring surprisingly strong ISM data out of the US and amid an otherwise broadly quiet data calendar until Friday’s Nonfarm Payrolls.”
-
09:02
Spain Current Account Balance came in at €3.27B, above expectations (€0.696B) in January
-
09:01
Italy Industrial Sales s.a. (MoM) came in at -1.1%, below expectations (-0.1%) in January
-
09:01
Italy Industrial Sales n.s.a. (YoY) below forecasts (15.5%) in January: Actual (8.6%)
-
09:01
Norway Registered Unemployment s.a above forecasts (59.471K) in March: Actual (59.82K)
-
09:01
Norway Registered Unemployment n.s.a came in at 1.8%, below expectations (1.9%) in March
-
08:55
Germany Unemployment Change registered at 16K above expectations (0K) in February
-
08:55
Germany Unemployment Rate s.a. registered at 5.6% above expectations (5.5%) in February
-
08:51
USD/JPY: Further upside could retest 134.20 – UOB
Markets Strategist Quek Ser Leang and Senior FX Strategist Peter Chia at UOB Group suggest USD/JPY could edge higher and surpass the 134.00 barrier in the near term.
Key Quotes
24-hour view: “Yesterday, we highlighted that ‘The sharp and swift rise has room to extend but deeply overbought conditions suggest a sustained rise above 133.50 is unlikely’. USD subsequently traded in a relatively quiet manner between 132.19 and 132.96. In early Asian trade, USD/JPY rose above 133.00. Today, a break of 133.50 will not be surprising but the major resistance at 134.20 could be just out of reach. Support is at 132.80, followed by 132.40.”
Next 1-3 weeks: “Our update from yesterday (30 Mar, spot at 132.60) still stands. As highlighted, the recent USD weakness has ended. The current rebound in USD could extend to 134.20. At this stage, a sustained rise above this level is unlikely. Overall, the current upside pressure will remain intact as long as USD stays above 131.70 (‘strong support’ level was at 131.20 yesterday).”
-
08:48
Crude Oil Futures: Scope for extra gains
CME Group’s flash data for crude oil futures markets noted traders increased their open interest positions for the second session in a row on Thursday, this time by around 12.5K contracts. On the other hand, volume shrank by the fourth straight session, now by more than 124K contracts.
WTI: Gains appear capped by $75.00 so far
Thursday’s marked uptick in prices of the WTI was on the back of increasing open interest, which leaves the door open to the continuation of this move at least in the very near term. So far, the $75.00 region per barrel emerges as the immediate hurdle for the commodity.
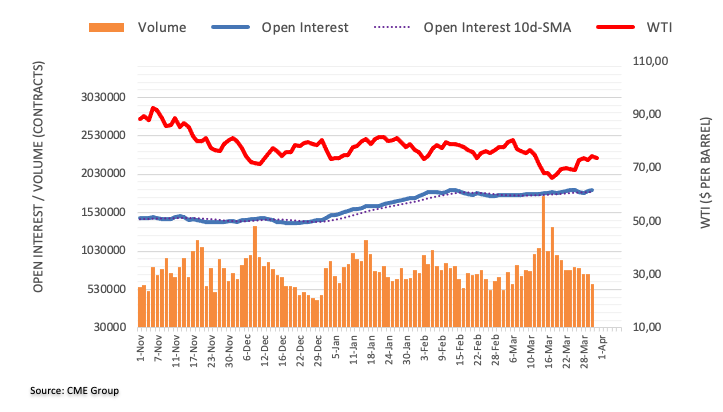
-
08:48
EUR/GBP consolidates in a range around 0.8800, traders keenly await Eurozone CPI
- EUR/GBP moves away from a one-week high, though lacks any follow-through selling.
- Bets for more rate hikes by the BoE and the ECB hold back traders from placing bets.
- The focus remains glued to the release of the preliminary Eurozone inflation figures.
The EUR/GBP cross edges lower for the second successive day on Friday and retreats further from a one-week high, around the 0.8825-0.8830 region touched the previous day. Spot prices remain on the defensive through the early European session and currently trade around the 0.8800 round-figure mark, down less than 0.05% for the day.
The better-than-expected UK GDP print, showing that the economy expanded by 0.1% during the fourth quarter as compared to the original estimate for zero growth, boosts the British Pound and exerts some pressure on the EUR/GBP cross. The data comes on the back of the Bank of England (BoE) Governor Andrew Bailey's hawkish remarks earlier this week, saying that interest rates may have to move higher if there were signs of persistent inflationary pressure, and favours the GBP bulls.
The downside for the EUR/GBP cross, however, is more likely to remain cushioned amid bets for a further policy tightening by the European Central Bank (ECB). The expectations were reaffirmed by slightly higher-than-expected German consumer inflation data, which sparked speculation of a potential upside surprise in the Eurozone CPI, due later this Friday. This might hold back traders from placing aggressive bearish bets and act as a tailwind for spot prices, for the time being.
Even from a technical perspective, the EUR/GBP cross, so far, has been finding decent support near the 100-day Simple Moving Average (SMA). The recent price action, meanwhile, constitutes the formation of a descending triangle and favours bearish traders. That said, it will still be prudent to wait for acceptance below the 100-day SMA and a subsequent slide below the 0.8730 horizontal support before positioning for any meaningful depreciating move in the near term.
Technical levels to watch
-
08:40
AUD/USD: Upside momentum improves further – UOB
AUD/USD could still see its upside reinvigorated on a breakout fo the 0.6760 level, according to Markets Strategist Quek Ser Leang and Senior FX Strategist Peter Chia at UOB Group.
Key Quotes
24-hour view: “Yesterday, we expected AUD to trade in a range of 0.6655/0.6700. However, AUD rose to a high of 0.6718 before closing at 0.6713 (+0.43%). Upward momentum has improved, albeit not much. Today, AUD could edge higher but it is unlikely to challenge the major 0.6760 (there is another resistance at 0.6730). On the downside, a breach of 0.6685 (minor support is at 0.6700) would indicate that the current mild upward pressure has eased.”
Next 1-3 weeks: “Yesterday (30 Mar, spot at 0.6680), we highlighted, that ‘While AUD could edge lower, it has to break clearly below 0.6625 before a sustained decline is likely’. We added, ‘The likelihood of a clear break below 0.6625 is low for now’. AUD subsequently rebounded and downward momentum has fizzled out. After rising to a high of 0.6718, upward momentum has improved somewhat instead. However, this time around, AUD has to break clearly above 0.6760 before a sustained advance is likely. The prospect of a clear break of 0.6760 is not high but it would remain intact as long as AUD stays above 0.6655 in the next 1-2 days.”
-
08:31
AUD/USD to face some hurdles before rallying to 0.75 by year-end – ANZ
Economists at ANZ Bank expect the AUD/USD pair to reach the 0.75 mark by the end of the year. However, the Aussie could struggle in the near term.
AUD upside through 2023 driven by USD weakness
“We see the AUD finishing the year higher against the USD. This is mostly a function of a valuation unwind in the USD, which is still commanding a premium of more than 10% to our measure of fair value. This adjustment process won’t be linear, however, and the lower interest rate structure leaves the AUD vulnerable on cross exposures.”
“We expect downward pressure on the AUD/JPY as defensive flows and continued expectations of a policy reset will drive JPY higher.”
“We maintain our year-end forecast of 0.75 for AUD/USD but acknowledge that in the short term, fears about a global banking crisis are unlikely to inspire strong risk appetite, which may keep a lid on any upside.”
-
08:26
USD Index to break trend support at 101.90 for a retest of the 100.82 YTD low – Credit Suisse
US Dollar Index (DXY) has fallen to test and hold its uptrend from May 2021. Although we may see further near-term consolidation above here, economists at Credit Suisse remain biased to an eventual break lower.
Break above 103.52 to open up 105.12
“Whilst we see scope for near term consolidation at the uptrend from May 2021 of 101.90, we continue to look for a sustained break in due course for a retest of the 100.82 YTD low and eventually we think the 61.8% retracement of the 2021/2022 uptrend at 98.98.”
“Resistance at 103.52 now ideally caps to keep the immediate risk lower. Above can see strength back to 105.12.”
-
08:25
Gold Price Forecast: XAU/USD gains a lift as US data misses the mark
- Gold price bulls come alive after laying dormant all week as US data fails to meet expectations.
- Never mind deposits, what about bank’s assets? Questions economist who sees crisis reviving and Gold exceeding $2,000.
- Gold may be forming a triangle in an uptrend. If ‘the trend is your friend’, bulls may be right.
Gold price (XAU/USD) trades higher on Friday, exchanging hands in the $1,970-80 range in the early European Session, after the release of poorer-than-expected US data pushed down the US Dollar and US Treasury yields. Traders now look forward to the release of the Federal Reserve (Fed) preferred gauge of inflation, the Personal Consumption Expenditure (PCE) – Price Index, for clarity on the next policy move by the Fed.
A gift to Gold bulls from lower-than-expected US data
Data out on Thursday showed an unexpected rise in the number of out-of-work people claiming unemployment support in the US from 191K to 198K – higher than the 196K forecast by economists. US Gross Domestic Product (GDP) for the fourth quarter also moderated down to 2.6% from 2.7% in Q3 when 2.7% had been forecast.
The overall reaction to the data was for the US Dollar to sell-off and US Treasury yields to pullback, reflecting investors’ view that the probabilities had slightly decreased for the US Federal Reserve to raise interest rates at their May meeting.
Gold price rose as the US Dollar weakened and the outlook for interest rates declined. Gold generally rises as interest rates – which the Fed sets – decline, since they lower the opportunity cost of holding the bright metal vis-a-vis staying in cash or cash equivalents.The next release on the economic docket for Gold is the preliminary PCE price index for March, which is out at 12:30 GMT on Friday. This will provide a perspective on inflation and could impact the Fed’s decision making ahead of its next meeting.
A higher-than-expected result could increase the chances the Fed will raise rates to combat inflation, with negative implications for the price of Gold. A lower-than-expected result will raise the chances the Fed will do nothing, that rates may have peaked and would likely be positive for Gold.
Gold to rise as banking crisis not over, says esteemed economist
The banking crisis is far from over and when it reignites the price of Gold will rise above $2,000 an ounce as people grope for safety, according to distinguished economist, David Rosenberg, the founder of Rosenberg Research.
So far the analysis of the banking crisis has focused on deposit risk but people are ignoring equally disturbing risks from the assets banks hold, argues Rosenberg in an interview with Kitco.com
"Everybody's focused on deposit insurance, concentrated uninsured deposits on the liability side of the balance sheet. But you know, the other part of the story is going to be what do the assets look like?" The economist said.
The availability of credit is shrinking, inflation remains high and the US is on the brink of recession. When people tighten their belts the risk of rising default rates on many of the loans held by regional banks could push a fresh tranche of lenders over the edge.
“Nobody talks about the quality of the assets – these traditional loans, especially as they pertain to commercial real estate business loans, credit cards and auto loans. A lot of these loans are held at the regional bank level," said Rosenberg.
Gold price technicals: Triangle forming in an uptrend
Gold price may be forming a symmetrical triangle price pattern in the midst of an established medium-term uptrend. The price of the precious metal continues to make higher highs and lows on the daily chart and the current consolidation is more probably a continuation pattern than not. According to the market maxim, “The trend is your friend until the bend at the end,” the technical outlook thus favors bulls.
-638158441128230093.png)
Gold price: Daily ChartA break above the key $2,009 March top would provide confirmation of further upside. The next target for Gold price would then lie at the $2,070 March 2022 highs.
The key $1,934 March 22 swing low must hold for Gold bulls to retain the advantage. Yet, a break and close on a daily basis below that level would introduce doubt into the overall bullish assessment of the trend. Such a move would probably see a sharp decline to support at $1,990 supplied by the 50-day Simple Moving Average (SMA).
A closer inspection of the symmetrical triangle pattern on lower timeframes may offer traders opportunities to enter breakout trades at more daring levels than the broader range parameters highlighted above.
-
08:11
NZD/USD fails ahead of 0.6300 mark, pares intraday gains to multi-week high
- NZD/USD scales higher for the second straight day and touches its highest level since February 16.
- The prevalent risk-on environment benefits the risk-sensitive Kiwi amid subdued USD price action.
- Bulls, however, turn cautious and look to the crucial US Core PCE Price Index for a fresh impetus.
The NZD/USD pair gains positive traction for the second successive day and touched its highest level since February 16 on Friday, albeit faces rejection near the 0.6300 mark. Spot prices trade around the 0.6270-0.6275 region during the early European session and now seem to have found acceptance above a technically significant 200-day Simple Moving Average (SMA).
The prevalent risk-on environment - as depicted by a generally positive tone around the equity markets - turns out to be a key factor lending support to the NZD/USD pair. Against the backdrop of easing fears of a full-blown banking crisis, hopes for a strong economic recovery in China boost investors' confidence and benefit the risk-sensitive Kiwi. In fact, the official Chinese PMI data showed that business activity in the services sector grew at its fastest pace in 12 years in March. Meanwhile, the growth in the manufacturing sector moderated a bit during the reported month, albeit at a smaller-than-expected pace.
The US Dollar (USD), on the other hand, struggles to gain any traction amid the uncertainty over the Federal Reserve's rate-hike path, which provides an additional lift to the NZD/USD pair. It is worth recalling that the Fed had signalled recently that it might soon pause the rate-hiking cycle in the wake of the turmoil in the banking sector. That said, hopes that a widespread banking crisis might have been averted fueled speculations that the US central bank might move back to its inflation-fighting rate hikes. Furthermore, three Fed officials on Thursday backed the case for more rate increases to lower high levels of inflation.
This, in turn, is holding back traders from placing aggressive bearish bets around the USD and acting as a headwind for the NZD/USD pair, at least for the time being. Investors also seem reluctant and prefer to move on the sidelines ahead of the release of the US Core PCE Price Index, the Fed's preferred inflation gauge later during the early North American session. The data will play a key role in influencing expectations about the next policy move. This, in turn, should drive the USD demand in the near term and help determine the next leg of a directional move for the major.
Technical levels to watch
-
08:10
NZD/USD to finish the year at the 0.66 mark – ANZ
Since the middle of February, NZD/USD has traded within a relatively tight range between 0.61 and 0.63. Economists at ANZ bank forecast the pair at 0.66 by the end of the year.
Kiwi to appreciate mildly further over the course of 2023
“We still see the RBNZ hiking the OCR to a peak of 5.25% by May 2023 and holding it there until at least the end of 2024. But the tight labour market and uncertain impact of the recent cyclone pose upside risks to the outlook for both inflation and the OCR.”
“Our forecasts have the Kiwi appreciating mildly further over the course of 2023, but imbalances like the current account deficit are weighing on sentiment.”
“We see the NZD/USD pair finishing the year at 0.66.”
-
08:01
Turkey Trade Balance rose from previous -14.24B to -12.08B in February
-
08:01
EUR/USD: Three and six-month forecasts revised up to 1.05 – Goldman Sachs
Economists at Goldman Sachs upgrade their three and six-month forecasts for the EUR/USD pair. However, they stick to their 12-month forecast of 1.10.
Less favorable tightening mix for the Dollar in the near term
“We are revising up our three and six-month EUR/USD forecasts to 1.05 (from 1.02 previously) to account for the recent deterioration in the US growth outlook and less favorable tightening mix for the Dollar.”
“We are maintaining our 12-month EUR/USD forecast at 1.10; we expect that still-limited economic slack and rising recession risks cut against more meaningful Dollar downside.”
-
07:57
USD/CHF Price Analysis: Corrective bounce remains elusive below 0.9190
- USD/CHF bounces off one-week low to print the first daily gain in three, retreats from intraday high of late.
- Clear downside break of 13-day-old previous support, bearish MACD signals keep sellers hopeful.
- 50-EMA, descending resistance line from early March challenge Swiss Franc pair buyers.
USD/CHF pares the first daily gain in three around 0.9135 as the market’s anxiety ahead of the key US inflation data escalates during the initial hour of Friday’s European session. In doing so, the Swiss Franc (CHF) pair reverses from the previous support line from mid-March.
Not only the failure to cross the support-turned-resistance but the bearish MACD signals also weigh on the USD/CHF price.
As a result, the Swiss currency pair sellers are well-set to challenge an upward-sloping support line from early February, around 0.9110 by the press time.
It should be noted that a clear break of the said key support line will need validation from the 0.9100 round figure and the previous monthly low of around 0.9060 to convince the USD/CHF bears to prod the 0.9000 psychological magnet.
Meanwhile, an upside break of the aforementioned previous support line, close to 0.9150, isn’t an open invitation to the USD/CHF bulls.
The reason could be linked to the presence of a convergence of the 50-bar Exponential Moving Average (EMA) and a downward-sloping resistance line from March 09, close to 0.9190.
Even if the USD/CHF bulls manage to cross the 0.9190 resistance confluence, the 0.9200 round figure and 61.8% Fibonacci retracement level of its February-March upside, near 0.9205, may act as an extra check for the buyers.
USD/CHF: Four-hour chart
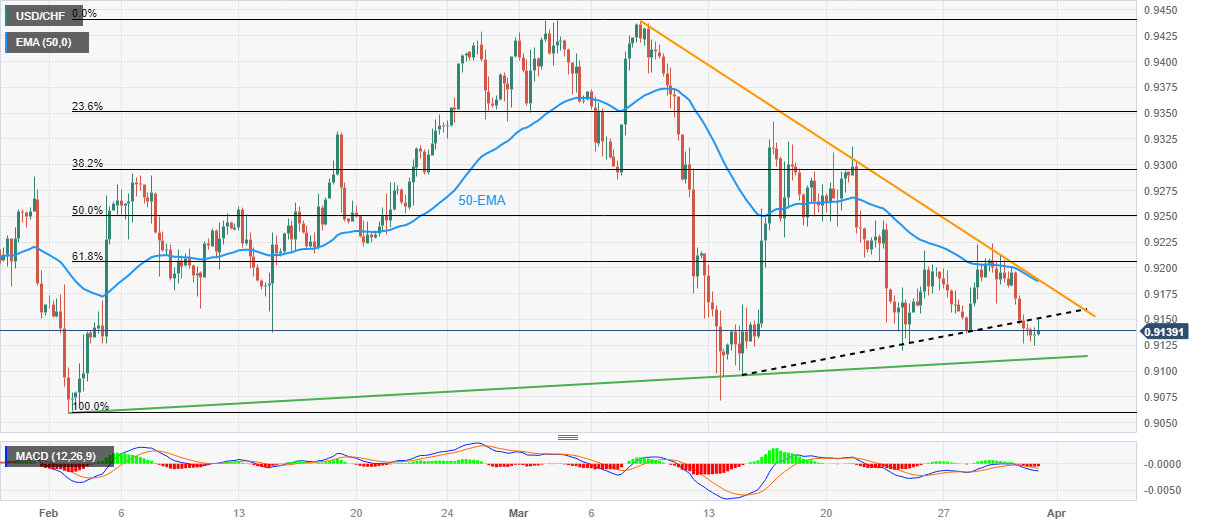
Trend: Further downside expected
-
07:56
Forex Today: Eyes on EU and US inflation figures on last day of Q1
Here is what you need to know on Friday, March 31:
The US Dollar continued to weaken against its rivals on Thursday as risk flows dominated the action in financial markets. Eurostat will release the preliminary Harmonized Consumer Price Index (HICP) data for March on Friday alongside the February Unemployment Rate. Later in the day, the Personal Consumption Expenditures (PCE) Price Index, the Fed's preferred gauge of inflation, will be featured in the US economic docket. Since this will be the last day of the month as well as the first quarter, position adjustments could ramp up the volatility and trigger wild fluctuations ahead of the weekend.
Wall Street's main indexes closed in positive territory on Thursday led by strong gains recorded in technology and real estate stocks. Following Wednesday's modest rebound, the US Dollar Index (DXY) stayed under bearish pressure and registered its lowest daily close since early February slightly above 102.00. Early Friday, the DXY clings to small recovery gains but struggles to gather bullish momentum.
The US Bureau of Economic Analysis (BEA) announced on Thursday that it revised the annualized Gross Domestic Product (GDP) growth for the fourth quarter to 2.6% from 2.7% in the previous estimate. The annual Core PCE inflation in the US is forecast to remain unchanged at 4.7% in February.
US February PCE Inflation Preview: Bad news for the Dollar, good news for the Fed?
EUR/USD climbed above 1.0900 in the American session on Thursday before going into a consolidation phase in the Asian session on Friday. The data from Germany showed earlier in the day that Retail Sales declined by 1.3% oın a monthly basis in February. This reading came in much worse than the market expectation for an increase of 0.5% but was largely ignored by market participants. Meanwhile, Annual HICP in France declined to 6.6% in March from 7.3% in February, compared to the market expectation of 6.5%.
Euro area HICP Preview: Peak inflation or base effects? No trade-off for ECB (for now).
GBP/USD climbed to its highest level in three months above 1.2420 in the early Asian session before staging a technical correction and retreating below 1.2400 in the European morning. The UK's Office for National Statistics reported on Friday that the GDP expanded by 0.6% on a yearly basis in the fourth-quarter following the 0.4% growth recorded in the first quarter. This reading surpassed the market expectation of 0.4% and helped Pound Sterling stay resilient against its rivals.
Following Wednesday's modest pullback, USD/JPY regained its traction and rose above 133.00 on Friday. The data from Japan showed that Industrial Production increased by 4.5% on a monthly basis in February. Additionally, Tokyo Consumer Price Index edged higher to 3.4% on a yearly basis in March from 3.2% in February.
Gold price recovered decisively on Thursday and continued to stretch higher early Friday. XAU/USD was last seen trading slightly above $1,980.
Bitcoin reversed its direction after having climbed above $29,000 and closed in negative territory on Thursday. BTC/USD was last seen moving sideways at around $27,000. Ethereum struggled to find direction on Thursday and extended its sideways grind near $1,800 to start the last day of the week.
-
07:48
EUR/PLN will fall back to 4.60 by the end of 2023 – TDS
Economists at TD Securities expect the EUR/PLN pair to hover around 4.65 before ticking down toward 4.60 by the end of the year.
EUR/PLN to trade in a stable regime around 4.65
“We forecast EUR/PLN to trade in a stable regime around 4.65.”
“Over the long term, we continue to hold a positive view on the Zloty and think that EUR/PLN will fall back to 4.60 by the end of 2023.”
See: EUR/PLN to drift down to around 4.65 by end-2023 before rising again toward 4.80 in 2024 – Commerzbank
-
07:45
France Consumer Price Index (EU norm) (MoM) registered at 0.9% above expectations (0.8%) in March
-
07:45
France Consumer Price Index (EU norm) (YoY) came in at 6.6%, above forecasts (6.5%) in March
-
07:45
France Consumer Spending (MoM) came in at -0.8% below forecasts (-0.4%) in February
-
07:45
France Producer Prices (MoM) came in at -0.9%, below expectations (1.6%) in February
-
07:36
Silver Price Analysis: Further XAG/USD decline hinges on $23.30 breakdown
- Silver price retreats from two-month high, snaps three-day winning streak.
- Fortnight-old bullish channel restricts immediate downside ahead of the key SMAs.
- Overbought RSI suggests further pullback in XAG/USD price but bears are far from sight.
Silver price (XAG/USD) pares weekly gains at the highest levels in two months, mildly offered near $23.85 heading into Friday’s European session. In doing so, the bright metal prints the first daily loss in four ahead of the key inflation data from Eurozone and the US.
Also read: Gold Price Forecast: Inflation data, $1,973 support to restrain XAU/USD bears – Confluence Detector
The precious metal’s latest weakness could be linked to a pullback from the resistance line of a two-week-old bullish channel. The XAG/USD retreat also justifies the overbought RSI (14).
However, bullish MACD signals and the stated channel formation keep the Silver bears off the table unless the quote breaks the $23.30 mark, comprising the stated channel’s lower line.
Even so, the 100-SMA and 200-SMA can challenge the bullion’s additional downside near $22.30 and $21.70.
Should the Silver price remains bearish past $21.70, the odds of witnessing a slump toward the $20.00 round figure and then to the monthly low of $19.90 can’t be ruled out.
On the flip side, XAG/USD recovery needs to cross the immediate channel’s top line, close to $24.05 at the latest.
However, the yearly high marked in February around $24.65 can challenge the Silver buyers before giving back control to them.
Silver: Four-hour chart
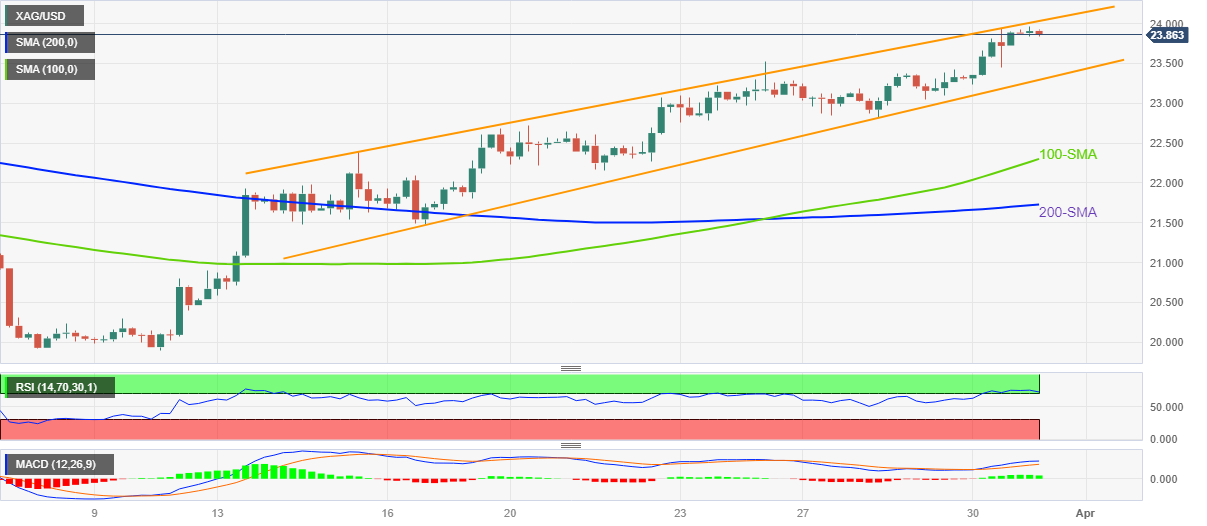
Trend: Limited downside expected
-
07:30
Switzerland Real Retail Sales (YoY) came in at 0.3% below forecasts (1.9%) in February
-
07:30
Canadian GDP Preview: Forecasts from four major banks, strong start to Q1
Canada will release January Gross Domestic Product (GDP) data on Friday, March 31 at 12:30 GMT as we get closer to the release time, here are forecasts from economists and researchers of four major banks regarding the upcoming growth data.
January GDP is expected at 2.9% year-on-year vs. 2.3% in December. On a monthly basis, growth is expected to be at 0.4% vs. 0.1% in the previous month.
CIBC
“The 0.6% gain in monthly GDP we forecast would be a few ticks better than the advance estimate, although early indications for February point to a modest giveback during that month.”
TDS
“We look for January GDP to print above flash estimates at +0.4%. Growth should be broad-based, with unseasonably warm weather providing a tailwind. A 0.4% print would leave Q1 GDP tracking well above BoC forecasts, though financial stability concerns take precedent for the moment. We look at somewhat larger deficit projections in the budget compared to the Fall Economic Statement.”
NBF
“Judging from industry-level reports published to date, economic output may have increased 0.3% in the month, as gains for mining/quarrying/oil and gas extraction, manufacturing, wholesale and transportation/warehousing were likely partially offset by declines for construction and retail.”
RBC Economics
“Canadian GDP is expected to tick higher 0.3% MoM.”
-
07:16
Gold Futures: Further upside not ruled out
Open interest in gold futures markets rose by nearly 2K contracts after three consecutive daily drops on Thursday according to preliminary readings from CME Group. Volume, instead, shrank for the fourth session in a row, now by around 53.1K contracts.
Gold remains focused on the $2000 mark and above
Thursday’s marked uptick in gold prices was on the back of increasing open interest and is supportive of the continuation of the upward bias in the very near term. In the meantime, the next hurdle of note for the precious metal emerges at the 2023 high at $2009 per ounce troy (March 20).
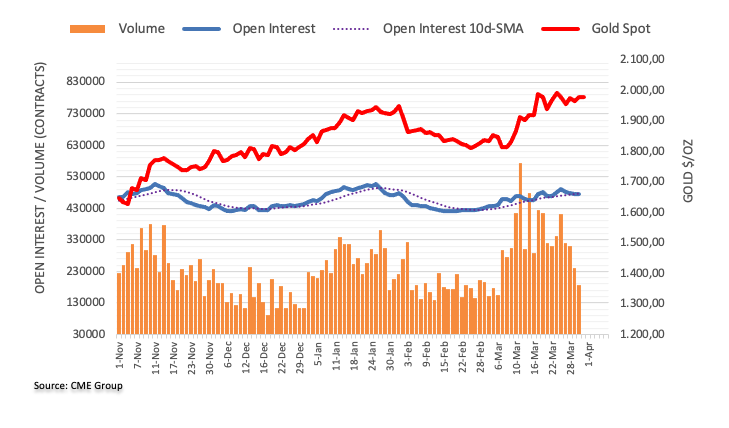
-
07:13
GBP/USD pauses pullback from multi-day top near 1.2380 on upbeat UK GDP, US inflation eyed
- GBP/USD takes offers to refresh intraday low after reversing from nine-week high.
- UK Q4 GDP rose past 0.4% previous forecasts to 0.6% YoY.
- British trade deal with Trans-Atlantic nations, Brexit optimism joins receding hawkish Fed bets to favor Cable buyers.
- Market sentiment remains divided as traders brace for Fed’s favorite inflation data.
GBP/USD shows little reaction to better-than-forecast UK economic growth numbers during early Friday. The reason could be linked to the market’s cautious mood ahead of the Federal Reserve’s (Fed) preferred inflation gauge.
That said, the UK’s fourth quarter (Q4) Gross Domestic Product (GDP) came in at 0.1% QoQ versus 0.0% prior forecasts while the yearly figures appear more impressive with 0.6% YoY growth for the Q4 GDP compared to 0.4% earlier estimations. It’s worth noting that the UK’s National Housing Prices for March and Total Business Investment for the Q4 appear dismal and might have probed the GBP/USD bulls ahead of the key US data.
Also read: UK Final GDP revised up to 0.1% QoQ in Q4 vs. 0% expected
Even so, optimism surrounding the UK’s £ 1.8 billion trade deal with Trans-Pacific nations joins the Brexit optimism to favor the bulls. In this regard, the Financial Times (FT) said, “The UK on Friday unveiled an agreement to join an 11-member Asia-Pacific trade bloc, with British prime minister Rishi Sunak claiming it proved his government was seizing ‘post-Brexit freedoms’.”
Also positive was the news suggesting the higher inflation and the Bank of England’s (BoE) hawkish concerns as Reuters said, “British businesses were their most confident this month since May 2022 and pricing expectations, which are being watched by the Bank of England as it grapples with high inflation, cooled to a six-month low, a survey showed on Friday.”
On the other hand, easing hawkish Fed bets and mixed US data, as well as receding pessimism surrounding the global banking sector seem to weigh on the US Dollar ahead of the Core Personal Consumption Expenditure (PCE) Price Index for February.
It’s worth noting that the US Treasury bond yields’ latest retreat allows the US Dollar to pare recent losses and weigh on the GBP/USD as traders wait for inflation data amid hawkish Fed talks.
Technical analysis
Although the overbought RSI (14) might have triggered the GBP/USD pair’s pullback, the 10-week-old horizontal resistance-turned-support around 1.2285-65 appears a tough nut to crack for the Cable bears to break.
-
07:12
GBP/USD: Door open to a test of 1.2450 near term – UOB
In the opinion of Markets Strategist Quek Ser Leang and Senior FX Strategist Peter Chia at UOB Group, GBP/USD could now pick up pace and revisit the 1.2450 region in the near term.
Key Quotes
24-hour view: “Our view for GBP to edge lower yesterday was incorrect as it rose to 1.2393 before ending the day at 1.2387 (+0.59%). While upward momentum has increased, GBP has to break the major resistance at 1.2400 before a sustained advance is likely. The chance of GBP breaking above 1.2400 is on the high side. That said, the next resistance at 1.2450 is a significant level and might not be easy to breach. The upside risk is intact as long as GBP stays above 1.2340 (minor support is at 1.2365).”
Next 1-3 weeks: “Two days ago (29 Mar, spot at 1.2330), we highlighted that ‘upward momentum appears to be building but GBP has to break and stay above 1.2400 before a sustained advance is likely’. We added, ‘The likelihood of a clear break of 1.2400 is not high for now but it will remain intact as long as GBP stays above 1.2240 in the next 1-2 days’. Yesterday, GBP rose to a high of 1.2393. While GBP did not break 1.2400, the vastly improved upward momentum suggests GBP is likely to head higher to 1.2450. A breakthrough this significant resistance level could potentially lead to an upward acceleration. On the downside, the ‘strong support’ level has moved higher to 1.2300 from 1.2240. Looking ahead, the next level to watch above 1.2450 is at 1.2550.”
-
07:05
United Kingdom Total Business Investment (YoY) below expectations (13.2%) in 4Q: Actual (10.8%)
-
07:05
EUR/USD corrects to near 1.0900 amid anxiety ahead of Eurozone Inflation and US PCE Price Index
- EUR/USD has corrected to near 1.0900 as investors have turned anxious ahead of Eurozone HICP and US PCE Price Index.
- Federal Reserve policymakers have continued favoring rate-hiking spell to tame persistent US inflation.
- European Central Bank would announce more rate hikes as Eurozone inflation is expected to remain persistent due to a shortage of labor.
- EUR/USD has formed a Double Top pattern but needs to clear more filters for validation.
EUR/USD has corrected gradually to near 1.0900 after failing to surpass Thursday’s high around 1.0926 in the early European session. The major currency pair has sensed selling pressure as investors have turned cautious ahead of the release of the Eurozone preliminary Harmonized Index of Consumer Prices (HICP) and United States core Personal Consumption Expenditure (PCE) Price Index data.
The US Dollar Index (DXY) has shown signs of recovery, building a cushion above 102.10. The downside bets for the USD Index have been trimmed as investors are anticipating a rate hike in May monetary policy meeting by the Federal Reserve (Fed). The approach for May policy has changed swiftly as waning fears of further casualty in the US banking system have opened room for the continuation of a policy-tightening spell by the Federal Reserve.
Meanwhile, gains generated by the S&P500 futures in the Asian session are halved now as investors are getting anxious ahead of the release of the Federal Reserve’s preferred inflation tool. However, the overall market mood is quite bullish. The demand for US government bonds has turned subdued as investors are shrugging off the US banking collapse event. The 10-year US Treasury yields are choppy around 3.55%.
Odds for a steady Federal Reserve policy have trimmed
Ebbing fears of further US banking turmoil have infused enormous confidence among market participants. Investors are not anticipating any recession warnings amid waning baking jitters, which has supported demand for US equities. Fading banking jitters have also restored confidence among Federal Reserve policymakers that the hiking spell can be continued to tame persistent US inflation. In a private meeting with US lawmakers, Federal Reserve chair Jerome Powell cited that he anticipates one more rate hike in 2023. As per the CME Fedwatch tool, chances of a 25 basis points (bp) rate hike have scaled above 53%, which will push rates to 5.00-5.25%.
Adding to that, Richmond Federal Reserve President Thomas Barkin said on Thursday that he is content with the current trajectory set by the FOMC of evaluating whether a 25 bps interest rate hike is required at each meeting. According to Barkin, there is a lot of money available for spending among households. He further added, “It is possible that tightening credit conditions, along with the lagged effect of our rate moves, will bring inflation down relatively quickly. But I still think it could take time for inflation to return to target.”
For further clarity, investors will keep an eye on US core PCE Price Index data. Analysts at Wells Fargo have forecasted the PCE deflator (+0.4%) to outpace nominal spending (+0.3%).
Higher labor shortage cements further acceleration in Eurozone Inflation
Considering cues from the German HICP released on Thursday, it is highly likely that Eurozone headline inflation would soften dramatically led by lower energy prices. As per the consensus, the Eurozone headline HICP is expected to soften to 7.1% from the former release of 8.5%. The economic indicator that could propel the need of more rate hikes from the European Central Bank (ECB) is the extreme shortage of labor in the Eurozone.
Bargaining power has shifted to talent due to a shortage of job seekers, which also allowed wage growth to scale higher. The Labor cost index in Eurozone is shuffling between 5% and 6%, the highest in decades, as reported by Reuters.
Therefore, core Eurozone Inflation data could turn sticky further as households are equipped with sufficient funds for disposal. The street is anticipating that European Central Bank President Christine Lagarde will hike rates further ahead.
EUR/USD technical outlook
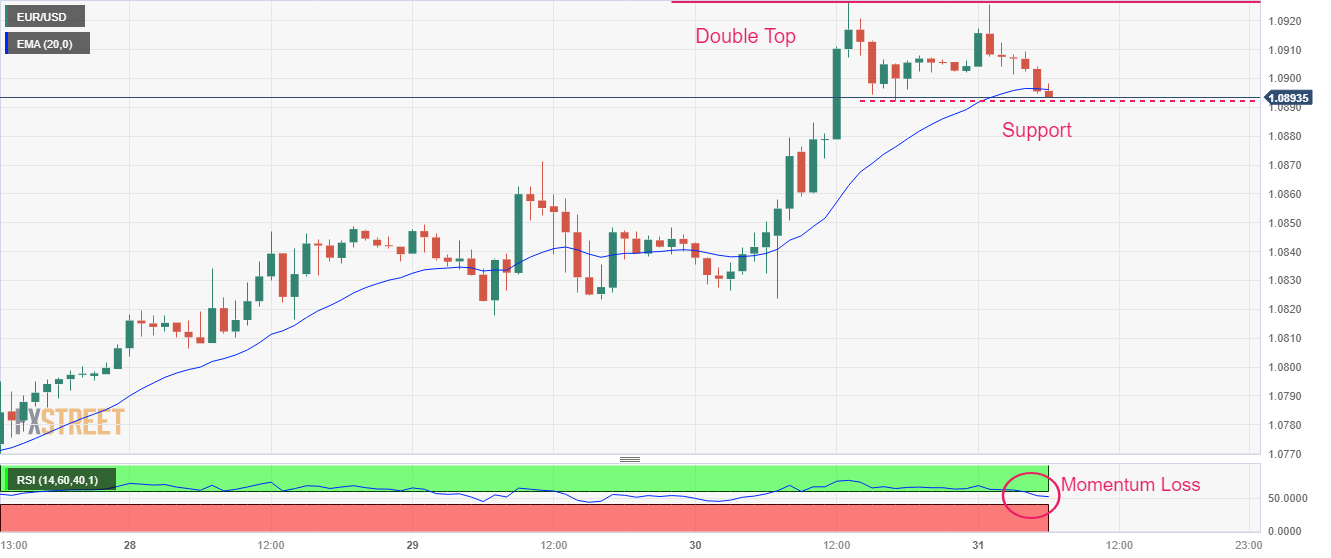
EUR/USD is forming a Double Top chart pattern near 1.0926 on an hourly scale, which indicates an absence of sheer buying interest while surpassing previous highs. The Double Top chart pattern has not been triggered yet as the asset is continued with higher highs and higher lows structure. This could be a corrective move after a perpendicular rally by the Euro. The critical support is plotted around 1.0890 whose breakdown could activate the Double Top formation.
Upward-sloping 20-period Exponential Moving Average (EMA) at 1.0890 is providing a cushion to the Euro.
Meanwhile, the Relative Strength Index (RSI) (14) has slipped into the 40.00-60.00 range from the bullish range of 60.00-80.00, which indicates a loss in the upside momentum.
-
07:02
UK Final GDP revised up to 0.1% QoQ in Q4 vs. 0% expected
The UK economy expanded by 0.1% on the quarter in the final three months of 2022 vs. 0% prior, the final revision confirmed on Friday. The market consensus stood at 0% in the fourth quarter.
Britain’s annual GDP rate grew by 0.6% in Q4 vs. 0.4% printed in the first estimate while missing 0.4% expectations.
Meanwhile, the UK Q4 Current Account arrived at £-2.483 when compared to the £-17.6B expected and the third quarter’s £-12.744B.
The country’s Total Business Investment data for Q4 came in at -0.2% QoQ and 1.08% YoY.
FX implications
GBP/USD remains uninspired by the upward revision to the UK growth numbers. The pair was last seen trading near daily lows at 1.2380, modestly flat on the day.
About the UK GDP
The Gross Domestic Product released by the Office for National Statistics is a measure of the total value of all goods and services produced by the UK. The GDP is considered a broad measure of the UK's economic activity. Generally speaking, a rising trend has a positive effect on the GBP, while a falling trend is seen as negative (or bearish).
-
07:01
United Kingdom Total Business Investment (YoY) came in at 1.08% below forecasts (13.2%) in 4Q
-
07:01
United Kingdom Total Business Investment (QoQ) below expectations (4.8%) in 4Q: Actual (-0.2%)
-
07:01
United Kingdom Gross Domestic Product (QoQ) came in at 0.1%, above forecasts (0%) in 4Q
-
07:01
German Retail Sales decline by 7.1% YoY in February vs. -5.2% expected
- German Retail Sales plunged 7.1% YoY in February vs. -5.2% expected.
- Retail Sales in Germany came in at -1.3% MoM in February vs. 0.5% expected.
According to the official figures released by Destatis on Friday, Germany's Retail Sales dropped by 1.3% MoM in February versus 0.5% expected and -0.3% previous.
On an annualized basis, the bloc’s Retail Sales tumbled 7.1% in February versus the -5.2% expected and a 6.9% decline seen in January.
FX implications
The Euro is undermined by the disappointing German data. At the time of writing, the EUR/USD is down 0.07% on the day at 1.0892.
About German Retail Sales
The Retail Sales released by the Statistisches Bundesamt Deutschland is a measure of changes in sales of the German retail sector. It shows the performance of the retail sector in the short term. Percent changes reflect the rate of changes of such sales. The changes are widely followed as an indicator of consumer spending. Positive economic growth is usually anticipated as "bullish" for the EUR, while a low reading is seen as negative, or bearish, for the EUR.
-
07:01
Germany Retail Sales (YoY) below forecasts (-5.2%) in February: Actual (-7.1%)
-
07:01
United Kingdom Gross Domestic Product (YoY) above expectations (0.4%) in 4Q: Actual (0.6%)
-
07:01
Germany Retail Sales (MoM) came in at -1.3%, below expectations (0.5%) in February
-
07:01
Germany Import Price Index (YoY) below forecasts (4.2%) in February: Actual (2.8%)
-
07:01
United Kingdom Nationwide Housing Prices s.a (MoM) came in at -0.8% below forecasts (-0.3%) in March
-
07:01
Denmark Gross Domestic Product (YoY) increased to 1.6% in 4Q from previous 1.5%
-
07:01
Denmark Gross Domestic Product (QoQ): 0.6% (4Q) vs previous 0.9%
-
07:00
United Kingdom Nationwide Housing Prices n.s.a (YoY) below forecasts (-2.2%) in March: Actual (-3.1%)
-
07:00
Germany Import Price Index (MoM) came in at -2.4% below forecasts (-1%) in February
-
07:00
United Kingdom Current Account above expectations (£-17.6B) in 4Q: Actual (£-2.483B)
-
06:58
Gold Price Forecast: XAU/USD defends minor bids, gathering pace for the next push higher toward $2,000
Gold price bounced off key support in a pennant formation, resistance at $1,993 holds the key, FXStreet’s Dhwani Mehta reports.
XAU/USD needs acceptance above $1,993 for further upside
“Should the rebound pick up steam, Gold price could aim to take out the falling trendline resistance at $1,993. A daily closing above the latter is needed to confirm an upside break from a pennant formation. Doors will then open up for a test of the $2,000 mark, above which the yearly high at $2,010 will be threatened. The next relevant upside target for Gold bulls is seen at the $2,050 psychological level.”
“Failure to sustain the renewed upside will trigger a fresh decline toward strong trendline support, now at $1,959. A sustained break below the latter will validate a pennant breakdown, exposing the $1,950 round level. Gold sellers will then target the previous week’s low at $1,935 should the downside momentum accelerate.”
-
06:55
Gold Price Forecast: Inflation data, $1,973 support to restrain XAU/USD bears – Confluence Detector
- Gold price retreats from weekly top as pre-data anxiety escalates.
- EU, US inflation becomes crucial for XAU/USD amid looming banking crisis, hawkish central bank talks.
- Upbeat China data, easing hawkish Fed bets fail to impress Gold buyers.
- Pullback remains elusive beyond $1,973; XAU/USD bulls can stay hopeful beyond $1,960.
Gold price (XAU/USD) pares weekly losses while easing from an intraday high to $1,980 during early Friday morning in Europe. In doing so, the yellow metal traces the market’s consolidation ahead of the key Eurozone and the US inflation clues. Also likely to have weighed on the Gold price could be the recent hawkish comments from the Fed policymakers, including Chairman Jerome Powell.
However, the recently firmer China official PMIs for March and receding fears of a banking crisis join easing hawkish Fed bets to keep the Gold buyers hopeful. On the same line are the mixed US data and the US Dollar’s rejection from Brazil and China.
Even so, the XAU/USD bears aren’t off the table as central bankers remain ready for more rate hikes, if needed to tame the inflation woes. As a result, today’s Eurozone Harmonised Index of Consumer Prices (HICP) for March and the United States Core Personal Consumption Expenditure (PCE) Price Index for February will be closely watched for clear directions.
Also read: Gold Price Forecast: XAU/USD needs acceptance above $1,993 for further upside, United States PCE eyed
Gold Price: Key levels to watch
As per our Technical Confluence Indicator, the Gold price retreats towards the short-term key support surrounding $1,973, comprising 10-DMA and Fibonacci 38.2% on one day.
Should the XAU/USD bears manage to conquer the $1,973 support, Fibonacci 38.2% on one week joins the Pivot Point one-day S1 to highlight $1,964 as another important level to watch before giving control to the bears.
Further south, $1,960 level including the previous monthly high acts as the last defense of the Gold buyers.
On the contrary, Fibonacci 61.8% on one week joins the upper Bollinger bank on the four-hour to restrict immediate upside of the Gold price.
Following that, Pivot Point one-day R1 could act as an extra check for the XAU/USD bulls around $1,993 before directing the Gold price towards the $2,000 psychological magnet.
Here is how it looks on the tool
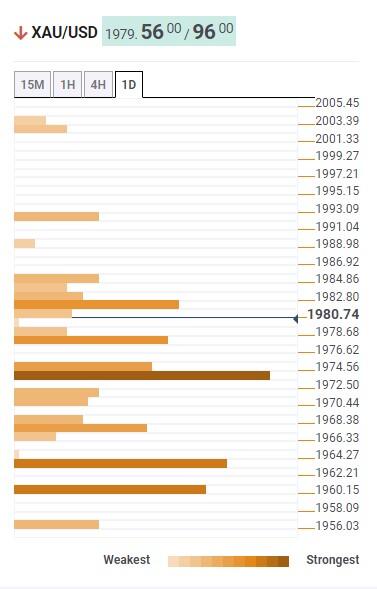
About Technical Confluences Detector
The TCD (Technical Confluences Detector) is a tool to locate and point out those price levels where there is a congestion of indicators, moving averages, Fibonacci levels, Pivot Points, etc. If you are a short-term trader, you will find entry points for counter-trend strategies and hunt a few points at a time. If you are a medium-to-long-term trader, this tool will allow you to know in advance the price levels where a medium-to-long-term trend may stop and rest, where to unwind positions, or where to increase your position size.
-
06:45
FX option expiries for Mar 31 NY cut
FX option expiries for Mar 31 NY cut at 10:00 Eastern Time, via DTCC, can be found below.
- EUR/USD: EUR amounts
- 1.0700 1.6b
- 1.0800 1.8b
- 1.0850 1.2b
- 1.0900 648m
- 1.0950 1.1b
- 1.1000 532m
- GBP/USD: GBP amounts
- 1.2000 515m
- 1.2100 693m
- USD/JPY: USD amounts
- 130.00 762m
- 131.00 1.0b
- 132.00 665m
- 133.85 655m
- 136.20 1.3b
- AUD/USD: AUD amounts
- 0.6550 808m
- USD/CAD: USD amounts
- 1.3600 1.5b
- 1.3900 1.2b
-
06:42
USD Index appears slightly bid above 102.00 ahead of US PCE
- The index navigates the lower end of the recent range near 102.00.
- Another visit to the 2023 low near 101.90 remains on the cards.
- All the attention is expected to be on the US PCE, Consumer Sentiment.
The USD Index (DXY), which tracks the greenback vs. a bundle of its main competitors, navigates a narrow range just above the 102.00 mark at the beginning of the week.
USD Index now looks at key data
The index attempts a mild rebound following Thursday’s marked pullback and the earlier drop to the boundaries of the 102.00 neighbourhood, as the appetite for the risk complex appears to be taking a breather ahead of the opening bell in Euroland on Friday.
In the meantime, the dollar derived some strength as of late following hawkish comments from FOMC’s Collins (Boston) and Barkin (Richmond) on Thursday, which seem to have tilted investors’ preference for a 25 bps rate raise in May.
Interest session in the US docket, as inflation figures tracked by the PCE are due seconded by Personal Income, Personal Spending and the final readings of the Michigan Consumer Sentiment.
What to look for around USD
The index remains well under pressure and keeps putting the 102.00 region to the test at the end of the week.
So far, speculation of a potential Fed’s pivot in the short-term horizon should keep weighing on the dollar, although the still elevated inflation, the resilience of the US economy and the hawkish narrative from Fed speakers are all seen playing against that view for the time being.
Key events in the US this week: PCE, Personal Income/Spending, Final Michigan Consumer Sentiment (Friday).
Eminent issues on the back boiler: Persistent debate over a soft/hard landing of the US economy. Terminal Interest rate near the peak vs. speculation of rate cuts in 2024. Fed’s pivot. Geopolitical effervescence vs. Russia and China. US-China trade conflict.
USD Index relevant levels
Now, the index is advancing 0.07% at 102.24 and faces the next resistance level at 103.36 (55-day SMA) followed by 104.05 (100-day SMA) and then 105.88 (2023 high March 8). On the other hand, the breach of 101.93 (monthly low March 23) would open the door to 100.82 (2023 low February 2) and finally 100.00 (psychological level).
-
06:22
EUR/USD now focuses on 1.0970 – UOB
In light of the recent price action, EUR/USD could extend the upside to the 1.0970 region in the next few weeks, noted Markets Strategist Quek Ser Leang and Senior FX Strategist Peter Chia at UOB Group.
Key Quotes
24-hour view: “The strong rise in EUR to a high of 1.0926 came as a surprise (we were expecting EUR to trade in a range). While overbought, the advance in EUR could break above the month-to-date high near 1.0930. In view of the overbought conditions, the next resistance at 1.0970 is unlikely to come into view today. Support is at 1.0880; a breach of 1.0865 would indicate that the upward pressure has faded.”
Next 1-3 weeks: “We have held the same view since Monday (27 Mar, spot at 1.0775) wherein EUR ‘appears to have entered a consolidation phase and it is likely to trade between 1.0660 and 1.0870’. We highlighted yesterday (30 Mar, spot at 1.0845) that ‘while short-term upward momentum has improved a tad, EUR has to break and stay above 1.0900 before a sustained advance is likely’. We added, ‘The prospect of EUR breaking clearly above 1.0900 is low for now, but it would remain intact as long as EUR stays above the ‘strong support’ level of 1.0770 in the next few days’. In early NY trade, EUR cracked 1.0900 and rose to 1.0926 before settling at 1.0901 (+0.53%). Upward momentum has improved further and EUR is likely to strengthen to 1.0970. On the downside, the ‘strong support’ level has moved higher to 1.0820 from 1.0770. Looking ahead, the next significant resistance above 1.0970 is at 1.1035.”
-
06:16
USD/CAD syncs with sluggish Oil price, US Dollar above 1.3500 as Canada GDP, US inflation clues loom
- USD/CAD picks up bids to pare intraday losses around five-week low.
- Oil traders struggle to cheer risk-on mood, upbeat China PMI as US Dollar pauses downside.
- Recently falling hawkish Fed bets, mixed US data allow Loonie bears to remain hopeful.
- Canada GDP for January, US Core PCE Price Index eyed for fresh impulse.
USD/CAD licks its wounds around 1.3520 as it pares the weekly losses around the lowest levels in more than a month, after refreshing the multi-day low, during early Friday. In doing so, the Loonie pair takes clues from the inactive Oil price and the US Dollar amid the market’s cautious mood ahead of the key inflation data from the US, as well as Canada’s Monthly Gross Domestic Product (GDP) data for January.
WTI crude oil remains mildly offered around $74.30 after refreshing a 13-day high earlier in the day. That said, upbeat prints of China’s official PMIs for March join talks of no change in the production policies of the Organization of the Petroleum Exporting Countries (OPEC) and allies led by Russia, known collectively as OPEC+, to favor the Oil buyers.
On the other hand, the US Dollar Index (DXY) seesaws around 102.25, after refreshing the weekly bottom with 102.05 earlier in the day. In doing so, the greenback’s gauge versus the six major currencies portrays the pre-data anxiety, while also taking clues from the lackluster markets, to prod the DXY traders.
It should be noted that the recent hawkish rhetoric of the Fed officials and strong US inflation expectations seemed to have triggered the USD/CAD pair’s corrective bounce. That said, Fed Jerome Powell joined Boston Fed President Susan Collins, Minneapolis Fed Leader Neel Kashkari and Richmond Fed President Thomas Barkin to suggest the US central bank’s further rate hike to tame the inflation woes. However, mixed US data raise doubts about the Fed policymakers’ hawkish rhetoric and rather concentrated on their rejection of banking crisis woes to weigh on the US Dollar, as well the Fed bets.
As per the latest reading of the CME’s FedWatch Tool, traders place a nearly 47% chance of a 0.25% rate hike in the May month Federal Open Market Committee (FOMC) Monetary policy meeting, versus 60% the previous day.
Amid these plays, the S&P 500 Futures refresh a three-week high by tracing Wall Street’s upbeat sentiment. Though, the US 10-year Treasury bond yields rose two basis points (bps) to 3.57% whereas the two-year counterpart grinds higher to 4.13% during a five-day uptrend.
Looking ahead, USD/CAD may defend the latest corrective bounce ahead of the key US inflation clues, as well as Canadian GDP. However, the actual prints of the Core Personal Consumption Expenditure (PCE) Price Index for February will be crucial for clear directions.
Technical analysis
The 100-DMA challenges USD/CAD bears around 1.3520 ahead of directing them to the key support line stretched from June 2022, close to 1.3480. That said, the bearish MACD signals and sustained trading below the 50-DMA, close to 1.3545 at the latest, suggest the Loonie pair’s further downside.
-
06:10
Japan Construction Orders (YoY) above expectations (9.8%) in February: Actual (22.3%)
-
06:10
Japan Housing Starts (YoY) registered at -0.3% above expectations (-0.5%) in February
-
06:09
Japan Annualized Housing Starts: 0.859M (February) vs previous 0.893M
-
05:54
Natural Gas Price Analysis: Approaches two-year low at $2.10 despite a less-than-expected drawdown
- Natural Gas is oscillating near its fresh two-year low at $2.09 amid a weak demand outlook.
- The US EIA reported a drawdown in natural gas inventory by 47 billion cubic feet (bcf), lower than the consensus of -54bcf.
- The extension of winter in northern America has postponed the requirement of ACs due to which demand for natural gas might remain weak.
Natural Gas futures are hovering near their fresh two-year low at $2.09 in the Asian session. The asset witnessed a steep fall on Thursday despite a less-than-anticipated drawdown reported by the United States Energy Information Administration (EIA) for the week ending March 24.
The US EIA reported a drawdown in natural gas inventory by 47 billion cubic feet (bcf), lower than the consensus of -54bcf and the former release of 72bcf. The extension of winter in northern America has postponed the requirement for air conditioners to which demand for natural gas is expected to remain weak, which is weighing heavily on natural gas prices. Also, declining oil prices will get benefit from natural gas substitution ahead.
Meanwhile, the US Dollar Index (DXY) is displaying a subdued performance ahead of the United States core Personal Consumption Expenditure (PCE) Price Index data.
Natural Gas price weekly chart
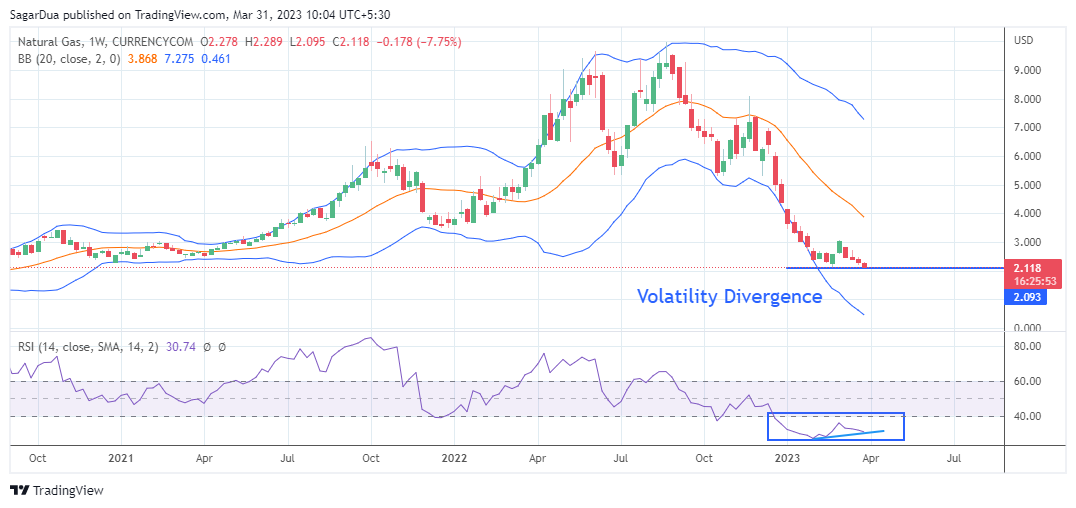
On a weekly scale, Natural Gas futures are showing signs of volatility divergence. The asset has gone a little far from the lower Bollinger Bands (20,2), which indicates that volatility has been squeezed. Also, the Relative Strength Index (RSI) (14) is displaying a divergence in the downside momentum.
The asset has formed a lower low while the momentum oscillator has not made a lower low yet. However, investors are required to use more filters for building bullish bias.
Natural Gas price hourly chart
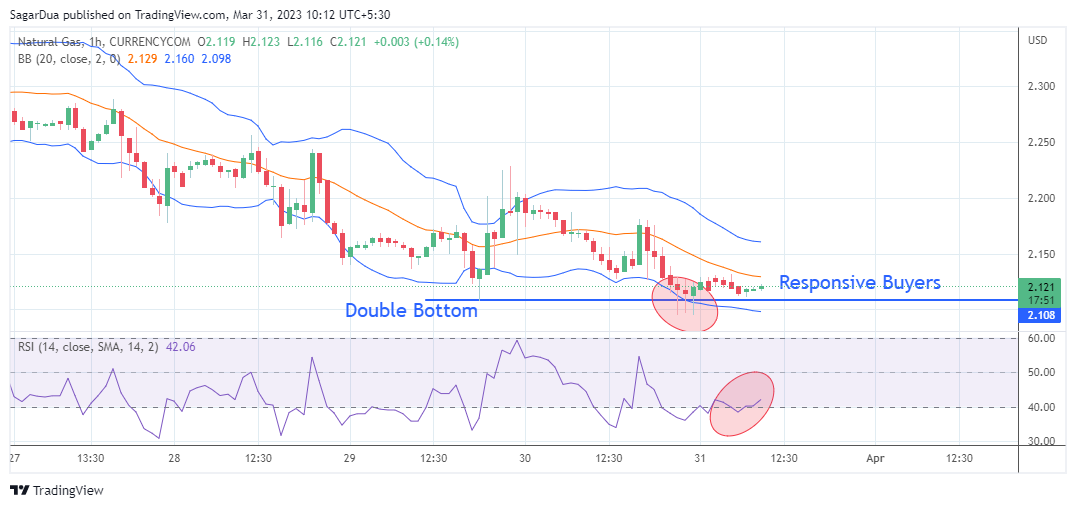
On an hourly scale, Natural Gas futures have shown some signs of responsive buying near the critical support of $2.11, which could result in a Double Bottom chart pattern but still eyes more filters for confidence.
For an upside move, the asset needs to break above the immediate resistance of $2.20, which will drive the asset towards March 28 high around $2.25 followed by March 27 high at $2.29.
On the flip side, a break below March 30 low at $2.09 would expose the asset to fresh two-year low near the psychological resistance at $2.00.
-
05:45
AUD/USD Price Analysis: Retraces from wall of resistance around 0.6750
- AUD/USD retreats after refreshing one-week high, mildly bid of late.
- Bullish MACD signals, upbeat RSI (14) keeps Aussie pair buyers hopeful.
- Convergence of 200-DMA, monthly triangle’s upper line restrict immediate advances.
- Bears remain off the table unless breaking 0.6520.
AUD/USD pares intraday gains around 0.6720, following the run-up to refresh weekly top to near 0.6740, as markets brace for the key US inflation clues during early Friday. Even so, the Aussie pair remains inside a monthly symmetrical triangle.
It’s worth noting that upbeat China PMI and broad US Dollar weakness, amid receding hawkish Fed bets, previously propelled the AUD/USD pair to renew a one-week high.
Even if the Aussie pair fades upside momentum ahead of the key data, bullish MACD signals join the above 50 levels of RSI (14), not overbought, to keep the buyers hopeful.
However, the 200-DMA and the stated triangle’s top line, close to 0.6750, appear a tough nut to crack for the AUD/USD bulls to crack.
Following that, a run-up towards the early February lows near 0.6855 and then to the last December’s high of around 0.6895 can’t be ruled out.
On the contrary, pullback moves need to defy the triangle formation, by slipping beneath the support line of 0.6660, to convince AUD/USD bears.
In that case, the 61.8% Fibonacci retracement of the pair’s November-February upside precedes the previous resistance line from February, respectively near 0.6610 and 0.6520, to challenge the AUD/USD sellers afterward.
AUD/USD: Daily chart
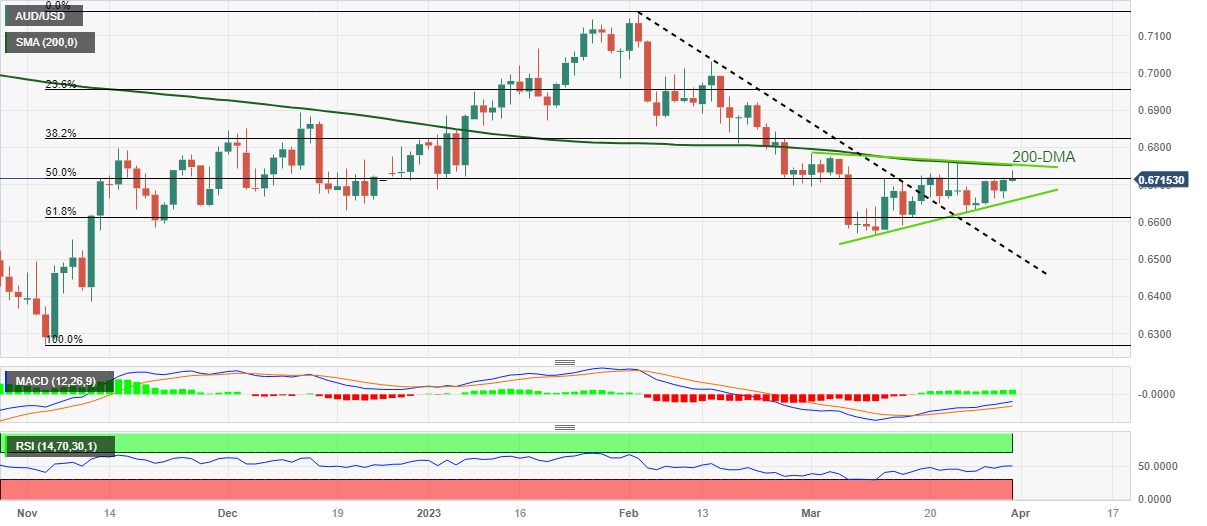
Trend: Further upside expected
-
05:31
Netherlands, The Retail Sales (YoY) dipped from previous 11.1% to 8.5% in February
-
05:12
GBP/USD eyes two-month high near 1.2450 amid cheerful market mood, UK GDP in focus
- GBP/USD is looking to recapture a two-month high at 1.2450 as the risk profile remains upbeat.
- The USD Index is defending the 102.20 support in hopes of the continuation of a policy-tightening spell by the Fed.
- Mixed views on BoE’s monetary outlook will keep Pound Sterling volatile.
The GBP/USD pair is aiming to re-test its two-month high at 1.2448 in the Asian session. The Cable is attracting bullish bets despite expectations for a steady monetary policy by the Federal Reserve (Fed) have eased. The US Dollar Index (DXY) is defending the 102.20 support on hopes that receding fears of the United States banking fiasco have opened the door for the continuation of the policy-tightening spell by the Fed.
As per the CME Fedwatch tool, the odds of an unchanged monetary policy by the Fed in May have slipped below 50%.
The USD Index is demonstrating topsy-turvy moves above 102.20 as investors are awaiting the release of the core US Personal Consumption Expenditure (PCE) Price Index (Feb) data. According to the estimates, the core PCE Price Index is expected to remain flat at 4.7% annually. Meanwhile, the prices of goods and services have accelerated by 0.4%, lower than the former expansion of 0.6%.
There is evidence that conveys the United States inflation is in a clear downtrend, however, the inflation rate is still more than three times the desired rate, and achieving price stability is not a cakewalk, which solidifies the case of one more rate hike announcement by Fed chair Jerome Powell in May.
S&P500 futures have gained further in the Tokyo session after a bullish Thursday as ebbing US banking jitters have infused confidence among investors, portraying extremely positive market sentiment. Also, Fed Vice Chair for Supervision Michael Barr assured investors that the failure of a couple of lenders is unable to lead to a widespread contagion.
Going forward, the Pound Sterling will show a power-pack action amid the release of the United Kingdom Gross Domestic Product (GDP) data. According to the estimates, UK’s growth rate has remained stagnant in the fourth quarter of CY2022. Annual GDP is expected to remain steady at 0.4%.
Mixed views on the Bank of England’s (BoE) monetary outlook will keep Pound Sterling volatile. BoE policymakers are confident about the quick softening of UK inflation ahead, however, rising food inflation and shortage of labor are telling a different story.
-
04:41
USD/INR Price News: Indian Rupee struggles above 82.00 as inflation woes prod Fed bets
- USD/INR seesaws around three-week low amid cautious markets.
- Yields grind higher but receding hawkish Fed bets favor Indian Rupee buyers.
- Second-tier statistics from India can entertain traders ahead of US Core PCE Price Index.
- Easing US inflation could weigh on US Dollar, especially amid banking-led optimism.
USD/INR stays defensive above 82.00, keeping the latest bounce off three-week low amid Friday’s sluggish Asian session. In doing so, the Indian Rupee (INR) pair portrays the market’s anxiety ahead of the key US inflation clues. However, recently easing hawkish bias about the Federal Reserve’s (Fed) next moves seem to favor the bears.
As per the latest reading of the CME’s FedWatch Tool, traders place a nearly 50% chance of a 0.25% rate hike in the May month Federal Open Market Committee (FOMC) Monetary policy meeting, versus 60% the previous day.
While tracing the clues, mixed US data could be held responsible as final readings of the US fourth quarter (Q4) Gross Domestic Product (GDP), also known as the Real GDP, marked an easy Annualized growth number of 2.6% versus 2.7% previous forecasts. It’s worth noting that the Q4 Personal Consumption Expenditure (PCE) Prices matched 3.7% QoQ forecasts and prior while the Core PCE figure grew to 4.4% QoQ versus 4.3% expected and prior. Moving on, the Weekly Initial Jobless Claims rose to 198K for the week ended on March 25 versus 191K prior and 196K market forecasts.
Even so, the recent hawkish rhetoric of the Fed officials and strong US inflation expectations challenge the USD/INR bears. That said, Fed Jerome Powell joined Boston Fed President Susan Collins, Minneapolis Fed Leader Neel Kashkari and Richmond Fed President Thomas Barkin to suggest the US central bank’s further rate hike to tame the inflation woes. However, mixed US data raise doubts about the Fed policymakers’ hawkish rhetoric and rather concentrated on their rejection of banking crisis woes to weigh on the US Dollar, as well the Fed bets.
While portraying the mood, the S&P 500 Futures refresh a three-week high by tracing Wall Street’s upbeat sentiment. Though, the US 10-year Treasury bond yields rose two basis points (bps) to 3.57% whereas the two-year counterpart grinds higher to 4.13% during a five-day uptrend. Amid these plays, the US Dollar Index (DXY) licks its wounds near 102.20 after refreshing the weekly low.
Looking forward, India’s Q4 Balance Payment and Current Account details may allow USD/INR intermediate directions as those figures have previously weighed on the INR. However, major attention will be given to the Core Personal Consumption Expenditure (PCE) Price Index for February.
Also read: US February PCE Inflation Preview: Bad news for the Dollar, good news for the Fed?
Technical analysis
A 10-week-old ascending support line, near the 82.00 threshold at the latest, restricts the immediate downside of the USD/INR price. The recovery moves, however, need validation from the 50-DMA hurdle surrounding 82.35. It’s worth noting that the bearish MACD signals join the pair’s sustained trading below the key moving averages to keep the sellers hopeful.
-
04:18
EUR/USD retreats to 1.0900 even as hawkish Fed bets ease pre-Eurozone, US inflation hints
- EUR/USD grinds higher after refreshing one-week top, retreats from intraday peak of late.
- Pre-data anxiety seems probing Euro buyers as markets anticipate easing inflation fears.
- Comparative more hawkish ECB speakers, than the Fed ones, join upbeat EU data to keep buyers hopeful.
- German Retail Sales can entertain EUR/USD traders ahead of Eurozone HICP, US Core PCE Price Index.
EUR/USD stays defensive around 1.0910 after refreshing the weekly high to 1.0925 during early Friday. In doing so, the Euro pair portrays the market’s cautious mood ahead of the key inflation clues from Eurozone and the US. Adding strength to the pullback moves could be the recently sluggish Treasury bond yields.
Downbeat prints of German inflation contrast with the policymakers’ hawkish bias to challenge the EUR/USD pair’s latest run-up even if the recently easing expectations of a rate hike by the Fed in May month’s Federal Open Market Committee (FOMC) Monetary policy meeting.
Preliminary readings of Germany’s inflation gauge, namely the Harmonised Index of Consumer Prices (HICP), suggested an easing in price pressure to 7.8% YoY in March versus 9.3% prior and 7.5% market forecasts. On the same line, German inflation per the Consumer Price Index (CPI) also eased to 7.4% YoY during the stated month from 8.7% prior and 7.3% expected. Further, the Eurozone Business Climate gauge for March eased to 0.70 versus 0.71 prior while the Consumer Confidence figure came in at -19.2 during the stated month while matching market forecasts and prior.
Even so, the latest Economic Bulletin from the European Central Bank (ECB) said, “Inflation is projected to remain too high for too long.” On the same line, Frank Elderson, member of the Executive Board of the European Central Bank (ECB) and Vice-Chair of the ECB’s Supervisory Board said in a media interview, “We must reduce the very high rate of inflation.”
For the US, the final readings of the US fourth quarter (Q4) Gross Domestic Product (GDP), also known as the Real GDP, marked an easy Annualized growth number of 2.6% versus 2.7% previous forecasts. It’s worth noting that the Q4 Personal Consumption Expenditure (PCE) Prices matched 3.7% QoQ forecasts and prior while the Core PCE figure grew to 4.4% QoQ versus 4.3% expected and prior. Moving on, the Weekly Initial Jobless Claims rose to 198K for the week ended on March 25 versus 191K prior and 196K market forecasts.
It should be noted that Federal Reserve Chairman Jerome Powell joined three other Fed Officials to back further rate hikes on Thursday, citing the need to tame the inflation woes. However, mixed US data raise doubts about the Fed policymakers’ hawkish rhetoric and rather concentrated on their rejection of banking crisis woes to weigh on the US Dollar, as well the Fed bets. That said, the CME’s FedWatch Tool suggests a nearly 50% chance of a 0.25% rate hike in the May Fed meeting, versus 60% the previous day.
On a different page, officials from the Federal Reserve (Fed), the European Central Bank (ECB), the Bank of England (BoE) and the Swiss National Bank (SNB) have recently pushed back the fears of the banking crisis and allowed the markets to remain optimistic. The same weighs on the US Dollar’s demand, especially amid sluggish yields.
While portraying the mood, the S&P 500 Futures refresh a three-week high near 4,095, rising for the third consecutive day, as it traces Wall Street’s upbeat sentiment. That said, the US 10-year Treasury bond yields rose two basis points (bps) to 3.57% whereas the two-year counterpart grinds higher to 4.13% during a five-day uptrend.
Looking forward, the Eurozone Harmonised Index of Consumer Prices (HICP) for March and the United States Core Personal Consumption Expenditure (PCE) Price Index for February will be closely watched for clear directions. Also important to watch will be Germany’s Retail Sales for February, expected -5.2% YoY versus 6.9% prior.
Forecasts suggest the EU HICP ease to 7.1% YoY from 8.5% prior but the Core HICP could print annualized growth of 5.7% versus 5.6% previous readings. Further, On the other hand, the Fed’s preferred inflation gauge, namely the US Core PCE Price Index, is likely to remain unchanged at 4.7% YoY during February. However, the monthly figure is expected to ease to 0.4%, from 0.6% prior.
Technical analysis
Given the overbought RSI (14) and the Euro pair’s repeated failures to cross the 1.0930-35 horizontal resistance area, comprising levels marked since late January, the EUR/USD pair may drop to a two-week-old ascending support line, close to 1.0850 at the latest.
-
03:57
USD/JPY retreats from fortnight top to 133.00 on BoJ talks, Fed’s favorite inflation eyed
- USD/JPY trims intraday gains at the highest levels in two week.
- IMF’s Salgado signals more flexibility in BoJ YCC policy, Japan FinMin Suzuki advocates BoJ independence.
- Mixed Japan data, sluggish yields and cautious optimism keep Yen pair buyers hopeful.
- Quarter-end JPY flows, US Core PCE Price Index can entertain USD/JPY traders.
USD/JPY drops to 132.90 amid early Friday, after refreshing a two-week high, as market sentiment turns dicey ahead of the key US inflation catalysts. Adding strength to the pullback moves could be the chatters surrounding the Bank of Japan (BoJ) and mixed Japan data, not to forget the sluggish US Treasury bond yields.
Starting with the data, Tokyo Consumer Price Index (CPI) rose to 3.3% in March versus 2.7% expected but eased from 3.4% prior while the Tokyo CPI ex Food, Energy jumped to 3.4% compared to 3.2% previous readings and 3.3% market consensus. Further, Japan’s Industrial Production growth rallied to 4.5% MoM in February compared to 2.7% estimations and -5.3% prior while Retail Trade also improved during the stated month to 6.6% from 5.0% prior and 5.8% analysts’ forecasts. On the contrary, a surprise jump in Japan’s Unemployment rate, from 2.4% to 2.6% in February, can be cited as resulting in the Japanese Yen’s (JPY) latest weakness.
Following that, Japan's Finance Minister Shunichi Suzuki said that he expects the Bank of Japan (BoJ) and Ueda to enforce monetary policy strongly. The same promotes the Japanese central bank’s autonomy and likely push for exiting the easy money policies, especially after the latest wage hike.
It should, however, the noted that International Monetary Fund (IMF) Japan Mission Chief Ranil Salgado saw the prospect and the potential of more flexibility at the long end of the curve under the Bank of Japan’s (BOJ) YCC policy.”
On the other hand, Federal Reserve Chairman Jerome Powell joined three other Fed Officials to back further rate hikes on Thursday, citing the need to tame the inflation woes. However, mixed US data raise doubts about the Fed policymakers’ hawkish rhetoric and rather concentrated on their rejection of banking crisis woes to weigh on the US Dollar, as well the Fed bets. That said, the CME’s FedWatch Tool suggests a nearly 50% chance of a 0.25% rate hike in the May Fed meeting, versus 60% the previous day.
It’s worth mentioning that the central bankers from the Federal Reserve (Fed), the European Central Bank (ECB), the Bank of England (BoE) and the Swiss National Bank (SNB) have recently pushed back the fears of the banking crisis and allow the markets to remain optimistic.
Amid these plays, the S&P 500 Futures refresh a three-week high near 4,095, rising for the third consecutive day, as it traces Wall Street’s upbeat sentiment. That said, the US 10-year Treasury bond yields rose two basis points (bps) to 3.57% whereas the two-year counterpart grinds higher to 4.13% during a five-day uptrend.
Moving on, the Federal Reserve’s (Fed) preferred inflation gauge, namely the US Core Personal Consumption Expenditure (PCE) Price Index for February, will be crucial for clear directions as markets anticipate softer inflation to weigh on hawkish Fed bets.
Also read: US February PCE Inflation Preview: Bad news for the Dollar, good news for the Fed?
Technical analysis
A daily closing beyond the 50-DMA hurdle surrounding 133.00 becomes necessary for the USD/JPY bulls to keep the reins.
-
03:33
Gold Price Forecast: XAU/USD aims to sustain above $1,980, investors eye Fed’s preferred inflation tool
- Gold price is looking to sustain its business firmly above $1,980.00 as investors see no rate hike in May.
- The USD Index has shown some signs of recovery from 102.00, however, the downside is still favored.
- Gold price is auctioning in a Symmetrical Triangle pattern, which is indicating volatility contraction ahead of the Fed’s preferred inflation tool.
Gold price (XAU/USD) is aiming to sustain its auction above the critical resistance of $1,980.00 in the Asian session. The precious metal is looking to surpass Thursday’s high of $1,984.65 despite the US Dollar Index (DXY) has shown some signs of recovery from 102.00.
S&P500 futures have generated significant gains in the Asian session. US equities have carry-forwarded the buying spree firmly, portraying a cheerful market mood. Meanwhile, the demand for US government bonds has been trimmed further in hopes of no further casualties in the United States banking sector.
The recovery move from the USD Index has to pass plenty of filters as investors are anticipating an unchanged monetary policy stance in May by the Federal Reserve (Fed). In a private meeting with US lawmakers, Fed chair Jerome Powell cited that he anticipates one more rate hike in 2023. The statement from Fed Powell is not restricted to the May policy. Therefore, the chances of a steady monetary policy in May are extremely solid.
On Friday, the USD Index will remain in action ahead of the release of the core Personal Consumption Expenditure (PCE) Price Index data. Analysts at Wells Fargo have forecasted the PCE deflator (+0.4%) to outpace nominal spending (+0.3%).
Gold technical analysis
Gold price is auctioning in a Symmetrical Triangle chart pattern on an hourly scale, which is indicating a sheer volatility contraction ahead of Fed’s preferred inflation tool. The upward-sloping trendline of the chart pattern is plotted from March 22 low at $1,934.34 while the downward-sloping trendline is placed from March 20 high at $2,009.88.
Broadly the Gold price is overlapping the 50-period Exponential Moving Average (EMA) at above $1,970.00, which indicates that the consolidation is still on.
The Relative Strength Index (RSI) (14) is oscillating in the bullish range of 60.00-80.00, which favors more upside ahead.
Gold hourly chart
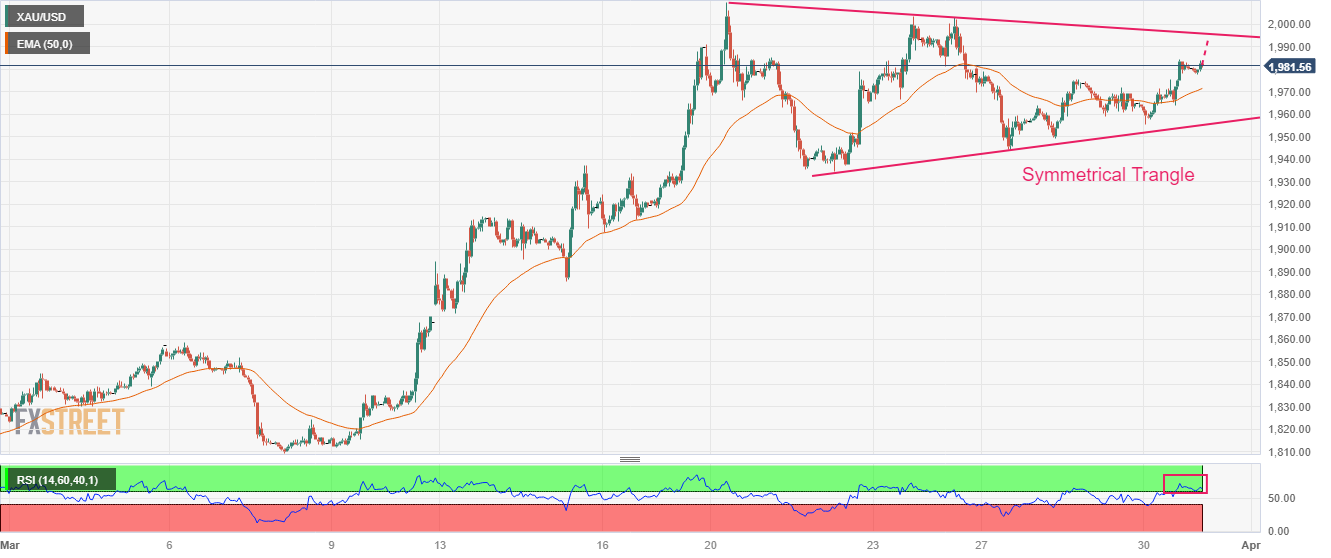
-
03:31
USD/MXN Price Analysis: Doji prods bears at three-week low around 18.00
- USD/MXN portrays corrective after refreshing multi-day bottom, sidelined of late.
- Bearish MACD signals, sustained trading below key DMA, resistance line favor sellers.
- Nearly oversold RSI, Doji candlestick on daily challenges Mexican Peso pair’s further downside.
USD/MXN licks its wounds near 18.10, after refreshing the three-week low, during early Friday. In doing so, the Mexican Peso pair probes the five-day losing streak after posting a trend reversal suggesting a candlestick, namely Doji, the previous day.
Not only Thursday’s Doji but nearly oversold RSI (14) also suggests the Mexican Peso pair’s recovery.
However, bearish MACD signals and the quote’s sustained trading below the 21-DMA, as well as a fortnight-long descending trend line, keeps sellers hopeful.
As a result, the quote’s latest rebound remains elusive unless it crosses the downward-sloping resistance line from March 20, close to 18.30 by the press time. Even so, the 21-DMA hurdle of 18.43 may test the USD/MXN bulls.
In a case where the USD/MXN pair rises past 18.43, multiple stops around 18.55 and the previous Friday’s peak surrounding 18.80 can challenge the bulls ahead of directing them to the 19.00 threshold. Following that, the monthly of near 19.25 will be in focus.
Alternatively, USD/MXN pair’s fresh downside needs validation from the previous day’s low of 18.04, as well as the 18.00 round figure, to convince sellers.
Though, the monthly low of 17.89 and a downward-sloping support line from late November 2022, around 17.63 at the latest, could challenge the USD/MXN bears afterward.
USD/MXN: Daily chart
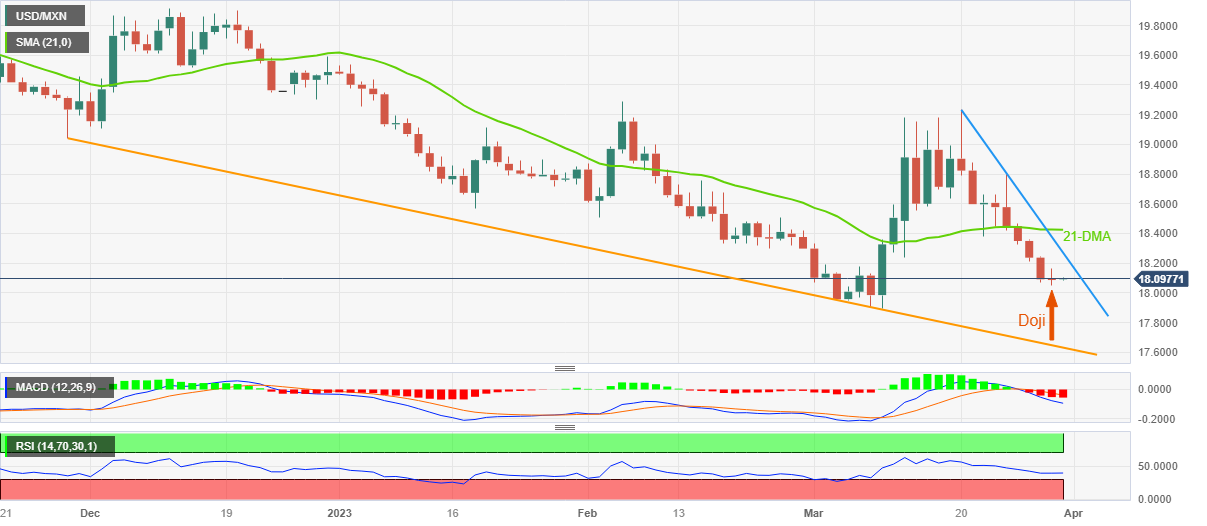
Trend: Limited recovery expected
-
03:15
Australian PM Albanese: Would welcome inflation-matching minimum wage rise
In an interview with ABC Radio, Australian Prime Minister (PM) Anthony Albanese said on Friday, he would welcome lifting the minimum wage to match inflation.
Key quotes
The government submission recommended real wages for low-paid workers "do not go backwards" but added it was not suggesting wages should "across-the-board" automatically rise with inflation.
"If the Fair Work Commission makes that decision then I would welcome it, but it is an independent decision of the government. It's up to them to determine the range of factors they'll consider.”
"My values haven't changed.”
Meanwhile, the Australian Chamber of Commerce and Industry submission on Friday called for an increase in minimum and award wages of up to 4%.
Market reaction
AUD/USD is consolidating the upbeat Chinese PMIs-led gains at around 0.6725, up 0.22% on the day. The Reserve Bank of Australia (RBA) could take note of the above development when they announce their policy decision next Tuesday.
-
03:13
S&P 500 Futures refresh three-week high, yields dribble as hawkish Fed bets ease ahead of US, EU inflation
- Risk appetite remains firmer as markets anticipate easing inflation woes to prod Fed hawks.
- Optimism about banking sector, mixed US data supersede Federal Reserve officials’ push for higher rates.
- S&P 500 Futures print three-day winning streak to refresh multi-day top, bond yields remain sidelined.
- Eurozone HICP, US Core PCE Price Index will be important for fresh impulse.
Market sentiment remains firmer as traders flex muscles for the key Friday comprising headline inflation clues from Eurozone and the US. Adding strength to the market’s cautious optimism are the recently easing hawkish Fed bets and mixed US data, not to forget the policymakers’ rejections of the banking crisis.
While portraying the mood, the S&P 500 Futures refresh a three-week high near 4,095, rising for the third consecutive day, as it traces Wall Street’s upbeat sentiment. That said, the US 10-year Treasury bond yields rose two basis points (bps) to 3.57% whereas the two-year counterpart grinds higher to 4.13% during a five-day uptrend.
Federal Reserve Chairman Jerome Powell joined three other Fed Officials to back further rate hikes on Thursday, citing the need to tame the inflation woes. However, mixed US data raise doubts about the Fed policymakers’ hawkish rhetoric and rather concentrated on their rejections of banking crisis woes to reduce the bets of a 0.25% rate hike in the next Federal Open Market Committee (FOMC) Monetary policy meeting, in May.
Not only the central bankers from the US but the European Central Bank (ECB), Bank of England (BoE) and the Swiss National Bank (SNB) officials have also recently pushed back the fears of the banking crisis.
As a result, the CME’s FedWatch Tool suggests a nearly 50% chance of a 0.25% rate hike in the May Fed meeting, versus 60% the previous day.
It should be noted that China’s upbeat activity data and softer US numbers also propel the risk-on mood. That said, China’s headline NBS Manufacturing PMI rises to 51.9 versus 51.5 expected and 52.6 prior while the Non-Manufacturing PMI jumps to 58.2 from 56.3 previous readings. On the same line could be comments from China's Premier Li Qiang who said that the economic situation in March is even better than in January and February.
On the other hand, final readings of the US fourth quarter (Q4) Gross Domestic Product (GDP), also known as the Real GDP, marked an easy Annualized growth number of 2.6% versus 2.7% previous forecasts. It’s worth noting that the Q4 Personal Consumption Expenditure (PCE) Prices matched 3.7% QoQ forecasts and prior while the Core PCE figure grew to 4.4% QoQ versus 4.3% expected and prior. Moving on, the Weekly Initial Jobless Claims rose to 198K for the week ended on March 25 versus 191K prior and 196K market forecasts.
Looking ahead, the Eurozone Harmonised Index of Consumer Prices (HICP) for March and the United States Core Personal Consumption Expenditure (PCE) Price Index for February should be closely watched for clear directions.
Also read: Forex Today: DXY under pressure amid risk appetite; focus turns to US inflation data
-
02:59
IMF’s Salgado: See prospect, potential of more flexibility at long end of curve under BoJ’s YCC policy
International Monetary Fund (IMF) Japan Mission Chief Ranil Salgado said on Friday, “we do see a prospect and the potential of more flexibility a the long end of the curve under the Bank of Japan’s (BOJ) YCC policy.”
Additional quotes
“There are two-sided risks to Japan's inflation, including upward surprises in the Shunto wage negotiations.”
“Downside risks to Japan's inflation outlook are related to the global environment, financial shocks that raise prospects of a global recession.”
“Our advice to the BoJ is to consider allowing for greater flexibility at longer-end yields, allow lthe longer end of the curve to be more determined by market forces.”
-
02:56
USD/CNH plummets below 6.8500 on better-than-forecast China PMIs ahead of Fed’s favorite inflation data
- USD/CNH drops to fresh one-week low, down for the second consecutive day, on upbeat China activity data for March.
- China NBS Manufacturing PMI rose more than expected while Non-Manufacturing PMI crossed previous figures.
- Easing hawkish bias for the Fed’s next move, risk-on mood join mixed US data to drown USD/CNH price.
- US Core PCE Price Index, risk catalysts eyed for clear directions.
USD/CNH renews weekly low near 6.8440 during early Friday, declining for the second consecutive day amid broad US Dollar weakness and upbeat China data.
That said, China’s headline NBS Manufacturing PMI rises to 51.9 versus 51.5 expected and 52.6 prior while the Non-Manufacturing PMI jumps to 58.2 from 56.3 previous readings. On the same line could be comments from China's Premier Li Qiang who said that the economic situation in March is even better than in January and February.
Apart from upbeat data from the biggest commodity user, as well as the major consumer, USD/CNH also bears the burden of the risk-on mood and receding hawkish Fed bets, not to forget the mixed US data.
It should be noted that Federal Reserve Chairman Jerome Powell joined three other Fed Officials to back further rate hikes on Thursday, citing the need to tame the inflation woes. However, mixed US data raise doubts about the Fed policymakers’ hawkish rhetoric and rather concentrated on their rejection of banking crisis woes to weigh on the US Dollar, as well the Fed bets.
While portraying the market’s bets, the CME’s FedWatch Tool suggests a nearly 50% chance of a 0.25% rate hike in the May Fed meeting, versus 60% the previous day.
Talking about the US data, final readings of the US fourth quarter (Q4) Gross Domestic Product (GDP), also known as the Real GDP, marked an easy Annualized growth number of 2.6% versus 2.7% previous forecasts. It’s worth noting that the Q4 Personal Consumption Expenditure (PCE) Prices matched 3.7% QoQ forecasts and prior while the Core PCE figure grew to 4.4% QoQ versus 4.3% expected and prior. Moving on, the Weekly Initial Jobless Claims rose to 198K for the week ended on March 25 versus 191K prior and 196K market forecasts.
Moving on, the Federal Reserve’s (Fed) preferred inflation gauge, namely the US Core Personal Consumption Expenditure (PCE) Price Index for February, will be crucial for clear directions as markets anticipate softer inflation to weigh on hawkish Fed bets.
Also read: US February PCE Inflation Preview: Bad news for the Dollar, good news for the Fed?
Technical analysis
Failure to cross the 100-DMA hurdle surrounding 6.9140 directs USD/CNH bears towards an upward-sloping support line from early February, near 6.8280 by the press time.
-
02:54
AUD/USD climbs above 0.6730 on better-than-anticipated China’s official PMI
- AUD/USD has scaled above 0.6730 as the Chinese official PMI remained better than expectations.
- Investors are split about the monetary policy decision by the RBA as Australian inflation has softened firmly.
- The USD Index is putting efforts into defending its critical support of 102.10.
The AUD/USD pair has jumped above 0.6730 as China’s National Bureau of Statistics (NBS) has reported better-than-projected PMI figures. Manufacturing PMI has landed at 51.9, higher than the consensus of 51.5 but lower than the former release of 52.6. The Non-Manufacturing PMI has mounted higher at 58.2 vs. the former release of 56.3.
Chinese economy looks steady on its way to economic recovery as the administration is providing various monetary and non-monetary measures to trigger overall demand and accelerate the scale of economic activities. However, Monday’s Caixin Manufacturing PMI data will be keenly watched. Investors should be aware of the fact that Australia is a leading trading partner of China and a higher scale of economic activities will support the Australian Dollar.
Going forward, the Australian Dollar will remain active ahead of the interest rate decision by the Reserve Bank of Australia (RBA).
Investors are split about the monetary policy decision by RBA Governor Philip Lowe as Australian inflation has softened to 6.8% firmly from the December print of 8.4%, which supports the case of keeping policy steady and observing the impact of the current interest rate. Also, RBA Lowe cited in its previous policy statement that the central bank is considering maintenance of the status quo in April. While, the other school of thought believes that despite softening of Australian inflation, the Consumer Price Index (CPI) is still far from the desired target. Therefore, the rate-hiking spell should continue ahead.
On the United States front, the US Dollar Index (DXY) is putting efforts into defending its critical support of 102.10. More action will be seen in the USD Index ahead of the release of the US core Personal Consumption Expenditure (PCE) Price Index data.
-
02:42
NZD/USD jumps to fresh weekly high near 0.6300 on upbeat China PMI
- NZD/USD takes the bids to refresh multi-day top on strong China PMI.
- China’s NBS Manufacturing PMI, Non-Manufacturing PMI increased in March.
- Risk-on mood, receding hawkish Fed bets also favor Kiwi pair buyers.
- Fed’s preferred inflation gauge eyed for further directions.
NZD/USD renews the highest levels of the week, taking bids to refresh the multi-day top near 0.6300 on upbeat China activity data for March, published early Friday. Adding strength to the Kiwi pair’s upside is the broad US Dollar weakness amid receding hawkish Federal Reserve (Fed) bets and the mixed US data, not to forget the market’s cautious optimism.
China’s headline NBS Manufacturing PMI rises to 51.9 versus 51.5 expected and 52.6 prior while the Non-Manufacturing PMI jumps to 58.2 from 56.3 previous readings.
Elsewhere, Federal Reserve Chairman Jerome Powell joined three other Fed Officials to back further rate hikes on Thursday, citing the need to tame the inflation woes. However, mixed US data raise doubts about the Fed policymakers’ hawkish rhetoric and rather concentrated on their rejection of banking crisis woes to weigh on the US Dollar, as well the Fed bets. As a result, the CME’s FedWatch Tool suggests a nearly 50% chance of 0.25% rate hike in the May Fed meeting, versus 60% the previous day.
Not only the Fed talks but the mixed US data also weigh on the market’s bets of future rate hikes and propel the Kiwi pair. That said, final readings of the US fourth quarter (Q4) Gross Domestic Product (GDP), also known as the Real GDP, marked an easy Annualized growth number of 2.6% versus 2.7% previous forecasts. It’s worth noting that the Q4 Personal Consumption Expenditure (PCE) Prices matched 3.7% QoQ forecasts and prior while the Core PCE figure grew to 4.4% QoQ versus 4.3% expected and prior. Moving on, the Weekly Initial Jobless Claims rose to 198K for the week ended on March 25 versus 191K prior and 196K market forecasts.
It should be noted, however, that the Sino-American woes prod the NZD/USD bulls. China's Taiwan Affairs Office threatened retaliation over Taiwan President Tsai Ing-wen's visit to the US on Wednesday. Additionally, China's Premier Li Qiang recently said that the economic situation in March is even better than in January and February. The policymaker, however, also raised geopolitical tension by opposing trade protectionism and decoupling, which indirectly targets the US.
Looking forward, Fed’s preferred inflation gauge, namely the US Core Personal Consumption Expenditure (PCE) Price Index for February, will be crucial for clear directions.
Technical analysis
A clear upside break of the 50-DMA hurdle, now immediate support around 0.6280, keeps the Kiwi pair buyers hopeful.
-
02:34
China PMIs beat expectations, supporting AUD/USD into resistance
AUD/USD is a touch higher as China's March Official PMI Manufacturing arrived at 51.9 vs. the expected 51.5 while Services came in at 58.2 vs. the expected 54.3.
- Chinese composite PMI actual 57.0 (forecast -, previous 56.4).
AUD/USD update
The Australian Dollar edged higher on Friday as banking fears calmed a little, while bonds were boasting their best month in a decade after expectations for rate hikes were reined in. The Chinese data has helped to keep the bid alive and the price is moving firmer into resistance as the following illustrates:
AUD/USD daily chart
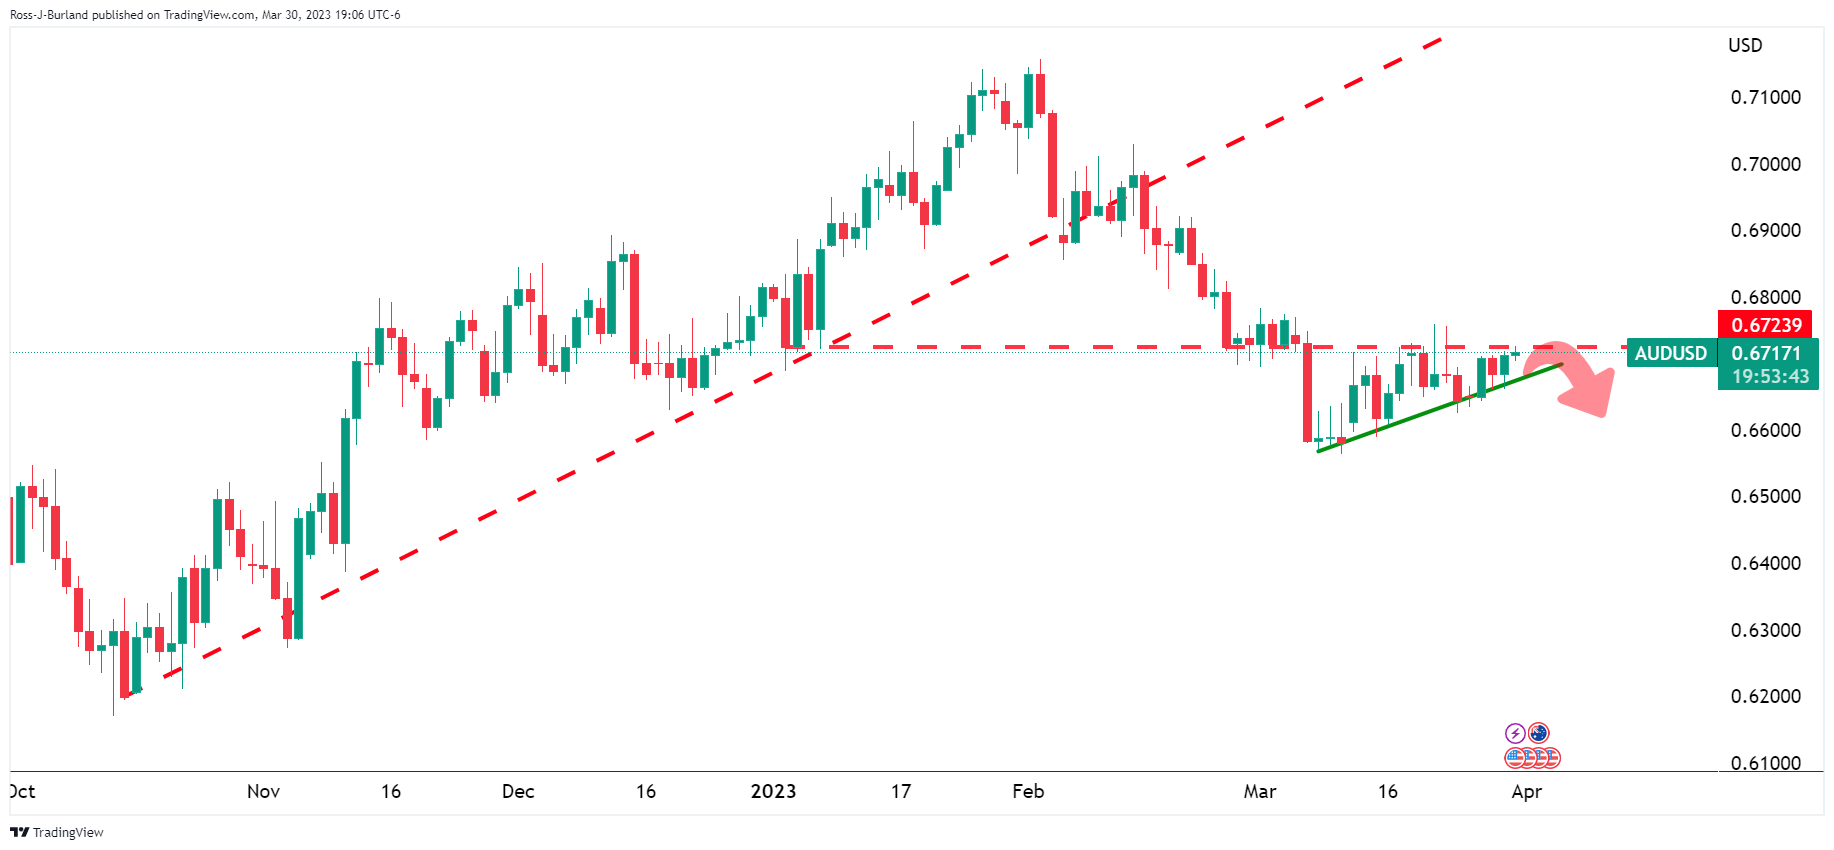
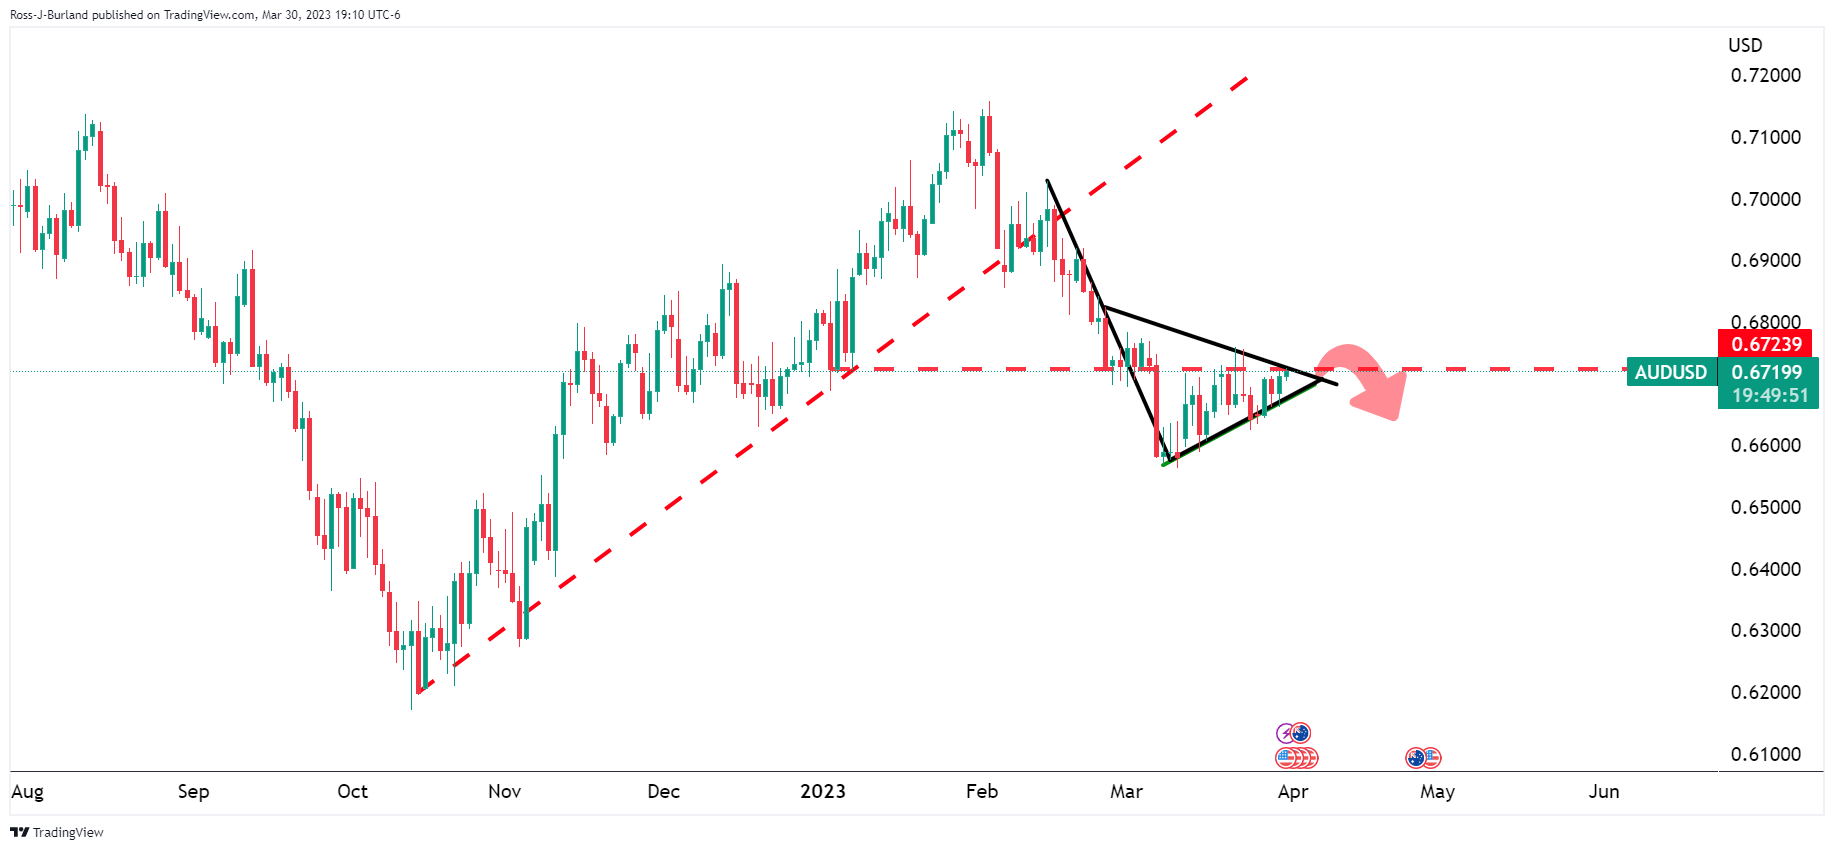
However, overall, the bears are in the market near a structure point that was broken earlier in the month that has been acting as resistance ever since. As a result, a bearish pennant has been carved out on the daily chart and traders are on the lookout for an explosive breakout of the coiled market conditions with 0.65 eyed:
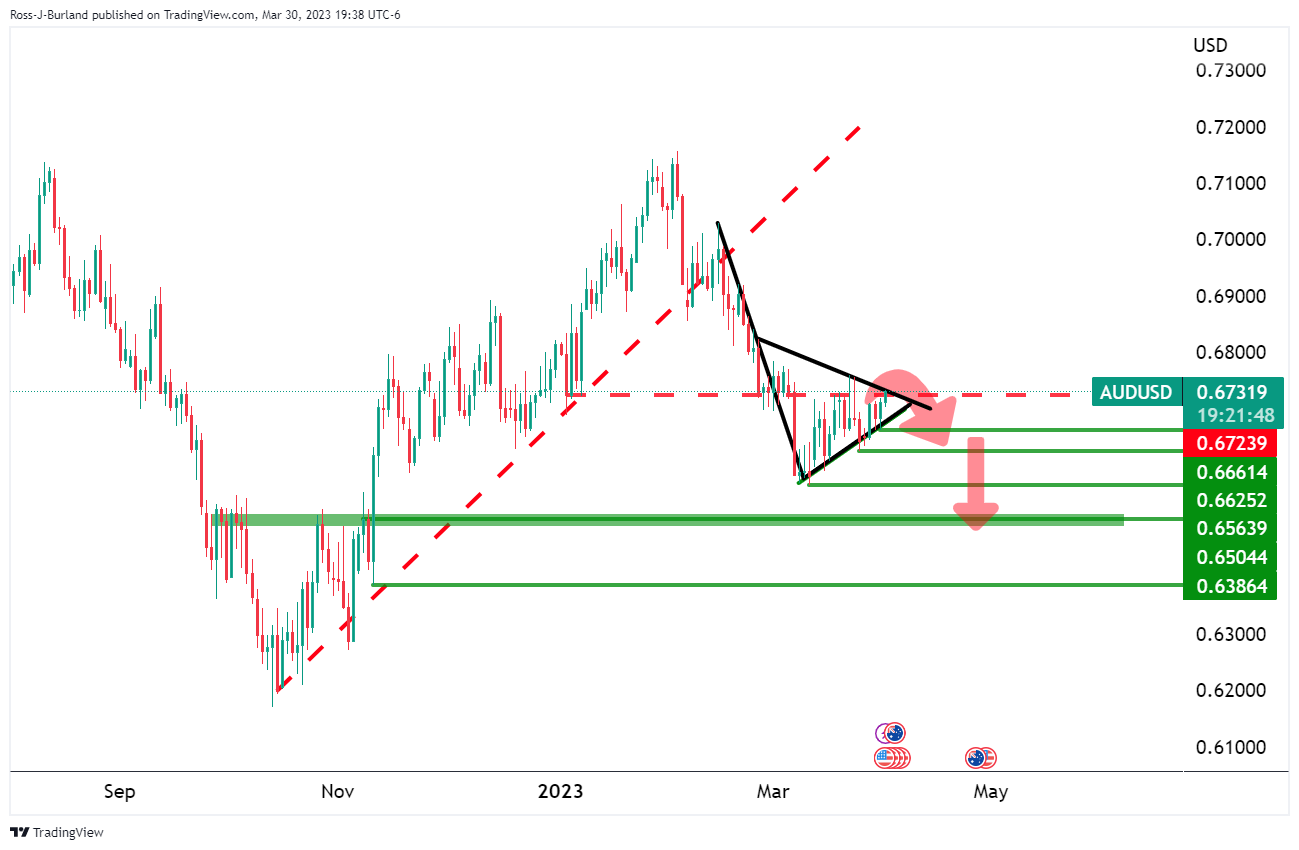
About the data
The monthly manufacturing PMI is released by China Federation of Logistics and Purchasing (CFLP) on the last day of every month. The official PMI is released before the Caixin Manufacturing PMI, which makes it even more of a leading indicator, highlighting the health of the manufacturing sector, considered as the backbone of the Chinese economy. The data is of high relevance for the financial markets throughout several asset classes, given China’s influence on the global economy.
China Federation of Logistics and Purchasing (CFLP) publishes the non-manufacturing PMI on a monthly basis. The gauge highlights the performance of China’s service sector, which has a significant impact on the global FX market, given the size of the Chinese economy. An expansion in the Chinese service sector activity points to signs of economic improvement and vice-versa.
-
02:30
China NBS Manufacturing PMI above expectations (51.5) in March: Actual (51.9)
-
02:30
China Non-Manufacturing PMI climbed from previous 56.3 to 58.2 in March
-
02:29
USD/CHF senses resistance near 0.9140 as USD Index resumes south-side journey
- USD/CHF has faced selling pressure near 0.9140 amid the positive market mood.
- Investors believe that the anticipation of one more rate hike in 2023 by Fed Powell is not for May policy.
- Swiss annual retail sales (Feb) data is expected to expand by 1.9% against a contraction of 2.2%.
The USD/CHF pair has faced tough barricades near 0.9140 in the Asian session. The Swiss Franc asset is expected to register a fresh two-week low after slipping below 0.9120 ahead. The downside bets for the major are accelerating as the US Dollar Index (DXY) has dropped after a short-lived pullback near 102.25. The downside action in the USD Index is expected to drag it below the immediate support of 102.00.
Bearish bets for USD Index are accelerating as investors believe that anticipation of one more rate hike in 2023 by Federal Reserve (Fed) chair Jerome Powell is not for May monetary policy meeting. No doubt, fears of the United States banking system crisis have ebbed significantly, and credit conditions by US banks will remain extremely tight to safeguard themselves from further casualties. Also, the impact of US banking jitters is yet to be realized ahead.
As per the CME Fedwatch tool, more than 52% chances are in favor of an unchanged monetary policy stance by the Fed for its May policy meeting.
Meanwhile, S&P500 futures have carry-forwarded optimism observed on Thursday. The 500-US stocks basket futures have added more gains in the Asian session, portraying further solidification of the risk appetite of the market participants. The demand for US government bonds is getting subdued amid an absence of clarity on the monetary policy outlook.
On the Swiss Franc front, investors are awaiting the release of Real Retail Sales (Feb) data. The annual retail sales data is expected to expand by 1.9% against a contraction of 2.2%, which would cement further scalability in the inflationary pressures. Also, the Swiss National Bank (SNB) is set on the path of bringing inflation down by hiking more rates ahead.
-
02:21
USD/CNY fix: 6.8717 against the previous closing of 6.8710
In recent trade today, the People’s Bank of China (PBOC) set the yuan at 6.8717 against the previous closing of 6.8710.
About the fix
China maintains strict control of the yuan’s rate on the mainland.
The onshore yuan (CNY) differs from the offshore one (CNH) in trading restrictions, this last one is not as tightly controlled.
Each morning, the People’s Bank of China (PBOC) sets a so-called daily midpoint fix, based on the yuan’s previous day's closing level and quotations taken from the inter-bank dealer.
-
02:19
USD/CAD Price Analysis: Bears approach multi-month-old support near 1.3470
- USD/CAD seesaws around five-week low after four-day downtrend.
- Clear break of 50-DMA, downbeat oscillators keep sellers hopeful.
- Ascending support line from June 2022 appears the key challenge for Loonie bears.
- Buyers have a bumpy road on the way to retake control.
USD/CAD sellers flirt with 1.3520-25, after declining to the lowest levels since February 22, as markets turn dicey on Friday ahead of the key inflation data from the US. In doing so, the Loonie pair prints minor losses during the five-day losing streak.
Even so, the pair’s successful downside break of the 50-DMA joins bears MACD signals to keep the sellers hopeful. Adding strength to the bearish bias is the absence of the oversold RSI (14) line.
It’s worth noting, however, that an upward-sloping support line from early June 2022, close to 1.3475 by the press time, appears a tough nut to crack for the USD/CAD bears to watch during the further downside. Also highlighting the importance of the 1.3475 level is the RSI’s fall below the 50 level as it suggests the likely dip-buying around the key support line.
In a case where the Loonie pair breaks the 1.3475 support, the 200-DMA and an ascending trend line from mid-November 2022, respectively near 1.3375 and 1.3295, could challenge the bears afterward.
On the contrary, recovery moves need validation from the 50-DMA resistance of 1.3545 to convince short-term USD/CAD buyers.
However, the mid-month low around 1.3650-55 and December 2022 tops surrounding 1.3705 can challenge the Loonie pair’s further upside before highlighting the previous yearly top of 1.3977.
USD/CAD: Daily chart
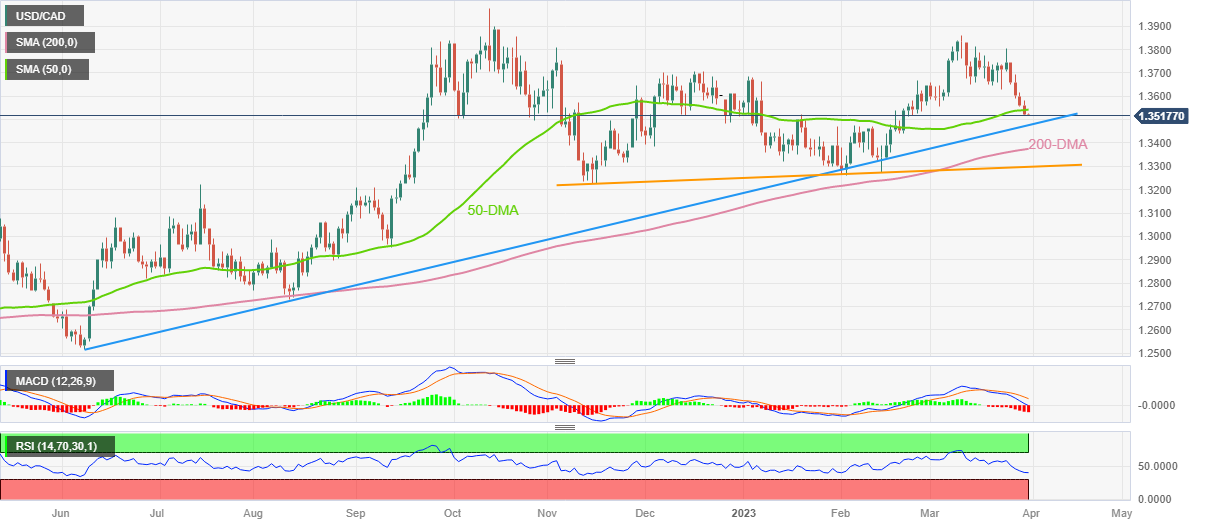
Trend: Further downside expected
-
02:00
Japan's Finmin Suzuki: BoJ and Ueda to enforce monetary policy strongly; precise policy is up to the BoJ
Japan's Finance Minister Shunichi Suzuki said he expects the Bank of Japan and Ueda to enforce monetary policy strongly; precise policy is up to the BoJ.
USD/JPY update
USD/JPY bulls took control on the front side of the trend with the 133.78s eyed. As it stands, a 38.2% Fibonacci retracement comes in near 133 the figure which is still on the front side of the trend.
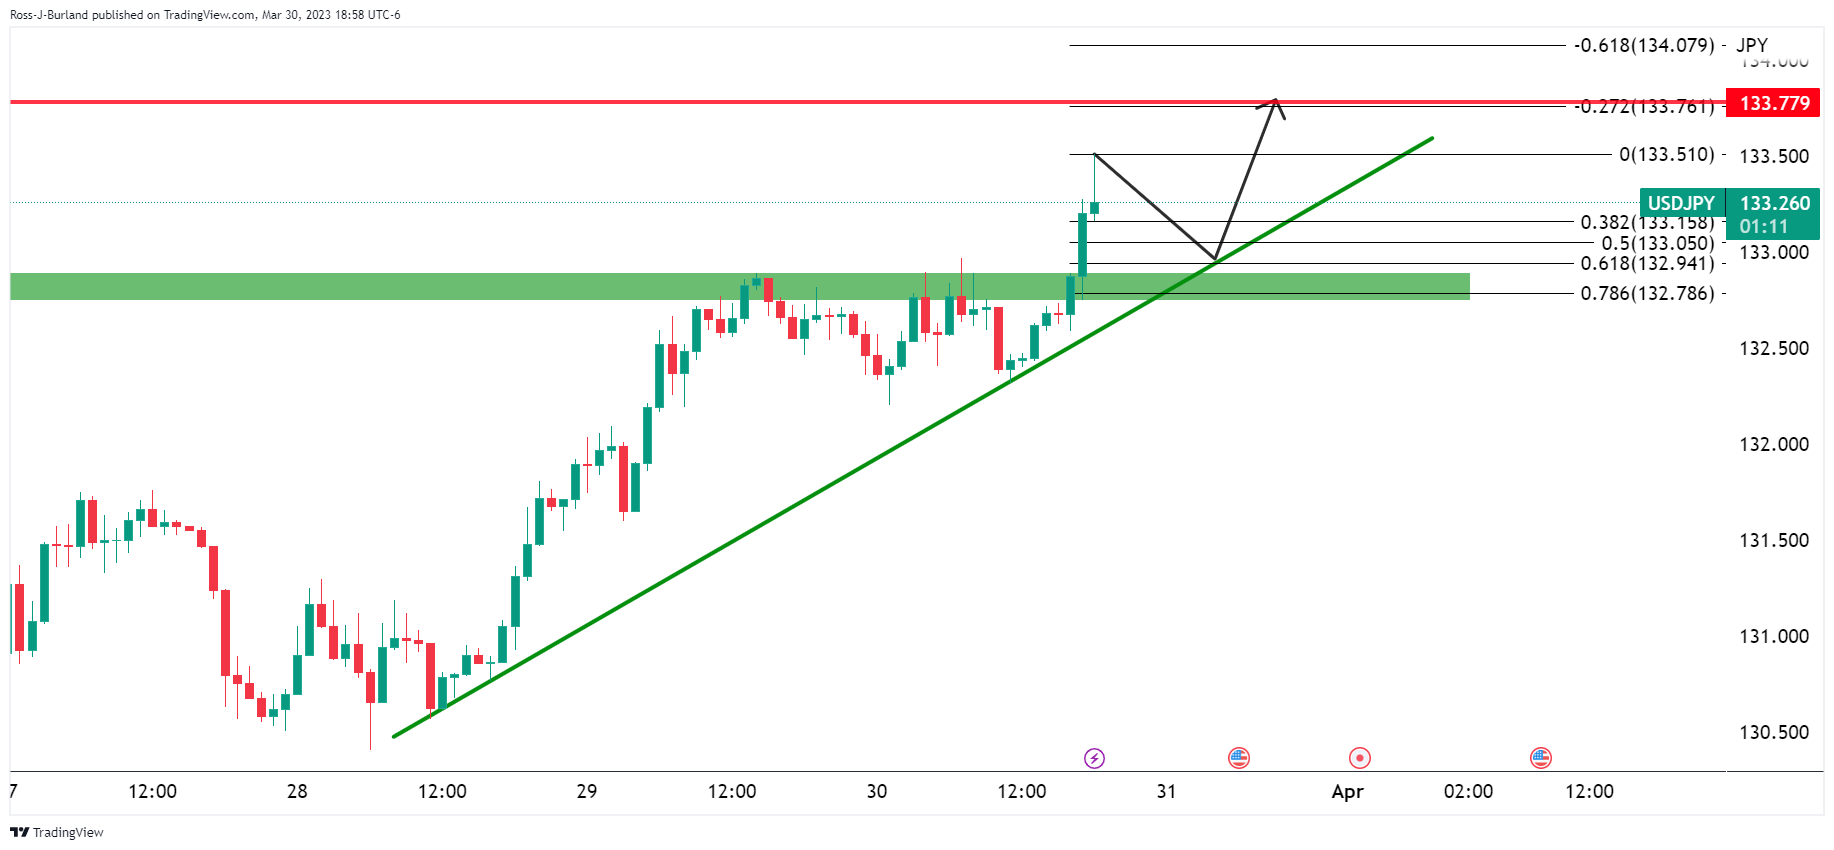
-
01:59
GBP/USD renews two-month high near 1.2400, UK GDP, Fed’s favorite inflation in focus
- GBP/USD refreshes multi-day top after rising the most in two weeks the previous day.
- Optimism about UK’s multi-billion trade deal, easing bank fears please bulls.
- Receding hawkish Fed bets, mixed US data joins hopes of downbeat inflation to propel Cable price.
- Final readings of UK Q4 GDP, US Core PCE Price Index eyed for clear directions.
GBP/USD bulls attack the 1.2400 threshold while refreshing the highest levels in two months during early Friday. In doing so, the Cable pair cheers optimism surrounding the UK’s Trans-Atlantic trade deal amid easing fears from the banking sector. However, the cautious mood ahead of the Federal Reserve’s (Fed) preferred inflation gauge, namely the US Core Personal Consumption Expenditure (PCE) Price Index for February, prods the pair buyers of late.
UK Prime Minister Rishi Sunak hails a £1.8billion Brexit boost as Britain signed up to the giant Trans-Pacific Partnership, per The Sun. The news also mentioned, “The deal, which follows two years of talks, opens the door to free trade with 11 nations including Japan, Australia, Mexico, Malaysia and Singapore.”
On the other hand, Federal Reserve Chairman Jerome Powell joined three other Fed Officials to back further rate hikes on Thursday, citing the need to tame the inflation woes. However, mixed US data raise doubts about the Fed policymakers’ hawkish rhetoric and rather concentrated on the policymakers' rejection of banking crisis woes to weigh on the US Dollar.
"Inflation remains too high, and recent indicators reinforce my view that there is more work to do to bring inflation down to the 2% target associated with price stability," Federal Reserve Bank of Boston leader Susan Collins said in remarks to a gathering of the National Association for Business Economics per Reuters. Following her was Minneapolis Fed President Neel Kashkari who said, “We have to bring down inflation.” On the same line was Richmond Fed President Thomas Barkin saying that if inflation persists, we can react by raising rates further.
It’s worth noting that US Treasury Secretary Janet Yellen said on Thursday, “Banking system is sound, even as it has come under pressure.”
While portraying the mood, the US 10-year Treasury bond yields remain pressured near 3.55% while the two-year counterpart grinds higher around 4.12%, targeting the first weekly gain in four. Further, Wall Street closed positive for the third consecutive day whereas S&P 500 Futures also print mild gains at the latest.
Looking forward, the final reading of the UK’s fourth quarter (Q4) Gross Domestic Product (GDP) will be important to watch for the intraday move. However, major attention should be given to the headlines surrounding the inflation data from the US, as well as the central bankers’ reaction to the same.
Also read: US February PCE Inflation Preview: Bad news for the Dollar, good news for the Fed?
Technical analysis
A sustained break of the 10-week-old horizontal resistance area, now support around 1.2285-65, joins the clear respect of a fortnight-long ascending trend line, close to 1.2320, to keep the GBP/USD pair buyers hopeful.
-
01:50
AUD/JPY soars above 89.50 as Japan’s Unemployment Rate expands to 2.6%
- AUD/JPY has firmly climbed above 89.50 as Japan’s higher jobless rate claims the continuation of BoJ’s loose policy.
- Japan’s retail demand remained robust. Also, inflation figures outperformed estimates.
- Going forward, investors are awaiting the interest rate decision by the RBA.
The AUD/JPY pair has shown a significant upside move after the release of Japan’s economic reports associated with the Tokyo Consumer Price Index (CPI), labor market, and retail demand. Tokyo’s headline CPI has landed at 3.3%, much higher than the anticipation of 2.7% but lower than the former release of 3.4%. Tokyo’s core CPI that excludes oil and food prices has been reported at 3.4%, higher than the consensus of 3.3% and the prior release of 3.2%.
Steady Tokyo inflation conveys that the intention of the Bank of Japan (BoJ) of maintaining inflation steadily above desired targets is not affected yet. This might keep chances of an exit from ultra-loose monetary policy intact.
Meanwhile, Japan’s retail demand remained robust in February. Monthly Retail Sales expanded by 1.4% while the street was anticipating a contraction by 0.3%. Annual Retail Sales data has soared to 6.6% vs. the estimates of 5.8%. BoJ policymakers and Japan’s administration have been worried that inflationary pressures are majorly contributed by international forces and not by domestic demand. Now solid retail demand would ease some worries.
The catalyst that has brought weakness in the Japanese Yen is the weak labor market data. The Unemployment Rate has increased to 2.6% vs. the consensus and the former release of 2.4%. Also, the Jobs/Applicants ratio has been trimmed to 1.34. Weak labor market data might force the BoJ to continue its expansionary policy.
On the Australian Dollar front, investors are awaiting the interest rate decision by the Reserve Bank of Australia (RBA), which is scheduled for Tuesday. Softening Australian inflation could propel the consideration of a steady policy. Economists at ANZ Bank are of the view that “While the RBA has signaled its intention to pause at some point in coming months, we continue to think that the data is not yet consistent with a pause.”
-
01:41
USD/JPY bulls take control into the 133s
- USD/JPY bulls are in control on the front side of the trend.
- Bulls eye the 133.78s while a 38.2% Fibonacci retracement comes in near 133 the figure.
As per the prior analysis, USD/JPY Price Analysis: Bears need to make their move or lose control in the 133s, the bulls have made their move and the price is now making fresh cycle highs in the 133s. At the time of writing, USD/JPY is 0.5% higher and has made a high of 133.36 so far.
A slew of data and the Tokyo fix combined have seen the price vault 133 the figure on Friday. Being the end of the month and quarter-end FX fixes, volatility is kicking in while otherwise, as analysts at ANZ Bank said, ´´the focus is shifting away from bank wobbles and back to macroeconomics.´´
In this regard, he February reading of personal consumption expenditures (PCE) on Friday, the Fed's preferred inflation gauge, will be released later today. January figures showed a sharp acceleration in consumer spending so the data will be closely eyed.
´´Comments from Fed officials have been mixed with Jerome Powell indicating last week that the impact of the recent turmoil in the banking system could be the equivalent of 25bp of tightening,´´ analysts at ANZ Bank said. ´´However other Federal Reserve officials have pointed out that more tightening will be required if inflation risks persist.´´
On Thursday, US data showed that Jobless Claims last week rose more than expected from the week before indicating a cooling labor market, while fourth-quarter Gross Domestic Product growth was slightly lower at 2.6% compared with earlier estimates of 2.7%, both supporting the case for a softer Fed policy.
USD/JPY technical analysis
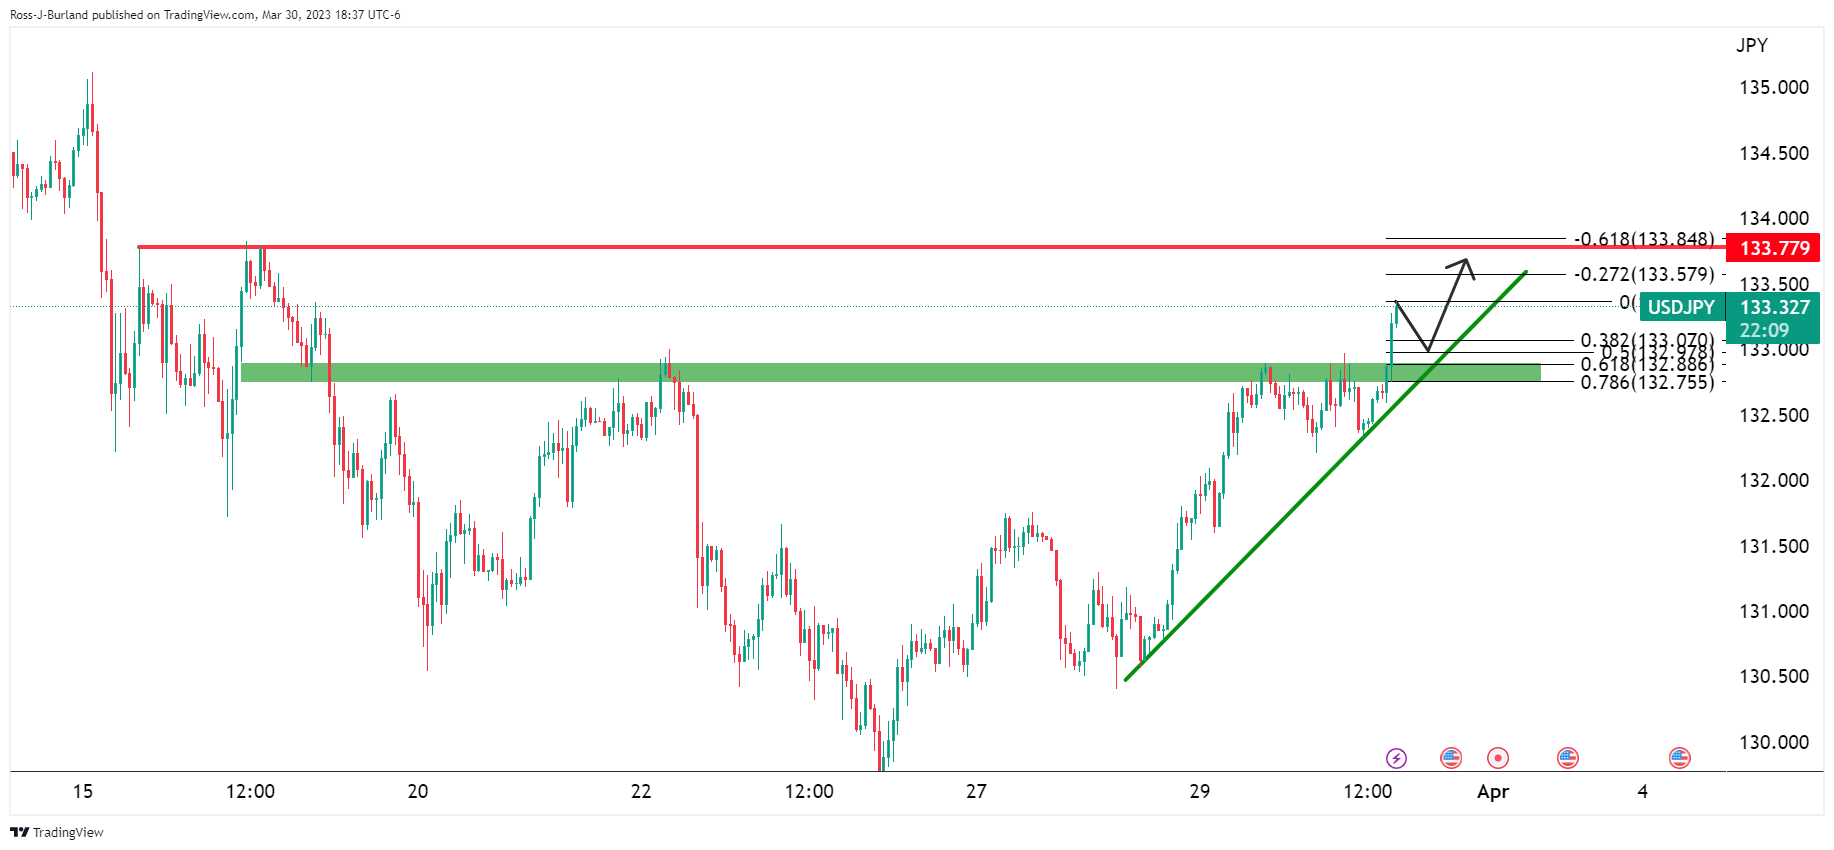
The bulls are in control on the front side of the trend with the 133.78s eyed. As it stands, a 38.2% Fibonacci retracement comes in near 133 the figure which is still on the front side of the trend.
-
01:40
US inflation expectations refresh three-week high ahead of Core PCE Price Index
US inflation expectations, as per the 10-year and 5-year breakeven inflation rates from the St. Louis Federal Reserve (FRED) data, challenge the market’s latest risk-on mood by refreshing the multi-day top.
That said, the 10-year and 5-year breakeven inflation rates from the St. Louis Federal Reserve (FRED) jumped to the highest levels since March 07 and 09 respectively while renewing the multi-day tops with 2.34% and 2.40% figures by the end of Thursday’s North American session.
The same joins the recent hawkish rhetoric from the Federal Reserve (Fed) to raise fears of a positive surprise from the Fed’s preferred inflation gauge, namely the US Core Personal Consumption Expenditure (PCE) Price Index for February.
Although the inflation figure is likely to remain unchanged at 4.7% YoY, the monthly figure is expected to ease to 0.4%, from 0.6% prior.
Hence, there prevails a discord between the market forecasts for the inflation data and the inflation expectations per the FRED, making it interesting for US Dollar traders to watch today’s economics closely.
Also read: US Dollar Index slides towards 102.00 despite hawkish Fed talks, focus on inflation
-
01:40
Australia Private Sector Credit (YoY) down to 7.6% in February from previous 8%
-
01:30
Australia Private Sector Credit (MoM) meets forecasts (0.3%) in February
-
01:27
EUR/USD Price Analysis: Bulls seek validation from 1.0930 as key inflation data looms
- EUR/USD seesaws around weekly high after rising the most in one-week the previous day.
- Upbeat sentiment, softer yields supersede hawkish Fed talks to propel the Euro pair.
- 10-week-old horizontal resistance area can challenge bulls are RSI turns overbought.
- Sellers need 50-SMA breakdown to retake control; January’s top can lure bulls past 1.0930 hurdle.
EUR/USD depicts the market’s pre-inflation anxiety while making rounds to 1.0900, after refreshing a one-week high, during early Friday. In doing so, the Euro pair portrays another battle with the key horizontal resistance established on January 23.
Given the overbought RSI (14) and the Euro pair’s repeated failures to cross the 1.0930-35 horizontal resistance area, the pair buyers are likely to witness one more disappointment should the Eurozone inflation data ease and/or US Core PCE Price Index softens.
Also read: EUR/USD Forecast: Positive signs for the Euro ahead of more inflation data
In a case where the EUR/USD bulls ignore the RSI (14) conditions, backed by fundamental support, and cross the 1.0935 hurdle, the odds of witnessing a rally towards the yearly top marked in January near 1.1035 can’t be ruled out.
Meanwhile, a two-week-old ascending support line, close to 1.0850 at the latest, restricts the short-term EUR/USD downside.
Following that, the 50-SMA level surrounding 1.0820 and the mid-March high near 1.0750 can act as the last defenses of the EUR/USD buyers, a break of which could quickly drag the quote towards the monthly low of near 1.0515.
Overall, the EUR/USD pair remains on the bull’s radar unless breaking the 1.0750 level but the limited upside room highlights today’s inflation numbers as the key catalysts.
EUR/USD: Daily chart
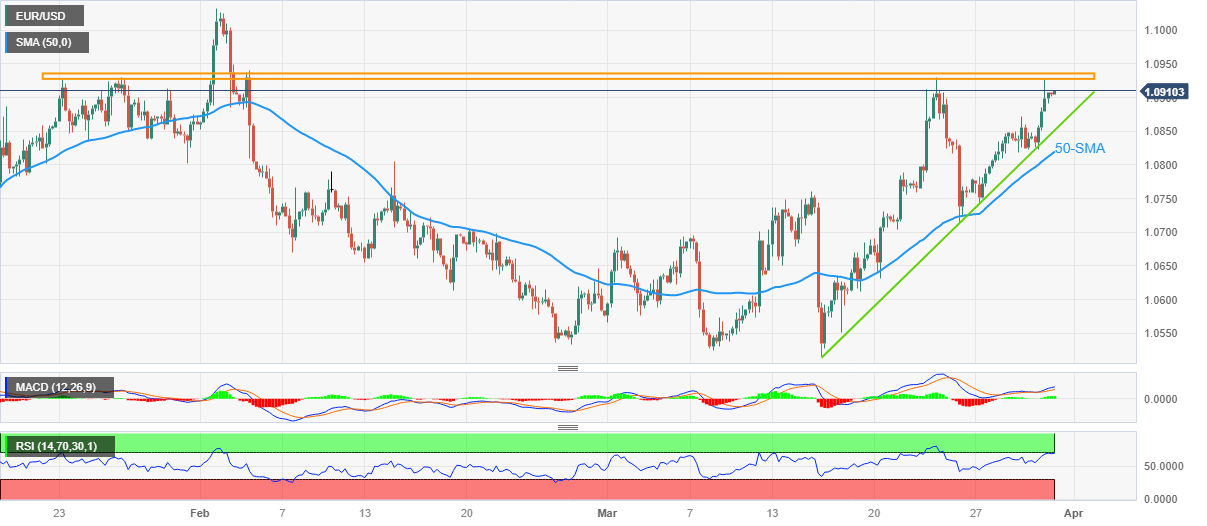
Trend: Limited upside expected
-
01:23
EUR/GBP juggles above 0.8800 ahead of Eurozone Inflation and UK GDP data
- EUR/GBP is oscillating above 0.8800 as investors await Eurozone HICP and UK GDP for fresh impetus.
- Eurozone headline inflation to soften due to lower energy prices while the core figure could elevate.
- The street is split about BoE’s monetary policy outlook as more rate hikes would deepen recession fears.
The EUR/GBP pair is delivering a lackluster performance as investors have sidelined ahead of the release of the Eurozone Harmonized Index of Consumer Prices (HICP) and the United Kingdom’s Gross Domestic Product (GDP) data.
The release of the German HICP data on Thursday indicates that headline figures could soften dramatically as energy prices have dropped firmly. However, a shortage of labor and eventually shifting of bargaining power in hands of job seekers would keep core figures firmer. Reuters reported that due to a shortage of job seekers and wage growth is now between 5% and 6%, the highest in decades. This might force the European Central Bank (ECB) to continue to hike rates further in order to achieve price stability.
According to the consensus, Eurozone’s preliminary headline HICP (March) would soften to 7.1% from the former release of 8.5%. Contrary to that, core HICP is expected to escalate to 5.7% vs. the prior release of 5.6%.
Apart from that, German Retail Sales (Feb) data will be keenly watched. Monthly retail demand is expected to expand by 0.5% against a contraction of 0.3%. An expansion in retail demand might bolster the chances of more rate hike announcements from ECB President Christine Lagarde.
On the UK front, investors are awaiting the GDP (Q4) data. As per the consensus, UK’s growth has remained stagnant in the fourth quarter of CY2022. Annual GDP is expected to remain steady at 0.4%.
Meanwhile, UK inflation is expected to remain elevated as shop price inflation is accelerating led by high food inflation. The street is split about the Bank of England’s (BoE) monetary policy outlook as investors are worried that more rate hikes would deepen recession fears or inflation would remain elevated if the policy remained unchanged.
-
01:15
Currencies. Daily history for Thursday, March 30, 2023
Pare Closed Change, % AUDUSD 0.67115 0.41 EURJPY 144.692 0.53 EURUSD 1.09053 0.57 GBPJPY 164.371 0.56 GBPUSD 1.23869 0.59 NZDUSD 0.62615 0.64 USDCAD 1.3521 -0.28 USDCHF 0.91301 -0.58 USDJPY 132.686 -0.03 -
01:05
GBP/JPY renews one-month high below 165.00 despite upbeat Japan inflation, sluggish yields
- GBP/JPY picks up bids to refresh one-month high during three-day winning streak.
- March Inflation data from Japan came in better than expected but eased from prior levels.
- Yields portray market’s cautious mood ahead of top-tier inflation numbers from the US, UK.
- Final readings of UK Q4 GDP, risk catalysts are important for fresh impulse.
GBP/JPY bulls attack the previous monthly high, picking up bids around 164.80 to refresh the multi-day top, even as Japan inflation numbers crossed the downbeat expectations during early Friday. It’s worth noting that upbeat sentiment could be held responsible for the cross-currency pair’s latest run-up although the yields remain sluggish.
Tokyo Consumer Price Index (CPI) rose to 3.3% in March versus 2.7% expected but eased from 3.4% prior while the Tokyo CPI ex Food, Energy jumped to 3.4% compared to 3.2% previous readings and 3.3% market consensus. Further, Japan’s Industrial Production growth rallied to 4.5% MoM in February compared to 2.7% estimations and -5.3% prior while Retail Trade also improved during the stated month to 6.6% from 5.0% prior and 5.8% analysts’ forecasts. On the contrary, a surprise jump in Japan’s Unemployment rate, from 2.4% to 2.6% in February, can be cited for the Japanese Yen’s (JPY) latest weakness.
On the other hand, UK Prime Minister Rishi Sunak hails a a £1.8billion Brexit boost as Britain signed up to the giant Trans-Pacific Partnership, per The Sun. The news also mentioned, “The deal, which follows two years of talks, opens the door to free trade with 11 nations including Japan, Australia, Mexico, Malaysia and Singapore.”
Above all, Bank of Japan (BoJ) policymakers’ defense of the easy money status contrasts with the hawkish rhetoric among the Bank of England (BoE) officials to propel the GBP/JPY prices. On the same line could be the recently easing market fears from the banking turmoil and hopes of less severe rate hikes from the key central banks.
Amid these plays, the US 10-year Treasury bond yields remain pressured near 3.55% while the two-year counterpart grinds higher around 4.12%, targeting the first weekly gain in four. Further, Wall Street closed positive for the third consecutive day whereas S&P 500 Futures also print mild gains at the latest.
Looking ahead, the final reading of the UK’s fourth quarter (Q4) Gross Domestic Product (GDP) will be important to watch for the intraday move. However, major attention should be given to the headlines surrounding the inflation data from Eurozone and the US, as well as the central bankers’ reaction to the same.
Technical analysis
A downward-sloping resistance line from December 13, 2022, near 164.80 by the press time, challenges immediate GBP/JPY upside.
-
01:03
Japan Large Retailer Sales registered at 4.7% above expectations (3.6%) in February
-
00:54
Japan Retail Trade s.a (MoM) above forecasts (-0.3%) in February: Actual (1.4%)
-
00:51
Japan Industrial Production (YoY) came in at -0.6%, above forecasts (-2.5%) in February
-
00:51
Japan Industrial Production (MoM) registered at 4.5% above expectations (2.7%) in February
-
00:50
Japan Retail Trade (YoY) above forecasts (5.8%) in February: Actual (6.6%)
-
00:46
Silver Price Analysis: XAG/USD approaches $24.00 as USD Index suffers losses ahead of US PCE Price Index
- Silver price is aiming to recapture the immediate resistance of $24.00 amid a positive market mood.
- The white metal is in a positive trajectory despite receding fears of potential United States banking turmoil.
- Silver price is auctioning in a Rising Wedge chart pattern that indicates a continuation of upside momentum.
Silver price (XAG/USD) is marching towards the round-level resistance of $24.00 with an immense pace in the early Asian session. The white metal has registered a three-day winning streak and is expected to continue its upside momentum amid weakness in the US Dollar Index (DXY).
Silver price is in a positive trajectory despite receding fears of potential United States banking turmoil. Earlier, investors underpinned bullions as a safe-haven to dodge volatility-inspired by the collapse of three mid-size US banks.
The USD index is struggling to gain strength despite rising chances of more rate hikes by the Federal Reserve (Fed). One school of thought believes that Fed chair Jerome Powell could go for hiking rates further as US banking jitters are cooling-off. Also, Fed Powell has anticipated one more rate hike in 2023. And that a rate hike in Fed’s May policy meeting would allow it to keep rates higher for a longer period.
Meanwhile, S&P500 futures have added more gains in the Asian session after a positive settlement on Thursday, indicating sheer improvement in the risk-taking ability of the market participants.
Going forward, Fed’s preferred inflation tool, the US core Personal Consumption Expenditure (PCE) Price Index data will remain in the spotlight. Analysts at Credit Suisse expect “Monthly reading to just round down to 0.3%, leaving YoY core inflation unchanged at 4.7%. Monthly headline inflation should be similar to the core, but the YoY measure should drop to 5.1% owing to an easy base effect.”
Silver technical analysis
Silver price is auctioning in a Rising Wedge chart pattern that indicates a continuation of upside momentum and every pullback is considered as a buying opportunity for the market participants. The white metal is approaching the horizontal resistance plotted from February 02 high at $24.64. The 20-period Exponential Moving Average (EMA) at $23.14 is providing a cushion to the Silver price.
The Relative Strength Index (RSI) (14) is oscillating in the bullish range of 60.00-80.00, which indicates more upside ahead.
Silver four-hour chart
-638158166679003020.png)
-
00:37
Gold Price Forecast: XAU/USD inks Bullish Pennant as yields drag ahead of Eurozone, United States inflation
- Gold price seesaws inside two-week-old bullish chart pattern, sluggish of late.
- Easing fears of banking crisis, downbeat US Dollar favor Gold buyers.
- Hopes of upbeat core inflation data from Eurozone, United States join strain in China-US ties to prod XAU/USD bulls.
Gold price (XAU/USD) grinds higher within a two-week-old bullish chart pattern, making rounds to $1,980 during Friday’s Asian session. In doing so, the XAU/USD reverses the previous weekly loss ahead of the key inflation data from the United States and Eurozone. It’s worth noting that the risk-on mood joins the market’s lack of conviction in the Federal Reserve’s (Fed) further rate hikes to propel the Gold price.
Gold price grinds higher as US Dollar softens
Gold price cheers downbeat US Dollar performance to brace for the weekly gains even as the hawkish Federal Reserve (Fed) concerns and mostly upbeat US data challenge the XAU/USD buyers. The reason for the XAU/USD run-up could also be linked to the quarter-end positioning of the US Dollar Index (DXY). That said, the DXY prints a three-week downtrend, so far, as the greenback bears poke 102.15 level.
Easing of bank turmoil fears, sluggish yields add strength to XAU/USD
It should be noted that Federal Reserve Chairman Jerome Powell joins three other Fed Officials to back further rate hikes on Thursday, citing the need to tame the inflation woes. However, mixed US data raise doubts about the Fed policymakers’ hawkish rhetoric and allowed the Gold price to remain firmer, via sluggish yields and banking hopes.
"Inflation remains too high, and recent indicators reinforce my view that there is more work to do to bring inflation down to the 2% target associated with price stability," Federal Reserve Bank of Boston leader Susan Collins said in remarks to a gathering of the National Association for Business Economics per Reuters.
Following her was Minneapolis Fed President Neel Kashkari who said, “We have to bring down inflation.”
On the same line was Richmond Fed President Thomas Barkin saying that if inflation persists, we can react by raising rates further.
Not only the rate concerns but the hopes of a secured banking system also favored the sentiment and exerted downside pressure on the DXY, especially amid mixed US data. That said, final readings of the US fourth quarter (Q4) Gross Domestic Product (GDP), also known as the Real GDP, marked an easy Annualized growth number of 2.6% versus 2.7% previous forecasts. It’s worth noting that the Q4 Personal Consumption Expenditure (PCE) Prices matched 3.7% QoQ forecasts and prior while the Core PCE figure grew to 4.4% QoQ versus 4.3% expected and prior. Moving on, the Weekly Initial Jobless Claims rose to 198K for the week ended on March 25 versus 191K prior and 196K market forecasts.
Furthermore, US Treasury Secretary Janet Yellen said on Thursday, “Banking system is sound, even as it has come under pressure,” which in turn pushed back banking sector woes.
It’s worth observing that the mixed data and risk-on mod fail to underpin the US 10-year Treasury bond yields as they remain pressured near 3.55% while the two-year counterpart grinds higher around 4.12%, targeting the first weekly gain in four.
Hence, sluggish yields join the market’s mixed data and mostly positive sentiment to allow the Gold price to stay firmer. While portraying the mood, Wall Street closed positive for the third consecutive day.
China woes weigh on Gold price
Although the upbeat sentiment and softer US Dollar allow the Gold price to remain firmer, fears emanating from China, one of the world’s biggest Gold consumers, prod the XAU/USD bulls. That said, fears emanating from China, Russia and North Korea allow the Gold buyers to take a breather. China's Taiwan Affairs Office threatened retaliation over Taiwan President Tsai Ing-wen's visit to the US on Wednesday. Additionally, China's Premier Li Qiang recently said that the economic situation in March is even better than in January and February. The policymaker, however, also raised geopolitical tension by opposing trade protectionism and decoupling, which indirectly targets the US.
Inflation is the key as central bankers remain hawkish
While the Gold price portrays the market’s indecision, despite recent action, fears of higher inflation in the United States and Eurozone join the hawkish central bank comments to challenge the XAU/USD buyers. As a result, today’s Eurozone Harmonised Index of Consumer Prices (HICP) for March and the United States Core Personal Consumption Expenditure (PCE) Price Index for February will be closely watched for clear directions.
That said, the EU HICP is expected to ease to 7.1% YoY from 8.5% prior but the Core HICP could print annualized growth of 5.7% versus 5.6% previous readings. With this, the Gold price may witness selling pressure if inflation figures suggest no easing either on the headline or on the core basis.
Also read: Euro area HICP Preview: Peak inflation or base effects? No trade-off for ECB (for now)
On the other hand, the Fed’s preferred inflation gauge, namely the US Core PCE Price Index, is likely to remain unchanged at 4.7% YoY during February. Though, the monthly figure is expected to ease to 0.4%, from 0.6% prior, and can lure the Gold sellers in case of rising past estimations and previous readings.
Also read: US February PCE Inflation Preview: Bad news for the Dollar, good news for the Fed?
Gold price technical analysis
Gold price portrays a Bullish Pennant chart pattern on the daily formation, currently between $1,958 and $1,995. The same suggests the XAU/USD buyer’s preparations for the next leg towards the north.
The upside bias also takes clues from the Moving Average Convergence and Divergence (MACD) indicator’s bullish signal, as well as the firmer Relative Strength Index (RSI) line, placed at 14. It’s worth noting, however, that the RSI line tilts towards the south while the MACD suggests easing bullish bias.
As a result, the Gold buyers need a strong push towards the north to cross the $1,995 hurdle, which in turn favors the metal’s theoretical target surrounding the two-month-old ascending resistance line, around $2,025 by the press time.
On an immediate basis, the 10-DMA level surrounding $1,971 acts as a nearby resistance.
Alternatively, a downside break of $1,958 will defy the bullish chart formation and can quickly direct the Gold sellers toward $1,910, a break of which can push the XAU/USD price to the early February high of near $1,890.
Above all, the Gold price remains firmer unless staying beyond the 100-DMA support of $1,850.
Gold price: Daily chart
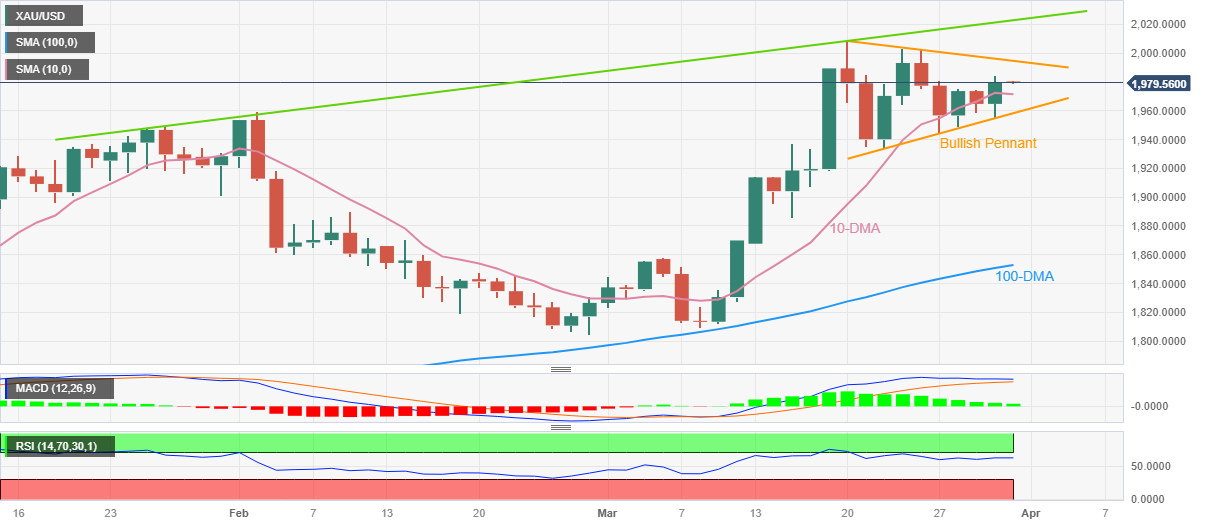
Trend: Further upside expected
-
00:34
USD/JPY Price Analysis: Bears need to make their move or lose control in the 133s
- USD/JPY bulls eye the 133s and the foundations to track down the 135s.
- Bears are in anticipation of supply at this juncture and for deeper correction in the days ahead.
As per the prior analysis, USD/JPY Price Analysis: Bears move in and eye a significant correction towards 131.50, whereby USD/JPY moved into a phase of consolidation below 133.00 the figure, a correction into the W-formation´s neckline was anticipated illustrated as follows:
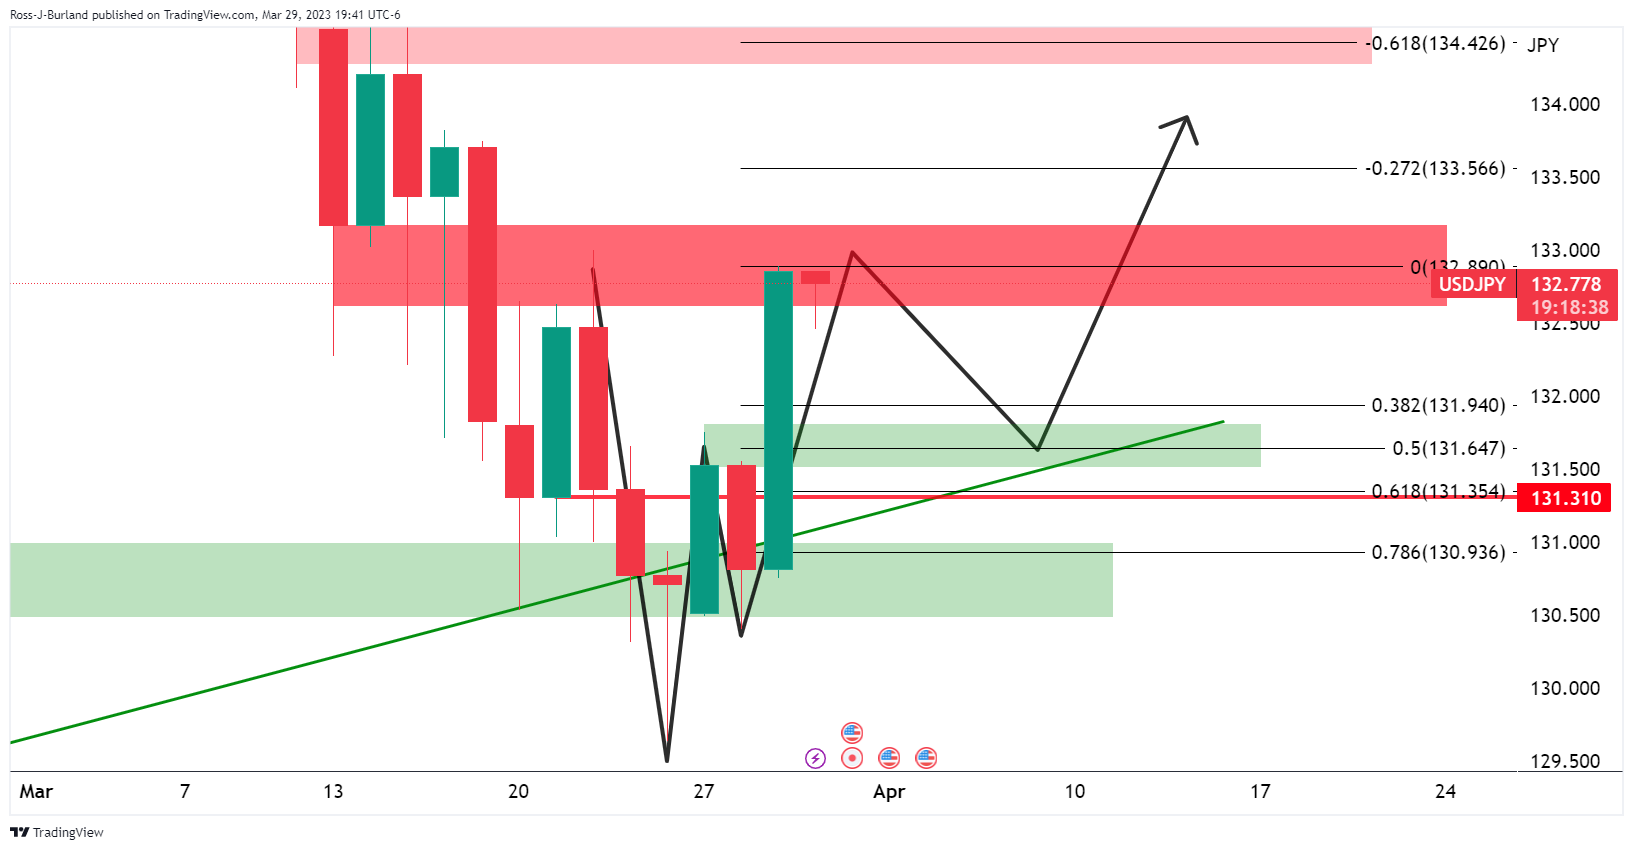
USD/JPY might be expected to return to the midpoint of the W-formation in the coming days where the neckline meets a 50% mean reversion and a 61.8% Fibonacci retracement level near 131.50.
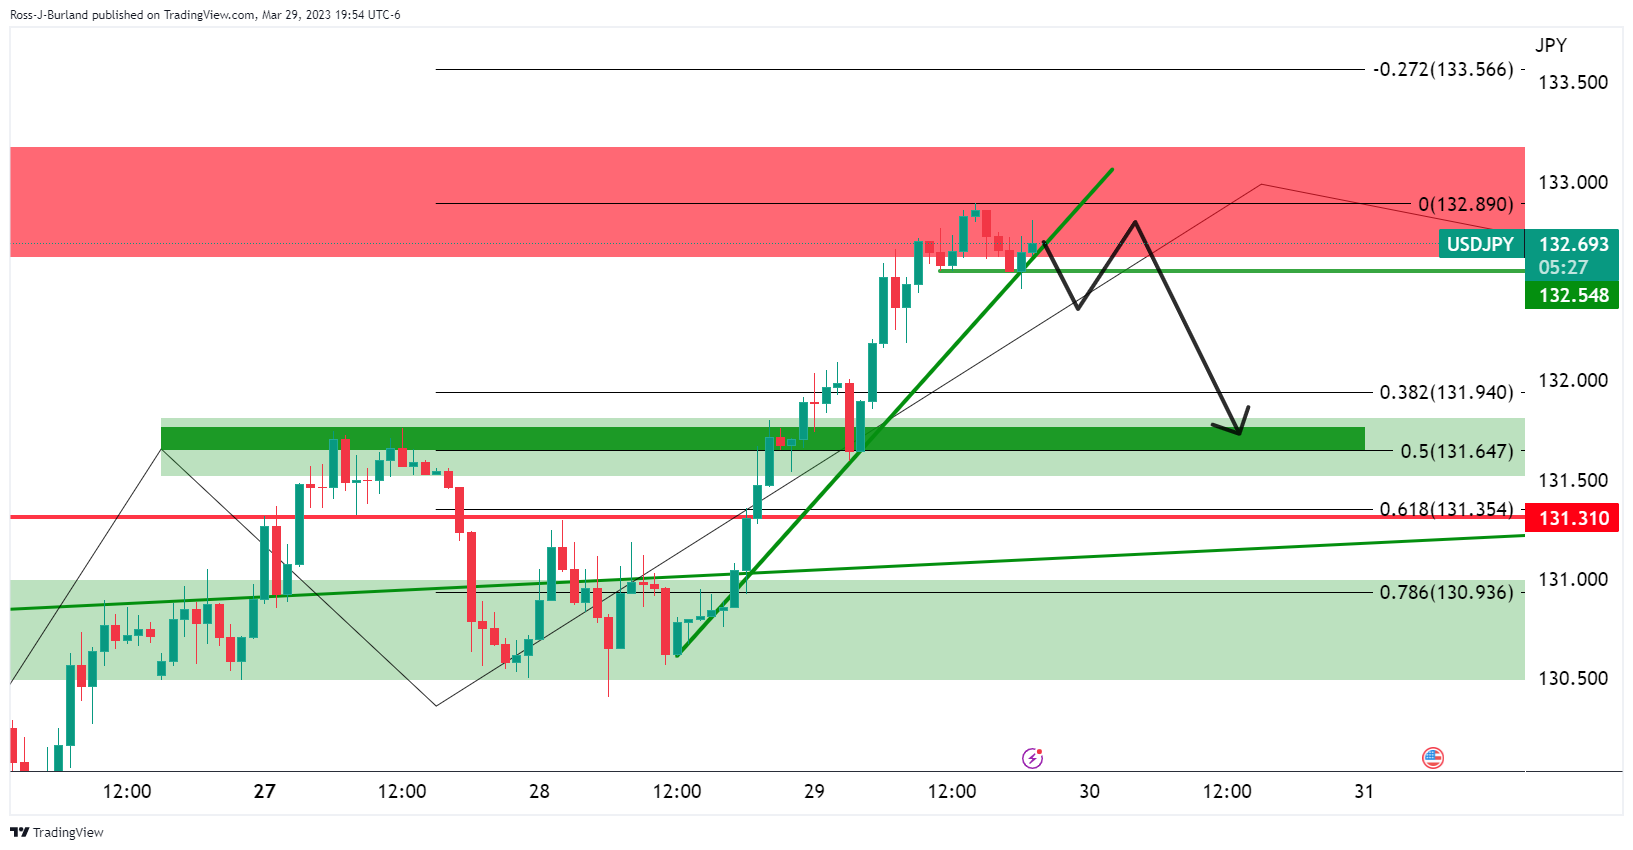
It was explained that the bears needed to get over the 132.50s structure and onto the backside of the hourly micro bullish trend as illustrated above.
USD/JPY update
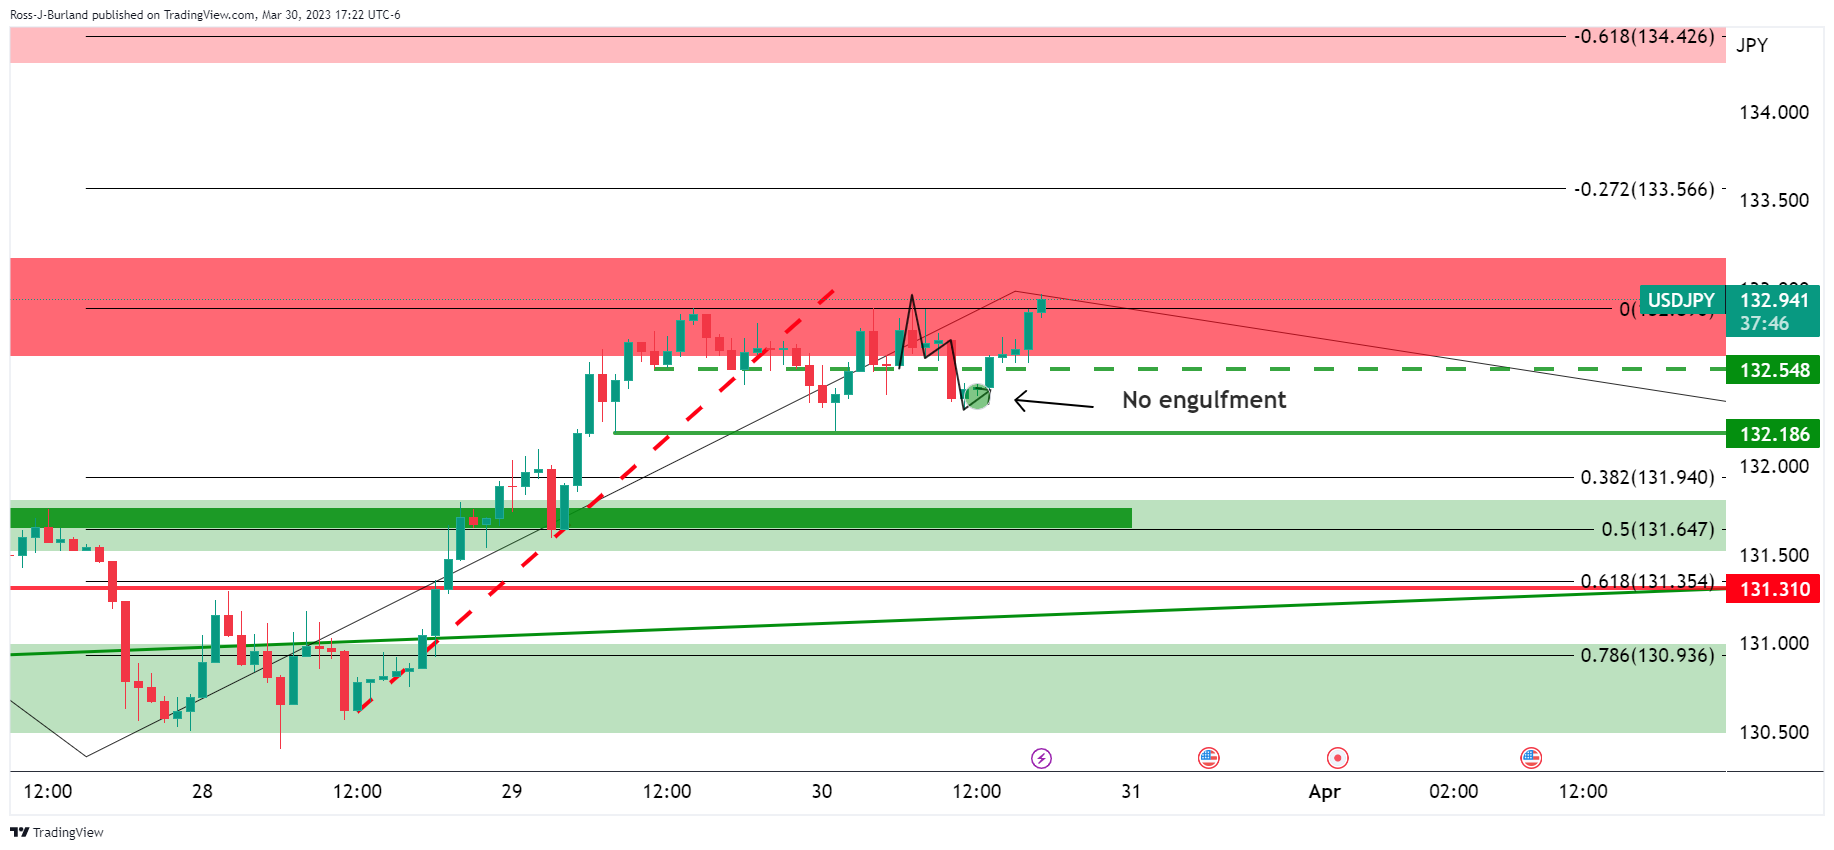
The topping pattern was put into place but there was no bearish engulfment and the price spiked into stops instead.
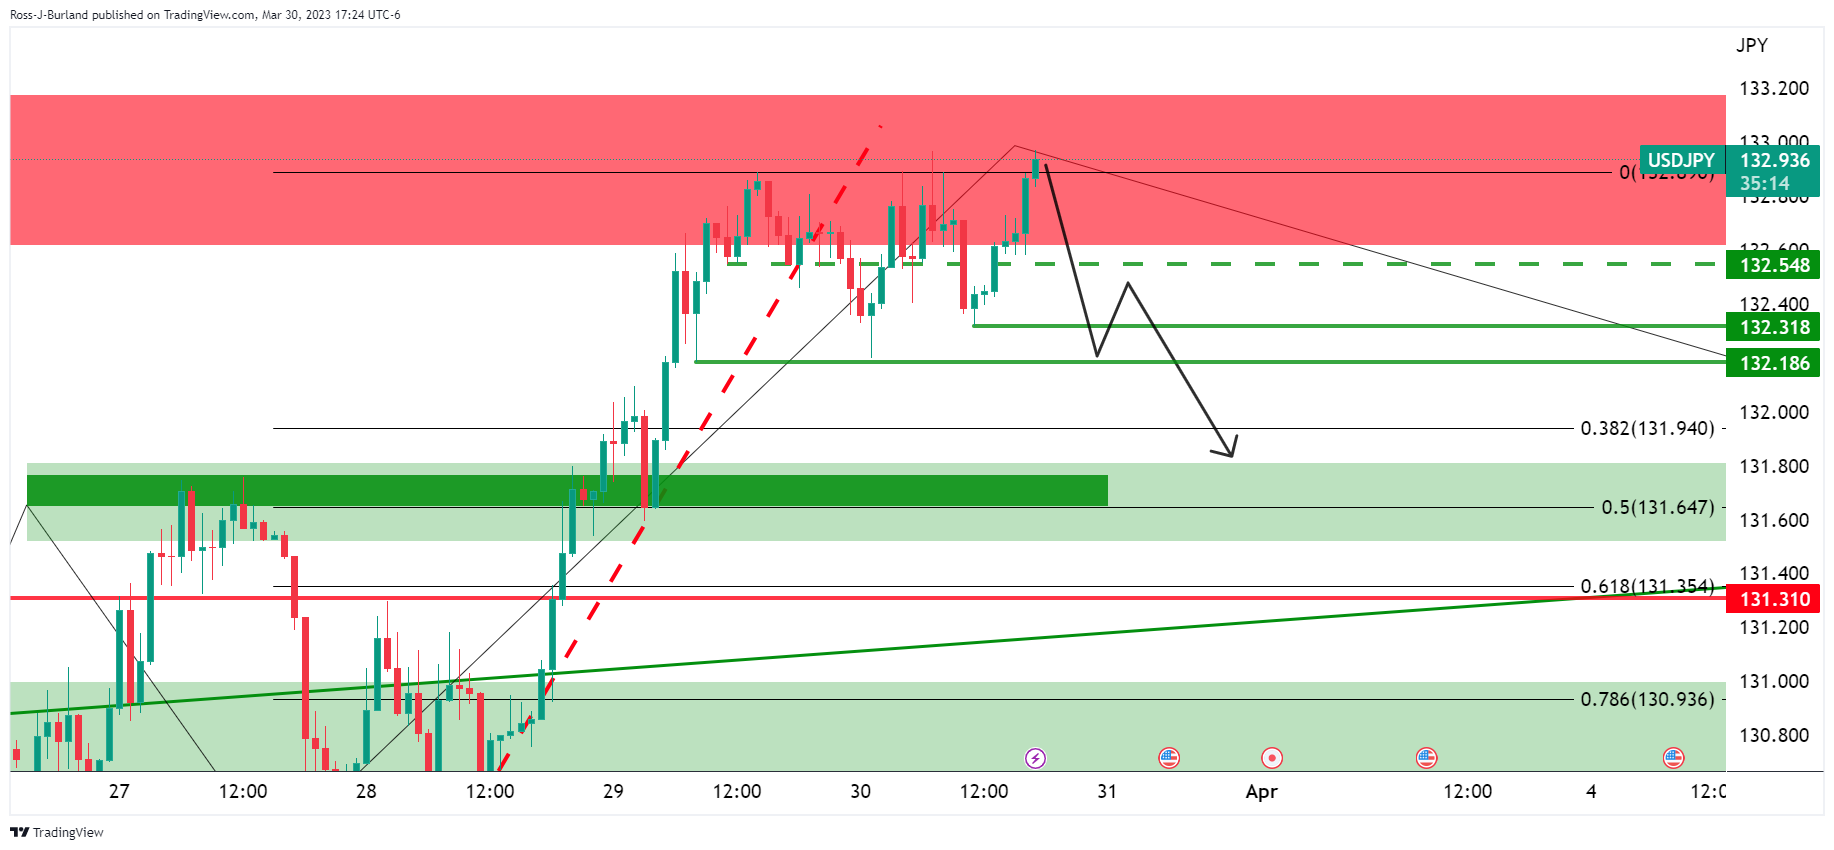
However, that is not to say that the downside bias is invalidated, yet. A move lower to break the structure could be the next significant development as illustrated above. However, should the bulls stay committed in the 133s, then the likelihood of a fuller bearish correction will be diminished as the bulls track down the 135s.
-