Notícias do Mercado
-
23:46
GBP/USD Price Analysis: Retreats towards 1.2400 within bullish channel as US NFP looms
- GBP/USD remains pressured after reversing from 10-month high in the last two consecutive days.
- One-month-old bullish channel, ascending support line from early March prod Cable bears.
- MACD, RSI suggests further consolidation of weekly gains ahead of top-tier US employment data.
- Bulls need validation from 1.2550 to retake control.
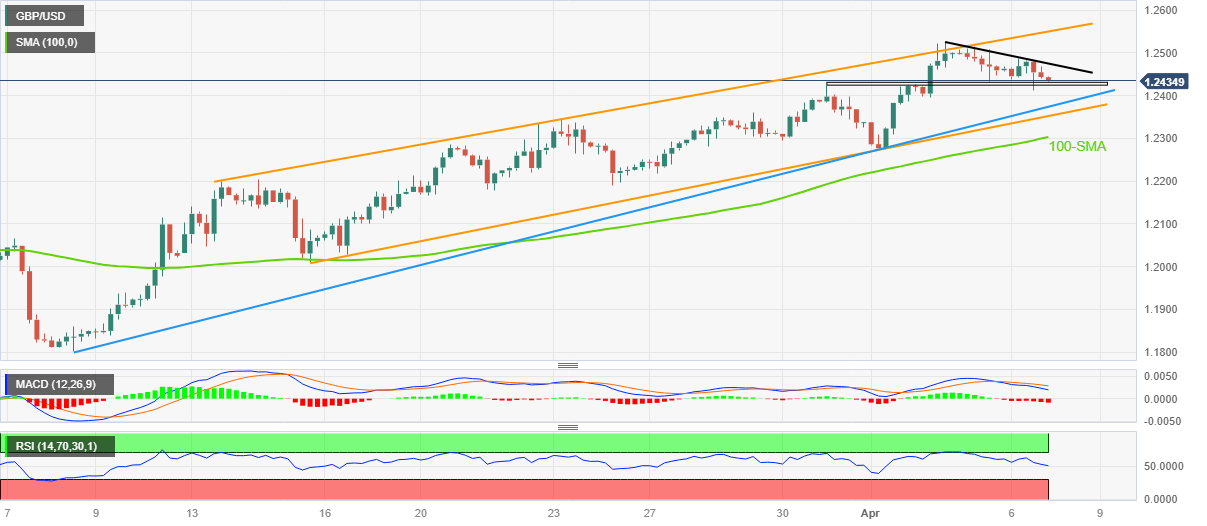
GBP/USD drops to 1.2430 as it extends the two-day downtrend to a sluggish Asian session on Good Friday. In doing so, the Cable pair pares the weekly losses, the fourth consecutive one, while easing from the top line of a one-month-old ascending trend channel.
That said, the GBP/USD pair’s pullback from the short-term key hurdle also gains support from bearish MACD signals and the RSI (14) line’s retreat from the overbought territory, which suggests further declines of the quote.
However, a one-week-old horizontal support area around 1.2430 currently restricts the Cable pair’s immediate downside ahead of an upward-sloping support line from March 08, close to 1.2375.
It’s worth noting, though, that the GBP/USD pair’s weakness past 1.2375 will be tough as the stated channel’s lower line and the 100-SMA, respectively near 1.2350 and 1.2300, could challenge the bears before giving them control.
On the contrary, recovery moves need to cross a downward-sloping resistance line from Tuesday, around 1.2475 by the press time.
Even so, the latest multi-month peak of 1.2525, the highest since June 2022, will precede the aforementioned channel’s top line, around 1.2550, to challenge the GBP/USD buyers.
Should the Cable pair remains firmer past 1.2550, backed by price-positive US Nonfarm Payrolls (NFP), the odds of witnessing a run-up to a May 2022 high of around 1.2665 can’t be ruled out.
Also read: Nonfarm Payrolls Preview: Markets fear depressing data, three scenarios for the US Dollar
GBP/USD: Four-hour chart
Trend: Limited downside expected
-
23:24
Fed Chair 'Powell's curve' plunges to new lows, flashing US recession warning – Reuters
Reuters came out with downbeat signals from the Federal Reserve’s (Fed) research amid the ongoing recession chatters as Asian markets cheer the Good Friday holiday.
“The Federal Reserve’s preferred bond market signal of an upcoming recession has plunged to fresh lows, bolstering the case for those who believe the central bank will soon need to cut rates to revive economic activity,” said the news.
Reuters also adds that research from the Fed has argued that the “near-term forward spread” comparing the forward rate on Treasury bills 18 months from now with the current yield on a three-month Treasury bill was the most reliable bond market signal of an imminent economic contraction.
Additional quotes
That spread, which has been in negative territory since November, plunged to new lows this week, standing at nearly minus 170 basis points on Thursday.
Money market investors, however, on Thursday were largely betting the Fed would have cut rates by about 70 basis points by December, from the current 4.75%-5% range.
‘Powell’s curve ... continues to plunge to fresh century lows,’ Citi rates strategists William O’Donnell and Edward Acton said in a note on Thursday. Refinitiv data showed the curve was the most inverted since at least 2007.
Market reaction
The news allows the US Dollar to benefit from its haven appeal and exert downside pressure on the EUR/USD. However, the holiday mood restricts the pair’s immediate moves despite retreating to 1.0920 during early Friday.
Also read: EUR/USD eyes fourth weekly gains above 1.0900 despite US Dollar’s bounce ahead of US NFP
-
23:15
EUR/USD eyes fourth weekly gains above 1.0900 despite US Dollar’s bounce ahead of US NFP
- EUR/USD grinds higher as traders await the key US employment numbers after a mixed daily performance, retreating of late.
- Upbeat German data contrasts with downbeat US statistics to underpin bullish bias for Euro.
- Recession woes, pre-data anxiety join holiday-driven inaction to prod traders.
- US job numbers are the only game in the town to watch for fresh impulse, volatility expected.
EUR/USD bulls keep the reins around 1.0920, retreating of late, as it portrays the typical Good Friday inaction, as well as anxiety ahead of the US Nonfarm Payrolls (NFP), during the early hours of the day. The major currency pair witnessed a volatile Thursday amid the initial US Dollar rebound on recession woes before ending the day unchanged with downbeat US data contrasting with firmer statistics from the Eurozone.
Consecutive weakness in the US Dollar and downbeat US Treasury bond yields triggered fears of a recession in the world’s largest economy, which in turn allowed the USD bears to take a breather during early Thursday. However, another set of downbeat US jobs report reversed the greenback’s gains afterward as traders brace for the all-important NFP.
That said, US Initial Jobless Claims improved to 228K for the week ended on March 31 versus 200K expected and upwardly revised 246K prior. It’s worth noting that the Challenger Job Cuts for the said month rose to 89.703K from 77.77K prior.
It should be noted that Reuters raised fears of recession by citing the Federal Reserve (Fed) Chairman Jerome Powell’s preferred bond market indicator’s latest slump. “Research from the Fed has argued that the “near-term forward spread” comparing the forward rate on Treasury bills 18 months from now with the current yield on a three-month Treasury bill was the most reliable bond market signal of an imminent economic contraction,” said the news.
On the same line, International Monetary Fund (IMF) Managing Director Kristalina Georgieva said in her prepared remarks on Thursday that they expect the global economy to grow by less than 3% in 2023, down from 3.4% in 2022, per Reuters.
Elsewhere, Germany’s Industrial Production (IP) rose 0.6% YoY in February versus -2.7% market forecasts and -1.6% previous readings. The monthly figures also came in firmer than 0.1% expected, to 2.0% versus 3.7% prior. On Wednesday, Germany Factory Orders improved to -5.7% YoY for February from -12.0 revised down prior and -10.5% market forecasts while the MoM growth came in at 4.8% compared to 0.3% expected and 0.5% previous readings.
Amid these plays, Wall Street and US Treasury bond yields both pare weekly losses but fail to gain major acceptance from bulls.
Moving on, off in the major markets can keep the EUR/USD inactive and vulnerable to sharp moves amid less liquidity on the scheduled US employment numbers for March. It’s worth mentioning that the recently dovish Fed bets and downbeat US data give rise to hopes of a positive surprise and huge volatility in prices afterward.
Also read: Nonfarm Payrolls Preview: Markets fear depressing data, three scenarios for the US Dollar
Technical analysis
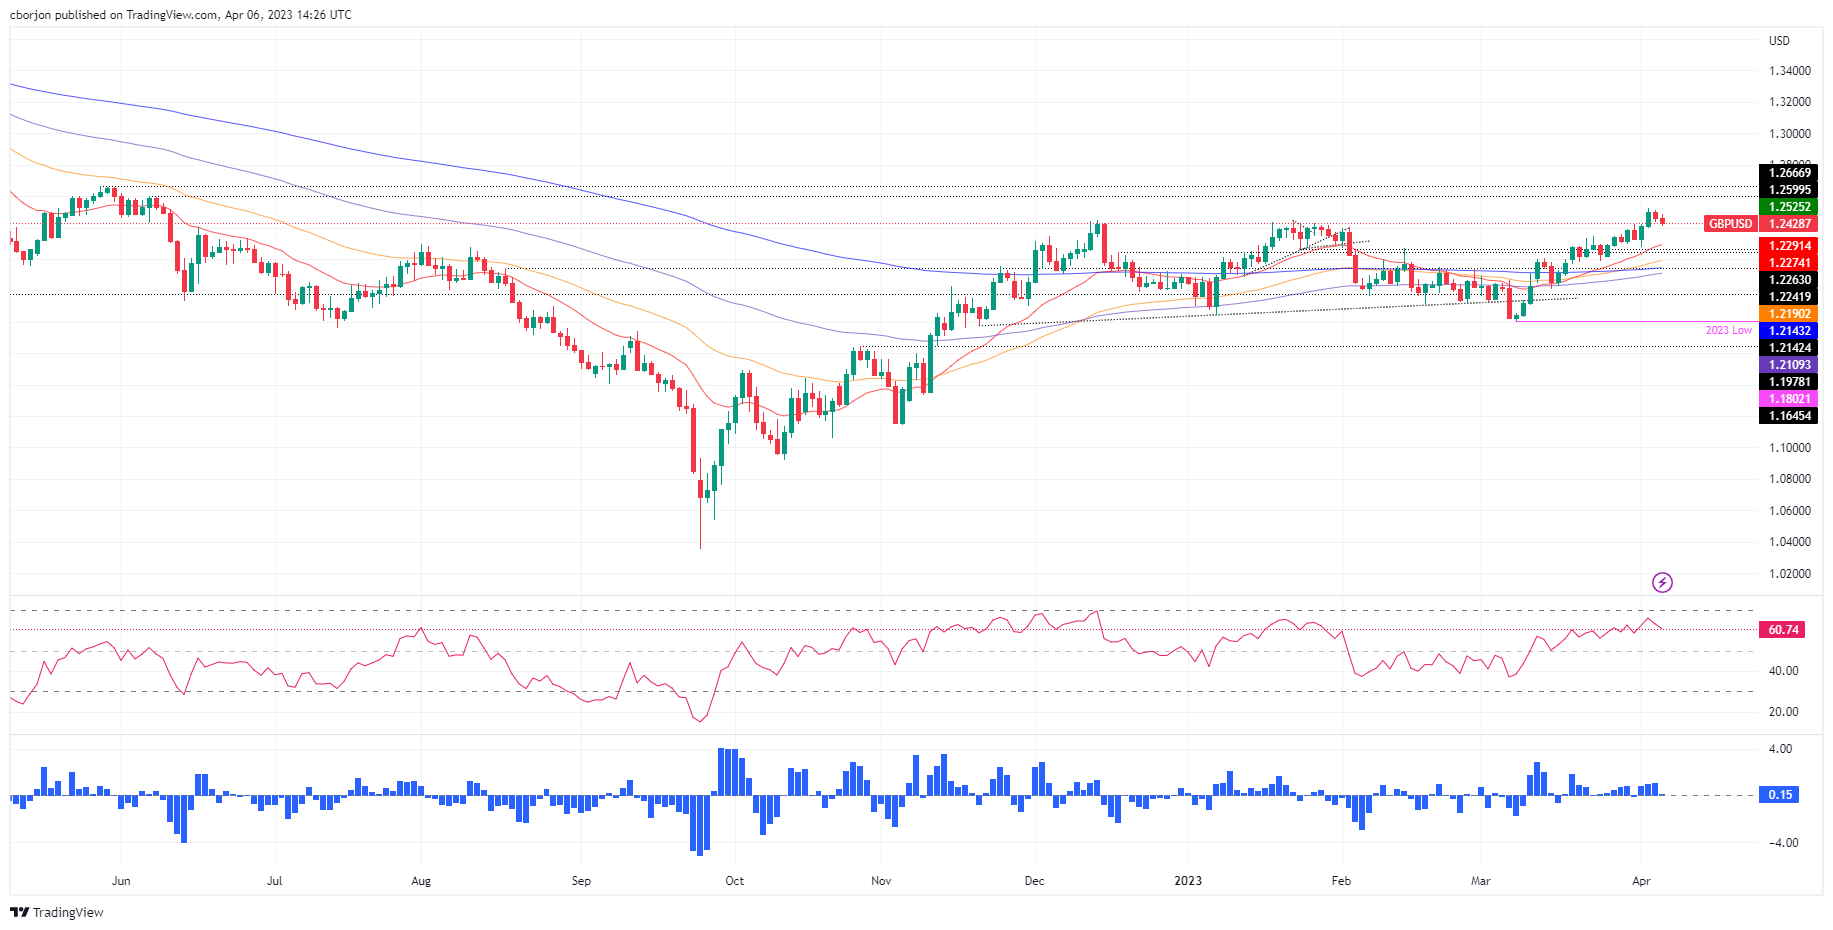
EUR/USD’s sustained trading beyond the 10-DMA, around 1.0880 by the press time, joins the gradually rising RSI (14) to favor bulls in aiming for the Year-To-Date high of 1.1033.
-
22:47
USD/MXN falls as a late boost in risk sentiment supports the Mexican Peso
- The Mexican Peso trimmed some of its weekly losses after depreciating to 18.40 weekly.
- US job data sparks recession fears as Initial Jobless Claims rise to 228K.
- US Nonfarm Payrolls are expected to decelerate from February’s 311K to 240K.
The Mexican Peso (MXN) snapped three days of consecutive losses and advances against the US Dollar (USD) due to a late improvement in risk sentiment. Therefore, the USD/MXN dropped from around the 20-day Exponential Moving Average (EMA) and trades at around 18.2285, down 0.04%.
Wall Street finished the week with gains. The latest round of jobs data revealed in the United States (US) economic calendar increased the likelihood of a recession. The Initial Jobless Claims for the last week rose by 228K, crushed estimates of 200K, but trailed the previous week’s data, which was revised to 246K. Continuing claims, which smooths week-to-week changes, were little changed at 1.82 in the week ending March 25.
From the start of the week, the US PMI’s employment index has indicated that job creation is slowing down. This was confirmed by the US JOLTs Opening report, which demonstrated a decrease in job openings. As a result, there is now increased speculation that the Federal Reserve may halt its tightening cycle.
The St. Louis Fed President James Bullard said the first quarter was stronger than expected. Additionally, Bullard said inflation would be “sticky going forward” and that the Fed “needs to stay at it” to get inflation back to its 2% target.
Meanwhile, the US Dollar Index, a measure of the buck’s value vs. a basket of six currencies, edged higher towards the end of the New York session, up 0.31%, at 101.905, but failed to bolster the USD/MXN.
On the Mexican front, speculations that the Bank of Mexico (Banxico) might end its tightening cycle depreciated the MXN by 1.2% in the week. BofA Global Research strategists wrote, “Banxico dropped the hiking bias at its most recent policy decision and said that future movements would depend on the inflation outlook, which is now improving.”
“Banxico dropped the hiking bias at its most recent policy decision and said that future movements would depend on the inflation outlook, which is now improving,” BofA Global Research strategists wrote in a note.
“Banxico will likely cut when the US Fed cuts, but not before, and not more than the Fed,” BofA strategists said.
What to watch?
On Friday, the US economic docket would release the US Nonfarm Payrolls report for March, is expected to decelerate to 240K after February’s astonishing 311K. The Unemployment Rate is estimated to stay steady at 3.6%, while Average Hourly Earnings are declining to 4.3% YoY, vs. 4.6% in February.
USD/MXN Technical Levels
-
22:16
USD/INR to hover around 82.25 through the end of the second quarter – Wells Fargo
On Thursday, the Reserve Bank of India (RBI) kept its key interest rate on hold, against expectations of a 25 basis points rate hike. Analysts at Wells Fargo see the RBI on hold for the next months. They expect the Indian Rupee to underperform among emerging market currencies.
Key Quotes:
“The Reserve Bank of India (RBI) opted for a hawkish hold at its April meeting; however, mixed signals complicate the outlook for Indian monetary policy. We now believe the RBI will be on hold through Q3-2023, but is still on track to initiate an easing cycle in Q4 of this year.”
“With the RBI on hold and the Fed likely to deliver another 25 bps hike in May, expect the rupee to continue moving sideways in the short-term.”
“Over the longer-term, an aggressive Fed easing cycle and broad-based U.S. dollar depreciation should lead to rupee strength; however, we expect INR to underperform across the emerging market currency complex. On the other hand, we believe India's economy will be one of the important drivers of global activity and be responsible for an outsized contribution to global economic growth this year.”
“We forecast the USD/INR exchange rate to hover near INR82.25 through the end of the second quarter.”
-
22:09
Bank of Canada: Staying on the sidelines looks like an easy decision – RBC
Next week, the Bank of Canada will have its monetary policy meeting. Market participants see the central bank keeping rates unchanged. Analysts at RBC point out the central bank will likely stay on hold despite the fact that economic growth have been more resilient than expected.
Bank of Canada to stay on the sidelines
“The central bank is widely expected to make a second consecutive decision to hold. This is despite economic growth that’s been more resilient than expected so far this year.”
“So why hold interest rates again when the economy is still running hot? The BoC’s pause on rate hiking was driven by an expectation that growth would stall through mid-2023, and Governor Macklem said it would take an “accumulation of evidence” to the contrary for it to resume tightening.”
“Cooler inflation readings have been encouraging—particularly since the softening has come even before the full effect of higher interest rates hits household purchasing power. And the recent round of financial instability is a reminder that aggressive interest rate increases over the last year could yet have unexpected consequences.”
“Inflation (and the broader economy) are still running too hot for the BoC to actively consider cutting interest rates but staying on the sidelines for now looks like an easy decision to make.”
-
21:40
Forex Today: NFP is the only game in town
The US official employment report will be released on Friday, with markets closed around the world for Easter. Nonfarm Payrolls are seen rising by 240,000 in March. Trading volume will likely be light, with volatility spikes around the release of the NFP. Before and afterwards, not much action is expected.
Here is what you need to know on Friday, April 7:
Holidays and an empty economic calendar in Asia warrant limited price action ahead. Later, a crucial economic report amid thin trading conditions will set the environment for erratic moves in the FX board, including wide spreads.
The Euro was the best G10 performer on Thursday. Germany offered another strong report, with February’s Industrial Production rising by 2%. EUR/USD climbed above 1.0900, and its outlook is neutral to positive.
Data from the US showed a decline in Initial Jobless Claims to 228,000 after sharp negative revisions that point to a looser labor market.
The labor market is starting to look not so tight according to data released this week, but the NFP will have the final word. Payrolls are expected to rise 240,000 and the Unemployment rate to stay at 3.6%. Earnings will also be watched closely. A negative report could increase the bets of no more rate hikes from the Federal Reserve.
USD/JPY ended a three-day negative streak, moving away from a dangerous area toward 132.00, helped by the slight rebound in Treasury yields. Bank of Japan’s Haruhiko Kuroda governorship ends on Saturday.
USD/CAD rose modestly on Thursday, but the Loonie outperformed AUD and NZD following Canadian employment data. The economy added 35,000 jobs in March, surpassing expectations. Next week, the Bank of Canada is seen staying on hold. USD/CAD held below 1.3500.
AUD/USD fell for a third consecutive day, posting the lowest daily close in a week around 0.6670. The Kiwi fell across the board as NZD/USD suffered the biggest slide in weeks to end below 0.6250.
The Mexican Peso outperformed among emerging market currencies, with USD/MXN falling 0.25% to 18.25. The Reserve Bank of India unexpectedly kept interest rates unchanged at 6.5%. USD/INR closed at 81.80, the weakest level in a month.
Gold retreated further but remained above $2,000, while Silver moved sideways below $25.00. Crude Oil prices continued to consolidate, holding on to an 8% weekly gain.
Like this article? Help us with some feedback by answering this survey:
Rate this content -
21:29
AUD/USD drops for three straight days as Wall Street gains offset by risk aversion
- The US labor market eases, as Initial Jobless Claims for April 1 rise to 228K, exceeding estimates of 200K
- St. Louis Fed President Bullard notes stronger than expected Q1 data while warning of “sticky” inflation.
- US Nonfarm Payrolls are expected at 240K, while the Unemployment Rate is foreseen at 3.6%.
The AUD/USD extends its losses to three consecutive days, as Wall Street is set to finish the week with gains, except for the Dow Jones, losing 0.02%. In the FX space, risk aversion was the main driver of the session, weakening high beta currencies, like the Australian Dollar (AUD), which tumbled 0.74% vs. the buck. At the time of writing, the AUD/USD is trading at 0.6671.
AUD/USD falls below 0.6700, weighed by the risk-off sentiment in the FX market
On Thursday, the North American session was characterized by fluctuating sentiment, though US equity bulls lifted the S&P 500 and the Nasdaq. The US economic docket features Initial Jobless Claims for April 1, which jumped to 228K, above estimates of 200K, but trailed the prior’s week, which was upward revised to 246K.
Since the beginning of the week, the employment index of the US PMIs has shown signs that hiring is decelerating. That was confirmed by the US JOLTs Opening report, which showed that vacancies shifted downwards. Therefore, growing speculations for a Federal Reserve’s (Fed) pause on its tightening cycle increased.
On Wednesday, the ADP Employment Change report for March showed that companies hired fewer employees than expected. Given the backdrop, the latest US labor market data has sparked worries that an upcoming US recession is around the corner.
Hence, the AUD/USD began Thursday’s session at around 0.6730s, the day’s high. Nevertheless, it resumed its downtrend, as the release of the US Nonfarm Payrolls report and the Good Friday holiday motivated traders to book profits.
OF late, the St. Louis Federal Reserve President James Bullard commented that Q1’s incoming data is more robust than expected, adding that financial conditions are less tighter than the 2007-2009 crisis. Bullard said inflation would be “sticky going forward” and that the Fed “needs to stay at it” to get inflation back to its 2% target.
An absent Australian economic docket will leave traders focused on the release of the US Nonfarm Payrolls. The US Bureau of Labor Statistics (BLS) will release the report on April 7 at 12:30 GMT. Most banks expect the US economy to add 240K jobs after a February increase of 311K. The Unemployment Rate is estimated to stay steady at 3.6%, while Average Hourly Earnings are declining to 4.3% YoY, vs. 4.6% in February.
AUD/USD Technical Levels
-
20:23
USD/CAD Price Analysis: Supported by a 5-month-old trendline, climbs steadily
- Short term, the USD/CAD is downward biased, and the ongoing upward correction might be capped around 1.3568/75.
- USD/CAD Price Analysis: Further upside potential for USD/CAD lies at 1.3705, December 16 cycle high.
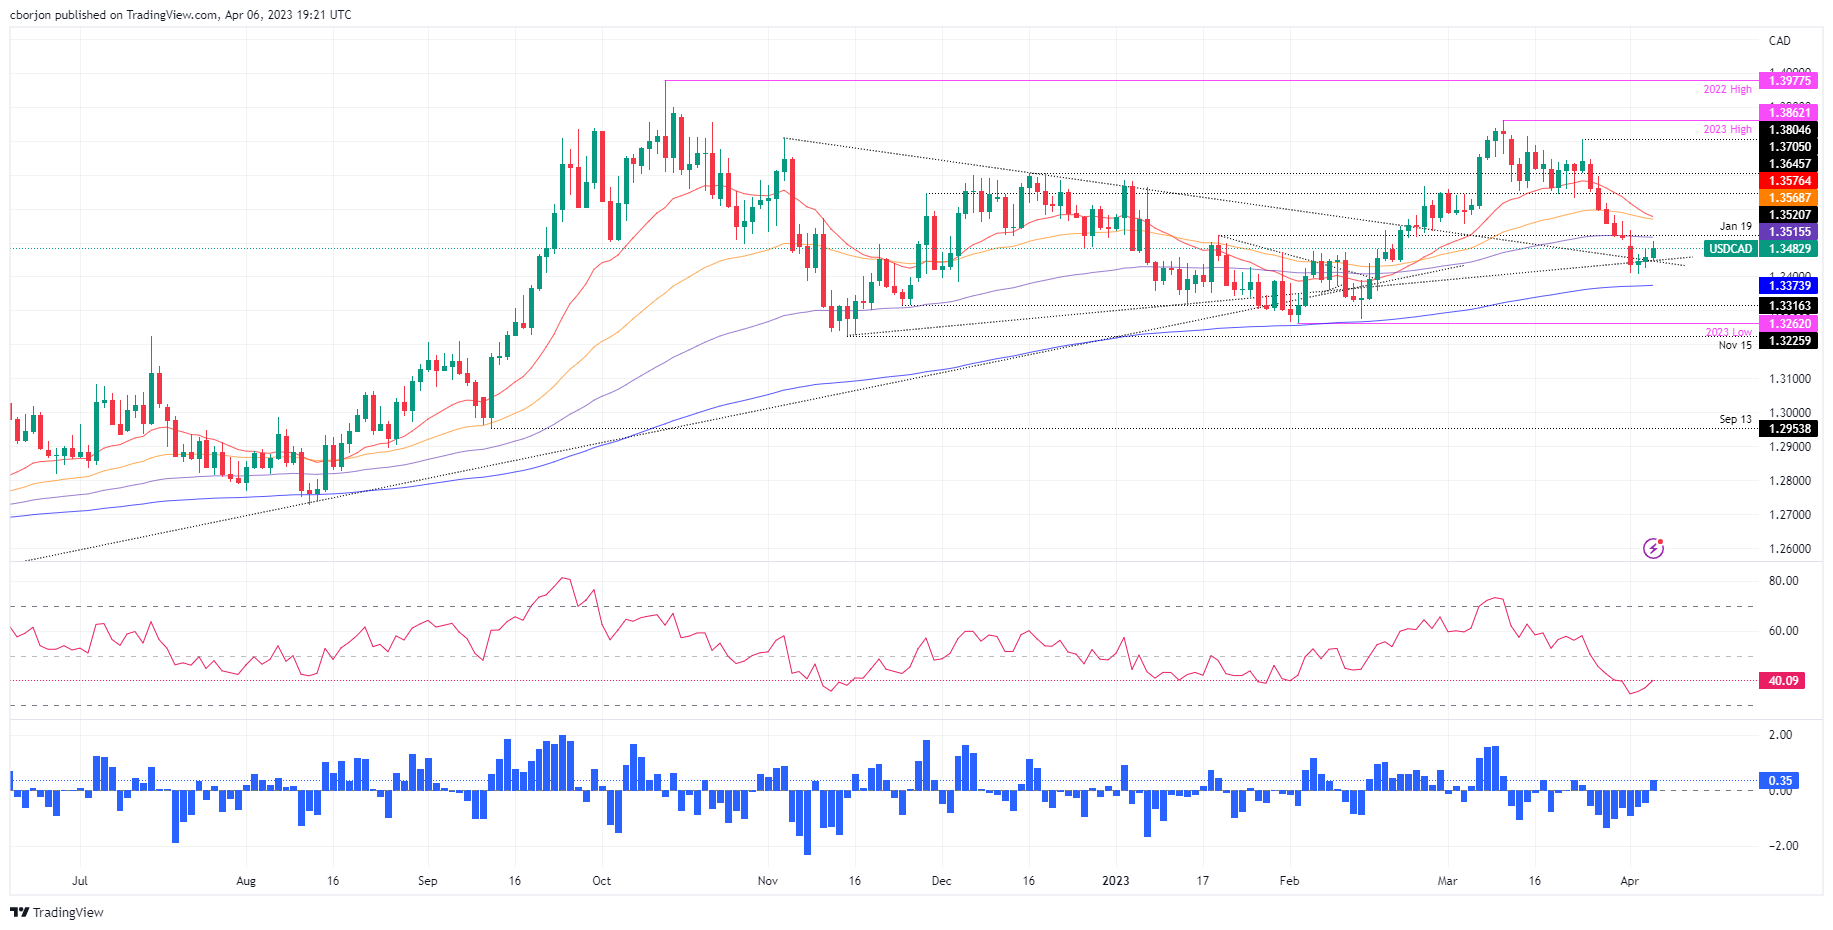
After diving towards 1.3400, the USD/CAD is staging a three-day comeback, though it remains trading above a five-month-old support trendline. At the time of writing, the USD/CAD is trading at 1.3474 after hitting a daily low of 1.3446.
USD/CAD Price Action
From a daily chart perspective, the USD/CAD is still neutral to upward biased, despite dipping 2.85% since March 24. Nevertheless, buyers kept sellers from testing the 200-day Exponential Moving Average (EMA) at 1.3374 and are hopeful of reclaiming the 100-day EMA at 1.3515. Even though the USD/CAD is printing a leg-up, the USD/CAD advancement could be capped by the 20 and 50-day EMA confluence at around 1.3568/75. If that scenario plays out, the USD/CAD might resume its current downtrend and test the 200-day EMA soon.
On the flip side, for a bullish continuation, the USD/CAD must surpass the 1.3575 area on its way to 1.3600. Once cleared, the USD/CAD upside risks lie at 1.3705, the December 16 cycle high, followed by the March 24 daily high at 1.3804.
Oscillator-wise, the Relative Strength Index (RSI) shifted gears and is aiming north but at bearish territory. This means sellers remain in charge, and the upward correction could be at risk of turning direction. Meanwhile, the Rate of Change (RoC) shows that buyers stepped in but are more likely to be outweighed by sellers.
USD/CAD Daily Chart
USD/CAD Technical Levels
-
19:14
Silver Price Analysis: XAG/USD, clouded by investors’ indecision, fluctuates around $24.90s
- Silver prices show hesitation near YTD highs amidst market uncertainty.
- Oscillators flashed mixed signals, keeping XAG/USD traders at bay.
- XAG/USD Price Analysis: Upside risks at around $25.12; otherwise, it could fall towards $24.00.
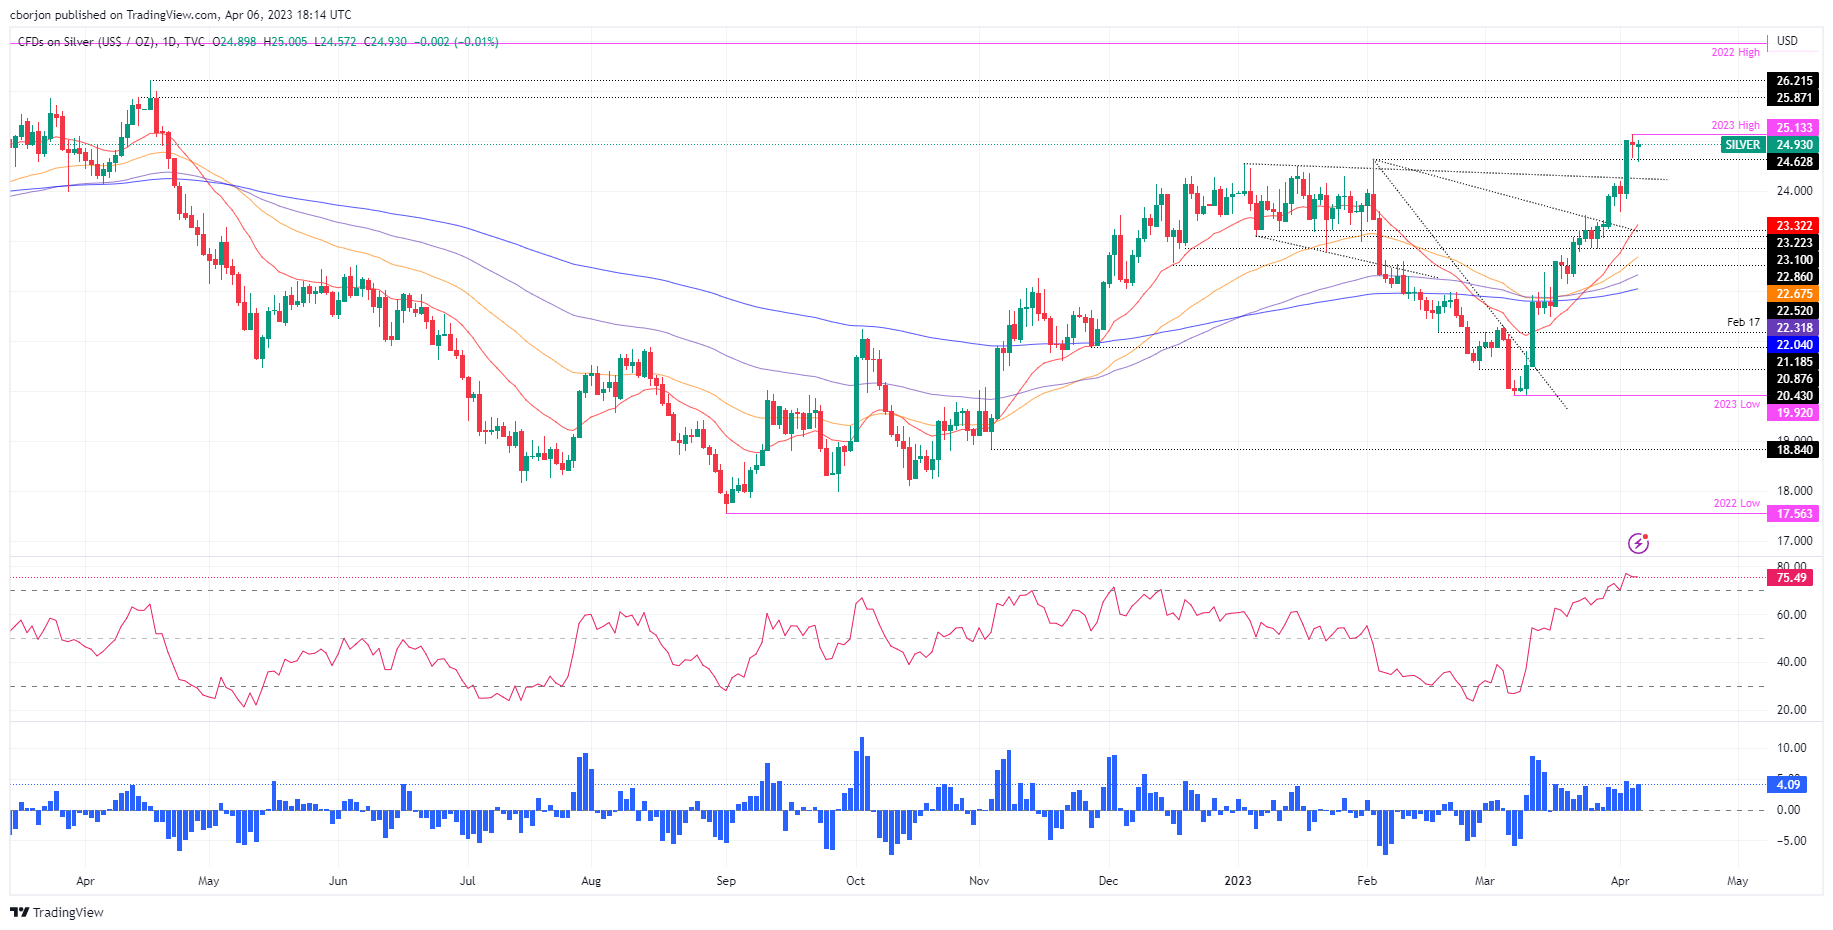
Silver price registers back-to-back doji’s at around the YTD highs hit at 25.13 but stays shy of the $25.00 a troy ounce figure. At the time of writing, the XAG/USD is trading at 24.95 after hitting a daily high of $25.00.
XAG/USD Price Action
Buyers and sellers of the white metal, also known as Silver, are undecided according to the XAG/USD’s price action during the last couple of days. The Relative Strength Index (RSI) shifted overbought since the beginning of the week, flashing that buying pressure would fade soon. The Rate of Change (RoC) signals buyers remain in charge, but they must reclaim the YTD high at $25.13 before posing a threat to test the last year’s high at $26.95.
For a bullish resumption, XAG/USD needs a daily close above $25.00. That would open the door to testing the YTD high at $25.12, followed by $25.87, April’s 14 high. The following resistance would be $26.00, followed by the April 18 cycle high of $26.21.
If XAG/USD prints a daily close below $25.00, it could exacerbate a test of February’s 25 cycle high at $24.62. Once cleared, the white metal could drop to test a previous resistance trendline turned support at around $24.25-40 before diving towards $24.00.
XAG/USD Daily Chart
XAG/USD Technical Levels
-
19:08
EUR/USD bulls retreat into NFP
- EUR/USD treads water ahead of key US data inputs.
- The focus at this point is the pivotal Nonfarm Payrolls.
EUR/USD is topping the extreme of the day in late New York in holiday calmness. The pair is currently trading at 1.0930 at hourly resistance. The pair has traveled between a low of 1.0884 and a high of 1.0937. The focus at this point is the pivotal Nonfarm Payrolls and the impact of the Federal Reserve´s policy.
The greenback has been pressured of late following a week of troublesome data. As a prelude, the ADP National Employment report showed US private employers hired fewer workers than expected in March, suggesting a cooling labor market. Private employment increased by 145,000 jobs last month, while economists polled by Reuters had forecast private employment increasing by 200,000, Reuters reported. Additionally, the ISM's Non-Manufacturing index dropped to 51.2 in March from 55.1 in February. The services sector's employment indicator slid as well to 45.8 from 47.6 in February.
Looking ahead the focus will be on US inflation and analysts at TD Securities said ´´core prices likely cooled off modestly in March, with the index still rising a strong 0.4% MoM as we look for recent relief from goods deflation to turn into inflation this month.´´
-
18:40
Canada: Solid hiring continued in March – CIBC
Data released on Thursday showed the Canadian economy added 35,000 jobs in March, surpassing expectations. Despite the strong numbers, the Bank of Canada (BoC) is expected to keep rates unchanged next week. Analysts at CIBC see the BoC on hold for the rest of the year before allowing rate cuts starting early in 2024.
Key Quotes:
“The solid hiring to start 2023 continued in March, with a 35K increase in employment easily outstripping consensus forecasts for a modest 7.5K gain. However, job gains were narrower by sector than they had been in prior months, with the overall increase driven by strong hiring in only three areas (transportation, business services and finance).”
“Other sectors of the economy either saw little change in employment or outright declines, and as such today's data are not quite as strong as they first appear. Still, the continued hiring, combined with low unemployment rate and strong wage inflation, will likely see the Bank of Canada maintain a hiking bias as it holds rates steady next week, and not hint at the cuts that have been priced into markets.”
-
18:26
NZD/USD tumbles on risk aversion on increased recessionary fears in the US
- Surging jobless claims sparked concern among traders and boosted the US Dollar to the detriment of the New Zealand Dollar.
- Bullard warns of sticky inflation, says Fed needs to stay vigilant to reach 2% target
- After the RBNZ 50 bps rate hike, the New Zealand Dollar rally faded as the NZD/USD dropped below the 200-DMA.
NZD/USD stumbles below the 200-day Exponential Moving Average (EMA) due to a risk aversion as the United States (US) labor market data crumble, sparking recessionary fears. Therefore, investors seeking safety in the FX space bought the US Dollar (USD). At the time of writing, the NZD/USD is exchanging hands at 0.6255., down almost 1%.
NZD/USD creeps below the 200-DMA, following bad US jobs data
Wall Street’s shift from being in the red turning positive. US economic data revealed that the labor market begins to loosen up as the Federal Reserve (Fed) maintains its hiking campaign. However, unemployment claims rising above estimates of 200K to 228K for the week ending on April 1 spurred speculations that a Fed pivot might be around the corner.
Earlier in the week, the JOLTs report flashed that job openings have begun to downtrend, while the latest ADP report showed that private hiring was below forecasts. Therefore, money market futures trimmed the chances for a 25 bps rate hike by the Federal Reserve, with traders estimating rates to be kept unchanged at the upcoming Fed meeting, according to CME FedWatch Tool.
The odds of keeping rates at 4.75%-5.00% are 56.1%. In addition, some investors speculate that the Fed could cut rates as soon as July.
The US Dollar Index (DXY), which tracks the performance of six currencies against the American Dollar (USD), registers minuscule losses of 0.08%, down at 101.802, after reaching a two-day high at 102.138. US Treasury bond yields resumed their downward trajectory, a headwind for the greenback.
Lately, the St. Louis Federal Reserve President James Bullard said that Q1’s incoming data is more robust than expected, adding that financial conditions are less tighter than the 2007-2009 crisis. Bullard said inflation would be “sticky going forward” and that the Fed “needs to stay at it” to get inflation back to its 2% target.
On the New Zealand (NZ) front, the rally sparked by the Reserve Bank of New Zealand’s (RBNZ) 50 bps rate hike at the April 5 meeting was short-lived, as the NZD/USD turned bearish, below the 200-day EMA, which lies at 0.6268. ANZ analysts are expecting an additional 25 bps rate hike. They added, “We’ve updated our OCR call, banking the 25bp surprise in April and maintaining our expectation for a 25bp follow-up in May (which will take the OCR to a peak of 5.5%). We’ve also penciled in three cuts for late 2024.”
NZD/USD Technical Analysis
-
18:03
United States Baker Hughes US Oil Rig Count dipped from previous 592 to 590
-
16:38
Gold Price Forecast: XAU/USD dips for the second day as US labor market data sparks recession fears
- Gold price takes a hit on disappointing US unemployment claims as the labor market eases.
- US Treasury US bond yields drop, but XAU/USD traders booking profits ahead of US NFP spurred the ongoing dip.
- St. Louis Fed President Bullard warns of sticky inflation, says Fed needs to stay vigilant to reach 2% target
Gold price slides for the second consecutive day, though it’s bracing for the March 20 high at around $2,009.75. Worse than expected, US labor market data accumulated during the week triggered investors worried about a possible recession in the United States (US). Therefore, traders scaled back their bullish bets in the yellow metal. At the time of writing, the XAU/USD is trading at $2,011.28.
XAU/USD retreats from YTD highs, ahead of US Nonfarm Payrolls report
Global equities are trading mixed, with most European (EU) bourses trading with gains. Wall Street is extending its losses to four straight days. Gold price headed down spurred by a jump in US Initial Jobless Claims for the week ending on April 1, which increased by 228K above forecasts of 200K. Additionally, data from the week before April 1 was upward revised from 198K to 246K, painting a dismal scenario for the US labor market.
Latest data like the ADP report missing estimates and job vacancies heading south exacerbated an investor’s flight to safety, initially sending XAU/USD rallying towards its YTD high of $2,032.13. Nevertheless, bad US jobs data underpin the greenback despite US Treasury bond yields continuing to drop.
US Treasury bond yields, particularly the most sensitive to interest rates, the 2-year, dropped to 3.674% before reversing their course and is up at 3.783%.
Even though the US 2-year Treasury bond yield has gained traction, money market futures estimate that the Federal Reserve (Fed) would hold rates unchanged, as shown by the CME Fed WatchTool. The odds of keeping rates at 4.75%-5.00% are 56.1%. In addition, some investors speculate that the Fed could cut rates as soon as July.
Lately, the St. Louis Federal Reserve President James Bullard said that Q1’s incoming data is stronger than expected, adding that financial conditions are less tighter than the 2007-2009 crisis. Bullard said inflation would be “sticky going forward” and that the Fed “needs to stay at it” to get inflation back to its 2% target.
ING estimates XAU/USD can hit the all-time-high
ING Analysts commented that flows toward XAU were due to the banking crisis. Analysts noted, “US data showed the job market is loosening, fuelling expectations that the Fed is nearing the end of its monetary tightening cycle.”
“Markets will be keeping a close eye on the US jobs report later this week and whether this takes the gold market to striking distance of its all-time high of US$2,075.47/oz made in August 2020,” according to ING.
XAU/USD Technical Analysis
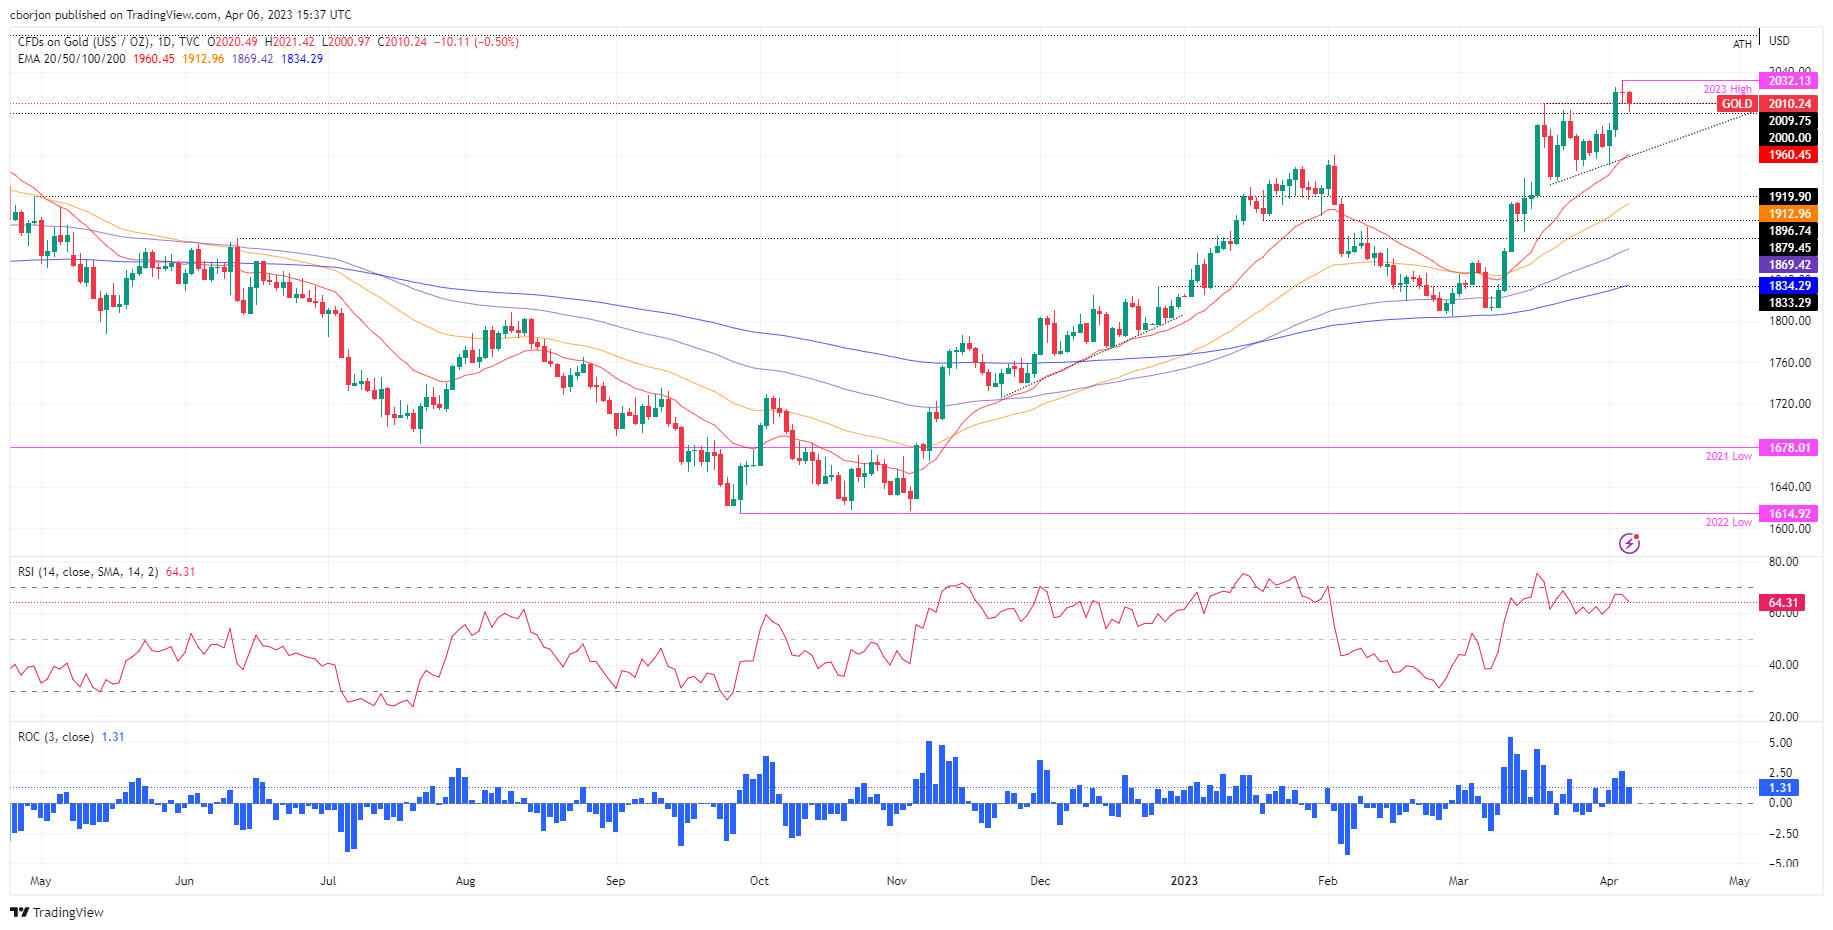
The uptrend in XAU/USD remains intact, though the current dip could be due to Gold traders’ banking profits ahead of the US Nonfarm Payrolls report. Nevertheless, buyers must keep XAU/USD price above $2,000 if they want to challenge the ATH at $2,075.47. On the flip side, a fall below the former, and sellers could drag XAU/USD to test the 20-day EMA at $1,960.42. Once cleared, the March 17 low at $1,918.38 would be exposed, ahead of the 50-day EMA at $1,912.95.
What to watch?
-
16:35
United States 4-Week Bill Auction dipped from previous 4.6% to 4.44%
-
16:06
Fed’s Bullard: Inflation is going to be “sticky” going forward
St. Louis Federal Reserve President James Bullard said on Thursday he thinks inflation is going to be sticky going forward. Regarding monetary policy, he considers that interest rates are currently at the low end of a sufficiently restrictive range. He mentioned the need to “stay at it” to get inflation back into the target.
Bullard warned that one of the biggest risks for the US economy is that the current inflation becomes entrenched.
Amid ongoing developments in the bond market, Bullard explained that some yield curve inversion reflects the inflation outlook. According to him, it is a great time to reassess how the deposit insurance is designed.
Market reaction
The US Dollar Index is trading flat on Thursday around 101.85, on a light volume session ahead of the Easter holidays. The Greenback erased modest gains after Wall Street’s opening bell.
-
15:58
Gold Price Forecast: XAU/USD to see another leg higher toward $2,230 on a move above $2,055/75 – SocGen
Gold has crossed above recent brief consolidation and April 2022 levels ($2,000) denoting persistence in uptrend. A break above the $2,055/2075 resistance zone would clear the way toward $2,150 and $2,230, analysts at Société Générale report.
$1,945 should be an important support near term
“XAU/USD is expected to head gradually towards the upper part of its range since 2020 at $2,055/2,075. This is a key resistance zone. If Gold establishes itself above this hurdle, it could mean onset of a larger uptrend toward next projections of $2,150 and $2,230.
“Lower end of recent consolidation at $1,945 should be an important support near term.”
-
15:40
US NFP Preview: Softer-than-expected or roughly in-line data to keep soft USD trend in place – Credit Suisse
Economists at Credit Suisse preview the Nonfarm Payrolls release and consider key possible ensuing market scenarios.
Stronger-than-expected NFP readings could trigger renewed USD strength
“Stronger-than-expected NFP readings could drive pushback against the dovish drift in Fed policy expectations, triggering renewed USD strength in the process. The likely mixed liquidity conditions could amplify market moves. However, barring shocking data outcomes, we’d look to stick to our strategy of fading USD strength against EUR and would wait for next week’s US CPI data before making a more comprehensive assessment.”
“Softer-than-expected or roughly in-line numbers validating the dovish Fed narrative can keep the current soft USD trend in place.”
“In the unlikely event that the data were to show shockingly weak numbers, featuring a sharply higher unemployment rate and/or an NFP print well below the low end of the Bloomberg analyst forecast range (currently 150K), broader risk-off price action might complicate the FX picture and keep USD weakness more focused in ‘safe haven’ pairs such as USD/JPY and more mixed elsewhere, with USD-EM likely sharply higher. We view this as a tail risk, it is not our baseline scenario.”
See – US Nonfarm Payrolls: Banks Preview, labor market still going strong
-
15:30
United States EIA Natural Gas Storage Change came in at -23B below forecasts (-21B) in March 31
-
15:27
GBP/USD sees pullback from 9-month high as US jobs data deteriorated
- US BLS data reveals an unexpected rise in Initial Jobless Claims to 228K as the labor market eases.
- Labor market data from multiple sources signal a slowdown in the jobs market.
- Money market futures estimates that the Fed will hold rates unchanged at May’s meeting.
The Pound Sterling (GBP) pullback from a 9-month high against the US Dollar (USD) on Tuesday dropped below the 1.2500 figure due to the buck’s renewed strength. The labor market in the United States (US) continues to deteriorate, painting a gloomy scenario for the US economy. The GBP/USD is trading at 1.2422 after hitting a high of 1.2486
GBP/USD drops as bad US jobs data underpin the greenback
Wall Street is trading with losses. The US Bureau of Labor Statistics (BLS) showed that Initial Jobless Claims for the week ending on April 1 exceeded forecasts of 200K, with data hitting 228K. Data linked to the labor market, namely the JOLTs job opening, ADP Employment Change, and the ISM Manufacturing PMI employment subcomponent, portrayed the labor market easing. That spurred an investor reaction, meaning that recessionary fears are the main reasons for the risk-off impulse seen in the last three days.
GBP/USD traders bought the US Dollar, with the pair diving from around daily highs of 1.2480, toward the lows at 1.2412. US Treasury bond yields, particularly the most sensitive to interest rates, the 2-year, dropped to 3.674% before reversing its course and is up at 3.789%.
Although the US 2-year Treasury bond yield has recovered, money market futures estimate that the Federal Reserve (Fed) would pause its tightening cycle at the May meeting. The odds of keeping rates unchanged are at 56.1%. In addition, some investors speculate that the Fed could cut rates as soon as July.
On Wednesday, the Cleveland Fed President Loretta Mester commented that rates need to rise “a little bit higher” and then hold them there for some time. She estimates that inflation will get to the Fed’s target by 2025.
The US Dollar Index (DXY), a gauge for the greenback value against a basket of six currencies, posts back-to-back bullish candles and rises 0.22%, up at 102.104.
On the UK front, the economy in the United Kingdom (UK) has fared well, contrasting the catastrophic economic projections by the Bank of England (BoE) and the UK’s Office for Budget Responsibility (OBR). Projections foresaw an 18-month recession, though the economy has avoided a recession and even posted more robust growth numbers in January. In the meantime, expectations for a 25 bps rate hike by the BoE stay at 63% at the May meeting.
GBP/USD Technical Analysis
After two straight sessions of registering losses, the GBP/USD stayed short of breaking to fresh three-day lows, below 1.2394, Tuesday’s low. If GBP/USD holds the spot price above the latter, it will keep buyers hopeful of breaking to new YTD highs above 1.2525. Upside risks lie at June 7 high at 1.2599, followed by May 27 pivot high at 1.2667. Contrarily, if GBP/USD drops past 1.2394, that would pave the way for a test of the 20-day EMA at 1.2290, below the 1.2300 psychological level.
-
15:19
Room for a moderate cyclical decline in the Dollar over the next six to 12 months – Charles Schwab
Economists at Charles Schwab expect the US Dollar to weaken moderately over the coming months, Nonetheless, the greenback is set to retain its dominance in the long run.
Fed nears the end of its rate hiking cycle while other central banks continue to tighten policy
“Over the next six to 12 months, we see room for a moderate cyclical decline in the Dollar. The main driver is likely to be a greater convergence of interest rates in the major economies as the US Federal Reserve nears the end of its rate hiking cycle while other central banks continue to tighten policy.”
“The ECB and BoE appear on track to keep hiking rates due to persistently high inflation. The BoJ may loosen its yield curve control policy, allowing bond yields to move up, which would likely mean less demand for US Dollar-denominated assets by Japanese investors. We view these developments as the most significant risk to the Dollar's strength in 2023 and 2024.”
“Longer-term, movement to a multi-currency global economy is possible and could have benefits, particularly for emerging-market countries where moves in the Dollar can have big effects on economic growth. However, it would require some major structural changes in many regions. These changes take time and political will.”
-
15:01
USD/JPY to reach 124 by Q4 as the likelihood of a BoJ policy shift should accelerate Yen gains – Wells Fargo
Economists at Wells Fargo believe the Bank of Japan will elect to deliver a policy shift later this year in Q4-2023. Such a policy move should see longer-term Japanese yields spike higher and add to their constructive medium-term outlook for the Yen.
BoJ policy change on the horizon
“We now believe the BoJ will take advantage of a tactical opportunity to further tweak its policy settings in Q4-2023, and we lean towards the October meeting in terms of timing.”
“We expect the Bank of Japan's policy adjustment to be a further step towards normalizing Japan's government bond market. Specifically, we expect the BoJ to lift the target for the 10-year Japanese government bond yield to 0.25% from 0% and widen the tolerance band around that target to +/- 75 bps.”
“While we are already positive on Yen's longer-term prospects, the likelihood of a BoJ policy shift should accelerate yen gains. Thus, against a backdrop of an earlier Bank of Japan adjustment than we previously expected, we also forecast a stronger Yen.”
“We now forecast the USD/JPY exchange rate to reach 124.00 by Q4-2023 and 120.00 by mid-2024, which would equate to a EUR/JPY exchange rate of 140.00 by Q4-2023 and 140.50 by mid-2024.”
-
15:00
Canada Ivey Purchasing Managers Index s.a registered at 58.2 above expectations (56.1) in March
-
15:00
Canada Ivey Purchasing Managers Index climbed from previous 50.8 to 65.2 in March
-
14:54
WTI comes under pressure and pokes with $80.00
- Prices of the WTI add to Wednesday’s decline near $80.00.
- The WTI advances for the third week in a row so far.
- Weekly US oil rig count comes next in the docket.
Prices of the WTI trades on the back foot for the second day in a row and puts the key $80.00 mark per barrel to the test on Thursday.
WTI remains propped up by OPEC+ cut
So far, the barrel of the American benchmark for the sweet light crude oil remains on the defensive amidst some profit taking sentiment as well as renewed recession concerns.
However, the commodity remains well en route to close the third week with gains, this time bolstered by the decision by the OPEC+ to reduce the oil output and another larger-than-expected weekly drop in US crude oil supplies (as per the EIA’s report on Wednesday).
The firm performance of the commodity so far this week continues to echo on prices of RBOB gasoline futures, which trade in levels last seen back in late October 2022 past the $2.80 mark.
Later in the session, driller Baker Hughes will report on US oil rig count in the week to April 7 (592 prev.).
WTI significant levels
At the moment the barrel of WTI is down 0.02% at $80.20 and a breach of $79.05 (monthly low April 3) would open the door to $66.86 (low March 24) and then $64.41 (2023 low March 20). On the upside, the next hurdle is located at $81.75 (monthly high April 4) followed by $82.60 (2023 high January 23) and finally $83.67 (200-day SMA).
-
14:53
USD/JPY refreshes daily top amid notable USD demand, upside potential seems limited
- USD/JPY gains some positive traction on Thursday and snaps a three-day losing streak.
- Some follow-through USD buying is seen as a key factor lending support to the major.
- Bets for an imminent Fed rate-hike pause and a softer risk tone could cap further gains.
The USD/JPY pair reverses an early North American session dip to sub-131.00 levels and climbs to a fresh daily top in the last hour, snapping a three-day losing streak. The pair moves further away from a one-week low touched on Wednesday and now trades around the 131.65-131.70 region, up nearly 0.30% for the day.
The US Dollar (USD) is seen building on the previous day's bounce from over a two-month low and gaining some follow-through traction for the second successive day, which, in turn, acts as a tailwind for the USD/JPY pair. That said, any meaningful upside still seems elusive amid growing acceptance that the Federal Reserve (Fed) is nearly done with its inflation-fighting rate hikes. In fact, the markets are pricing in an even chance of a 25bps lift-off at the next FOMC meeting in May and the possibility of rate cuts by year-end.
A larger-than-expected rise in the US Weekly Initial Jobless Claims comes on the back of the disappointing release of the US ADP report on Wednesday and suggests that the Fed's efforts to cool the labor market could be having some impact. The data lifts bets for an imminent pause in the rate-hiking cycle by the US central bank, which keeps the US Treasury bond yields depressed near a multi-month low. This, in turn, should hold back the USD bulls from placing aggressive bets and cap gains for the USD/JPY pair, at least for now.
Traders might also prefer to move to the sidelines and wait for the release of the closely-watched US monthly employment data on Friday. The popularly known NFP report will play a key role in influencing market expectations about the next policy move by the Fed and drive the USD demand. This, in turn, should help investors to determine the next leg of a directional move for the USD/JPY pair. Nevertheless, the fundamental backdrop warrants some caution before positioning for any further appreciating move for the major.
Technical levels to watch
-
14:48
USD unlikely to strengthen significantly at the moment – Scotiabank
USD quiets down ahead of a long weekend for many. Shaun Osborne, Chief FX Strategist at Scotiabank, believes that narrowing short-term spreads will weigh on the greenback.
Yields and yield spreads remain a key influence over the USD’s performance
“Slower growth fears weighed on stocks and have extended the USD some haven demand. I doubt the USD can strengthen significantly at the moment, however.”
“Slowing growth momentum plus concerns about the impact of credit tightening on the economic outlook have prompted a significant rally in red pack Eurodollar futures — implying markets anticipate significant (more than 200 bps) Fed rate cuts two years hence. Markets anticipate (currently, at least) much smaller rate reductions in the UK and Eurozone over that timeframe. Narrowing short-term spreads will limit the potential for the EUR to weaken and, ultimately, weigh on the USD.”
-
14:29
IMF’s Georgieva: Global economy to grow by less than 3% in 2023, down from 3.4% in 2022
International Monetary Fund (IMF) Managing Director Kristalina Georgieva said in her prepared remarks on Thursday that they expect the global economy to grow by less than 3% in 2023, down from 3.4% in 2024, per Reuters.
Additional takeaways
"90% of advanced economies will see decline in growth in 2023; India and China to account for half of global growth."
"IMF projects global growth to remain at around 3% over the next five years, lowest medium-term growth forecast since 1990."
"Recent banking sector pressures exposed risk management failures at specific banks and supervisory lapses."
"Robust recovery remains elusive with rising geopolitical tensions and still-high inflation."
"Central banks should continue tight stance to fight inflation, address financial stability risks when they occur."
"Calling for major boost in spending on renewable energy, continued global trade and moves to diversify supply chains."
"Countries should further reduce budget deficits while supporting the most vulnerable to safeguard social cohesion."
"Banks generally stronger and more resilient than in 2008 financial crisis, but there are concerns about hidden vulnerabilities."
"Message to policymakers on monetary policy is to be vigilant and be more agile than ever."
Market reaction
The US Dollar Index showed no immediate reaction to these comments and was last seen rising 0.2% on a daily basis at 102.10.
-
14:26
USD/CAD: Solid NFP print to set up the risk of a push higher – TDS
The Canadian labour market continues to defy gravity with employment rising by another 35K in March. Limited reaction in CAD though. A solid US payrolls number in the upcoming report could support USD/CAD in the very near-term, economists at TD Securities report.
Canadian labour market still red hot in March
“The Canadian labour market added 35K jobs in March, greatly surpassing the market estimate of 7.5K. The unemployment rate was unchanged at 5.0%, and wage growth decelerated from +5.4% YoY to +5.2% YoY.”
“The CAD was little changed following the number though this may be a function of the simultaneous release of US claims data, long weekend liquidity issues and US payrolls tomorrow.”
“The moderation in the wage numbers may be slightly encouraging for the BOC, though the robustness of job growth offers some offset.”
“The aggressive dovish repricing in the fed funds curve and our expectation for a solid NFP print sets up the risk of a push higher in USD/CAD. Should NFP surprise below consensus, however, 1.3380/00 will be important support.”
See – US Nonfarm Payrolls: Banks Preview, labor market still going strong
-
14:20
USD/MXN to trade to 17.50 and even 17.00 later this year – ING
The Peso is selling off. However, AMLO's 'new nationalisation' should not be a MXN negative, economists at ING report.
Very good demand for the Peso should USD/MXN correct to the 18.50-19.00 region
“Driving the correction looks to be a corporate finance deal announced this week that the Mexican government is buying 75% of the Mexican gas and wind facilities from Spain's Iberdola in a deal worth nearly$6bn. Mexican President AMLO describes this as a 'new nationalisation' – although that term may not be as scary for investors as it sounds. We do not read the deal as negative for Mexico's potential to attract nearshoring FDI inflows and suspect that there will be very good demand for the Peso should USD/MXN correct to the 18.50-19.00 region.”
“We see the potential for USD/MXN to trade to 17.50 and even 17.00 later this year.”
-
14:17
USD/CHF recovers early lost ground amid modest USD strength, flat-lines around 0.9065 area
- USD/CHF attracts some dip-buying on Thursday amid a modest USD strength.
- The upside seems limited amid bets for an imminent pause in Fed rate hikes.
- Looming recession fears benefits the safe-haven CHF and contributes to cap.
The USD/CHF pair struggles to capitalize on the previous day's recovery from the 0.9000 psychological mark, or its lowest level since June 2021 and attracts some intraday sellers on Thursday. Spot prices, however, manage to reverse an intraday dip and trade just above mid-0.9000s during the early North American session, nearly unchanged for the day.
The US Dollar (USD) gains some positive traction for the second straight day and moves away from over a two-month low set on Wednesday, which, in turn, lends some support to the USD/CHF pair. The USD uptick, meanwhile, lacks bullish conviction and runs the risk of fizzling out rather quickly amid growing acceptance that slowing economic growth will force the Federal Reserve (Fed) to pause its rate-hiking cycle.
In fact, the markets are currently pricing in an even chance of a 25 bps lift-off at the upcoming FOMC monetary policy meeting in May and the possibility of rate cuts by year-end. A larger-than-expected rise in the US Weekly Initial Jobless Claims comes on the back of the disappointing release of the US ADP report on Wednesday and suggests that the Fed's efforts to cool the labor market could be having some impact.
This, in turn, reaffirms expectations the Fed is nearly done with its inflation-fighting rate-hikes and keeps the US Treasury bond yields depressed near a multi-month low, which, in turn, should act as a headwind for the buck. Furthermore, looming recession risks continues to weigh on investors' sentiment and benefit the safe-haven Swiss Franc. This might further contribute to capping the upside for the USD/CHF pair.
Traders might also refrain from placing aggressive directional bets and prefer to wait on the sidelines ahead of the release of the closely-watched US monthly jobs data on Friday. The popularly known as the NFP report will play a key role in influencing market expectations about the Fed's next policy move, which, in turn, will drive the USD demand and help investors to determine the next leg of a directional move for the USD/CHF pair.
Technical levels to watch
-
14:03
EUR/USD: Market tilting firmly toward another 25 bps hike in June would still be EUR-supportive – Scotiabank
EUR/USD drifts but underlying support from narrower spreads remains intact, Shaun Osborne, Chief FX Strategist at Scotiabank, reports.
EUR should find firm support on dips
“Given elevated core inflation data, it seems likely to me that policy hawks will continue to push for rate hikes outside of more severe market turmoil. A 25 bps hike is more or less fully priced in for May 4th at this point. A half point move remains a long shot but a hawkish policy outlook – tilting market pricing more firmly towards another 25 bps hike in June would still be EUR-supportive.”
“A break under 1.0880 support would imply the risk of a short-term dip at least in the EUR back to the 1.08 area. Broader trends (and trend momentum) remain EUR-bullish, however, implying the EUR should find firm support on dips.”
-
14:00
Russia Central Bank Reserves $ declined to $593.9B from previous $594.6B
-
13:53
Nasdaq 100: A meaningful move higher can emerge toward resistance at 13603/721 – Credit Suisse
Nasdaq 100 ended Q1 strongly. Analysts at Credit Suisse look for further strength to the 50% retracement at 13606/721.
Rally to extend
“A more meaningful move higher can emerge for resistance next at the 50% retracement and summer 2022 high at 13603/721. Our bias would be to then look for a fresh cap here and for a correction lower and fresh consolidation phase. Should strength directly extend though, we would see resistance next at the 61.8% retracement and price resistance at 14277/349.”
“Below support at 12518 is needed to suggest we have seen a ‘false’ break higher for a slide back to support next at the 63-Day Moving Average, currently at 12128.”
-
13:51
EUR/USD Price Analysis: Sustained gains seen above 1.0970
- EUR/USD trades within a tight range around the 1.0900 region.
- The immediate barrier comes at the April top near 1.0970.
EUR/USD trades without a clear direction around the 1.0900 region on Thursday.
The likelihood of extra advances appears favoured for the time being. Against that, the pair needs to clear the April high at 1.0973 (April 4) to put the key 1.1000 mark back on the radar and then challenge the YTD peak at 1.1032 (February 2).
Looking at the longer run, the constructive view remains unchanged while above the 200-day SMA, today at 1.0348.
EUR/USD daily chart
-
13:48
USD/CAD remains under 1.3500 after upbeat Canadian jobs report
- US Initial Jobless Claims rise to 228,000, above the 200,000 of market consensus.
- Canadian economy adds 34,700 jobs in March, more than 12,000 expected.
- USD/CAD remains in the previous range, below 1.3500.
The USD/CAD is hovering around 1.3470/80 after the release of employment numbers from the US and Canada. The pair dropped to 1.3457 and then bounced to 1.3480 after the economic figures, staying sideways, in a familiar range.
Employment numbers from US and Canada
In Canada, the economy added 34,700 jobs in March, surpassing expectations. The Unemployment rate stayed unchanged at 5%. The Loonie strengthened against it main rivals, hitting fresh daily highs, expected versus the US Dollar.
The weekly US Jobless Claims report came in below expectations. Initial Jobless Claims rose to 228,000, above the 200,000 of market consensus. The Labor Department made a sharp revision to the upside in the previous weeks, reflecting a change in the methodology. Friday is Nonfarm Payrolls Day.
The US Dollar rose despite signs of labor conditions softening. US stocks react negatively, probably reflecting fears about the global economic outlook. US yield dropped but quickly rebound.
Technical outlook
The USD/CAD is moving between two key moving averages in the daily chart: the 200-day offers support at 1.3380 while the 55 and 100-day are near 1.3525.
The bias is skewed to the downside, however technical indicators favor some consolidation after the recent rally of the Loonie that send USD/CAD from 1.3740 to the 1.3400 area.
USD/CAD Daily Chart

-
13:48
US Nonfarm Payrolls: Banks Preview, labor market still going strong
The US Bureau of Labor Statistics (BLS) will release the March jobs report on Friday, April 7 at 12:30 GMT and as we get closer to the release time, here are the forecasts by the economists and researchers of 11 major banks regarding the upcoming employment data.
Nonfarm Payrolls in the US are forecast to rise by 240K following the 311K increase recorded in February, with the unemployment rate seen steady at 3.6% and average hourly earnings declining to 4.3% year-on-year vs. 4.6% in February.
Commerzbank
“At 240K, we expect a smaller increase in payrolls in March than in January (+504K) and February (+311K). However, the figures for the first two months were probably somewhat inflated by the unusually mild weather, and mid-March was rather too cold. If our forecast materialized, the number of new jobs created would continue to exceed the monthly average increase in new workers of an estimated maximum of 100K, which is fed by population growth. The labor market would thus remain tight, and the unemployment rate would probably remain at a very low 3.6%.”
ING
“While we remain nervous about the outlook for jobs given the rise in job lay-off announcements and the inevitable tightening of lending conditions resulting from banking stresses that will be a major headwind for struggling businesses, this will take time to be reflected in payroll numbers. Anything over 200K in terms of March payroll growth will likely boost expectations for a 25 bps rate hike.”
Danske Bank
“We think employment growth remained upbeat in March, and look for 250K NFP gain.”
NBF
“We expect payroll growth to have decelerated to 190K, which would remain very solid given the increasingly limited number of people remaining on the sidelines. The household survey is expected to show a similar gain, something which would leave the unemployment rate unchanged at 3.6%, assuming the participation rate stayed put at 62.5%.”
SocGen
“Our NFP projections are for a moderation. Our forecast absolute gain of 215K in March is still strong, but if realised, would be the softest since December 2021. We view monthly gains in excess of 150-175K as strong since over time, such a pace would further reduce the unemployment rate. With the unemployment rate at 3.6%, labour markets are tight. Wages are likely to grow by 0.3% mom in March, similar to the previous reading. This would mark a deceleration in wage growth. Average hourly earnings are not the best measure for compensation pressures, but the data is monthly and earlier than other data, so it is closely watched. A softening in wages may reflect management strategies to resist demands. If employers see labour requirements as being met and fear a potential layoff round in coming quarters, their willingness to boost wages to retain and attract workers diminishes.”
Deutsche Bank
“We expect nonfarm payrolls to gain +250K and both the unemployment rate and hourly earnings growth to remain unchanged (3.6% and +0.2%, respectively).”
CIBC
“Jobless claims remained low in the March payroll survey reference period, signaling a healthy 220K pace of hiring. Although our forecast of 0.3% growth in average hourly earnings doesn’t preclude reaching ontarget inflation, a 220K pace of hiring is roughly double what Powell has suggested is consistent with sustainable on-target inflation, and we, therefore, continue to expect a final 25 bps rate hike ahead, assuming no proliferation of banking sector issues. With private measures of job openings easing, and previously announced layoffs still coming to fruition, we expect to see a further cooling in the pace of hiring ahead, in combination with a deterioration in cyclical sectors, which will likely leave the Fed on pause after the May FOMC. We’re a little below the consensus on payrolls, but likely not by enough to put downwards pressure on bond yields, as the fading of banking sector concerns is an overriding factor.”
BMO
“US payrolls will be released on Good Friday this year (thus producing the rare case of Canadian jobs arriving earlier). We expect it will be worth the wait, with a solid gain of around 240K likely on tap, lifting the tally for all of Q1 to above 1 million net new jobs – making a mockery of recession talk, at least at the start of the year.”
Citi
“We expect monthly payroll growth to continue to slow in March, but to a still strong pace of 250K jobs added, although with slight downside risks due to some more signs of job losses in rate-sensitive sectors. We also expect a 0.3% MoM increase in average hourly earnings in March with roughly balanced risks of a larger or smaller increase. On the one hand, tightness in the US labor market should continue to put upward pressure on wages and expect that underlying wage growth is running at least 4-6% annualized. On the other, changes in the sector composition of payroll employment in recent months have likely put downward pressure on average hourly earnings and could continue to do so in March. And after rising somewhat unexpectedly to 3.6% in February, we expect the unemployment rate to decline to 3.5% in March. This is based on a similar expectation for employment growth in the household survey that determines the unemployment rate and the labor force participation rate remaining unchanged after a few months of recent increases.”
Wells Fargo
“We look for job growth to slow to 240K in March. The still-tight state of the labor market is likely to be reflected by the unemployment rate ticking back down to 3.5% and March's rise in average hourly earnings edging up to 0.3%.”
TDS
“We expect the March jobs report to show that payrolls grew with 270K and while this is a slight slowdown from stronger prints in Jan-Feb, it still suggests an above-trend pace of job growth in March. The unemployment rate is projected to stay unchanged at 3.6%. Finally, wage growth will probably print a firm 0.3% MoM.”
-
13:39
US: Weekly Initial Jobless Claims decline to 228K vs. 200K expected
- Initial Jobless Claims in the US decreased by 18,000 in the week ending April 1.
- US Dollar Index continues to fluctuate in daily range at around 102.00.
There were 228,000 initial jobless claims in the week ending April 1, the weekly data published by the US Department of Labor (DOL) showed on Thursday. This print followed the previous week's print of 246,000 (revised from 191,000) and came in worse than the market expectation of 200,000.
Further details of the publication revealed that the advance seasonally adjusted insured unemployment rate was 1.3% and the 4-week moving average was 237,750, a decrease of 4,250 from the previous week's revised average.
"The advance number for seasonally adjusted insured unemployment during the week ending March 25 was 1,823,000, an increase of 6,000 from the previous week's revised level," the DOL further added.
It's worth noting that the DOL announced a revision to seasonal adjustment factors starting with this data.
"Beginning with the Unemployment Insurance (UI) Weekly Claims News Release issued Thursday, April 6, 2023, the methodology used to seasonally adjust the national initial claims and continued claims reflects a change in the estimation of the models," the DOL said in its press release.
Market reaction
The US Dollar Index clings to its daily recovery gains at around 102.00 after this report.
-
13:34
Canada: Unemployment Rate stays unchanged at 5% in March vs. 5.1% expected
- Unemployment Rate in Canada held steady at 5% in March.
- USD/CAD continues to trade in its daily range below 1.3500.
The data published by Statistics Canada revealed on Thursday that the Unemployment Rate stayed unchanged at 5% in March. This reading came in slightly better than the market expectation of 5.1%.
Further details of the publication revealed that the Net Change in Employment came in at +34.7K in March, surpassing analysts' estimate of 12,000. Finally, the Participation Rate edged lower to 65.5% from 65.7%.
Market reaction
USD/CAD edged slightly higher with the initial reaction to this data and was last seen rising 0.15% on a daily basis at 1.3478.
-
13:33
GBP/USD: A pause in the underlying bull trend before another push higher – Scotiabank
GBP/USD consolidates around key support in the mid-1.24s. Economists at Scotiabank expect the pair to extend its up move toward 1.2750.
Firm support on modest GBP dips
“Look for more range trading in the short run but expect firm support on modest GBP dips.”
“The basic message from short-term price action (developing ‘bull flag’) remains essentially the same – a pause in the underlying bull trend before another push higher.”
“Cable dips have been well supported at or just below 1.2440/45 (former highs and now major support).”
“Trend momentum remains bullish, implying limited downside and ongoing upside risk (potential to 1.2750/00).”
-
13:31
Canada Unemployment Rate below expectations (5.1%) in March: Actual (5%)
-
13:30
Canada Net Change in Employment came in at 34.7K, above expectations (12K) in March
-
13:30
United States Initial Jobless Claims above forecasts (200K) in March 31: Actual (228K)
-
13:30
Canada Participation Rate below forecasts (65.7%) in March: Actual (65.6%)
-
13:30
United States Continuing Jobless Claims came in at 1.823M, above forecasts (1.699M) in March 24
-
13:30
United States Initial Jobless Claims 4-week average up to 237.75K in March 31 from previous 198.25K
-
13:23
AUD/USD remains depressed below 0.6700 mark, seems vulnerable to slide further
- AUD/USD remains depressed for the third straight day and is pressured by a combination of factors.
- The RBA’s dovish tilt undermines the Aussie and weighs on the pair amid a modest USD strength.
- Bets for an imminent Fed rate-hike pause act as a headwind for the USD and might help limit losses.
The AUD/USD pair remains under some selling pressure for the third straight day on Thursday and trades just below the 0.6700 round-figure mark heading into the North American session.
The Australian Dollar continues to be weighed down by the Reserve Bank of Australia's (RBA) dovish outlook, which, along with a modest US Dollar (USD) strength, exerts some downward pressure on the AUD/USD pair. It is worth recalling that the Australian central bank on Tuesday paused its rate-hiking cycle following 10 consecutive raises and signalled that inflation had likely peaked. In the accompanying policy statement, the RBA noted that it wanted additional time to assess the full effects of past increases as the economy slows.
The USD, on the other hand, edges higher for the second straight day and looks to build on the overnight modest bounce from over a two-month low, which is seen as another factor dragging the AUD/USD pair lower. The incoming macro data from the US pointed to slowing economic growth and revived recession fears. This, in turn, continues to weigh on investors' sentiment and benefits the Greenback's relative safe-haven status. That said, rising bets for an imminent pause in the Federal Reserve's (Fed) rate-hike cycle cap gains for the buck.
In fact, the markets are currently pricing in an even chance of a 25 bps lift-off at the next FOMC monetary policy meeting in May and see the possibility of rate cuts by year-end. The bets were lifted by the disappointing US economic releases, which suggested that the Fed's efforts to cool the labor market could be having some impact. This keeps the US Treasury bond yields depressed near their lowest level in seven months, which is holding back the USD bulls from placing aggressive bets and might limit losses for the AUD/USD pair, at least for now.
The aforementioned mixed fundamental backdrop warrants some caution before positioning for any further depreciating move, though the price action suggests that the path of least resistance for the AUD/USD pair is to the downside. Traders, however, might prefer to move to the sidelines ahead of Friday's release of the closely-watched US monthly employment details - popularly known as the NFP report. In the meantime, the USD price dynamics will be looked upon to grab some short-term trading opportunities around the major.
Technical levels to watch
-
13:02
Chile Core Consumer Price Index (Inflation) (MoM) climbed from previous 0.2% to 1.4% in March
-
13:00
Chile Consumer Price Index (Inflation) (MoM) up to 1.1% in March from previous -0.1%
-
12:59
USD Index Price Analysis: Still scope for a drop to 100.80
- DXY erodes the initial bull run to the area just above 102.00.
- Next on the downside emerges the YTD low around 100.80.
DXY comes under pressure and returns to the negative territory after briefly trespassing the 102.00 barrier on Thursday.
The bearish sentiment around the dollar remains well and sound and this could force the index to retest the so far April low at 101.43 (April 5) in the near term. The loss of this level could pave the way for a deeper decline to the 2023 low around 100.80 (February 2).
Looking at the broader picture, while below the 200-day SMA, today at 106.50, the outlook for the index is expected to remain negative.
DXY daily chart
-
12:56
Gold Price Forecast: XAU/USD may flirt with all-time high of $2,075 – ING
Catching some attention has been the move in Gold above $2,000. What does Gold above $2,000 mean? Gold is seen as the flip side of the Dollar trend and of course, a key hedge against inflation, economists at ING report.
Is Gold telling us something about the Dollar?
“There does not yet seem to be much weight to the narrative that a US banking crisis is going to undermine the Fed's battle against high and ingrained inflation. And certainly Gold – as a non-interest bearing asset – is doing well compared to the near 5% rates available in overnight Dollar deposits.”
“What also may be at work in favour of Gold are FX reserve management trends. The increasingly bipolar geopolitical world – exacerbated by the war in Ukraine – means that BRICS+ central banks will be keeping a greater share of their international reserves in Gold. This is a structural positive for Gold and a structural negative for the Dollar, one to add to the cyclical negative of what should be a Fed easing cycle later this year.”
“Markets will be keeping a close eye on the US jobs report later this week and whether this takes the gold market to striking distance of its all-time high of $2,075.47 made in August 2020.”
-
12:41
USD/CAD: Firm jobs data may provide a lift to the Loonie – Scotiabank
USD/CAD continues to edge higher after the mid-week test and rejection of the low 1.34 zone. Economists at Scotiabank expect the Loonie to benefit from firm Canadian Employment report.
Resistance at 1.3505/25 looks firm
“The labour market here remains tight and elevated wage data, in particular, is likely to bother policymakers who have noted previously that high wage growth is inconsistent with regaining control of inflation (absent an unheard-of increase in domestic productivity).”
“US/Canada 2Y spreads have narrowed this week – providing some backstop for the CAD – and may narrow a little more if the jobs data are firm.”
“Intraday, resistance at 1.3505/25 looks firm. Support (bearish break-out) is 1.3450.”
See – Canadian Jobs Preview: Forecasts from four major banks, employment may suffer a bit of retreat
-
12:31
United States Challenger Job Cuts climbed from previous 77.77K to 89.703K in March
-
12:29
USD/SGD to fall in Q2 within a 1.2800-1.3400 range – Credit Suisse
Economists at Credit Suisse think USD weakness will push USD/SGD lower in a 1.28-1.34 range.
Prospect of a dovish Fed pivot means that the NEER basket will strengthen against the USD
“For USD/SGD, the movements of the broad US Dollar, rather than SGD NEER volatility, has been the bigger driver of USD/SGD over the last 12 months. We expect this trend to continue in Q2 2023.”
“The prospect of a dovish Fed pivot means that the NEER basket will strengthen against the US Dollar. Therefore, because of our view for a weaker USD against basket currencies (including JPY and EUR), we expect USD/SGD to fall in Q2 within a 1.2800-1.3400 range.”
-
12:25
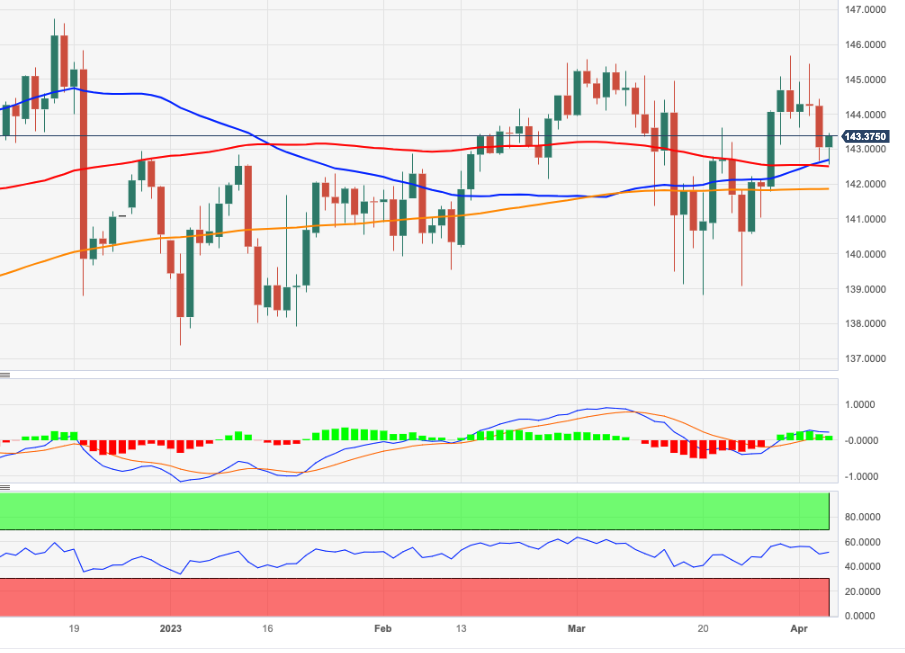
EUR/JPY Price Analysis: Price action remains erratic
- EUR/JPY reverses two sessions with losses and regains 143.00.
- The 200-day SMA continues to hold the downside so far.
EUR/JPY picks up some pace and reclaims the area above 143.00 the figure on Thursday.
The cross keeps navigating choppy waters for the time being. In the meantime, a daily close above the 2023 peak at 145.67 (March 31) should encourage the cross to challenge the December 2022 high around 146.70 (December 15), while the breach of the 200-day SMA at 141.83 exposes a deeper drop to recent lows near 139.00.
So far, further upside looks favoured while the cross trades above the 200-day SMA.
EUR/JPY daily chart
-
12:01
EUR/USD to eventually move above its YTD high at 1.1035 for a test of 1.1185/1.1275 – Credit Suisse
Economists at Credit Suisse look for EUR/USD to eventually see a clear and sustained break above its downtrend from May 2021 and 50% retracement of the 2021/2022 bear trend for strength back to the 1.1035 YTD high, then resistance at 1.1185/1.1275.
Initial support aligns at 1.0788
“EUR/USD remains well supported and is seeing a fresh and concerted retest of key resistance from the 50% retracement of the 2021/2022 fall and downtrend from May 2021 at 1.0921/44. We continue to look for an eventual sustained break higher for a retest of the 1.1035 YTD high. Whilst this should continue to be respected, we stay bullish for an eventual test of 1.1185/1.1275 – the 61.8% retracement and March 2022 high.”
“Support is seen at 1.0788 initially, with 1.0714 ideally still holding. A break would warn of a fall back to the uptrend from last September, currently at 1.0630.”
-
11:59
When is the Canadian monthly jobs report and how could it affect USD/CAD?
Canadian employment details overview
Statistics Canada is scheduled to publish the monthly employment report for March later this Thursday at 12:30 GMT. The Canadian economy is anticipated to have added 12K jobs during the reported month, down from February's reading of 21.8K. Moreover, the unemployment rate is anticipated to edge higher to 5.1% from 5.0% in the previous month.
Analysts at Citi Bank offer a brief preview of the key macro data and explain: “After a few months of very strong employment gains, we expect a modest 10K drop in employment in the labor force survey in March, although with risks tilted to the upside due to strong population growth from immigration. An eventual contraction in activity later this year alongside slowing in the US which should result in job losses, but even in this scenario, the rise in unemployment could be relatively muted. Expectation for modest job loss in March would imply an increase in the unemployment rate to a still-low 5.2%.”
How could the data affect USD/CAD?
Ahead of the crucial employment details, the USD/CAD pair is seen trading with a positive bias for the third successive day and draws support from a combination of factors. A softer tone around Crude Oil prices undermines the commodity-linked Loonie, which, along with a modest US Dollar (USD), uptick acts as a tailwind for the major.
Any disappointment from the Canadian employment details could further weigh on the domestic currency and provide an additional boost to the USD/CAD pair. Conversely, stronger data might lend support to the Canadian Dollar and cap the upside for the major. The immediate market reaction, however, is more likely to be limited as the focus remains glued to the closely-watched US monthly jobs data - popularly known as NFP.
Valeria Bednarik, Chief Analyst at FXStreet, offers a brief technical outlook for the USD/CAD pair and writes: “Technical readings in the daily chart suggest the upward potential remains limited, as indicators have barely recovered from near oversold readings, lacking strength enough to confirm another leg north. Furthermore, USD/CAD develops below a directionless 100 Simple Moving Average (SMA) at 1.3520, while the 20 SMA gains bearish traction far above the longer one.”
Valeria further outlines important technical levels to trade the USD/CAD pair: “A steeper decline could be expected on a break below the 1.3400 threshold, with market players targeting then the 1.3250/70 region, where the pair bottomed multiple times between November and February. Gains beyond 1.3520, on the other hand, could see the pair testing the 1.3600 mark.”
Key Notes
• Canada Employment Preview: Modest gain anticipated, but a surprise not off the table
• Canadian Jobs Preview: Forecasts from four major banks, employment may suffer a bit of retreat
• USD/CAD Forecast: 100 DMA holds the key ahead of Canadian jobs data
About the Employment Change
The employment Change released by Statistics Canada is a measure of the change in the number of employed people in Canada. Generally speaking, a rise in this indicator has positive implications for consumer spending which stimulates economic growth. Therefore, a high reading is seen as positive, or bullish for the CAD, while a low reading is seen as negative or bearish.
About the Unemployment Rate
The Unemployment Rate released by Statistics Canada is the number of unemployed workers divided by the total civilian labour force. It is a leading indicator for the Canadian Economy. If the rate is up, it indicates a lack of expansion within the Canadian labour market. As a result, a rise leads to weaken the Canadian economy. Normally, a decrease of the figure is seen as positive (or bullish) for the CAD, while an increase is seen as negative or bearish.
-
11:34
USD Index to eye new lows for the year – Credit Suisse
The recent rebound in the US Dollar Index is over. Economists at Credit Suisse stay tactically negative, looking for a move back to the 100.82 YTD low and eventually what they expect to be stronger support at 98.98/97.89.
Resistance at 103.36 ideally caps to keep the immediate risk lower
“We maintain our 1-3 month negative outlook for a retest of the 100.82 YTD low. Whilst this should be respected, we look for new lows for the year for support next at 100.00 and then what we look to be better support, starting at the 61.8% retracement of the 2021/2022 uptrend at 98.98 and stretching down to 97.44, which also includes the long-term 200-week average, currently at 97.89.”
“Resistance at 103.36 now ideally caps to keep the immediate risk lower. Above can see strength back to 105.12.”
-
11:20
Gold Price Forecast: XAU/USD bounces off daily low, holds steady around $2,020 level
- Gold price reverses an intraday dip on Thursday, albeit lacks any follow-through buying.
- A modest US Dollar strength and stable performance in the equity markets cap gains.
- Bets for an imminent rate-hike pause by the Federal Reserve continue to lend support.
- Traders now seem reluctant and look to the US NFP report for some meaningful impetus.
Gold price attracts some dip-buying near the $2,008-$2,007 region on Thursday and stalls the previous day's retracement slide from its highest level since March 2022. The XAU/USD is currently placed just below the $2,020 level, nearly unchanged for the day, and is influenced by a combination of diverging forces.
Gold price is weighed down by a combination of factors
The US Dollar (USD) edges higher for the second successive day and recovers further from over a two-month low touched on Wednesday. This, in turn, prompts some intraday selling around the US Dollar-denominated Gold price. Apart from this, signs of stability in the equity markets undermine traditional safe-haven assets, including the XAU/USD. That said, rising bets for an imminent pause in the Federal Reserve's (Fed) rate-hiking cycle caps the upside for the Greenback and helps limit the downside for the non-yielding yellow metal.
Bets that Federal Reserve is down with rate hikes lend support
Investors seem convinced that the Fed is nearly done with its inflation-fighting interest rate hikes. In fact, the markets are pricing in an even chance of a 25 bps lift-off at the next Federal Open Market Committee (FOMC) meeting in May and the possibility of rate cuts by year-end. The bets were reaffirmed by the disappointing release of the ADP report from the United States (US) on Wednesday, which showed that private-sector employers added 145K jobs in March as compared to the 200K anticipated and the 261K previous.
Depressed US Treasury bond yields further act as a tailwind
Furthermore, the ISM Services PMI indicated a slowdown in growth during March, along with a deceleration in its Employment sub-index, suggesting that the Fed's efforts to cool the labor market may be having some impact. Meanwhile, expectations that the Fed is nearly done with its inflation-fighting interest rate hikes keep the US Treasury bond yields depressed near their lowest level in seven months. This should contribute to capping the USD and suggests that the path of least resistance for Gold price is to the upside.
Focus remains glued on Friday’s NFP report from United States
Traders, however, seem reluctant to place aggressive bets and prefer to wait on the sidelines ahead of the release of the crucial US monthly employment details - popularly known as NFP on Friday. In the meantime, Thursday's US economic docket, featuring the usual Weekly Initial Jobless Claims, will be looked upon for short-term opportunities later during the early North American session. The immediate market reaction, however, is more likely to be limited and might do little to provide any meaningful impetus to Gold price.
Gold price technical outlook
From a technical perspective, the recent breakout and acceptance above the $2,000 psychological mark favour bullish traders. Moreover, oscillators on the daily chart are holding in the positive territory and support prospects for additional gains. Hence, a move back towards retesting a one-year peak, around the $2,032 area touched on Wednesday, looks like a distinct possibility. Some follow-through buying should allow Gold price to aim to retest the March 2022 swing high, around the $2,070 region. This is closely followed by the all-time peak, around the $2,074-$2,075 zone, which if cleared will set the stage for a further near-term appreciating move.
On the flip side, the daily swing low, around the $2,008-$2,007 area could find some support near the $2,000 mark. Any further pullback is more likely to attract fresh buyers and remain limited around the $1,982-$1,980 horizontal zone. The latter should act as a pivotal point, which if broken decisively might prompt some technical selling and drag the Gold price towards the $1,955 intermediate support en route to the $1,945-$1,944 support.
Key levels to watch
-
11:12
USD/JPY to retest 127.53/23 YTD low later in Q2 amid “bearish” triangle pattern – Credit Suisse
USD/JPY has extended its recovery. Nevertheless, economists at Credit Suisse view the current price action as a potential bearish “triangle” continuation pattern and they continue to look for the range to be eventually resolved lower.
“Triangle” consolidation phase may last a while
“We now look for further near-term strength in what is looking like the early stage of a potential ‘triangle’ continuation pattern. Resistance is seen next at 135.12, with tougher resistance expected at 136.67/137.30, which we look to cap.”
“Big picture, if we are correct and we are seeing the formation of a bearish ‘triangle’ this would suggest we should see an eventual break below 129.64 later in Q2 for a retest of the 127.53/23 YTD low and 50% retracement of the 2021/2022 uptrend. Whilst a fresh hold here should be allowed for, we look for an eventual break for a fall to support next at the 61.8% retracement at 121.44. We would also expect such a fall to be in line with a broader market ‘risk off’ phase.”
-
11:02
EUR/USD: Euro might come under renewed pressure on higher risk perceptions – Commerzbank
If the FX market considers the world to be more uncertain it mainly sees EUR-negative risks, Ulrich Leuchtmann, Head of FX and Commodity Research at Commerzbank, reports.
There will always be some disaster somewhere
“There will always be some disaster somewhere. As I do not know what that will be, I cannot tell whether the unpredictable will be EUR-positive or EUR-negative. But over the past quarters, higher risk perceptions was typically perceived as EUR-negative.”
“The fact that the Euro is trading at relatively high levels at present is due to the fact that there is untypically little going on at present. If that changes and if the pattern seen over the past quarters does not change, the Euro might come under renewed pressure. That is another reason why I am somewhat sceptical about current EUR/USD levels.”
-
10:59
US Dollar stabilizes ahead of Nonfarm Payrolls report
- US Dollar stays relatively resilient against its major rivals on Thursday.
- EUR/USD technical outlook remains bullish but there is a loss of momentum.
- Nonfarm Payrolls report for March could significantly influence US Dollar’s valuation.
The US Dollar (USD) manages to hold its ground in the second half of the week after having suffered heavy losses against its major rivals earlier. The USD seems to be finding demand as a safe haven as investors grow increasingly concerned about the United States (US) economy tipping into recession. Nonfarm Payrolls (NFP) report for March, which will be released on Friday, could influence the market positioning regarding the US Federal Reserve’s next policy step and impact the USD’s performance.
The US Dollar Index, which gauges the USD’s valuation against a basket of six currencies, holds steady at around 102.00 after having touched its weakest level since early February below 101.50 early Wednesday.
Daily digest market movers: US Dollar holds its ground ahead of key data releases
- Federal Reserve Bank of Atlanta’s GDPNow model’s estimate for the first-quarter real Gross Domestic Product Growth (GDP) declined to 1.5% following Wednesday’s data releases.
- Nonfarm Payrolls in the US is forecast to rise by 240,000 following February’s impressive increase of 311,000. The Unemployment Rate in the US is expected to hold steady at 3.6%.
- Assessing the potential impact of the US jobs report on the USD’s valuation, “with the ISM Manufacturing Employment Index down at 46.9, there is growing evidence that the positive demand in the US labour market is now beginning to fade,” noted economists at MUFG Bank “If that is confirmed on Friday by a weaker than expected Nonfarm Payrolls report it will likely result in a more substantial depreciation of the US Dollar.”
- Economic activity in the US services sector expanded at a softening pace in March with the ISM Services PMI declining to 51.2 from 55.1 in February.
- The inflation component of the PMI survey, the Price Paid sub-index, edged lower to 69.5 from 65.6 in February. The Employment sub-index fell to 51.3 from 54.
- Employment in the US private sector rose by 145K in March, falling short of analysts' estimate of 200K, ADP's monthly report showed on Wednesday.
- Commenting on the data, "our March payroll data is one of several signals that the economy is slowing,” said Nela Richardson, chief economist, ADP. "Employers are pulling back from a year of strong hiring and pay growth, after a three-month plateau, is inching down."
- The US Bureau of Labor Statistics (BLS) announced on Tuesday that the number of job openings on the last business day of February declined to 9.9 million from 10.5 million in January.
- Bloomberg reported on Tuesday that the Chinese Yuan has surpassed the US Dollar as the most traded currency, in monthly trading volume, for the first time in Russia in February. According to the outlet, the gap has continued to widen in March.
- Last week, Brazil and China have reached an agreement to stop using the US Dollar as an intermediary in trade transactions.
- On Sunday, Saudi Arabia announced that several producers in OPEC+ will participate in voluntary output cuts from May to the end of the year. The group’s total output will be reduced by more than 1.5 million barrels per day in that period.
- Federal Reserve Bank of St. Louis President James Bullard said on Monday that the unexpected decision by OPEC to lower output could make the Fed’s jobs of bringing inflation down back to 2% target more challenging.
- ISM’s Report on Business revealed on Monday that the headline Manufacturing PMI declined to 46.3 in March from 47.7 in February, revealing a contraction at an accelerating pace in the manufacturing sector’s economic activity.
- The Prices Paid Index of the PMI survey, the inflation component, dropped to 49.2 from 51.3. This reading suggests that input inflation in the sector softened in March.
Technical analysis: US Dollar is yet to outperform Euro in a convincing way
Despite Wednesday’s pullback, EUR/USD’s near-term technical outlook stays bullish with the Relative Strength Index (RSI) on the daily chart holding comfortably above 50. Moreover, the 20-day Simple Moving Average (SMA) continues to pull away from the 50-day SMA following the bullish cross seen earlier in the week.
1.0900 (psychological level, static level) aligns as immediate support for EUR/USD. If the pair falls below that level and starts using it as support, it could extend its downward correction toward 1.0800 (psychological level, 20-day SMA), 1.0740 (50-day SMA) and 1.0680 (100-day SMA).
On the upside, static resistance seems to have formed at 1.0950 ahead of 1.1000 (end-point of the latest uptrend, psychological level) and 1.1035 (multi-month high set in early February).
How does Fed’s policy impact US Dollar?
The US Federal Reserve (Fed) has two mandates: maximum employment and price stability. The Fed uses interest rates as the primary tool to reach its goals but has to find the right balance. If the Fed is concerned about inflation, it tightens its policy by raising the interest rate to increase the cost of borrowing and encourage saving. In that scenario, the US Dollar (USD) is likely to gain value due to decreasing money supply. On the other hand, the Fed could decide to loosen its policy via rate cuts if it’s concerned about a rising unemployment rate due to a slowdown in economic activity. Lower interest rates are likely to lead to a growth in investment and allow companies to hire more people. In that case, the USD is expected to lose value.
The Fed also uses quantitative tightening (QT) or quantitative easing (QE) to adjust the size of its balance sheet and steer the economy in the desired direction. QE refers to the Fed buying assets, such as government bonds, in the open market to spur growth and QT is exactly the opposite. QE is widely seen as a USD-negative central bank policy action and vice versa.
-
10:44
GBP/USD: Moving to new highs for the year, eyes on tough resistance at 1.2668/1.2758 – Credit Suisse
GBP/USD has already moved above the 1.2447/49 highs of December and January. Analysts at Credit Suisse stay bullish for what they look to be tougher resistance at 1.2668/1.2758, which includes its downtrend from May 2021.
A break below 1.2274 can see a fall back to 1.2190/70
“With a bullish moving average ‘golden cross’ in place we maintain our core positive outlook for resistance next at 1.2668/1.2758 – the May 2022 high, 61.8% retracement of the 2021/2022 fall and long-term downtrend from May 2021. Our bias would then be to look for a cap here for a fresh phase of consolidation. Should strength directly extend though, we see resistance next at 1.2894, then 1.3000.”
“Support at 1.2274 now ideally holds to keep the immediate risk higher. A break can see a fall back to 1.2190/70 but with fresh buyers expected here.”
-
10:33
EUR/USD: Challenging risk environment can keep the pair bouncing around in a 1.05-1.10 range – ING
EUR/USD reversed quite sharply from a high of 1.0970 yesterday. The first run at 1.10 failure reinforces ING’s forecast over this next quarter.
EUR/USD probably hovers around the 1.0900 area today
“Price action yesterday tentatively confirms our thinking for EUR/USD over this next quarter. Despite the building macro negatives for the Dollar, we suspect a challenging risk environment can keep EUR/USD bouncing around in a 1.05-1.10 range.”
“EUR/USD probably hovers around the 1.0900 area today.”
See – EUR/USD: Recent Euro strength might be unsustainable – Commerzbank
-
10:24
USD/JPY recovers intraday losses amid modest USD strength, remains below mid-131.00s
- USD/JPY bounces off a daily low amid a modest USD uptick, albeit lacks any follow-through buying.
- Bets for an imminent Fed rate-hike pause keep a lid on the buck and act as a headwind for the pair.
- The narrowing of the US-Japan rate-differential benefits the JPY and contributes to capping the upside.
The USD/JPY pair attracts some dip-buying near the 130.80-130.75 region on Thursday and builds on its steady intraday ascent through the early part of the European session. The pair, for now, seems to have stalled this week's rejection slide from the 100-day Simple Moving Average (SMA), though seems to struggle to capitalize on the momentum beyond mid-131.00s.
The US Dollar (USD) edges higher for the second successive day and looks to build on the overnight modest recovery from over a two-month low, which, in turn, acts as a tailwind for the USD/JPY pair. Apart from this, signs of stability in the equity markets undermine the safe-haven Japanese Yen (JPY) and lend additional support to the major. That said, rising bets for an imminent pause in the Federal Reserve's (Fed) rate-hiking cycle hold back the USD bulls from placing aggressive bets and cap gains for the pair.
Investors now seem convinced that the Fed is nearly done with its inflation-fighting interest rate hikes. In fact, the current market pricing indicates an even chance of a 25 bps lift-off at the May policy meeting and the possibility of rate cuts by year-end. The bets were reaffirmed by the disappointing release of the US ADP report on Wednesday, showing that private-sector employers added 145K jobs in March as compared to the 200K anticipated. The data suggested that the Fed's efforts to cool the labor market could be having some impact.
This, in turn, keeps the US Treasury bond yields depressed near their lowest level in seven months. This results in the narrowing of the US-Japan rate differential, which drives some flows towards the JPY and contributes to keeping a lid on any meaningful upside for the USD/JPY pair. Traders also seem reluctant ahead of the release of the closely-watched US jobs data, or the NFP report on Friday. In the meantime, the US Weekly Initial Jobless Claims might provide some impetus later during the early North American session on Thursday.
Technical levels to watch
-
10:13
USD/TRY: Speed of the depreciation has been accelerating recently, a warning sign – Commerzbank
USD/TRY has been depreciating continuously like pulled along by a piece of string since last autumn. Ulrich Leuchtmann, Head of FX and Commodity Research at Commerzbank, believes that the fact that the speed of the depreciation has been accelerating recently is a warning sign.
The longer it hisses, the louder the boom
“We have frequently referred to measures implemented by the Turkish central bank and government as being a mild form of capital controls. In view of the exchange rate developments, I come to the conclusion: everything all told this policy is working in a manner that is turning USD/TRY into a managed exchange rate. The issue with exchange rate management is: it does not work long term.”
“Bretton Woods, the currency snake, EMS I. All these attempts to control exchange rate developments came crashing down sooner or later. If the imbalances become unstable, things get worse the later the control fails. I, therefore, do not take too much of a risk if I project: that is going to happen to the control of the lira exchange rates at some point.”
“The development of the TRY exchange rate illustrates one thing: the fact that the speed of the depreciation has been accelerating recently is a warning sign.”
-
10:12
ECB’s Lane: May decision will depend on three factors
Delivering a university lecture in Cyprus, European Central Bank (ECB) Chief Economist Philip Lane said that the “May decision will depend on three factors.”
Additional comments
It will depend on the inflation outlook.
Then, we have to diagnose the underlying dynamic, not just the overall inflation rate.
And through that, assess how quickly inflation is going to fall.
Thirdly, is how quickly these interest rate increases are restricting the economy and bringing down inflation.
For these reasons, we have no longer indicated or pre-announced what the expectation is for the next meeting or for the upcoming meetings.
The focus should be on understanding every data point that comes in.
If, by the time of the May meeting, projections remain on track, then a rate hike will be appropriate.
Supply side of economy seen recovering in next couple of years.
Food is where inflation is at its most intense.
Sees big debate this year on services inflation.
Market reaction
Lane’s remarks fail to move the needle around the Euro, with EUR/USD keeping its range at around 1.0900. The pair almost unchanged on the day.
-
10:06
Japan’s PM Kishida: Not seeking imminent change in monetary policy
Japanese Prime Minister Fumio Kishida said on Thursday, he is “not seeking imminent change in monetary policy.”
Kyodo News Agency reported that PM Kishida will likely meet with incoming Bank of Japan (BoJ) Governor Kazuo Ueda on April 10, adding that the “incoming BoJ Governor Ueda is likely to confirm the intention to maintain current monetary easing for a while.”
Market reaction
At the time of writing, USD/JPY is holding steady at 131.35, unfazed by the above comments.
-
10:01
NZD/USD may struggle to move higher with resistance at 0.6390 – Citi
Economists at Citi analyze the NZD/USD and AUD/NZD pairs after the Reserve Bank of New Zealand 50 bps hike suprise.
The technical picture could lend weight to a lower AUD/NZD
“Post the surprise 50 bps hike by RBNZ, markets are currently pricing in around +25 bps by the July RBNZ meet, which would bring OCR to the RBNZ guidance for terminal rate of 5.5% at the February MPS. However, we think NZD/USD may struggle to move higher with resistance at 0.6390 (February 2023 highs), unless we see a strong print at the April 20 Q1 CPI (local) which supports the case for a higher terminal rate.”
“The technical picture could lend weight to a lower AUD/NZD as we are on track to close below strong AUD/NZD support at 1.0617-1.0612 (76.4% Fibonacci, March 2022 low, October 2021 high). If we see a weekly close below this level, we would complete a bearish outside week (as a continuation), which suggests an extension of the move, lower towards 1.0471.”
-
09:53
BoE DMP Survey: One-year CPI inflation expectations fall slightly
According to the latest Bank of England (BoE) Monthly Decision Maker Panel (DMP) survey released on Thursday, DMP members expected CPI inflation to be 5.8% one-year ahead, down from 5.9% in February.
Additional findings
“Three-year ahead CPI inflation expectations ticked up from 3.4% in February to 3.5% in March.”
“Over the next year, businesses expected their output prices to increase by an average of 5.3%, down 0.1 percentage points from the previous month. “
“The three-month average also fell by 0.1 percentage points to 5.5%, which is now 1.1 percentage points below its peak from September.”
“Expected year-ahead wage growth fell by 0.1 percentage points to 5.6% in March. Realised annual wage growth fell by a similar amount to 6.5%.”
Market reaction
GBP/USD was last seen trading at around 1.2450, modestly flat on the day.
-
09:45
EUR/USD: Recent Euro strength might be unsustainable – Commerzbank
Rate hikes come with undesirable side effects. Therefore, Ulrich Leuchtmann, Head of FX and Commodity Research at Commerzbank, is sceptical about current EUR/USD levels.
How much applause does one get for restrictive monetary policy?
“Perhaps my perceptions are distorted, but I have the impression that the Fed’s restrictive monetary policy has received more criticism. I now see that those who defend the restrictive Fed policy are coming under fire. Perhaps my perception is due to the fact that this is exactly what I had expected; that criticism of its fight against inflation will start as soon as Fed policy acts restrictively and actually dampens economic activity.”
“For the ECB the revision of expectations was moderate also because the real economic effects of past rate hikes are not yet being felt quite so significantly. With an unemployment rate at record lows Europe is lagging the cycle, if you want.”
“Because it can be assumed that the rate hikes will not remain without effects on the European economy and labour market either, I have my doubts that the recent EUR-strength is sustainable.”
-
09:41
EUR/USD looks vacillating around 1.0900
- EUR/USD attempts to consolidate Wednesday’s strong pullback.
- Construction PMI in Germany retreated markedly to 42.9 in March.
- US Initial Jobless Claims next on tap in the NA session.
The single currency alternates gains with losses amidst a narrow trading range vs. the dollar and motivates EUR/USD to keep business near the 1.0900 region on Thursday.
EUR/USD appears cautious ahead of Friday’s NFP
Following Wednesday’s sharp drop, EUR/USD now attempts some stabilization in the 1.0900 neighbourhood amidst the generalized prudent stance in the global markets and an equally flattish mood around the dollar.
Market participants, in the meantime, keep the cautious stance ahead of the release of the key US Nonfarm Payrolls on Friday (+240K exp.), while expectations for a 25 bps rate hike by the ECB and a pause at the Fed’s meeting in May appear unchanged for the time being.
In the domestic calendar, Germany’s Construction PMI dropped to 42.9 in March, while the same gauge in the broader Euroland eased to 45.0. Earlier in the session, Industrial Production in Germany expanded at a healthy 2.0% MoM in February.
In the US, the only release of note will be the usual weekly Initial Claims.
What to look for around EUR
EUR/USD clings to the 1.0900 region following the strong corrective decline seen in the previous session.
In the meantime, price action around the single currency should continue to closely follow dollar dynamics, as well as the incipient Fed-ECB divergence when it comes to the banks’ intentions regarding the potential next moves in interest rates.
Moving forward, hawkish ECB-speak continue to favour further rate hikes, although this view appears in contrast to some loss of momentum in economic fundamentals in the region.
Key events in the euro area this week: Germany, EMU Final Services PMI (Wednesday) – Germany Industrial Production, Germany/EMU Construction PMI (Thursday).
Eminent issues on the back boiler: Continuation, or not, of the ECB hiking cycle. Impact of the Russia-Ukraine war on the growth prospects and inflation outlook in the region. Risks of inflation becoming entrenched.
EUR/USD levels to watch
So far, the pair is losing 0.04% at 1.0898 and faces the next contention at 1.0788 (monthly low April 3) followed by 1.0745 (55-day SMA) and finally 1.0712 (low March 24). On the other hand, the surpass of 1.0973 (monthly high April 4) would target 1.1032 (2023 high February 2) en route to 1.1100 (round level).
-
09:31
United Kingdom S&P Global Construction PMI registered at 50.7, below expectations (53.5) in March
-
09:30
GBP/USD struggles for a firm intraday direction, flat-lines above mid-1.2400s
- GBP/USD seesaws between tepid gains/minor losses through the early European session.
- A combination of factors acts as a headwind for the USD and lends support to the major.
- The uncertainty over the BoE’s rate-hike path holds back bulls from placing fresh bets.
The GBP/USD pair attracts some dip-buying near the 1.2435 region on Thursday and for now, seems to have stalled this week's modest pullback from its highest level since June 2022. Spot prices climb nearly 50 pips from the daily low, albeit lacks follow-through and trade in neutral territory, around the 1.2465 zone during the early part of the European session.
The US Dollar (USD) struggles to capitalize on the overnight bounce from over a two-month low and attracts fresh sellers on Wednesday, which, in turn, is seen lending some support to the GBP/USD pair. Rising bets for an imminent pause in the Federal Reserve's (Fed) rate-hiking cycle turn out to be a key factor acting as a headwind for the Greenback. In fact, the current market pricing indicates an even chance of a 25 bps lift-off at the next FOMC meeting in May and the possibility of rate cuts by year-end.
The bets were reaffirmed by the disappointing release of the US ADP report on Wednesday, which showed that private-sector employers added 145K jobs in March as compared to 200K anticipated and the previous month's upwardly revised reading of 261K. Adding to this, the ISM Services PMI indicated a slowdown in growth during March, along with a deceleration in its Employment sub-index. The data suggested that the Fed's efforts to cool the labor market could be having some impact.
Meanwhile, expectations that the Fed is nearly done with its inflation-fighting interest rate hikes keep the US Treasury bond yields depressed near their lowest level in seven months. This, along with a stable performance around the equity markets, undermines traditional safe-haven assets, including the buck. The GBP/USD pair, however, fails to attract any meaningful buying and lacks bullish conviction amid mixed signals from the Bank of England (BoE) policymakers over the future rate-hike path.
Traders also seem reluctant to place aggressive directional bets and prefer to wait on the sidelines ahead of the release of the closely-watched US monthly jobs data - popularly known as NFP - on Friday. In the meantime, traders on Thursday will take cues from the UK Construction PMI and the US Weekly Initial Jobless claims data. This, along with the broader risk sentiment, might influence the USD price dynamics and produce short-term trading opportunities around the GBP/USD pair.
Technical levels to watch
-
09:15
Possible CAD losses to be limited on weak labour market report – Commerzbank
Market attention is likely to focus on today’s Canadian labour market report for March. Economists at Commerzbank analyze how employment figures could impact the Loonie.
What signals will the Canadian labour market data sending out?
“The market does not seem to expect further BoC rate hikes. Quite the opposite, the OIS rate expectations signal that rate cuts are being priced in as early as the second half of the year. A weak labour market report would confirm this view so that possible CAD losses are likely to be limited in this case.”
“If today’s data provides a mixed picture or if it points towards further labour shortages as well as the risk of rising wage pressure this is likely to dampen the expectation of imminent rate cuts. At the same time, it would ease possible concerns about a hard landing of the economy, so that the Loonie should be able to benefit.”
See – Canadian Jobs Preview: Forecasts from four major banks, employment may suffer a bit of retreat
-
08:53
Forex Today: US Dollar quiets down following Wednesday's rebound
Here is what you need to know on Thursday, April 6:
Markets stay relatively quiet early Thursday and the US Dollar Index moves up and down in a tight range below 102.00 following Wednesday's rebound. The US economic docket will feature weekly Initial Jobless Claims and Challenger Job Cuts data. St. Louis Federal Reserve President James Bullard will deliver a speech on the economy and monetary policy. Statistics Canada will release the March jobs report as well. Bond markets in the US will close early ahead of the Easter holiday on Friday and the trading action is likely to turn subdued later in the day.
Despite disappointing macroeconomic data releases from the US, the negative shift witnessed in risk mood amid growing concerns over an economic slowdown helped the US Dollar stay resilient against its rivals. In the early European session on Thursday, US stock index futures trade mixed. Meanwhile, the 10-year US Treasury bond yield stays in negative territory below 3.3%.
US private sector employment rises by 145K in March vs. 200K expected.
US: ISM Services PMI declines to 51.2 in March vs. 54.5 expected.
During the Asian trading hours, the data from China revealed that Caixin Services PMI improved to 57.8 in March from 55 in February, surpassing the market expectation of 54. This data, however, failed to trigger a noticeable market reaction.
EUR/USD turned south on renewed USD strength in the second half of the day on Wednesday and erased all the gains it recorded on Tuesday. Early Thursday, the pair fluctuates in a narrow channel slightly above 1.0900.
GBP/USD closed in negative territory after having met resistance at 1.2500 on Wednesday. The pair clings to modest recovery gains on Thursday but stays below 1.2500. The data from the UK showed that Halifax House Prices rose by 0.8% on a monthly basis in March, compared to maker expectation for a decrease of 0.3%.
The Unemployment Rate in Canada is forecast to tick up to 5.1% in March. Net Change in Employment is expected to arrive at +12K following February's 21.8K increase. Ahead of this key data, USD/CAD holds steady slightly below 1.3500.
Canadian Jobs Preview: Forecasts from four major banks, employment may suffer a bit of retreat.
Despite the USD's upbeat performance, USD/JPY closed in the red for the third straight day on Wednesday, pressured by falling US T-bond yields. At the time of press, the pair was flat on the day slightly below 131.50. In the early Asian session on Friday, Leading Economic Index and Coincident Index data for February will be featured in the Japanese economic docket.
Gold price lost its traction on Wednesday but closed the day virtually unchanged supported by retreating yields. XAU/USD stays in a consolidation phase below $2,020 on Thursday.
Bitcoin struggled to find direction and closed flat on Wednesday. BTC/USD continues to move sideways at around $28,000 on Thursday. Ethereum extended its rally and touched its highest level since August near $1,950 before staging a technical correction. As of writing, ETH/USD was down more than 1% on the day at $1,880.
-
08:53
Gold Price Forecast: XAU/USD in sight of a record high as investors seek safety – ANZ
On Wednesday, Gold extended gains amid concerns over global economic activity. The yellow metal eyes record high, economists at ANZ Bank report.
Renewed concerns of weak economic activity
“US ADP jobs missed the market, while the US March Services Index fell. This led a flight to safety, with the yield the two-year Treasury down 18 bps at one stage. However, the USD also gained, which crimped Gold’s appeal to investors.”
“Nevertheless, Gold remains in sight of a record high as investor seek safety on the back of elevated inflation.”
-
08:43
NZD/USD remains depressed below 0.6300 mark amid modest USD strength
- NZD/USD retreats further from a nearly two-month high amid some follow-through USD buying.
- Looming recession fears benefit the safe-haven Greenback and weigh on the risk-sensitive Kiwi.
- Bets for an imminent Fed rate-hike pause could cap the buck and help limit losses for the major.
The NZD/USD pair comes under heavy selling pressure on Thursday and extends the previous day's retracement slide from the 0.6400 neighbourhood, or its highest level since February 14. The pair maintains its offered tone through the early part of the European session and is currently placed just below the 0.6300 round-figure mark.
As investors digest the Reserve Bank of New Zealand's (RBNZ) surprise 50 bps rate hike on Wednesday, some follow-through US Dollar (USD) recovery from over a two-month low is seen exerting downward pressure on the NZD/USD pair. The incoming softer US macro data fuels concerns about a deeper global economic downturn and tempers investors' appetite for riskier assets. This, in turn, benefits the safe-haven Greenback and is seen weighing on the risk-sensitive Kiwi.
The USD uptick, however, is likely to remain capped amid growing acceptance that the Federal Reserve (Fed) is nearing the end of its rate-hiking cycle. In fact, the markets are currently pricing in an even chance of a 25 bps lift-off at the May FOMC policy meeting and see the possibility of rate cuts by year-end. The bets were lifted by the disappointing US ADP report on Wednesday, which showed that private-sector employers added 145K jobs in March against the 200K anticipated.
Moreover, the ISM Services PMI indicated a slowdown in growth during March, along with a deceleration in its Employment sub-index, suggesting that the Fed's efforts to cool the labor market could be having some impact. This, in turn, keeps the US Treasury bond yields depressed near their lowest level in seven months, which might hold back traders from placing aggressive bullish bets around the USD and help limit losses for the NZD/USD pair, at least for the time being.
Furthermore, this week's sustained breakout through a technically significant 200-day Simple Moving Average (SMA) favours bullish traders and supports prospects for the emergence of some dip-buying at lower levels. Hence, it will be prudent to wait for strong follow-through selling before confirming that the NZD/USD pair has formed a near-term top and positioning for any further losses ahead of the release of the closely-watched US monthly jobs data (NFP) on Friday.
Technical levels to watch
-
08:42
Natural Gas Futures: Room for further upside
Open interest in natural gas futures markets extended the uptrend for yet another session on Wednesday, this time by more than 1K contracts according to preliminary readings from CME Group. On the other hand, volume shrank for the second session in a row, now by nearly 36K contracts.
Natural Gas: No changes to the consolidative theme
Prices of natural gas added to the previous session’s gains on Wednesday amidst rising open interest and is supportive of extra gains in the very near term. However, the persistent decline in volume could remove strength to that view and should leave the ongoing consolidation theme well in place for the time being.
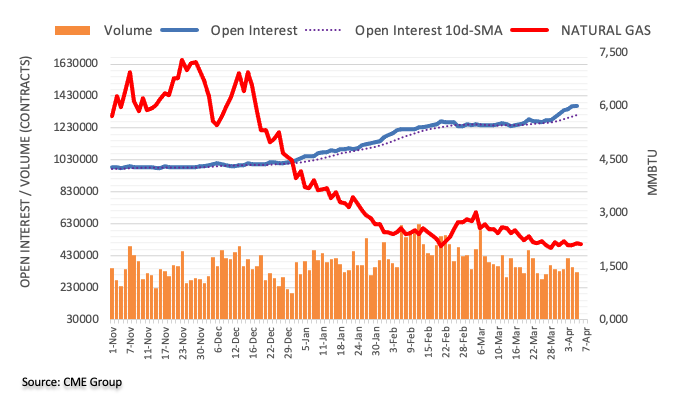
-
08:33
USD Index to hover around 102.00 into Friday's US NFP report – ING
Despite another sharp drop in US short-dated yields yesterday, the Dollar actually rallied. Economists at ING expect the US Dollar Index (DXY) to hover around 102.00 today.
Any sharp rise in initial jobless claims could slightly soften the Dollar
“Another big drop in short-dated US yields yesterday did not carry the Dollar to a new low. Either short Dollar positioning is too heavy or – as we like to think – investors feel it is too early to default to a 'buy risk, sell Dollars' mentality given what could be further skeletons in the banking closet.”
“Any sharp rise in initial jobless claims could slightly soften the dollar today, plus we will be watching for comments from Fed's James Bullard. Does the Fed need to hike one last time in May?”
“DXY to hover around 102.00 into tomorrow's US March jobs report.”
-
08:21
USD/INR: Firm cap around 83.00, move toward the 200-DMA at 81.24 on the cards – TDS
In a surprise decision, the Reserve Bank of India (RBI) kept its repo rate unchanged at 6.50%. Economists at TD Securities continue to be biased towards further INR gains, with a firm cap on USD/INR around 83.00.
RBI will begin to ease by end-2023
“RBI kept its repo rate unchanged at 6.50% in a unanimous decision. RBI also maintained its ‘withdrawal of accommodation stance’. RBI also lowered its forecasts for CPI inflation slightly to 5.2% in fiscal year 2024 from 5.3% and raised its FY 24 growth forecast to 6.5% from 6.4%.”
“We now think that 6.50% marks the terminal rate for the Bank. We maintain our view that the RBI will begin to ease by end-2023, but we may need to push back easing expectations.”
“We continue to be biased towards further INR gains, with a firm cap on USD/INR around 83.00 in place and a likely move towards the 200-Day Moving Average around 81.24.”
-
08:17
Silver Price Analysis: XAG/USD trades with minor losses, bullish potential seems intact
- Silver edges lower for the second successive day, albeit lacks follow-through selling.
- The technical setup favours bullish traders and supports prospects for further gains.
- Dips could be seen as a buying opportunity near the $24.40-30 resistance breakpoint.
Silver trades with a mild negative bias for the second successive day on Wednesday, though the lack of follow-through selling warrants some caution for aggressive bearish traders. The white metal manages to hold above the overnight swing low and hovers around the $24.80-$24.85 region during the early European session.
From a technical perspective, the downtick could be solely attributed to some profit-taking amid a slightly overbought Relative Strength Index (RSI) on the daily chart. That said, this week's sustained move and acceptance above the $24.30-$24.40 strong horizontal barrier was seen as a fresh trigger for bulls. Moreover, the XAG/USD, so far, has managed to hold its neck above the previous YTD peak, around the $24.65 zone, and seems poised to prolong its recent upward trajectory witnessed over the past month or so.
Hence, any further pullback is likely to attract fresh buyers and remain limited near the $24.40-$24.30 resistance breakpoint, now turned support. The said area should now act as a pivotal point, which if broken decisively might prompt some technical selling and make the XAG/USD vulnerable to weaken below the $24.00 mark, towards testing the weekly low, around the $23.60-$23.55 area. The corrective decline could get extended further towards the $23.15 intermediate support en route to the $23.00 round-figure mark.
Bullish traders, meanwhile, might now wait for some follow-through buying beyond the $25.10-$25.15 region, or a nearly one-year high touched on Wednesday, before placing fresh bets. The XAG/USD might then aim to surpass an intermediate barrier near the $25.35-$25.40 zone and reclaim the $26.00 round-figure mark for the first time since April 2022. The next relevant hurdle is pegged near the $26.20 area ahead of the $26.40-$26.50 region and the 2022 swing high, just ahead of the $27.00 round-figure mark.
Silver daily chart
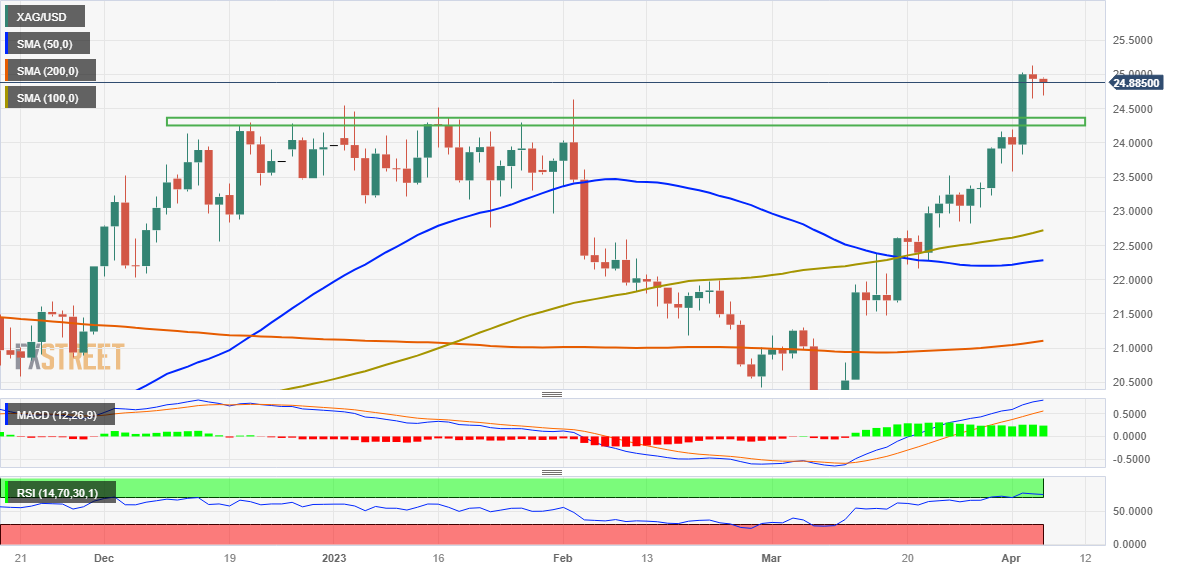
Key levels to watch
-
08:15
Crude Oil Futures: Further correction on the cards
Considering advanced prints from CME Group for crude oil futures markets, open interest increased by around 21.4K contracts on Wednesday, reaching the sixth consecutive daily build. Volume, instead, went down for the second straight session, this time by nearly 223K contracts.
WTI: To fill or not to fill the gap?
Crude oil prices gave away some gains on Wednesday amidst rising open interest, which is suggestive that further retracement appears likely in the very near term. Against that, it remains to be seen whether the WTI could fill Monday’s upside gap in response to the OPEC+ decision. On this, the next support is seen at $75.68 (daily high March 31).
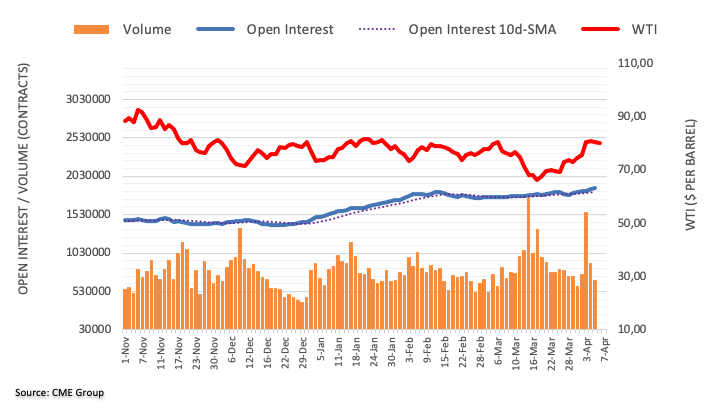
-
08:03
Switzerland Foreign Currency Reserves dipped from previous 771B to 743B in March
-
08:02
Austria Trade Balance down to €-2097.8M in January from previous €-1358.1M
-
08:01
Austria Wholesale Prices n.s.a (YoY) dipped from previous 10.2% to -0.4% in March
-
08:01
Austria Wholesale Prices n.s.a (MoM): -0.8% (March) vs previous -0.5%
-
07:59
NZD/USD: BNZ staunchness is adding to carry and giving the Kiwi a hand – ANZ
The Kiwi was unable to sustain yesterday’s post-RBNZ bounce. But as economists at ANZ Bank note, NZ has the highest cash rate in the G10 again; that’s good for carry.
Carry is back
“It isn’t something local that pulled it back; rather it was a rebound in the Dollar and likely safe-haven buying going into the long weekend. We say that because US bond yields slumped further and data there slowed, but the USD DXY still bounced.”
“Local recession fears have lifted following the RBNZ’s 50-pointer yesterday, but equally, stern action should stem any lingering inflation concerns. That’s a less straightforward picture for the Kiwi, but carry is back, and NZ now has the highest G10 cash rate once more.”
“Support 0.5750/0.5900/0.6090 Resistance 0.6540/0.6675.”
-
07:56
EUR/GBP seesaws near 0.8750 despite upbeat German Industrial Production
- EUR/GBP retreats from intraday high during six-day downtrend.
- German Industrial Production YoY for February arrives better than expected and prior.
- Brexit optimism, comparatively upbeat UK data and hawkish BoE talks previously teased bears.
- ECB policymakers keep advocating further rate hikes even as recession fears loom.
EUR/GBP fails to cheer upbeat German data for long during early Thursday as it reverses from the intraday top to around 0.8745 by the press time. In doing so, the cross-currency pair drops for the sixth consecutive day and remains on the way to posting the second consecutive weekly loss as traders brace for the holidays in the bloc.
Germany’s Industrial Production (IP) rose 0.6% YoY in February versus -2.7% market forecasts and -1.6% previous readings. The monthly figures also came in firmer than 0.1% expected, to 2.0% versus 3.7% prior.
Today’s German data traces the previous day’s mostly upbeat figures for the European powerhouse, as well as for the old continent, and allow the Euro buyers to cheer the recently hawkish comments from the European Central Bank (ECB) officials. However, the broad risk-off mood and recession fears underpin the US Dollar’s demand and weigh on the shared currency.
On Wednesday, Germany Factory Orders improved to -5.7% YoY for February from -12.0 revised down prior and -10.5% market forecasts while the MoM growth came in at 4.8% compared to 0.3% expected and 0.5% previous readings. It’s worth noting that Germany’s final readings of S&P GlobalBME Composite PMI for March confirmed 52.6 initial estimations while Services PMI eased to 53.7 versus 53.9 flash forecasts. On a broader front, Eurozone S&P Global Composite PMI eased to 53.7 in March versus 54.1 first readings whereas Services PMI also declined to 55.0 during the stated month from 55.6 preliminary forecasts.
Following the data, ECB policymaker Boris Vujčić said on Wednesday, “The largest part of the rate-hiking cycle is behind us.” The ECB official also added that “to address core inflation, we might need to raise rates further.”
It’s worth noting, however, that the Brexit optimism and the UK’s mixed PMIs seem to challenge the EUR/GBP buyers.
The UK’s final readings of S&P Global/CIPS Composite and Services PMIs for March came in mixed as the former confirmed the initial estimations of 52.2 but the key Services gauge improved to 52.9 from 52.8 initial forecasts.
Talking about Brexit, “A new model will be announced later on Wednesday to ‘reduce the need for checks for many types of goods,’” said Sky News while citing an anonymous UK Cabinet Office source speaking on the post-Brexit checks on goods coming to the UK from the European Union (EU).
Moving on, second-tier Eurozone data can entertain EUR/GBP pair traders ahead of a Good Friday break. With this, the cross-currency pair may witness further consolidation of previous losses but the bulls need strong reasons to return.
Technical analysis
Despite the latest rebound, EUR/GBP buyers need to cross a three-week-old previous support line, now immediate resistance near 0.8770, to retake control. Until then, the bears appear to keep the reins and aim for the 11-week-old horizontal support area surrounding 0.8720.
-
07:49
Gold Futures: Consolidation ahead of further gains
CME Group’s flash data for gold futures markets noted traders scaled back their open interest positions by just 285 contracts on Wednesday, reversing two daily builds in a row. Volume followed suit and shrank by around 35.7K contracts after two consecutive daily upticks.
Gold: A move to $2070 remains on the cards
Gold charted an inconclusive session on Wednesday amidst shrinking open interest and volume and exposes the resurgence of some range bound theme in the very near term. The underlying bullish tone, however, appears unchanged and the precious metal continues to target the 2022 high at $2070 per ounce troy (March 8).
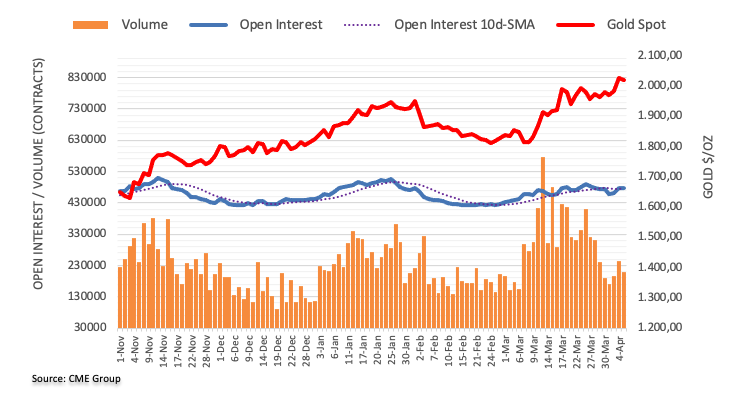
-
07:47
USD/INR: Temporary setback for the Rupee after RBI pauses in a surprise decision – Standard Chartered
USD/INR has scaled firmly above 82.00 after the Reserve Bank of India (RBI) kept its repo rate unchanged at 6.5%. However, economists at Standard Chartered continue to see downside risks to USD/INR in the near term.
The repo rate has peaked
“India’s Monetary Policy Committee (MPC) kept the repo rate unchanged at 6.5% in a surprise decision. The unanimity to pause was another surprise.”
“We had expected the repo rate to peak at 6.75%. However, with today's pause, we believe the repo rate has peaked. The MPC is unlikely to see the need to hike further unless inflation once again moves above or closer to the upper threshold of the mandated band of 2-6% (with 4% the medium-term target). If such a scenario arises, the monetary policy hiking cycle may resume, beyond just one hike of 25 bps.”
“The INR reacted slightly negatively to the surprise policy decision, with USD/INR spot rising by c.0.2%. Nevertheless, we see this as a temporary setback for the INR. Given the improvement in India’s trade balance and broad USD weakness, we see rising downside risks to USD/INR in the near term.”
-
07:36
USD Index extends the rebound and flirts with 102.00
- The index adds to Wednesday’s uptick and approaches 102.00.
- The downtrend in US yields remain unabated for the time being.
- Initial Jobless Claims will be in the limelight later in the NA session.
The greenback, when measured by the USD Index (DXY), maintains the bid tone for the second session in a row and trades closer to the 102.00 neighbourhood on Thursday.
USD Index looks at data, risk trends
The index advances further after bottoming out in the 100.40 region on Wednesday, helped at the same time by further loss of momentum in the risk-linked galaxy.
In the meantime, US yields remain well on the defensive and extend the leg lower to new multi-session lows across the curve against the backdrop of renewed recession concerns and speculation that the Fed might pause its hiking cycle as soo as at the May meeting.
Later in the session, usual weekly Claims will take centre stage along with the speech by St. Louis Fed J. Bullard (2025 voter, hawk).
What to look for around USD
Price action around the index appears reinvigorated as of late and now retargets the 102.00 region against the backdrop of increasing cautiousness among market participants ahead of the release of US Nonfarm Payrolls in the second half of the week.
Also weighing on the current bearish outlook for the dollar emerges the almost omnipresent view that the Federal Reserve could make an impasse in its current tightening bias in May, which has been propped up by persevering disinflation, nascent weakness in some key fundamentals and fresh concerns surrounding the banking sector
In addition, dwindling hawkishness from Fed rate setters also seems to have removed some strength from the greenback, particularly since the latest FOMC gathering and events around SVB and other medium-size US lenders.
Key events in the US this week: Initial Jobless Claims (Thursday) – Non-Farm Payrolls, Unemployment Rate, Consumer Credit Change (Friday).
Eminent issues on the back boiler: Persistent debate over a soft/hard landing of the US economy. Terminal Interest rate near the peak vs. speculation of rate cuts in 2024. Fed’s pivot. Geopolitical effervescence vs. Russia and China. US-China trade conflict.
USD Index relevant levels
Now, the index is advancing 0.07% at 101.95 and faces the next resistance level at 103.05 (monthly high April 3) seconded by 103.86 (100-day SMA) and then 105.11 (weekly high March 15). On the other hand, the breach of 101.43 (monthly low April 5) would open the door to 100.82 (2023 low February 2) and finally 100.00 (psychological level).
-
07:34
Canadian Jobs Preview: Forecasts from four major banks, employment may suffer a bit of retreat
Canada’s employment data for February will be reported by Statistics Canada on Thursday, April 6 at 12:30 GMT and as we get closer to the release time, here are forecasts from economists and researchers at four major banks regarding the upcoming jobs figures.
The North American economy is expected to have added 12K jobs after creating 21.8K positions in February. The unemployment rate is expected to rise a tick to 5.1% while the Participation Rate is expected to have remained stable at 65.7%.
TDS
“We look for employment to fall by 12K, unwinding a small portion of recent strength, with UE rising 0.2pp to 5.2% as wage growth firms to 5.5% YoY.”
NBF
“The job market has been extraordinarily strong recently, with headcounts expanding by 350K over the past six months. And while signs of an upcoming reversal remain few and far between, we think such a pace is unsustainable in the medium term. We thus expect more modest gains in the coming months, starting with a 10K result in March. Despite this gain, and assuming that the participation rate remained unchanged at 65.7%, the unemployment rate could still increase by one tenth to 5.1%, the result of yet another sharp expansion of the labor force.”
CIBC
“We expect to see a modest decline in employment during March (-10K), although that would still leave a very positive underlying trend, as measured by 3 and 6-month averages. A slight tick down in the participation rate as well is expected to limit the impact that the expected weak employment figure has on the jobless rate, as we see that rising by only one tick to 5.1%. Wage growth should be less volatile now that we are past the comparisons to lockdown periods in 2022, although that’s also likely to mean little deceleration from last month’s 5.5% pace.”
Citi
“After a few months of very strong employment gains, we expect a modest 10K drop in employment in the labor force survey in March, although with risks tilted to the upside due to strong population growth from immigration. An eventual contraction in activity later this year alongside slowing in the US which should result in job losses, but even in this scenario, the rise in unemployment could be relatively muted. Expectation for modest job loss in March would imply an increase in the unemployment rate to a still-low 5.2%.”
-
07:25
USD/CAD Price Analysis: Bulls need acceptance from 1.3520 hurdle and Canada Employment data
- USD/CAD extends recovery from seven-week low, grinds higher of late.
- Convergence of previous support line from June 2022, 100-day EMA challenges Loonie pair’s recovery.
- 38.2% Fibonacci retracement level, five-month-old ascending trend line lures sellers.
- Canada’s monthly employment data for March bears downbeat forecasts and can weigh on prices.
USD/CAD refreshes intraday high near 1.3485 as it pares the weekly gains during a three-day uptrend on early Thursday. The pair’s latest run-up could be linked to a pre-data consolidation amid broad US Dollar strength ahead of the employment data from Canada and the US.
Also read: USD/CAD bulls eye 1.3500 on softer Oil price, firmer US Dollar, focus on Canada employment data
In doing so, the Loonie pair extends Tuesday’s U-turn from the 38.2% Fibonacci retracement of its upside from June-October 2022. The quote’s recovery also takes clues from the latest rebound in the RSI (14) from below 50 levels.
However, a convergence of the 100-day Exponential Moving Average (EMA) and a 10-month-old support-turned-resistance line, around 1.3520 at the latest, appears a tough nut to crack for the Loonie pair buyers.
In a case where the USD/CAD price remains firmer past 1.3520, it can rise towards the 23.6% Fibonacci retracement level of 1.3635 and then to the December 2022 peak of 1.3700.
On the flip side, a downside break of the stated 38.2% Fibonacci retracement level of 1.3425 can restrict the short-term USD/CAD downside.
If the USD/CAD breaks 1.3425 support, an upward-sloping support line from mid-November 2022, around 1.3300 by the press time, can act as the last defense of the USD/CAD buyers.
Overall, USD/CAD is likely to witness a pullback unless bulls manage to cross the 1.3520 hurdle and see welcome data from Statistics Canada.
USD/CAD: Daily chart
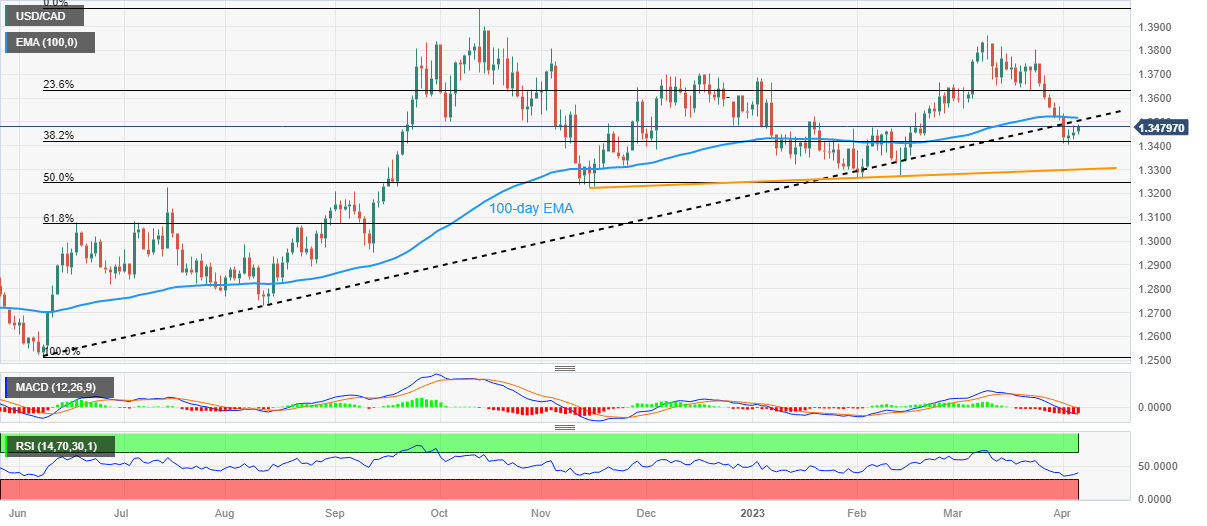
Trend: Limited recovery expected
-
07:24
USD/IDR: Rupiah to enjoy gains supported by its resilient current account balance – MUFG
The Indonesian Rupiah registered gains against the US Dollar in March. Economists at MUFG Bank see some gains from the IDR if commodity prices improve from current levels.
BI likely to maintain its monetary policy for the rest of the year
“The current account may stay insulated by H2-2023 if commodity prices improve and export demand from Asia and China increase. Besides, the recovery in tourism is likely to help maintain a relatively stable services balance.”
“The economy is expected to receive net portfolio investment inflows as yield differentials between the US and Indonesia are unlikely to narrow further. This comes as BI is likely to maintain its monetary policy for the rest of the year.”
“We forecast USD/IDR at 15,000 by the end of Q2 and 14,400 by Q1-2024.”
-
07:24
US Dollar responding less to yield-gap compression – Standard Chartered
Steve Englander, Standard Chartered’s head of research for global Group-of-10 currencies, wrote in a note to clients, despite the decline in the US Treasury bond yields against its global peers, the US Dollar has stood resilient due to its safe-haven demand.
Key quotes
“A week ago, the USD was still responding to risk appetite and spreads, in line with the prior three months.”
“Now, the USD does not seem to be responding much to the compression in spreads.”
“We suspect that increasing concern about where the USD is positioned on the ‘dollar smile’ curve is diluting the impact of the USD’s much-reduced yield advantage.”
“The fear is that deteriorating growth and financial instability will lead to safe-haven USD demand, offsetting any yield moves.”
-
07:15
AUD/USD skids below 0.6700 amid Sino-US tensions over Taiwan, US NFP hogs limelight
- AUD/USD has surrendered the immediate support of 0.6700 as US-China tension has strengthened the risk-off mood.
- Federal Reserve to remain steady amid deepening US recession fears and cooling US labor market.
- Reserve Bank of Australia has kept doors open for more rate hikes in case Australian inflation continues to remain persistent.
- AUD/USD is auctioning in a Rising Channel chart pattern, however, weak momentum could weaken the Australian Dollar.
AUD/USD has surrendered the round-level support of 0.6700 in the early European session. The Aussie asset is declining towards Wednesday’s low at 0.6675 as deepening United States-China tensions over Taiwan have trimmed the risk appetite of the market participants. US’s promise of delivering arms to Taiwan on a timely basis and strengthening economic cooperation on trade and technology has made China uneasy.
China’s Foreign Ministry Spokesperson made an allegation against the US after the commentary from US House of Representatives Speaker Kevin McCarthy for breaking commitment over the Taiwan issue. The event has triggered volatility for the Australian Dollar. It is worth noting that Australia is the leading trading partner of China and the deterioration of US-China relations would have a cascading effect on the Australian Dollar.
Escalating US-China tensions have trimmed the appeal for risk-perceived assets. S&P500 futures have stretched losses on expectations that US-China tensions could lead to some sanctions on the dragon economy. US equities have been registering bearish settlements for the past two trading sessions amid evidence of a slowdown in the US economy.
The US Dollar Index (DXY) looks firm above 102.00 and is expected to extend its recovery further. However, the slowing US labor market could restrict its upside. The demand for US government bonds is recovering quickly in hopes that the Federal Reserve (Fed) will consider an early pause to the policy-tightening spell. This has dragged 10-year US Treasury yields to near 3.29%.
Signs of cooling US labor strengthen amid lower job additions
On Wednesday, the US Automatic Data Processing (ADP) agency reported a decline in the number of job additions in the month of March. The US economy added 145K jobs in March, significantly lower than the estimates of 200K and the former release of 242K. Firms have slowed down their hiring process amid rising interest rates by the Federal Reserve (Fed) and a bleak economic outlook. A slowdown in the recruitment process after the release of weak Job Openings data indicates that the US labor market has started cooling off and chances are solid of an escalation in the Unemployment Rate ahead.
However, investors will get more clarity about the labor market condition after the release of the US Nonfarm Payrolls (NFP) data, which is scheduled for Good Friday. As per the consensus, the jobless rate is seen unchanged at 3.6%. An economic indicator that could prompt US consumer inflation expectations is the Average Hourly Earnings data. The street is anticipating a deceleration in the annual labor cost index to 4.3% from the former release of 4.6%. However, monthly wage data could accelerate by 0.3% against the former increment of 0.2%.
Reserve Bank of Australia opens gates for further rate hikes
Considering the current monetary policy as restrictive enough to tame stubborn inflation, the Reserve Bank of Australia (RBA) kept interest rates unchanged at 3.6% in its monetary policy meeting on Tuesday. However, Reserve Bank of Australia Governor Philip Lowe has kept doors open for more rate hikes in case Australian inflation continues to remain persistent. It is worth noting that Australia’s monthly Consumer Price Index (CPI) has softened quickly to 6.8% from the peak of 8.4% recorded in December.
AUD/USD technical outlook
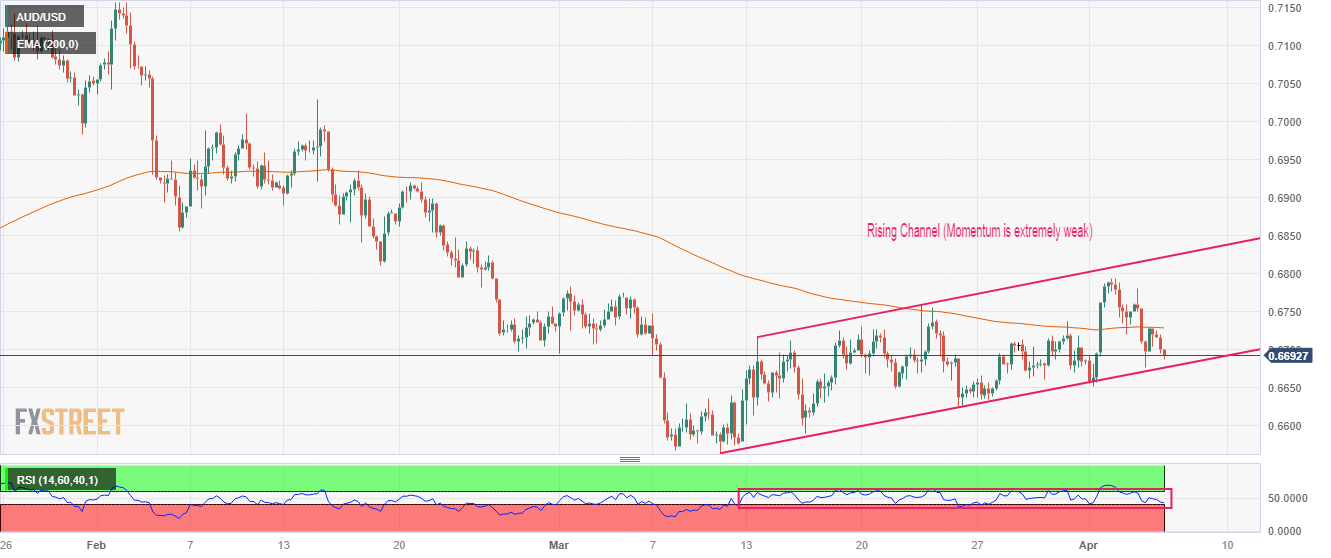
AUD/USD is auctioning in a Rising Channel chart pattern on a four-hour scale in which every corrective move is capitalized as a buying opportunity by investors. However, lack of momentum in the aforementioned chart pattern is advocating a downside move in the Aussie asset ahead.
The Australian Dollar has failed in keeping the asset above the 200-period Exponential Moving Average (EMA) at 0.6730, which indicates that the long-term trend is bearish.
Meanwhile, the Relative Strength Index (RSI) (14) is oscillating in the 40.00-60.00 range, indicating a consolidation. A scenario of slipping into the bearish range of 20.00-40.00 is highly likely.
Going forward, a break below April 03 low at 0.6650 will expose the Aussie asset to the round-level support at 0.6600. A crackdown below the round-level support would further drag the asset toward March 10 low at 0.6564.
Alternatively, downside bias for the Aussie asst would vanish if it manages to climb above April 03 high around 0.6800. An occurrence of the same will drive the asset toward February 23 high at 0.6842 followed by February 13 low at 0.6890.
-
07:02
German Industrial Production rises 2.0%% MoM in February vs. 0.1% expected
Industrial Production in Germany slowed its pace of increase in February, the official data showed on Thursday, suggesting that the manufacturing sector recovery is losing steam yet again.
Eurozone’s economic powerhouse’s Industrial Output rose by 2.0% MoM, the federal statistics authority Destatis said in figures adjusted for seasonal and calendar effects, vs. 0.1% expected and 3.5% prior.
On an annualized basis, German Industrial Production arrived at 0.6% in February versus a -1.6% figure booked in January and -2.7% market expectations.
FX implications
The shared currency is recovering losses to trade neutral at 1.0900 on the upbeat German industrial figures.
-
07:02
Germany Industrial Production n.s.a. w.d.a. (YoY) above forecasts (-2.7%) in February: Actual (0.6%)
-
07:01
United Kingdom Halifax House Prices (YoY/3m) came in at 1.6%, below expectations (4.6%) in March
-
07:01
Germany Industrial Production s.a. (MoM) came in at 2%, above forecasts (0.1%) in February
-
07:00
Sweden Industrial Production Value (YoY) increased to 4.9% in February from previous 3.5%
-
07:00
Sweden Industrial Production Value (MoM) dipped from previous 2.6% to 0.6% in February
-
07:00
Sweden New Orders Manufacturing (YoY) below expectations (7.2%) in February: Actual (-4.7%)
-
06:59
Gold Price Forecast: XAU/USD could witness a profit-taking decline amid repositioning ahead of key US NFP
Gold price is correcting from the highest level since March 2022 reached at $2,032 on Wednesday. XAU/USD could see dip-buying following a pennant breakout on the 1D chart, FXStreet’s Dhwani Mehta reports.
Pre-US NFP repositioning could sideline XAU/USD buyers
“Gold price is retreating toward the $2,000 mark, below which the pennant resistance-turned-support at $1,988 will be challenged. The next critical line of defense for Gold buyers is seen at the confluence of Tuesday’s low and the pennant support near $1,975.”
“Should Gold bulls jump back into the game, the upside would resume toward the $2,020 figure. Bulls will then reattempt the yearly top at $2,032. Acceptance above the latter is needed to make fresh headways toward the pennant target measured at $2,043. However, the Gold price action is likely to remain choppy ahead of Friday’s US Nonfarm Payrolls data.”
See – Gold Price Forecast: XAU/USD to eye $2,300 on a sustained break above $2,070/75 record highs – Credit Suisse
-
06:52
WTI crude oil slides to $80.00 as sour sentiment underpins US Dollar rebound
- WTI fades bounce off intraday low, down for the second consecutive day to pare weekly gains around multi-day top.
- Fears emanating from China, North Korea join recession woes to favor US Dollar’s haven demand.
- Easy inventory draw adds strength to pullback moves.
- OPEC+ supply cut, downbeat US statistics keep Oil buyers hopeful.
WTI crude oil drops for the second consecutive day after refreshing a seven-week high, down 0.50% near $79.95 heading into Thursday’s European session. In doing so, the black gold justifies the US Dollar’s corrective bounce amid sour sentiment to trim gains during the third consecutive weekly uptrend.
US Dollar Index (DXY) rises 0.12% intraday to 102.00 as it extends the previous day’s rebound from a two-month low despite the recent dovish shift in the Fed bets and downbeat US data. The reason for the US Dollar’s latest rebound could be linked to the market’s fears of a recession in the world’s largest economy after the US employment clues have been extremely downbeat.
Apart from the recession fears, the US-China tension about a likely meeting between US House of Representatives Speaker Kevin McCarthy and Taiwanese President Tsai Ing-Wen also weighs on the sentiment and allow the US Dollar to grind high. On the same line is the latest nuclear warning from North Korea as the US and South Korea hold joint military drills.
On a different page, a lesser-than-previous inventory draw also weighs on the WTI crude oil prices. That said, the weekly stockpile data from the US Energy Information Administration (EIA) marked -3.739M figure versus -2.329M market forecasts and -7.489M prior. Previously, the American Petroleum Institute (API) also flashed downbeat inventory data for the week ended on March 31, -4.346M versus -6.076M prior.
Alternatively, the OPEC+ supply cut and the market’s bets on no Fed action in May month may seem to put a floor under the Oil prices.
Amid these plays, S&P 500 Futures drop for the third consecutive day even if the benchmark US Treasury bond yields remain sluggish around the multi-day bottom.
Moving on, the second-tier US data may entertain Oil traders ahead of Friday’s all-important Nonfarm Payrolls (NFP).
Technical analysis
A clear downside break of a fortnight-old support line, around $79.40 at the latest, becomes necessary for the WTI crude oil bears to return to the table.
-
06:45
Switzerland Unemployment Rate s.a (MoM) in line with expectations (1.9%) in March
-
06:19
EUR/USD Price Analysis: H&S confirmation favors Euro bears around 1.0890
- EUR/USD holds lower ground after confirming a bearish chart formation, sidelined of late.
- Recovery remains elusive below 1.0950 even as MACD signals test Euro sellers of late.
- 200-HMA, fortnight-old support line can act as intermediate halt during theoretical south-run targeting 1.0790.
EUR/USD prints mild losses around 1.0890 during the two-day downtrend heading into Thursday’s European session. In doing so, the Euro pair extends the previous day’s pullback from a two-month high after confirming a bearish “Head and Shoulders” (H&S) chart pattern on the hourly play.
It’s worth noting, however, that a light calendar and receding strength of the bearish MACD signals seem to challenge the EUR/USD sellers of late.
The Euro pair remains on the bear’s radar unless crossing the 1.0900 support-turned-resistance, comprising the neckline of the stated H&S formation.
Following that, a one-week-old ascending resistance line around 1.0950 can act as the last defense of the EUR/USD bears before targeting the latest swing high of 1.0975.
Should the EUR/USD buyers keep the reins past 1.0975, the 1.1000 psychological magnet and the Year-To-Date (YTD) high of 1.1033 will be in focus.
Alternatively, the 200-Hour Moving Average (HMA) precedes a two-week-long ascending trend line to restrict short-term EUR/USD downside around 1.0865 and 1.0830 in that order.
It’s worth observing that the H&S confirmation flashes the theoretical target of 1.0790 which is near the weekly bottom.
Hence, EUR/USD is well-set for further declines despite the latest inaction.
EUR/USD: Hourly chart
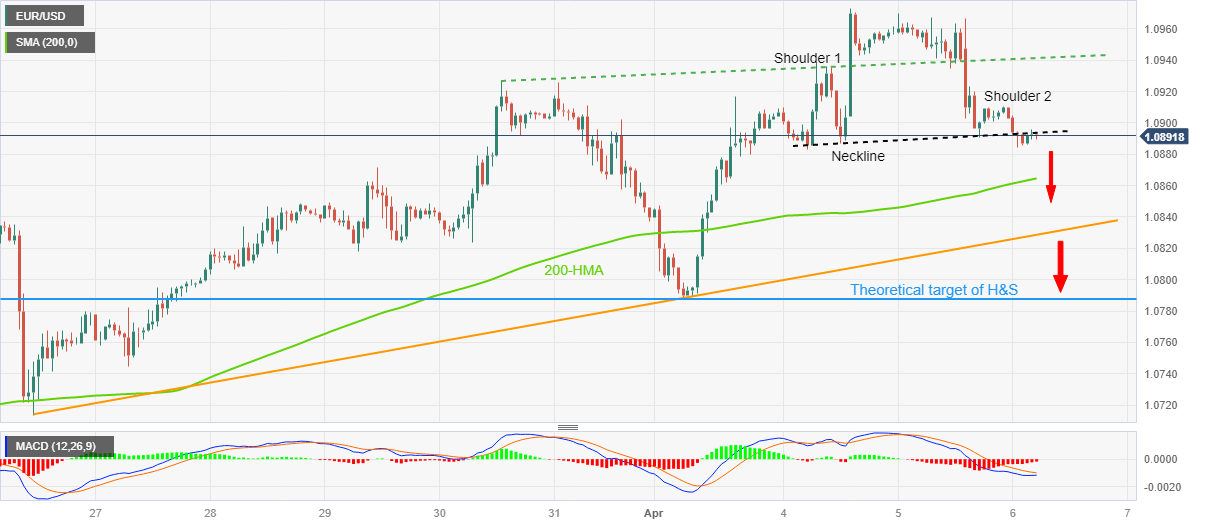
Trend: Further downside expected
-
06:19
India Reverse Repo Rate remains unchanged at 3.35%
-
06:08
Gold Price Forecast: XAU/USD eyes $2,000 as US-China tensions improve US Dollar’s appeal, US NFP in focus
- Gold price is likely to continue its downside move till $2,000.00 as US Dollar’s safe-haven appeal has improved.
- Slowing economic activities due to higher interest rates by the Fed are responsible for a recession in the US economy.
- Fed Mester advocates rates above 5% this year and holding them at restrictive levels for some time to quell inflation.
Gold price (XAU/USD) has dropped firmly to near $2,010.00 in the early European session. The precious metal is likely to attract more offers and may find a cushion near the psychological support of $2,000.00 ahead. The downside bias for the Gold price has stemmed from geopolitical tensions between the United States and China.
China seems uneasy about arms support to Taiwan from the United States. In retaliation, a Chinese Foreign Ministry spokesperson said China will take resolute and effective measures to safeguard national sovereignty, and territorial integrity. This has spooked the market sentiment and risk-sensitive assets have taken the bullet.
The US Dollar Index (DXY) is making efforts in keeping its business above 102.00. Meanwhile, the 10-year US Treasury yields have slipped below 3.3% again on expectations that the labor market is not extremely tight anymore.
Apart from the softening of the US labor market, the anticipation of a recession has strengthened further. Slowing economic activities due to higher interest rates by the Federal Reserve (Fed) are responsible for a recession in the US economy.
The street is expecting a neutral stance from Fed chair Jerome Powell for May’s monetary policy, however, Cleveland Fed Bank President Loretta Mester said policymakers should move their benchmark rate above 5% this year and hold it at restrictive levels for some time to quell inflation, as reported by Bloomberg.
Gold technical analysis
Gold price has challenged the immediate support plotted from Wednesday’s low at $2,010.88 on an hourly scale. The precious metal has slipped sharply below the 20-period Exponential Moving Average (EMA) at $2,017.18 while the 50-period EMA at $2,011.36 is providing cushion to the Gold bulls.
The Relative Strength Index (RSI) (14) has found support near 40.00. A case of a breakdown below the same would activate the bearish momentum.
Gold hourly chart
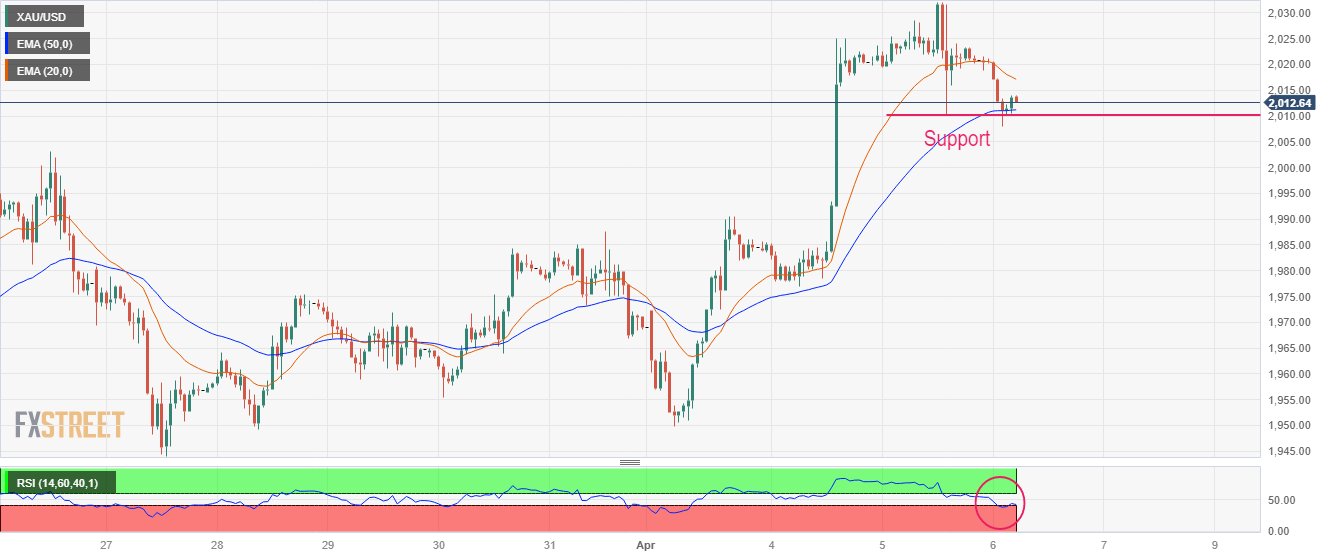
-
05:51
USD/CHF Price Analysis: Recovery approaches support-turned-resistance around 0.9080
- USD/CHF picks up bids to extend the previous day’s rebound from 22-month low.
- Upside break of weekly resistance line, looming bull cross on MACD favor Swiss Franc sellers.
- Two-month-old previous support line appears crucial for USD/CHF bulls; 100-SMA acts as the last defense of bears.
USD/CHF lures buyers around 0.9075 as it pierces a downward-sloping resistance line from Monday amid early Thursday in Europe. In doing so, the Swiss Franc (CHF) pair extends the previous day’s recovery moves from the lowest levels since June 2021 amid a sluggish session.
That said, a clear upside break of the immediate resistance line joins an impending bull cross on the MACD to lure USD/CHF buyers. However, the previous support line from early February, around 0.9080 by the press time, challenges the quote’s recovery.
Should the USD/CHF pair remains firmer past 0.9080, a one-month-old resistance line, around 0.9155, precedes the 100-SMA level of around 0.9190 to act as the last defense of the pair sellers.
In a case where the quote rises past 0.9190, and also crosses the 0.9200 round figure, it can aim for the mid-March high of 0.9342.
Meanwhile, the immediate resistance-turned-support line near 0.9070 restricts the immediate downside of the USD/CHF price ahead of the latest bottom surrounding 0.9005. Also acting as a downside filter is the 0.9000 psychological magnet, a break of which could drag the pair toward June 2021 low surrounding 0.8925.
Overall, USD/CHF is likely to consolidate recent losses near the multi-month low but the bullish trend is far from sight.
USD/CHF: Four-hour chart
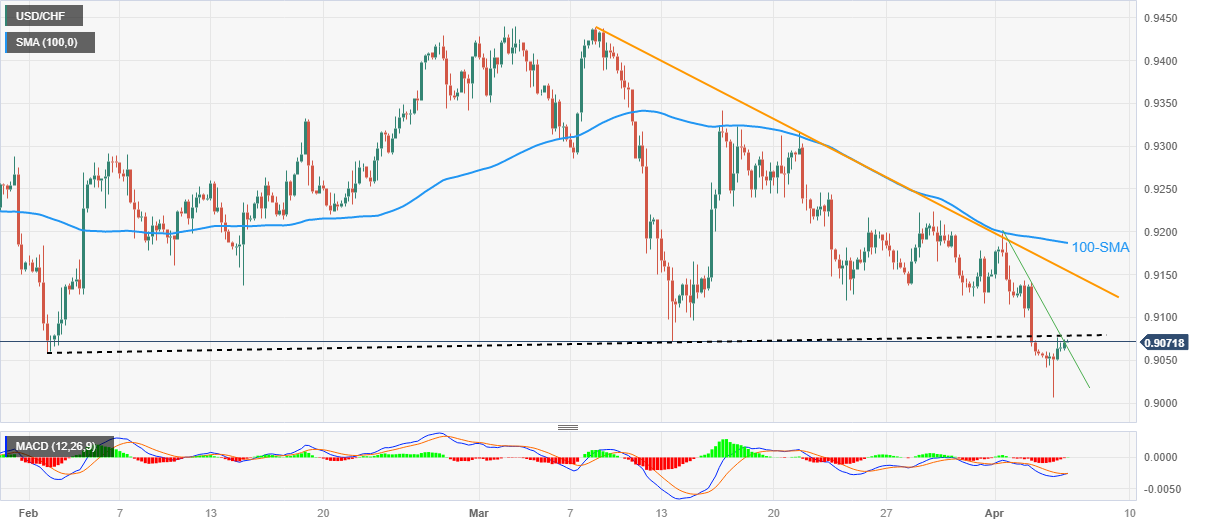
Trend: Further recovery expected
-
05:38
USD/INR Price News: Climbs above 82.00 as RBI keeps repo rate unchanged at 6.5%
- USD/INR has scaled sharply above 82.00 as the RBI has kept its first bi-monthly policy unchanged.
- Considering the contagion risk from global banking jitters and uncertainty, a steady policy has been chosen.
- Geopolitical tensions between the United States and China are keeping risk-sensitive assets on their toes.
The USD/INR pair has scaled firmly above 82.00the Reserve Bank of Index (RBI) has kept its repo rate unchanged at 6.5%. Out of six Monetary Policy Committee (MPC) members team, five voted for maintaining the status-quo. The street was anticipating a 25 basis point (bps) rate hike as India's inflation rate at 6.44% is well-above the desired rate. RBI Governor Shaktikanta decided to keep rates steady considering the contagion risks from the global banking fiasco. Apart from that, recent jump in oil prices are sufficient enough to impact the economic prospects.
Meanwhile, geopolitical tensions between the United States and China are keeping risk-sensitive assets on toes. S&P500 futures have extended their losses after two consecutive bearish trading sessions. The US Dollar Index (DXY) is aiming to extend its gains further above 102.20 amid improved appeal for safe-haven assets.
Going forward, the US Nonfarm Payrolls (NFP) data will remain in the spotlight. Soaring expectations of softening of the US labor market and economic slowdown due to the maintenance of higher interest rates by the Federal Reserve (Fed) have deepened fears of recession. Lower Job Openings data and economic slowdown are aiming for weak labor market data on Good Friday.
As per the expectations, the US economy added 240K jobs in March lower than the former release of 311K. The Unemployment Rate is seen unchanged at 3.6%. The major catalyst that will hog the limelight is the Labor Cost Index data, which is expected to accelerate by 0.3%, higher than February’s jump of 0.2%.
-
05:34
India RBI Interest Rate Decision (Repo Rate) below expectations (6.75%): Actual (6.5%)
-
05:28
USD/JPY pares weekly loss above 131.00 despite downbeat yields as recession fears propel US Dollar
- USD/JPY portrays bearish consolidation during four-day downtrend, picks up bids of late.
- Fears of economic slowdown underpin US Dollar rebound despite downbeat data, yields stay pressured at weekly low.
- Hawkish BoJ concerns contradict dovish shift in Fed bets to weigh on Yen price.
- Second-tier US employment data eyed ahead of Friday’s key Nonfarm Payrolls.
USD/JPY consolidates intraday losses around 131.20 as the US Dollar defends the previous day’s rebound from two-month low heading into Thursday’s European session. Even so, the Yen pair remains on the way to reversing the last week’s gains, the first in five, amid downbeat Treasury bond yields.
A likely monetary policy divergence between the Bank of Japan (BoJ) and the US Federal Reserve (Fed) appears to weigh on the Yen pair of late. The talks of the BoJ’s exit from easy money policy under the new Governor reign, especially when there prevails the need to reverse the 1.55 quadrillion yen ($11.7 trillion) of stimulus introduced during the last 10 years of Kuroda’s leadership.
On the other hand, CME’s FedWatch Tool suggests a nearly 57.0% of chance that the US central bank will pause its rate hike trajectory in May.
Even so, recession woes emanating from consecutive weakness in the US employment numbers and contagion risk associated with the same weigh on the sentiment while allowing the US Dollar to lick its wounds. That said, US Dollar Index (DXY) extends the previous day's rebound from a two-month low to 102.00 by the press time, up 0.12% intraday.
It should be noted that the US JOLTS Job Openings for February previously slumped to the lowest levels in 19 months and bolstered job fears while ADP Employment Change for March dropped to 145K from 200K expected and an upwardly revised prior of 261K. On the same line, the final readings of S&P Global Composite and Services PMIs for March also came in downbeat as the former one declined to 52.3 from 53.3 preliminary estimations while the Services PMI dropped to 52.6 from 53.8 anticipated earlier. More importantly, the US ISM Services PMI for the said month amplified pessimism as it dropped to 51.2 versus 54.5 expected and 55.1 prior.
Elsewhere, geopolitical fears emanating from China and North Korea also weigh on the sentiment and allow the US Dollar to remain firmer.
Amid these plays, &P 500 Futures drop for the third consecutive day even if the benchmark US Treasury bond yields remain sluggish around the multi-day bottom. That said, the US 10-year Treasury bond yields dropped in the last five consecutive days to refresh a seven-month low on Wednesday while the two-year counterpart also printed a four-day downtrend.
Looking forward, headlines surrounding China and the second-tier US employment data.
Technical analysis
A daily closing below an 11-week-old support line, around 130.95 by the press time, becomes necessary for the USD/JPY bear’s conviction.
-
04:53
GBP/USD declines towards 1.2400 as geopolitical tensions dampen market mood, US NFP eyed
- GBP/USD is eyeing more weakness to near 1.2400 amid a dismal market mood.
- China’s retaliation over arms support to Taiwan by the US might result in some restrictions on exports from China to the US.
- Scrutiny of US ADP Employment data is indicating a slowdown in the labor market ahead.
The GBP/USD pair is hovering near Wednesday’s low at 1.2440 in the Asian session. The Cable is expected to extend its downside journey as geopolitical tensions between the United States and China over Taiwan have dampened the overall market mood. China’s retaliation over arms support to Taiwan by the US might result in some restrictions on exports from China to the US.
S&P500 futures have generated decent losses in the Asian session, continuing its two-day losing streak amid deepening fears of a recession in the US economy. After five straight months of contraction in the US manufacturing sector, the weaker-than-anticipated US Services PMI has strengthened signs of a slowdown. Fortunately, the US Services PMI has not fallen into a contraction trajectory yet.
US-China tensions have improved the safe-haven appeal of the US Dollar Index (DXY) firmly. The USD Index has shifted its auction above 102.00 and is expected to extend gains ahead. The demand for US government bonds is recovering in hopes that the Federal Reserve (Fed) will consider an early pause to the policy-tightening spell. This has eased some recovery in the 10-year US Treasury yields and has pushed them below 3.30%.
As per the CME Fedwatch tool, the chances for a steady Fed interest rate decision are sticky above 50%.
Going forward, the release of the US Nonfarm Payrolls (NFP) data will provide clarity over the labor market condition. Scrutiny of US Automatic Data Processing (ADP) Employment data is indicating a slowdown in the labor market ahead.
On the Pound Sterling front, Bank of England (BoE) policymakers’ anticipation that United Kingdom inflation will start declining quickly looks vague. There are no signs that UK inflation has started softening, however, a fresh jump in oil prices is expected to put more burden on households.
-
04:20
USD/CAD bulls eye 1.3500 on softer Oil price, firmer US Dollar, focus on Canada employment data
- USD/CAD renews intraday high during three-day rebound from seven-week low.
- US Dollar ignores dovish shift in Fed bets, rises for the second consecutive day amid recession woes.
- WTI crude oil remains pressured as risk aversion intensifies.
- Downbeat Canada trade numbers, geopolitical woes also propel Loonie pair ahead of the key employment statistics.
USD/CAD picks up bids to renew its intraday high near 1.3485 as it pares weekly losses with a three-day uptrend during early Thursday. In doing so, the Loonie pair prepares for the all-important Canada employment data for March amid the US Dollar recovery and downbeat prices of Ontario’s key export, namely WTI crude oil.
That said, US Dollar Index (DXY) extends the previous day's rebound from a two-month low to 102.00 by the press time, up 0.12% intraday. On the other hand, WTI crude oil extends the previous day’s pullback from the 10-week high to $80.00 at the latest.
The US Dollar cheers recession woes emanating from consecutive weakness in the employment numbers, which in turn raise fears of a slowdown in the world’s biggest economy and contagion risk associated with the same.
On Wednesday, the US ADP Employment Change for March dropped to 145K from 200K expected and an upwardly revised prior of 261K. On the same line, the final readings of S&P Global Composite and Services PMIs for March also came in downbeat as the former one declined to 52.3 from 53.3 preliminary estimations while the Services PMI dropped to 52.6 from 53.8 anticipated earlier. More importantly, the US ISM Services PMI for the said month amplified pessimism as it dropped to 51.2 versus 54.5 expected and 55.1 prior. It’s worth observing that US JOLTS Job Openings for February previously slumped to the lowest levels in 19 months and bolstered job fears.
Apart from the US data-inflicted recession woes, geopolitical fears surrounding China and North Korea also weigh on the sentiment and allow the USD/CAD to grind higher. Late on Wednesday, US House of Representatives Speaker Kevin McCarthy’s talks with Taiwanese President Tsai Ing-Wen renewed the Sino-American tussles. On the other hand, North Korea on Thursday accused the U.S. and South Korea of escalating tensions to the brink of nuclear war through their joint military drills, vowing to respond with "offensive action," state media KCNA reported per Reuters.
At home, Canadian International Merchandise Trade, Exports and Imports all eased for February and weigh on the Canadian Dollar (CAD).
It should be noted, however, that CME’s FedWatch Tool suggests a nearly 57.0% of chance that the US central bank will pause its rate hike trajectory in May, which in turn probes USD/CAD bulls ahead of the monthly Canada jobs report.
Forecasts suggest a downbeat Net Change in Employment and an increase in the Unemployment rate for March, which in turn can favor Bank of Canada (BoC) doves and allow the USD/CAD buyers to remain hopeful if the data matches expectations.
Also read: Canada Employment Preview: Modest gain anticipated, but a surprise not off the table
Technical analysis
USD/CAD recovery remains elusive unless the quote stays below the 100-DMA hurdle of around 1.3530.
-
03:58
Natural Gas retreats towards $2.13 support amid economic slowdown fears, EIA inventories eyed
- Natural Gas price fades the previous day’s corrective rebound.
- Firmer US Dollar, recession woes weigh on XNG/USD ahead of weekly inventories from EIA.
- Extension of US tax exemption on gas fuels, geopolitical tension joins downbeat US data to put a floor under prices.
Natural Gas (XNG/USD) retreats to $2.25 during early Thursday as the market slips into consolidation mode ahead of Friday’s key US jobs report.
It’s worth noting that the US tax credit and geopolitical woes allowed the XNG/USD to post the biggest daily gains in a week the previous day. However, fears of economic slowdown in the world’s US join the firmer US Dollar to weigh on the energy prices of late.
US Dollar Index (DXY) extends the previous day's rebound from a two-month low to 102.00 by the press time, up 0.12% intraday. Recession woes gain momentum as consecutive weakness in the US employment numbers raised fears of a slowdown in the world’s biggest economy and contagion risk associated with the same, which in turn weigh on the energy demand and XNG/USD price.
On the contrary, House of Representatives Speaker Kevin McCarthy’s talks with Taiwanese President Tsai Ing-Wen renewed the Sino-American tussles. On the other hand, North Korea on Thursday accused the U.S. and South Korea of escalating tensions to the brink of nuclear war through their joint military drills, vowing to respond with "offensive action," state media KCNA reported per Reuters.
It should be noted that the US Senate extends the decade-old tax exemption on natural gas and favor more demand for Natural Gas, putting a floor under the prices of late.
While portraying the mood, S&P 500 Futures drop for the third consecutive day even if the benchmark US Treasury bond yields remain sluggish around the multi-day bottom.
Looking forward, Weekly Natural Gas Storage Change data from the US Energy Information Administration (EIA), prior -47B, could direct XNG/USD moves. Though, major attention should be given to the headlines surrounding China and the second-tier US employment data.
Technical analysis
Although the Natural Gas buyers remain off the table unless witnessing a clear break of the 50-DMA, around $2.51 at the latest, the bears remain cautious beyond the double-bottom surrounding $2.13.
-
03:38
EUR/USD ignores dovish shift in Fed bets to approach 1.0860 support amid recession woes
- EUR/USD remains pressured after reversing from two-month high on Tuesday, mildly offered of late.
- Downbeat US data renew recession woes and allowed Euro buyers to take a breather amid mixed EU statistics.
- Geopolitical fears, market’s consolidation amid holiday mood can please intraday EUR/USD bears.
- US Nonfarm Payrolls will be the key to rejecting bullish bias.
EUR/USD holds lower ground near the intraday bottom of 1.0884 as it prints two-day downtrend, after reversing from the highest levels since early February on Tuesday.
That said, the Euro pair’s latest losses could be linked to the US Dollar’s corrective bounce amid recession woes and geopolitical fears. However, downbeat US data and comparatively hawkish bets on the European Central Bank (ECB) than the US Federal Reserve (Fed) seem to put a floor under the EUR/USD prices.
US Dollar Index (DXY) extends the previous day's rebound from a two-month low to 102.00 by the press time, up 0.12% intraday, as it cheers the greenback’s haven appeal amid fears of economic slowdown and geopolitical woes emanating from China and North Korea. While portraying the mood, S&P 500 Futures drop for the third consecutive day even if the benchmark US Treasury bond yields remain sluggish around the multi-day bottom.
Recession woes gain momentum as consecutive weakness in the US employment numbers raised fears of a slowdown in the world’s biggest economy and contagion risk associated with the same. A disappointing 19-month low of the US JOLTS Job Openings for February precedes the ADP Employment Change for March which dropped to 145K from 200K expected and an upwardly revised prior of 261K. On the same line, the final readings of S&P Global Composite and Services PMIs for March also came in downbeat as the former one declined to 52.3 from 53.3 preliminary estimations while the Services PMI dropped to 52.6 from 53.8 anticipated earlier. More importantly, the US ISM Services PMI for the said month amplified pessimism as it dropped to 51.2 versus 54.5 expected and 55.1 prior.
On the other hand, S House of Representatives Speaker Kevin McCarthy’s talks with Taiwanese President Tsai Ing-Wen renewed the Sino-American tussles. On the other hand, North Korea on Thursday accused the U.S. and South Korea of escalating tensions to the brink of nuclear war through their joint military drills, vowing to respond with "offensive action," state media KCNA reported per Reuters.
It should be observed that CME’s FedWatch Tool suggests a nearly 57.0% of chance that the US central bank will pause its rate hike trajectory in May. Alternatively, the ECB’s 0.25% rate hike is almost given. With this in mind, ECB policymaker Boris Vujčić said on Wednesday, “The largest part of the rate-hiking cycle is behind us.” The ECB official also added that “to address core inflation, we might need to raise rates further.”
Talking about the data from the bloc, Germany Factory Orders improved to -5.7% YoY for February from -12.0 revised down prior and -10.5% market forecasts while the MoM growth came in at 4.8% compared to 0.3% expected and 0.5% previous readings. It’s worth noting that Germany’s final readings of S&P GlobalBME Composite PMI for March confirmed 52.6 initial estimations while Services PMI eased to 53.7 versus 53.9 flash forecasts. On a broader front, Eurozone S&P Global Composite PMI eased to 53.7 in March versus 54.1 first readings whereas Services PMI also declined to 55.0 during the stated month from 55.6 preliminary forecasts.
Looking forward, EUR/USD traders will be interested in more clues for Friday’s all-important Nonfarm Payrolls (NFP).
Technical analysis
Overbought RSI joins the EUR/USD pair’s U-turn from a one-year-old resistance line, around 1.0950 at the latest, to please sellers.
-
03:19
USD/CNH turns volatile on US-China tensions, Caixin Services PMI soars
- USD/CNH is demonstrating volatile moves amid escalating tensions between the United States and China.
- Chinese spokesperson cited that the economy will take resolute and effective measures to safeguard territorial integrity.
- Caixin Services PMI has remained upbeat in March, landing higher at 57.8.
The USD/CNH pair has been displaying topsy-turvy moves in the Asian session amid elongated tensions between the United States and China over Taiwan. US House of Representatives Speaker Kevin McCarthy crossed wires, via Reuters, late Wednesday while praising talks with Taiwanese President Tsai Ing-Wen.
US McCarthy is supporting economic cooperation with Taiwan, particularly on trade and technology. He further added, “US arms sales to Taiwan must be delivered on a timely basis.” In retaliation, China has criticized the US for collusion with Taiwanese authorities and their secret attempts with separatists seeking "Taiwan independence".
Also, the Chinese Foreign Ministry spokesperson added that China will take resolute and effective measures to safeguard national sovereignty and territorial integrity.
Meanwhile, the release of the Caixin Services PMI (March) data has not been well attended amid geopolitical tensions. The economic data has landed at 57.8, higher than the consensus of 54.0 and the former release of 55.0. The release of the upbeat Services PMI would remain supportive of the Chinese Yuan.
S&P500 futures have deepened their losses as investors are turning their faces from risk-perceived assets. The US Dollar Index (DXY) is making efforts in keeping its auction above 102.00.
Going forward, more clarity on the movement of the USD Index will come after the release of the US Nonfarm Payrolls (NFP) data. Taking cues from the US Automatic Data Processing (ADP) Employment figures, it is highly likely that the fresh labor additions would remain subdued.
-
03:10
NZD/USD bears take a breather around 0.6300 as China Caixin Services PMI jumps
- NZD/USD licks its wounds during the first daily negative in four.
- China Caixin Services PMI rises to the highest levels since November 2020.
- Risk-off mood previously allowed Kiwi pair to consolidate RBNZ-led gains.
- Downbeat US data, yields keep Kiwi buyers hopeful ahead of US employment numbers.
NZD/USD flirts with the 0.6300 round figure during its first loss-making day in four amid early Thursday. While the broad risk aversion underpins the US Dollar’s corrective bounce and weigh on the Kiwi pair, the hawkish bias surrounding the Reserve Bank of New Zealand (RBNZ) joins strong China activity data to prod the bears.
Recently, China’s Caixin Services PMI rallied to 57.8 versus 54.0 expected 55.0 prior. In doing so, the China data rises to the highest level since November 2020.
It’s worth noting that the NZD/USD price jumped to the seven-week high the previous day as the RBNZ surprised markets with 0.50% rate hike. However, downbeat US data triggered recession woes afterward and weighed on the quote. Also likely to have exerted downside pressure on the NZD/USD are the geopolitical fears surrounding Taiwan and North Korea.
That said, a disappointing 19-month low of the US JOLTS Job Openings for February precedes the ADP Employment Change for March which dropped to 145K from 200K expected and an upwardly revised prior of 261K. On the same line, the final readings of S&P Global Composite and Services PMIs for March also came in downbeat as the former one declined to 52.3 from 53.3 preliminary estimations while the Services PMI dropped to 52.6 from 53.8 anticipated earlier. More importantly, the US ISM Services PMI for the said month amplified pessimism as it dropped to 51.2 versus 54.5 expected and 55.1 prior.
Elsewhere, US House of Representatives Speaker Kevin McCarthy’s talks with Taiwanese President Tsai Ing-Wen renewed the Sino-American tussles. On the other hand, North Korea on Thursday accused the U.S. and South Korea of escalating tensions to the brink of nuclear war through their joint military drills, vowing to respond with "offensive action," state media KCNA reported per Reuters.
Against this backdrop, S&P 500 Futures drop for the third consecutive day even if the benchmark US Treasury bond yields remain sluggish around the multi-day bottom but the US Dollar Index (DXY) grinds higher to 101.98 by the press time.
Looking ahead, the weekly US jobless claims data will be important for fresh impulse before Friday’s all-important Nonfarm Payrolls (NFP).
Technical analysis
NZD/USD remains on the way to testing the one-month-old support line, around 0.6245 by the press time, unless breaking a two-month-old 0.6385-90 resistance area
-
02:57
RBA’s FSR: Australian banks are well capitalized, profitable and highly liquid
Reserve Bank of Australia (RBA) published its semi-annual Financial Stability Review (FSR) on Thursday, stating that “Australian banks are well capitalized, profitable and highly liquid.”
Key takeaways
“Australia not immune to global financial shocks.”
“But Australian banks well capitalized, profitable and highly liquid.”
“APRA has stepped up oversight of domestic institutions, considering lessons for regulations.”
“Global financial stability risks have increased, likely to see a tightening of credit.”
“Regulators will need to tighten rules, protect from "digital" runs on banks.”
“Financial system also at risk if inflation stays high, central banks keep tightening.”
“Most Australian households, firms well placed to weather higher rates, inflation.”
“But some are already in stress and squeeze on budgets likely to last for some time.”
“Stress is seen in domestic construction sector, commercial lending.”
“Domestic banks well placed to absorb any increase in non-performing loans.”
“Lenders provisioning for loan arrears to rise, though from very low levels.
“Mortgages in negative equity make up only 1% of total loans.”
“Keeping watching brief on cyber attacks, climate change, geopolitical stress.”
Related reads
- AUD/USD struggles to cheer upbeat China PMI near 0.6700 amid mixed Aussie trade data, recession woes
- China Caixin Services PMI beats, supportive of AUD/USD´s near-term outlook
-
02:52
AUD/USD struggles to cheer upbeat China PMI near 0.6700 amid mixed Aussie trade data, recession woes
- AUD/USD remains depressed for the third consecutive day amid mixed Australia trade data, upbeat China PMI figures.
- Australia’s Trade Balance improved but Imports, Exports dropped in February, China Caixin Services PMI rallied for March.
- Recession woes join geopolitical concerns to weigh on the Aussie pair.
- Softer US data, yields allow AUD/USD pair buyers to remain hopeful.
AUD/USD licks its wounds near the intraday low after China data allowed bears to take a breather during early Thursday. Even so, downbeat Australian trade numbers and risk-off mood weighs on the Aussie pair of late.
That said, China’s Caixin Services PMI rallied to 57.8 versus 54.0 expected 55.0 prior.
Earlier in the day, Australia’s headline Trade Balance improved to 13,870M versus 11,100 expected and 11,688M prior. However, Exports and Imports both dropped to -3.0% and -9.0% compared to 1.0% and 5.0% respective priors.
Additionally challenging the AUD/USD bulls is the Reserve Bank of Australia's (RBA) Financial Stability Review (FSR) which mentioned the stress in the domestic construction sector and commercial lending.
In addition to the mostly downbeat data at home, as well as from the biggest customer China, AUD/USD pair bears the burden of the market’s risk-off mood and the dovish bias of the RBA.
That said, consecutive weakness in the US employment numbers raised fears of a recession in the world’s biggest economy and contagion risk associated with the same. On the other hand, RBA Governor Philip Lowe tried to appease hawks, following the RBA’s pause in rate hikes after 10 such increases. The policymaker ruled out rate cuts while also saying, “Balance of risks lean toward further rate rises.”
Amid these plays, S&P 500 Futures drop for the third consecutive day even if the benchmark US Treasury bond yields remain sluggish around the multi-day bottom.
Having witnessed the initial reaction to second-tier data from Australia and China, the AUD/USD pair traders may rely on the risk catalysts for intraday directions. Also important to watch will be the weekly US jobless claims data ahead of Friday’s all-important Nonfarm Payrolls (NFP).
To sum up, sour sentiment joins the dovish RBA bias to weigh on the AUD/USD prices but the broad US Dollar weakness challenges the Aussie pair bears.
Technical analysis
A convergence of a one-month-old ascending support line and the 21-DMA highlights 0.6680 as the key short-term key support for the AUD/USD pair traders to watch before welcoming bears.
-
02:48
China Caixin Services PMI beats, supportive of AUD/USD´s near-term outlook
The Caixin Services PMI, released by Markit Economics, has been released as follows:
- China Caixin Services PMI March: 57.8 (est 55.0; prev 55.0).
- Caixing Composit PMI March: 54.5 (prev 54.2).
AUD/USD update
AUD/USD remains tucked in on top of the 0.6700 trendline support.
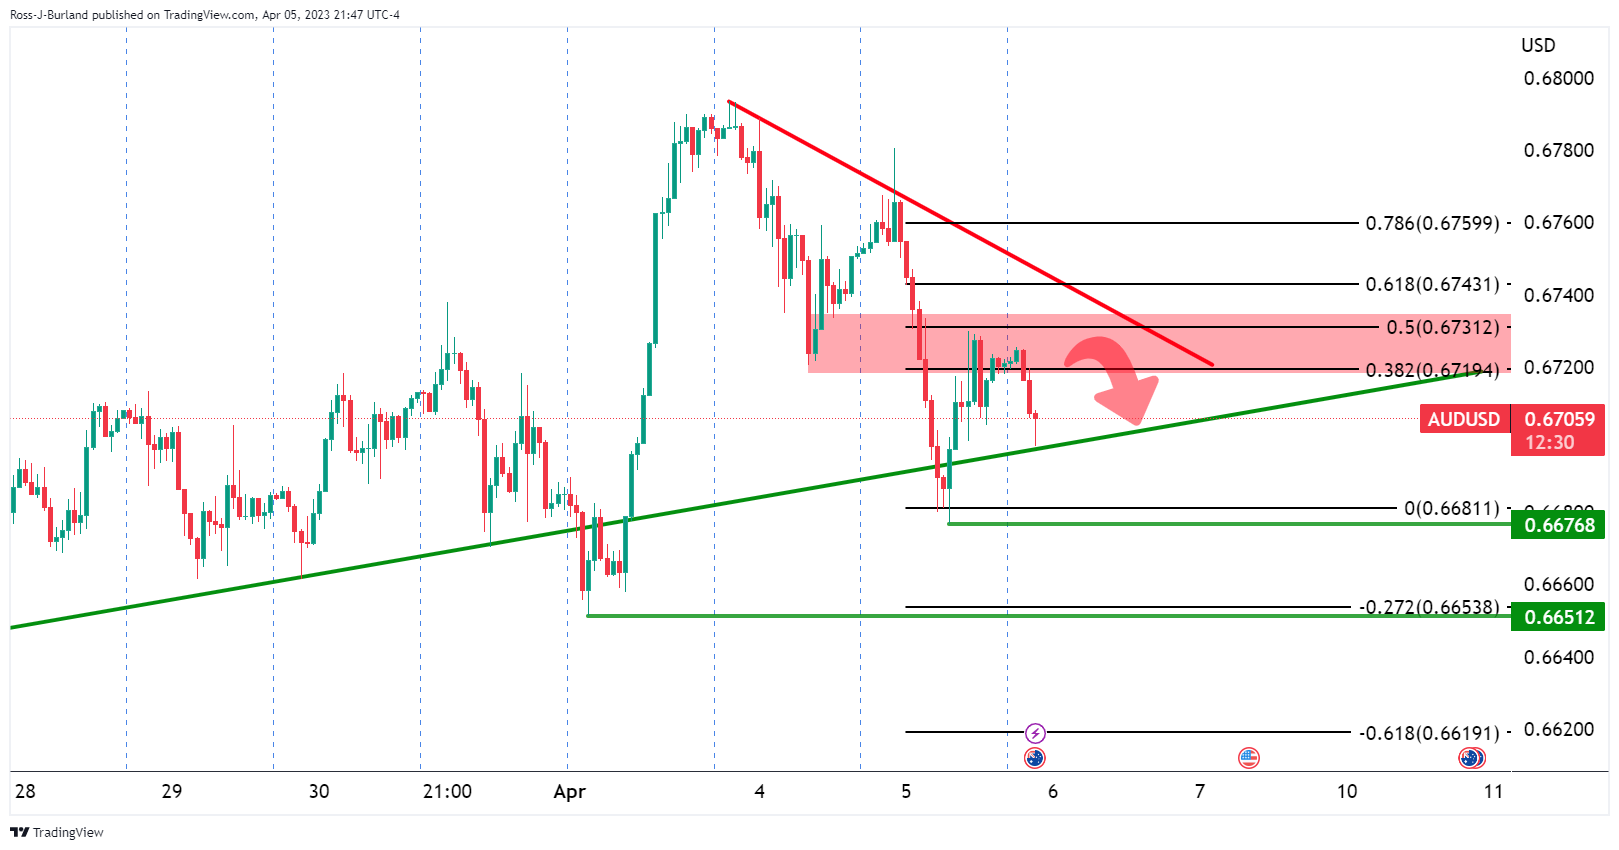
AUD/USD´s bearish pennant is a compelling feature on the daily time frames and failures below 0.6720 keep the bearish bias in place as the following will illustrate.
- AUD/USD Price Analysis: Bears eye break below 0.6650
About The Caixin Services PMI
The Caixin Services PMI™, released by Markit Economics, is based on data compiled from monthly replies to questionnaires sent to purchasing executives in over 400 private service sector companies. The panel has been carefully selected to accurately replicate the true structure of the services economy.
-
02:45
China Caixin Services PMI above expectations (54) in March: Actual (57.8)
-
02:43
USD/JPY Price Analysis: Defends 131.00 as geopolitical tensions in US-China escalates
- USD/JPY has rebounded following the footprints of the USD Index amid geopolitical tensions.
- China is opposing US collusion with Taiwan and criticizes US McCarthy for breaking the commitment on the Taiwan question.
- S&P500 futures have extended their downside after a two-day losing spell, portraying a dismal market mood.
The USD/JPY pair has witnessed buying interest after slipping below the immediate support of 131.00 in the Asian session. The recovery move in the asset is backed by an extension of reversal in the US Dollar Index (DXY). The USD Index has firmly climbed above the 102.00 resistance and is expected to record more upside amid deepening geopolitical tensions between the United States and China.
S&P500 futures have extended their downside after a two-day losing spell amid escalating geopolitical tensions, portraying a dismal market mood.
Also, the US and South Korea have been accused of stoking nuclear war tensions by North Korea after their joint military drills operation, as reported by Reuters. China is opposing US collusion with Taiwan and criticizes US House Speaker McCarthy for breaking the commitment made by the US to China on the Taiwan question.
The US Dollar Index (DXY) is attracting bids amid improvement in its safe-haven appeal amid geopolitical tensions. Also, investors are getting anxious ahead of the release of the United States Nonfarm Payrolls (NFP) data. Meanwhile, the 10-year US Treasury yields have also recovered to 3.31%.
USD/JPY is defending further downside after dragging to near the 61.8% Fibonacci retracement (placed from March 24 low at 129.64 to April 03 high at 133.76) at 131.22 on an hourly scale. The 20-period Exponential Moving Average (EMA) at 131.30 is still acting as a barricade for the US Dollar bulls.
Meanwhile, the Relative Strength Index (RSI) (14) is making efforts in climbing into the 40.00-60.00 range.
Should the asset break above the immediate resistance of 131.50, US Dollar bulls would drive the asset towards 38.2% Fibo retracement at 132.19 followed by April 04 high at 133.17.
On the contrary, a break below April 05 low at 130.63 would drag the asset towards the round-level support of 130.00. A break below the 130.00 support would expose the asset to March 24 low at 129.64.
USD/JPY hourly chart
-638163421061104085.png)
-
02:35
AUD/JPY stays pressured around 88.00 on mixed Aussie trade data, softer yields
- AUD/JPY holds lower ground at weekly bottom, down for the third consecutive day.
- Australia trade numbers for February came in elusive as Trade Balance improved but Imports, Exports dropped.
- Fears of recession, dovish RBA keeps bears hopeful, yields allow Yen to remain firmer.
AUD/JPY prints a three-day downtrend near 88.00 as mixed Aussie trade numbers join downbeat Treasury bond yields to favor bears on early Thursday.
Talking about the Aussie trade numbers, the headline Trade Balance improved to 13,870M versus 11,100 expected and 11,688M prior. However, Exports and Imports both dropped to -3.0% and -9.0% compared to 1.0% and 5.0% respective priors.
Apart from the mixed Australian trade figures, the dovish bias of the Reserve Bank of Australia (RBA), versus the talks of the Bank of Japan’s (BoJ) exit from easy money policy, seem to exert downside pressure on the AUD/JPY prices.
On Wednesday, Reserve Bank of Australia (RBA) Governor Philip Lowe tried to appease hawks, following the RBA’s pause in rate hikes. The policymaker ruled out rate cuts while also saying, “Balance of risks lean toward further rate rises.”
On the other hand, chatters surrounding the BoJ’s further editing of the Yield Curve Control (YCC) policy under the new Governor allow the Japanese Yen (JPY) to remain firmer.
It should be noted that the challenges to the sentiment, mainly from China and the US, also keep the bears hopeful. Recently, US House of Representatives Speaker Kevin McCarthy’s talks with Taiwanese President Tsai Ing-Wen renewed the Sino-American tussles. On the other hand, consecutive downbeat employment clues from the US raise recession fears and roil the sentiment, as well as weigh on the risk-barometer AUD/JPY pair.
While portraying the mood, S&P 500 Futures print mild losses while tracing the Wall Street benchmarks. However, the yields remain pressured and weigh on the AUD/JPY. That said, the benchmark US 10-year Treasury bond yields dropped in the last five consecutive days to refresh a seven-month low on Wednesday while the two-year counterpart also printed a four-day downtrend before bouncing off 3.79% at the latest.
Moving on, risk catalysts will be important for fresh directions amid a light calendar and a long weekend in Australia. Among them, news from China and recession talks will gain major attention.
Technical analysis
A three-month-old horizontal area around 87.45-40 can challenge the AUD/JPY bears as downbeat RSI (14) suggests dip-buying.
-
02:34
Aussie Trade Balance leaves AUD/USD sidelined
The trade balance released by the Australian Bureau of Statistics has been released as follows:
- Exports -3% MoM (prior +1%).
- Imports -9% MoM (prior +5%).
AUD/USD update
AUD/USD is virtually unchanged on the data a 0.6703.
AUD/USD´s bearish pennant is a compelling feature on the daily time frames and failures below 0.6720 keep the bearish bias in place as the following will illustrate.
- AUD/USD Price Analysis: Bears eye break below 0.6650
About the Trade Balance
The trade balance released by the Australian Bureau of Statistics is the difference in the value of its imports and exports of Australian goods. Export data can give an important reflection of Australian growth, while imports provide an indication of domestic demand. Trade Balance gives an early indication of the net export performance. If a steady demand in exchange for Australian exports is seen, that would turn into a positive growth in the trade balance, and that should be positive for the AUD.
-
02:30
Australia Trade Balance (MoM) came in at 13870M, above expectations (11100M) in February
-
02:30
Australia Imports (MoM) dipped from previous 5% to -9% in February
-
02:30
Australia Exports (MoM) fell from previous 1% to -3% in February
-
02:18
New Zealand ANZ Commodity Price above expectations (0.5%) in March: Actual (1.3%)
-
02:17
USD/CNY fix: 6.8747 vs. the last close of 6.8770
In recent trade today, the People’s Bank of China (PBOC) set the yuan at 6.8747 vs. the last close of 6.8770.
About the fix
China maintains strict control of the yuan’s rate on the mainland.
The onshore yuan (CNY) differs from the offshore one (CNH) in trading restrictions, this last one is not as tightly controlled.
Each morning, the People’s Bank of China (PBOC) sets a so-called daily midpoint fix, based on the yuan’s previous day's closing level and quotations taken from the inter-bank dealer.
-
02:08
AUD/NZD struggles to extend recovery above 1.0640 as RBNZ-RBA policy divergence stretches
- AUD/NZD is facing resistance in extending its recovery above 1.0640.
- RBNZ Orr went for a bumper rate hike as New Zealand’s inflation has turned extremely sticky.
- RBA Lowe has kept doors open if further rate hikes are required.
The AUD/NZD pair is struggling in stretching its recovery above 1.0640 in the Asian session. The cross may face tough barricades as the impact of the surprise 50 basis points (bps) rate hike by the Reserve Bank of New Zealand (RBNZ) is expected to remain for a decent period.
On Wednesday, RBNZ Governor Adrian Orr went ahead of expectations and hiked its Official Cash Rate (OCR) by 50 bps to 5.25%. RBNZ Orr went for a bumper rate hike as New Zealand’s inflation has turned extremely sticky. New Zealand’s quarterly inflation rate has remained steady at 7.2% in the last three quarters.
Reuters reported that the New Zealand economy is expected to have shrunk by 0.3% this quarter, following a 0.6% contraction in the final three months of 2022. In spite of anticipation of contraction in the economic activities, the RBNZ went for a mega rate hike keeping the stubborn inflation as its foremost priority.
About interest rate guidance, Economists at ING believe that even in the event of another hike and the 5.50% projected peak rate is reached, the chances of rate cuts by the end of the year have now increased materially, and markets are likely underestimating them.
On the Australian front, Reserve Bank of Australia (RBA) Governor Philip Lowe kept doors open if further rate hikes are required, cited in his commentary on Wednesday. The statement came after the RBA kept its monetary policy unchanged on Tuesday in hopes that the current monetary policy is restrictive enough to tame persistent inflation. Australian inflation has softened dramatically from the peak of 8.4% to 6.8% in February.
-
02:06
USD/MXN Price Analysis: Bulls approach 18.45-50 SMA confluence
- USD/MXN picks up bids to print four-day rebound from one-month low.
- Easing bearish bias of MACD signals, clear break of 10-DMA keeps buyers hopeful.
- Convergence of 21-DMA, 50-DMA appears a tough nut to crack for Mexican Peso sellers.
USD/MXN buyers stay in the driver’s seat for the fourth consecutive day during early Thursday. That said, the Mexican Peso (MXN) pair remains firmer around 18.32 by the press time after positing the first daily closing beyond the 10-DMA in two weeks on Wednesday.
Not only the 10-DMA breakout but the recently improving MACD line and receding bearish signals also favor the USD/MXN buyers.
However, a convergence of the 21-DMA and the 50-DMA can challenge the Mexican Peso (MXN) sellers around 18.45-50.
Following that, a downward-sloping resistance line from late December 2022, around 18.80 at the latest, can act as an extra upside filter.
It’s worth noting that the USD/MXN bears may remain hopeful unless the quote stays below the 100-DMA hurdle of 18.90.
On the contrary, a daily closing below the 10-DMA level of 18.20 can renew USD/MXN downside.
In that case, the latest swing low of 17.96 and the multi-month bottom marked in March around 17.89 will be in focus.
Should the USD/MXN bears remain in power after 17.89, the August 2017 low of around 17.57 may flash on their radars.
Overall, USD/MXN is likely to witness further recovery but the bulls are far from taking control.
USD/MXN: Daily chart
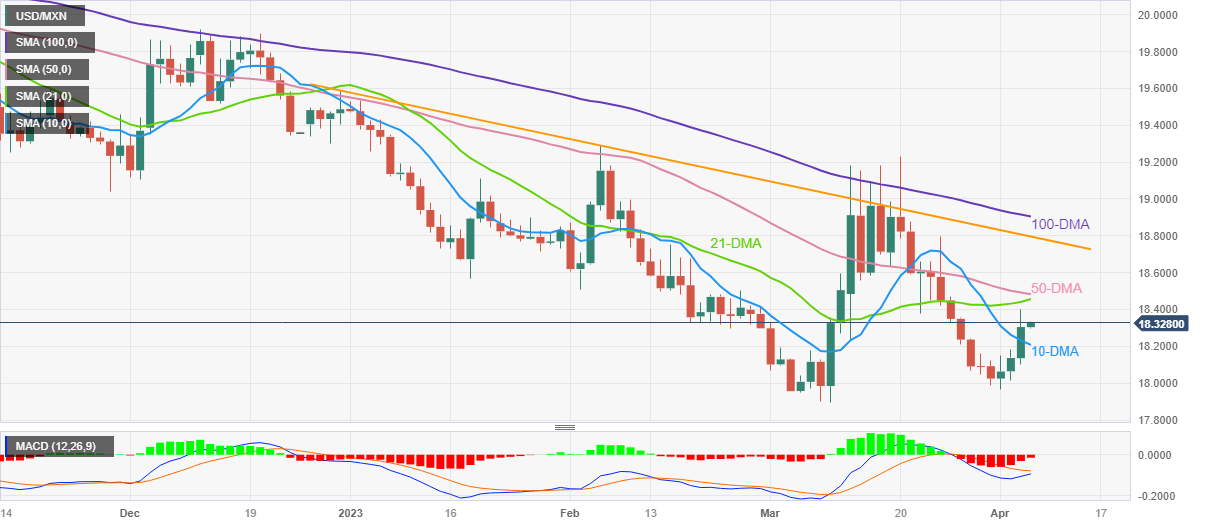
Trend: Further recovery expected
-
01:48
Gold Price Forecast: XAU/USD grinds past $2,000 as softer United States data drown yields
- Gold price remains sidelined after refreshing multi-month high, mildly offered of late.
- United States data keeps weighing on US Treasury bond yields and allowing XAU/USD to stay firmer.
- Threats to greenback’s reserve currency status, downbeat yields prod USD and favor the Gold buyers.
- Second-tier US data eyed ahead of the all-important Nonfarm Payrolls (NFP).
Gold price (XAU/USD) prints mild losses around $2,020 during early Thursday, after rising to the highest levels since March 2022 the previous day. The precious metal’s previous run-up could be linked to the broad US Dollar weakness amid downbeat United States data and receding hawkish bets on the Federal Reserve’s (Fed) next move, not to forget downbeat US Treasury bond yields. However, the recession woes seemed to have underpinned the Gold price recovery amid mixed clues.
Gold price rose on softer United States Treasury yields, US Dollar rebound prod bulls
Gold price remains firmer despite the latest retreat as the softer United States statistics weigh on the US Treasury bond yields and the US Dollar. That said, US Dollar Index (DXY) fades the previous day’s bounce off a two-month low as it retreats to 101.82 by the press time.
Among the key negatives for the bond coupons and the greenback, which in turn propel the Gold price, are the employment numbers, as well as the latest activity data.
After a disappointing 19-month low of the US JOLTS Job Openings for February, the ADP Employment Change for March dropped to 145K from 200K expected and an upwardly revised prior of 261K. On the same line, the final readings of S&P Global Composite and Services PMIs for March also came in downbeat as the former one declined to 52.3 from 53.3 preliminary estimations while the Services PMI dropped to 52.6 from 53.8 anticipated earlier. More importantly, the US ISM Services PMI for the said month amplified pessimism as it dropped to 51.2 versus 54.5 expected and 55.1 prior.
It should be noted that the CME’s FedWatch Tool suggests a nearly 57.0% of chance that the US central bank will pause its rate hike trajectory in May, which in turn prod the US Dollar buyers and weigh on the Gold price.
Against this backdrop, S&P 500 Futures print mild losses while tracing the Wall Street benchmarks. However, the yields remain pressured and weigh on the US Dollar. It’s worth noting that the benchmark US 10-year Treasury bond yields dropped in the last five consecutive days to refresh a seven-month low on Wednesday while the two-year counterpart also printed a four-day downtrend before bouncing off 3.79% at the latest.
Hence, multiple catalysts suggest further run-up of the Gold price even as the quote retreats of late.
Other challenges to US Dollar also propel XAU/USD
Apart from the data-linked weakness in the US Dollar and Treasury bond yields that propel the Gold price, the challenges to the US Dollar’s reserve currency status also allow the XAU/USD to remain firmer.
That said, Russia’s latest likes for the Chinese Yuan and the China-Brazil pact to ignore the US Dollar as an intermediate currency are key news that recently challenges the greenback’s imperial status.
On the same line are the chatters that some of the US Congressmen have proposed a Gold Standard Restoration Act to defend the US Dollar. The bill suggests re-pegging the greenback with a fixed amount of the Gold’s weight, like it was before 1971.
Geopolitical concerns fail to weigh on Gold price
While the aforementioned catalysts allow the Gold price to remain firmer, geopolitical chatters surrounding Russia, China, the US and Taiwan should have weighed on the XAU/USD price. However, the yellow metal ignores the challenges to sentiment amid the US Dollar’s failure to recover and the market’s less attention on these issues amid downbeat United States data and easing hawkish Fed bets.
Recently, US House of Representatives Speaker Kevin McCarthy crossed wires, via Reuters, late Wednesday while praising talks with Taiwanese President Tsai Ing-Wen. The Diplomat, however, ruled out chatters of his visit to the Asian nation by saying, “I don't have any current plans to visit Taiwan but that doesn't mean I will not go.”
Soon after the comments from US House Speaker McCarthy, China’s Foreign Ministry Spokesperson crossed wires and alleged the US of breaking its commitment on the Taiwan issue.
Second-tier US statics eyed before Nonfarm Payrolls
As most of the stated factors do suggest further upside of the Gold price, the second-tier United States statistics may entertain the commodity traders ahead of Friday’s key jobs report for March. Among them, the US Weekly Initial Jobless Claims may gain major attention as recently downbeat employment statistics from the United States triggered recession woes and weighed on the Gold price.
Gold price technical analysis
Gold price rides along the lines of an upward-sloping resistance line from late January, which is around $2,030 by the press time.
In doing so, the XAU/USD justifies the pennant breakout, as well as the bullish signals from the Moving Average Convergence and Divergence (MACD) indicator. However, the overbought conditions of the Relative Strength Index (RSI) line, placed at 14, prod the Gold buyers from time to time.
As a result, the yellow metal is well-set for refreshing the Year-To-Date high but is likely to rise gradually.
Even if the XAU/USD crosses the $2,030 hurdle, the year 2022 peak of $2,070 and the all-time high marked in 2020 around $2,075 can act as extra filters towards the north.
Meanwhile, Gold price pullback remains elusive until the quote stays beyond the stated pennant’s top line, close to $1,990 at the latest. That said, the $2,000 round figure may offer immediate support to the prices.
In a case where the Gold price drops below $1,990, the pennant’s bottom line of around $1,970 and February’s peak of $1,960 may become the last defenses of the XAU/USD bulls.
Gold price: Daily chart
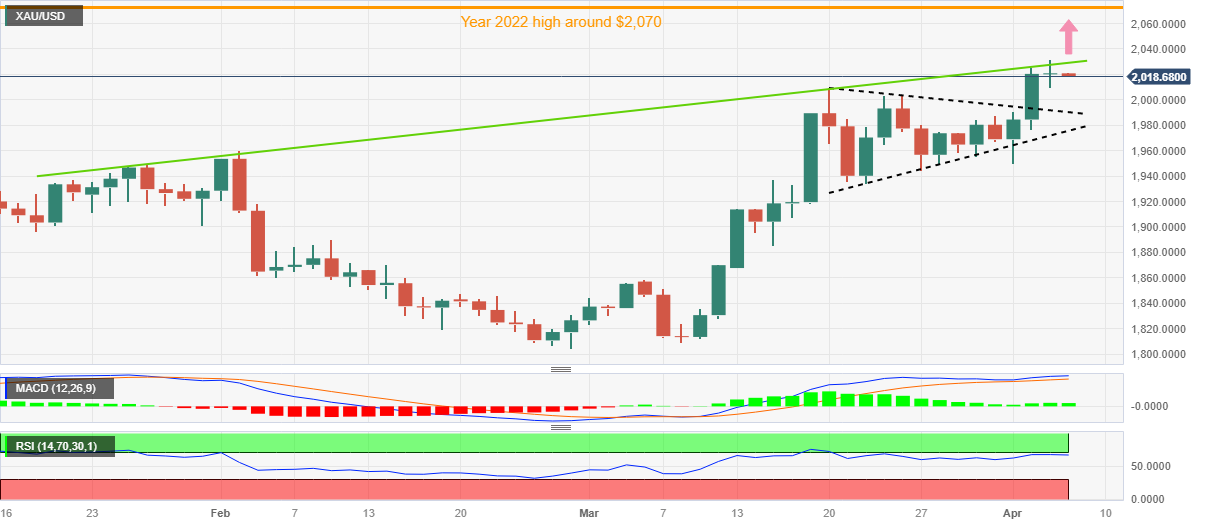
Trend: Further upside expected
-
01:45
AUD/USD Price Analysis: Bears eye break below 0.6650
- AUD/USD bears have engaged once again.
- The bearish pennant is still in play for the days ahead.
AUD/USD bearish pennant is a compelling feature on the daily time frames and failures below 0.6720 keep the bearish bias in place as the following will illustrate.
AUD/USD daily chart
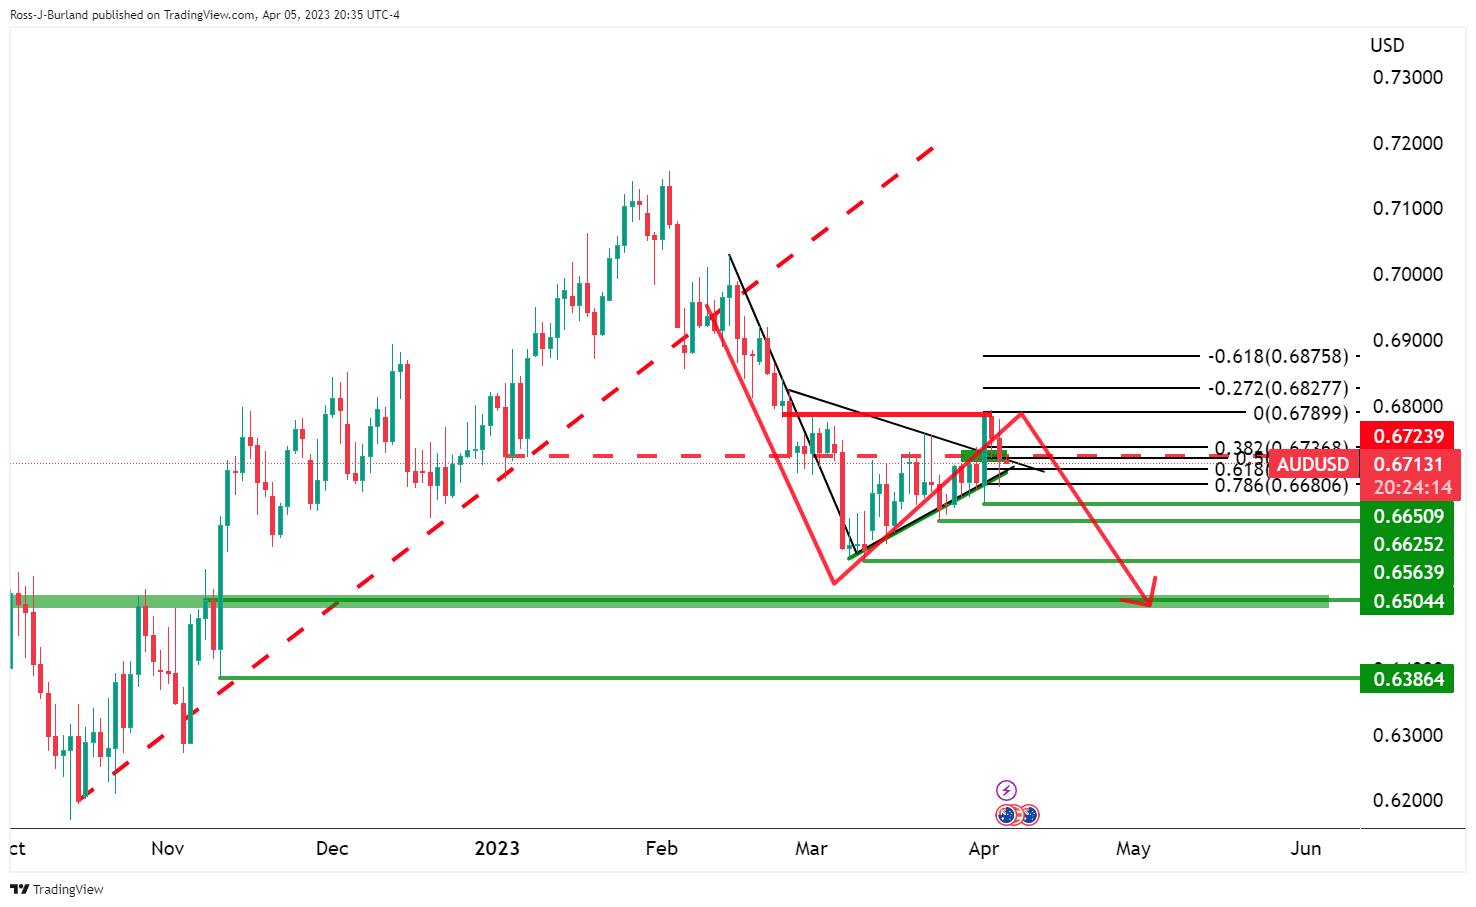
The price has taken on the premature´s bearish bets and hit stops near 0.6770/90. This leaves prospects of a downside continuation for the days ahead. The bears need to get below 0.6650 to open the doors to below 0.6600 and 0.6500.
AUD/USD H1 chart
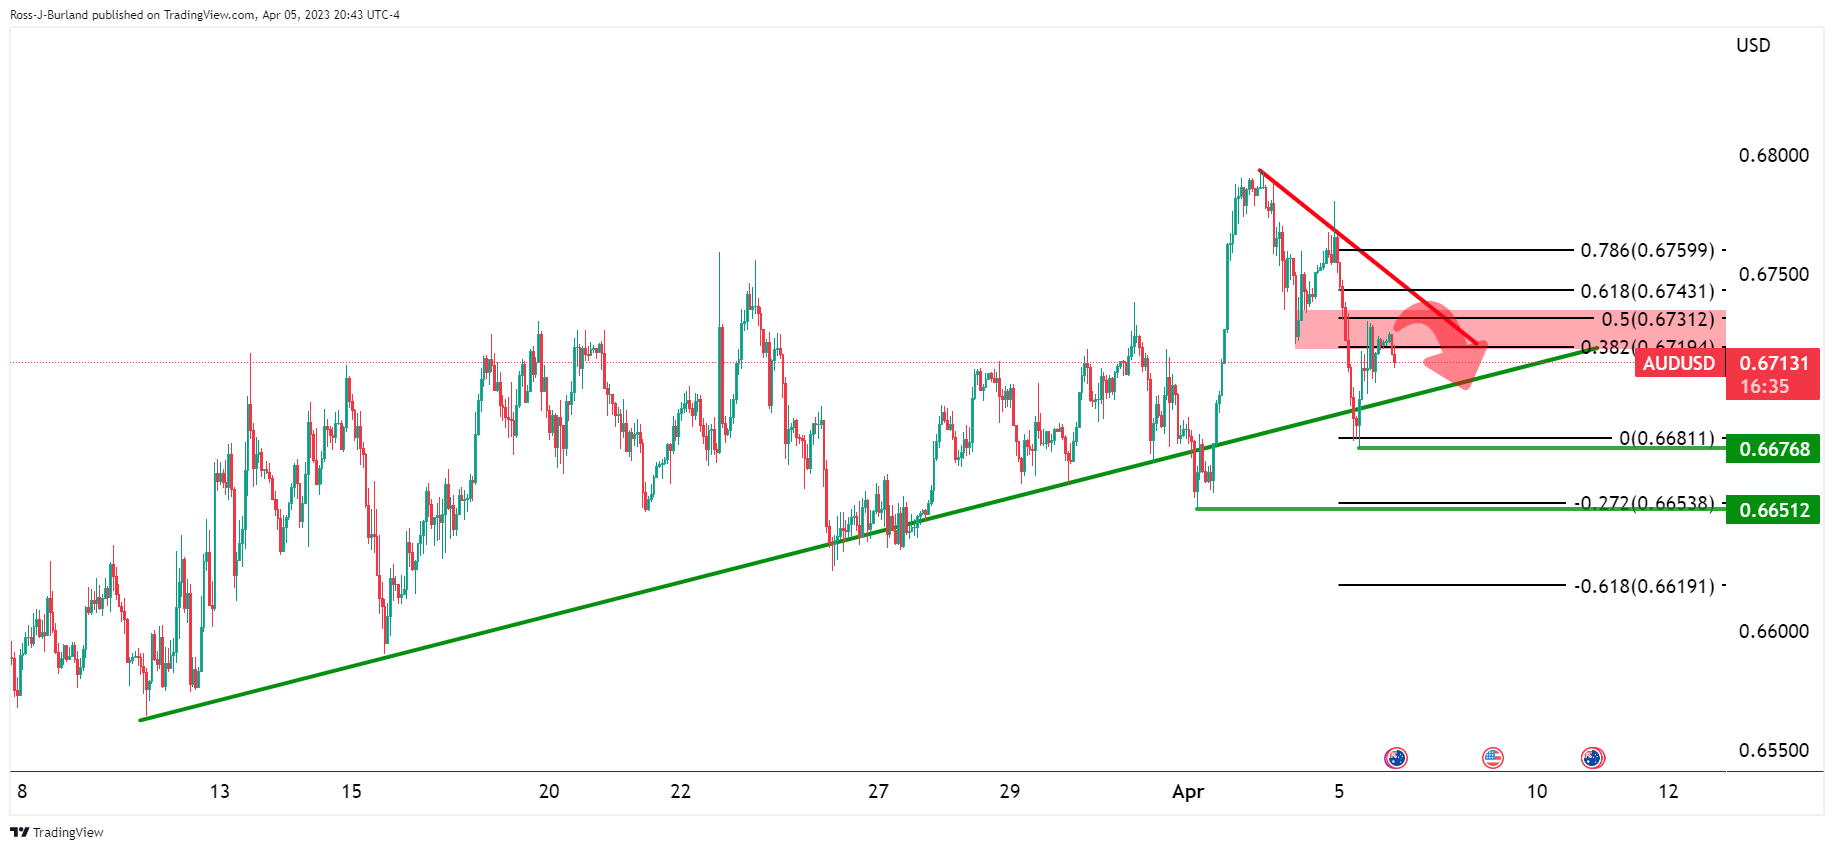
AUD/USD has pulled back into the neckline of the M-formation in a 50% mean reversion of the hourly impulse. This area may act as resistance and lead to an eventual break of the trendline support and then 0.6650.
-
01:31
GBP/USD Price Analysis: Pullback remains elusive beyond 1.2410 support
- GBP/USD treads water after reversing from 10-month high.
- Previously key horizontal resistance, bullish MACD signals favor Cable buyers.
- Three-week-old ascending trend line acts as additional downside filter.
- Multiple resistances to test GBP/USD bulls during recovery, offering a bumpy ride ahead.
GBP/USD struggles for clear directions as it makes rounds to 1.2460-55 during the mid-Asian session on Thursday.
The Cable pair reversed from its highest levels since June 2022 the previous day to print the first daily loss in three amid an overbought RSI (14). However, a four-month-old previous resistance line joins the bullish MACD signals to challenge the GBP/USD bears of late.
Even if the quote drops below the resistance-turned-support surrounding 1.2450-45, an upward-sloping support line from mid-March, around 1.2410, can act as the last defense of the GBP/USD buyers.
Following that, February 14 swing high around 1.2270 may prod the GBP/USD bears before directing them to the Year-To-Date low marked in March around 1.1800.
Alternatively, recovery moves need to cross the latest peak of 1.2525 to convince the Cable buyers to return to the table.
Following that, the 61.8% Fibonacci Expansion (FE) of its moves between November 2022 and March 2023, close to 1.2605, may challenge the GBP/USD bulls.
In a case where the pair remains firmer past 1.2605, the May 2022 high of around 1.2665-70 can challenge the upside momentum.
Overall, GBP/USD remains on the bull’s even if it trades sluggishly of late.
GBP/USD: Daily chart
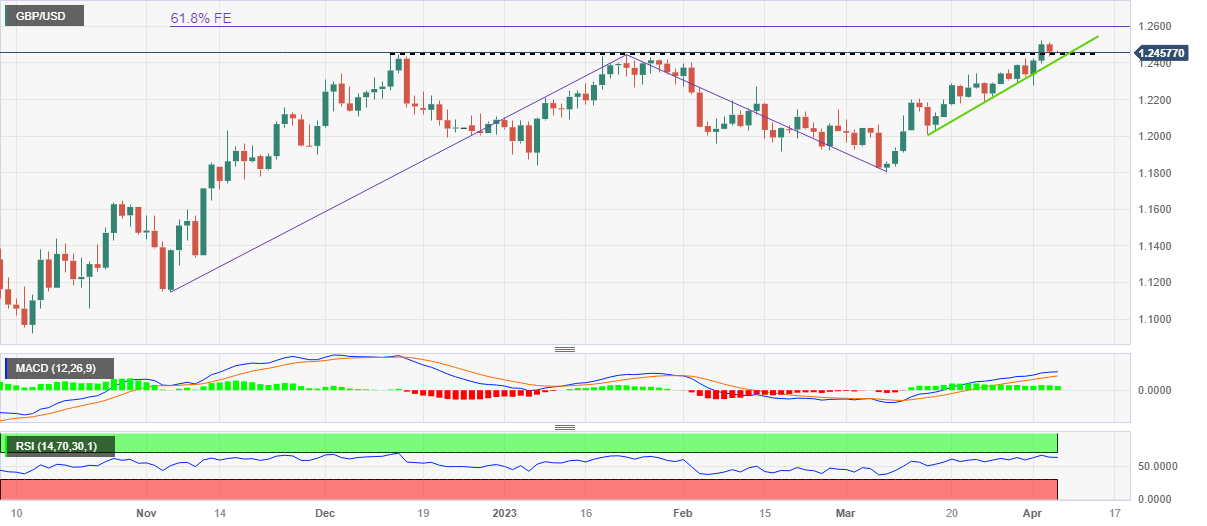
Trend: Further upside expected
-
01:30
Hong Kong SAR Nikkei Manufacturing PMI came in at 53.5, above expectations (52.6) in March
-
01:27
EUR/JPY continues its losing streak, drops below 142.60 as BoJ to consider YCC expansion
- EUR/JPY has carry-forwarded its three-day losing streak as the BoJ might consider an expansion in YCC sooner.
- Eurozone S&P Global Composite PMI recorded at 53.7, the highest in the past 10 months.
- Accelerating PMIs are supporting the continuation of rate hikes by the European Central Bank.
The EUR/JPY pair has continued its three-day losing spell after slipping below 142.60 in the Asian session. The cross is facing immense pressure as rumors of an expansion in the Yield Curve Control (YCC) by the Bank of Japan (BoJ) have been renewed.
Wages are growing gradually in the Japanese economy and the headline inflation is expected to react to recent higher oil prices ahead. Analysts at Wells Fargo believe that the BoJ will take advantage of a tactical opportunity to further tweak its policy settings in Q4-2022, and are lean towards the October meeting in terms of timing. They further added that this timeframe is most conducive for a smooth adjustment in policy as monetary easing from the Federal Reserve (Fed) among other major central banks should alleviate upward pressure on yields.
Specifically, the BoJ would lift the target for the 10-year Japanese government bond (JGBs) yield to 0.25% from 0% and will widen the tolerance band around that target to +/- 75 bps.
On the Eurozone front, accelerating PMIs are supporting for the continuation of rate hikes by the European Central Bank (ECB). On Wednesday, S&P Global reported the Composite PMI at 53.7, higher than the prior release of 52.0 but remained short of expectations at 54.1, the highest in the past 10 months.
S&P Global said in a statement, "Manufacturing production picked up slightly, but it was the service sector that had the strongest influence on March's accelerated upturn,” as reported by Reuters.
About interest rate guidance, ECB policymaker Boris Vujčić said on Wednesday, “The largest part of the rate-hiking cycle is behind us.” He further added, “To address core inflation, we might need to raise rates further.”
-
01:15
Currencies. Daily history for Wednesday, April 5, 2023
Pare Closed Change, % AUDUSD 0.67197 -0.46 EURJPY 143.15 -0.71 EURUSD 1.09051 -0.46 GBPJPY 163.551 -0.58 GBPUSD 1.246 -0.32 NZDUSD 0.6317 0.1 USDCAD 1.34563 0.08 USDCHF 0.90613 0.03 USDJPY 131.297 -0.3 -
01:08
EUR/USD Price Analysis: Bears eye a break of daily support
- EUR/USD is stalling on the offer and there is a phase of accumulation taking place.
- Bears are lurking and a break of daily support could be on the cards.
EUR/USD dropped on Wednesday following a short series of daily bullish closes. However, the pair is now testing support and there are prospects of a bullish correction prior to the next bearish impulse as the following will illustrate.
EUR/USD daily chart
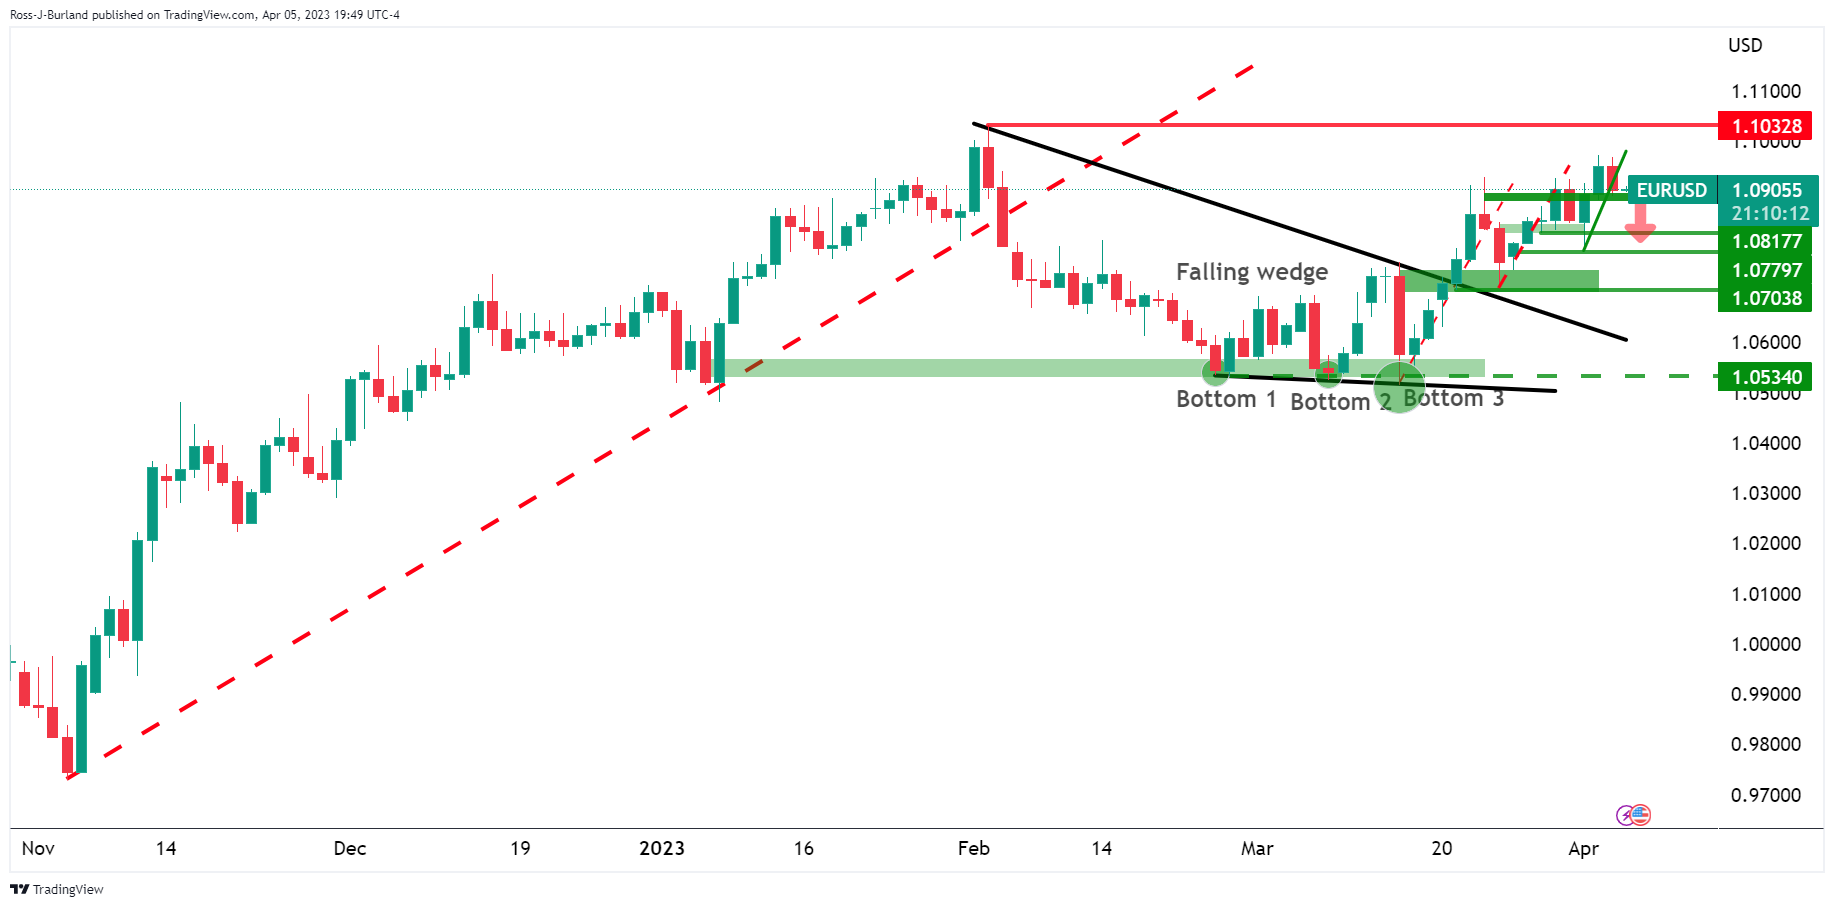
The price initially rallied out of the wedge but it is yet to fulfill the prospects of a fresh high for the longer-term bullish trend. Instead, the bulls are paring back gains ahead of the long weekend and Friday´s Nonfarm Payrolls.
EUR/USD H4 chart

With that being said, the price is meeting support and there is an M-formation, a reversion pattern, being carved out on the 4-hour time frame. This could pull the price in for a correction towards the neckline of the formation.
EUR/USD M15 chart
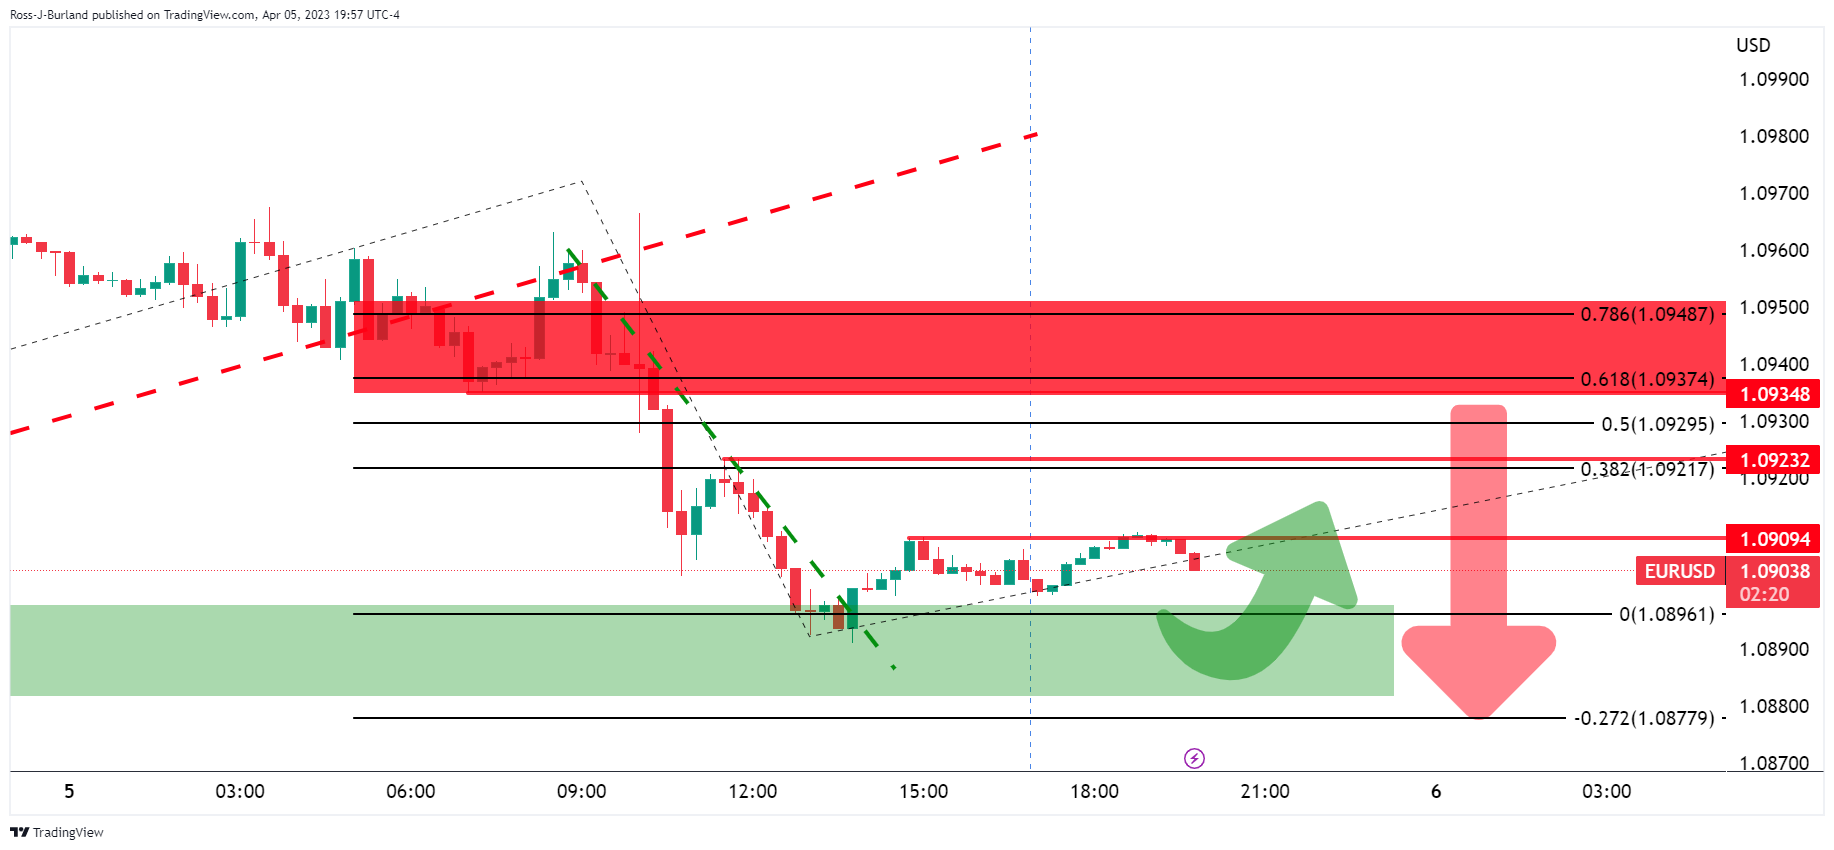
From a 15-minute basis, the bulls are on the backside of the bearish trend line and there is a phase of accumulation taking place.
-
01:08
WTI ignores risk aversion, downbeat Oil inventories to pare losses around $80.50 as US Dollar retreats
- WTI portrays bullish consolidation around 10-week high, picks up bids of late.
- US Dollar’s corrective bounce, risk-off mood and downbeat EIA stockpiles previously probed Oil buyers.
- Geopolitical woes, the greenback’s fresh downside keeps WTI bulls hopeful ahead of key US jobs report.
WTI crude oil regains upside momentum, following the first daily negative in five, as the US Dollar reverses the previous day’s corrective bounce. That said, the black gold picks up bids to print mild gains around $80.55 by the press time of early Thursday morning in Asia.
That said, the US Dollar’s corrective bounce joined downbeat Oil inventory data to trigger a pullback in the commodity prices. Also challenging the WTI buyers were recession fears. However, the broad USD weakness and geopolitical tensions emanating from China and Russia keep the buyers of the energy benchmark hopeful.
The weekly stockpile data from the US Energy Information Administration (EIA) marked -3.739M figure versus -2.329M market forecasts and -7.489M prior. Earlier in the week, the American Petroleum Institute (API) also flashed downbeat inventory data for the week ended on March 31, -4.346M versus -6.076M prior.
Elsewhere, US Dollar Index (DXY) fades the previous day’s bounce off a two-month low as it retreats to 101.82 by the press time amid recently increased odds of the US Federal Reserve’s (Fed) no rate hike in May. It should be noted that downbeat US data allowed the hawkish Fed bets to reverse earlier in the week.
After a disappointing 19-month low of the US JOLTS Job Openings for February, the ADP Employment Change for March dropped to 145K from 200K expected and an upwardly revised prior of 261K. On the same line, the final readings of S&P Global Composite and Services PMIs for March also came in downbeat as the former one declined to 52.3 from 53.3 preliminary estimations while the Services PMI dropped to 52.6 from 53.8 anticipated earlier. More importantly, the US ISM Services PMI for the said month amplified pessimism as it dropped to 51.2 versus 54.5 expected and 55.1 prior.
It should be noted that CME’s FedWatch Tool suggests a nearly 57.0% of chance that the US central bank will pause its rate hike trajectory in May.
While portraying the mood, S&P 500 Futures print mild losses while tracing the Wall Street benchmarks. However, the yields remain pressured and weigh on the US Dollar. It’s worth noting that the benchmark US 10-year Treasury bond yields dropped in the last five consecutive days to refresh a seven-month low on Wednesday while the two-year counterpart also printed a four-day downtrend before bouncing off 3.79% at the latest.
Moving on, second-tier US employment clues and risk catalysts may entertain WTI crude oil traders ahead of Friday’s key Nonfarm Payrolls (NFP).
To sum up, the OPEC+ supply cut joins the broad US Dollar weakness to underpin the Oil price strength.
Technical analysis
A four-month-old resistance line challenges WTI crude oil buyers around $81.80. The likely pullback, however, remains elusive unless the quote stays beyond ascending support line from March 24, close to $79.20 at the latest.
-
00:50
Japan Foreign Bond Investment: ¥-483.4B (March 31) vs previous ¥1182B
-
00:50
Japan Foreign Investment in Japan Stocks: ¥62.2B (March 31) vs ¥-1285.8B
-
00:49
USD/CAD Price Analysis: Range restricts to 40-pips as investors await US/Canada Employment data
- USD/CAD has locked in a tight range ahead of the US/Canada labor market data.
- The tight US labor market is cooling down as firms have eased their recruitment process.
- Canada’s Employment Change is seen at 12K and the Unemployment Rate might escalate to 5.1%.
The USD/CAD pair corrected below 1.3450 in the early Asian session as the US Dollar Index (DXY) showed a loss in the upside momentum after reaching to the critical resistance of 102.00. The Loonie asset is expected to deliver a power-pack action as investors are awaiting the release of the United States/Canada Employment data.
The tight US labor market is cooling down as firms have eased their recruitment process observed after a slowdown in Job Openings and weak additions of fresh jobs through Automatic Data Processing (ADP). This has triggered expectations of steady interest rates by the Federal Reserve (Fed) for its May policy meeting.
Meanwhile, S&P500 futures have resumed their downside journey, conveying a risk-off market mood.
The Canadian Dollar will be impacted by the Employment data. As per the consensus, Net Change in Employment is seen at 12K, lower than the former release of 21.8K. The Unemployment Rate is seen higher at 5.1% vs. the former release of 5.0%.
USD/CAD is auctioning in an Inverted Flag chart pattern on an hourly scale. An Inverted Flag is a trend-following pattern that displays a long consolidation that is followed by a breakdown. Usually, the consolidation phase of the chart pattern serves as an inventory adjustment in which those participants initiate shorts, which prefer to enter an auction after the establishment of a bearish bias and current sellers add more positions.
The Loonie asset has failed to sustain above the 50-period Exponential Moving Average (EMA) at 1.3458, which indicates more weakness ahead.
Meanwhile, the upside in the Relative Strength Index (RSI) (14) is capped around 60.00. A slippage into the bearish range of 20.00-40.00 will activate the downside momentum.
A downside break below April 04 low at 1.3406 will expose the asset to a fresh six-week low near 1.3350, which is February 6 low followed by the round-level support at 1.3300.
In an alternate scenario, an upside move above the psychological resistance of 1.3500 will shift traction in the favor of US Dollar bulls, which will drive the asset toward March 31 high and March 29 high at 1.3559 and 1.3619 respectively.
USD/CAD hourly chart
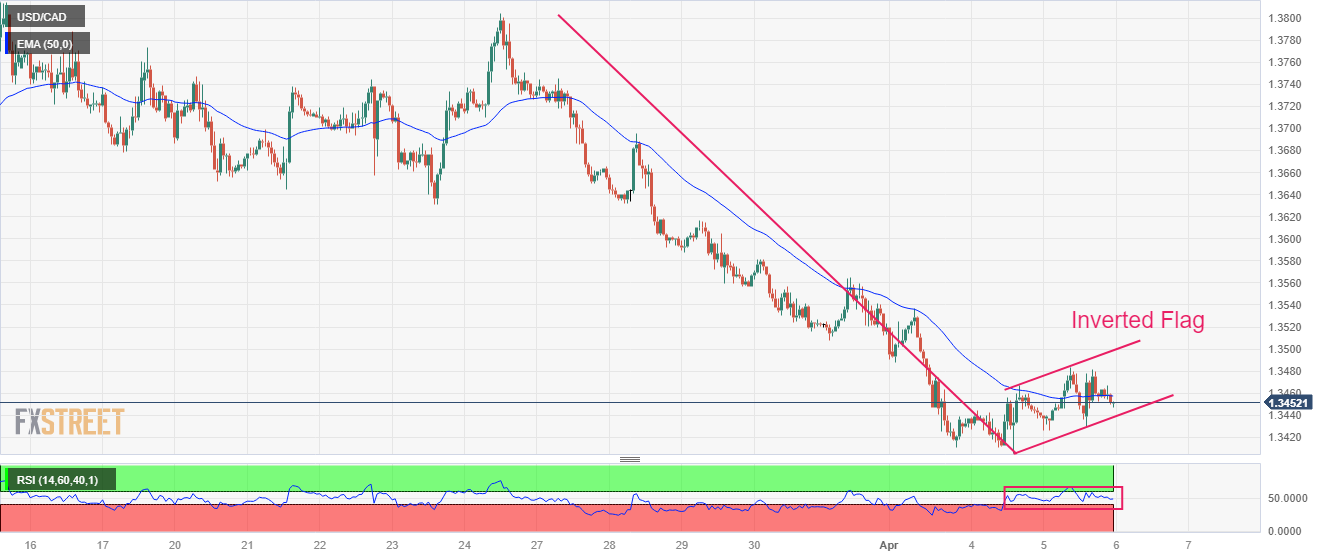
-
00:47
USD/CHF fades bounce off multi-day low under 0.9100 as Swiss Unemployment Rate loom
- USD/CHF drops back towards the lowest levels since June 2021, marked the previous day.
- Challenges to sentiment allowed Swiss Franc pair to portray corrective bounce.
- Downbeat US data, threats of de-dollarization weigh on USD/CHF price.
- Employment figures from Switzerland, US eyed for fresh impulse.
USD/CHF retreats to 0.9060 during early Thursday, after a failed recovery from the 22-month low marked the previous day. In doing so, the Swiss Franc (CHF) pair cheers the US Dollar’s broad weakness ahead of important employment data.
That said, the greenback portrayed a corrective bounce on Wednesday as downbeat US data triggered recession woes. However, the recently increased odds of the US Federal Reserve’s (Fed) no rate hike in May and challenges to the greenback’s reserve currency status seem to exert downside pressure on the US Dollar.
Talking about the data, the ADP Employment Change for March dropped to 145K from 200K expected and an upwardly revised prior of 261K. On the same line, the final readings of S&P Global Composite and Services PMIs for March also came in downbeat as the former one declined to 52.3 from 53.3 preliminary estimations while the Services PMI dropped to 52.6 from 53.8 anticipated earlier. More importantly, the US ISM Services PMI for the said month amplified pessimism as it dropped to 51.2 versus 54.5 expected and 55.1 prior.
On the other hand, Russia’s latest likes for the Chinese Yuan and the China-Brazil pact to ignore the US Dollar as an intermediate currency are the key news that recently challenges the greenback’s imperial status. On the same line are the chatters that some of the US Congressmen have proposed a Gold Standard Restoration Act to defend the US Dollar. The bill suggests re-pegging the greenback with a fixed amount of the Gold’s weight like it was before 1971.
Elsewhere, CME’s FedWatch Tool suggests a nearly 57.0% of chance that the US central bank will pause its rate hike trajectory in May.
Amid these plays, S&P 500 Futures print mild losses while tracing the Wall Street benchmarks. However, the yields remain pressured and weigh on the US Dollar. It’s worth noting that the benchmark US 10-year Treasury bond yields dropped in the last five consecutive days to refresh a seven-month low on Wednesday while the two-year counterpart also printed a four-day downtrend before bouncing off 3.79% at the latest.
Moving on, the Swiss Unemployment Rate for March, expected to remain unchanged at 1.9%, will precede the US Weekly Initial Jobless Claims to direct intraday moves of the USD/CHF pair. However, major attention will be given to Friday’s US Nonfarm Payrolls (NFP) for clear directions.
Technical analysis
USD/CHF pair’s candlestick on the daily chart for Wednesday appears challenging the bears amid oversold RSI (14). The recovery moves, however, need validation from a two-month-old support-turned-resistance, around 0.9085 by the press time.
-
00:28
US Dollar Index: DXY rebound remains elusive amid employment woes, threats of de-dollarization
- US Dollar Index fades bounce off two-month low, sluggish of late.
- Fears of recession allowed DXY to pare recent losses at multi-day low despite downbeat employment clues.
- Challenges to greenback’s reserve currency status, fears of deterioration job conditions exert downside pressure on the US Dollar Index.
- Second-tier US jobs report, risk catalysts eyed for fresh impulse.
US Dollar Index (DXY) fades late Wednesday’s corrective bounce off 101.41 as it retreats to 101.82 during early Thursday. In doing so, the greenback’s gauge versus six major currencies justifies the challenges to the US employment sector, as well as threats to the US Dollar’s reserve currency status.
The greenback portrayed a corrective bounce from the two-month low the previous day amid fears of a recession in the US, mainly due to downbeat US statistics. That said, the ADP Employment Change for March dropped to 145K from 200K expected and an upwardly revised prior of 261K. On the same line, the final readings of S&P Global Composite and Services PMIs for March also came in downbeat as the former one declined to 52.3 from 53.3 preliminary estimations while the Services PMI dropped to 52.6 from 53.8 anticipated earlier. More importantly, the US ISM Services PMI for the said month amplified pessimism as it dropped to 51.2 versus 54.5 expected and 55.1 prior.
Apart from the US data, the fresh US-China tension over Taiwan also put a floor under the US Dollar prices amid a sluggish session.
It’s worth noting, however, that the Fed policymakers’ inability to convince markets of their hawkish capacity joined downbeat US data and talks surrounding the de-dollarization to exert downside pressure on the US Dollar Index.
Russia’s latest likes for the Chinese Yuan and the China-Brazil pact to ignore the US Dollar as an intermediate currency are the key news that recently challenges the greenback’s imperial status. On the same line are the chatters that some of the US Congressmen have proposed a Gold Standard Restoration Act to defend the US Dollar. The bill suggests re-pegging the greenback with a fixed amount of the Gold’s weight like it was before 1971.
On a different page, market sentiment remains sour and restricts the US Dollar’s downside. While portraying the mood, Wall Street close and drowned the US Treasury bond yields.
Looking forward, US weekly jobless numbers may entertain the US Dollar traders ahead of Friday’s key employment data.
Technical analysis
Unless crossing a one-month-old descending resistance line, around 102.60 at the latest, US Dollar Index remains on the bear’s radar.
-
00:15
USD/JPY bears pounce in the opèn and take out 131.00
- USD/JPY bears step in early doors and test below 131.00.
- All eyes are turning to this week´s NFP.
USD/JPY is down on the day so far losing some 0.2% and printing a low of 130.99 from 131.33 the high in a firm sell-off in the Asian morning. The underlying trend for the US Dollar remained tilted to the downside mid week although traders have started to pare back shorts across the board, as per DXY, into the long weekend and US Nonfarm Payrolls showdown.
Meanwhile, data on Wednesday supported the view that the Federal Reserve may not need to raise rates much further. The ADP National Employment report showed US private employers hired fewer workers than expected in March, suggesting a cooling labor market. Private employment increased by 145,000 jobs last month, while economists polled by Reuters had forecast private employment increasing by 200,000, Reuters reported. Additionally, the ISM's Non-Manufacturing index dropped to 51.2 in March from 55.1 in February. The services sector's employment indicator slid as well to 45.8 from 47.6 in February.
US Treasury yields pressured
The data this week has been weighing on the Greenback and casting an eye over the last month, the US two-year yields, which reflect interest rate expectations, sank nearly 74 basis points (bps), the worst monthly fall since January 200.
Investors are fearful of a recession and are pricing in Federal Reserve rate cuts later in the year. The US two-year note was paying as little as 3.646% on the day while the yield on the 10-year note was down to a low of 3.268%. Both notes were poised to close at lows last seen in September as safe-haven buying pushed bond prices, which move opposite to their yields, higher.
Reuters reported that ´´futures priced in a 39.1% likelihood that the Fed raises its target rate by 25 basis points on May 3 when policymakers conclude a two-day meeting, down from 59.7% on Monday, CME's FedWatch Tool showed. Chances the Fed cuts rates by year's end also rose, with the outlook for the US central bank's target rate falling below 4.0% in December.
Nonfarm Payrolls eyed
Analysts at ANZ bank noted that ´´softer-than-consensus anecdotal US labour market data this week has fanned expectations that the jobs market may finally be cooling in response to Fed tightening.´´
The analysts explained that for Nonfarm Payrolls Friday, the Feb JOLTS (9.8k vs 10.6k last), March ISM services employment (-2.7 to 51.3) and March ADP (145k vs 261k last) all missed expectations and are pointing to downside risks to the market's 240k forecast.´´
´´The FOMC is currently anticipating a rapid slowing in the labour market. In fact, its forecast that unemployment will rise to 4.5% in Q4 envisions either a strong and unexpected rise in the participation rate and/or a persistent fall in payrolls,´´ the analysts added. ´´That looks a challenging proposition at present and with core PCE inflation ex-shelter sticky around 8.0% YoY, further Fed tightening seems appropriate.´´
-
00:12
NZD/USD Price Analysis: Eyes 0.6350 as RBNZ-Fed policy divergence expands
- NZD/USD is looking to seize back the 0.6350 resistance as RBNZ-Fed policy divergence expands.
- RBNZ Orr hiked its OCR by 50 bps while the street was estimating a rate hike of 25 bps.
- S&P500 futures have added losses further after a two-day losing streak, portraying a further decline in the risk appetite.
The NZD/USD pair is aiming to recapture the critical resistance of 0.6350 as the surprise interest rate decision of 50 basis points (bps) hike by the Reserve Bank of New Zealand (RBNZ) to 5.25% has expanded the RBNZ-Federal Reserve (Fed) policy divergence.
RBNZ Governor Adrian Orr hiked its Official Cash Rate (OCR) by 50 bps on Wednesday while the street was estimating a rate hike of 25 bps. The RBNZ went for a bumper rate hike despite signs of contraction. New Zealand’s inflation rate is not softening in the past three months, therefore, big rate hikes were needed to tame price pressures dramatically.
Meanwhile, S&P500 futures have added losses further after a two-day losing streak, portraying a further decline in the risk appetite of the market participants. The US Dollar Index (DXY) has sensed a pause while attempting to surpass the critical resistance of 102.00. Going forward, the USD Index will dance to the tunes of the United States Nonfarm Payrolls (NFP) data, which will release on Friday.
On a two-hour scale, NZD/USD is auctioning in a Rising Channel chart pattern in which each corrective move is considered a buying opportunity for the market participants. The Kiwi asset attempted a breakout of the aforementioned chart pattern on Wednesday but failed to keep the strength amid the presence of responsive sellers.
The 20-period Exponential Moving Average (EMA) at 0.6312 is providing support to the New Zealand Dollar.
Meanwhile, the Relative Strength Index (RSI) (14) has slipped into the 40.00-60.00 range after exhaustion in the upside momentum.
A decisive break above February 07 high at 0.6363 will expose the Kiwi asset to the round-level resistance at 0.6400 followed by December 05 high at 0.6443.
On the flip side, a breakdown of March 21 low at 0.6167 will drag the asset toward March 15 low at 0.6139. A slippage below the latter will expose the asset for more downside toward the round-level support at 0.6100.
NZD/USD two-hour chart

-
00:04
Silver Price Analysis: XAG/USD bulls occupy driver’s seat despite recent retreat to $25.00
- Silver price grinds higher after reversing from one-year top.
- Successful trading above the previously key resistance area, bullish MACD signals favor XAG/USD bulls.
- 10-month-old ascending resistance line, overbought RSI challenges Silver buyers.
Silver price (XAG/USD) seesaws around $25.00 during early Thursday, following a volatile Wednesday that initially refreshed a one-year high before marking the daily loss.
In doing so, the bright metal justifies the overbought RSI (14) while easing below an upward-sloping resistance line from April 2022.
It’s worth noting, however, that the quote marked a corrective bounce late Wednesday. The same could be linked to the XAG/USD’s inability to break three-month-old key support, previous resistance around $24.55-65. Additionally favoring the rebound are the bullish MACD signals.
Hence, the Silver price is likely to remain firmer unless breaking below $24.55.
Even if the quote breaks the stated resistance-turned-support, an ascending support line from the mid-March, near $24.05, can act as an extra filter towards the south.
Meanwhile, recovery moves may find it difficult to cross the multi-day-old resistance line, near $25.30 by the press time.
In a case where the Silver price ignores the overbought RSI and crosses the aforementioned resistance of around $25.30, the April 2022 high of around $26.25 may act as an intermediate halt during the likely run-up towards the previous yearly peak of $26.95.
Overall, the Silver price stays bullish despite the latest pullback. However, the metal’s north run is likely to remain long and bumpy.
Silver price: Daily chart
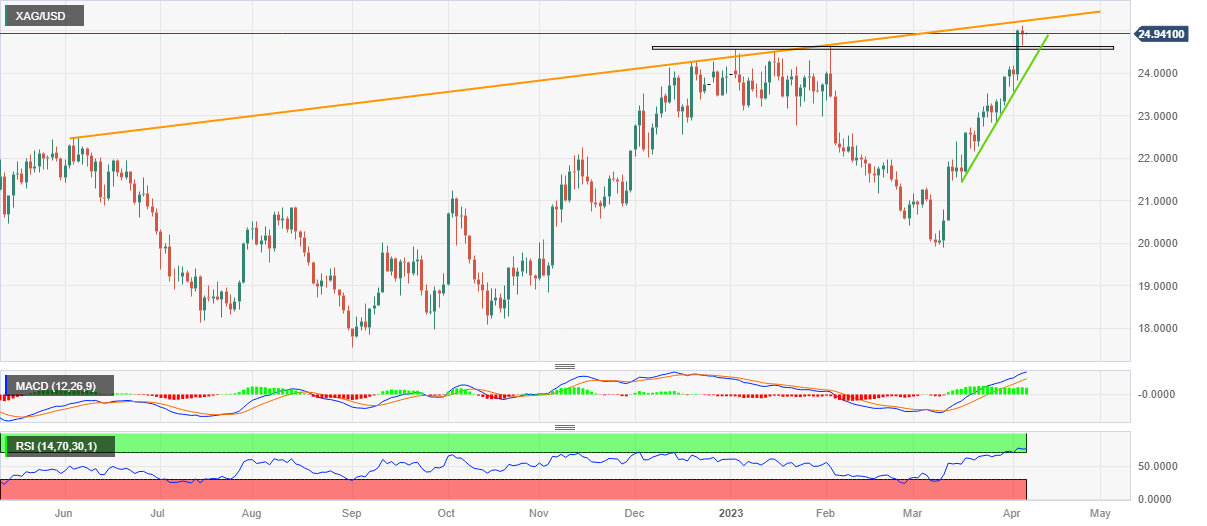
Trend: Limited upside expected
-