Notícias do Mercado
-
23:40
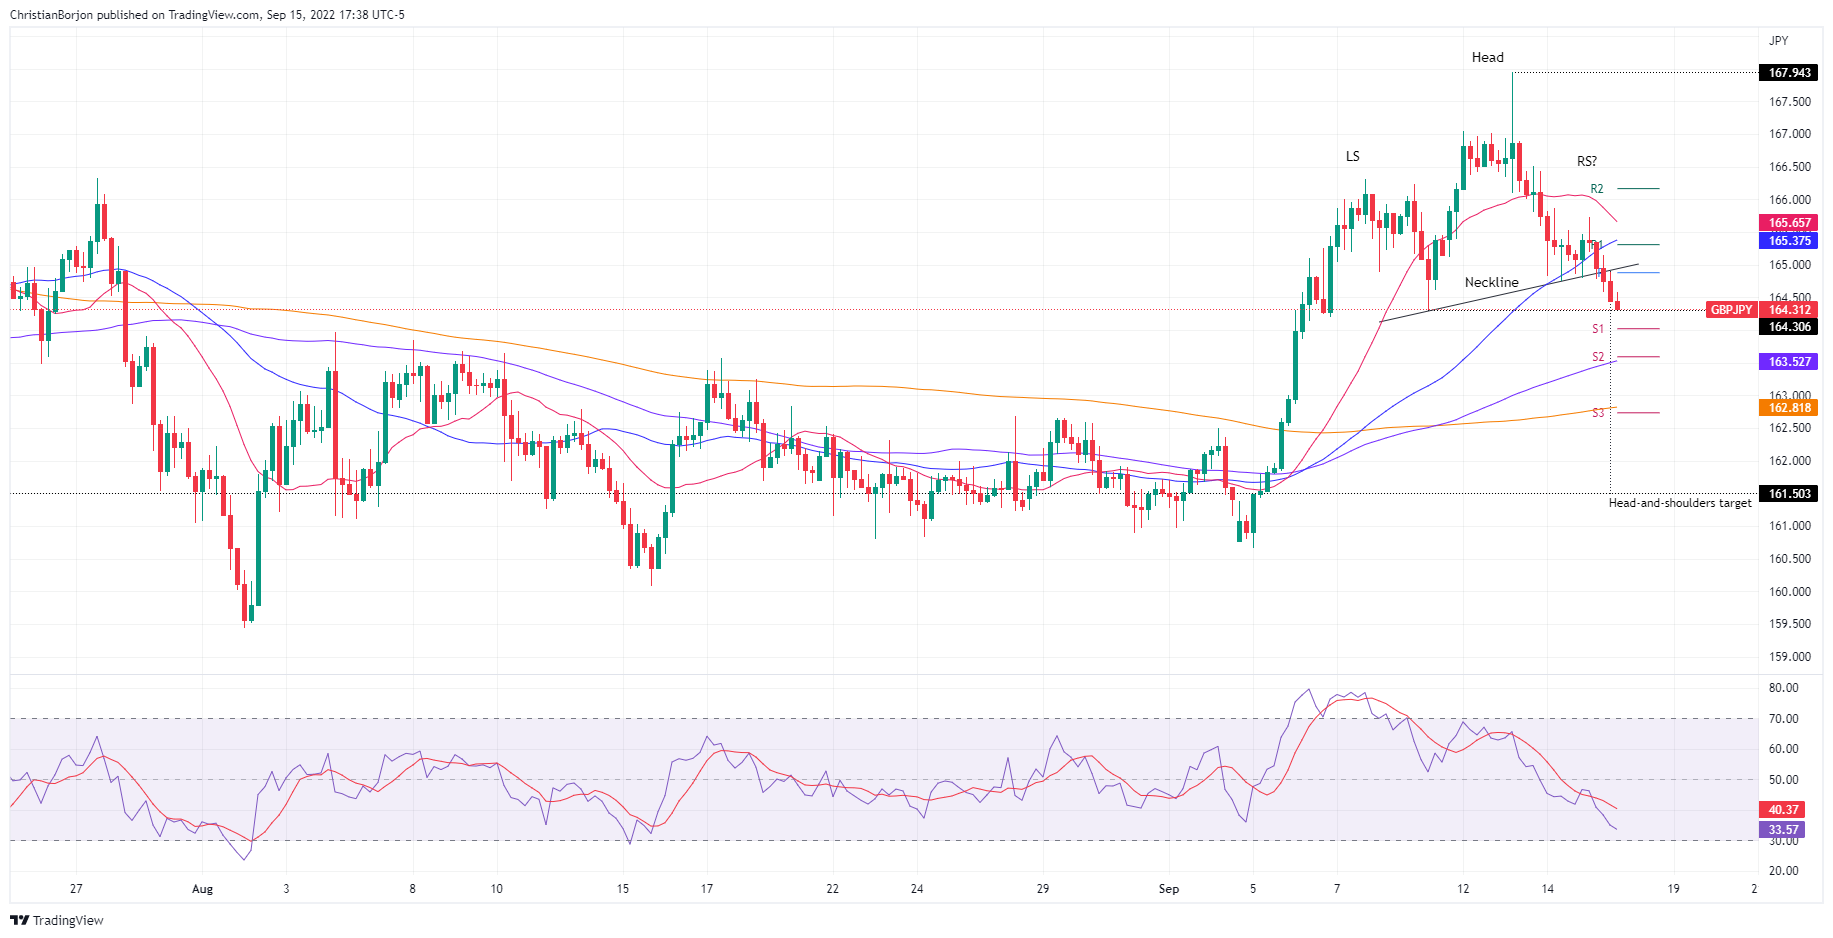
GBP/JPY Price Analysis: Head-and-shoulders chart pattern in the H4 targets a fall towards 161.50
- GBP/JPY is registering a minimal loss of 0.06% as the Asian session begins.
- A risk-off impulse, alongside Japanese authorities’ verbal intervention in the FX markets, bolstered the yen against most G8 currencies.
- The GBP/JPY 4-hour chart portrayed the formation of a head-and-shoulders pattern which targets a drop to 161.50.
On Thursday, the GBP/JPY extended its losses for the third consecutive trading day, courtesy of a risk-off impulse that kept investors leaning toward less risky assets, turning to the greenback alongside US Treasuries. Meanwhile, US equities finished with losses between 0.66% and 1.71%. At the time of writing, the GBP/JPY is trading at 164.31, below its opening price by 0.08%.
GBP/JPY Price Analysis: Technical outlook
During the week, the GBP/JPY hit a weekly high at around 167.94 before retreating due to some factors. Rumors of Japanese authorities intervening in the Forex Markets caused a Japanese yen repricing across most crosses. Therefore, the GBP/JPY tumbled on sentiment, though it’s testing the September 9 cycle low at 164.30. If the latter gives way, the pair could drop towards a confluence area with the 20, 50, and 100-day EMAs, around 163.00-34.
The GBP/JPY 4-hour chart confirms the bearish bias in the near term. A head-and-shoulders chart pattern emerged, which, measured by the distance of the head-to-the-neckline, would target a drop from current spot prices toward 161.50. therefore, the GBP/JPY first support would be the S1 pivot at 164.01. A breach of the latter will expose the confluence of the S2 daily pivot and the 100-EMA at 163.52, ahead of the confluence of the 200-EMA and the S3 pivot at 162.82, ahead of the161-50 target.
GBP/JPY Key Technical Levels
-
23:40
Gold Price Forecast: XAU/USD eyes further losses below $1,700 amid firmer yields, hawkish Fed bets
- Gold price dropped to the lowest levels since April 2020 on breaking the key support, tests 61.8% FE.
- US dollar cheers the data-driven strength of the yields, odds of Fed’s aggression.
- Risk-negative headlines from China, Europe also weigh on the XAU/USD price.
- Preliminary readings of Michigan Consumer Sentiment Index could entertain traders.
Gold price (XAU/USD) remains on the back foot at the 2.5-year low as bears attack $1660 support during Friday’s Asian session. The metal dropped the most since early July the previous day after breaking the short-term key support line. The reason could be linked to the firmer US dollar and yields that propel the hawkish Fed bets.
Increasingly hawkish Fed bets appear to be the underlying reason behind the US dollar’s strength, which in turn drowns the XAU/USD price. Also keeping the metal bears hopeful are the firmer yields backed by the mostly stronger data.
On Thursday, US Retail Sales rose 0.3% in August versus 0.0% expected and July’s revised down -0.4%. Further, NY Fed Empire State Manufacturing Index improved to -1.5 in September compared to -31.3 in August and market expectation of -13. Alternatively, Philadelphia Fed Manufacturing Index declined to -9.9 for the said month compared to 2.8 expected and 6.2 prior. Additionally, US Industrial Production slid to -0.2% in August versus a market expectation for an expansion of 0.1% and downwardly revised prior to 0.5%.
Additionally, pessimism emanating from China and Europe are an extra burden on metal prices. Bloomberg ran a piece suggesting that China is likely to witness harder days than it witnessed in 2020. On the same line was the news surrounding the Sino-American tussles and the People’s Bank of China’s (PBOC) inaction. Elsewhere, fears that the Eurozone will remain in dire conditions despite having a good stock for winter joined hawkish comments from the European Central Bank (ECB) policymakers to keep the pessimism higher.
Against this backdrop, Wall Street closed in the red and the US Treasury bond yields were firmer. Further, the market’s pricing of the Fed’s 0.75% and 1.0% rate hikes in the next week’s Federal Open Market Committee (FOMC) also rose to 80% and 20% in that per the CME’s FedWatch Tool.
Although the risk-aversion can keep the gold bears hopeful amid a firmer US dollar, today’s readings of the Michigan Consumer Sentiment Index (CSI) for September will be important to watch for fresh impulse.
Technical analysis
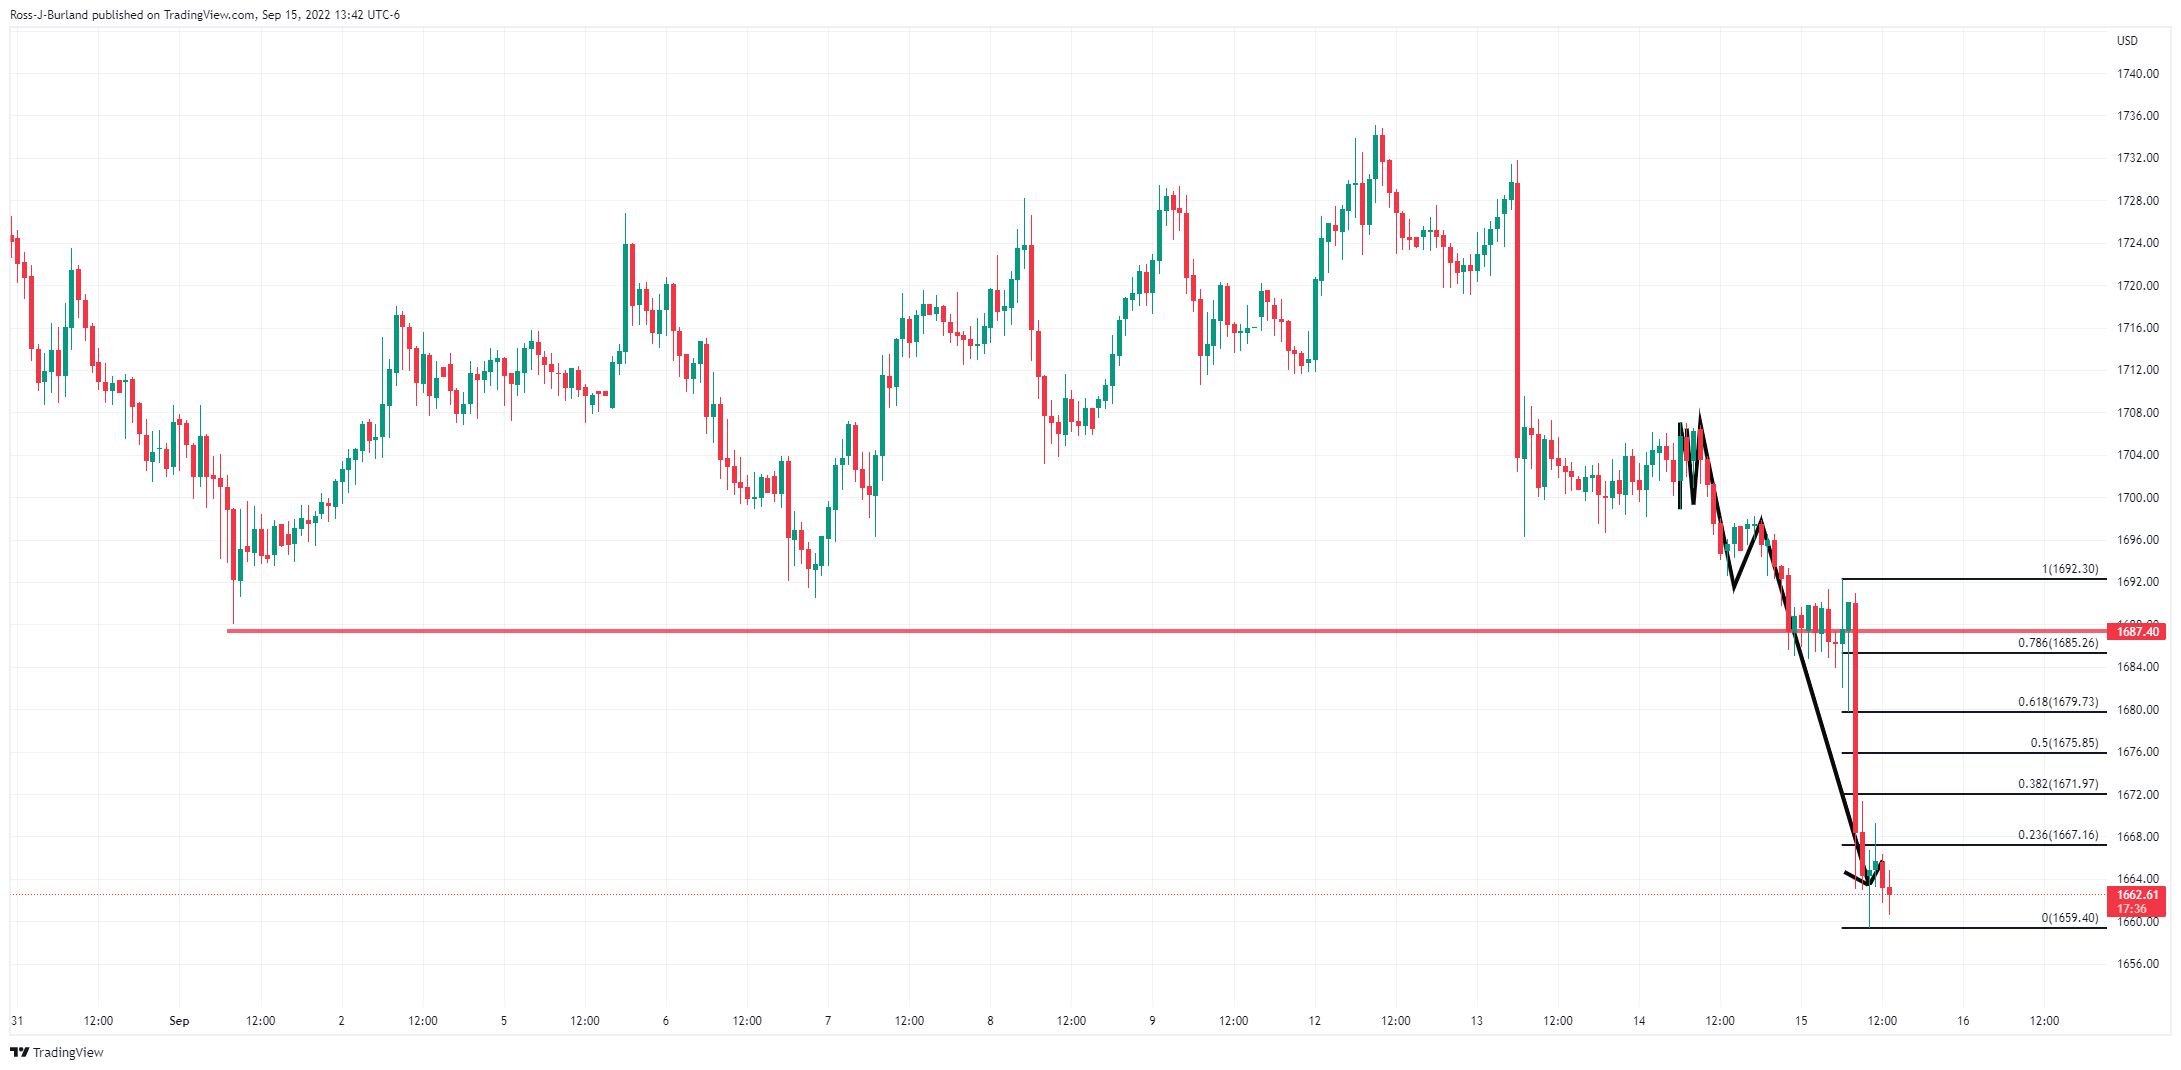
A sustained downside break of the two-month-old support line, now resistance around $1,695, joins the bearish MACD signals to keep XAU/USD sellers hopeful of a fresh multi-month low. However, the oversold RSI (14) challenges the immediate downside around the 61.8% Fibonacci Expansion (FE) of the bullion’s April-August moves, near $1,660.
Should the metal price drops below $1660, which is more likely, the 78.6% FE level near $1,622 and the $1,600 threshold could quickly flash on the chart. However, a downward sloping support line from May, near $1,593, could challenge the gold bears afterward.
Alternatively, recovery moves not only need to cross the support-turned-resistance line near $1,695 but should also stay successfully beyond the $1,700 threshold to convince intraday buyers.
Even so, the 21-DMA and a three-month-old descending resistance line, respectively near $1,718 and $1,765, will question the metal’s upside before welcoming the bulls.
Gold: Daily chart
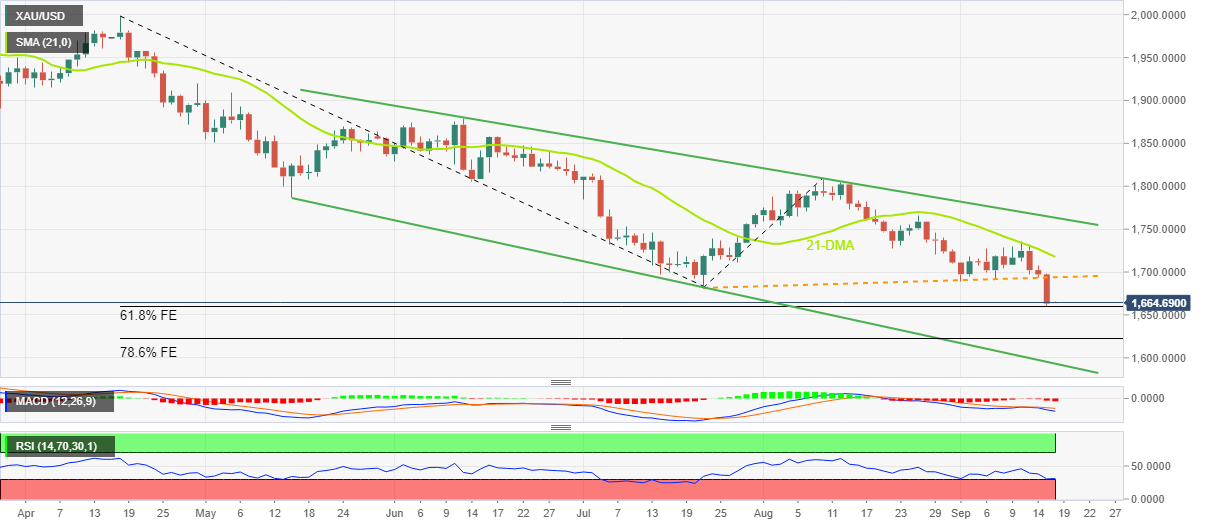
Trend: Further weakness expected
-
23:32
New Zealand Business NZ PMI above forecasts (52.5) in August: Actual (54.9)
-
23:25
EUR/USD hovers around 1.0000, downside remains favored ahead of US Michigan CSI
- EUR/USD is oscillating around 1.0000, more weakness expected on Eurozone stagflation fears.
- An unexpected improvement in US Retail Sales is keeping the DXY at elevated levels.
- Investors are blaming the ECB for underestimating the pace of inflation.
The EUR/USD pair is displaying back-and-forth moves below the magical figure of 1.0000 in the early Tokyo session. On a broader note, the asset has turned sideways in a range of 0.9955-1.0025 after nosediving from Tuesday’s high at 1.0187. Usually, a consolidation phase after a perpendicular fall is followed by a resumption in the downside move due to a lack of optimism in the market participants.
On Thursday, the asset displayed a less-confident pullback after re-testing Tuesday’s low around 0.9955. The pullback move is expected to conclude sooner and will convert into a sheer fall on higher expectations for US Michigan Consumer Sentiment Index (CPI).
The US consumer sentiment data is seen higher at 60 against the prior release of 58.2. It is worth noting that the sentiment data is in a recovery mode after dropping to 50 in June. In the past two months, the confidence of consumers is returning led by a solid labor market, falling gasoline prices, and higher growth prospects.
Also, the US Retail Sales data on Thursday landed higher at 0.3% against the expectations of stagnancy and the prior decline in retail demand by 0.5%. This indicates that the retail demand is returning and eventually the confidence of consumers despite higher-than-expected inflationary pressures.
On the Eurozone front, investors should brace for a period of stagflation amid a deepening energy crisis and an accelerating price rise index. Investors are blaming the European Central Bank (ECB) for underestimating the pace of price pressures. A delayed response by ECB policymakers towards the inflation mess has pushed it to 9.1% and a consensus for a double-digit figure cannot be ruled out.
-
23:14
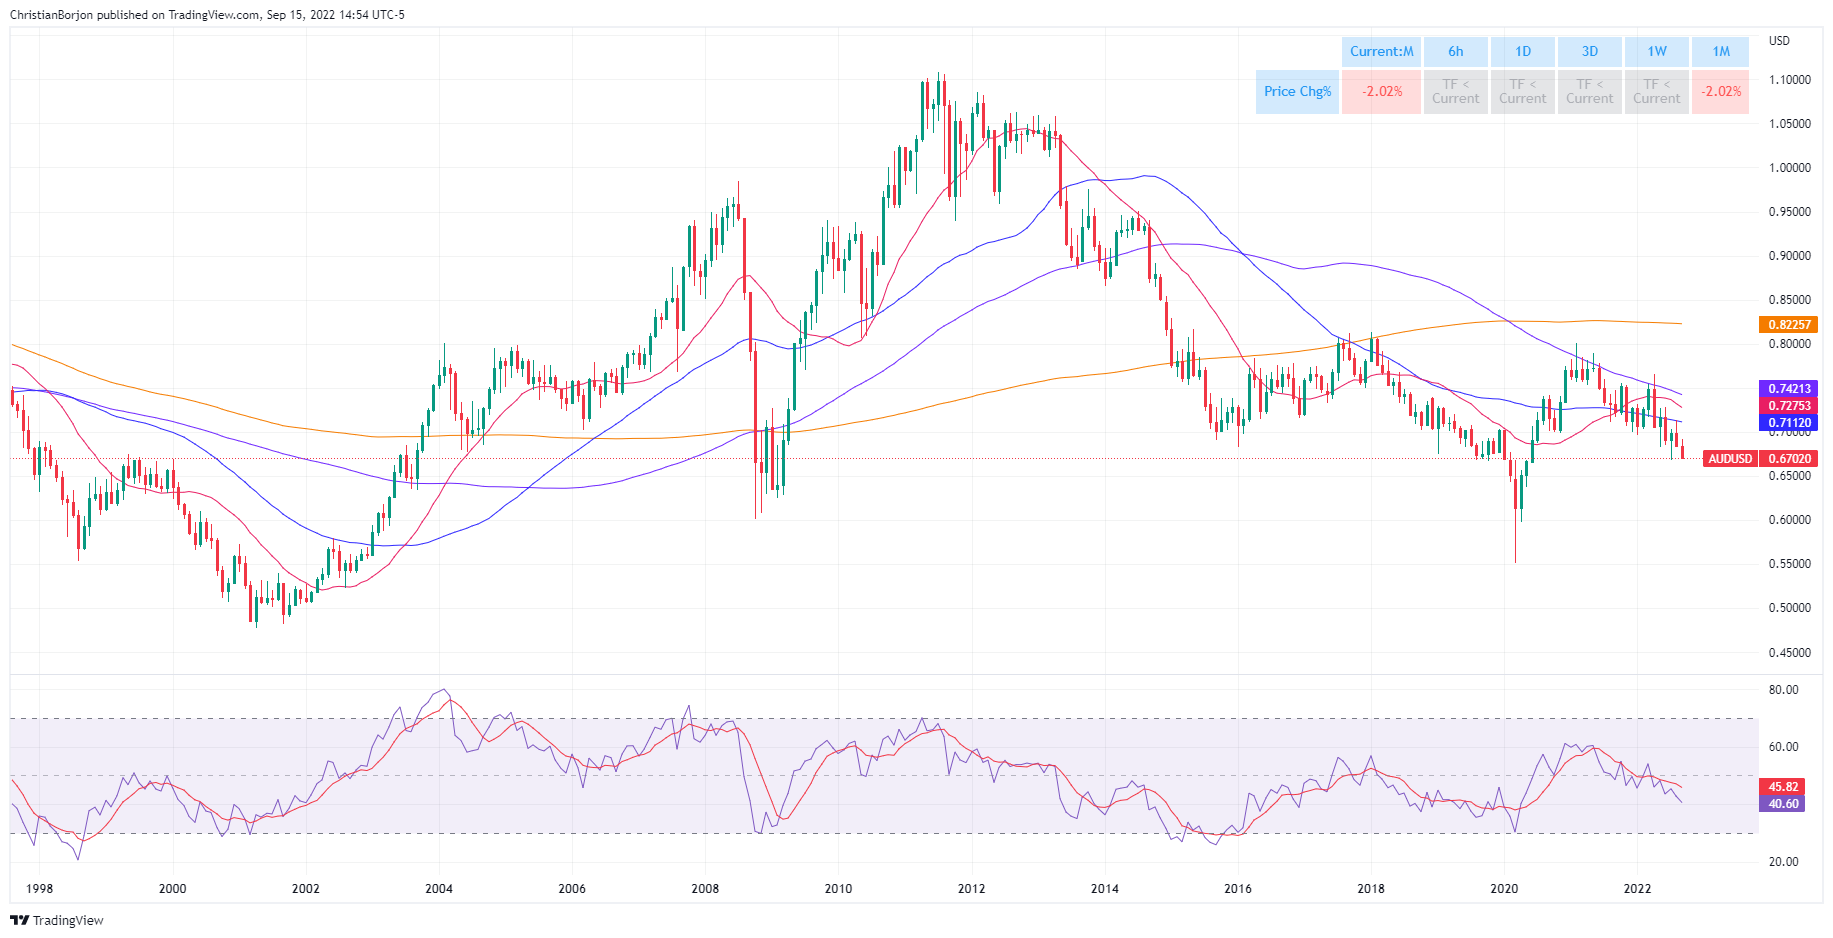
AUD/USD bears poke 0.6700 key support, China data dump, RBA’s Lowe eyed
- AUD/USD remains pressured at the lowest levels in two months, sellers attack upward sloping support line from July.
- Mostly firmer US data, fears surrounding China’s economy and mixed Aussie jobs report pleased bears.
- Firmer yields, hawkish Fed bets could keep focus on the next week’s FOMC.
- China’s Industrial Production, Retail Sales for August will precede US Michigan Consumer Index to direct intraday moves.
AUD/USD holds lower ground near the yearly bottom marked in July, poking the two-month-old support line, as risk-aversion propels the US dollar ahead of the day’s key catalysts. That said, the Aussie pair drops to 0.6696 by the press time.
Strong US data joined pessimism surrounding China and Europe, as well as mixed Australia employment and inflation expectations numbers, to weigh on the AUD/USD prices the previous day.
US Retail Sales rose 0.3% in August versus 0.0% expected and July’s revised down -0.4%. Further, NY Fed Empire State Manufacturing Index improved to -1.5 in September compared to -31.3 in August and market expectation of -13. Alternatively, Philadelphia Fed Manufacturing Index declined to -9.9 for the said month compared to 2.8 expected and 6.2 prior. Additionally, US Industrial Production slid to -0.2% in August versus market expectation for an expansion of 0.1% and downwardly revised prior of 0.5%.
At home, Australia’s Employment Change rose to 33.5K in August, versus 35K expected and -40.9K prior. Further, the Unemployment Rate also rose beyond 3.4% market consensus and the previous readings to 3.5% whereas the Participation Rate matched 66.6% forecasts during the stated period versus 66.4% prior. Also, Australia’s Consumer Inflation Expectations softened to 5.4% for September versus 6.7% expected and 5.9% prior.
It should be noted that Bloomberg ran a piece suggesting that China is likely to witness harder days than it witnessed in 2020. On the same line was the news surrounding the Sino-American tussles and the People’s Bank of China’s (PBOC) inaction. Elsewhere, fears that the Eurozone will remain in dire conditions despite having a good stock for winter joined hawkish comments from the European Central Bank (ECB) policymakers to keep the pessimism higher.
Amid these plays, Wall Street closed in the red and the US Treasury bond yields were firmer. Further, the market’s pricing of the Fed’s 0.75% and 1.0% rate hikes in the next week’s Federal Open Market Committee (FOMC) also rose and weighed on the AUD/USD prices.
Looking forward, China’s monthly data dump including the Industrial Production, Retail Sales and housing numbers for August could offer immediate directions. Following that, Reserve Bank of Australia (RBA) Governor Philip Lowe’s Testimony and preliminary readings of the Michigan Consumer Sentiment Index (CSI) will be crucial for nearby directions. Above all, bears are likely to keep reins amid anxiety ahead of the Fed meeting.
Technical analysis
With the AUD/USD pair’s U-turn from the 50-DMA, around 0.6890 by the press time, joining the lack of oversold RSI (14) and bearish MACD signals, the pair is all set to revisit the yearly low near 0.6680.
-
23:05
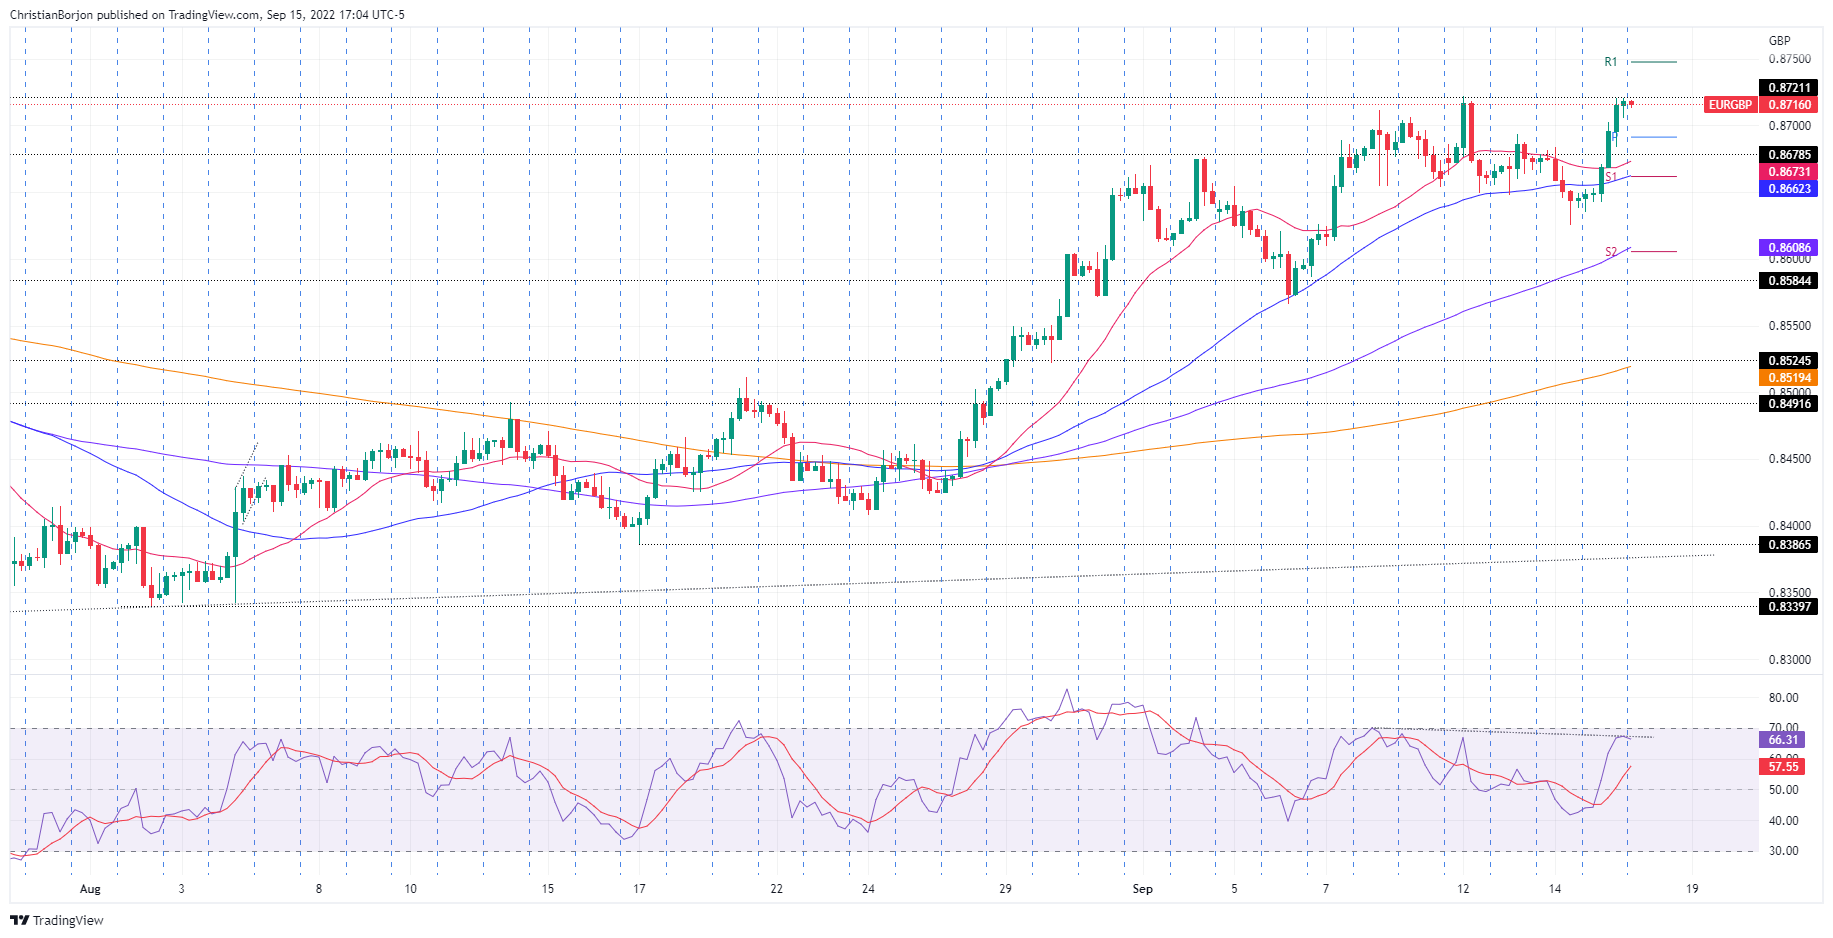
EUR/GBP Price Analysis: Probing the 2022 YTD highs above 0.8700
- The EUR/GBP extended its gains, despite the overall bearish bias in euro crosses.
- From a daily chart perspective, the EUR/GBP is headed upwards.
- Short term, the EUR/GBP 4-hour chart suggests the cross could drop before recording a fresh YTD high.
On Thursday, the EUR/GBP rallied for the second day in the week, registering a fresh weekly high at around 0.8720, spurred by overall British pound courtesy, amidst uncertainty around the new Prime Minister Liz Truss’s government. At the time of writing, the EUR/GBP is trading at 0.8717, unchanged as the Asian session begins.
EUR/GBP Price Analysis: Technical outlook
The EUR/GBP advanced for the second day during the week, facing a solid resistance near the YTD high at 0.8721. The Relative Strength Index (RSI) is headed north but shifted flat around 66.93, with little room before reaching overbought conditions after last week’s ECB’s decision, ahead of the following week’s BoE. It’s worth noting that a decisive break above 0.8721 could pave the way towards the 0.8800 mark, but price action might shift choppy, in the vicinity of a 50 bps rate hike by the BoE.
The EUR/GBP 4-hour scale offers a different bias than the daily chart. Even though the moving averages (EMAs) are below the spot price, the divergence between the RSI, recording lower highs, and price action at higher highs might open the door for further downside.
Therefore, the EUR/GBP first support would be the 0.8700 mark, followed by the daily pivot at 0.8691, followed by the confluence of the 50-EMA and the S1 pivot point at 0.8660/62. Once cleared, the cross will tumble towards the confluence of the S2 pivot and the 100-EMA at around 0.8605/08.
EUR/GBP Key Technical Levels
-
22:51
GBP/USD declines towards 1.1400 on lower consensus for UK Retail Sales
- GBP/USD is expected to scale down further towards 1.1400 ahead of UK Retail Sales data.
- As per the estimates, UK Retail Sales will drop by 4.2% on an annual basis.
- The DXY is maintaining itself at elevated levels on higher-than-expected US Retail Sales data.
The GBP/USD pair has surrendered the psychological support of 1.1500 and is declining towards a multi-decade low at 1.1400. The asset has extended its losses after dropping below Wednesday’s low at 1.1480 and more downside looks certain amid downbeat consensus for the UK Retail Sales data. An upbeat US Retail Sales data released on Thursday is responsible for the establishment of the cable below the psychological support of 1.1500.
On Thursday, the US Retail Sales landed at 0.3%, higher than the expectations of 0% and the prior release of -0.4%. As the retail demand has expanded by 0.3%, investors keep the US dollar index (DXY) at elevated levels.
The investing community is aware of the fact that the inflationary pressures have yet not responded well to the soaring interest rates by the Federal Reserve (Fed). And, higher interest rates always decline the value of paychecks received by the households. But growth prospects, retail demand, and labor market are extremely robust in the US economy, which is shielding the economy against the consequences of red-hot inflation.
On the pound front, investors are dumping sterling ahead of the UK Retail Sales data. The economic data is expected to decline by 4.2% against a decline of 3.4% reported earlier on an annual basis. Also, the monthly figure will display a decline of 0.5% against a rise of 0.3% reported earlier. The overall demand in the UK economy is getting poor led by higher energy bills and a worsening labor market. This indicates a significant decline in the confidence of consumers in the economy.
-
22:17
Forex Today: The greenback keeps on keeping on
Here is what you need to kow for Friday 16 Sep.
The US dollar keeps its dominance as the case for ongoing aggressive hikes by the Federal Reserve dominates the markets. DXY, which measures the greenback vs. a basket of major rivals ended the North American session flat but put in a high of 109.21 within the upper end of this week's bullish channel having climbed from a low of 109.42
Retail Sales moved up 0.3% last month and the US dollar has held near recent peaks, supported by the view that the Federal Reserve will keep tightening policy aggressively. The data of late, including this week's surprise increase in consumer prices in August, has reinforced the bullish case for the greenback as investors price in a third consecutive 75-basis-point rate hike next Wednesday.
Meanwhile, the US 10-year yield climbed 5bps to 3.45%, and key majors, such as the yen came back under pressure despite authorities that verbally intervened, jawboning the currency following sharp declines.USD/JPY fell to 143.33.
GBP/USD bulls were attempting a correction from an important support area near the midpoint of the 1.1400 area, with the price recovering from a low of 1.1462 and now testing the bear's commitments at 1.1500.
EUR/USD remained trapped between a key 4-hour channel and consolidated ahead of 1.0025 and 0.995 breakout levels. On an hourly basis, the pair moved sideways, coiling for a move either way.
As for the Australian dollar, it traded between a daily high at around 0.6770 and the bears moved in on the key 0.67 level, piercing it to a low of 0.6899. The price levelled out after yesterday's employment report was solid, adding 33.5K employments in August, in line with forecasts, while the unemployment rate rose to 3.5% from 3.4%. ANZ bank analysts expect that the Reserve Bank of Australia (RBA) will lift rates by 50 bps.“An overall solid labor market report adds to the case made by the strong NAB business survey and US CPI data earlier this week for the RBA to hike the cash rate 50bp in October,” said analysts at ANZ. This brings the market into a consolidation phase into the weekend.
On the commodities front, WTI fell to $84.9/bbl as the US Department of Energy said their restocking of oil reserves would likely involve deliveries after the fiscal year 2023. Gold slipped 1.4% to $1,662.
-
22:01
South Korea Export Price Growth (YoY) below forecasts (22.9%) in August: Actual (13.4%)
-
22:00
South Korea Import Price Growth (YoY) registered at 22.9%, below expectations (23.1%) in August
-
21:48
NZD/USD bears move in on key support into the last hour
- NZD/USD bears are treading on firm bullish territory at demand.
- The RBNZ is now a key market focus and eyes on 0.6000.
NZD/USD was lower on the day as the greenback came back to push the commodity bloc lower, with the bird hanging over a key support level around the midpoint of the 0.5900s. Headlining into the close of the New York session, NZD/USD was down some 0.5% on the day following a resurgence of the greenback that shattered the bulls.
''Kiwi is lower this morning, having made a more convincing break below 0.60 overnight as risk appetite wavers and US bond yields edge higher again. The more substantive overnight move should quell any debate about whether the 0.60 level has been sustainably breached or not, and technically, it brings 0.5940 (the 76.4% Fibo of the 2020/21 rally) and 0.5915 (the May 2020 low after the April 2020 bounce) into focus, analysts at ANZ Bank explained.
Ahead of next week's key meeting, the markets expect 75 basis points when its policy committee meets next week and lower market hopes for a smaller increase. However, there is a one-in-five chance that the Fed will raise rates by a full percentage point, up from zero a day before the CPI report according to FEDWATCH.
''FX sentiment remains USD/globally driven, and the Kiwi struggled to garner any support from Gross Domestic Product data yesterday. Surprising as that was, given the size of the miss, what that tells you is that the market will be sensitive to next week’s Fed “75 or 100bps” rate hike decision,'' the analysts said.
-
20:56
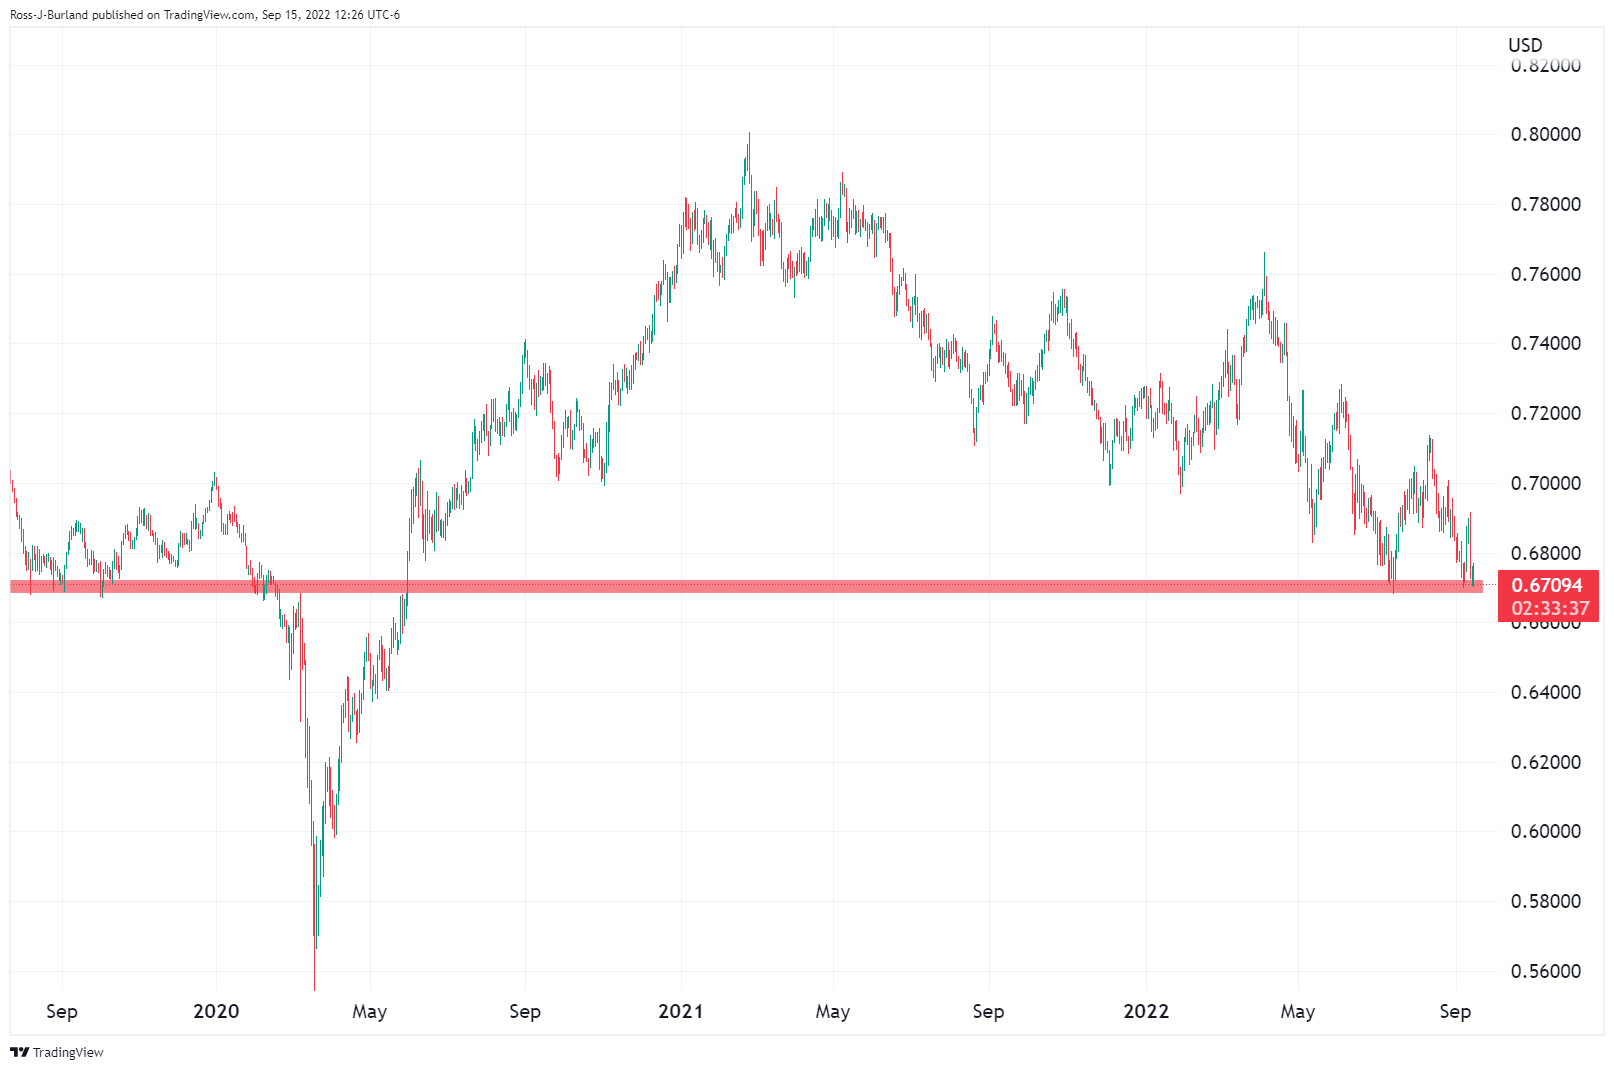
AUD/USD drops to fresh two-month lows, below 0.6700
- The Aussie dollar briefly traded below the 0.6700 figure, at around 0.6695.
- Positive US economic data further concrete the case for a Fed 75 bps interest rate increase.
- AUD/USD Price Analysis: A daily close below 0.6700 would expose the pair to selling pressure.
The Australian dollar continues to weaken against the greenback, failing to recover after Tuesday’s hot US inflation report spurred expectations that the US Federal Reserve might tighten even 100 bps in September’s monetary policy meeting. Nevertheless, with the CME FedWatch Tool, odds for a large increase lie at 20%, less than the 80% chance of a 75 bps rate hike.
Therefore, the AUD/USD is down, after hitting a daily high at around 0.6770, but is tumbling sharply. At the time of writing, the AUD/USD trades at 0.6702, above the 0.6700 psychological level.
AUD/USD stumbles below the 0.6700 figure on Fed’s aggressive estimates
US data released earlier during the day confirms that the Federal Reserve would likely continue to tighten monetary conditions. A solid US Retail Sales report in August, with sales bouncing 0.3% MoM above estimates, cements the case for the Fed hiking 75 bps. The year-over-year figure was 9.37%, lower than July’s figures.
At the same time, the US Labor Department showed that Initial Jobless Claims for the past week, ending on September 10, decelerated by 213K, lower than economists’ estimates of 227K, showing the labor market’s resilience.
Elsewhere, the New York and Philadelphia Fed Manufacturing Indices were mixed. The Empire State, albeit improving, remained in contractionary conditions, while the Philadelphia Fed index dropped to the contractionary part after rebounding in the August report
On the Australian side, the employment report was solid, adding 33.5K employments in August, in line with forecasts, while the unemployment rate rose to 3.5% from 3.4%. ANZ bank analysts expect that the Reserve Bank of Australia (RBA) will lift rates by 50 bps.
“An overall solid labor market report adds to the case made by the strong NAB business survey and US CPI data earlier this week for the RBA to hike the cash rate 50bp in October,” said analysts at ANZ.
What to watch
The Australian economic docket will be light, reporting the Consumer Sentiment Index (CSI). The US economic docket will feature the University of Michigan Consumer Sentiment alongside consumer inflation expectations.
AUD/USD Price Analysis: Technical outlook
From a daily chart perspective, the AUD/USD is downward biased, with room to challenge the YTD low at 0.6681. The Relative Strength Index (RSI) pointing downwards, below the 50-midline, confirm the bearish bias in the major, with enough room to spare, before reaching oversold territory. Therefore, the AUD/USD first support would be 0.6681, which, once cleared, would expose the 0.6600 figure on its way towards May 2020 lows at 0.6372.
-
20:53
Gold Price Forecast: XAU/USD is pulling in the bid following big drop
- Gold bears take the lead but the bulls are making their move.
- The US dollar is taking the lead ahead of the Fed, causing a capitulation in the yellow metal.
Gold prices have settled down into the late session of the New York trade but it begs more from the bears at this juncture as the gold price rest at key support. On the day, the yellow metal dropped heavily from a high of $1698.32 to a low of $1,660.43. The bulls need to commit here, at the lowest since May 2020.
Pressures come as the greenback US bond yields keep rising ahead of next week's Federal Reserve's policy committee meeting. Analysts at TD Securities explained that the precious metal has broken the'' $1700/oz support as aggressive Fed expectations are being priced in.''
''We expect continued outflows from money managers and ETF holdings to weigh on prices, which ultimately raises the probability of a pending capitulation from the small number of family offices and proprietary trading shops who hold complacent length in gold. The persistence of inflation continues to support an aggressive effort by the Fed.''
Traders are of the view that the Federal Reserve will keep tightening policy aggressively. The data of late, including this week's surprise increase in consumer prices in August, has reinforced the bullish case for the greenback as investors price in a third consecutive 75-basis-point rate hike next Wednesday.
The analysts at TD Securities note that ''indeed, gold and silver prices have tended to display a systematic underperformance when markets expect the real level of the Fed funds rate to rise above the neutral rate, as estimated by Laubach-Williams.''
Gold technical analysis
As per the prior analysis, the price of gold has indeed headed lower:
Gold H1 chart
The bears have well and truly made their move.
And from here...
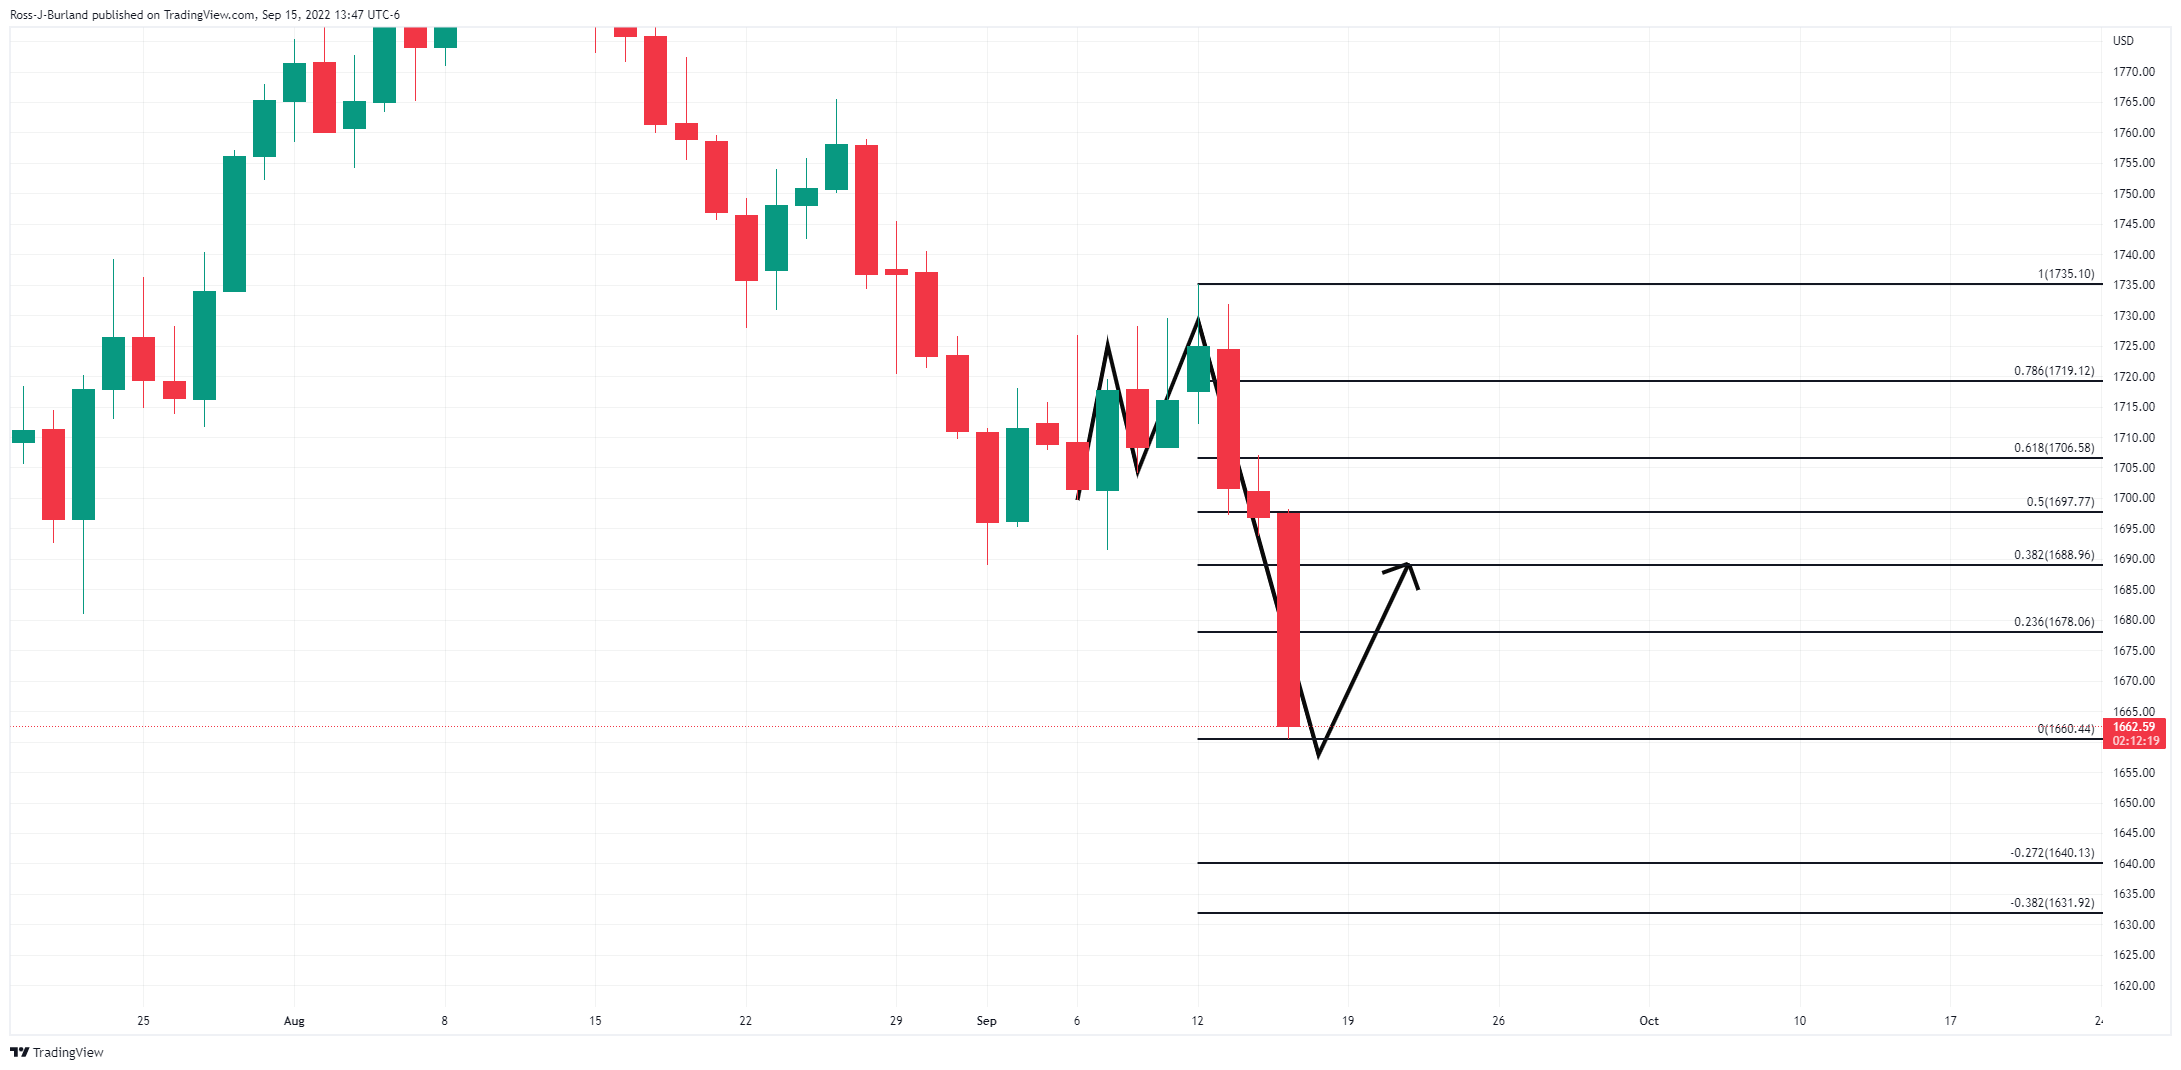
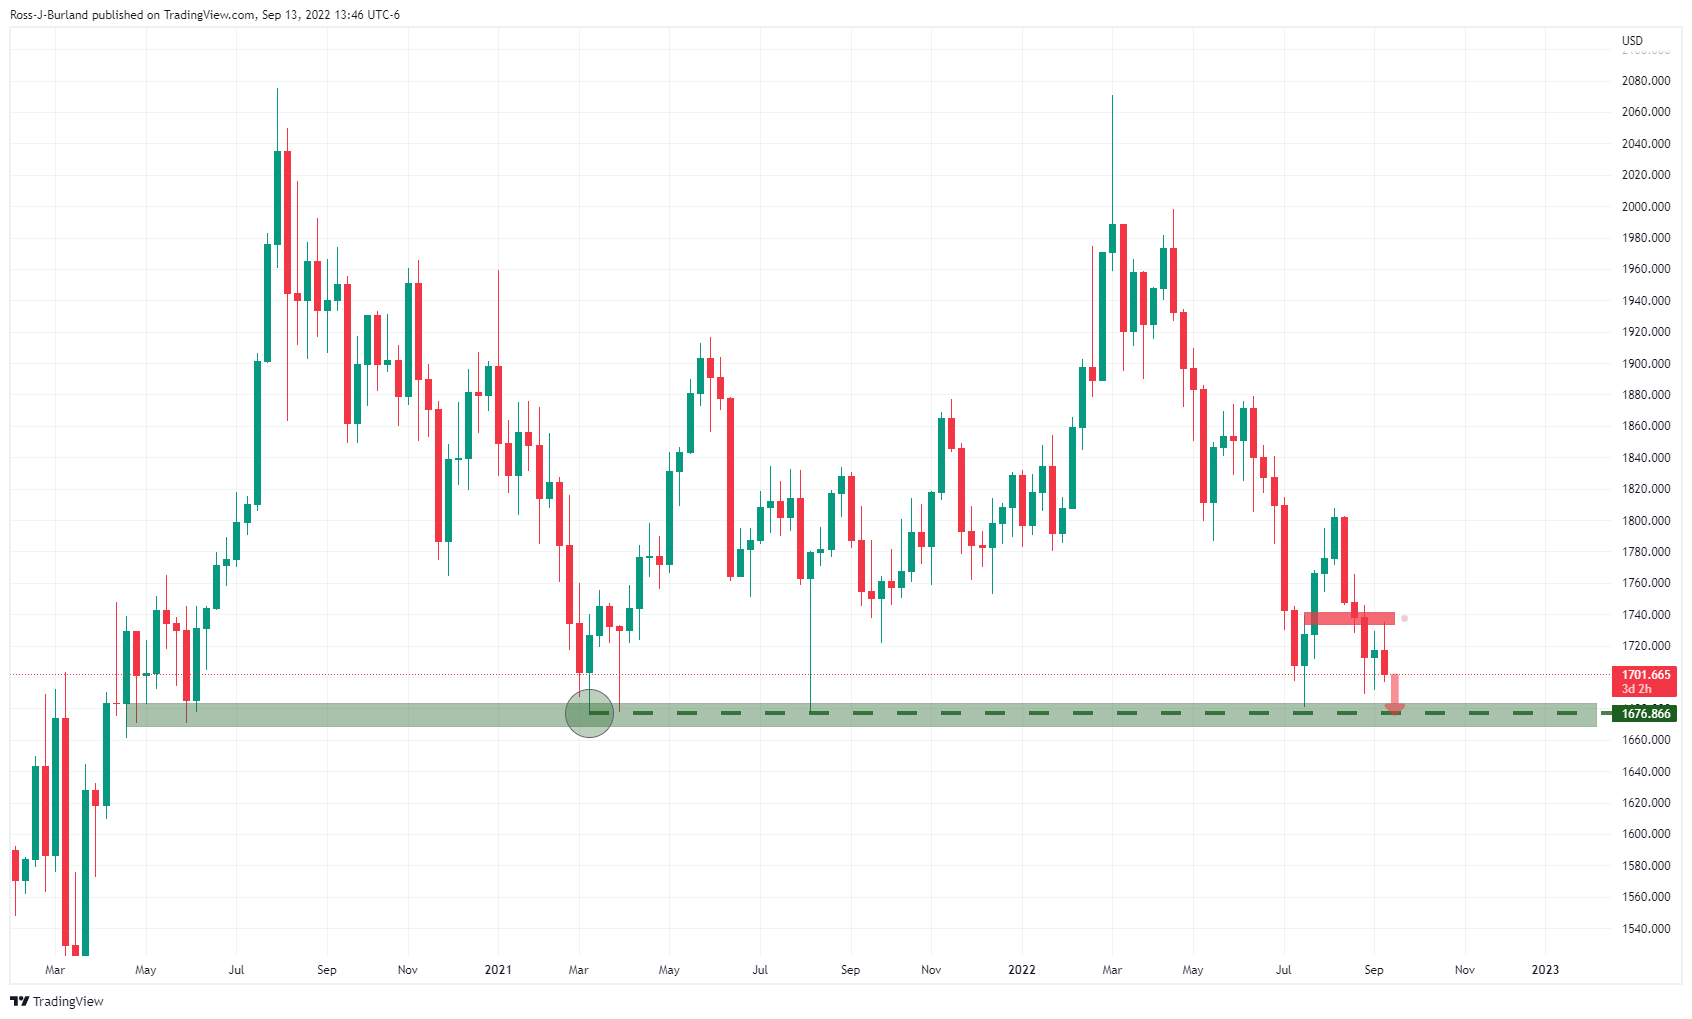
The daily M-formation is now compelling for a retracement into the prior lows that meets that 38.2% Fibonacci retracement area.
-
20:20
Colombia Industrial output (YoY) below expectations (7.1%) in July: Actual (5.2%)
-
20:20
Colombia Retail Sales (YoY) came in at 7.7%, below expectations (12.8%) in July
-
19:58
USD/CAD Price Analysis: Rallies above the 1.3200 figure, threatening to clear the YTD high
- USD/CAD approaches the YTD high at around 1.3223, amidst a risk-off mood.
- If USD/CAD buyers hold the fort above 1.3200, it could open the door for further gains, as they eye 1.3300.
The USD/CAD conquers the 1.3200 figure for the third time during the year, reaching a fresh weekly high, but shy of the YTD high reached on July 14 at 1.3227. The USD/CAD is trading at 1.3222, above its opening price by 0.39% at the time of writing.
USD/CAD Price Analysis: Technical outlook
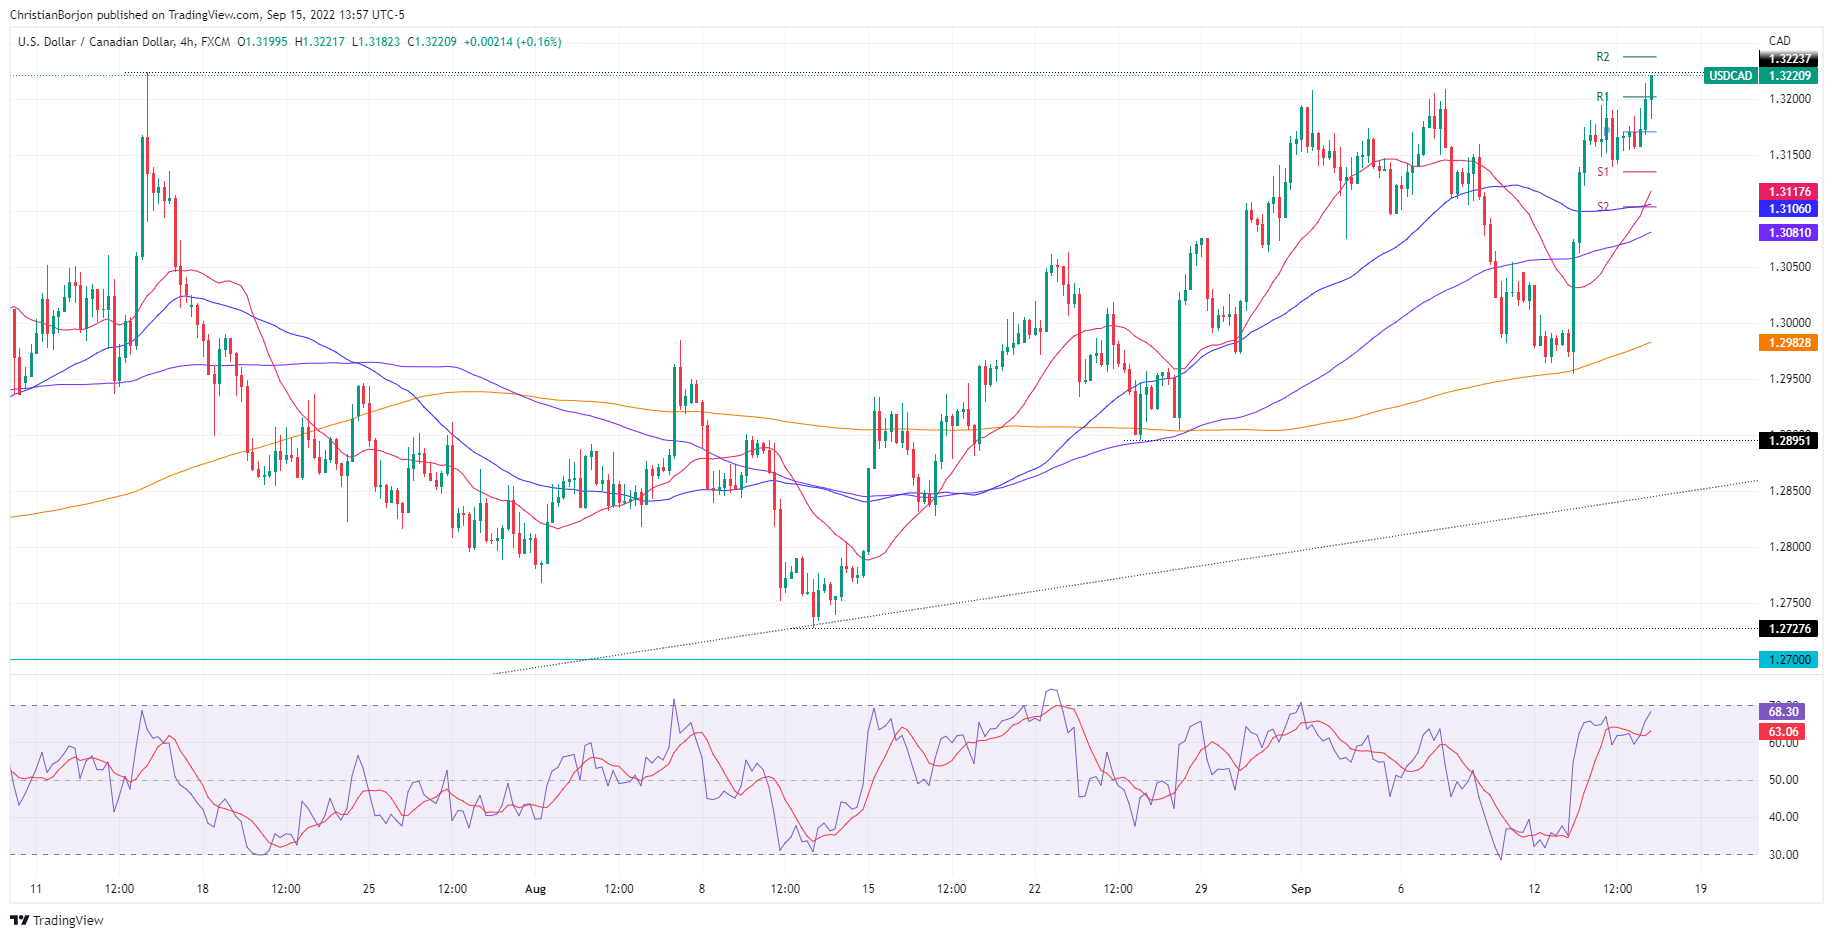
The USD/CAD continued extending its gains throughout the week. After Tuesday’s gains of 1.36%, the major stabilized around the day’s highs, shy of the YTD peak, eyeing a break above that could pave the way towards 1.3300. Worth noting that the Relative Strength Index (RSI) remains in bullish territory, with some room before reaching overbought conditions, suggesting that a 1.3300 test is on the cards.
Near term, the USD/CAD four-hour chart shows the major testing of the 1.3200 figure for the third time in the month, poised to print a fresh YTD high above 1.3220. If buyers clear the 1.3227 YTD high, a move towards 1.3300 is likely to happen, but firstly it would need to overcome some hurdles on its way up.
The USD/CAD first resistance would be the YTD high at 1.3227. The break above will expose the R2 pivot point at 1-3237, followed by the R3 daily pivot at 1.3268, ahead of the 1.3300 figure.
On the flip side, the USD/CAD failure to hold above 1.3200 could pave the way for further downside. Therefore, the USD/CAD first support would be the daily pivot at 1.3172. Once it’s cleared, it would expose support levels, like the S1 daily pivot at 1.3134, followed by the 20-EMA at 1.3117, ahead of the S2 pivot at 1.3104.
USD/CAD Key Technical Levels
-
19:46
AUD/USD Price Analysis: Bearish bias persits as bears take control at key daily support
- AUD/USD bears seeking a break of 0.67 the figure.
- Meanwhile, the US dollar is stuck in a range, breakout traders are on alert.
AUD/USD shows no sign of correcting at this stage on a longer-term time frame basis, as illustrated below and threatens a break of key support in the following analysis:
AUD/USD daily chart
AUD/USD H1 chart
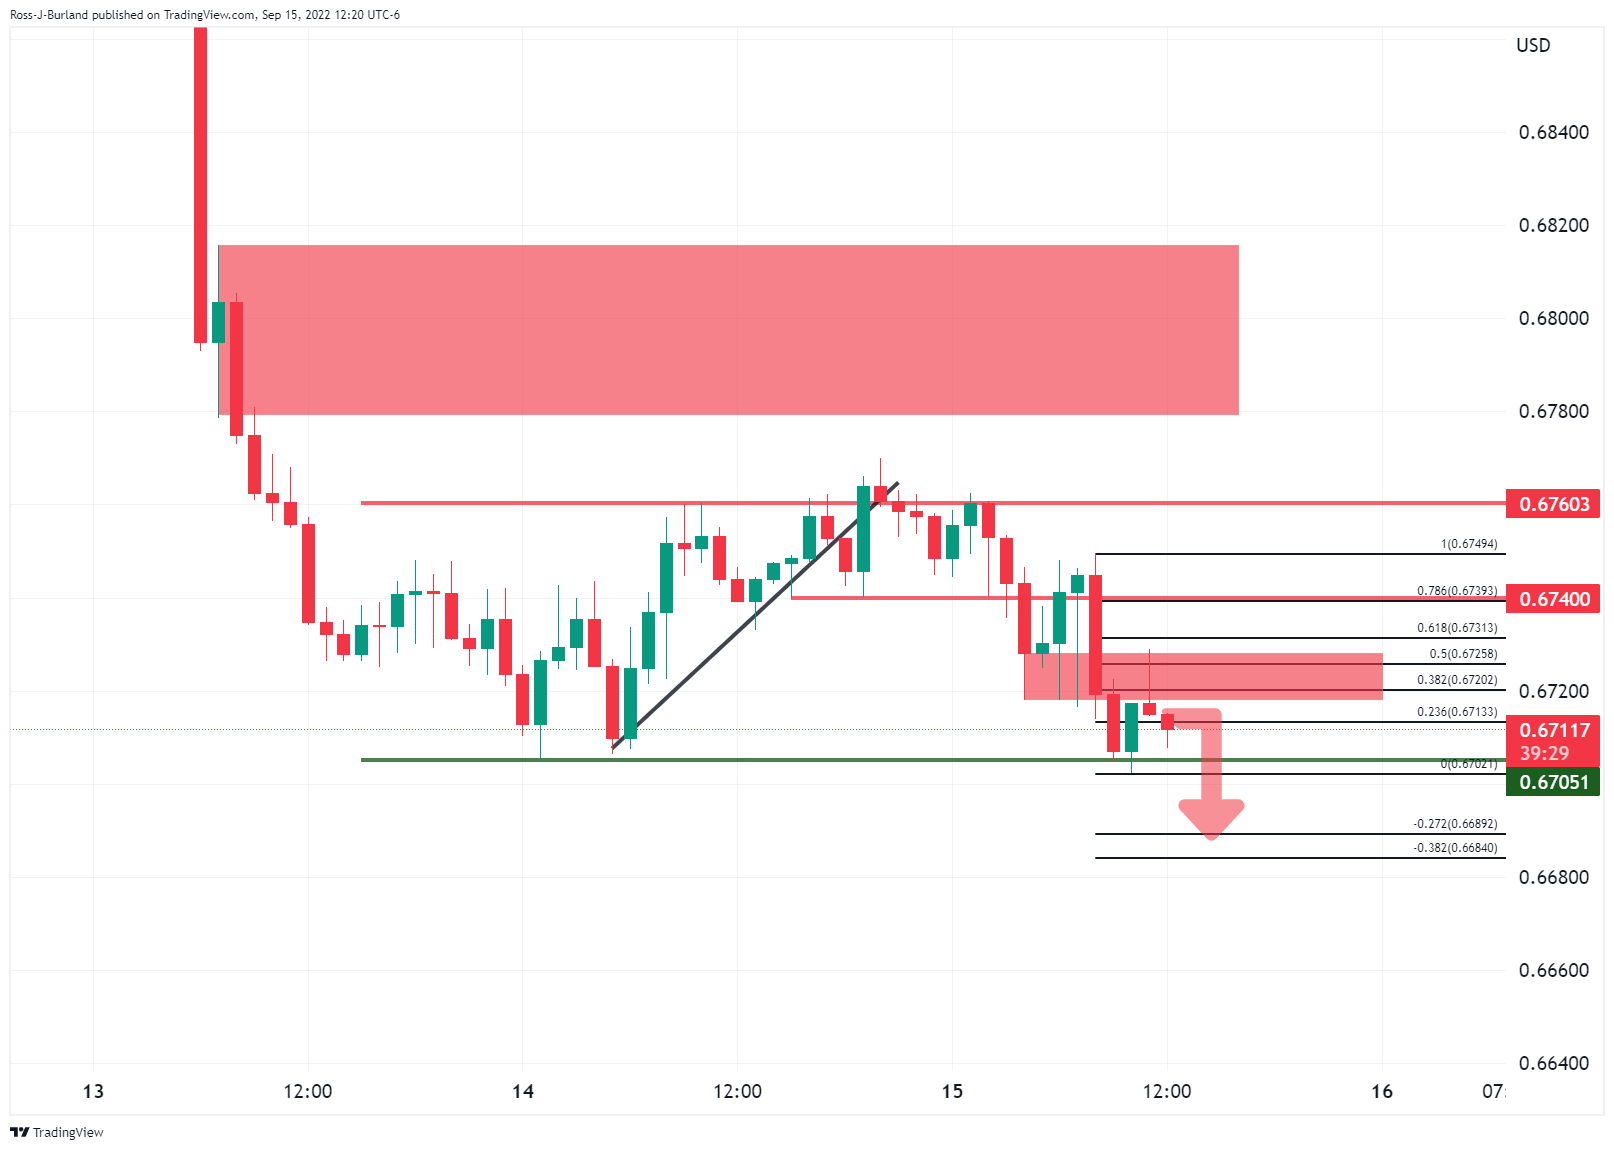
Meanwhile, the bears will be looking for an engulfing formation below the pin bar that has tapped the lower quarter of the 0.67 area that has pierced the 50% retracement of the latest bearish impulse on the hourly time frame. This is an area of confluence as per the wicks there and the bias is to the downside below 0.6750 tops.
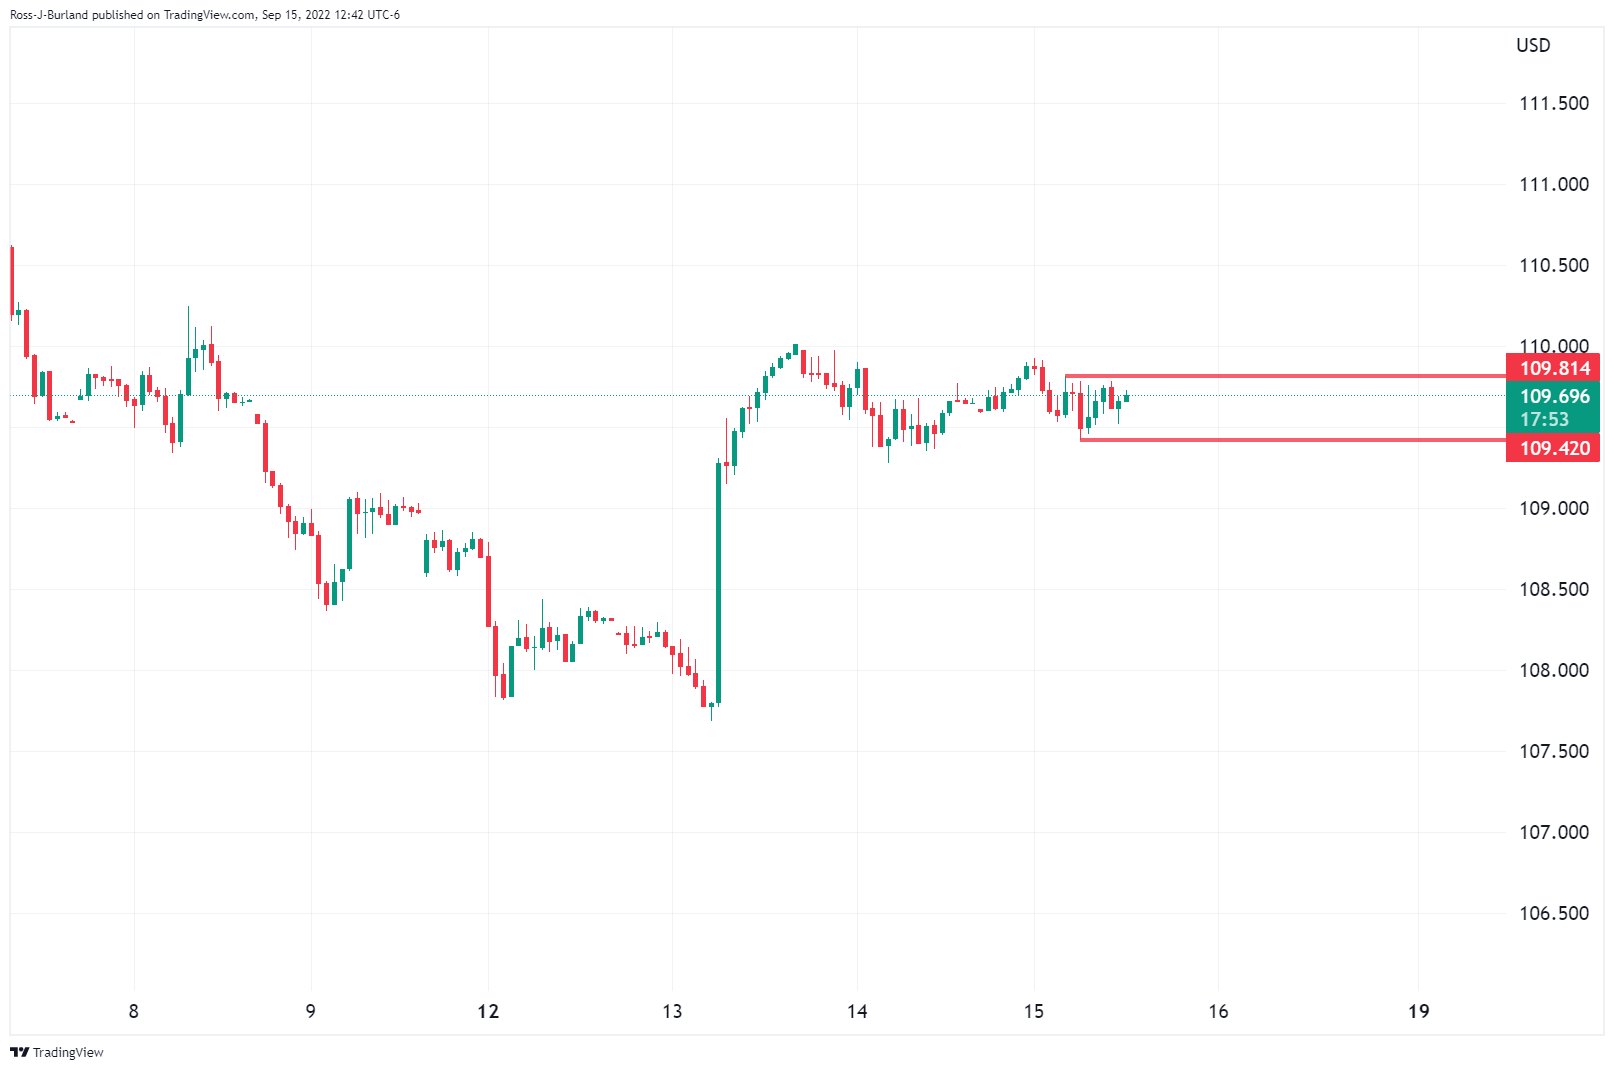
Meanwhile, however, while the US dollar consolidates, it could be sideways action until a break of either 109.80 or 109.25 as per the DXY index that measures the greenback vs. a basket of currencies:
-
18:43
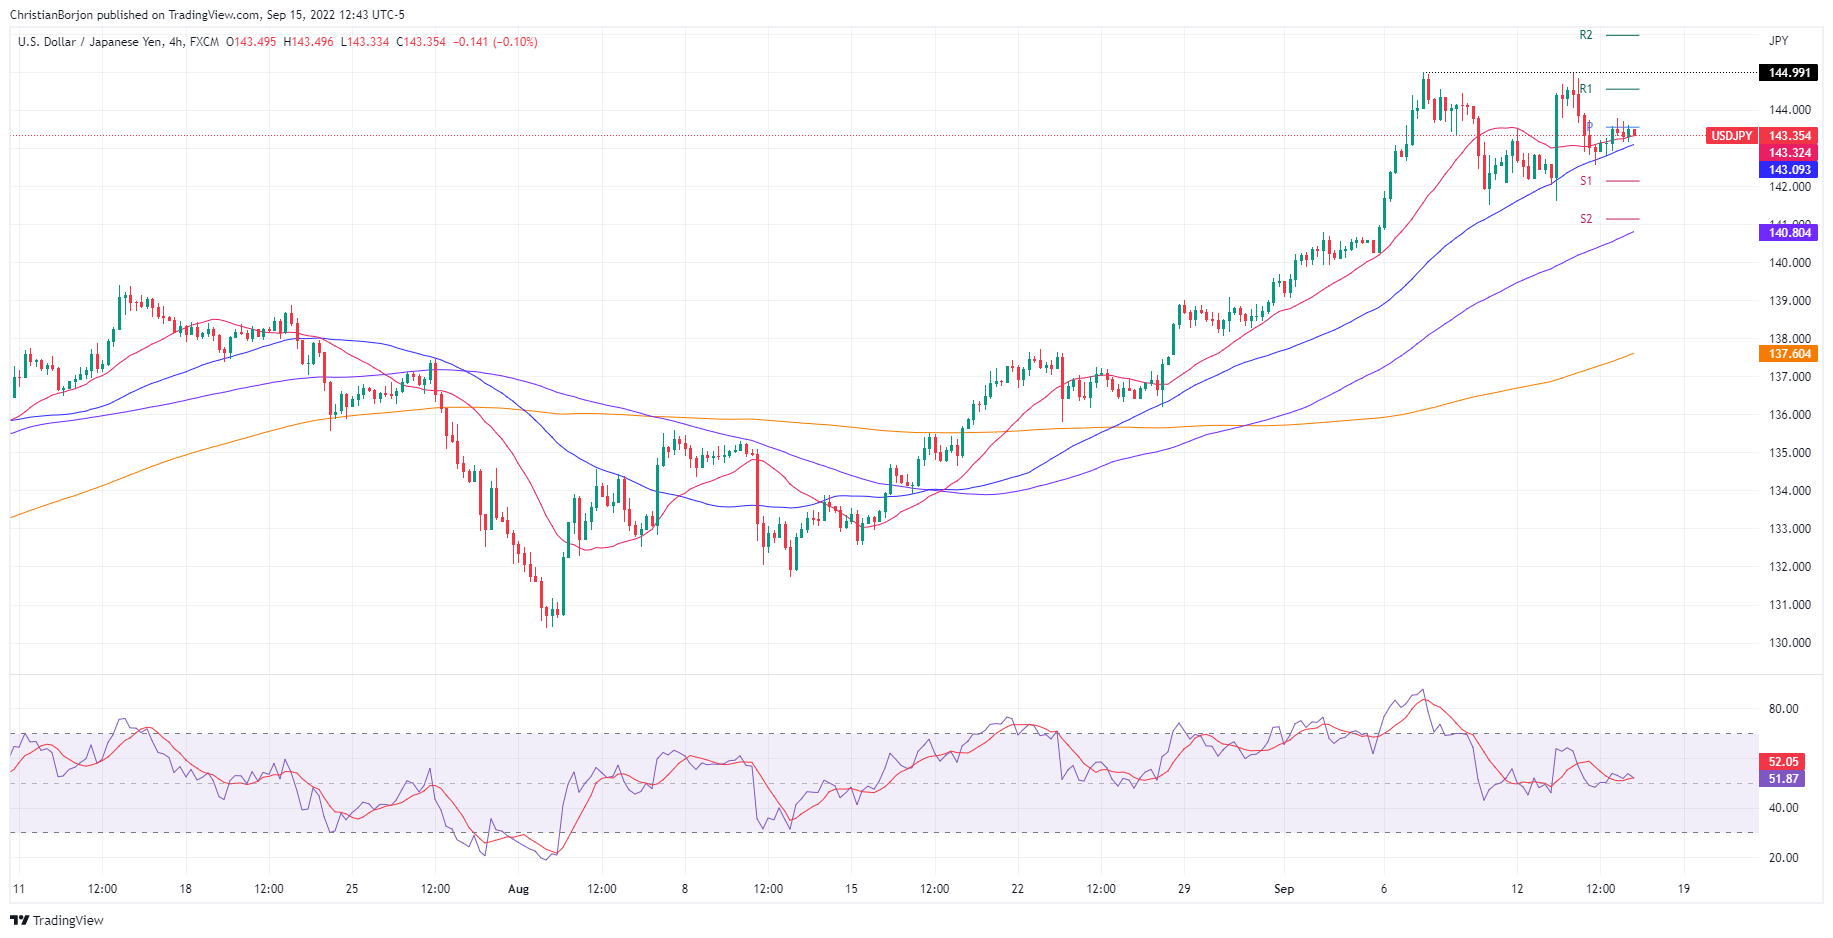
USD/JPY Price Analysis: Subdued around 143.30s after threats of a Japanese intervention
- USD/JPY remains subdued after a verbal intervention by Japanese authorities.
- Negative divergence in the daily chart could send the USD/JPY towards 142.00.
- In the near term, the USD/JPY could test the 141.00 area.
The USD/JPY recovers some ground following rumors of a possible Forex intervention by Japanese authorities to propel the Japanese yen but stays below the 144.00 mark, above its opening price by 0.21%. At the time of writing, the USD/JPY is trading at 143.43.
USD/JPY Price Analysis: Technical outlook
From a daily chart perspective, the USD/JPY remains upward biased, but price action is overextended, with buyers showing signs of exhaustion. Even though the USD/JPY retested the YTD high on September 14, the Relative Strength Index (RSI) showed signs of negative divergence, suggesting the major could dive soon. If the USD/JPY clears the 145.00 figure, a test of the August 1998 high at 147.67 is on the cards. Conversely, a break below 143.00 could send the USD/JPY tumbling towards the 142.00 figure.
Short term, the 4-hour chart shows the major testing of the daily pivot for the last five candles. Failure to do so portrays soft demand for the buck, exposing the pair to further losses. Once sellers clear the 50-EMA at 143.09, it would pave the way toward the 143.00 figure. Break below will expose the S1 pivot point at 142.13, ahead of the 142.00 mark, followed by the S2 saily pivot at 141.13.
USD/JPY Key Technical Levels
-
18:37
GBP/USD bulls step in at key support in the face of USD headwinds
- GBP/USD bulls are attempting to hold the key support areas on the charts
- However, the greenback remains in the hands of the bears ahead of key central bank meetings.
GBP/USD bulls are attempting a correction from an important support area near the midpoint of the 1.1400 area, with the price recovering from a low of 1.1462 and now testing the bear's commitments at 1.1500. The pound, however, is still losing some .03% on the day as the US dollar edges up following data showing US Retail Sales unexpectedly rebounded in August.
Retail Sales increased 0.3% last month and the US dollar has held near recent peaks, supported by the view that the Federal Reserve will keep tightening policy aggressively. The data of late, including this week's surprise increase in consumer prices in August, has reinforced the bullish case for the greenback as investors price in a third consecutive 75-basis-point rate hike next Wednesday.
Meanwhile, the Bank of England is also expected to hike by another 50bp on Thursday 22 September, but it remains a close call between 50bp and 75bp due to the rising recession risk. Analysts at Danske Bank argue that the BoE has had a tendency to surprise to the dovish side at recent meetings. ''Additionally, BoE was the first G10 central bank to forecast a recession by Q4 2022 at its last meeting, while using a far more dovish market pricing as policy input than what is currently priced.''
The analysts expect 50bp hikes in September, November and December followed by a final 25bp hike in February 2023. ''The endpoint is thus lifted to 3.25% (from 2.50%). We see the possibility for further hikes in 2023, if we see underlying inflation pressures to prove persistent.''
Politically, the analysts cite the newly elected Prime Minister Liz Truss; plans to add upside to inflation down the road with inflation possibly proving to be more persistent. ''This could highlight the need for further hikes in 2023, yet amid the deficit funding uncertainty we still lean towards 50bp next week.''
-
17:34
EUR/USD reclaims parity, despite some ECB officials taking a dovish stance
- EUR/USD is seesawing around parity after mixed ECB official signals.
- Upbeat US Retail Sales confirms the case of the Fed going 75 bps.
- ECB officials emphasized the need to hike rates;
- ECB official Mario Centeno expressed that the central bank should take “as small steps as possible.”
The EUR/USD is positive in the day for the second-straight day but faces solid resistance around the parity on woes of a large US Federal Reserve rate hike, spurring a jump in US Treasury bond yields. However, the shared currency remains resilient, though slightly up by 0.19%, amidst a risk-off environment.
During the day, the EUR/USD began trading at around 0.9980, sliding toward the daily low at 0.9955 in the early European session. However, fresh bids lifted the shared currency towards hitting the daily high at 1.0018 before settling at the current spot price. At the time of writing, the EUR/USD is trading at 1.0002.
US economic data released before the Wall Street open and during the beginning of Thursday’s trading session further cemented the Fed’s case for going aggressive, as shown by money market futures odds at 80% of increasing rates by 75 bps and 20% chances of going 100.
The US Commerce Department reported that Retail Sales in August jumped by 0.3% MoM, higher than expectations of a 0.1% contraction, while the annual base reading was 9.37%, less than the previous month’s data. At the same time, the Department of Labor showed that unemployment claims for the past week, ending on September 10, decreased to 213K, lower than economists’ estimates of 227K, showing the labor market’s resilience.
The EUR/USD barely reacted to data, though it brought the major under parity. Meanwhile, the US Dollar Index, a gauge of the buck’s value vs. its peers, is recovering from earlier losses, up 0.10%, at 109.751.
Of late, a tranche of manufacturing data revealed by regional Fed banks began with the New York Fed Empire State Index and the Philadelphia Fed Index. The New York Fed Index showed signs of improvement though remains in contractionary territory, while the Philadelphia Fed index dropped to the contractionary part after rebounding in the August report.
ECB officials continue expressing the need for hiking rates due to high inflationary pressures on the Eurozone side. Philip Lane, ECB Chief Economist, said, “We expect that this transition will require us to continue to raise interest rates over the next several meetings. The appropriate size of an individual increment will be larger, the wider the gap to the terminal rate and the more skewed the risks to the inflation target.”
Later, ECB Vice-President Luis de Guindos commented that price pressures continued to elevate while adding that the euro’s depreciation added to “these inflationary pressures.” In the meantime, ECB official Mario Centeno expressed that the central bank should take “as small steps as possible” in hiking rates not to destabilize the economy, a signal perceived as dovish by market players. He emphasized that monetary policy “must remain predictable.”
EUR/USD traders should note that a part of the German bond yield curve briefly inverted on Thursday, signaling investors’ worries that an aggressive ECB might lead to an economic slowdown.
What to watch
The Eurozone calendar will feature inflation readings in the bloc and Italy. On the US side, the economic docket will feature the University of Michigan Consumer Sentiment and inflation expectations.
EUR/USD Key Technical Levels
-
16:36
United States 4-Week Bill Auction rose from previous 2.5% to 2.67%
-
16:32
EUR/USD is in danger of dipping further towards 0.95 – Rabobank
The EUR/USD continues to move sideways around the parity level ahead of next week’s FOMC meeting. According to analysts from Rabobank, the risks on the EUR/USD are tilted to the downside and they warn it could drop to 0.95.
Key Quotes:
“The precariously position of growth in the region (Eurozone) in the coming months may mean that higher short-term rates do not translate into a significantly stronger EUR. In our view, the market has not yet fully priced in the risks to the growth in the region in the coming months. Given the coincident strength of the USD, we expect that EUR/USD could be drawn further below parity in the weeks ahead.”
“It is our view that the safe haven USD is likely to remain well supported until investors are willing to move back into risky assets. This may be some months off. This period will cover what is likely to be a testing winter for the Eurozone economy. Even though further, potentially aggressive, rates hikes are widely expected from the ECB, it is our view that EUR/USD is in danger of dipping further towards 0.95.”
-
16:20
US: Staying power of consumer spending is waning – Wells Fargo
Data released on Thursday showed an increase in retail sales in August above expectations in the US. According to analysts at Wells Fargo point out the 0.3% increase was a surprise, but so was a revision that reduced last month's sales by an even larger 0.4%.
Key Quotes:
“Retail sales rose 0.3% in August, but July's sales were revised down by 0.4%. Excluding autos, the actual level of retails sales is lower in August than it was in June. The staying power of consumer good spending is at last losing momentum.”
“We anticipate the economy entering a mild recession early next year and although we anticipated this retrenchment in consumer spending, this is not yet the start of the downturn. Consumer demand for services and experience-oriented spending remains intact, for now. This was evident in the 1.1% increase in spending in bars and restaurants.”
“How goods spending evolves is particularly important for the outlook. Real retail sales are running around 8% above pre-pandemic levels. While that pales in comparison to the some 30% higher nominal sales are, it still emphasizes a high level of goods spending. Elevated consumption with still not fully restocked inventory levels can continue to exert upward pressure on prices and thus keep inflation running at a steep rate. This would make the Fed's job all the more challenging.”
-
16:10
Breaking: Gold nosedives to two-year lows below $1670
- Gold price tumbles to fresh 2-year lows below the $1670 mark.
- Expectations that the Fed would aggressively continue to tighten weighed on the yellow metal.
- Upbeat US Retail Sales continue to show the strength of the US economy.
Gold price tumbles below the $1700 psychological level, to fresh two-year lows at $1665.30, on expectations that the US Federal Reserve would continue to tighten monetary conditions, sparking a jump in US Treasury yields. Hence, the greenback followed suit but pared earlier gains. At the time of writing, the XAU/USD is trading at around $1666 a troy ounce.
Gold price tumbles on higher US Treasury bond yields
US Treasury yields jumped on expectations that the Fed might hike rates between 75 or 100 bps. The US 2-year bond yield, the most sensitive to interest rate hikes, peaked at 3.84%, while the 10-year benchmark note remained at 3.437%, gaining three bps. Worth noting that the yield curve further inverted, with the spread between 2s and 10s deepening to -0-403%, as market participants expected an aggressive Fed could derail the US economy, tapping it into a recession.
US Retail Sales for August, reported by the US Department of Commerce, surprisingly rose, after dropping a month earlier, with readings increasing 0.3%, exceeding estimates of -0.1%.
In the meantime, US economic data revealed by the Labor Department showed that Initial Jobless Claims for the week ending on September 10 was 213K, decreasing from the previous week's reading and lower than estimates of 227K.
The New York and Philadelphia Fed Manufacturing Indices were reported, showing mixed results. The New York Empire State manufacturing sector improved but remained in contractionary territory, while the Philadelphia Fed index dropped to the contractionary part after rebounding in the August report.
Gold (XAU/USD) Key Technical Levels
-
16:04
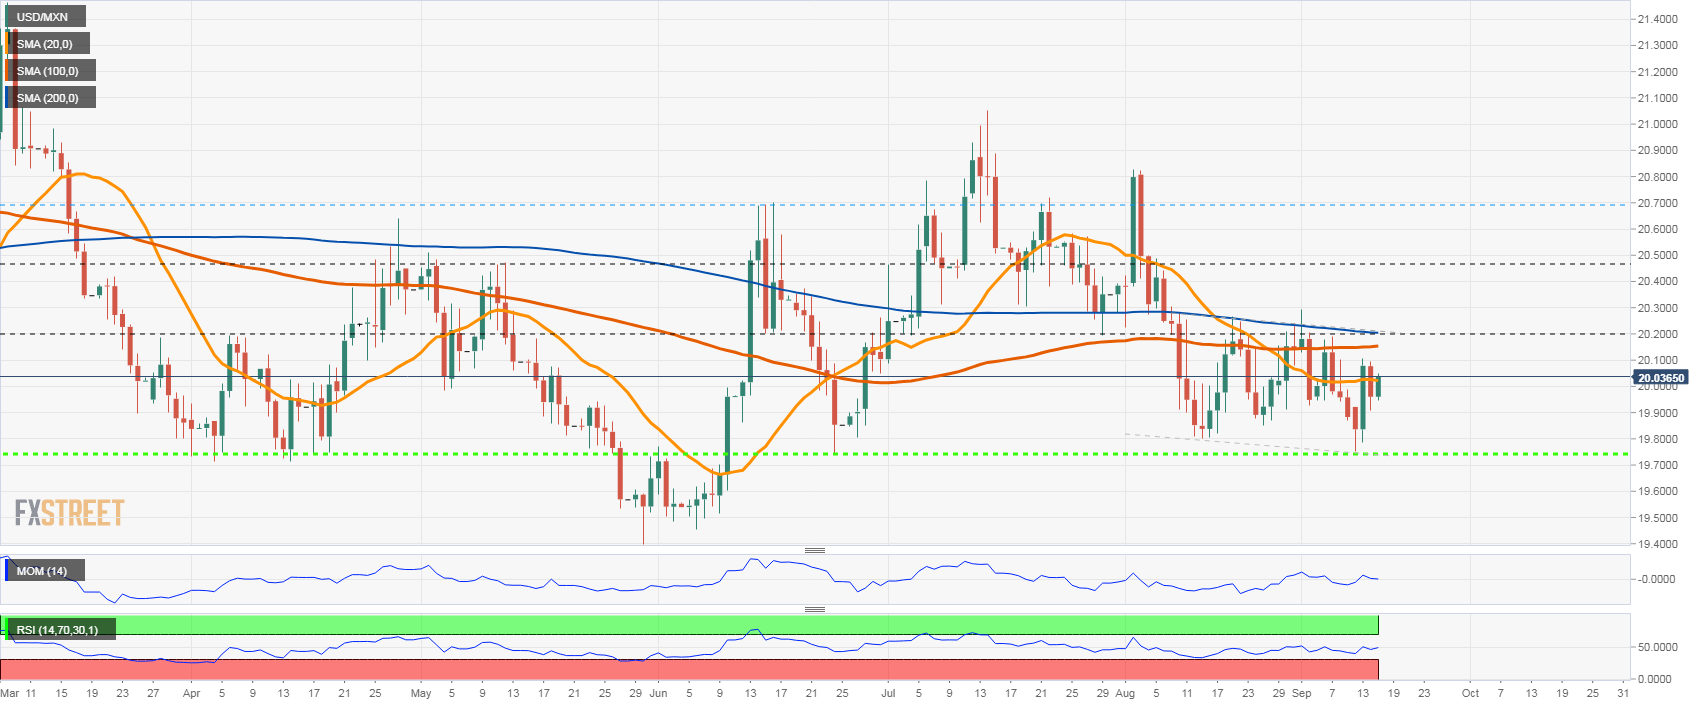
USD/MXN remains in range, looking at 20.10 as market sentiment deteriorates
- USD/MXN moving between 20.20 and 19.80 since mid-August.
- Mexican peso fails to break 19.80, and reverses.
- Stocks turn lower in Wall Street, supporting the dollar.
The USD/MXN is up on Thursday amid a stronger US dollar across the board. The pair is trading at 20.07, at the highest intraday level. Wall Street is turning from neutral to bearish, favoring the greenback.
On the upside, the immediate resistance is seen at 20.10 (Sep 8 and 13 high). A consolidation above could point to further gains and a test of the critical area between 20.17 and 20.20. A daily close above 20.20 would be a positive technical development suggesting more gains ahead, targeting the 20.45 area.
On the flip side, the first support stands at 19.95, but a more significant barrier is located at 19.90. The key area is 19.80 and a break lower would put USD/MXN on its way toward 19.70.
Eyes on the Fed
Following many US economic reports (jobless claims, retail sales, Philly Fed and industrial production) on Thursday and particularly the CPI on Tuesday, attention now sets on the FOMC meeting next week. The central bank is expected to raise interest rates by 75 basis points on Wednesday. Banxico is expected to follow on September 29.
USD/MXN daily chart
Technical levels
-
15:59
Gold Price Forecast: XAU/USD nosedives to two-year lows below $1670
- Gold price tumbles to fresh 2-year lows below the $1670 mark.
- Expectations that the Fed would aggressively continue to tighten weighed on the yellow metal.
- Upbeat US Retail Sales continue to show the strength of the US economy.
Gold price tumbles below the $1700 psychological level, to fresh two-year lows at $1665.30, on expectations that the US Federal Reserve would continue to tighten monetary conditions, sparking a jump in US Treasury yields. Hence, the greenback followed suit but pared earlier gains. At the time of writing, the XAU/USD is trading at around $1666 a troy ounce.
Gold price tumbles on higher US Treasury bond yields
US Treasury yields jumped on expectations that the Fed might hike rates between 75 or 100 bps. The US 2-year bond yield, the most sensitive to interest rate hikes, peaked at 3.84%, while the 10-year benchmark note remained at 3.437%, gaining three bps. Worth noting that the yield curve further inverted, with the spread between 2s and 10s deepening to -0-403%, as market participants expected an aggressive Fed could derail the US economy, tapping it into a recession.
US Retail Sales for August, reported by the US Department of Commerce, surprisingly rose, after dropping a month earlier, with readings increasing 0.3%, exceeding estimates of -0.1%.
In the meantime, US economic data revealed by the Labor Department showed that Initial Jobless Claims for the week ending on September 10 was 213K, decreasing from the previous week's reading and lower than estimates of 227K.
The New York and Philadelphia Fed Manufacturing Indices were reported, showing mixed results. The New York Empire State manufacturing sector improved but remained in contractionary territory, while the Philadelphia Fed index dropped to the contractionary part after rebounding in the August report.
Gold (XAU/USD) Key Technical Levels
-
15:30
United States EIA Natural Gas Storage Change above forecasts (73B) in September 9: Actual (77B)
-
15:00
Uncertain environment continues to strengthen Swiss franc – Erste
Since the recent escalation of energy price hikes in Europe, the euro has weakened slightly again against the franc. Analysts at Erste Group Research expect the EUR/CHF pair to continue its move downward.
Swiss National Bank to raise interest rates by another 25 bps
“We currently expect the situation on the energy markets in Europe to ease from the end of October. In this environment, the euro should be able to strengthen somewhat against the Swiss franc.”
“In the short-term, the upcoming parliamentary elections in Italy (September 25) also pose a further risk of a weaker euro.”
“The short-term development of the exchange rate will also depend heavily on the SNB's next interest rate decision at its meeting on September 22. Currently, we expect the SNB to raise interest rates by another 25 basis points.”
“In the event of escalating geopolitical crises, the Swiss franc could strengthen further against the euro at any time.”
-
15:00
United States Business Inventories registered at 0.6%, below expectations (0.8%) in July
-
14:53
USD/CAD retreats from two-month high, once again fails to find acceptance above 1.3200
- USD/CAD gains some positive traction and hits a two-month high on Thursday.
- A fresh leg up in oil prices undermines the loonie and offers support to the pair.
- Subdued USD demand fails to impress bulls or provide any meaningful impetus.
The USD/CAD pair climbs to a two-month high during the early North American session and looks to build on the momentum beyond the 1.3200 round-figure mark.
A fresh leg down in crude oil prices undermines the commodity-linked loonie and turns out to be a key factor pushing the USD/CAD pair higher. Concerns that a deeper global economic downturn will dent fuel demand overshadow worries about tight supply and weigh on the black liquid.
The US dollar, on the other hand, struggles to gain traction and moves little in reaction to the mixed US macro data, though remains well supported by hawkish Fed expectations. This is seen as another factor acting as a tailwind wind for the USD/CAD pair and favours bullish traders.
That said, repeated failures to build on the momentum beyond the 1.3200 mark constitutes the formation of multiple-tops on short-term charts. This makes it prudent to wait for strong follow-through buying placing fresh bullish bets around the USD/CAD pair and positioning for any further gains.
Nevertheless, the fundamental backdrop suggests that the path of least resistance is to the upside. Traders, however, might prefer to move to the sidelines ahead of next week's FOMC meeting, which will influence the USD price dynamics and provide a fresh directional impetus to the USD/CAD pair.
Technical levels to watch
-
14:46
USD/TRY reaches an all-time high past 18.27
- USD/TRY extends the march higher past 18.27 on Thursday.
- There seems to be no respite for the lira slump.
- The CBRT could reduce the policy rate further next week.
Another day, another low in the Turkish currency vs. the greenback. This time USD/TRY advanced to levels past 18.27, printing at the same time new all-time tops.
USD/TRY now looks to CBRT
USD/TRY extends the gradual march higher for yet another session on Thursday and remains well on track to close its sixth consecutive week with gains. So far this year, the lira has depreciated around 38% vs. the US dollar vs. 44% in all of 2021.
The outlook for the lira remains well in the negative territory in a context where inflation gives no signs of mitigating and the central bank (CBRT) seems to have embarked in a renewed easing cycle of its monetary conditions in response to the government’s exclusive focus on growth and the improvement of the current account.
On the latter, the CBRT meets next week and could reduce the One-Week Repo Rate for the second meeting in a row following August's 100 bps rate cut.
In Türkiye, the Budget Balance showed a TL3.59B surplus for the month of August, reversing July’s TL64B deficit.
What to look for around TRY
USD/TRY extends the upside momentum to new all-time peak around the 18.27 area on Thursday.
So far, price action around the Turkish lira is expected to keep gyrating around the performance of energy and commodity prices - which are directly correlated to developments from the war in Ukraine - the broad risk appetite trends and the Fed’s rate path in the next months.
Extra risks facing the Turkish currency also come from the domestic backyard, as inflation gives no signs of abating (despite rising less than forecast in July and August), real interest rates remain entrenched well in negative territory and the political pressure to keep the CBRT biased towards low interest rates remains omnipresent.
In addition, there seems to be no other immediate option to attract foreign currency other than via tourism revenue, in a context where official figures for the country’s FX reserves remain surrounded by increasing skepticism.
Key events in Türkiye this week: Budget Balance (Thursday) – End Year CPI Forecast (Friday).
Eminent issues on the back boiler: FX intervention by the CBRT. Progress of the government’s scheme oriented to support the lira via protected time deposits. Constant government pressure on the CBRT vs. bank’s credibility/independence. Bouts of geopolitical concerns. Structural reforms. Presidential/Parliamentary elections in June 23.
USD/TRY key levels
So far, the pair is gaining 0.20% at 18.2618 and faces the next hurdle at 18.2723 (all-time high September 15) seconded by 19.00 (round level). On the downside, a break below 17.8590 (weekly low August 17) would target 17.8203 (55-day SMA) and finally 17.7586 (monthly low August 9).
-
14:45
S&P 500 Index: Holding or not support at 3915 to shape USD trend – Scotiabank
Economists at Scotiabank analyze the correlation between the US Dollar Index, the VIX and the S&P 500 Index. They conclude that the key support at 3915 for the S&P 500 is set to determine the USD trend.
Negative correlation between the USD and the S&P 500
“Our correlation screen reflects tightening positive correlations between the DXY and the VIX (+55% on a rolling 1-month study of daily returns) on the one hand and a stronger, negative correlation between the USD and the S&P 500 (-64%) on the other.”
“Stocks are just about holding the uptrend from the Jun low on the daily chart – I spot (rising trend line) support at around 3915 for the S&P 500 currently and whether this level holds or not will go a long way to shaping USD trends into and beyond the FOMC.”
-
14:36
USD/CAD: The 1.32 area is set to continue capping the topside – Scotiabank
USD/CAD holds range. As analysts at Scotiabank note, technicals suggest USD gains have stalled around 1.32.
Loonie remains hitched to the risk on/off tone
“USD/CAD has established a well-defined trading range between support at 1.3150 and resistance at 1.3195/00 over the past couple of sessions. The CAD remains hitched to the risk on/off tone and the broader moves in the USD for now but we continue to expect USD supply to emerge at or near the recent range extremes, keeping spot broadly range bound.”
“We look for the 1.32 area to continue capping the topside.”
-
14:29
EUR/USD to find firm support on dips to the low 0.99 zone – Scotiabank
EUR/USD has carved out a well-defined range between 0.9950/1.0015 amid European Central Bank (ECB) hawks circle. Economists at Scotiabank expect the pair to find a solid floor around the 0.99 area.
EUR-bullish weekly signal from last week’s price action remains intact
“The hawkish drumbeat from ECB policymakers – Holzman, Makhlouf, Guindos in the past few hours – continues. ECB hawkishness may underpin the EUR but it may take a bit more clarity on the energy crunch to drive the EUR higher in the coming weeks.”
“Heavy losses from the 1.02 area earlier this week sustain the broader downtrend in this market and tilt overall risks to the downside in the short run. We note, however, that the EUR-bullish weekly signal from last week’s price action remains intact and this should mean firm support for the EUR on dips to the low 0.99 zone still.”
-
14:29
AUD/USD flirts with 0.6700 mark, focus shifts to Chinese macro data dump on Friday
- AUD/USD remains on the defensive despite a modest USD pullback from the daily high.
- The US bond yields retreat in reaction to the mixed US macro data and weigh on the buck.
- Aggressive Fed rate hike bets, recession fears limit the USD losses and continue to cap.
- Investors now eye the Chinese data dump on Friday for some meaningful opportunities.
The AUD/USD pair once again finds some support ahead of the 0.6700 mark and recovers a few pips from the daily low during the early North American session. The pair is currently trading around the 0.6725-0.6730 area, still down over 0.20% for the day.
The US dollar struggles to preserve its early modest gains and remains on the defensive for the second straight day on Thursday, which, in turn, offers some support to the AUD/USD pair. The mixed US economic data triggers an intraday pullback in the US Treasury bond yields and undermines the greenback.
That said, rising bets for a more aggressive policy tightening by the Fed, bolstered by Tuesday's stronger US CPI report, should act as a tailwind for the US bond yields. Apart from this, worries about a global economic downturn might continue to favour the USD bulls and cap the upside for the risk-sensitive aussie.
The fundamental backdrop suggests that the path of least resistance for the AUD/USD pair is to the downside. That said, it will still be prudent to wait for a sustained break below the 0.6700 mark before positioning for any further depreciating move. Traders now look forward to the Chinese data dump for a fresh impetus during the Asian session on Friday.
The focus, however, will remain on the key central bank event risk - the two-day FOMC monetary policy meeting on September 20-21. The outcome will play a key role in driving the USD demand in the near term and help determine the next leg of a directional move for the AUD/USD pair.
Technical levels to watch
-
14:23
A barrel of Brent Oil should cost $90 at the end of the year – Commerzbank
The price of a barrel of Brent Oil has been trading below $100 most of the time since the beginning of August. Any attempts at recovery have failed. Strategists at Commerzbank forecast Brent Oil at $90 by end-2022.
OPEC+ signals change of course
“Demand concerns about an upcoming recession in the USA and Europe and the zero-covid policy in China are weighing on prices. Oil demand, which has been quite robust so far, is likely to lose momentum.”
“OPEC+ is considering a production cut. In October, the production volume will already be slightly reduced.”
“A barrel of Brent Oil should cost $90 at the end of the year.”
-
14:20
US: Industrial Production contracts by 0.2% in August vs. +0.2% expected
- Industrial Production in the US contracted unexpectedly in August.
- US Dollar Index stays near the lower limit of its daily range.
The data published by the US Federal Reserve showed on Thursday that Industrial Production contracted by 0.2% on a monthly basis in August. This print came in worse than the market expectation for an expansion of 0.2%. In the same period, Manufacturing Production increased by 0.1% following July's growth of 0.6%.
"Capacity utilization declined 0.2 percentage points in August to 80.0%, a rate that is 0.4 percentage points above its long-run (1972–2021) average," the Fed further noted in its publication.
Market reaction
The US Dollar Index showed no immediate reaction to these figures and was last seen posting small daily losses at 109.58.
-
14:15
United States Industrial Production (MoM) below expectations (0.1%) in August: Actual (-0.2%)
-
14:15
United States Capacity Utilization below expectations (80.3%) in August: Actual (80%)
-
14:15
Gold Price Forecast: XAU/USD to extend its decline on highly-aggressive Fed tightening – TDS
Gold has broken the $1,700 support. Economists at TD Securities expect the yellow metal to extend its move downward as aggressive Fed expectations are being priced in.
Outflows from money managers and ETF holdings to weigh on gold
“We expect continued outflows from money managers and ETF holdings to weigh on prices, which ultimately raises the probability of a pending capitulation from the small number of family offices and proprietary trading shops that hold complacent lengths in gold.”
“The persistence of inflation continues to support an aggressive effort by the Fed, and we now expect the FOMC to raise the target rate by 75 bps at its meeting next week, deliver another 75 bps hike in November, and hike a further 50 bps in December.”
-
14:03
EUR/USD: No upside potential in the short-run – Commerzbank
In the case of the EUR/USD, the risks point downwards in the short-term. In the opinion of economists at Commerzbank, the euro should only start to recover when investors are increasingly betting on an end to the crisis in mid-2023.
Recession in the euro area, driven by the war of nerves over gas
“We now expect a recession for the euro area, triggered by high energy prices, in turn, a consequence of reduced gas supplies from Russia. This development is likely to weigh on the euro.”
“For 2023, we expect a partial recovery of EUR/USD when it becomes clear that Europe can meet its energy needs without Russian gas, when energy prices settle down again and when it becomes clear that the ECB resumes its rate hike cycle.”
-
14:03
US: Philadelphia Fed Manufacturing Index drops to -9.9 in September vs. 2.8 expected
- Philadelphia Fed Manufacturing Index fell into negative territory in September.
- The greenback is struggling to preserve its strength after latest US data releases.
The Federal Reserve Bank of Philadelphia's Manufacturing Business Outlook Survey's diffusion index for current general activity dropped to -9.9 in September from 6.2 in August. This print came in worse than the market expectation of 2.8.
"The new orders index fell 13 points to -17.6, and the shipments index fell 16 points to its lowest reading since May 2020 but remained positive at 8.8," the publication further read. "The prices paid index declined for the fifth consecutive month, down 14 points to 29.8, its lowest reading since December 2020 and near its long-run nonrecession average."
Market reaction
The US Dollar Index stays in negative territory below 109.50 as investors assess the latest data releases from the US.
-
14:00
Russia Central Bank Reserves $ fell from previous $561.9B to $557.4B
-
13:54
US: NY Fed Empire State Manufacturing Index improves to -1.5 in September
- NY Fed Empire State Manufacturing Index rose in September but stayed in negative territory.
- US Dollar Index edges lower, trades below 109.50.
The headline General Business Conditions Index of the Federal Reserve Bank of New York's Empire State Manufacturing survey improved to -1.5 in September from -31.3 in August. This reading came in better than the market expectation of -13.
"Labor market indicators pointed to a modest increase in employment and no change in the average workweek," the NY Fed said in its publication. "Price indexes moved notably lower, pointing to a deceleration in price increases. Looking ahead, firms were not very optimistic that business conditions would improve over the next six months."
Market reaction
The greenback is facing modest bearish pressure in the early American session and the US Dollar Index was last seen losing 0.17% on a daily basis at 109.45.
-
13:46
US: Weekly Initial Jobless Claims decline to 213K vs. 226K expected
- Initial Jobless Claims in the US fell by 5,000 in the week ending September 10.
- US Dollar Index stays in daily range slightly above 109.50.
There were 213,000 initial jobless claims in the week ending September 10, the weekly data published by the US Department of Labor (DOL) showed on Thursday. This print followed the previous week's print of 218,000 (revised from 222,000) and came in better than the market expectation of 226,000.
Further details of the publication revealed that the advance seasonally adjusted insured unemployment rate was 1% and the 4-week moving average was 224,000, a decrease of 8,000 from the previous week's revised average.
"The advance number for seasonally adjusted insured unemployment during the week ending September 3 was 1,403,000, an increase of 2,000 from the previous week's revised level," the DOL reported.
Market reaction
The US Dollar Index posts small daily losses on the day but manages to hold above 109.50 after this data.
-
13:45
GBP/USD keeps the red near weekly low, moves little post-US economic data
- GBP/USD comes under renewed selling pressure on Thursday amid a modest USD strength.
- Bets for more aggressive Fed rate hikes, elevated US bond yields revive the USD demand.
- The mixed US economic data fails to impress the USD bulls or provide impetus to the pair.
The GBP/USD pair extends its steady intraday descent through the early North American session and seems rather unaffected by US macro releases. The pair is currently trading around the 1.1470-1.1465 area and remains well within the striking distance of its lowest level since 1985 touched last week.
Following the previous day's modest downtick, the US dollar regains some positive traction on Thursday amid hawkish Fed expectations and turns out to be a key factor exerting pressure on the GBP/USD pair. That said, a generally positive tone around the equity markets keeps a lid on any meaningful gains for the safe-haven greenback.
Even the mixed US economic data also did little to impress the USD bulls or provide any meaningful impetus to the GBP/USD pair. The US Census Bureau reported that the headline sales unexpectedly rose by 0.3% in August. This, however, was offset by the fact that core sales (excluding autos) remain flat during the reported month.
Separately, the US Weekly Initial Jobless Claims fell to 213K during the week ended September 9 against a rise to 226K anticipated. Furthermore, the Empire State Manufacturing Index improves to -1.5 in September from -31.3 previous, while Philly Fed Manufacturing Index plunges to -9.9, missing estimates for a fall to 2.8 from 6.2 in August.
The data, meanwhile, does little to push back against bets for a more aggressive policy tightening by the Fed. This, in turn, remains supportive of elevated US Treasury bond yields and favours the USD bulls, suggesting that the path of least resistance for the GBP/USD pair is to the downside. Hence, a slide back towards the YTD low, around the 1.1400 mark, remains a distinct possibility.
Technical levels to watch
-
13:36
US: Retail Sales rise by 0.3% in August vs. 0% expected
- Retail Sales in the US rose modestly in August.
- US Dollar Index holds above 109.50 after the data.
Retail Sales in the US stayed increased by 0.3% to $683.3 billion in August, the data published by the US Census Bureau showed on Thursday. This reading followed July's decrease of 0.4% (revised from 0%) and came in better than the market expectation for a no-change.
Further details of the report revealed that Retail Sales ex Autos were down by 0.3%.
"Total sales for the June 2022 through August 2022 period were up 9.3% from the same period a year ago," the publication read. "The June 2022 to July 2022 percent change was revised from virtually unchanged to down 0.4%."
Market reaction
The US Dollar Index showed no immediate reaction to these figures and was last seen trading flat on the day at 109.68.
-
13:32
United States Continuing Jobless Claims below forecasts (1.475M) in September 2: Actual (1.403M)
-
13:32
United States Export Price Index (YoY) above forecasts (9.6%) in August: Actual (10.8%)
-
13:32
United States Import Price Index (YoY) came in at 7.8%, below expectations (7.9%) in August
-
13:31
United States Philadelphia Fed Manufacturing Survey came in at -9.9 below forecasts (2.8) in September
-
13:31
United States NY Empire State Manufacturing Index registered at -1.5 above expectations (-13) in September
-
13:31
United States Retail Sales ex Autos (MoM) below forecasts (0.1%) in August: Actual (-0.3%)
-
13:31
United States Export Price Index (MoM) registered at -1.6%, below expectations (-1.2%) in August
-
13:30
United States Retail Sales (MoM) registered at 0.3% above expectations (0%) in August
-
13:30
United States Initial Jobless Claims came in at 213K below forecasts (226K) in September 9
-
13:30
United States Initial Jobless Claims 4-week average: 224K (September 9) vs previous 233K
-
13:30
United States Import Price Index (MoM) registered at -1% above expectations (-1.2%) in August
-
13:30
United States Retail Sales Control Group registered at 0%, below expectations (0.5%) in August
-
13:28
EUR/USD: Consolidative trade to end on a break of 0.9960-1.0060 range – OCBC
EUR/USD continues to trade below parity on Thursday. Economists at OCBC Bank highlight the key technical levels to watch.
Price cap for gas imports and windfall levy to support the EUR
“Mild bullish momentum on daily chart shows tentative signs of fading but RSI was flat. Consolidative trades likely.”
“Support at 0.9960, 0.9910 levels. Resistance at 1.0060.”
“In European Commission President Ursula’s state of the union speech, she said that the EU will launch a ‘deep and comprehensive’ reform of the electricity market. A swift move to firm up on the proposals on price cap for gas imports and windfall levy could help to ease price pressures and provide further support for EUR.”
-
13:19
USD/JPY: Intervention risk on a sharp move higher to test 145, but unlikely to alter the trend – OCBC
USD/JPY treads water around mid-143s. Economists at OCBC Bank expect a test of 145 to trigger intervention from Japanese authorities but it is unlikely to stop the pair’s current rally.
Intervention impact could be most felt within the first 48 hours
“We opined that the actual intervention may be conducted if there is another sharp move higher to test 145.”
“Intervention can impact the JPY and the impact could be most felt within the first 48 hours based on past observation. But intervention alone is not likely to alter the trend unless USD, UST yields turn lower or BoJ changes/tweaks policy.”
-
13:12
US Dollar Index to retain a bid tone, next resistance seen at 110.30 – OCBC
The US Dollar Index holds in positive territory but stays below 110.00. Strategists at OCBC Bank highlight the key technical levels to watch.
USD could still stay bid on dips
“The USD could still stay bid on dips and take cues from upcoming US data – retail sales, industrial production today, Uni of Michigan sentiment on Fri, alongside the roll-out of regional Fed manufacturing surveys for September. In the interim, the debate between a 75 bps and 100 bps hike is likely to retain a bid tone on the USD overall.”
“Resistance at 110.30 before 110.78 (previous high). Support at 109.10 (21 DMA), 108.45 (38.2% Fibo retracement of Aug low to Sep high) and 107.70 levels (50 DMA, 50% Fibo).”
See – US Retail Sales Preview: Forecasts from six major banks, can the US consumer remain strong?
-
13:05
Silver Price Analysis: XAG/USD maintains a large top, further downside ahead – Credit Suisse
Silver maintains the top analysts at Credit Suisse have been highlighting since mid-May. Therefore, XAG/USD is expected to decline towards the $15.56 support.
Break above $21.39 required to negate the top
“Silver has risen back above the crucial 61.8% retracement support of the whole 2020/21 upmove at $18.65/15, however, still maintains a large top below $21.39 and we hence expect further downside from here towards the $15.56 support from a technical analysis perspective.”
“Next resistance is seen at $20.87 and above $21.39 remains needed to negate the top.”
-
12:40
ECB's Centeno: No sign of inflation expectations de-anchoring
European Central Bank (ECB) Governing Council member Mario Centeno said on Thursday that he does not see any signs of a de-anchoring of inflation expectations, per Reuters.
"The monetary policy must act at the margin in as small steps as possible," Centeno added and further noted that he expects the effects of unprecedented supply shocks to ease.
Market reaction
These comments don't seem to be having a significant impact on the shared currency's performance against its major rivals. As of writing, EUR/USD was up 0.15% on the day at 0.9991.
-
12:20
EUR/USD Price Analysis: Selling pressure alleviated above 1.0180
- EUR/USD treads water below the parity zone on Thursday.
- The pair needs to clear the multi-month resistance line near 1.0180.
EUR/USD trades in an inconclusive fashion, while a break above the parity level remains elusive on Thursday.
If the recovery picks up extra pace, then the interim hurdle comes at the 55-day SMA at 1.0163 prior to the key 7-month resistance line, today near 1.0180. A move beyond the latter is needed to reduce the selling bias and allow the pair to confront the September high at 1.0197 (September 12) before the 100-day SMA at 1.0325.
In the longer run, the pair’s bearish view is expected to prevail as long as it trades below the 200-day SMA at 1.0735.
EUR/USD daily chart
-
12:12
US Dollar Index Price Analysis: Another visit to the 2022 top remains in place
- DXY fades Wednesday’s retracement and flirts with 110.00.
- Extra upside could see the 2022 high near 110.80 revisited.
DXY trades with decent gains in the vicinity of the 110.00 mark, leaving behind the previous day’s decline.
The dollar manages well to keep the trade in the upper end of the recent range and its short-term bullish view remains unchanged while above the 7-month support line around 106.30.
That said, the surpass of the 110.00 neighbourhood should put the index en route to a probable visit to the YTD top at 110.78 (September 7).
In the longer run, DXY is expected to maintain its constructive stance while above the 200-day SMA at 101.60.
DXY daily chart
-
11:56
When are US monthly retail sales figures and how could they affect EUR/USD?
US Monthly Retail Sales Overview
Thursday's US economic docket highlights the release of monthly Retail Sales figures for August, due later during the early North American session at 12:30 GMT. On a monthly basis, the headline sales are estimated to remain flat for the second straight month. Excluding autos, core retail sales probably rose a modest 0.1% during the reported month, down from 0.4% growth in July.
Analysts at Deutsche Bank sounded more optimistic and offered a brief preview of the report: “We expect a +0.6% MoM reading, up from last month's flat print. As gasoline prices continue their downward trend, whether this assuages the inflationary pressures on consumer spending will be important.”
How Could it Affect EUR/USD?
Ahead of the key release, expectations for a more aggressive policy tightening by the Fed continue to act as a tailwind for the US dollar. A surprisingly stronger data will lift bets for a full 100 bps at next week's FOMC meeting and provide an additional lift to the USD. Conversely, any disappointment is unlikely to dent the underlying bullish sentiment surrounding the buck, suggesting that the path of least resistance for the EUR/USD pair is to the downside.
Eren Sengezer, Editor at FXStreet, outlines important technical levels to trade the EUR/USD pair: “The Fibonacci 61.8% retracement of the latest uptrend forms key resistance at 1.0000. The 50 and the 100-period SMAs on the four-hour chart reinforce that level as well. In case EUR/USD manages to flip that level into support, it could target the 1.0030/40 area (Fibonacci 50% retracement, 20-period SMA) and the 1.0070/80 area (Fibonacci 38.2% retracement, 200-period SMA).”
“On the downside, sellers could take action with a drop below 0.9950 (static level) and cause EUR/USD to decline toward 0.9900 (psychological level) and 0.9865 (September 6 low),” Eren adds further.
Key Notes
• US Retail Sales Preview: Can consumers keep up with inflation? A breather could weigh on the dollar
• US Retail Sales Preview: Forecasts from six major banks, can the US consumer remain strong?
• EUR/USD Forecast: Euro defines range before next breakout
About US Retail Sales
The Retail Sales released by the US Census Bureau measures the total receipts of retail stores. Monthly per cent changes reflect the rate of changes in such sales. Changes in Retail Sales are widely followed as an indicator of consumer spending. Generally speaking, a high reading is seen as positive (or bullish) for the USD, while a low reading is seen as negative (or bearish).
-
11:43
EU's Dombrovskis: We want to continue to put pressure on Russia
European Commission Executive Vice-President and Commissioner for Trade, Valdis Dombrovskis, said on Thursday that they want to continue to put pressure on Russia and reiterated that sanctions will remain in place, as reported by Reuters.
"We have spoken with the US on their tax incentives for e-cars and expressed our concerns," Dombrovskis added. "We want to go into further details in the coming weeks."
Market reaction
The shared currency struggles to find demand following these comments and the EUR/USD pair was last seen trading flat on the day at 0.9975.
-
11:38
Gazprom's Aksyutin: There is no alternative to Russian pipeline gas for Europe
Oleg Aksyutin, Deputy Chief Executive Officer of Gazprom, said on Thursday that Europe had no other alternative other than Russian gas, as reported by Reuters.
Aksyutin added that no additional LNG supplies could be expected in global markets in the short term and argued that nearly-full EU gas inventories couldn't guarantee a safe winter for Europe.
Market reaction
These comments don't seem to be having a significant impact on risk mood during the European trading hours. As of writing, the Euro Stoxx 600 Index was up 0.15% on a daily basis.
-
11:16
Gold Price Forecast: XAU/USD languishes near its lowest since July 21, below $1,700 mark
- Gold continues losing ground for the third straight day and drops to its lowest level since July 21.
- Bets for more aggressive Fed rate hikes, a positive risk tone continue to weigh on the XAU/USD.
- A modest intraday USD pullback lends support, for the time being, ahead of the US macro data.
Gold remains under heavy selling pressure for the third successive day and drops to its lowest level since July 21 on Thursday. The XAU/USD now seems to have entered a bearish consolidation phase and oscillates in a range around the $1,685-$1,690 region through the first half of the European session.
The prospects for a more aggressive policy tightening by the Fed turn out to be a key factor that continues to weigh on the non-yielding gold. Following surprisingly strong US consumer inflation data on Tuesday, the markets started pricing in the possibility of a full 100 bps rate hike at the September FOMC meeting. Fed funds futures indicate a 30% chance of such a move next week.
Furthermore, investors now expect the US central bank to deliver another supersized 75 rate increase in November, which remains supportive of elevated US Treasury bond yields. It is worth mentioning that the yield on the rate-sensitive two-year US government bond reached its highest level since November 2007 on Tuesday and the benchmark 10-year Treasury note stood tall near the YTD peak.
Apart from this, a generally positive tone around the equity markets further seems to exert downward pressure on the safe-haven precious metal. The US dollar, meanwhile, struggles to preserve its modest intraday gains, which, in turn, is seen lending some support to the dollar-denominated gold. The fundamental backdrop, however, remains skewed in favour of bearish traders.
Hence, any attempted recovery move could still be seen as a selling opportunity. Next on tap is the US economic docket, featuring the release of Retail Sales, Weekly Initial Jobless Claims, Regional Manufacturing Indices, and Industrial Production data. This, along with the US bond yields, the USD price dynamics and the broader risk sentiment might provide some impetus to gold.
Technical levels to watch
-
11:02
Philippines: BSP expected to hike rates this month – UOB
Economist at UOB Group Lee Sue Ann suggests the BSP could raise further its policy rate at the September 22 meeting.
Key Quotes
“Ongoing uncertainties particularly global recession risks into 2023 and a tentative retreat in global oil prices could also lead BSP to pause its rate hikes soon.”
“Thus, we stick to our call for a hike in the policy rate by another 25bps in Sep and thereafter keep the RRP rate at 4.00% through 4Q22 and 2023, unless both global and domestic environments move in unexpected directions.”
-
10:47
Japan LDP’s Hagiuda calls for $209B stimulus to combat inflation, weak yen
Japan’s ruling Liberal Democratic Party's (LDP) policy chief Koichi Hagiuda called for an additional stimulus package worth over JPY 30 trillion ($208.97 billion) to tackle the inflation and weak yen problem, Sankei newspaper reported.
Key quotes
"The supplementary budget of last year exceeded 30 trillion yen in size."
"Considering the price rises, global economic slowdown and weak yen and so on since then, more fine-tuned measures than last year are necessary."
Market reaction
USD/JPY is falling back towards 143.00 on these headlines, trading at 143.29, still up 0.12% on the day. The pair hit a session high of 143.80 earlier this morning.
-
USD/JPY pares intraday gains, retreats below mid-143.00s ahead of US macro data
-
-
10:30
USD/JPY pares intraday gains, retreats below mid-143.00s ahead of US macro data
- USD/JPY catches fresh bids on Thursday and recovers a part of the precious day’s losses.
- A positive risk tone undermines the safe-haven JPY amid the Fed-BoJ policy divergence.
- Elevated US bond yields revive the USD demand and remain supportive of the move up.
- Traders now look forward to important US macro releases for some meaningful impetus.
The USD/JPY pair catches fresh bids on Thursday and reverses a part of the previous day's retracement slide from the vicinity of the 24-year peak. The pair, however, trims a part of its intraday gains and retreats below mid-143.00s during the mid-European session, though is still up nearly 0.20% for the day.
The overnight JPY strength led by intervention fears fizzles out rather quickly amid a big divergence in the monetary policy stance adopted by the Bank of Japan and other major central banks. In fact, the BoJ has been lagging behind other major central banks in the process of policy normalisation and remains committed to continuing with its monetary easing. Apart from this, a generally positive tone around the equity markets weighs on the safe-haven Japanese yen and acts as a tailwind for the USD/JPY pair.
The US dollar, on the other hand, catches fresh bids and continues to draw support from expectations for a more aggressive policy tightening by the Fed. The markets started pricing in the possibility of a 1% rate hike move at the September FOMC meeting following the release of the stronger US CPI report on Tuesday. This remains supportive of elevated US Treasury bond yields, Which is seen as another factor underpinning the greenback and offering additional support to the USD/JPY pair.
Despite the fact that the fundamental backdrop favours bullish traders, the emergence of some selling at higher levels warrants some caution before positioning for any further appreciating move. Moreover, repeated failures near the 145.00 psychological mark constitute the formation of a bearish double-top chart pattern on short-term charts. Hence, sustained strength beyond the said barrier is needed to confirm the resumption of the recent strong bullish trajectory witnessed since March this year.
Market participants now look forward to the US economic docket, featuring Retail Sales figures, Weekly Initial Jobless Claims, Regional Manufacturing Indices, and Industrial Production data. This, along with the US bond yields, will influence the USD price dynamics and provide some impetus to the USD/JPY pair. Apart from this, traders will take cues from the broader risk sentiment to grab short-term opportunities ahead of the Chinese data dump during the Asian session on Friday.
Technical levels to watch
-
10:22
US: Inflation surprises to the upside in August – UOB
UOB Group’s Senior Economist Alvin Liew and Rates Strategist Victor Yong review the latest release of US inflation figures.
Key Takeaways
“US headline consumer price index (CPI) inflation was off from recent highs but still elevated at 8.3% y/y (from 8.5% y/y in Jul), above Bloomberg estimates of 8.1% (but in line with our forecast). On a m/m basis, the headline CPI picked up pace, increasing 0.1% m/m (versus flat at 0% in Jul) and faster against Bloomberg estimate of a decline by -0.1% m/m.”
“A bigger concern was the core CPI inflation (which excludes food and energy) which raced higher sequentially, reflecting unabating underlying momentum for price pressures. On a m/m basis, core inflation rose by a faster 0.6% in Aug (up from 0.3% in Jul, and above Bloomberg estimate of 0.3%). Compared to a year ago, it rose to 6.3% y/y in Aug, from 5.9% in Jul, and above Bloomberg estimate for 6.1%.”
“Goods inflation eased further, coming in at -0.8% m/m, 12.1% y/y in Jul (from -0.5% m/m, 12.1% y/y in Jul), but services inflation – a bigger and thus more important component of CPI – continued to increase and the pace re-accelerated, up by 0.7% m/m, 6.8% y/y (from 0.3% m/m, 6.2% y/y in Jul), matching the previous high of Oct 1982 (6.76% y/y). The sustained increase in services inflation in recent months is a clear indication that wage growth is having a meaningful transmission to price pressures.”
“While the latest US headline inflation was below the 9.1% recorded in Jun, this reflected mainly the decline in gasoline prices but the cost of living is still materially high as shown by the persistent rise of food and shelter costs and services inflation is getting hotter amidst strengthening demand. We maintain our headline CPI inflation forecast to average 8.5% and our core CPI inflation forecast at 6.5% for 2022. Subsequently, we still expect both headline and core inflation to ease in 2023, but it will likely average higher at 3.0% (from previous forecast of 2.5%). The balance of risk on inflation remains on the upside.”
-
10:20
ECB’s de Guindos: The euro area is now facing a challenging outlook
European Central Bank (ECB) Vice President Luis de Guindos is speaking at the CIRSF (Research Centre on Regulation and Supervision of the Financial Sector) Annual International Conference 2022 on Thursday. His speech is titled “The future of the EU financial system in a new geo-economic context.”
He said, “the euro area is now facing a challenging outlook.”
Additional quotes
Very high inflation is dampening spending and production.
Period of heightened uncertainty 'here to stay'.
Price pressures have continued to strengthen and broaden.
Monetary policy needs to walk a fine line to get it right.
Depreciation of the euro also adds to these inflationary pressures.
We need to guard against second-round effects.
Inflation is projected to be unacceptably high this year and next.
Growth to slow 'substantially'.
We also have decided to continue applying flexibility in reinvesting redemptions coming due in PEPP.
Monetary policy is still accommodative.
Related reads
- EUR/USD treads water just below parity amidst alternating risk trends
- ECB’s Makhlouf: Raising interest rates is absolutely necessary
-
10:17
EUR/USD treads water just below parity amidst alternating risk trends
- EUR/USD adds to Wednesday small advance just below parity.
- Risk appetite trends lack direction so far on Thursday.
- EMU Balance of Trade, US Retail Sales, Philly Index next on tap.
The single currency sticks to the bid bias and motivates EUR/USD to trade on the positive note near the key parity zone on Thursday.
EUR/USD focuses on US data
EUR/USD advances for the second session in a row and looks to revert the negative performance so far this week, particularly following Tuesday’s post-CPI slump from the vicinity of 1.0200 to the 0.9970 region.
In the meantime, market chatter continues to gyrate around the next rate hike by the Fed at next week’s event, with consensus positioned for a 75 bps rate hike despite a full-point rate raise remaining on the table.
In the domestic calendar, final Inflation Rate in France saw the CPI rise 0.5% MoM and 5.9% YoY in August, while the trade deficit in the euro area widened to €34B in July. Across the pond, Retail Sales and the Philly Fed Index will take centre stage seconded by Industrial Production, Initial Claims and Business Inventories.
What to look for around EUR
EUR/USD regains ground at a snail pace and looks to leave behind the parity level in a more sustainable fashion.
So far, price action around the European currency is expected to closely follow dollar dynamics, geopolitical concerns, fragmentation worries and the Fed-ECB divergence.
On the negatives for the single currency emerge the so far increasing speculation of a potential recession in the region, which looks propped up by dwindling sentiment gauges as well as an incipient slowdown in some fundamentals.
Key events in the euro area this week: France Final Inflation Rate, EMU Balance of Trade (Thursday) – Italy, EMU Final Inflation rate (Friday).
Eminent issues on the back boiler: Continuation of the ECB hiking cycle. Italian elections in late September. Fragmentation risks amidst the ECB’s normalization of its monetary conditions. Impact of the war in Ukraine and the persistent energy crunch on the region’s growth prospects and inflation outlook.
EUR/USD levels to watch
So far, the pair is advancing 0.06% at 0.9985 and now faces the initial barrier at 1.0197 (monthly high September 12) followed by 1.0202 (August 17 high) and then 1.0320 (100-day SMA). On the flip side, the breakdown of 0.9955 (weekly low September 14) would target 0.9863 (2022 low September 6) en route to 0.9859 (December 2002 low).
-
10:15
ECB’s Makhlouf: Raising interest rates is absolutely necessary
European Central Bank (ECB) Governing Council member Gabriel Makhlouf said on Thursday that “raising interest rates is absolutely necessary.”
“Reducing public debt 'should remain a key priority', Makhlouf added.
He warned that “persistent inflation is damaging to economic stability.”
Market reaction
EUR/USD was last seen trading at 0.9986, 0.11% higher on the day.
-
10:04
Greece Unemployment Rate (QoQ) declined to 12.4% in 2Q from previous 13.8%
-
10:01
European Monetary Union Trade Balance s.a. came in at €-40.3B below forecasts (€-35.5B) in July
-
10:00
European Monetary Union Labor Cost came in at 4%, above expectations (1.4%) in 2Q
-
10:00
European Monetary Union Trade Balance n.s.a. came in at €-34B, below expectations (€-16.4B) in July
-
09:58
Spain 5-y Bond Auction up to 2.228% from previous 1.754%
-
09:53
BOE Survey: UK public inflation expectations at record high for 2023
The quarterly survey conducted by the Bank of England (BOE) showed that the public's expectations in Britain for inflation over the coming surged.
Key takeaways
UK public inflation expectations for the coming year 4.9%.
UK public inflation expectations for 12 months after that are 3.2%.
UK public inflation expectations for 5 years' time are 3.1%.
Net public confidence in BOE-7% vs -3% in May.
UK public's year-ahead inflation expectations highest since the survey began in 1999.
Market reaction
The pound fails to pay any heed to the BOE survey, with GBP/USD keeping its range around 1.1525, down 0.07% on the day.
-
09:50
GBP/USD remains on the defensive amid modest USD uptick, eyes US data for fresh impetus
- GBP/USD comes under renewed selling pressure on Thursday, though lacks follow-through.
- Aggressive Fed rate hike bets revive the USD demand and exert some downward pressure.
- A positive risk tone caps the safe-haven buck and helps limit the downside for the major.
The GBP/USD pair struggles to capitalize on the previous day's modest uptick and meets with a fresh supply on Thursday. Spot prices remain on the defensive through the first half of the European session, though manage to hold above the 1.1500 psychological mark.
The US dollar catches fresh bids amid expectations for a more aggressive policy tightening by the Fed and turns out to be a key factor exerting some downward pressure on the GBP/USD pair. The stronger US consumer inflation data released on Tuesday all but confirmed that the Fed will hike interest rates at a faster pace. In fact, the implied odds for a full 1% lift-off at the September FOMC meeting currently stand at 30%.
Furthermore, the markets have been pricing in the possibility of another supersized Fed rate hike move in November. This remains supportive of elevated US Treasury bond yields and continues to underpin the greenback. That said, a generally positive risk tone is capping gains for the safe-haven buck. Apart from this, prospects for a 75 bps rate hike by the Bank of England on September 22 offer support to the GBP/USD pair.
This makes it prudent to wait for strong follow-through selling before positioning for an extension of the post-US CPI sharp retracement slide from a two-week high. In the absence of any relevant economic data from the UK, traders look forward to the US macro releases for some impetus later during the early North American session.
Thursday's US economic docket features the release of monthly Retail Sales figures, Weekly Initial Jobless Claims, Regional Manufacturing Indices, and Industrial Production data. This, along with the US bond yields and the broader risk sentiment, will influence the USD and produce short-term trading opportunities around the GBP/USD pair.
Technical levels to watch
-
09:37
EUR/HUF to target the 431/33 zone on a break past 415/17 – SocGen
EUR/HUF has undergone a pause in its up move after achieving upside projections near 415/417 in July. A break above here would clear the way towards 426, then 431/433, economists at Société Générale report.
Dip under 391 to trigger substantial fall
“The pair has successfully defended August levels of 391 in recent pullback and has now crossed above a steep descending channel. The break highlights possibility of revisiting the hurdle at 415/417. Once this is overcome, next leg of uptrend is likely to materialize towards projections of 426 and 431/433.”
“Defending 391 is crucial for averting a deeper down move.”
See: EUR/HUF set to reach 415 by year-end – Commerzbank
-
09:32
United Kingdom Consumer Inflation Expectations climbed from previous 4.6% to 4.9%
-
09:24
USD/JPY: Unilateral intervention not enough to reverse the yen downtrend – SocGen
The yen has plunged 25% since March against the US dollar. Therefore, talks of Bank of Japan (BoJ) intervention have increased. Nonetheless, economists at Société Générale believe that currency intervention will not deter the USD/JPY pair upmove.
Two conditions necessary for a sustainable reversal in the JPY
“We see two conditions necessary for a sustainable reversal in the JPY: 1/ the BoJ abandons curve control (10y JGB cap 0.25%); 2/ a recession unfolds in the US and causes Treasury yields to crumble.”
“Unilateral intervention could keep USD/JPY from scaling new highs but won’t be enough to reverse the downtrend.”
-
09:17
USD/CHF eases from weekly high, holds above 0.9600 mark amid modest USD strength
- USD/CHF climbs to a multi-day high and draws support from a combination of factors.
- A positive risk tone undermines the safe-haven CHF and acts as a tailwind for the pair.
- Bets for aggressive Fed rate hikes revive the USD demand and contribute to the uptick.
The USD/CHF pair regains some positive traction on Thursday and touches a four-day high, though the uptick stalls just ahead of mid-0.9600s. Nevertheless, the pair manages to stick to modest intraday gains through the early European session and is currently placed around the 0.9625 area.
Signs of stability in the equity markets undermine the safe-haven Swiss franc and act as a tailwind for the USD/CHF pair. The US dollar, on the other hand, attracts fresh buying amid firming expectations for a more aggressive policy tightening by the Fed. This was seen as another factor lending some support to spot prices.
Tuesday's stronger US CPI report fueled speculations that the Fed will hike interest rates at a faster pace to tame inflation. In fact, the implied odds for a full 1% lift-off at the September FOMC meeting currently stand at 30%. This remains supportive of elevated US Treasury bond yields and continues to benefit the USD.
That said, the lack of any follow-through buying warrants caution before positioning for an extension of the stronger US consumer inflation-inspired recovery from a nearly one-month low. Nevertheless, the fundamental backdrop suggests that the path of least resistance is to the upside and seems tilted in favour of bullish traders.
Market participants now look forward to the US economic docket, featuring Retail Sales figures, Weekly Initial Jobless Claims, Regional Manufacturing Indices, and Industrial Production data. This, along with the US bond yields, will influence the USD. Apart from this, the broader risk sentiment should provide some impetus to the USD/CHF pair.
Technical levels to watch
-
09:17
AUD/USD to suffer further losses if it fails to defend 0.6680 – SocGen
AUD/USD is in the vicinity of the trough formed in July at 0.6680 which is also the lower band of a descending channel. A break below the latter would clear the way towards 0.6620, then 0.6540/0.6465, economists at Société Générale report.
Break above 0.69 needed to see a rebound
“The pair has recently failed to reclaim 50-DMA near 0.6900; this hurdle must be crossed for an extended bounce.”
“In case it fails to defend 0.6680, ongoing downtrend could extend towards next projections at 0.6620 and 0.6540/0.6465.”
-
09:02
USD/JPY: Yen to recover most of its losses next year on BoJ's monetary policy shift – Nordea
The discrepancy between monetary policy against the Bank of Japan and the rest of the G10 central banks is taking its toll on the yen. Thus, the JPY will remain weak until the BoJ shifts gears, economists at Nordea report.
Loose monetary policy is the problem for JPY
“FX intervention will not be looked upon as welcomed by the remaining G7 countries if Japan unilaterally decides to intervene, and we believe that the bar for actual intervention is quite high and that the JPY would need to come above 148 against the USD before a real intervention is in the cards.”
“What will stop the yen-weakening is a shift in monetary policy from the Bank of Japan. Such a shift could easily come when the current BoJ Governor Kuroda retires in April 2023. We thus expect the JPY, which is the worst G10 performer against the USD this year, to recover most of its losses next year.”
-
09:01
Turkey Budget Balance climbed from previous -64B to 33.13B in August
-
08:50
USD/CNH: Extra advance appears likely once 7.0000 is cleared – UOB
USD/CNH needs to clear the 7.0000 hurdle to allow for a more convincing gains, comment FX Strategists at UOB Group Lee Sue Ann and Quek Ser Leang.
Key Quotes
24-hour view: “We indicated yesterday that USD ‘is likely to advance further even though it is left to be seen if it can break the major resistance at 7.0000’. Our expectations for further advance did not materialize as USD traded sideways in a relatively quiet manner between 6.9619 and 6.9850 before closing largely unchanged at 6.9750 (-0.09%). The movement appears to be part of a consolidation and further sideway trading would not be surprising. Expected range for today, 6.9620/6.9880.”
Next 1-3 weeks: “Yesterday (14 Sep, spot at 6.9820), we indicated that while upward momentum is building again, USD has to close above 7.0000 before a sustained advance is likely. We added, ‘support is at 6.9550 but only a breach of 6.9400 would indicate that USD is not ready to move above 7.0000’. There is no change in our view for now.”
-
08:50
EUR/USD to fall towards 0.95 by year-end – Nordea
In the opinion of economists at Nordea, the US economy should continue to outperform the euro area, pushing EUR/USD further down.
Hawkish ECB will not save the euro
“The weak euro area economic outlook compared to the US is one important reason why we expect the USD to continue to outperform the EUR, even if we expect the ECB to remain hawkish in the months ahead.”
“EUR/USD will continue to head lower and bottom at 0.95 later this year.”
“There could be a policy divergence among EU countries. If EU members don’t show solidarity with each other in the difficult months to come, then questions about the future of the EUR might come to the forefront again. If this materialises, then the EUR will weaken even more against the USD.”
-
08:46
US Dollar Index regains the smile and targets 110.00 ahead of data
- The index resumes the upside and approaches 110.00.
- US yields extend the march north across the curve on Thursday.
- Retail Sales, Initial Claims, Philly Fed Index next of note in the docket.
The greenback, when measured by the US Dollar Index (DXY), regains some composure and advances to the proximity of the 110.00 yardstick on Thursday.
US Dollar Index looks to data
The index rapidly leaves behind Wednesday’s pullback and resumes the weekly uptrend, all against the backdrop of alternating risk appetite trends and a mild preference for the US dollar in the global markets.
The so far daily uptick in the greenback comes in tandem with further upside in US yields across the curve, where the 2-year note moves closer to the 3.85% level, an area last visited in November 2007.
The firmer note in the buck also appears underpinned by the conviction around a 75 bps rate hike by the Federal Reserve at its September 21 gathering, although there is still a nearly 30% chance of a full-point rate raise according to CME Group’s FedWatch Tool.
Busy day data wise in the US calendar, as weekly Claims, the Philly Fed Index and Retail Sales are due in the first turn seconded by Industrial Production, Capacity utilization and Business Inventories.
What to look for around USD
The index regains poise and resumes the post-CPI upside on Thursday, with the immediate target at the 110.00 neighbourhood.
Bolstering the dollar’s underlying positive stance appears the firmer conviction of the Federal Reserve to keep hiking rates until inflation looks well under control regardless of a likely slowdown in the economic activity and some loss of momentum in the labour market. This view was reinforced by Chair Powell’s speech at the Jackson Hole Symposium.
Looking at the more macro scenario, the greenback appears propped up by the Fed’s divergence vs. most of its G10 peers in combination with bouts of geopolitical effervescence and occasional re-emergence of risk aversion.
Key events in the US this week: Retail Sales, Initial Claims, Philly Fed Manufacturing Index, Industrial Production, Business Inventories (Thursday) – Flash Michigan Consumer Sentiment, TIC Flows (Friday).
Eminent issues on the back boiler: Hard/soft/softish? landing of the US economy. Prospects for further rate hikes by the Federal Reserve vs. speculation over a recession in the next months. Geopolitical effervescence vs. Russia and China. US-China persistent trade conflict.
US Dollar Index relevant levels
Now, the index is advancing 0.09% at 109.74 and a break above 110.01 (weekly high September 13) would expose 110.78 (2022 high September 7) and then 111.90 (weekly high September 6 2002). On the other hand, the next support emerges at 107.68 (monthly low September 13) followed by 107.58 (weekly low August 26) and finally 107.52 (55-day SMA).
-
08:43
Forex Today: Markets quiet down ahead of mid-tier US data
Here is what you need to know on Thursday, September 15:
Following Wednesday's choppy action, markets stay relatively quiet on Thursday. The US Dollar Index holds in positive territory but stays below 110.00, the US stock index futures trade flat and the 10-year US Treasury bond yield moves sideways above 3.4%. In the second half of the day, August Retail Sales data will be featured in the US economic docket alongside the weekly Initial Jobless Claims, NY Empire State Manufacturing Survey and Philadelphia Fed Manufacturing Survey. Finally, the Fed will publish August's Industrial Production and Capacity Utilization figures.
US Retail Sales Preview: Can consumers keep up with inflation? A breather could weigh on the dollar.
During the Asian trading hours, China’s State Council announced that the People’s Bank of China (PBOC) will provide more than 200 billion yuan ($28.7 billion) in special lending funds to commercial banks to boost loans to companies. Furthermore, Reuters reported that China's largest four state-owned banks cut deposit rates, effective Thursday. Despite these developments, Shanghai Composite Index ended up closing the day in negative territory.
Earlier in the day, the data from Australia revealed that the Unemployment Rate edged higher to 3.5% in August from 3.4%. The participation rate improved to 66.6% from 66.4% and the Employment Change arrived at +33.5K, slightly below the market expectation of 35K. Following a mixed immediate reaction, AUD/USD started to stretch higher and was last seen rising 0.15% on the day at around 0.6750.
Statistics New Zealand reported the Gross Domestic Product (GDP) expanded at an annualized rate of 0.4% in the second quarter, surpassing analysts' forecast for a growth of 0.2%. Despite the upbeat GDP data NZD/USD struggles to gather momentum and trades in a relatively tight range near 0.6000.
EUR/USD continues to trade below parity on Thursday. The trade deficit in the euro area is expected to widen to €35.5 billion in July from €30.8 billion in June.
GBP/USD managed to register modest gains on Wednesday and seems to have stabilized above 1.15000 early Thursday.
USD/JPY fell sharply on Wednesday amid speculations that the Bank of Japan might be preparing to intervene in foreign exchange markets. The pair gained traction during the Asian trading hours and was last seen trading modestly higher on the day at around 143.50.
Gold broke below $1,700 during the Asian trading hours and failed to reclaim that level. With European traders entering the markets, XAU/USD extended its slide toward $1,680.
Bitcoin continues to move sideways slightly above $20,000. Ethereum holds steady near $1,600 after having gained more than 4% on Wednesday.
BREAKING: Ethereum Merge begins, the good, bad and ugly of crypto’s $22 billion bet.
-
08:41
NZD/USD consolidates in a range around 0.6000, seems vulnerable amid bullish USD
- NZD/USD struggles to gain any meaningful traction and oscillates in a range.
- Aggressive Fed rate hike bets revive the USD demand and act as a headwind.
- A positive risk tone seems to be the only factor that lends support to the pair.
The NZD/USD pair struggles to capitalize on the previous day's modest bounce from the 0.5975 area and oscillates in a range through the early European session on Thursday. The pair is currently hovering around the 0.6000 psychological mark and remains well within the striking distance of its lowest level since May 2020 touched the previous day.
Signs of stability in the equity markets turn out to be a key factor offering some support to the risk-sensitive kiwi. That said, the emergence of fresh US dollar buying acts as a headwind for the NZD/USD pair. Tuesday's stronger US CPI report lifted bets for a more aggressive policy tightening by the Fed, which, in turn, continues to underpin the greenback.
The implied odds for a full 1% lift-off at the next FOMC meeting on September 20-21 currently stand at 30%. Moreover, the markets expect the Fed to deliver another supersized 75 bps rate hike in November. This remains supportive of elevated US Treasury bond yields and favours the USD bulls, supporting prospects for a further downside for the NZD/USD pair.
That said, a positive risk tone caps gains for the safe-haven greenback and warrants some caution for aggressive traders. Market participants now look forward to the US economic docket, featuring Retail Sales figures, Weekly Initial Jobless Claims, Regional Manufacturing Indices, and Industrial Production data later during the early North American session.
This, along with the US bond yields and the broader risk sentiment, might influence the USD price dynamics and provide some impetus to the NZD/USD pair. The focus, however, remains on next week's highly-anticipated FOMC monetary policy meeting.
Technical levels to watch
-
08:03
USD/JPY: Intervention in support of the yen will not be successful beyond a short-term rebound – Scotiabank
USD/JPY is nearing the point (147.66) that marked the peak during the last, intense support operation for the yen that the Bank of Japan unleashed in 1998. The real issue is whether intervention would be effective in stemming the JPY slide. The answer is that unilateral intervention is unlikely to achieve a sustained rise in the yen, in the view of economists at Scotiabank.
US and Japanese monetary policy settings are moving in opposite directions
“A bout of official intervention could prompt a sharp-ish rebound in the JPY in the short run – perhaps by as much as 3-5% if timed well.”
“Beyond an unfeasibly large and sustained period of official JPY buying, a more sustained rebound in the JPY will need the support of a change in underlying fundamentals (monetary policy dynamics) and a reversal in the broader USD bull trend.”
-
07:57
Gravity seems likely to exert downward pressure on the USD sooner rather than later – JP Morgan
The US dollar already came into this year overvalued. Despite this, it has rallied a further 13% year-to-date to a 20-year high. When will the US dollar peak? More confidence around global growth is needed, Gabriela Santos, Global Market Strategist at JP Morgan, reports.
USD unlikely to peak in the very short-term
“In the short-term, the dollar peak may be delayed as investors still wrestle with global recession fears, keeping volatility elevated across assets and dragging on international equity returns. However, in the time frame of the next few quarters, investor sentiment about global growth has already gotten so depressed that ‘less bad’ news can fuel a turnaround in foreign currencies.”
“As gravity takes its toll on the US dollar again, market volatility can decline and international equity returns can receive a boost.”
-
07:56
Silver Price Analysis: 100-HMA probes XAG/USD sellers on the way to $18.80
- Silver price takes offers to reverse the previous day’s gains.
- Clear break of one-week-old ascending trend line, bearish MACD signals favor XAG.USD sellers.
- Bulls need to cross the $19.65 hurdle to retake control.
Silver price (XAG/USD) renews intraday low near $19.35 amid the initial hour of Thursday’s European session.
In doing so, the bright metal justifies the downside break of a weekly support line, now resistance around $19.60. Also keeping the bears hopeful are the downbeat MACD signals and the descending RSI (14), not oversold.
It should be noted, however, that the 100-HMA level near $19.30 tests the XAG/USD sellers before directing them to the $19.00 threshold.
Following that, the 200-HMA, close to $18.80 by the press time, could gain the metal bear’s attention.
On the flip side, a downward sloping resistance line from Monday, close to $19.65 at the latest, restricts the short-term rebound of the silver prices. Also acting as an upside filter is the $20.00 threshold.
In a case where the XAG/USD rises past $20.00, it could quickly rise towards the previous monthly top surrounding $20.90 and then to the $21.00 threshold.
To sum up, silver price returns to the bear’s table after the previous day’s failed attempt to lure buyers.
Silver: Hourly chart

Trend: Further weakness expected
-
07:55
USD/CAD edges higher amid modest USD strength and softer oil prices, remains below 1.3200
- USD/CAD attracts some dip-buying on Thursday and is supported by a combination of factors.
- Softer oil prices undermine the loonie and act as a tailwind amid a pickup in the USD demand.
- Repeated failures to find acceptance above the 1.3200 mark warrant caution for aggressive bulls.
- Traders now await important US macroeconomic releases for some meaningful opportunities.
The USD/CAD pair reverses an intraday dip to mid-1.3100s and climbs to a fresh daily high during the early European session. The pair is currently placed around the 1.3175-1.3180 region and remains well supported by a combination of factors.
Investors remain concerned that a deeper global economic downturn will dent fuel demand. This, to a larger extent, overshadows supply worries and weighs on crude oil prices, which, in turn, seems to undermine the commodity-linked loonie. Apart from this, the emergence of fresh US dollar buying acts as a tailwind for the USD/CAD pair and remains supportive of the modest intraday uptick.
Tuesday's stronger US CPI report reaffirmed expectations that the Fed will stick to its aggressive policy tightening path. In fact, the markets have been pricing in the possibility of a full 1% rate hike at the September FOMC meeting and another supersized 75 rate increase in November. This remains supportive of elevated US Treasury bond yields and continues to lend support to the greenback.
That said, a recovery in the risk sentiment - as depicted by a generally positive tone around the equity markets - might keep a lid on any meaningful gains for the safe-haven buck. Even from a technical perspective, the USD/CAD pair has repeatedly failed to find acceptance above the 1.3200 round-figure mark, warranting some caution before positioning for any further appreciating move.
Market participants now look forward to the US economic docket, featuring the release of monthly Retail Sales, Weekly Initial Jobless Claims, Regional Manufacturing Indices and Industrial Production data. This, along with the US bond yields and the broader risk sentiment, will drive the USD demand. Apart from this, oil price dynamics should provide some impetus to the USD/CAD pair.
Technical levels to watch
-
07:47
EUR/GBP looks unlikely to make any big moves outside its recent range for now – ING
The market is pricing in a near 75 bps hike for next week's Bank of England meeting. However, economists at ING do not expect the EUR/GBP pair to stage a significant move.
A break in data releases today
“In a very busy week for the UK economic calendar, we don’t get any major releases today.”
“Markets are currently pricing in 67 bps of tightening at next week's BoE meeting, and we see a good probability of markets fully pricing in a 75 bps hike in the coming days. That could offer a bit of help to sterling into the BoE announcement, but EUR/GBP looks unlikely to make any big moves outside its recent range for now.”
-
07:45
France Consumer Price Index (EU norm) (MoM) above expectations (0.4%) in August: Actual (0.5%)
-
07:45
France Consumer Price Index (EU norm) (YoY) above expectations (6.5%) in August: Actual (6.6%)
-
07:45
France Inflation ex-tobacco (MoM) increased to 0.5% in August from previous 0.3%
-
07:44
US dollar can stay supported amid plenty of data releases – ING
A fresh serving of US data should keep the market's expectations hawkish, in the view of economists at ING. Therefore, the dollar is set to remain on solid ground.
Plenty of data releases to watch today
“There are quite a number of data releases to keep an eye on today: retail sales, industrial production, Empire Manufacturing, and the Philadelphia Fed Business Outlook. Jobless claims may also gather more attention than usual after a surprisingly big drop last week fuelled the hawkish narrative of a still very tight labour market in the US.”
“We see a good chance that today’s data will not trigger any material re-pricing lower in Fed rate expectations, and the hawkish inertia into next week’s meeting means that the dollar can stay supported.”
See – US Retail Sales Preview: Forecasts from six major banks, can the US consumer remain strong?
-
07:38
EUR/USD to stay at or below 1.00 in the coming days – ING
EUR/USD holds lower ground. Economists at INg expect the world’s most popular currency pair to stay below parity in the coming days.
Estimating impact of energy caps
“The EUR-USD 2-year swap rate differential has re-widened in favour of the dollar and while we have highlighted on multiple occasions how the rate differential is indeed playing a secondary role in EUR/USD dynamics lately, this has reduced the room for a euro recovery further down the road.”
“There is still some uncertainty on whether the government’s efforts to freeze hikes in energy bills would have a predominantly dovish impact on central banks (as inflation would be lower) or a hawkish impact as the economic impact would be smaller and that allows more tightening. While markets wait for more clarity on this, the dollar’s resilience may keep EUR/USD at or below 1.0000 in the coming days.”
-
07:38
Germany’s Habeck on Ukraine: Can now see possibility of victory for democracy
German Economy Minister Robert Habeck said on Thursday, they “can now see the possibility of victory for democracy.”
Additional quotes
“Reconstruction of Ukraine requires more than public money can offer.”
“We must create a global fund with money from private investors, hedge funds and so on.“
“Plans to use trade to stabilize Ukraine once again.”
Market reaction
EUR/USD is holding the lower ground around 0.9960, down 0.13% on the day, at the time of writing.
-
07:34
EUR/HUF set to reach 415 by year-end – Commerzbank
The Hungarian forint exchange rate weakened sharply once again on Wednesday amid adverse developments on Hungary’s EU funding side. Economists at Commerzbank expect the EUR/HUF to hit 415 by the end of the year.
EU fund scare hits forint again
“Reporting from multiple sources raises the likelihood that at least some fund sanctions will, indeed, be imposed on Hungary. Markets have, so far, only minimally priced-in this risk of actual fund deduction. Therefore, the forint’s weakness now appears consistent.”
“The risk is also double-edged – meaning that not only the possible loss of funds, but the (negative) counter-reaction to this within Hungarian politics also needs to be considered – and will now be gradually priced-in by the markets.”
“We see EUR/HUF rising to 415.00 by the end of 2022.”
-
07:27
Riksbank to deliver 75 bps, effect on the krona to be limited – Commerzbank
The Riksbank will have to take action again next week. Economists at Commerzbank expect a 75 basis points (bps) rate hike, however, the krona is set to shrug off the movement.
Uncertainty in government formations usually leaves the krona unaffected
“I assume that it will hike its key rate by 75 bps on Tuesday to then 1.50% while at the same time adjusting the rate path to the upside. The market is also pricing in 75 bps for next week so the effect on SEK is likely to be limited. Otherwise, the Riksbank would have to sound very hawkish, signalling key rates to peak at much higher levels. That, in turn, seems unlikely in view of economic risks.”
“The possible change of government after the parliamentary elections in Sweden on Sunday should only be a side note for the FX market. Uncertainty is nothing new in government formations in Sweden and usually leaves the krona unaffected. But even if the change takes place quickly this time, I don't expect it to have much effect on the SEK.”
-
07:25
EUR/USD Price Analysis: Bears attack weekly support line with eyes on 0.9860
- EUR/USD extends pullback from 200-HMA as it pokes short-term key support.
- Looming bear cross on the MACD, downbeat RSI signals further downside.
- Yearly low lures sellers, 50-HMA acts as an additional upside filter.
EUR/USD holds lower ground as sellers poke the seven-day-old support line around 0.9960 amid the initial European session on Thursday.
In doing so, the major currency pair extends the previous day’s pullback from the 200-HMA, as well as justifies the trading below the 61.8% Fibonacci retracement level of September 06-12 upside.
It’s worth noting that the impending bearish signals from the MACD and the downbeat performance of the RSI (14), not oversold, also keep EUR/USD bears hopeful of breaking the 0.9960 support.
Following that, the 0.9900 threshold may probe the downside moves before directing sellers towards the yearly low around 0.9860, also the lowest level since December 2002.
In a case where the EUR/USD bears keep reins past 0.9860, the October 2002 low near 0.9680 will be in focus.
Alternatively, the 61.8% Fibonacci retracement, also known as the golden ratio, guards the EUR/USD pair’s immediate recovery moves near 0.9990 ahead of the 200-HMA and the 50-HMA hurdles, close to the 1.0000 parity level and 1.0010 in that order.
Should the quote rises past 1.0010, the recovery moves could aim for the 1.0110 and the 1.0200 hurdles to the north.
To sum up, EUR/USD is ready to refresh the yearly low but any further downside needs a strong catalyst, which in turn highlights the US Retail Sales for August.
Also read: US Retail Sales Preview: Can consumers keep up with inflation? A breather could weigh on the dollar
EUR/USD: Hourly chart
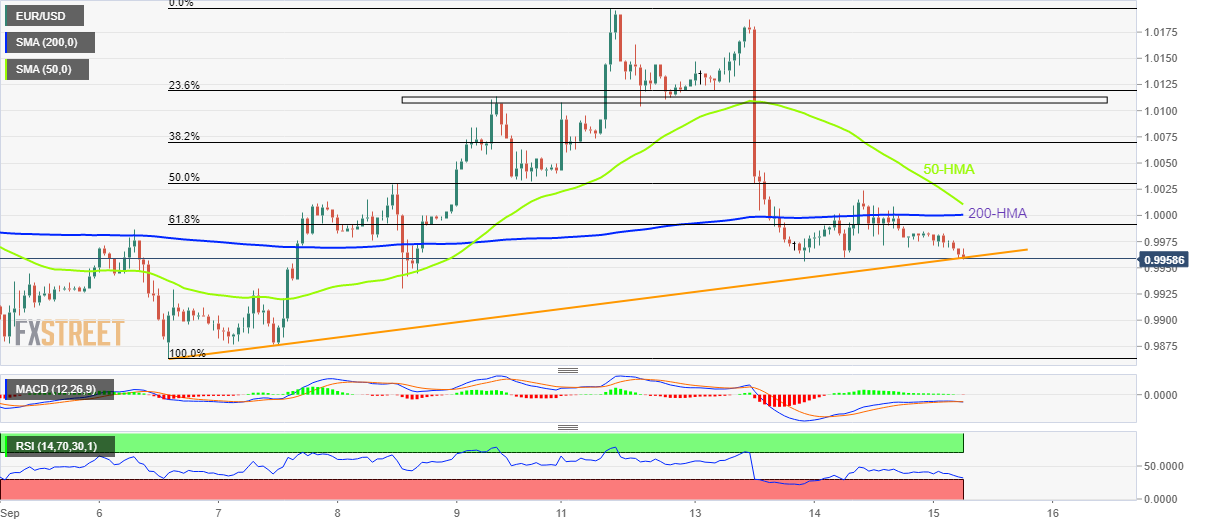
Trend: Further weakness expected
-
07:22
Sterling needs a truly very hawkish statement from the BoE to surge – Commerzbank
The Bank of England’s (BoE) meeting should have been held today but was postponed due to the mourning period. Market expectations have in part reached 75 bps for next week. But in the view of economists at Commerzbank, the BoE will hardly be able to deliver enough for sterling.
The conditions for sterling remain difficult
“With an inflation rate of 10%, it makes very little difference whether the key rate is 25 bps higher or not. At 2.25% or 2.50%, it remains clearly too low to send out a clear signal that at some point real interest rates might become anything but clearly negative again. The BoE would not just have to hike rates further, but inflation would also have to ease. But that won’t happen anytime soon.”
“Things are not looking good economically, the necessary rate hikes make it even more difficult for the economy. That might prevent the BoE from making a truly very hawkish statement next week. That would be required to convince the market that the BoE remains on a tightening course though, which would benefit sterling.”
“The conditions for sterling remain difficult. Even if a lot of negative news has already been priced in, I don’t think we will see more than short-term corrections.”
-
07:16
USD/JPY sticks to the 141.00-145.00 range – UOB
USD/JPY is now likely to trade within the 141.00-145.00 band in the near term, comment FX Strategists at UOB Group Lee Sue Ann and Quek Ser Leang.
Key Quotes
24-hour view: “We highlighted yesterday that ‘further USD strength appears likely even though overbought conditions suggest a sustained rise above 145.00 is unlikely’. However, USD did not break 145.00 as it rose to 144.95 before staging a surprisingly sharp drop to a low 142.54. Despite the bounce from the low, the underlying tone appears to be soft and USD could dip below 142.50. The next support at 142.00 is unlikely to come under threat. Resistance is at 143.60 followed by 144.10.”
Next 1-3 weeks: “After the strong advance on Tuesday, we highlighted yesterday (14 Sep, spot 144.50) that while upward momentum has improved, USD has to close above the major resistance at 145.00 below further advance is likely. We added, ‘a break of 143.30 would indicate that USD is not ready to move above 145.00 in a sustained manner’. USD rose to 144.95 during Asian hours yesterday before plunging below our ‘strong support’ level at 143.30. The breach of the ‘strong support’ indicates that USD is not ready to move above 145.00 in a sustained manner. From here, USD is likely to trade between 141.00 and 145.00 for a period of time.”
-
07:15
Situation in Europe is quite uncertain, the worst may yet be to come – Commerzbank
With the successes of the Ukrainian army sentiment on the markets improved a little at the start of the week. However, Antje Praefcke, FX and EM Analyst at Commerzbank, is sceptical. The worst may yet be to come.
The more the ECB does its frontloading, the less might follow at a later stage
“I am cautious with a view to the ECB and positive reactions of the euro in response to hawkish comments. The more the ECB does its frontloading, i.e. hiking the key rate short-term, the less might follow at a later stage. Above all, if the economy deteriorates significantly in the winter as a result of an energy crisis. Moreover, the ECB will have to deliver first what the market is pricing in.”
“The worst – in the shape of a tough winter with tight energy supplies and a recession which will cause the ECB to become more cautious again – may yet be to come. Even though I would, of course, be relieved if we were able to avoid that.”
-
07:10
GBP/USD Price Analysis: More downside looks certain below 1.1500
- A fakeout of the Rising Channel brought a sheer downside to the cable.
- Declining 20-and 50-EMAs add to the downside filters.
- The RSI (14) is on the verge of slipping into the bearish range of 20.00-40.00.
The GBP/USD pair has witnessed a steep fall after failing to surpass the critical hurdle of 1.1550 in the Tokyo session. A pullback move from Wednesday’s low at 1.1480 has concluded now and the market participants have initiated shorts by capitalizing on the bargain buy.
On an hourly scale, a perpendicular selling move by the pound bulls is visible after failing to sustain the upside break of the Rising Channel chart pattern. The upper portion of the above-mentioned chart pattern is placed from September 2 high at 1.1588 while the lower portion is plotted from the previous week’s low at 1.1405.
The 20-and 50-period Exponential Moving Averages (EMAs) at 1.1535 and 1.1555 respectively have turned lower, which adds to the downside filters.
Also, the Relative Strength Index (RSI) (14) is on the verge of shifting into a bearish range of 20.00-40.00, which will trigger a downside momentum.
A decisive break below the psychological support of 1.1500 will drag cable towards September 4 low at 1.444, followed by the previous week’s low at 1.1405.
On the contrary, a break above August 31 high at 1.1694 will send the asset towards August 30 high at 1.1761. A breach of the latter will drive the major towards August 25 high at 1.1855.
GBP/USD hourly chart
-637988189330247244.png)
-
07:10
Türkiye:: Higher inflation for longer, dovish monetary policy – Standard Chartered
Economists at Standard Chartered raise their inflation forecasts on higher realised inflation, continuing pressure on the Turkish lira (TRY) and elevated short and medium-term inflation expectations – however, they expect the Central Bank of the Republic of Turkey (CBRT) to ease policy further, as it looks to support growth amid rising global and domestic headwinds.
More rate cuts, despite higher inflation
“We raise our 2022 CPI inflation forecast (annual average) to 72% from 65%. We expect inflation to remain high due to higher short and medium-term inflation expectations and the lagged impact of continuing currency weakness. We also raise our 2023 and 2024 inflation forecasts to 40.0% (30% prior) and 15.0% (9%), as we expect expansionary monetary policy to keep inflation higher for longer.”
“We now expect the CBRT to cut the one-week repo rate by another 300 bps by end-2022 to 10.0%. Our base case is no change in the policy rate at the September meeting, as the central bank might adopt a ‘wait and see’ approach after last month’s cut and amid challenging global financial conditions. However, we do not rule out another rate cut.”
“A likely slowdown in economic activity in H2 is likely to convince the central bank to provide further monetary stimulus through rate cuts in Q4. The CBRT’s monetary policy stance is likely to remain tilted towards growth for the rest of 2022 and in H1-2023.”
-
07:07
FX option expiries for Sept 15 NY cut
FX option expiries for Sept 15 NY cut at 10:00 Eastern Time, via DTCC, can be found below.
- EUR/USD: EUR amounts
- 0.9850 260m
- 0.9990-00 1.6b
- 1.0015-20 602m
- 1.0050-60 1.2bl
- 1.0070-75 452m
- 1.0090-00 878m
- 1.0175-85 730m
- 1.0195-05 743m
- 1.0220-30 419m
- GBP/USD: GBP amounts
- 1.1675 427m
- 1.1700 224m
- 1.1900 480m
- USD/JPY: USD amounts
- 143.00 325m
- 144.00 220m
- AUD/USD: AUD amounts
- 0.6755 252m
- 0.6790-00 394m
- 0.6945 342m
- USD/CAD: USD amounts
- 1.2950 647m
- 1.3050 490m
- 1.3200 365m
- EUR/GBP: EUR amounts
- 0.8600 1.4b
- 0.8670 346m
- 0.8700 283m
- EUR/CHF: EUR amounts
- 0.9600 330m
-
07:01
Germany Wholesale Price Index (YoY) registered at 18.9%, below expectations (21%) in August
-
07:01
Germany Wholesale Price Index (MoM) registered at 0.1% above expectations (-0.6%) in August
-
07:00
Norway Trade Balance increased to 197.7B in August from previous 153.2B
-
07:00
Gold Price Forecast: XAU/USD set to test the 2022 lows of $1,681 once again
Gold price falls for the third straight, As FXStreet’s Dhwani Mehta notes, XAU/USD is poised for a big breakdown on big Fed rate hike bets.
XAU/USD awaits Thursday’s close to confirm an inverted cup and handle pattern
“The renewed uptick in the US Treasury yields, in the face of aggressive Fed rate hike expectations, also offers support to the greenback while adding to the weight on the non-yielding gold.”
“Bears now await the price to yield a daily closing below the rising trendline support at $1,693 to validate an inverted cup and handle formation. On a downside break, a test of the 2022 low at $1,681 will be inevitable, below which the 2021 low at $1,677 will come into play.”
“On the flip side, the $1,700 level will offer the immediate resistance, above which gold buyers will need to crack Monday’s low of $1,712. The $1,720 round number and the 21-DMA, now at $1,724, will be the next lines of defense for sellers.”
-
06:56
Gold Price Forecast: XAU/USD breaks key support below $1,700 ahead of US Retail Sales
- Gold price remains pressured towards yearly low on breaking a two-month-old support line.
- Firmer yields, fears surrounding China keep XAU/USD bears hopeful.
- US Retail Sales awaited with great cautious after softer CPI, PPI failed to tame hawkish Fed bets.
Gold price (XAU/USD) bears approach the yearly bottom on breaking the short-term key support line during Thursday’s early European morning. In doing so, the precious metal prints a three-day downtrend while poking $1,688 by the press time.
After an inactive start of the day, US Treasury yields pick up bids as traders brace for the European session, as well as the US Retail Sales for August. That said, the benchmark 10-year Treasury yields renew daily tops near 3.435% at the latest, after witnessing a pullback from a three-month high the previous day.
While tracking the same, the US Dollar Index (DXY) reverses the previous day’s downbeat performance around 109.90 even as the US Producer Price Index (PPI) flashed softer readings in August. US PPI declined to 8.7% YoY in August from 9.8% in July, versus 8.8% market forecasts.
The reason for the firmer yields could be linked to the hawkish Fed bets and mixed concerns surrounding China, one of the biggest customers of gold.
There appears 70% chance of the Fed’s 75 basis points (bps) rate hike in the next week, as well as the 30% odds favoring the full 100 bps Fed rate lift, as per the CME’s FedWatch Tool, as we write. On the other hand, China’s 200 billion yuan offer for stimulus contrasts with the People’s Bank of China’s (PBOC) mixed moves and fears of more economic hardships for the dragon nation, worst than 2020, also weigh on the market sentiment and the XAU/USD prices.
Amid these plays, the US stock futures remain downbeat, reversing early Asian session optimism while the yields and the DXY regain upside momentum amid cautious optimism.
Looking forward, the XAU/USD traders should wait for the US Retail Sales for August, expected to remain unchanged on MoM, to predict the metal prices properly. It should be noted that the market’s hawkish hopes stayed firmer despite the recently softer US inflation data and hence firmer Retail Sales prints could bolster the US dollar and weigh on the gold.
Also read: US Retail Sales Preview: Can consumers keep up with inflation? A breather could weigh on the dollar
Technical analysis
A clear downside break of an ascending trend line from July 21, around $1,690 by the press time, joins bearish MACD signals to favor gold sellers targeting the fresh yearly low, currently around $1,680.
In doing so, the XAU/USD bears keep their eyes on the 61.8% Fibonacci Expansion (FE) level of the bullion’s late April to early August moves, near $1,660.
Meanwhile, a corrective pullback needs validation from a three-week-old horizontal hurdle surrounding $1,728 to lure buyers.
Even so, a downward sloping resistance line from June 13 and the 100-DMA, respectively near $1,761 and $1,790, will act as the last defenses for the XAU/USD bears.
Gold: Daily chart
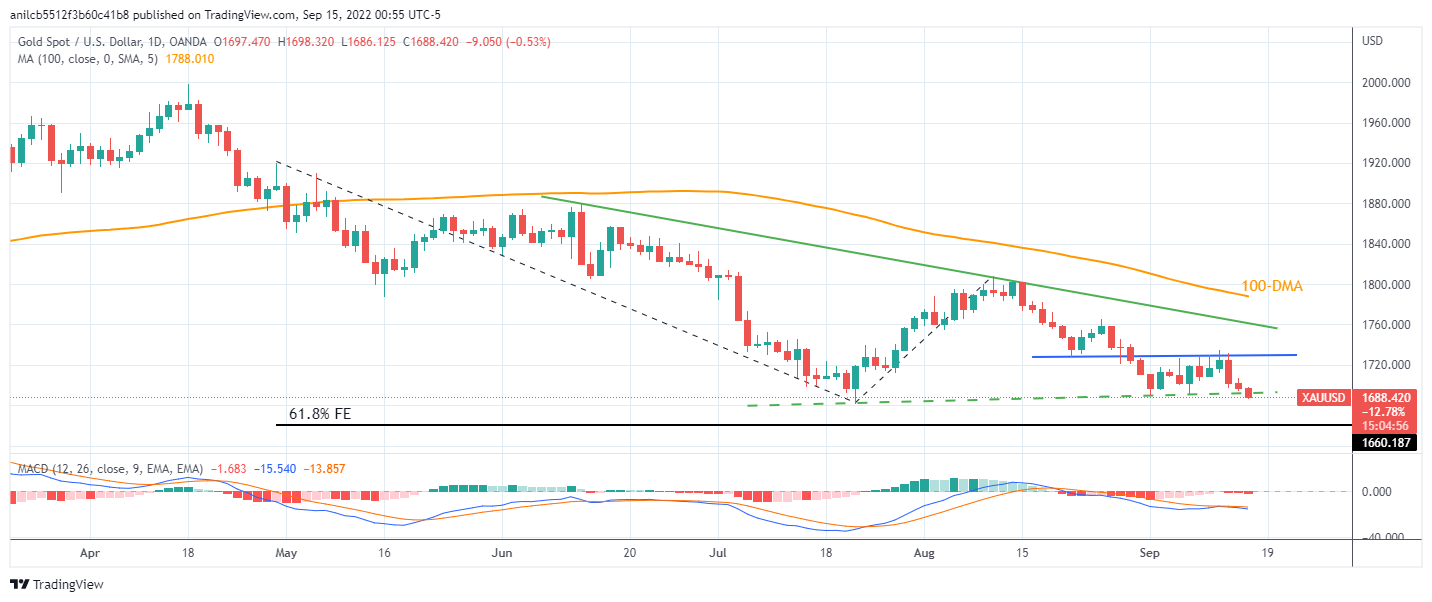
Trend: Further weakness expected
-
06:41
Natural Gas Futures: Green light for extra rebound
CME Group’s flash data for natural gas futures markets noted open interest resumed the uptrend and rose by around 3.3K contracts on Wednesday. Volume followed suit and went up sharply, this time by around 102.3K contracts.
Natural Gas now re-targets $10.00
Prices of the natural gas extended the recovery and rose markedly beyond the $9.00 mark on Wednesday. The move was also against the backdrop of increasing open interest and volume, exposing the continuation of the current bounce in the very near term and with next hurdle of note at the 2022 high just above the $10.00 mark per MMBtu (August 23).
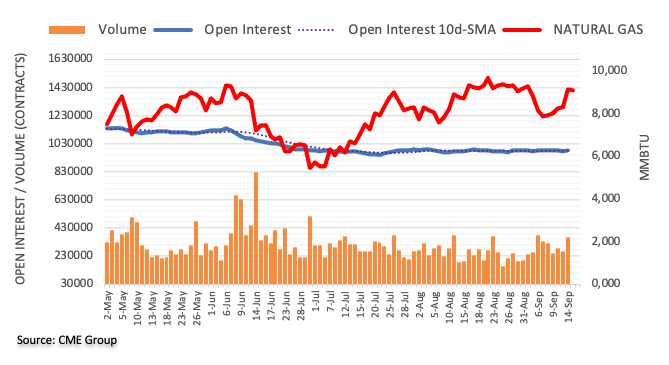
-
06:38
EUR/GBP displays a short-lived pullback around 0.8650, focus shifts to UK Retail Sales
- EUR/GBP has displayed a pullback move to near 0.8650, downside remains favored on stagflation fears.
- A one-time decline in the inflation rate is not sufficient to delight BOE policymakers.
- The ECB will remain more data-dependent in hiking interest rates further.
The EUR/GBP pair has witnessed a rebound after declining to a low of 0.8626. The asset has scaled higher gradually, which indicates that the pullback move is less-confident and won’t turn into a reversal ahead. On Wednesday, the cross witnessed a steep fall after the release of above-expected UK inflation data.
The plain-vanilla UK inflation rate that inculcates the volatile food and energy prices shifted lower to 9.9% vs. the prior release of 10.1% and also remained lower than the forecast of 10.2%. It is worth noting that the headline UK Consumer Price Index (CPI) has slipped lower in times when households are facing the headwinds of energy bills.
Next UK Prime Minister Liz Truss announced stimulus packages to safeguard households from skyrocketing energy bills but its impact has yet to be recorded. Therefore, a decline in the CPI figure is an unexpected bounty. Investors should not start pouring funds into sterling vigorously as a one-time decline in the inflation rate is not sufficient to trim hurdles of the Bank of England (BOE) policymakers.
On Friday, the UK Office for National Statistics will report the Retail Sales data. The economic data is expected to display a decline of 4.2% against a decline of 3.4% reported earlier on an annual basis. Also, the monthly figure will display a decline of 0.5% against a rise of 0.3% reported earlier.
Meanwhile, the shared currency bulls are in anxiety about the soaring odds of stagflation in the Eurozone. European Central Bank (ECB) member Robert Holzmann cited that the odds of stagflation are soaring. He further added that the ECB underestimated the pace of the inflation rate but will remain more data-dependent for further hikes.
-
06:35
NZD/USD faces a gradual decline – UOB
In the opinion of FX Strategists at UOB Group Lee Sue Ann and Quek Ser Leang, the downside pressure could motivate NZD/USD to slip back to 0.6975 ahead of 0.6945.
Key Quotes
24-hour view: “Yesterday, we were of the view that ‘the rapid drop in NZD could extend to 0.5975’. While NZD dropped as expected, it rebounded from a low of 0.5978. Downward pressure has eased and NZD is likely to trade sideways for today, expected to be within a range of 0.5985/0.6040.”
Next 1-3 weeks: “There is not much to add to our update from yesterday (14 Sep, spot at 0.6005). As indicated, while further NZD weakness is likely, any decline is likely to be at a slower pace. Supports are at 0.6975 and 0.6945. On the upside, a break of 0.6100 (no change in ‘strong resistance’ level from yesterday) would indicate that the weakness in NZD has stabilized.”
-
06:32
USD/JPY Price Analysis: Bulls proceed on the bumpy road to 145.00
- USD/JPY renews intraday high inside a weekly bullish triangle.
- 10-SMA, 144.10-20 restricts immediate upside ahead of double tops near 145.00.
- 50-SMA, weekly low act as additional downside filters.
USD/JPY takes the bids to refresh daily tops near 143.55 heading into Thursday’s European session. In doing so, the yen pair reverses the previous day’s pullback inside a one-week-old triangle formation.
Given the impending bull cross of the MACD and the quote’s sustained trading beyond the 50-SMA, the USD/JPY prices are likely to remain firmer.
However, the 10-SMA and a weekly horizontal resistance area, respectively near 143.60 and 144.10-20, could challenge the yen pair’s intraday upside.
Following that, the double tops around the 145.00 threshold will gain the market’s attention before the 61.8% Fibonacci Expansion (FE) of August 30 to September 09 moves, near 145.80.
In a case where the USD/JPY prices remain firmer past 145.80, the 146.00 round figure may test the bulls before directing them to the theoretical target of the double top breakout, close to 148.50.
Meanwhile, 50-SMA and the stated triangle’s support line, near 142.90 and 142.00 in that order, restrict the short-term downside of the pair.
Even if the USD/JPY prices decline below 142.00, the weekly low near 141.65 could act as the additional downside filter.
USD/JPY: Four-hour chart
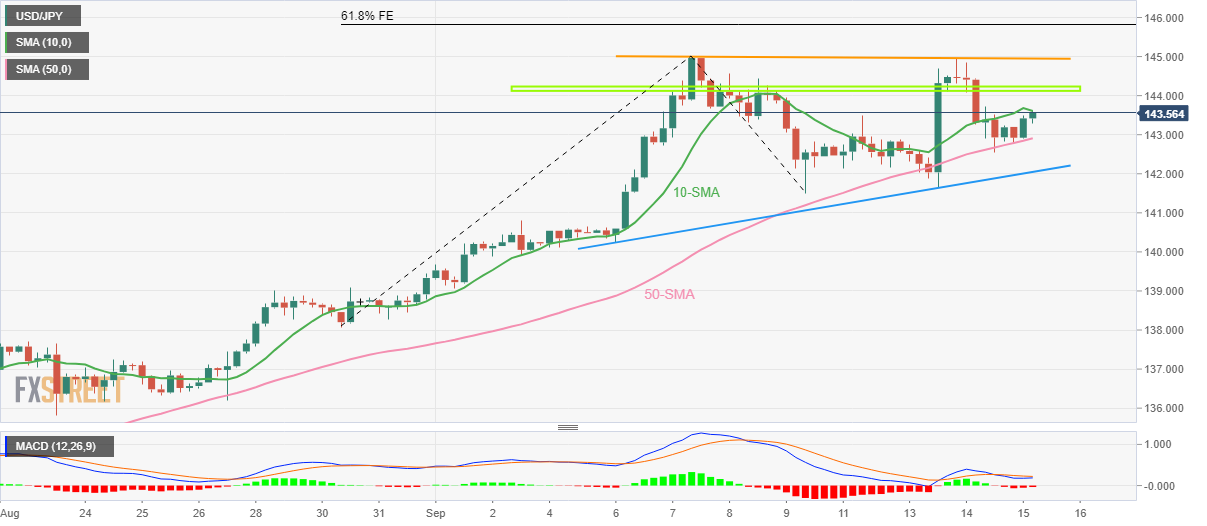
Trend: Further upside expected
-
06:30
Crude Oil Futures: Further strength on the cards
Considering preliminary readings from CME Group for crude oil futures markets, traders added just 189 contracts to their open interest, reaching the third consecutive daily build. In the same line, volume went up for the second session in a row, this time by around 25.2K contracts.
WTI remains capped by the 200-day SMA
Wednesday’s gains in prices of the WTI were accompanied by increasing open interest and volume and are supportive of extra upside in the very near term. In the meantime, the key 200-day SMA, today at $97.02, continues to cap occasional bullish attempts.
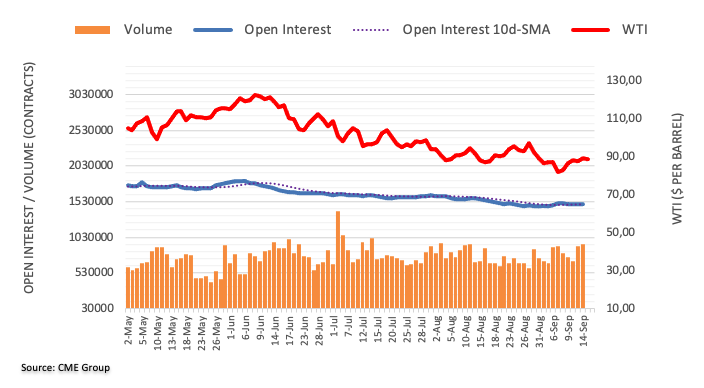
-
06:22
Japan’s opposition leader calls for more fiscal stimulus, not rate hike to cope with weak yen
In an interview with Reuters, Yuichiro Tamaki, the head of Japan’s Democratic Party for the People suggested that the government needs to roll out more fiscal stimulus instead of hiking policy rates to stem the recent rapid depreciation of the yen.
Key quotes
"The dollar is gaining against all the currencies. Even if the Bank of Japan raises rates, it wouldn't stop the yen weakening but rather hurt Japan's economy.”
"We must mobilize fiscal spending steadily to strengthen the economy.”
“The BOJ should add nominal wage growth of 2% to its 2% inflation target stipulated in a joint accord between the government and the BOJ issued in 2013.”
"We need to plainly explain to the public which indicator should be used for the 2% target.”
Related reads
- LDP’s Katayama: Japan lacks effective means to combat yen's sharp falls
-
06:21
GBP/USD: Shrinking bets for a breach of 1.1400 – UOB
FX Strategists at UOB Group Lee Sue Ann and Quek Ser Leang note GBP/USD is unlikely to break below the 1.1400 level in the near term.
Key Quotes
24-hour view: “We highlighted yesterday that GBP ‘could drop to 1.1465 first before stabilizing’. Our expectations did not materialize as GBP dropped to 1.1480 before rebounding quickly to 1.1589. The price actions appear to be part of a consolidation and GBP is expected to trade sideways for today, albeit likely within a higher range of 1.1500/1.1600.”
Next 1-3 weeks: “We continue to hold the same view as from yesterday (14 Sep, spot at 1.1510). As highlighted, GBP is likely to stay under pressure for now but at this stage, the chance for GBP to break the major support at 1.1400 is not high. On a shorter-term note, 1.1450 is already quite a solid support. On the upside, a breach of 1.1630 (no change in ‘strong resistance’ level from yesterday) would indicate that the current downward pressure has eased.”
-
06:16
Gold Futures: Door open to further decline
Open interest in gold futures markets remained choppy and went up by around 1.7K contracts on Wednesday according to advanced prints from CME Group. Volume, instead, resumed the downtrend and shrank by around 71.2K contracts.
Gold risks a break below $1,680
Gold prices extended the weekly leg lower on Wednesday amidst increasing open interest, opening the door at the same time to the continuation of the downtrend and another visit to the 2022 low at $1,680 per ounce troy (July 21).
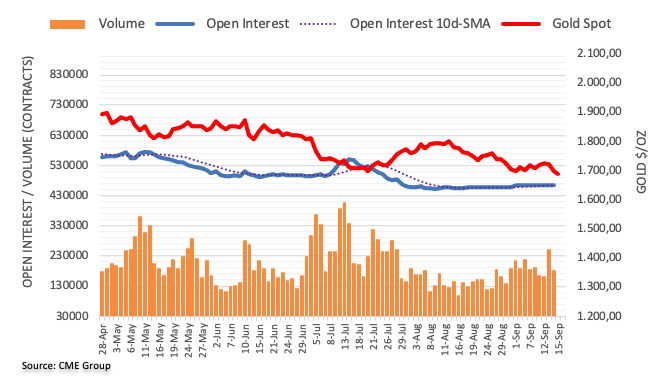
-
06:08
Steel prices extend recovery as supply squeezes in Europe, China announces more stimulus
- Steel prices have recovered sharply as prospects are indicating a decline in steel supply from Eurozone.
- The PBOC will provide 200 billion yuan to commercial banks to boost loans to companies.
- The dual support of stimulus packages and lower PLR will accelerate infrastructure spending.
Steel prices have widened their recovery after remaining in the negative trajectory for a major time period this year. The metal is gaining strength as escalating supply worries from the Eurozone is trimming the demand-supply divergence.
Energy prices are soaring like there is no tomorrow in the old continent after Russia cut off the gas supply from its main Nord Stream 1 pipeline under the Baltic Sea in response to western sanctions. This has forced the steel mill owners to shut down their smelters as rising production costs have demolished the profit margin structure. The companies are failing to achieve the break-even level, which has forced them to halt their production processes.
Meanwhile, the largest consumer of steel, China has announced more stimulus packages to spurt the growth prospects. China’s State Council announced that the People’s Bank of China (PBOC) will provide more than 200 billion yuan ($28.7 billion) in special lending funds to commercial banks to boost loans to companies, Xinhua News Agency reported.
Also, the People's Bank of China (PBOC) is looking to cut their Prime Lending Rates (PLR) further to deploy more liquidity into the economy. The dual support of stimulus packages and lower PLR will accelerate spending on inflation, construction, and expansion of production capacities. It will boost the demand for steel and other base metals due to their immense requirement to cater to manufacturing and production activities.
-
06:06
Asian Stock Market: Mixed concerns over China, Fed tests bulls
- Asia-Pacific equities trade mixed as traders struggle to ignore recession fears, hawkish Fed bets amid stimulus hopes.
- China eyes biggest stimulus to overcome worst economic hardships than 2020, PBOC keeps rates unchanged.
- Data from Australia came in mixed, New Zealand Q2 GDP rose past expectations.
- Risk profile remains sluggish ahead of US Retail Sales.
Asian shares remain directionless as hopes of China stimulus jostle with the economic pessimism and the Fed’s aggression during early Thursday morning in Europe.
While portraying the mood, the MSCI’s Index of Asia-Pacific shares outside Japan prints mild losses after bouncing off the yearly low whereas Japan’s Nikkei 225 rise 0.30% intraday at the latest. It’s worth noting that downbeat prints of Australia’s jobs report for August failed to impress the Aussie equity traders as the ASX 200 printed only mild gains by the press time.
Alternatively, strong prints of New Zealand’s (NZ) second quarter (Q2) Gross Domestic Product (GDP), grew 1.7% QoQ compared to 1.0% market expectations and a prior contraction of 0.2%, seem to weigh on the shares from Auckland. With this, NZX 50 drops nearly 0.60% intraday at the latest.
Above all, China’s 200 billion yuan offer for stimulus contrasts with the People’s Bank of China’s (PBOC) mixed moves to challenge stocks in Beijing. On the same line could be the hawkish Fed bets and the firmer US Treasury yields.
Elsewhere, Indonesia’s equity benchmark IDX Composite Index rises 1.17% intraday by the press time.
On a broader front, US President Joe Biden’s rejection of US fears and China’s stimulus are some of the key developments that should have favored the risk appetite. However, the Sino-American tussles and the energy crisis in Europe seemed to have challenged the optimism. It’s worth noting that the looming labor strike in the US appears an extra burden on the risk appetite.
It should be observed that the previous day’s downbeat US data failed to tame the hawkish Fed bets. The US Producer Price Index (PPI) flashed softer readings in August. US PPI declined to 8.7% YoY in August from 9.8% in July, versus 8.8% market forecasts. Details suggest that the PPI ex Food & Energy, better known as Core PPI, also eased to 7.3% YoY from 7.6% but surpassed the market expectation of 7.1%. Even so, the 75% chance of the Fed’s 75 basis points (bps) rate hike in the next week, as well as the 30% odds favoring the full 100 bps Fed rate lift, as per the CME’s FedWatch Tool, portray the market’s risk-aversion.
Against this backdrop, the S&P 500 Futures print mild gains around 3,670 whereas the US 10-year Treasury yields remain directionless near 3.416%.
Looking forward, the US Retail Sales for August, expected to remain unchanged at 0.0% MoM, will be important for fresh impulse.
Also read: US Retail Sales Preview: Can consumers keep up with inflation? A breather could weigh on the dollar
-
06:00
EUR/USD remains under pressure and focused on 0.9900 – UOB
EUR/USD risks further decline near term, although a sustained drop below 0.9900 appears out of favour according to FX Strategists at UOB Group Lee Sue Ann and Quek Ser Leang.
Key Quotes
24-hour view: “Yesterday, we held the view that ‘the outsized decline in EUR has scope to dip below 0.9930 before stabilization is likely’. However, EUR did not dip below 0.9930 as it traded in a relatively quiet manner between 0.9954 and 1.0023 before closing little changed at 0.9977 (+0.07%). The movement is likely part of a consolidation phase and we expect EUR to trade sideways for today, likely between 0.9950 and 1.0020.”
Next 1-3 weeks: “Our update from yesterday (14 Sep, spot at 0.9980) still stands. As highlighted, the outsized drop on Tuesday appears to be overdone but there is room for EUR to weaken to 0.9900. At this stage, a sustained decline below this level appears unlikely. All in, as long as the ‘strong resistance’ at 1.0070 (no change in level from yesterday) is not breached, EUR is likely to stay under pressure.”
-
05:40
Japan Tertiary Industry Index (MoM) fell from previous -0.2% to -0.6% in July
-
05:36
USD/IDR Price News: Rupiah remains firmer below $15,000 on upbeat Indonesia trade data
- USD/IDR pokes intraday low after upbeat Indonesia trade numbers for August.
- Fears surrounding China, hawkish Fed bets challenge sellers amid dicey markets.
- US Retail Sales, risk catalysts eyed for fresh impulse.
USD/IDR drops for the second consecutive day, taking offers to renew intraday low near $14,883, on upbeat Indonesia trade data published during Thursday’s Asian session. In doing so, the Indonesia rupiah (IDR) pair ignores the US dollar’s recovery moves ahead of the key US Retail Sales.
Indonesia marked robust trade numbers for August as the headlines Trade Balance rose to $5.76B versus $4.09B market forecasts and $4.22B prior. Also, the Exports grew 30.15% and the Imports rose 32.81% compared to the expectations of 19.19% and 30.6% in that order.
It should be noted that the headlines from Bloomberg suggesting China’s readiness for the worst economic slowdown, dire than the one seen in 2020, failed to push back the USD/IDR bears. The reason could be linked to Beijing’s readiness for more stimulus, around 200 billion yuan as per the latest chatters.
Elsewhere, the US Dollar Index (DXY) reverses the previous day’s downbeat performance around 109.70 even as the US Producer Price Index (PPI) flashed softer readings in August. US PPI declined to 8.7% YoY in August from 9.8% in July, versus 8.8% market forecasts. Details suggest that the PPI ex Food & Energy, better known as Core PPI, also eased to 7.3% YoY from 7.6% but surpassed the market expectation of 7.1%. Even so, the 75% chance of the Fed’s 75 basis points (bps) rate hike in the next week, as well as the 25% odds favoring the full 100 bps Fed rate lift, as per the CME’s FedWatch Tool, favor the DXY bulls.
On a broader front, US President Joe Biden’s rejection of US fears and China’s stimulus are some of the key developments that should have favored the risk appetite. However, the Sino-American tussles and the energy crisis in Europe seemed to have challenged the optimism. It’s worth noting that the looming labor strike in the US appears an extra burden on the risk appetite.
Against this backdrop, the S&P 500 Futures print mild gains around 3,670 whereas the US 10-year Treasury yields remain directionless near 3.416%. Additionally, Indonesia’s equity benchmark IDX Composite Index rises 1.17% intraday by the press time.
Having witnessed the initial impact of Indonesia data, the USD/IDR may witness hardships in extending the latest downside ahead of the US Retail Sales for August, expected to remain unchanged at 0.0%.
Technical analysis
The rising wedge bearish chart pattern keeps USD/IDR bears hopeful unless the quote stays below the $14,975 hurdle. However, a clear downside break of the $14,830 becomes necessary for the bear’s conviction.
-
05:34
EUR/JPY Price Analysis: Correction towards 20-EMA at 141.00 looks certain
- The formation of selling tails at elevated levels has shifted the cross into a correction mode.
- The 20-EMA at 141.00 will act as a major cushion for the asset.
- Oscillation in a bullish range of 60.00-80.00 by the RSI (14) indicates that the upside bias is intact.
The EUR/JPY pair is facing barricades around 143.00 in the Tokyo session after a modest incline from 142.30. On Wednesday, the asset witnessed a steep fall after failing to sustain above the critical resistance of 144.23 despite making multiple attempts. Investors started pouring funds into the Japanese yen on expectation of an intervention in the Fx moves by the Bank of Japan (BOJ).
On a daily scale, the cross has slipped back below the critical resistance of 144.23 plotted horizontally from June 8. The attempts to establish above the aforementioned hurdle are visible. However, the formation of selling tails consecutively this week is indicating that the shared currency bulls have to wait for more for shifting into unchartered territory.
A failure in sustaining above the critical resistance has resulted in a correction, which will conclude after hitting the 20-period Exponential Moving Average (EMA) at 141.00.
Meanwhile, the Relative Strength Index (RSI) (14) is comfortably oscillating in a bullish range of 60.00-80.0, which indicates that an upside bias is intact.
A correction towards the 20-EMA at 141.00 will create a bargain buy for the market participants which will send the cross towards June 8 high at 144.23, followed by Monday’s high at 145.63.
Alternatively, a drop below August 31 low at 138.27 will drag the asset towards August 24 low 135.51 and August 2 low at 133.39.
EUR/JPY daily chart
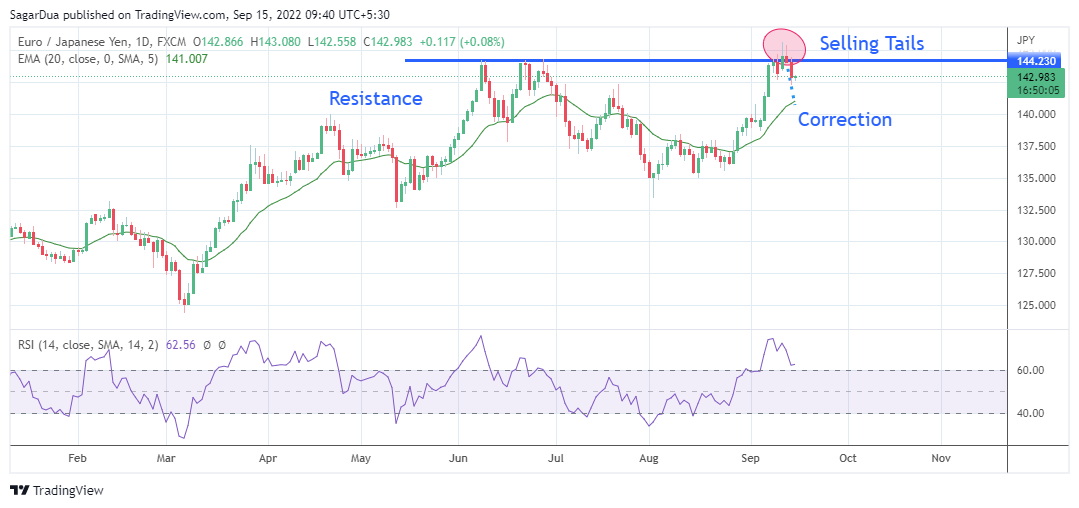
-
05:30
Netherlands, The Unemployment Rate s.a (3M) climbed from previous 3.6% to 3.8% in August
-
05:24
Indonesia Trade Balance above forecasts ($4.09B) in August: Actual ($5.76B)
-
05:24
Indonesia Imports came in at 32.81%, above expectations (30.6%) in August
-
05:23
South Korea Trade Balance fell from previous $-9.47B to $-9.49B in August
-
05:17
USD/CAD grinds higher past 1.3150 on mildly bid US dollar, softer oil, eyes on US Retail Sales
- USD/CAD picks up bids to reverse early Asian session losses around weekly top.
- Market’s anxiety joins hawkish Fed bets to underpin US dollar strength.
- Oil prices fail to justify supply crunch fears, IEA’s upbeat demand forecasts due to recession fears.
USD/CAD prints a three-day uptrend as it approaches the 1.3200 threshold, around 1.3170 during early Thursday morning in Europe. In doing so, the Loonie pair picks up bids to reverse the early Asian session losses while approaching the key resistance line.
The US dollar’s rebound and the downbeat prices of Canada’s main export item, WTI crude oil, could be linked to the quote’s latest strength. However, the market’s lack of interest ahead of the key US Retail Sales seemed to test the bullish moves.
That said, the US Dollar Index (DXY) reverses the previous day’s downbeat performance around 109.70 even as the US Producer Price Index (PPI) flashed softer readings in August. US PPI declined to 8.7% YoY in August from 9.8% in July, versus 8.8% market forecasts. Details suggest that the PPI ex Food & Energy, better known as Core PPI, also eased to 7.3% YoY from 7.6% but surpassed the market expectation of 7.1%.
Even so, the 75% chance of the Fed’s 75 basis points (bps) rate hike in the next week, as well as the 25% odds favoring the full 100 bps Fed rate lift, as per the CME’s FedWatch Tool, favor the DXY bulls.
On the same line could be US President Joe Biden’s rejection of US fears and China’s stimulus are some of the key developments that should have favored the risk appetite. However, the Sino-American tussles and the energy crisis in Europe seemed to have challenged the optimism. It’s worth noting that the looming labor strike in the US appears an extra burden on the risk appetite.
It should be noted that the WTI crude oil prices remain pressured at around $88.00 despite fears of a supply crunch in the US and upbeat demand forecasts from the International Energy Agency (IEA). The reason could be linked to the recession fears and higher inventory data from the Energy Information Administration (EIA).
Also read: US Retail Sales Preview: Can consumers keep up with inflation? A breather could weigh on the dollar
Amid these plays, the S&P 500 Futures print mild gains around 3,670 whereas the US 10-year Treasury yields remain directionless near 3.416%.
Moving on, a light calendar at home and sluggish prices of WTI crude oil highlight the US Retail Sales for August, expected to remain unchanged at 0.0%, as the main catalyst of the day. Should the data arrive as strong, the USD/CAD prices may pierce the key 1.3210 hurdle.
Technical analysis
A two-month-old resistance line, around 1.3210 by the press time, appears the key hurdle for the USD/CAD bulls to cross during further advances. Meanwhile, the pair buyers remain hopeful until staying beyond the 50-SMA on the four-hour chart and the 61.8% Fibonacci retracement level of the pair’s July-August downside, respectively near 1.3100 and 1.3030 in that order.
-
05:06
Indonesia Exports came in at 30.15%, above expectations (19.19%) in August
-
05:00
AUD/USD Price Analysis: Recovery approaches 0.6800 but bears remain hopeful
- AUD/USD picks up bids to extend the previous day’s rebound from two-month-old support.
- Impending bull cross on the MACD hints at further upside momentum.
- Monthly resistance line, 50-DMA restricts short-term advances, bears could aim for 0.6530 support confluence.
AUD/USD prints a two-day rebound from an upward sloping support line from July, grinding higher around 0.6760 during early Thursday morning in Europe.
The Aussie pair’s latest recovery also takes clues from the firmer MACD signals to keep buyers hopeful.
However, the 0.6800 threshold and the monthly descending resistance line near 0.6830 could challenge the AUD/USD bulls before directing them to the 50-DMA hurdle surrounding 0.6890.
Should the quote manages to stay firmer past the 50-DMA, the late August swing high near 0.7010 and the previous monthly peak of 0.7136 will gain the buyer’s attention.
On the contrary, pullback moves may have to conquer the aforementioned support line, as well as the yearly low, respectively around 0.6710 and 0.6680, to convince AUD/USD bears.
Following that, a south-run towards the four-month-old downward sloping support line and the 61.8% Fibonacci Expansion (FE) of April-August moves, near 0.6530, can’t be ruled out.
To sum up, AUD/USD is likely to witness short-term upside moves but the overall bearish trend remains intact.
AUD/USD: Daily chart
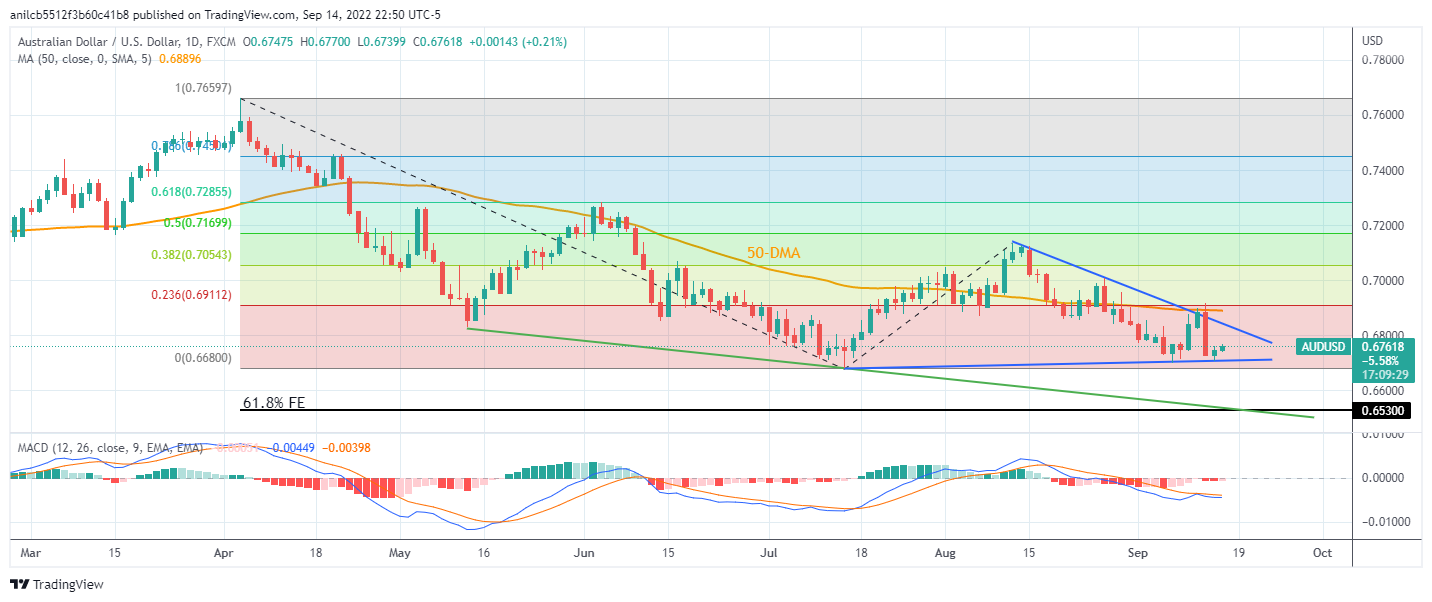
Trend: Limited recovery expected
-
04:57
EUR/USD sees a downside to near 0.9950 as DXY strengthens, US Retail Sales in focus
- EUR/USD is declining towards 0.9950 on soaring hawkish Fed bets.
- Stagnation in Retail Sales indicates a decline in consumers’ confidence in the economy.
- The odds of stagflation in the Eurozone have surged sharply.
The EUR/USD pair is dropping gradually after establishing below the magical figure of 1.0000 in the Asian session. The asset is expected to display more weakness and will slip to near 0.9950 as the US dollar index (DXY) is gaining strength. The DXY is aiming to recapture the psychological resistance of 110.00 as the odds of a full percent rate hike by the Federal Reserve (Fed) are skyrocketing.
After reading an above-expected US inflation rate this week, it is highly likely that the Fed will scale up the pace of hiking interest rates. Fed’s foremost priority is to bring price stability in the economy and for that growth prospects and employment have to make a lot of sacrifices. The market participants were expecting that falling gasoline prices and a spree of hiking interest rates will cool down the ultra-hot inflation, however, the price pressures have not responded well to the former.
In today’s session, investors will keep an eye on the US Retail Sales data. The catalyst is expected to remain subdued as estimates are displaying so improvement in the retail demand. A subdued retail demand is a sign of a decline in consumers’ confidence in the respective economy.
On the Eurozone front, chances of stagflation have increased in the trading bloc as cited by European Central Bank (ECB) member Robert Holzmann. The ECB member further added that the central bank has underestimated the pace of inflation and to scale down the same the ECB will announce more rate hikes this year. However, the extent of hikes will remain data-dependent.
-
04:19
Gold Price Forecast: XAU/USD declines towards $1,690 on hawkish Fed bets, US Retail Sales eyed
- Gold prices are declining sharply towards $1,690.00 as odds for a Fed’s full percent rate hike soar.
- The road to a neutral stance policy for the Fed is far from over.
- The preliminary estimates for the US Retail Sales are displaying stagnation.
Gold price (XAU/USD) has shifted into a negative trajectory as the asset has slipped below Wednesday’s low at $1,693.67. The precious metal is declining towards $1,690.00 as bears are taking charge of soaring odds for a bumper rate hike by the Federal Reserve (Fed) ahead.
Tuesday’s higher-than-expected release of the US Consumer Price Index (CPI) has faded the signs of exhaustion recorded earlier. Despite falling gasoline prices, the headline US CPI released higher at 8.3% than forecasts of 8.1%. The investing community believed that the inflation mess has started responding to rising interest rates by the Federal Reserve (Fed) and sooner a series of decline in price pressures will facilitate the fed to shift to a ‘neutral’ stance.
However, an above-expectations release of the US inflation has cleared that the road to neutral policy is too far from over. And, expectations of a full percent rate hike are trending now.
In today’s session, the release of the US Retail Sales will be of utmost importance. The forecasts for economic data are not revealing any improvement in retail demand. This may be a result of a decline in the confidence of consumers in the economy.
Gold technical analysis
The gold prices have witnessed a steep fall after displaying a textbook kind of test and drop of a consolidation breakdown. The consolidation formed in a range of $1,697.12-1,709.62 on an hourly scale. The yellow metal is trading below the 20-period Exponential Moving Average (EMA) at $1,698.70, which adds to the downside filters.
Also, the Relative Strength Index (RSI) has established in a bearish range of 20.00-40.00, which indicates more weakness ahead.
Gold hourly chart
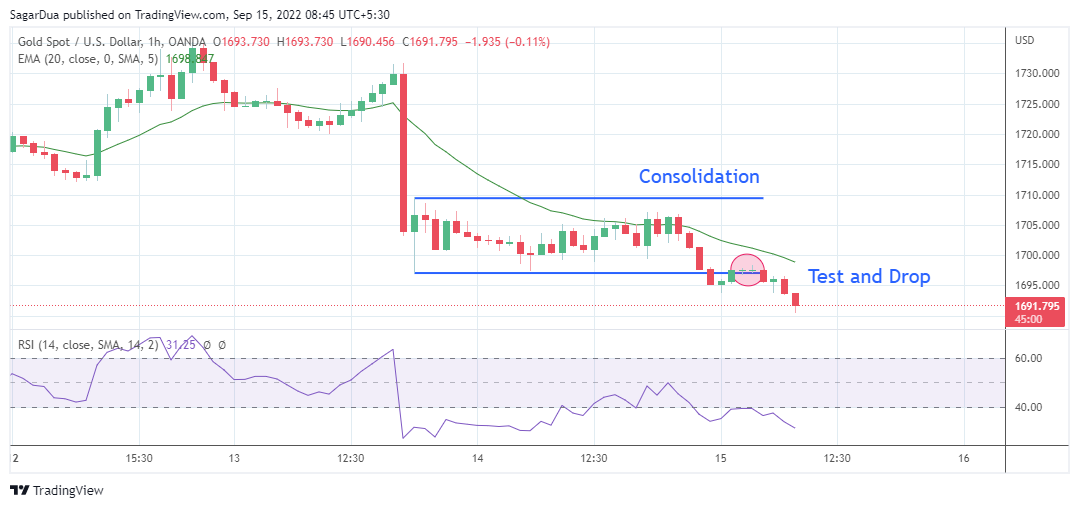
-
04:15
USD/KRW remains capped below 1,400 after S. Korean verbal intervention
South Korean Finance Minister Choo Kyung-ho said on Thursday that they “will take action on FXmarket if needed.”
He added that the government is “closely monitoring the market.”
South Korea is resorting to verbal intervention, adopting Japan’s apporach to stem the declines in their local currencies.
Market reaction
USD/KRW was last seen trading at 1,385.91, 0.31% higher on the day. South Korean officials are coming to the rescue of the won (KRW) as it slumps to the weakest level since March 2009 against the US dollar.
-
04:08
LDP’s Katayama: Japan lacks effective means to combat yen's sharp falls
Japan’s ruling Liberal Democratic Party (LDP) official Satsuki Katayama said on Thursday that the Japanese authorities lack “effective means to combat yen's sharp falls.”
He said that “conducting solo fx intervention likely won't be that effective in stemming sharp yen falls.”
Market reaction
USD/jPY is unperturbed by the latest comments from the Japanese official, as it is keeping its range around 143.40, adding 0.16% on the day.
-
03:57
GBP/USD retreats towards 1.1500 as UK politics, Brexit test buyers, focus on US Retail Sales
- GBP/USD fades the previous day’s corrective bounce off weekly low, takes the offers of late.
- Deadline to trigger Article 16, uncertainty over UK energy bill aide test buyers.
- Easy inflation in the US, Britain failed to impress bears the previous day.
- US Retail Sales, chatters over Fed’s next move will be important for fresh impulse.
GBP/USD remains pressured towards 1.1500 during early Thursday morning in Europe, reversing the previous day’s rebound, as global markets remain dicey ahead of the US data. Also exerting downside pressure on the Cable pair could be the pessimism surrounding the British politics and Brexit updates, not to forget the previous day’s downbeat UK/US inflation data.
UK Prime Minister (PM) Liz Truss has a hard time convincing British locals that the government’s relief on energy bills will take effect from the October start. The doubts over UK PM Truss’ ability to convince Northern Ireland Premier Micheal Martin during his visit to London, for Queen’s funeral, also weigh on the GBP/USD prices. Furthermore, a lack of response from London to the European Union (EU) despite approaching the date to trigger Article 16 relating to Brexit exerts additional downside pressure on the quote.
On Wednesday, the UK’s Food price inflation increased for the 13th consecutive month to 1.5% MoM, the biggest monthly jump since 1995. However, the headline Consumer Price Index (CPI) declined to 9.9% YoY versus 10.2% market forecasts and 10.1% previous readings. Further, the Retail Price Index also eased, reprinting 12.3% YoY figures versus 12.4% expected.
In the case of the US, the Producer Price Index (PPI) declined to 8.7% YoY in August from 9.8% in July, versus 8.8% in market forecasts. Details suggest that the PPI ex Food & Energy, better known as Core PPI, also eased to 7.3% YoY from 7.6% but surpassed the market expectation of 7.1%. Even so, the 75% chance of the Fed’s 75 basis points (bps) rate hike in the next week, as well as the 25% odds favoring the full 100 bps Fed rate lift, as per the CME’s FedWatch Tool, favor the GBP/USD bears.
It should be noted that US President Joe Biden’s rejection of US fears and China’s stimulus are some of the key developments that should have favored the risk appetite. However, the Sino-American tussles and the energy crisis in Europe seemed to have challenged the optimism. Additionally, the looming labor strike in the US appears an extra burden on the risk appetite.
Ami these plays, the S&P 500 Futures print mild gains around 3,670 whereas the US 10-year Treasury yields remain directionless near 3.416%.
Looking forward, the US Retail Sales for August, expected to remain unchanged at 0.0%, will be important for the GBP/USD traders to watch for intraday directions amid a lack of data/events from the UK. However, major attention will be given to the next week’s Fed meeting. Overall, the bears are likely to keep reins.
Also read: US Retail Sales Preview: Can consumers keep up with inflation? A breather could weigh on the dollar
Technical analysis
Despite the Cable pair’s repeated bounce off the 1.1490-85 support area, the buyers remain alert unless the quote crosses the 21-DMA hurdle surrounding 1.1650.
-
03:57
PBOC will provide CNY200B loan support for investment – Xinhua
Following a meeting on Tuesday, China’s State Council announced that the People’s Bank of China (PBOC) will provide more than 200 billion yuan ($28.7 billion) in special lending funds to commercial banks to boost loans to companies, Xinhua News Agency reported.
more to come ...
-
03:30
Commodities. Daily history for Wednesday, September 14, 2022
Raw materials Closed Change, % Silver 19.628 1.7 Gold 1696.95 -0.24 Palladium 2162.23 3.43 -
03:28
USD/JPY regains 143.00 amid sluggish yields, Japan’s record deficit, US Retail Sales eyed
- USD/JPY picks up bids to reverse the previous day’s losses amid an inactive session.
- Japan reports record trade deficit in August, Foreign Investments in Japan Stocks improved.
- Policymakers resist accepting market calls for BOJ intervention, yields remain sidelined despite hawkish Fed bets.
USD/JPY picks up bids to refresh intraday high around 143.35 during Thursday’s Asian session. In doing so, the yen pair portrays the market’s rush towards the US dollar amid a lack of clarity and before the key US Retail Sales data for August. With this, the quote ignores the bond market's inaction.
It should be noted that the mixed bunch of Japanese data also challenges the USD/JPY but keeps the buyers hopeful. “Japan ran its biggest single-month trade deficit on record in August as imports surged on high energy costs and a slump in the yen, exposing the economy's vulnerability to external price pressures,” mentioned Reuters. As per the news, Japan’s trade gap marked the 13th consecutive month of year-on-year shortfalls and was bigger than the 2.3982 trillion yen deficit expected in a Reuters poll. Alternatively, Foreign Investments in Japan Stocks improved to ¥-609.7B from revised up prior figures of ¥-703.7B.
The reason could also be linked to the Japanese policymakers’ rejection that the government and the Bank of Japan (BOJ) intervened to defend the national currency the previous day. Also keeping the USD/JPY buyers hopeful are the mixed bunch of catalysts that together suggest a lack of optimism.
US President Joe Biden’s rejection of US fears and China’s stimulus are some of the key developments that should have favored the risk appetite. However, the Sino-American tussles and the energy crisis in Europe seemed to have challenged the optimism. It’s worth noting that the looming labor strike in the US appears an extra burden on the risk appetite.
On the same line, the 75% chance of the Fed’s 75 basis points (bps) rate hike in the next week, as well as the 25% odds favoring the full 100 bps Fed rate lift, as per the CME’s FedWatch Tool, favor the DXY bulls.
Talking about the data, US Producer Price Index (PPI) declined to 8.7% YoY in August from 9.8% in July, versus 8.8% market forecasts. Details suggest that the PPI ex Food & Energy, better known as Core PPI, also eased to 7.3% YoY from 7.6% but surpassed the market expectation of 7.1%.
While portraying the mood, the S&P 500 Futures print mild gains around 3,670 whereas the US 10-year Treasury yields remain directionless near 3.416%.
Moving on, talks surrounding Japan’s market intervention and yields will be important ahead of the US Retail Sales for August, expected to remain unchanged at 0.0%.
Technical analysis
USD/JPY marks another rebound from the 10-DMA, around 142.75 by the press time, which in turn joins firmer RSI and the bullish MACD signals to keep buyers hopeful of refreshing the multi-year high marked in September, close to 145.00.
-
03:06
AUD/NZD Price Analysis: Stays on the way to 1.1255-60 key hurdle
- AUD/NZD defends the previous day’s bounce off 21-SMA, picks up bids of late.
- Firmer RSI, sustained trading beyond the key SMA, trend lines favor buyers.
- Triple tops around 1.1255-60 appear tough nuts to crack for bulls.
- Bears need validation from 200-SMA, monthly support line.
AUD/NZD picks up bids to reverse the early Asian session losses near 1.1240 on Thursday. The cross-currency pair’s latest moves ignore the mixed Aussie data, as well as strong New Zealand GDP numbers, while directing buyers towards the three-week-old horizontal hurdle.
Australia’s Employment Change rose to 33.5K, versus 35K expected and -40.9K prior during August. Further, the Unemployment Rate also rose beyond 3.4% market consensus and the previous readings to 3.5% whereas the Participation Rate matched 66.6% forecasts versus 66.4% prior. Earlier in the day, Australia’s Consumer Inflation Expectations softened to 5.4% for September versus 6.7% expected and 5.9% prior.
Earlier in the day, New Zealand’s (NZ) second quarter (Q2) Gross Domestic Product (GDP) grew 1.7% QoQ compared to 1.0% market expectations and a prior contraction of 0.2%, per the latest report from Statistics New Zealand. The YoY figures came in as 0.4% versus 0.2% expected and 1.2% previous readouts.
That said, the upward sloping RSI (14) joins the AUD/NZD pair’s successful rebound from the 21-SMA, and teases another battle with the all-important 1.1255-60 horizontal resistance area. Following that, tops marked during October 2017 around 1.1290 could test the bulls.
Meanwhile, pullback moves need a clear downside break of the 21-SMA support, near 1.1215 by the press time, to convince sellers.
Even so, an upward sloping support line from August 17 and the 200-SMA, respectively near 1.1150 and 1.1130, could challenge the AUD/NZD bears.
AUD/NZD: Four-hour chart
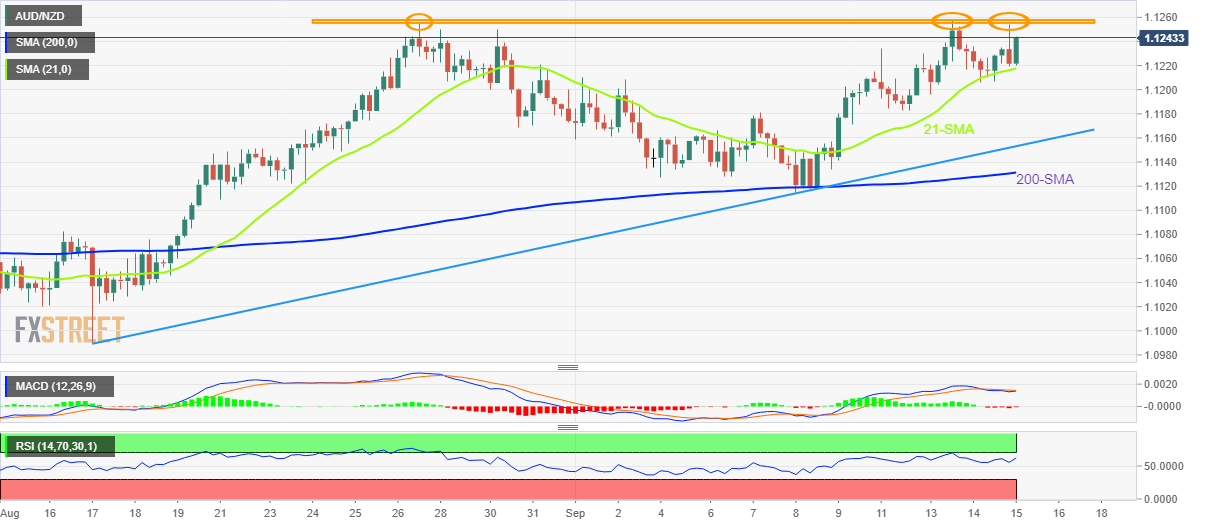
Trend: Further upside expected
-
03:01
China braces for a slowdown that could be even worse than 2020 – Bloomberg survey
According to the latest survey conducted by Bloomberg, China’s economy is likely to expand by 3.5% this year, way below the official target of around 5.5%.
Key takeaways
“It’s not just China’s strict Covid Zero policy of lockdowns and mass testing that’s buffeting the economy. A housing market collapse, drought, and weak demand both at home and overseas have all undercut growth.”
“China’s recovery likely stalled in August, hit by heatwaves, power shortages and Covid-19 flare-ups -- on top of a property slump. Leading indicators signal weakening momentum from output to consumption.”
Related reads
- PBOC conducts CNY400 billion via one-year MLF at 2.75%
- China rolls out property policies across nation to fix slump – Bloomberg
-
02:44
AUD/USD defies downside bias and advances towards 0.6770 on subdued Aussie job data
- AUD/USD is marching towards 0.6780 despite slightly lower-than-expected Aussie payroll data.
- The Australian economy has generated 33.5k jobs vs. the estimates of 35k.
- Aussie jobless rate has increased to 3.5% vs. expectations and prior release of 3.4%.
The AUD/USD pair as the Australian Employment Change has remained slightly lower than expectations. The economic data has landed at 33.5k vs. the expectations of 35k and the layoff of 40.9k employees reported in the July report. While the Unemployment Rate has increased to 3.5% against the forecast and the prior release of 3.4%.
A subdued Aussie employment data is not going to delight the Reserve Bank of Australia (RBA). The RBA won’t be able to hike rates without hesitation. It is worth noting that the RBA has already stepped up its Official Cash Rate (OCR) to 2.35%. RBA Governor Philip Lowe is bound to raise borrowing rates further to justify their foremost priority of containing the inflation mess. Also, the guidance provided earlier, citing 3.85% as a current target for interest rates to combat the soaring price rise index will continuously trim liquidity from the economy.
Meanwhile, the US dollar index (DXY) has returned to the bullish territory after a lackluster performance. The DXY is aiming to recapture the psychological resistance of 110.00 ahead of the US Retail Sales data. As per the preliminary estimates, the economic data has not shown any growth in retail demand. A stagnancy in consumers’ demand will haunt the Federal Reserve (Fed) but be a sign of decline in the confidence of the consumers in the economy.
Meanwhile, a resurgence in odds of a full percent rate hike by the Fed has shifted the spotlight to the DXY. Higher-than-expected headline inflation data despite a significant decline in gasoline prices has created havoc for Fed policymakers. The Fed will continue announcing restrictive policies till it finds a decline in the inflation rate for a decent period.
-
02:44
AUD/JPY fades corrective bounce near 96.50 on mixed Aussie inflation, employment data
- AUD/JPY retreats towards intraday low after downbeat statistics from Australia.
- Australia Employment Change came in below forecast, Unemployment Rate rose in August.
- US 10-year Treasury yields remain sluggish after refreshing three-month high.
- Risk catalysts, BOJ intervention chatters are in focus ahead of Friday’s speech from RBA’s Lowe.
AUD/JPY eases to 96.55, reversing the early Asian session rebound from the weekly low, after mixed data from Australia. Also weighing on the pair could be the market’s cautious sentiment and sluggish yields.
Australia’s Employment Change rose to 33.5K, versus 35K expected and -40.9K prior during August. Further, the Unemployment Rate also rose beyond 3.4% market consensus and the previous readings to 3.5% whereas the Participation Rate matched 66.6% forecasts versus 66.4% prior. Earlier in the day, Australia’s Consumer Inflation Expectations softened to 5.4% for September versus 6.7% expected and 5.9% prior. Given the mostly downbeat data, as well as the Reserve Bank of Australia’s (RBA) hesitance to sound hawkish, the AUD/JPY prices eased following the data.
Also read: Breaking: Aussie employment data misses the mark and is weighing on AUD/USD
On a different page, the People’s Bank of China’s (PBOC) medium-term lending facility (MLF) action should have favored the AUD/JPY buyers but the absence of rate move seemed to have kept the bear’s on the desk.
It’s worth noting that the market’s cautious mood amid chatters of the Bank of Japan’s (BOJ) intervention and sluggish yields, in addition to the hawkish bets on the Fed and the ECB, seems to exert downside pressure on the risk barometer pair. That said, the US 10-year Treasury yields remain directionless near 3.416%.
Elsewhere, US President Joe Biden’s rejection of US fears and China’s stimulus are some of the key developments that should have favored the risk appetite. However, the Sino-American tussles and the energy crisis in Europe seemed to have challenged the optimism. It’s worth noting that the looming labor strike in the US appears an extra burden on the risk appetite.
On Wednesday, Japanese Finance Minister Shunich Suzuki stated that If Tokyo were to intervene, it will do so swiftly, without pause. Also, the country’s Economy Minister Yamagiwa said he doesn't think it is a matter he should answer when asked whether BOJ conducted rate checks in the FX market.
Moving on, talks over the BOJ intervention and the risk catalysts will be important ahead of the RBA Governor Philip Lowe’s speech, up for publishing on Friday.
Technical analysis
The first daily closing below the 10-DMA in a month, around 96.80 by the press time, directs AUD/JPY towards the key support line from early August, at 96.10 as we write.
-
02:34
Breaking: Aussie employment data misses the mark and is weighing on AUD/USD
Australia has released the employment report for August where markets were looking for a 35k change as the headline and a 3.4% Unemployment Rate.
It arrived as follows:
Australia Aug employment +33.5k s/adj (Reuters poll: +35.0k).
Australia Aug unemployment rate +3.5 pct, s/adj (Reuters poll: +3.4).
Australia Aug full-time employment +58.8k s/adj.
Australia Aug participation rate +66.6 pct, s/adj (Reuters poll: +66.6 pct).AUD has dipped around 17 pips to 0.6740 but has almost recovered the drop back to 0.6752.
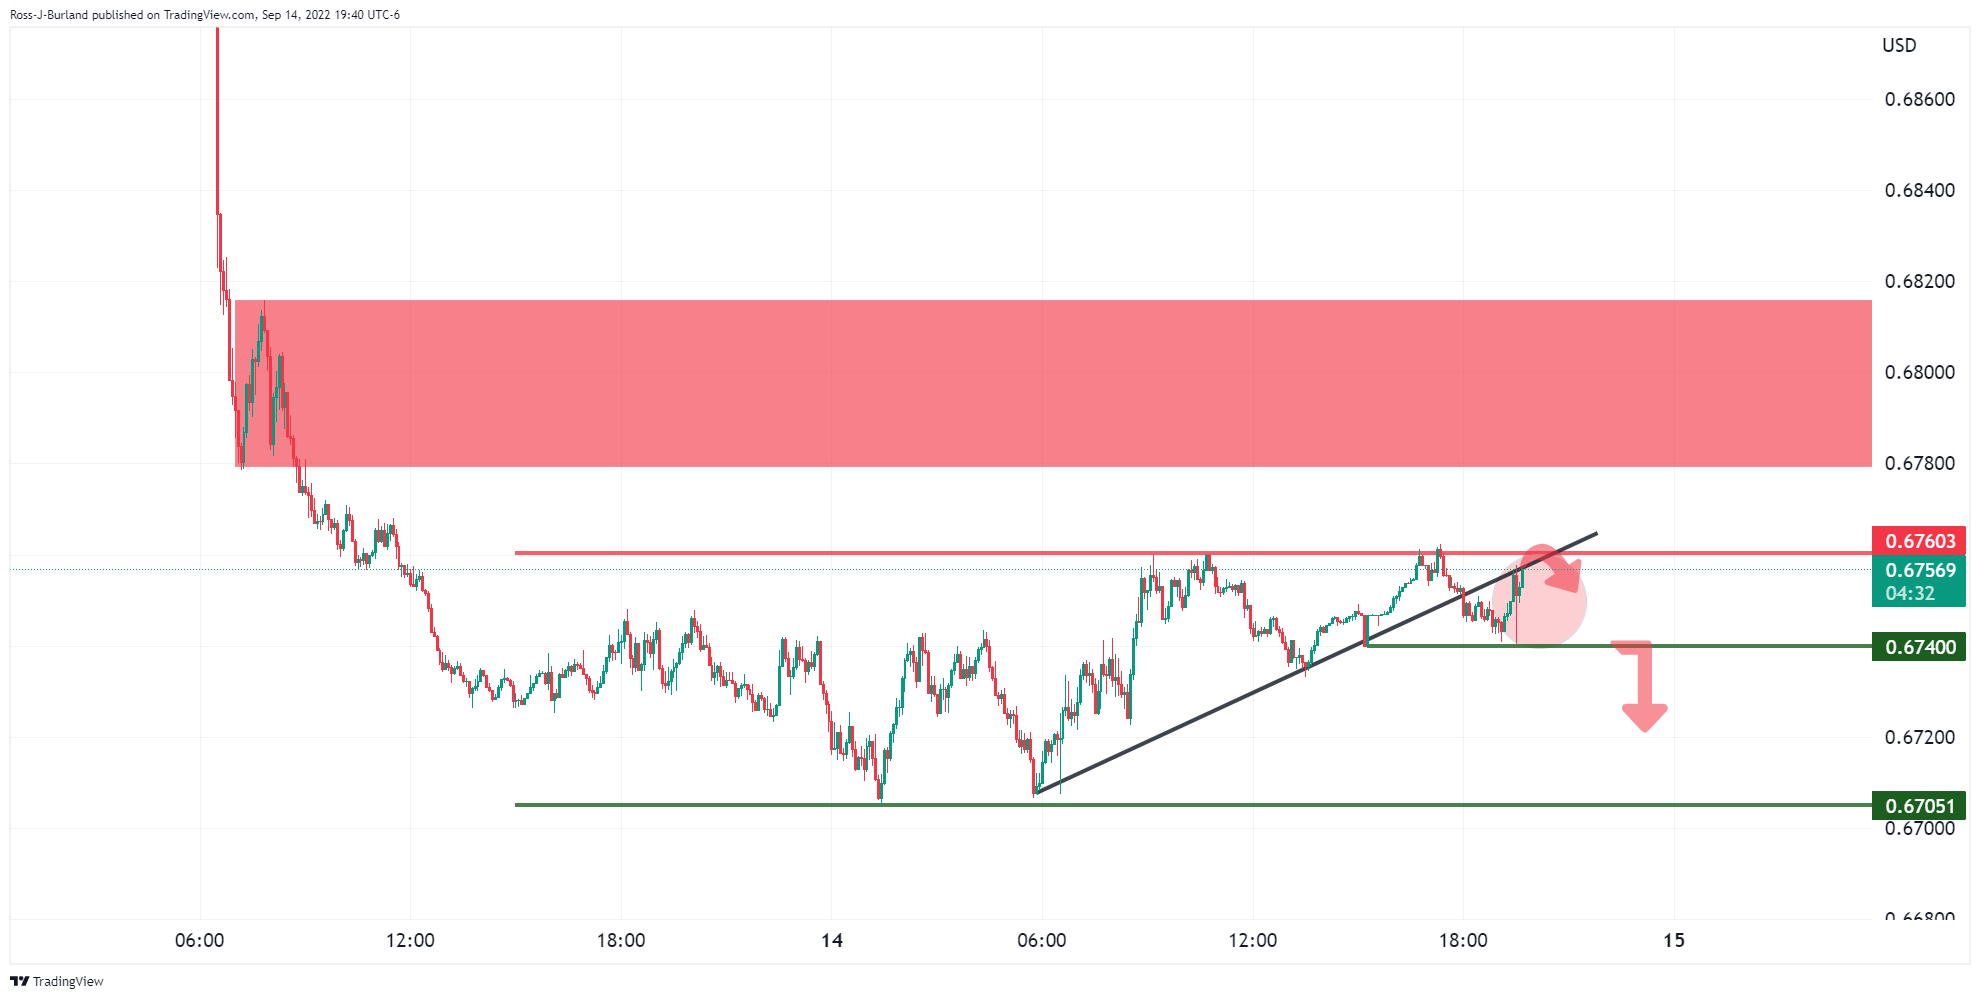
On the 5-minute chart, the price has run into the key structure of the sideways channel and accumulation of the US dollar's rally. If the price breaks this structure, 0.6740, considering the move below the trendline support, the prospects will be for a move towards a test of 0.67 the figure again.
About the Unemployment Rate
The Unemployment Rate released by the Australian Bureau of Statistics is the number of unemployed workers divided by the total civilian labour force. If the rate hikes, it indicates a lack of expansion within the Australian labour market. As a result, a rise leads to a weakening of the Australian economy. A decrease in the figure is seen as positive (or bullish) for the AUD, while an increase is seen as negative (or bearish).
-
02:32
Australia Part-Time Employment down to -25.3K in August from previous 46K
-
02:31
Australia Employment Change s.a. came in at 33.5K, below expectations (35K) in August
-
02:31
Australia Full-Time Employment rose from previous -86.9K to 58.8K in August
-
02:31
PBOC conducts CNY400 billion via one-year MLF at 2.75%
The People’s Bank of China (PBOC) injected CNY400 billion via one-year medium-term lending (MLF) facility on Thursday.
The Chinese central bank kept the rate for one-year MLF operation rate unchanged at 2.75%, as widely expected. The PBOC maintained the status quo after slashing rates in August.
The PBOC sold two billion yuan via 7-day reverse repos at 2.00% vs. 2.10% prior.
Market reaction
USD/CNY picked up fresh bid on the latest PBOC operation. The spot is currently trading at 6.9647, adding 0.05% on the day.
Meanwhile, the AUD/USD pair is hovering around 0.6750, as investors assess the latest Australian jobs data for fresh cues on the RBA’s next policy move. The pair is up 0.06% so far.
-
02:30
Australia Unemployment Rate s.a. above forecasts (3.4%) in August: Actual (3.5%)
-
02:30
Australia Participation Rate in line with expectations (66.6%) in August
-
02:26
US Dollar Index rebounds towards 110.00 with eyes on US Retail Sales
- US Dollar Index picks up bids to reverse the previous day’s pullback.
- Fears of supply disruptions in the US, hawkish Fed bets underpin bullish bias amid a light session.
- Easy inflation, stimulus hopes and inactive yields favor bears amid cautious optimism.
- US Retail Sales will be important to forecast next week’s FOMC action.
US Dollar Index (DXY) picks up bids to pare the previous day’s losses around 109.70 during Thursday’s Asian session. In doing so, the greenback’s gauge justifies the market’s cautious sentiment and a sluggish session while ignoring inactive yields.
That said, the DXY seems to cheer the hawkish Fed bets and fears surrounding supply-chain disruptions in the US, as well as the EU energy crisis, while recalling the buyers. It should be noted that the previous day’s softer US data appeared to have exerted downside pressure on the US Dollar Index.
News suggesting hardships for the US oil supplies in the Northeast, due to labor problems, Seems to challenge the market sentiment and underpin the US dollar’s safe-haven demand. "Some trains carrying fuel components to the U.S. Northeast have been halted in preparation for a possible railroad shutdown in the coming days, two sources familiar with the situation said on Wednesday," stated Reuters.
On the same line, the 75% chance of the Fed’s 75 basis points (bps) rate hike in the next week, as well as the 25% odds favoring the full 100 bps Fed rate lift, as per the CME’s FedWatch Tool, favor the DXY bulls.
Furthermore, US President Joe Biden’s rejection of US fears and China’s stimulus are some of the key developments that should have favored the risk appetite and weighed on the DXY. However, the Sino-American tussles and the energy crisis in Europe seemed to have challenged the optimism.
Talking about the data, US Producer Price Index (PPI) declined to 8.7% YoY in August from 9.8% in July, versus 8.8% market forecasts. Details suggest that the PPI ex Food & Energy, better known as Core PPI, also eased to 7.3% YoY from 7.6% but surpassed the market expectation of 7.1%.
Amid these plays, the S&P 500 Futures print mild gains around 3,670 whereas the US 10-year Treasury yields remain directionless near 3.416%.
Looking forward, the US Retail Sales for August, expected to remain unchanged at 0.0%, will be important to watch for clear intraday directions. Also important will be the market bets on the Fed’s next moves. If the actual release appears stronger than expected, the DXY may witness further upside.
Technical analysis
A one-week-old descending resistance line near 109.90 precedes the 110.25 horizontal hurdle to restrict short-term DXY up-moves. Alternatively, the 50-day EMA surrounding 107.75 challenges the bears. Overall, US Dollar Index is on the bull’s radar and is ready to refresh the multi-year high.
-
02:18
USD/CNY fix: 6.9101 vs. last close 6.9630
In recent trade today, the People’s Bank of China (PBOC) set the yuan (CNY) at 6.9101 vs. the last close of 6.9630.
About the fix
China maintains strict control of the yuan’s rate on the mainland.
The onshore yuan (CNY) differs from the offshore one (CNH) in trading restrictions, this last one is not as tightly controlled.
Each morning, the People’s Bank of China (PBOC) sets a so-called daily midpoint fix, based on the yuan’s previous day's closing level and quotations taken from the inter-bank dealer.
-
02:04
EUR/USD Price Analysis: Decline below 61.8% Fibo at around 1.0000 secures a contra bet
- Downside momentum loss on the broader picture still favors the domination of Eurozone bulls.
- The asset has slipped below the 61.8% Fibo retracement at 0.9994.
- Auction below 20-EMA adds to the downside filters.
The EUR/USD pair has dropped to near Wednesday’s low around 0.9969 in the Asian session. The asset has picked offers after a downside break of the consolidation formed in a narrow range of 0.9980-0.9984.
On a four-hour scale, the asset witnessed a strong rebound after displaying downside momentum loss at around September 6 low of 0.9864. The momentum oscillator, Relative Strength Index (RSI) (14) made a higher low while the asset displayed a lower low.
A recovery in the asset was followed by a sheer retracement, which has dragged the asset below 61.8% Fibo area. The marking of the retracement tool from September 6 low at 0.9864 to Monday’s high at 1.0198 displayed the placement of 61.8% Fibo retracement at 0.9994.
The asset has dropped below the 20-period Exponential Moving Average (EMA) at 1.0022, which adds to the downside filters.
Investors should be aware of the fact that retracement has been observed after a Bullish Divergence. A few times retracement gets more steeped due to sour market sentiment. However, the smart money structure is indicating a buy signal above the 20-EMA, which will send the pair towards a 38.2% retracement at 1.0070, followed by Monday’s high at 1.0198.
On the flip side, a break below Wednesday’s low at 0.9955 will drag the asset towards the round-level support of 0.9900, followed by a 19-year low at 0.9864.
EUR/USD four-hour chart
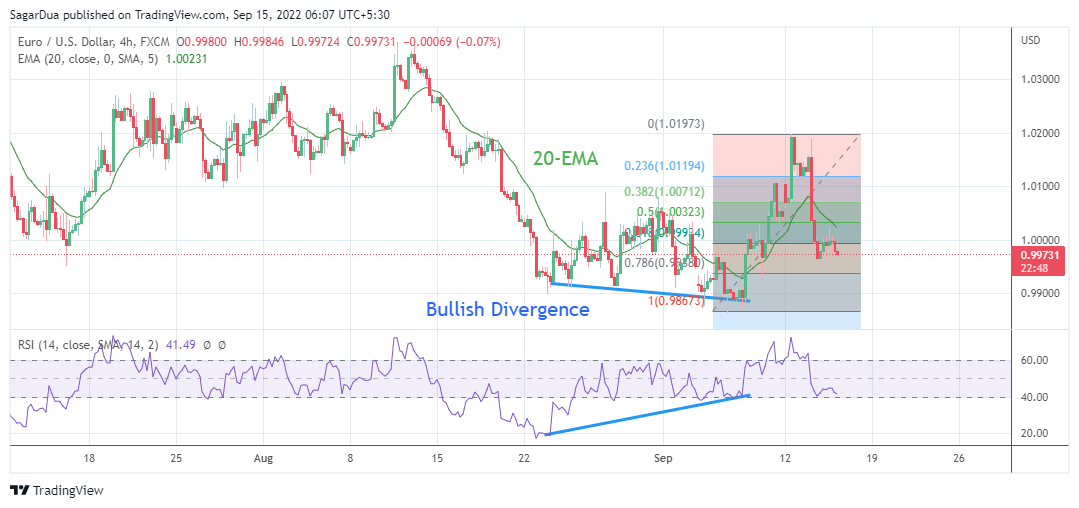
-
02:03
Australia Consumer Inflation Expectations came in at 5.4% below forecasts (6.7%) in September
-
02:01
WTI retreats towards $88.00 amid sluggish markets, US data, EU energy crisis in focus
- WTI pulls back from the weekly top, takes offers to refresh intraday low.
- IEA forecast, softer US dollar and EU’s energy plan favored oil buyers previously.
- Anxiety ahead of US Retail Sales, hawkish Fed bets challenge commodity buyers.
WTI crude oil prices return to the bear’s radar, after refreshing the weekly top the previous day, amid the sluggish Asian session on Thursday. That said, the black gold declines to $88.32 while refreshing the intraday low.
The energy benchmark’s latest weakness could be linked to the market’s inaction, as well as the downbeat inventory data from the official source, namely the US Energy Information Administration (EIA). That said, the EIA Crude Oil Stocks Change rose to 2.442M for the week ended on September 09, versus 0.8333M market forecasts and 8.844M previous readings.
While portraying the mood, the S&P 500 Futures print mild gains around 3,670 whereas the US 10-year Treasury yields remain directionless near 3.416%.
US President Joe Biden’s rejection of US fears and China’s stimulus are some of the key developments that should have favored the risk appetite. However, the Sino-American tussles and the energy crisis in Europe seemed to have challenged the optimism. It’s worth noting that the looming labor strike in the US appears an extra burden on the risk appetite.
It's worth noting that the news suggesting hardships for the US oil supplies in the Northeast, due to labor problems, should also challenge the oil prices. " Some trains carrying fuel components to the U.S. Northeast have been halted in preparation for a possible railroad shutdown in the coming days, two sources familiar with the situation said on Wednesday," stated Reuters.
“Global oil demand growth will rebound strongly next year as China eases COVID lockdowns, the International Energy Agency (IEA) said on Wednesday, adding that an economic slowdown will pause growth only briefly at the end of this year,” reported Reuters. The news seemed to have recalled the oil buyers initially. On the same line could be the European Union’s (EU) energy plan that teases Russia to increase hardships for the blocs to gain gas/oil supplies. the European Commission announced on Wednesday that it proposed a voluntary target for European Union countries to cut overall monthly electricity use by 10% compared to the same period in recent years, as reported by Reuters. “EU proposes windfall levy to claw back surplus profits from fossil fuel companies,” the news also mentioned.
Moving on, headlines surrounding the EU energy crisis and the US Retail Sales, expected to remain unchanged at 0.0% on MoM, could entertain the oil traders.
Technical analysis
WTI crude oil prices remain sidelined between the 21-DMA and a one-week-old support line, respectively near $89.10 and $87.15. Given the bearish RSI divergence on the daily chart, crude oil prices are likely to decline further.
-
01:49
NZD/USD Price Analysis: Bulls struggle to get through critical resistance
- NZD/USD bulls are attempting a move into the 50% mean reversion of the sell-off.
- Bears are lurking and there is a case for both sides of the market.
As per the prior analysis, NZD/USD Price Analysis: Bulls eye a move to the 38.2% Fibo and beyond, the pair was destined for a move deeper into the sell-off and has been testing the vicinity of the 50% mean reversion as follows:
NZD/USD prior analysis, H1 chart
It was explained that the downside has been decelerating, correcting into what could become resistance:
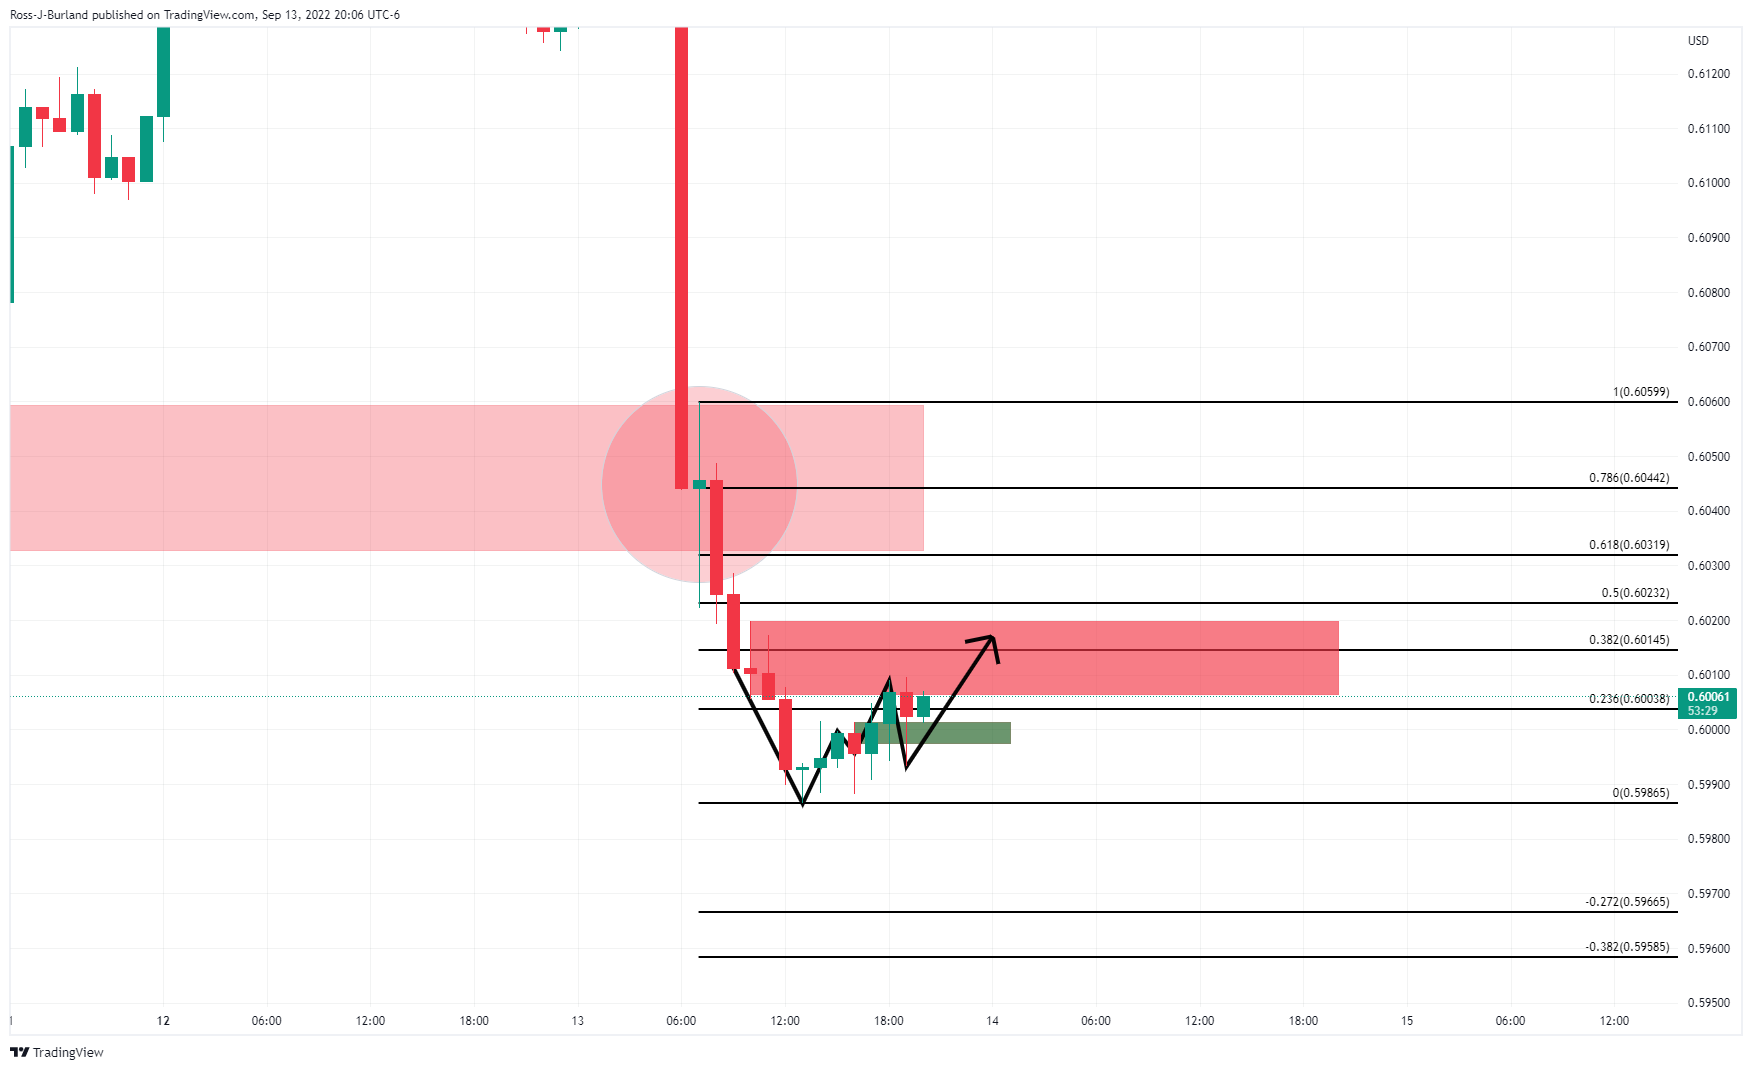
The W-formation's support was cited as a key feature, but this gave way as the US dollar continue its reign for a little while longer before the bulls threw in the towel:
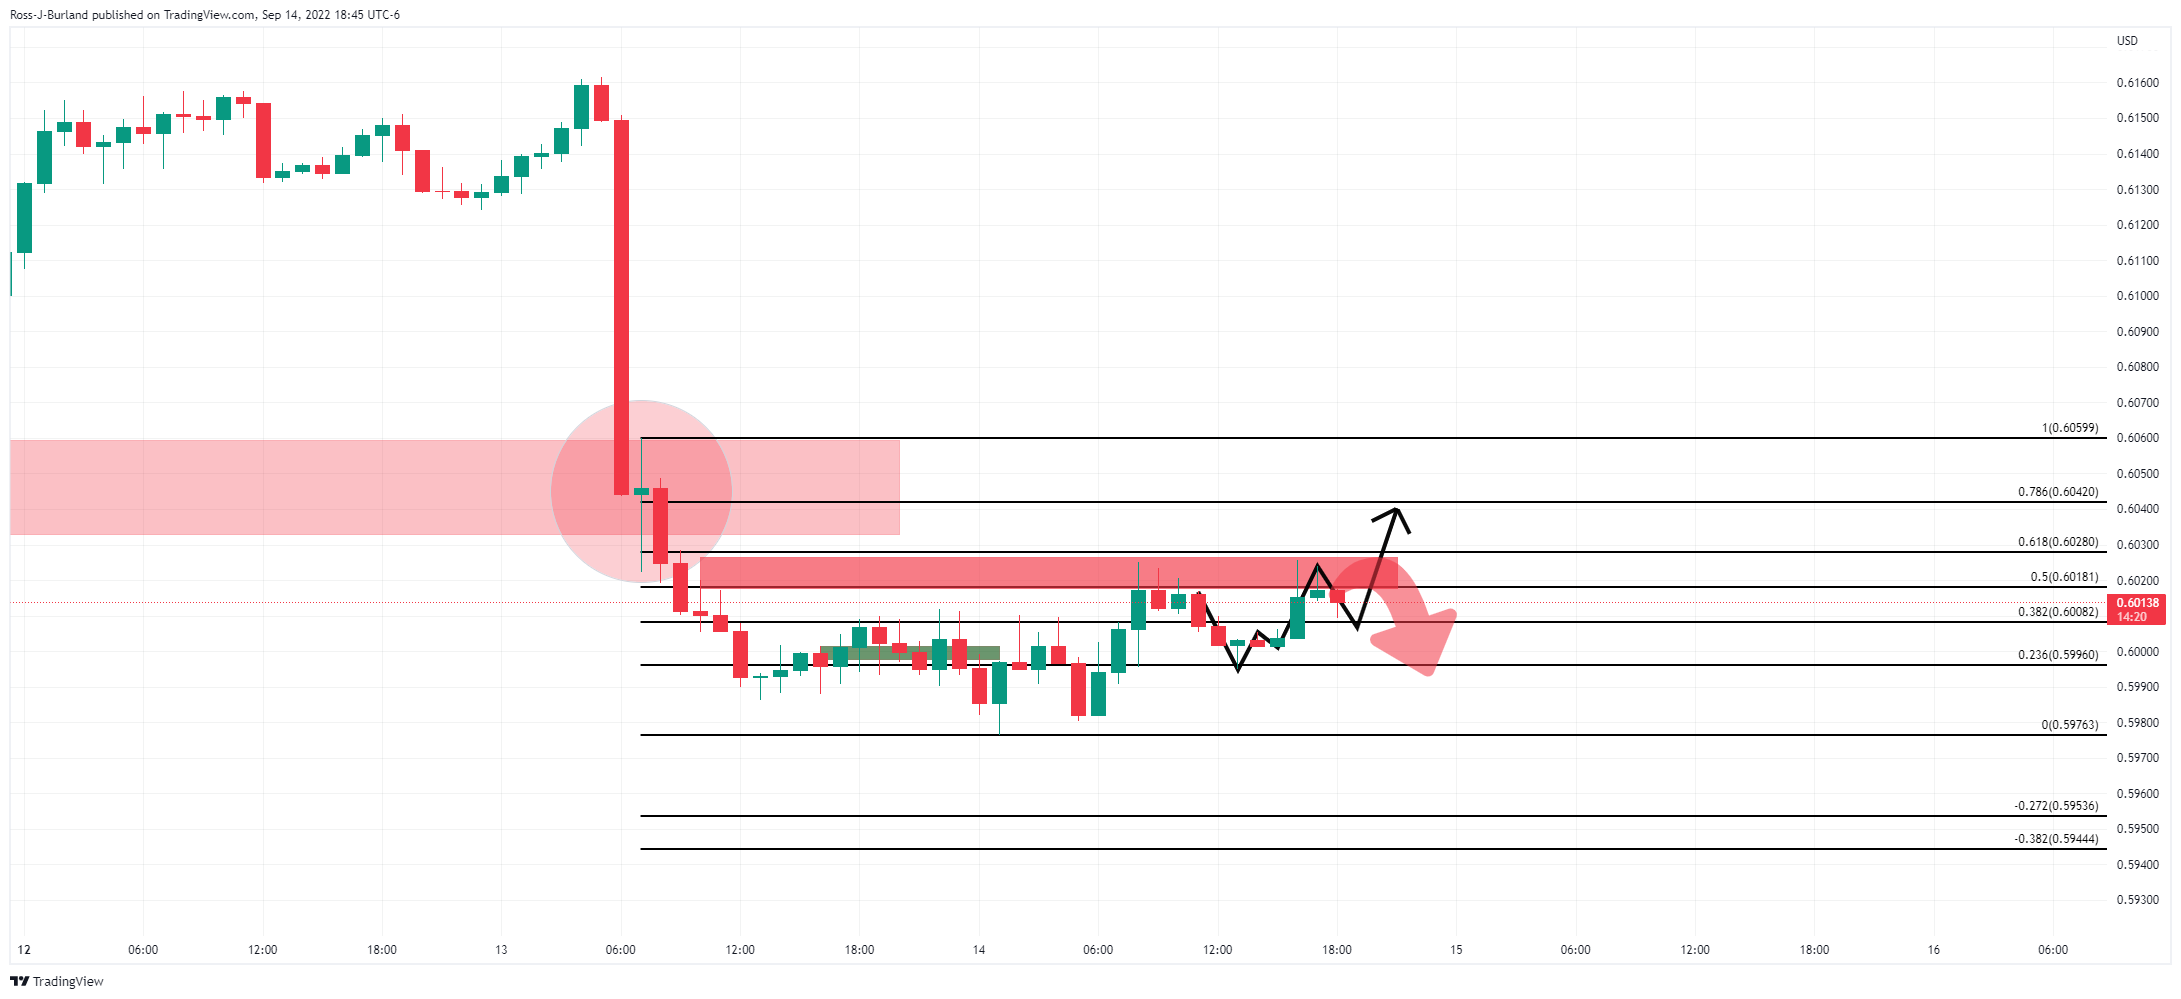
However, the bulls committed and headed into the structure and resistance near the 38.2% Fibonacci level ahead of a 50% retracement thereafter.
This is a level that meets the bounce halfway through the sell-off (the green candle) where the 78.6% Fibonacci meets where prices were agreed, so this would be expected to act as the firmest of the resistances. If it holds, the price could be sold off heavily in the near term, but if it breaks, a deeper correction will be on the cards for the days ahead.
-
01:32
When is the Australian employment report and how could it affect AUD/USD?
August month employment statistics from the Australian Bureau of Statistics, up for publishing at 01:30 GMT on Thursday, will be the immediate catalyst for the AUD/USD pair traders.
Market consensus suggests that the headline Unemployment Rate may remain unchanged at 3.4% on a seasonally adjusted basis whereas Employment Change could reverse the previous contraction of 40.9K with the addition of 35K. Further, the Participation Rate is also expected to improve to 66.6% versus 66.4% prior.
Considering the Reserve Bank of Australia’s (RBA) recently cautious comments, coupled with the trouble in China, today’s Aussie jobs report become crucial as the AUD/USD remains near the yearly bottom.
In addition to the employment data, the quarterly release of the RBA Bulletin will also be released around 01:30 AM GMT and hence warrants extra cautiousness from the AUD/USD traders.
Ahead of the event, analysts at Westpac said,
Given the recent bout of illness leave, holidays and weather events, Westpac anticipates employment to rebound strongly in August, lifting by 110k (market f/c: 35k). Therefore, a strong lift in participation should see the unemployment rate hold steady at 3.4%.
How could the data affect AUD/USD?
Ahead of the data, AUD/USD remains directionless around 0.6750, fading the previous day’s rebound from a one-week low. In doing so, the Aussie pair portrays the pre-data anxiety. Also likely to have restricted the pair’s moves could be the mixed concerns over China and the cautious mood ahead of the US Retail Sales.
That said, hopes of an upbeat Aussie jobs report could propel the AUD/USD to be fewer amid the broad pessimism surrounding economic slowdown and 75 bps Fed rate hike in September, not to forget doubts over the RBA’s next move. However, strong prints of the Employment Change and softer Unemployment Rate won’t go unnoticed and hence can provide a knee-jerk upside to the quote.
Considering this, FXStreet’s Dhwani Mehta says
Should the employment data surprise to the downside once again, it will squash hopes for a 50 bps October rate hike by the RBA. In such as case, AUD/USD could revisit July lows sub-0.6700. A big beat on all labor market indicators is needed to rescue AUD bulls, which could fuel a fresh upswing in the pair towards a critical resistance at around 0.6850.
Technically, a two-month-old ascending support line, at 0.6700 by the press time, precedes the yearly low of 0.6680 to restrict the short-term downside of the AUD/USD pair. The recovery moves, however, need validation from the monthly resistance line and the 50-DMA, respectively near 0.6850 and 0.6890 in that order. Overall, AUD/USD is likely to hold lower grounds but could remain range bound.
Key Notes
AUD/USD steadies around 0.6750 ahead of Aussie employment data, US Retail Sales
Australian Employment Preview: Will labor market upturn save the aussie?
About the Employment Change
The Employment Change released by the Australian Bureau of Statistics is a measure of the change in the number of employed people in Australia. Generally speaking, a rise in this indicator has positive implications for consumer spending which stimulates economic growth. Therefore, a high reading is seen as positive (or bullish) for the AUD, while a low reading is seen as negative (or bearish).
About the Unemployment Rate
The Unemployment Rate released by the Australian Bureau of Statistics is the number of unemployed workers divided by the total civilian labor force. If the rate hikes, indicates a lack of expansion within the Australian labor market. As a result, a rise leads to weaken the Australian economy. A decrease of the figure is seen as positive (or bullish) for the AUD, while an increase is seen as negative (or bearish).
-
01:30
Stocks. Daily history for Wednesday, September 14, 2022
Index Change, points Closed Change, % NIKKEI 225 -796.01 27818.62 -2.78 Hang Seng -479.76 18847.1 -2.48 KOSPI -38.12 2411.42 -1.56 ASX 200 -181.1 6828.6 -2.58 FTSE 100 -108.6 7277.3 -1.47 DAX -160.95 13028 -1.22 CAC 40 -23.28 6222.41 -0.37 Dow Jones 30.12 31135.09 0.1 S&P 500 13.32 3946.01 0.34 NASDAQ Composite 86.11 11719.68 0.74 -
01:19
GBP/JPY skids below 165.00 as BOJ warns intervention, UK Retail Sales eyed
- GBP/JPY has surrendered the critical support of 165.00 on potential BOJ intervention odds.
- Liz Truss’s stimulus packages will bring a rebound in the headline inflation rate.
- A vulnerable performance is expected from UK Retail Sales data.
The GBP/JPY pair has slipped below the critical support of 165.00 in the Asian session. The asset is declining strongly after surrendering the cushion of 166.00 on Wednesday. The cross has marked its auctioning territory in a 164.80-165.87 range and odds are favoring a downside break, which will drag it towards 164.00.
The pound bulls have failed to capitalize on the lower reading of the headline UK inflation data. The annual Consumer Price Index (CPI) landed at 9.9%, lower than the estimates of 10.2% and the prior release of 10.1%. Well, the inflation rate of 9.9% is still huge but back of the mind, it will delight with the fact that the economy is out of double-digit inflation rate despite soaring energy bills. However, the core CPI remained in line with the estimates at 6.3%.
It would be early to call it exhaustion in the price pressures as lower reading is not here to stay for longer. The announcement of stimulus packages by next UK Prime Minister Liz Truss to safeguard households from skyrocketing energy bills and to scale down the extent of tax brackets will keep the inflationary pressures on the elevated side.
On Friday, the UK Retail Sales data will hog the limelight. The economic data is expected to display a decline of 4.2% against a decline of 3.4% reported earlier on an annual basis. Also, the monthly figure will display a decline of 0.5% against a rise of 0.3% reported earlier.
Meanwhile, the yen bulls have been infused with fresh blood as the Bank of Japan (BOJ) has warned of intervention in the Fx moves to support the domestic currency. Nikkei reported o Thursday that the BOJ conducted a foreign exchange "check" to see what market participants view the JPY's valuation. According to the news outlet, this is a sign that the BOJ could be making preparations for an intervention in the market.
-
01:18
Gold Price Forecast: XAU/USD bears aim for $1,660 amid sluggish DXY ahead of US Retail Sales
- Gold price remains pressured towards short-term key support line.
- Market sentiment remains devided, favoring the US dollar’s safe-haven demand.
- Cautious mood ahead of important data/events restricts immediate moves.
- US Retail Sales, China inflation could entertain traders ahead of next week’s Fed meeting.
Gold price (XAU/USD) remains pressured at around $1,696, struggling to extend the two-day downtrend, as traders await key US data during Thursday’s Asian session. In addition to the wait for the macro, mixed concerns surrounding the key risk catalysts also seem to challenge the XAU/USD momentum traders.
That said, hawkish comments from the ECB policymakers jostled with the softer US inflation data to confuse the metal traders. On the same line could be China’s readiness for more stimulus and the Sino-American tussles. It should be noted that the Sino-American tension and the Ukraine-Russia war are extra filters to the XAU/USD moves. Above all, the market’s indecision ahead of the next week’s Federal Open Market Committee (FOMC) seems to restrict the gold price moves.
After marking a surprisingly easy US Consumer Price Index (CPI), US Producer Price Index (PPI) declined to 8.7% YoY in August from 9.8% in July, versus 8.8% market forecasts. Details suggest that the PPI ex Food & Energy, better known as Core PPI, also eased to 7.3% YoY from 7.6% but surpassed the market expectation of 7.1%.
On the other hand, Eurozone’s Industrial Production fell 2.3% MoM in July versus the 1.0% expected contraction.
Moving on, ECB policymaker Robert Holzmann has stated that the central bank's rates will be higher in a year but hikes will be data-dependent. Before that, ECB’s Constantinos Herodotou said, “ECB’s latest decision to hike the key rates does not mean there has been a forgone conclusion on the final level of interest rate.” Above all, ECB Chief Economist Philip Lane said on Wednesday that the current transition will require the ECB to continue to raise interest rates over the next several meetings, as reported by Reuters.
Elsewhere, the European Commission announced on Wednesday that it proposed a voluntary target for European Union countries to cut overall monthly electricity use by 10% compared to the same period in recent years, as reported by Reuters. “EU proposes windfall levy to claw back surplus profits from fossil fuel companies,” the news also mentioned.
Amid these plays, the Wall Street benchmarks printed mild gains while the Treasury yields retreated from the multi-day high, posting mild losses at the end.
Looking forward, the US Retail Sales for August, expected to remain unchanged at 0.0%, will be important to watch for clear intraday directions. Also important will be the market bets on the Fed’s next moves, especially after the recently mixed inflation data. It should be noted that the firmer US data may help the XAU/USD bears to keep reins.
Technical analysis
Bearish MACD signals join descending RSI (14), not oversold, to keep XAU/USD sellers hopeful of breaking an upward sloping support line from July 24, close to $1,690 by the press time.
Following that, the yearly low near $1,680 and the 61.8% Fibonacci Expansion of the metal’s moves between mid-August and September 13, around $1,660, will gain the gold bear’s attention.
It should be noted that the XAU/USD weakness past $1,660 may be challenged by the likely oversold RSI around then, if not then the metal’s slump towards the $1,600 threshold can’t be ruled out.
Alternatively, recovery moves may initially aim for the 100-SMA hurdle surrounding $1,721, a break of which could direct gold buyers towards the weekly peak near $1,735.
In a case where the XAU/USD price remains firmer past $1,735, the odds of witnessing a run-up towards the late August swing high near $1,765 can’t be ruled out.
Gold: Four-hour chat

Trend: Further weakness expected
-
01:15
Currencies. Daily history for Wednesday, September 14, 2022
Pare Closed Change, % AUDUSD 0.67468 0.28 EURJPY 142.861 -0.98 EURUSD 0.99798 0.18 GBPJPY 165.142 -0.71 GBPUSD 1.15388 0.46 NZDUSD 0.60039 0.18 USDCAD 1.31619 -0.13 USDCHF 0.96234 0.03 USDJPY 143.122 -1.17 -
01:02
USD/JPY Price Analysis: Bears about to pounce as US dollar meets 4-hour resistance
- USD/JPY bears could be about to make another move.
- The yen buying campaign could be underway.
As per the prior analysis, post US inflation data on Tuesday, USD/JPY pops back into intervention territory at a session high, the market has acted accordingly as follows:
USD/JPY, prior technical analysis
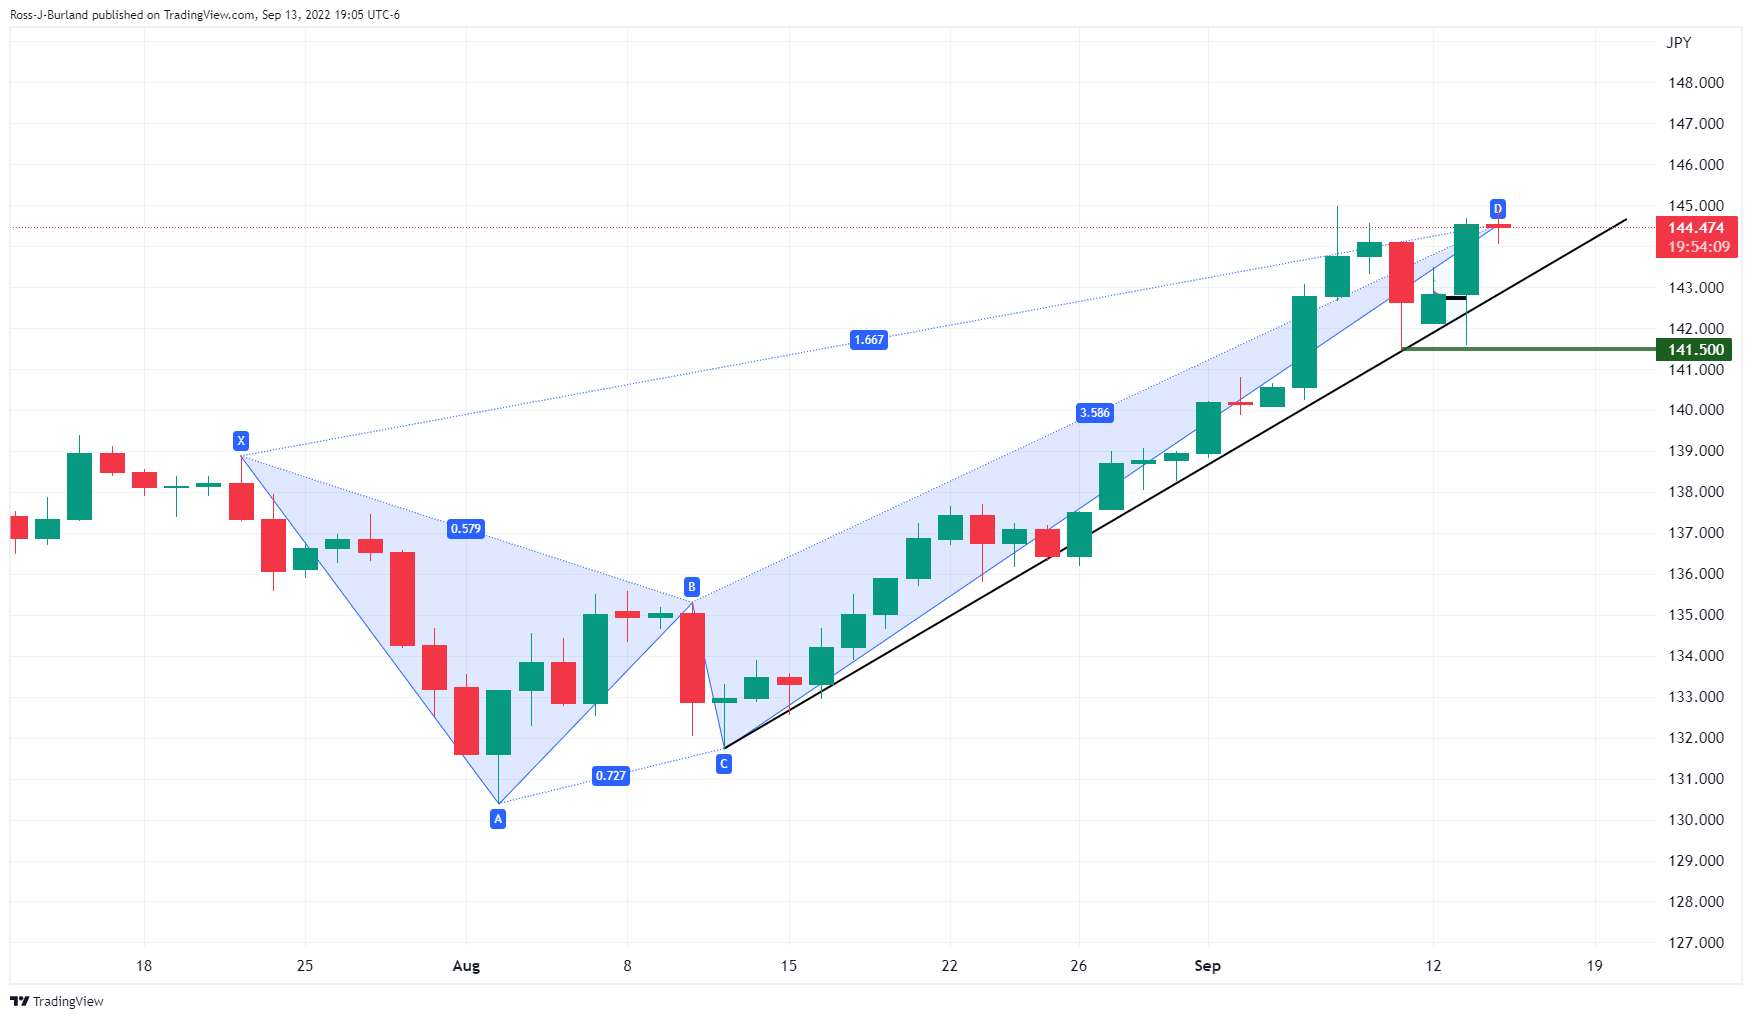
It was stated that the harmonic pattern was bearish n the daily chart.
A break of 141.50 will still be a key development in the days ahead, should that eventuate.
It also noted that the US dollar was on heat right now so attempting to pick a top would have been futile, but monitoring for a deceleration in the rally would go a long way in determining the trajectory for USD/JPY.
The verbal intervention of the Japanese officials sparked a bid in the yen and helped to see the harmonic pattern in the USD/JPY play out as follows:
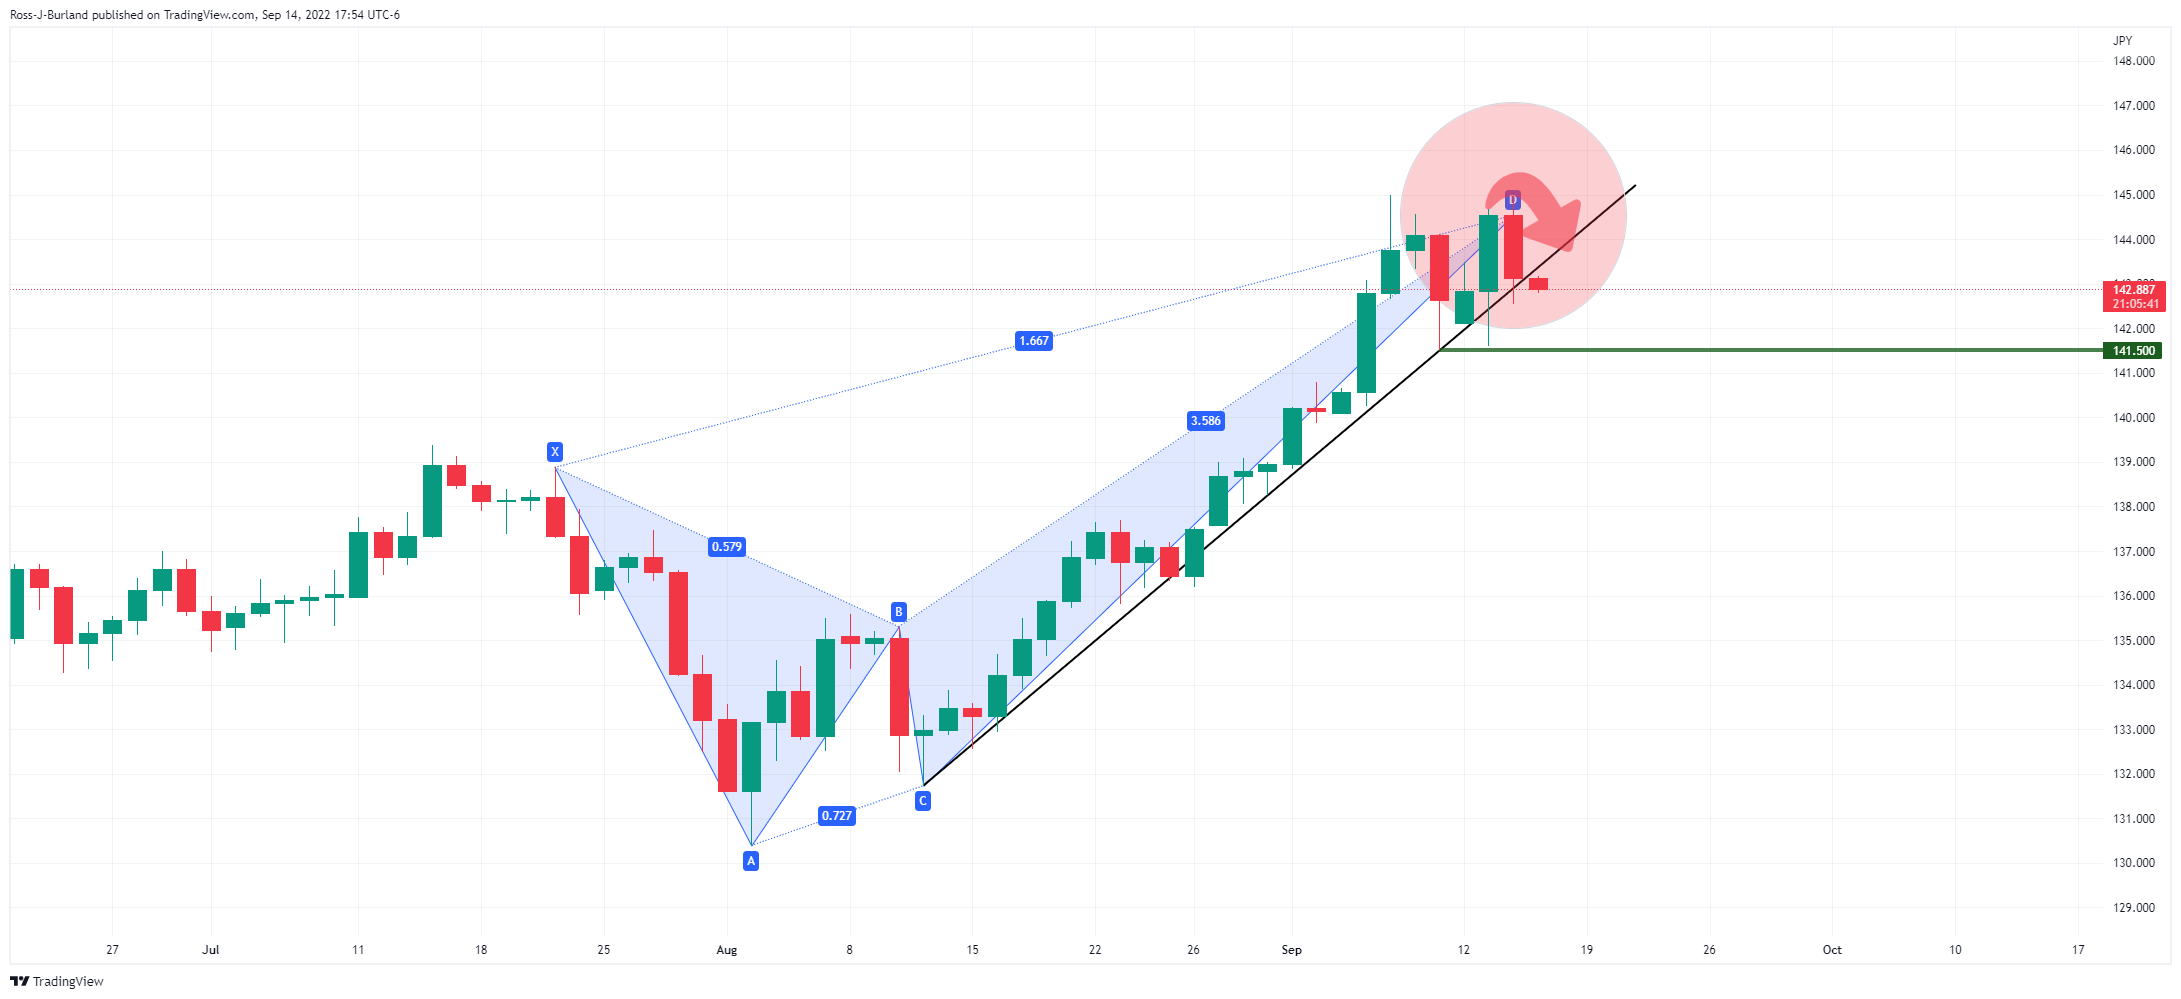
The price has pierced the trendline support, depending on where it is drawn, but in this case, the bears are taking on this trendline and there could be more in store for the days ahead.
As for the DXY, the price analysis from yesterday was as follows:
DXY H4 chart
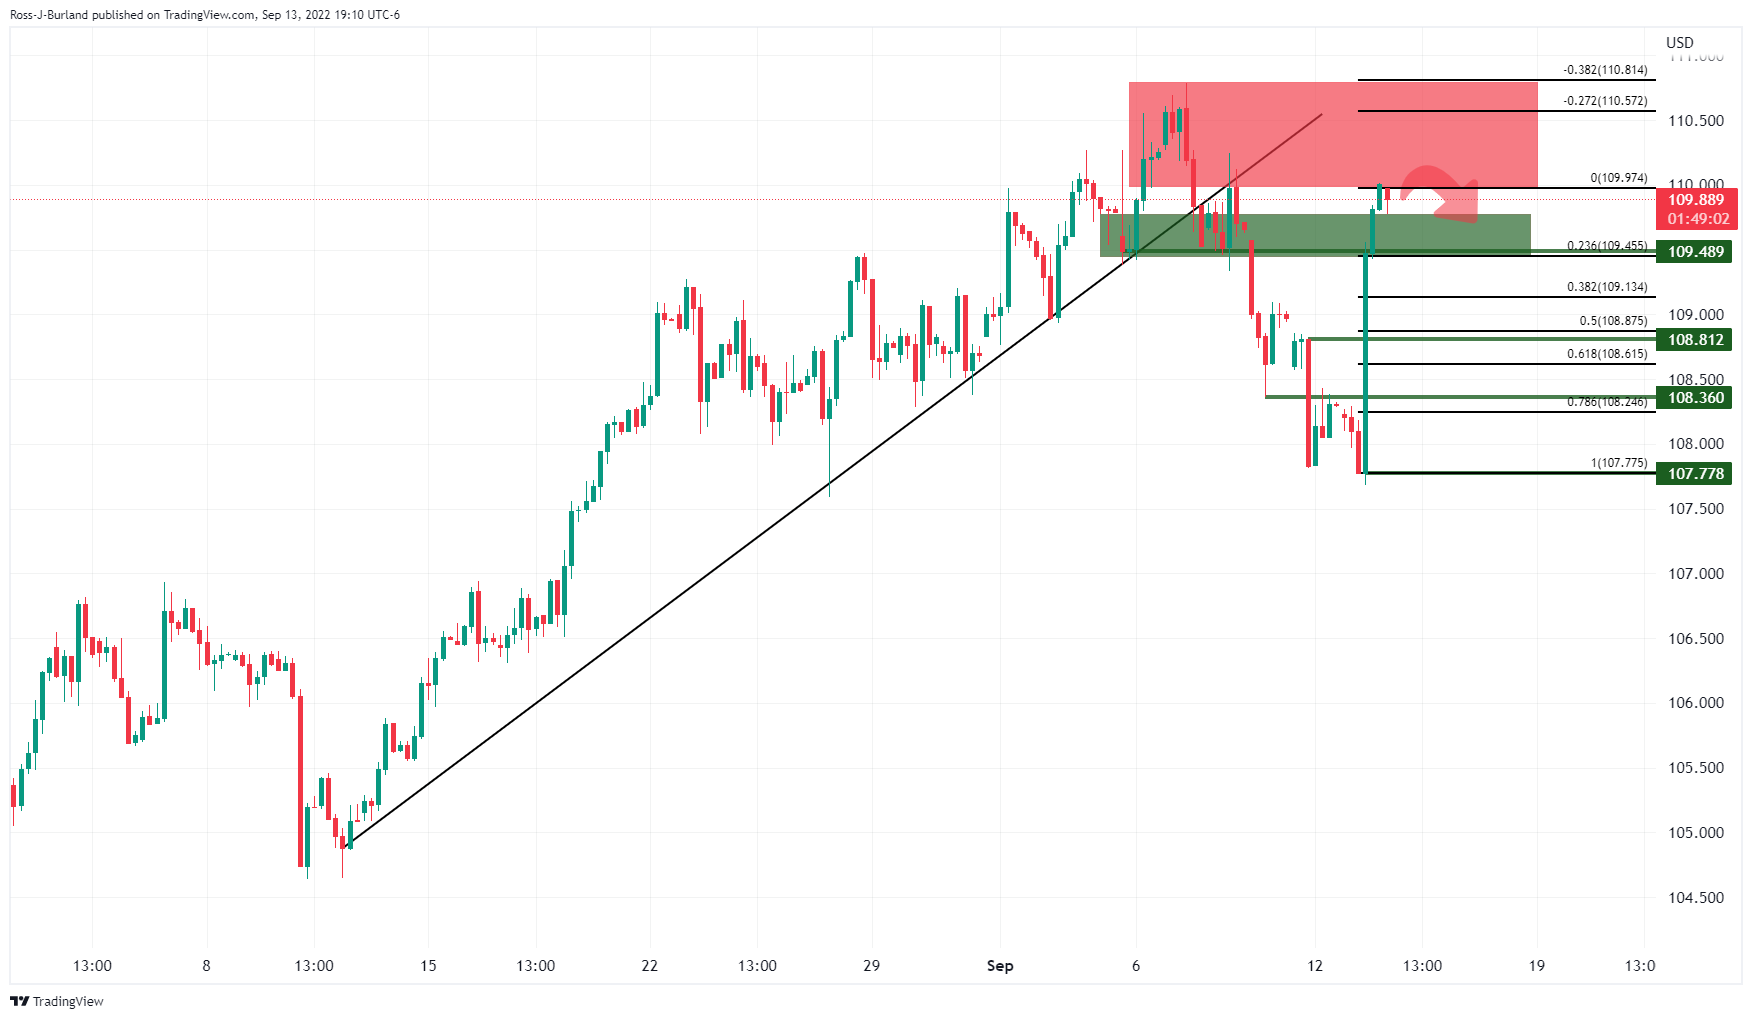
The chart above illustrated the market structure and key support levels should the US dollar take a turn for the worst in the coming days which could prompt a buying camping in the yen.
The outcome?...
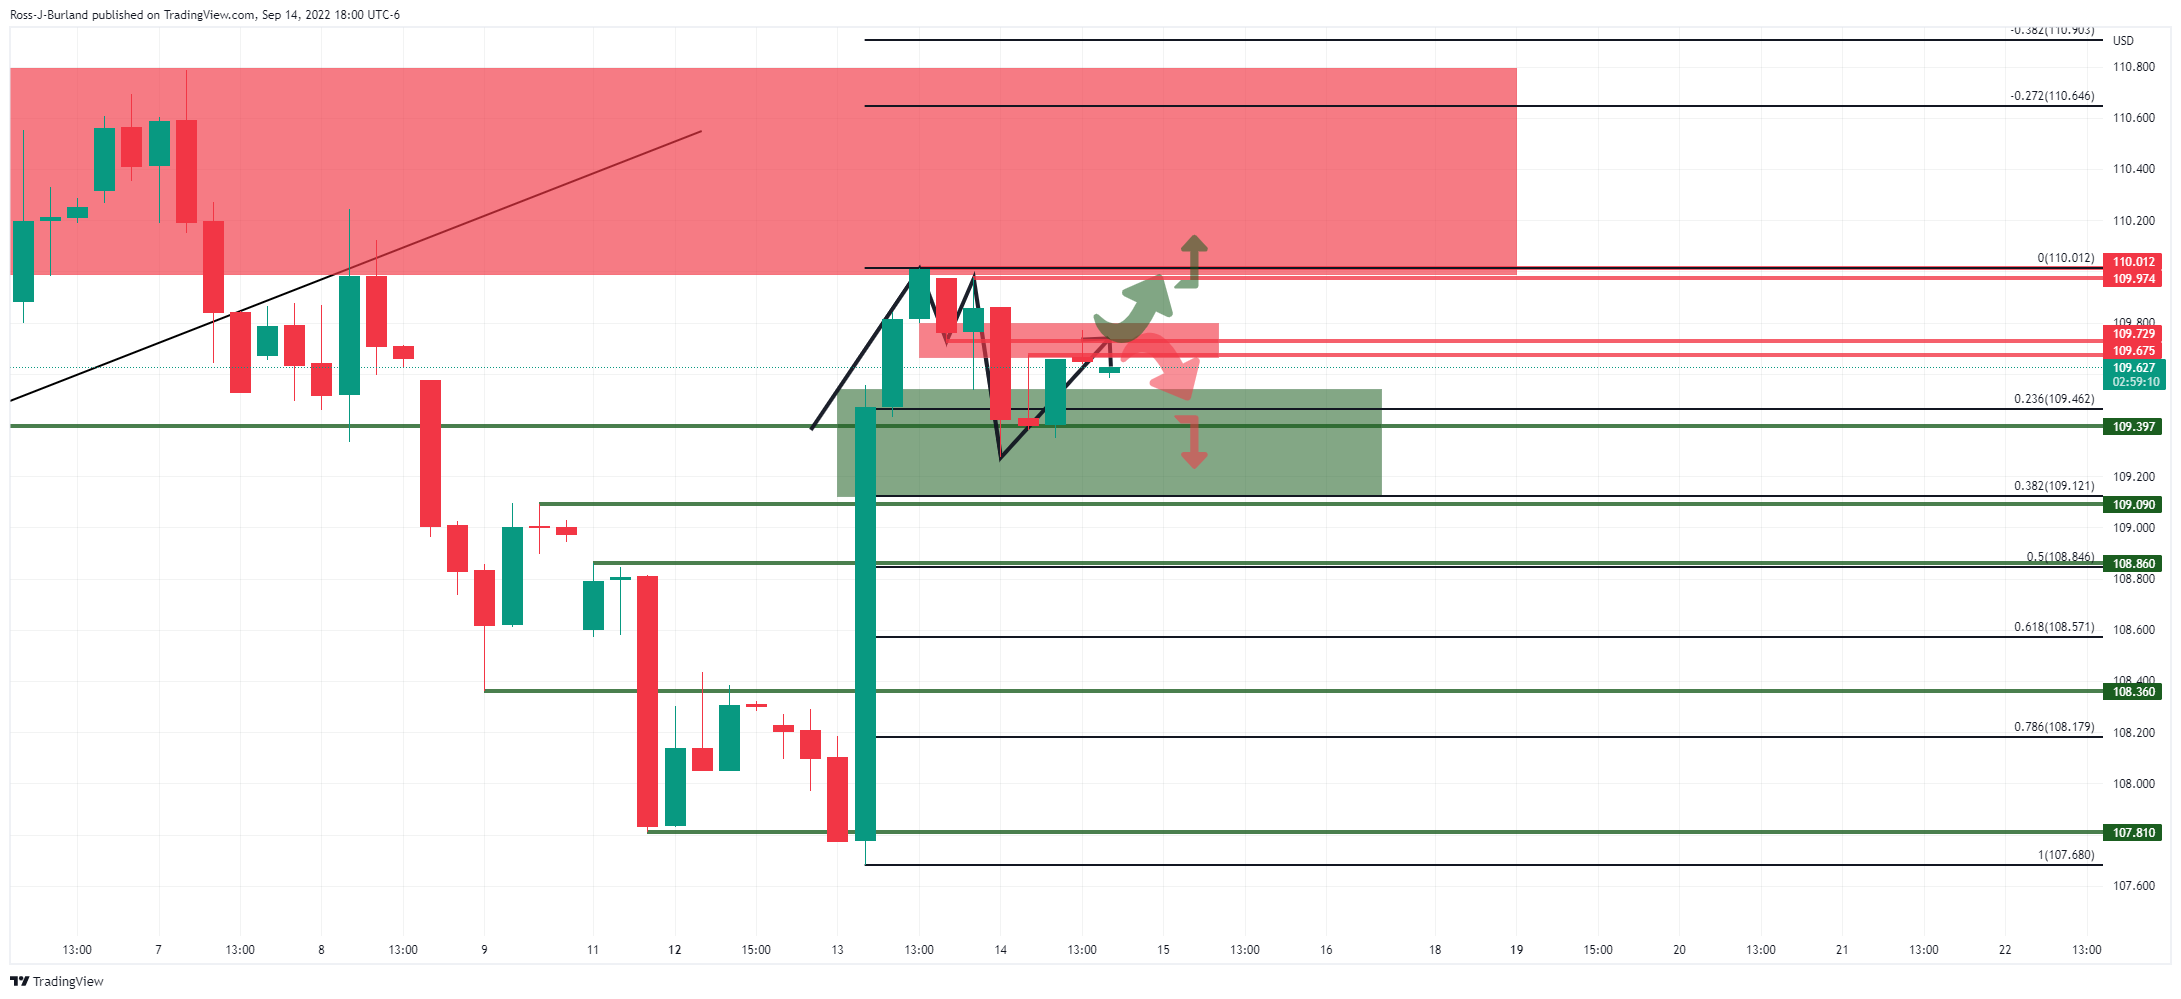
The price did indeed fall and if the bears commit again at the neckline of this M-formation, we should see more of the same from the yen in the coming sessions.
-
00:52
Japan Merchandise Trade Balance Total came in at ¥-2817.3B below forecasts (¥-2398.2B) in August
-
00:52
Japan Adjusted Merchandise Trade Balance came in at ¥-2371.3B, below expectations (¥-2152.3B) in August
-
00:50
Japan Exports (YoY) registered at 22.1%, below expectations (23.6%) in August
-
00:50
Japan Imports (YoY) registered at 49.9% above expectations (46.7%) in August
-
00:50
Japan Foreign Investment in Japan Stocks increased to ¥-609.7B in September 9 from previous ¥-704.2B
-
00:50
Japan Foreign Bond Investment dipped from previous ¥149.1B to ¥-140.7B in September 9
-
00:49
USD/CHF retreats towards 0.9600, ignores upbeat options market signals
USD/CHF prices fail to justify bullish bias in the options market as the Swiss currency (CHF) pair extends the previous day’s pullback towards 0.9600 during Thursday’s Asian session, pressured to around 0.9620 at the latest.
That said, the three-day uptrend by the daily risk reversal (RR) of the USD/CHF, a gauge of the spread between calls and puts, signals bullish bias in the options markets, with the latest figures being 0.015.
It’s worth noting that the weekly RR is also reversing the previous week’s losses with a 0.075 figure and keeps the USD/CHF pair traders hopeful.
To sum up, the optimism in the options market, coupled with the cautious mood, is likely to restrict immediate USD/CHF moves ahead of the US Retail Sales for August, expected to remain unchanged at 0.0%.
Also read: Australian Employment Preview: Will labor market upturn save the aussie?
-
00:44
GBP/USD faces barricades around 1.1500, focus is on US Retail Sales
- GBP/USD has sensed a moderate selling pressure around 1.1500 ahead of US Retail Sales data.
- A lower reading of UK CPI for one time is insufficient to declare exhaustion in price pressures.
- The Fed is preparing for a full percent rate hike to fix the core CPI chaos.
The GBP/USD pair is inching modestly towards the upside after a rebound from 1.1526 in the late New York session. The pair is expected to remain sideways as investors are awaiting the release of the US Retail Sales data. On a broader note, the asset recovered firmly after a dual-test of a low of 1.1480 on Wednesday. A decline in the UK inflation data against the expectation of an increment supported the pound bulls.
The headline UK Consumer Price Index (CPI) data landed at 9.9% lower than the forecasts of 10.2% and the prior release of 10.1%. A decline in headline CPI in times when the economy is going through the severe pain of sky-rocketing energy bills is music to the ears of the Bank of England (BOE) policymakers. The downside reading has come as a sigh of relief for the UK economy. Earlier, the market veterans anticipated an inflation rate of 13-14% for the pound zone. Therefore, tagging the situation as exhaustion in the price pressures won’t be justifiable.
Meanwhile, the US dollar index (DXY) has turned sideways after a juggernaut rally. The DXY is expected to remain at elevated levels as the street has started speaking about a full percent rate hike by the Federal Reserve (Fed) in its September monetary policy meeting. The Fed has reached back to the square despite tightening its policy over the past six months. The catalyst which has triggered fears for the Fed is the advancing core CPI data, which landed at 6.3%, higher than the forecasts of 6.1%.
In today’s session, investors’ entire focus will be on the US Retail Sales data. As per the preliminary estimates, the economic data has not shown any growth in retail demand. A stagnancy in consumers’ demand is not fancy for the economy but a sign of decline in the confidence of the consumers in the economy.
-
00:37
USD/CAD Price Analysis: Extends pullback from two-month-old hurdle below 1.3200
- USD/CAD takes offers to refresh intraday low, snaps two-day uptrend.
- RSI retreat from overbought territory, receding bullish bias of MACD favor pullback from the key resistance line.
- 50-SMA, 61.8% Fibonacci retracement level restricts immediate downside.
- Recovery moves need validation from the yearly top.
USD/CAD stretches the previous day’s pullback from a two-month-old resistance line, the third consecutive one in September, while taking offers to refresh the intraday bottom around 1.3150 during Thursday’s Asian session.
Not only the U-turn from the key resistance line but the RSI’s retreat from the overbought territory and the receding bullish bias of the MACD also favor the USD/CAD bears.
With this, the Loonie pair is all set to revisit the 50-SMA support near 1.3100 before declining towards the 61.8% Fibonacci retracement level of the pair’s July-August downside, close to 1.3030.
It should be noted, however, that a convergence of the 200-SMA and the 50% Fibonacci retracement level around 1.2980-75 appears a tough nut to crack for the USD/CAD bears afterward.
Alternatively, recovery moves need a clear upside break of the aforementioned resistance line from July, at 1.3210 by the press time. Also acting as an upside hurdle is the yearly high marked in July at around 1.3225.
Following that, a run-up towards October 2020 peak around 1.3390 can’t be ruled out.
USD/CAD: Four-hour chart
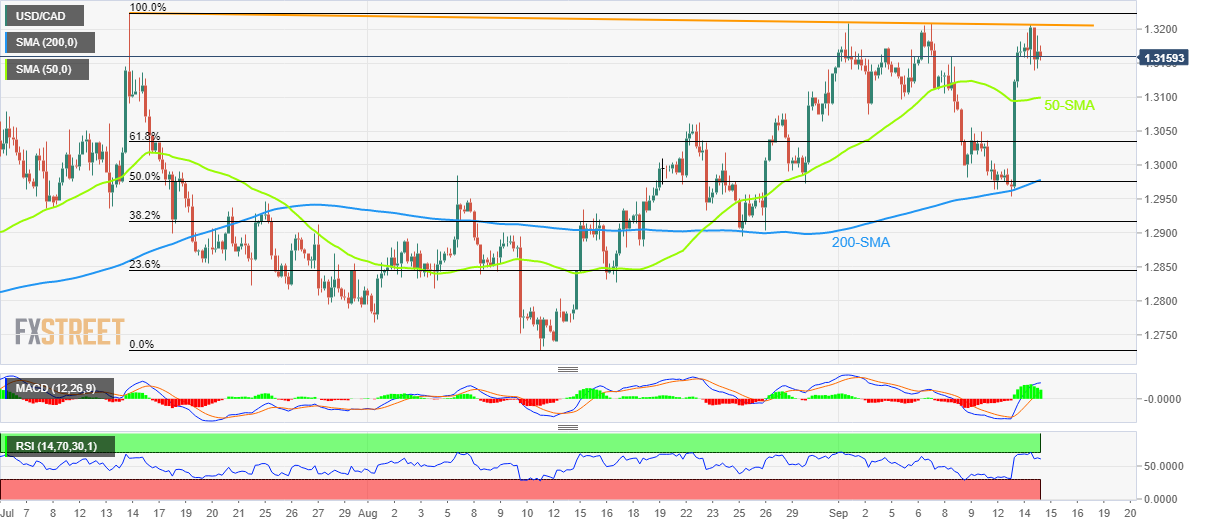
Trend: Further weakness expected
-
00:14
USD/JPY: More yen pain could catch Japanese firms off guard – Reuters poll
The vast majority of Japanese companies expect the yen to firm against the dollar by year-end, a Reuters monthly poll showed on Thursday. The survey also mentioned suggesting further weakness in the local currency could catch businesses off guard.
Key findings
During the Aug. 31 - Sept. 9 survey period, the yen was trading in a range of 138-145 to the dollar.
The survey was conducted before Japanese authorities this week gave strong indications that they were uncomfortable with the currency's sharp declines and appeared to be preparing to intervene to prop it up. On Wednesday, the yen was at 143.62 to the dollar.
Asked how they expected the yen to move against the dollar by year-end, 45% of firms - the biggest chunk - pegged it at 136-140, followed by 28% at 131-135, the survey showed.
Some 11% put it at 126-130, while 3% set it at 120-125. Only 13% saw it weakening further from 141, meaning many firms could be put on the back foot if the currency were to weaken again.
Separately, a slim majority of respondents want the yen to rise moderately while 28% want it to fall modestly.
A slim majority said they don't expect the government's easing of border controls to help inbound tourism recover.
One-third said they were unaffected by inbound tourism.
The Reuters Corporate Survey, conducted for Reuters by Nikkei Research, canvassed around 500 big non-financial Japanese firms on condition of anonymity, allowing them to speak more freely.
Separately, the survey also found that three quarters of firms are concerned about the possibility of an incident in Taiwan, given the political sensitivies around the island claimed by China.
Also read: Forex Today: Yen rallies on BoJ verbal intervention, but US dollar bulls perked-up
-
00:07
AUD/NZD retreats towards 1.1200 on strong NZ Q2 GDP, Australia Employment data eyed
- AUD/NZD takes offers to refresh intraday low after strong NZ Q2 GDP.
- New Zealand’s Q2 GDP rose past market expectations and prior on QoQ.
- Mixed concerns surrounding China, RBA versus RBNZ game tests bulls.
- Australia’s employment data for August will be important for fresh impulse.
AUD/NZD renews intraday low around 1.1220 on strong New Zealand (NZ) Gross Domestic Product (GDP) during Thursday’s initial Asian session. Even so, the cross-currency pair remains mildly offered, most cautious, as traders await Australia’s jobs report for August.
New Zealand’s (NZ) second quarter (Q2) Gross Domestic Product (GDP) grew 1.7% QoQ compared to 1.0% market expectations and a prior contraction of 0.2%, per the latest report from Statistics New Zealand. The YoY figures came in as 0.4% versus 0.2% expected and 1.2% previous readouts.
With the firm NZ GDP, the odds of the Reserve Bank of New Zealand’s (RBNZ) stronger rate hikes escalated, which in turn favored the New Zealand dollar (NZD). Also exerting downside pressure on the AUD/NZD pair are the cautious statements from the Reserve Bank of Australia (RBA) at the latest.
Earlier in the day, NZ Finance Minister Grant Robertson crossed wires, via Reuters, while stating that tighter fiscal policy will necessitate difficult decisions. The policymaker also mentioned, “New Zealand is entering a period of more focused spending.”
Elsewhere, fears surrounding China’s economic recovery and the dragon nation’s readiness for heavy stimulus join the geopolitical tussles between the Washington and Beijing to challenge the pair traders. Also, the Russia-Ukraine war and the energy crisis in Europe are some extra catalysts that restrict the pair’s upside momentum.
Above all, anxiety ahead of the next week’s RBNZ and the Fed meeting seems to challenge the AUD/NZD prices.
While portraying the mood, the Wall Street benchmarks printed mild gains while the Treasury yields retreated from the multi-day high, posting mild losses at the end.
Moving on, Australia’s Consumer Inflation Expectations for September, expected 6.7% versus 5.9% prior, will offer immediate directions ahead of the key Aussie jobs report. Forecasts suggest the Aussie Employment Change to increase from -40.9K to 35K while the Unemployment Rate to rise to 66.6% versus 66.4% prior. Even so, the Reserve Bank of Australia’s (RBA) cautious mood might challenge the AUD/NZD bulls.
Also read: Australian Employment Preview: Will labor market upturn save the aussie?
Technical analysis
Although double tops surrounding 1.1255-60 challenge AUD/NZD bulls, the pair’s downside remains elusive unless declining below June’s low of 1.1168.
-