Notícias do Mercado
-
21:02
United Kingdom CFTC GBP NC Net Positions climbed from previous £-25.7K to £-5.6K
-
21:02
United States CFTC S&P 500 NC Net Positions climbed from previous $-230.1K to $-159.8K
-
21:02
European Monetary Union CFTC EUR NC Net Positions up to €142.3K from previous €124.7K
-
21:02
Australia CFTC AUD NC Net Positions up to $-34.1K from previous $-37.8K
-
21:02
Japan CFTC JPY NC Net Positions up to ¥-40.9K from previous ¥-53.2K
-
21:02
United States CFTC Gold NC Net Positions rose from previous $125.6K to $128.8K
-
21:01
United States CFTC Oil NC Net Positions up to 238.2K from previous 229.6K
-
18:45
EUR/USD Price Analysis: An explosive holiday season breakout could be on the cards
- EUR/USD bears are eyeing the trendline support for an explosive breakout.
- The price is being resisted and a break of 1.0575 will likely encourage the bears to target a break of 1.0500.
As per the prior analysis, EUR/USD Price Analysis: Bears sink in their teeth to test bulls at a critical support structure, the bears are capping the bull's attempts to break higher. We have seen the price start to coil on the backside of the prior bullish trend but still, the Euro remains on the front side of the more dominant bullish trend as the following will illustrate.
EUR/USD prior analysis
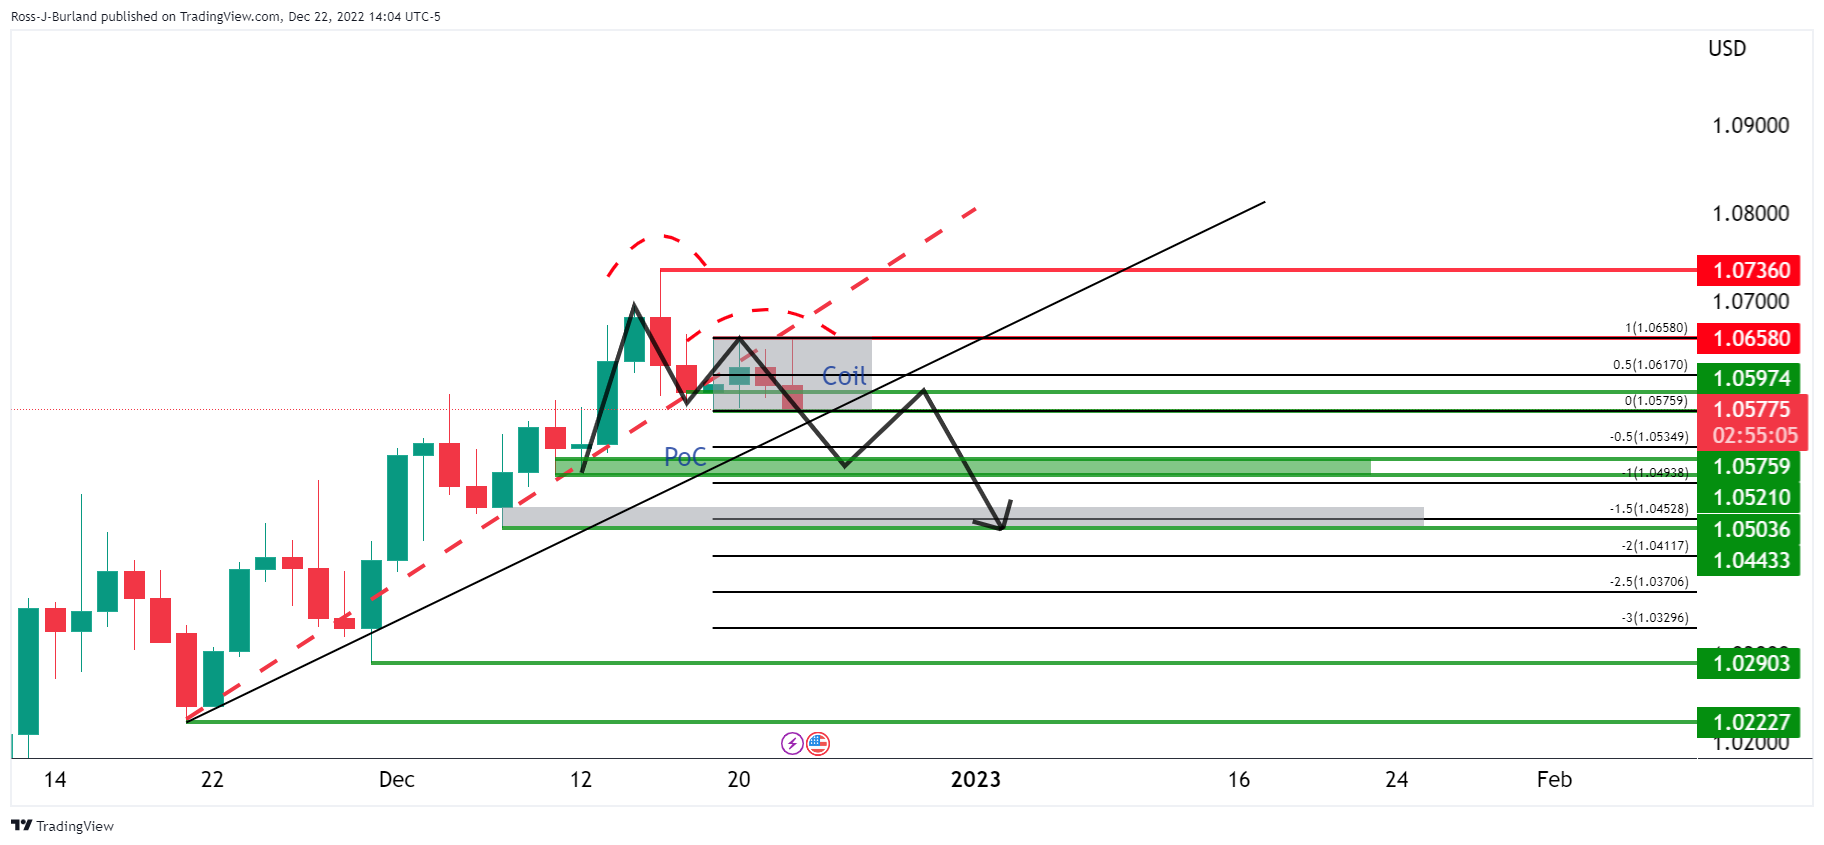
the above showed the prospects of an explosive move below trendline support and given the holidays, a narrow range could still be the fuel for the same in the full trading days between Christmas and New Year.
EUR/USD update
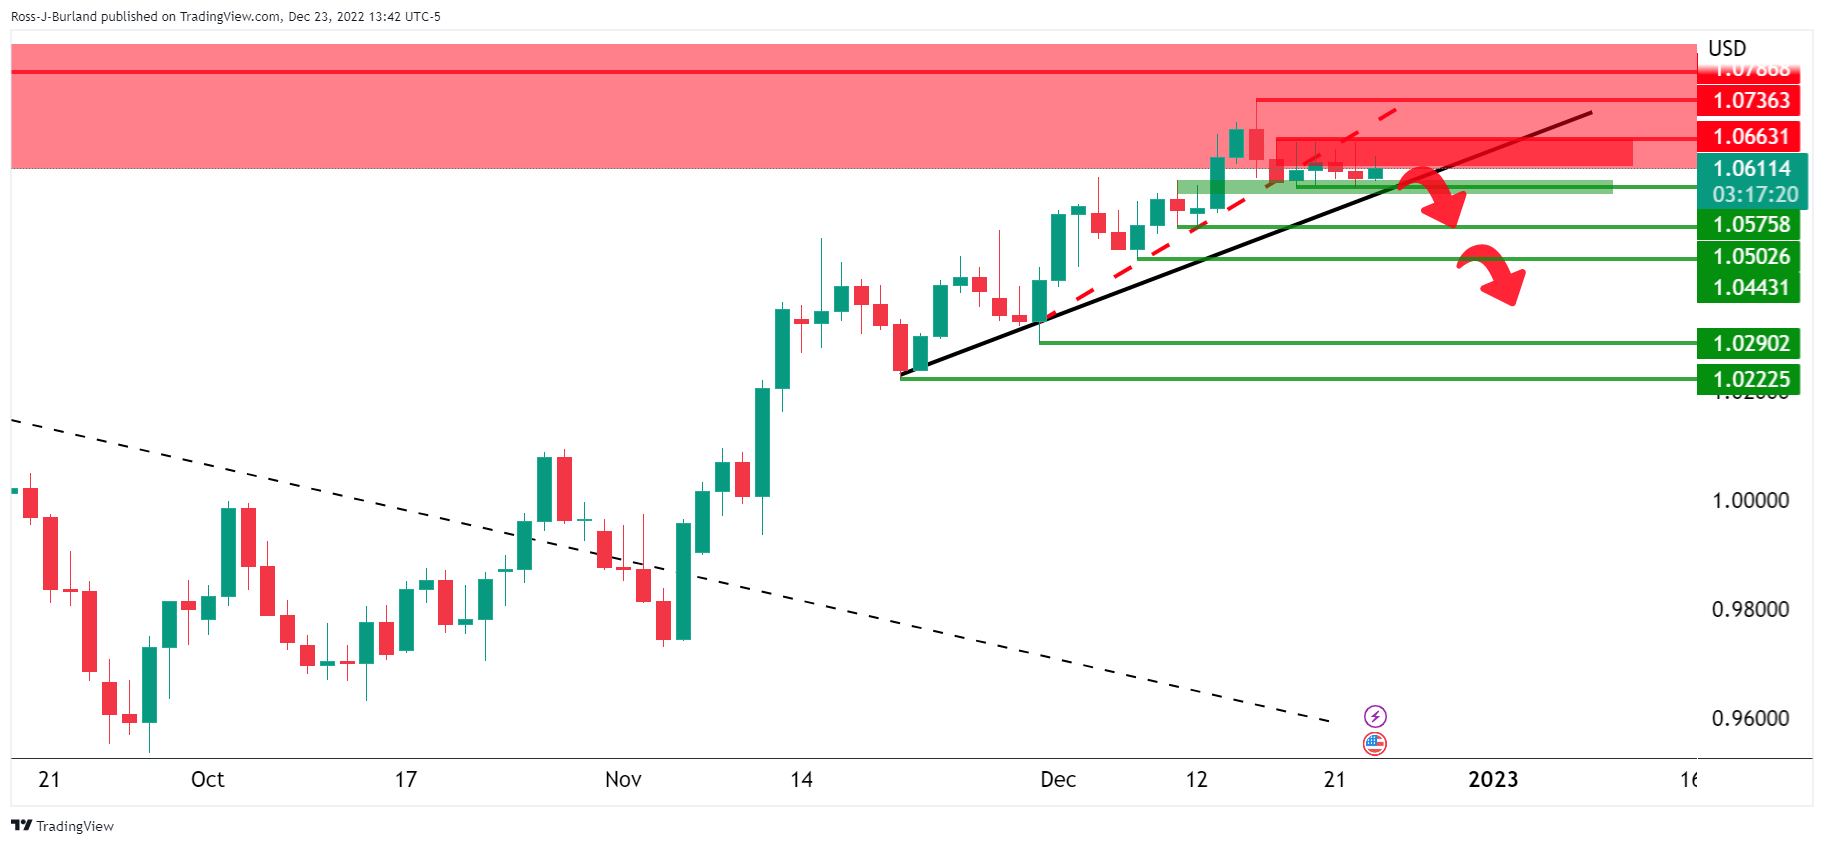
The price is being resisted and a break of 1.0575 will likely encourage the bears to target a break of 1.0500.
-
18:30
United States Baker Hughes US Oil Rig Count: 622 vs 620
-
18:25
Atlanta Fed Q4 GDPNow tracker moves up 3.7% from +2.7%
After recent releases from the US Census Bureau, the US Bureau of Economic Analysis, and the National Association of Realtors, the nowcasts of fourth-quarter real personal consumption expenditures growth and fourth-quarter real gross private domestic investment growth increased from 3.4 percent and -0.2 percent, respectively, to 3.6 percent and 3.8 percent, respectively," the release from the US Census Bureau said.
US Dollar update
The US Dollar, as measured by the DXY index vs. a basket of currencies is flat for the day in low-volume holiday markets, trading around 104.34. The index has stuck to a range of between 104.124 and 104.536 on the day. However, it has shown signs of recovery in a bullish correction love the past few days, supported by positive US data that has fueled speculation that the Fed will stay the course to fight inflation in 2023.
-
18:10
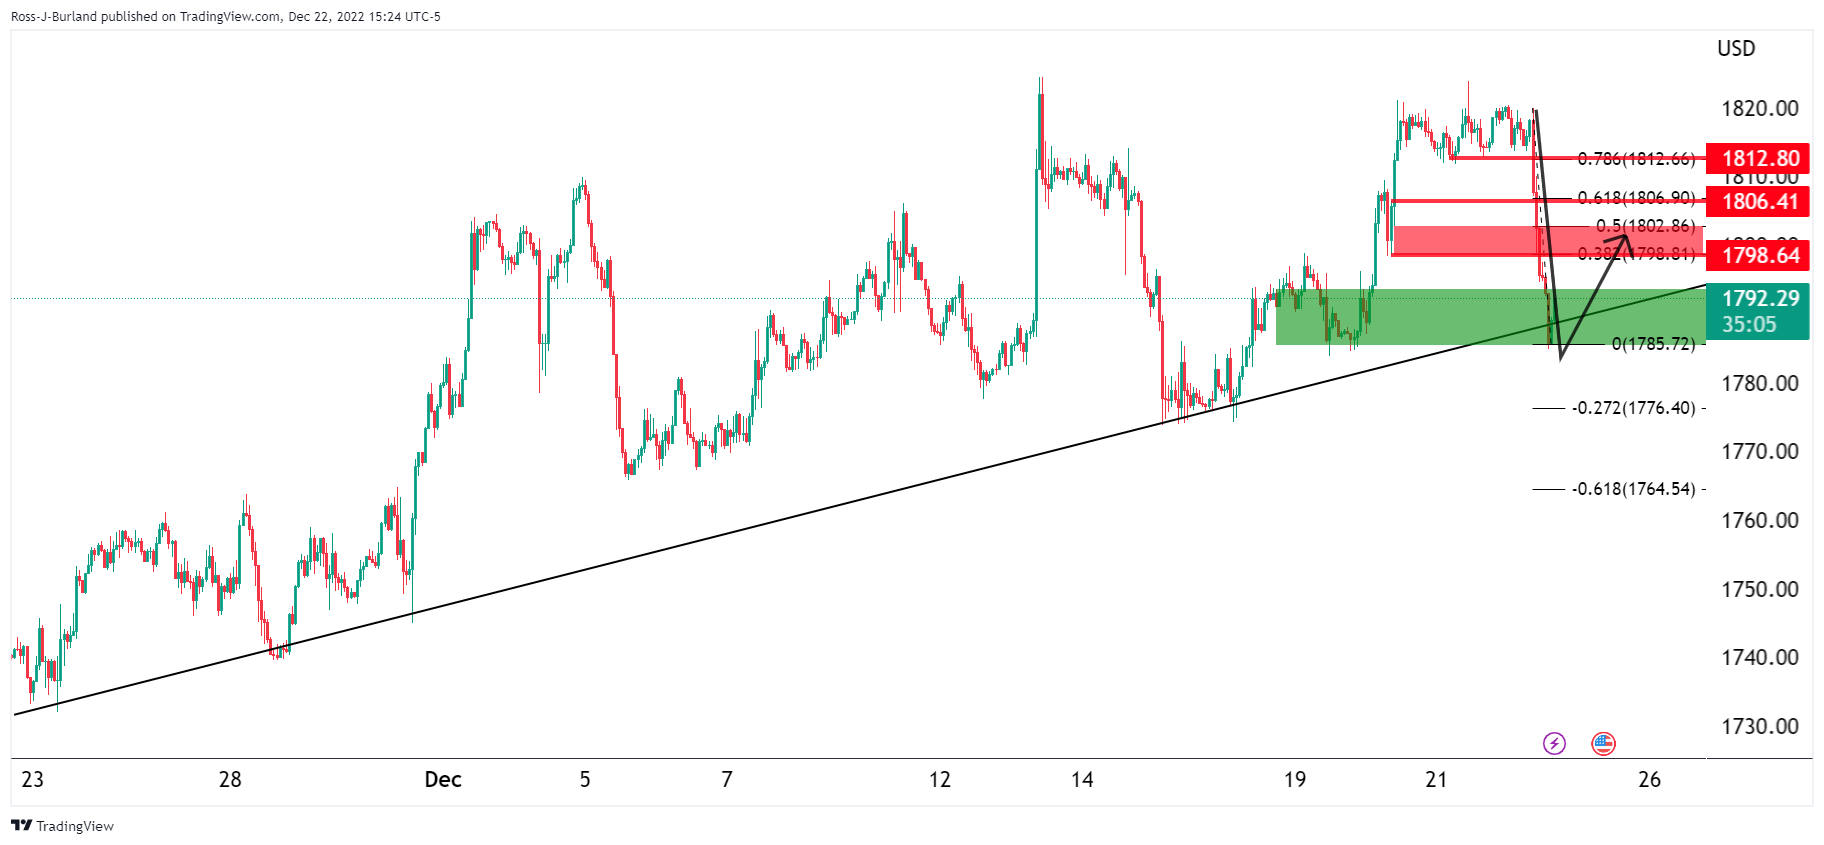
Gold Price Forecast: XAU/USD bulls move back in, market remains coiled
- The Gold price is back in line with the coil and would be expected to continue higher or at least stay sideways.
- Failing this, then an even deeper move in Gold price would be on the cards for the days ahead with $1,775 eyed.
As per the prior day's analysis, Gold Price Forecast: XAU/USD bulls need to commit at key trendline support, the Gold price has found demand at the said support area and has moved back into line with the broader bullish trend. Gold price edged up on Friday ahead of the Christmas holidays and long weekend and was supported by cooling inflation data in Friday's data storm.
US consumer spending glided 0.1% higher in November after climbing 0.4% in October, in a sign that inflation is cooling, although not as much as markets need to see to start to expect a pivot from the Federal Reserve or a slowdown in their rate-hike path. Year-over-year, (YoY), the Personal consumption expenditures index, (PCE), landed at 5.5%, a half-percent cool-down from October. Stripping away volatile food and energy prices, the index was up on monthly and annual bases by 0.2% and 4.7%, respectively, in-line with consensus. The bad news for Gold price is that the October PCE inflation data was upwardly revised.
US Gross Domestic Product data on Thursday and Jobless Claims also highlighted the country's economy rebounded faster than previously estimated and that the jobs market remains very tight. All in all, the slew of data does little to turn the tables with regard to speculation that the Fed will stay the course to fight inflation in 2023. Such rate hikes to tame price pressure weigh on the non-yielding asset that pays no interest which is now on track for a second consecutive yearly decline.
Fed will have to do more
Analysts at Brown Brothers Harriman said markets still don't believe the Fed. ''After rising as high as 5.5% after the most recent FOMC meeting, the terminal rate as seen by the swaps market has fallen back to around 5.0%,'' the analysts explained. ''Similarly, WIRP suggests a 50 bp hike February 1 is only 33% priced in, followed by a final 25 bp hike March 22. We cannot understand why the markets continue to fight the Fed. With the exception of some communications missteps here and there, chair Jerome Powell and company have been resolute about the need to take rates higher for longer. Recent US data confirm that the labor market remains strong and that the Fed will have to do more.''
Gold price technical analysis
In the prior analysis, the Gold price dropped to the targetted area and exceeded it into the $1,784s for a 300% measured move and to where the prior micro trend started off at:
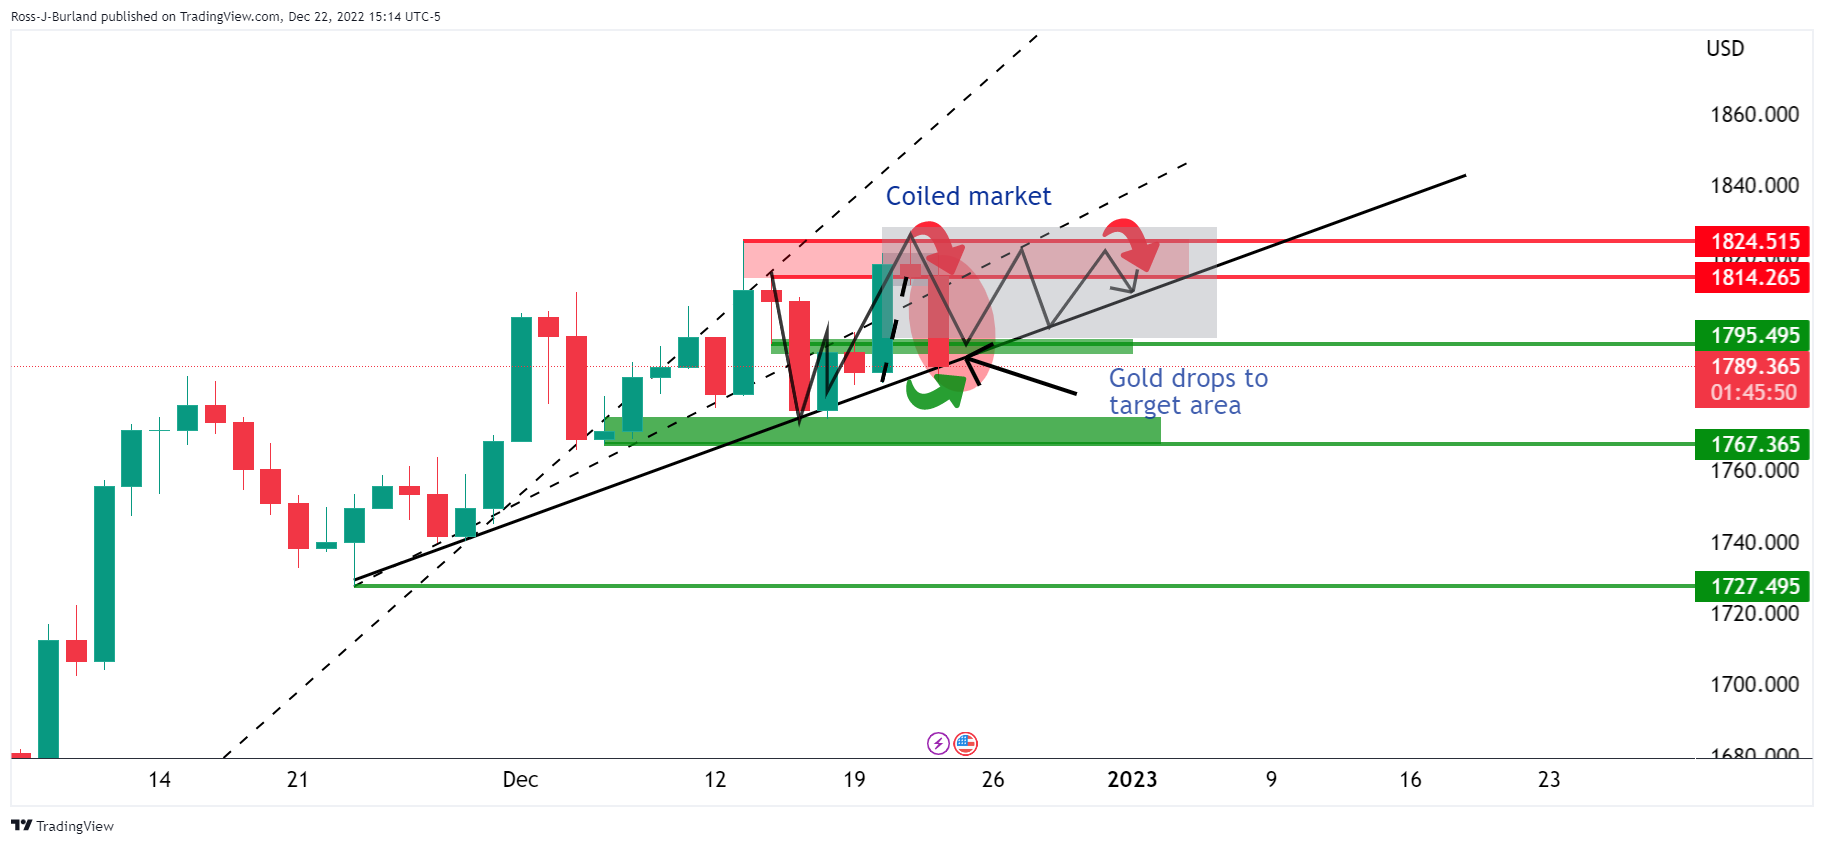
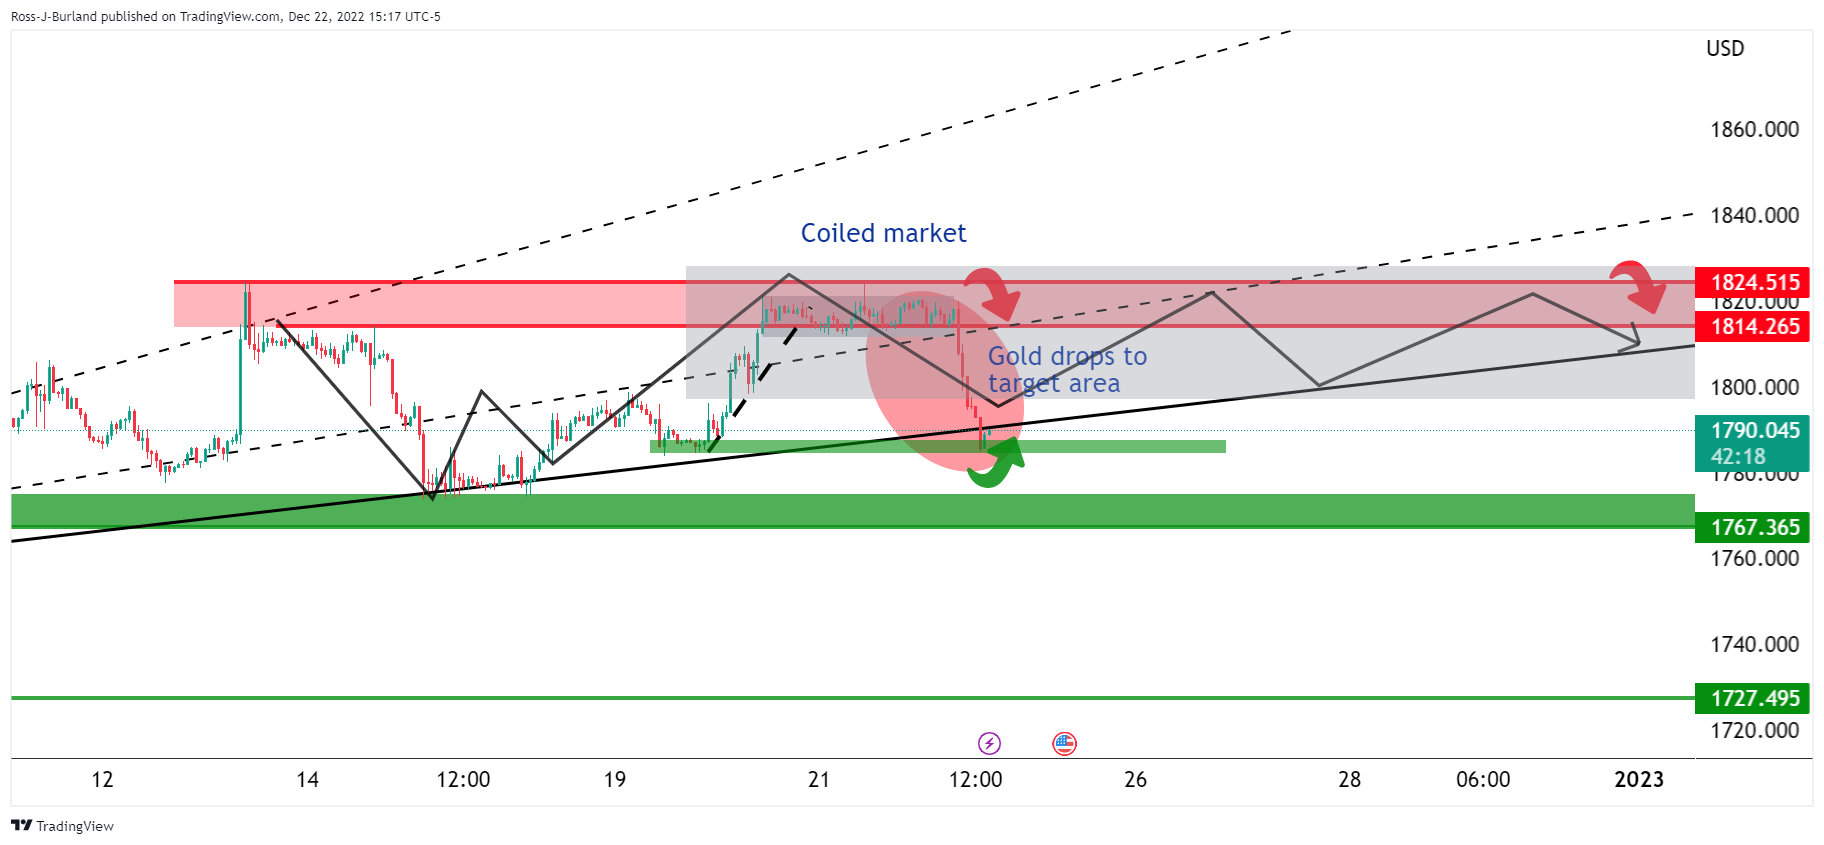
It was stated that a correction in the Gold price would be expected, respecting the bullish trend:
Gold price update
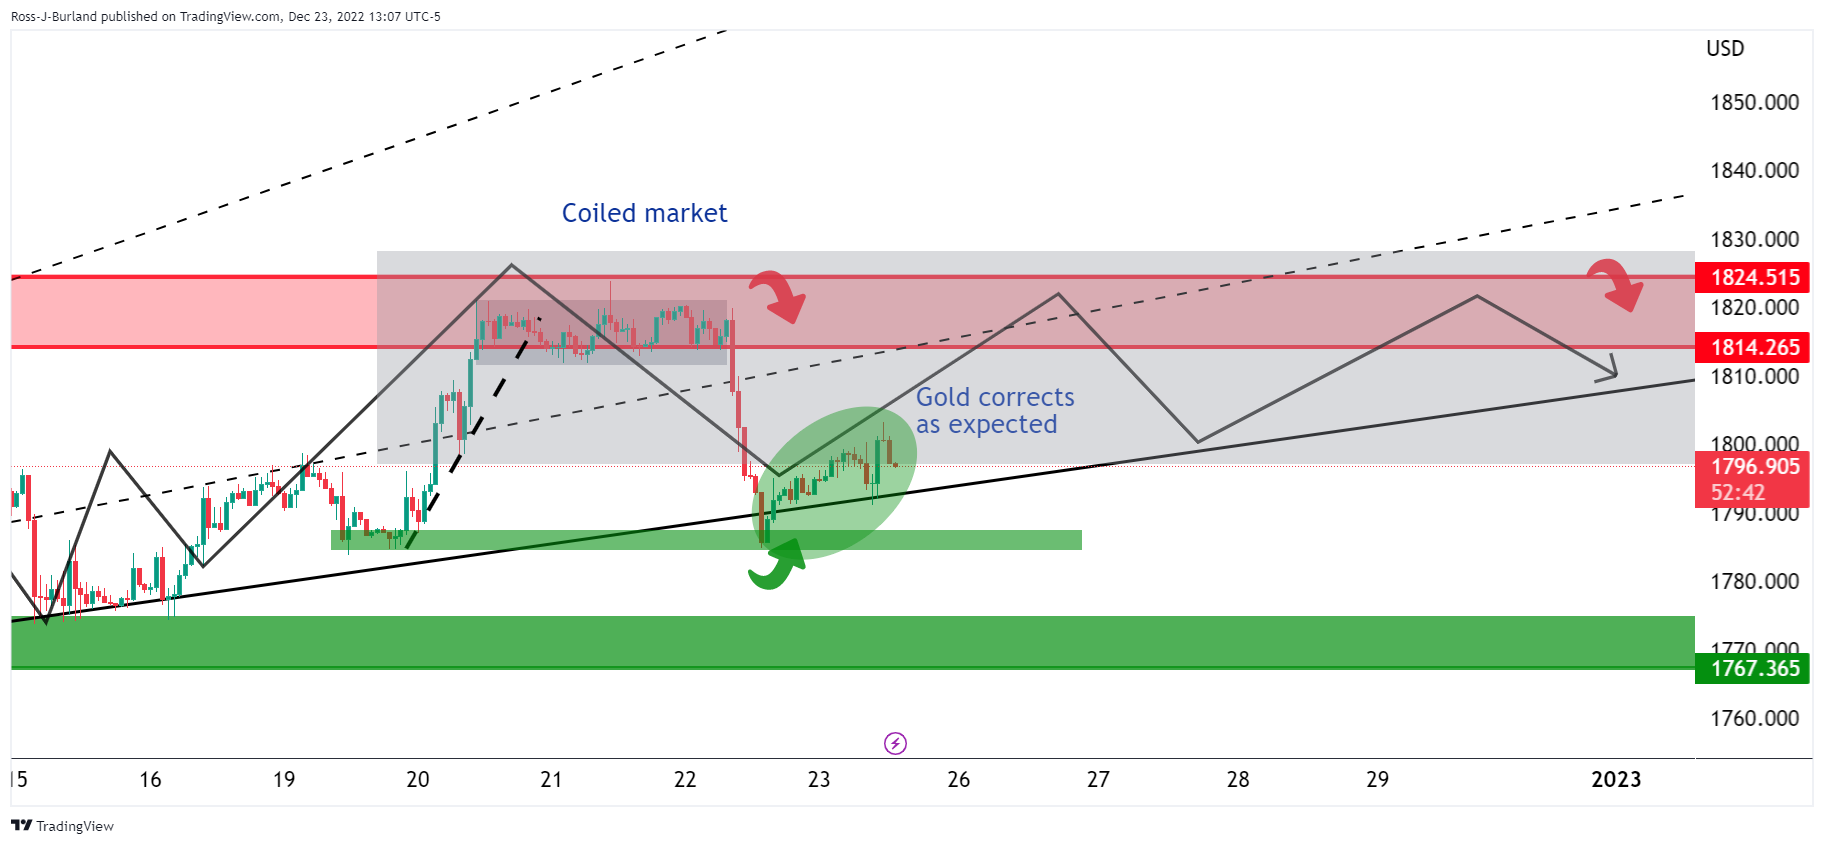
The Gold price is back in line with the coil and would be expected to continue higher or at least stay sideways. Failing this, then an even deeper move in Gold price would be on the cards for the days ahead, making the case for a significant downside correction with $1,775 eyed.
-
16:01
Türkiye: Dramatic rate hikes will be needed next year – TDS
On Thursday, the Central Bank of the Republic of Turkey kept its key interest rate unchanged at 9.00% as expected. Analysts from TD Securities continue to believe that dramatic rate hikes will be needed in 2023.
Key Quotes:
“The CBRT left the benchmark one-week repo rate on hold at 9.00%, one month after calling the end of the easing cycle. This is in line with our expectations and the consensus. The basic structure of the CBRT statement has remained unchanged compared to the November one.”
“The comment that "the comprehensive review of the policy framework continues with the aim of encouraging permanent and strengthened liraization in all policy tools of the CBRT" may be loosely interpreted as the possibility of more easing down the road, if this is deemed to help the CBRT achieve its objectives. While this has always been a distinct possibility, the CBRT seems to show no concern of a market misinterpretation. And this lack of concern is concerning to us. The market may also find itself unprepared for this.”
“We continue to believe that dramatic rate hikes will be needed next year, but not before the lira becomes unhinged again. Current conditions seem to discourage going for a negative view on the lira in the short term, but the fundamental backdrop continues to suggest this is the path of least resistance.”
-
15:47
Canada: Economy continued to grow at the start of Q4 – CIBC
Data released on Friday, showed the Canadian economy expanded 0.1% in October. Analysts at CIBC point out the upward revision to September and the modest growth in October/November leaves Q4 GDP tracking between 1% and 1.5%, which is above the Bank of Canada’s October Monetary Policy Report forecast of 0.5%.
Key Quotes:
“Statistics Canada provided a small dose of Christmas cheer, with news that the Canadian economy continued to grow (albeit only modestly) at the start of the fourth quarter. Combined with a slight upward revision to September, today's data leave Q4 as a whole tracking around 1.3%. That's above the Bank of Canada's October projection for growth of only 0.5% during the quarter, although not by enough on its own for us to project a further interest rate hike.”
“The industry data can sometimes diverge from the final expenditure figures, and we suspect that the employment data for December and the BoC's own business and consumer surveys will be more important in determining if policymakers raise interest rates any further. We maintain our view for a hold at the January meeting, and feel that the Bank has already done enough to slow the economy and inflation notably in 2023.”
-
15:34
USD/BRL: Fiscal fundamentals continue to be fragile – Rabobank
According to analysts from Rabobank, the Brazilian Real is suffering from fiscal developments after the presidential elections. They still think the USD/BRL will be traded at 5.30 by end-2022 and by end-2023.
Key Quotes:
“We still see the USDBRL at 5.30 by end-2022 and by end-2023. We still see the USDBRL at 5.30 by end-2022 and by end-2023.”
“The US dollar has recently seen huge swings in tandem with the Fed's views on the US economy, dragging commodity currencies like the BRL along with it, while other advanced economies' central banks struggle to keep up with the Fed's hiking cycle. Despite this, Brazil's external accounts relatively remain in good shape, with a historically low current account deficit (3.3% of GDP) that is easily financed by FDI (4.0% of GDP). However, fiscal fundamentals, particularly debt sustainability, continue to be fragile.”
“Following the elections, discussions about a transition constitutional amendment bill (granting the president-elect the authority to promote social transfers above the spending cap), worth BRL 198 billion per year, impacted the FX market over the last five weeks, causing the BRL to fall from second to fourth best YTD performance among 24 major EMFX currencies.”
“We believe the BRL has the potential to remain under pressure and reach 5.30 by the end of 2022 and end of 2023. If a credible fiscal policy outlook is announced in 23H1, we may see a partial and temporary reversal of this dynamic.”
-
15:26
USD/JPY jumps to highest in three days above 133.00 boosted by US Treasury yields
- Japanese Yen is among the worst performers weakened by higher US yields.
- Dollar posts mixed results after US data.
- USD/JPY up on Friday, and down for the week.
The USD/JPY broke above 132.80 and climbed to 133.15, reaching the highest level since Tuesday. US Treasury yields rose following several economic reports from the US and weighed on the Japanese Yen.
US data: more positives than negatives
The key report from the US was the Core Personal Consumption Expenditure Price Index which rose 0.2% in November, in line with expectations, and 4.7% from a year ago, a decline from the 5% in October. The inflation indicators are closely watched by the Federal Reserve.
Durable Goods Orders fell more than expected by 2.6%. The Michigan Consumer Sentiment Index came in at 59.7 in December, above the 59.1 of the preliminary estimate. New Home Sales surprised with a 5.8% increase in November to an annual rate of 640K, above the 600K of market consensus.
After all the economic reports, equity prices in Wall Street are heading lower, just like what happened on Thursday, when positive figures triggered a selloff. The difference on Friday is that bond yields are reacting more strongly, hence boosting USD/JPY.
The pair is hovering below 133.00, with a bullish intraday bias. Above the daily high the next resistance might be located around the 133.50 area. On the downside, the key support is the 132.50/60 band, a confluence of a horizontal level and an uptrend line from the weekly low. A break lower would change the intraday bias to neutral/negative.
Technical levels
-
15:09
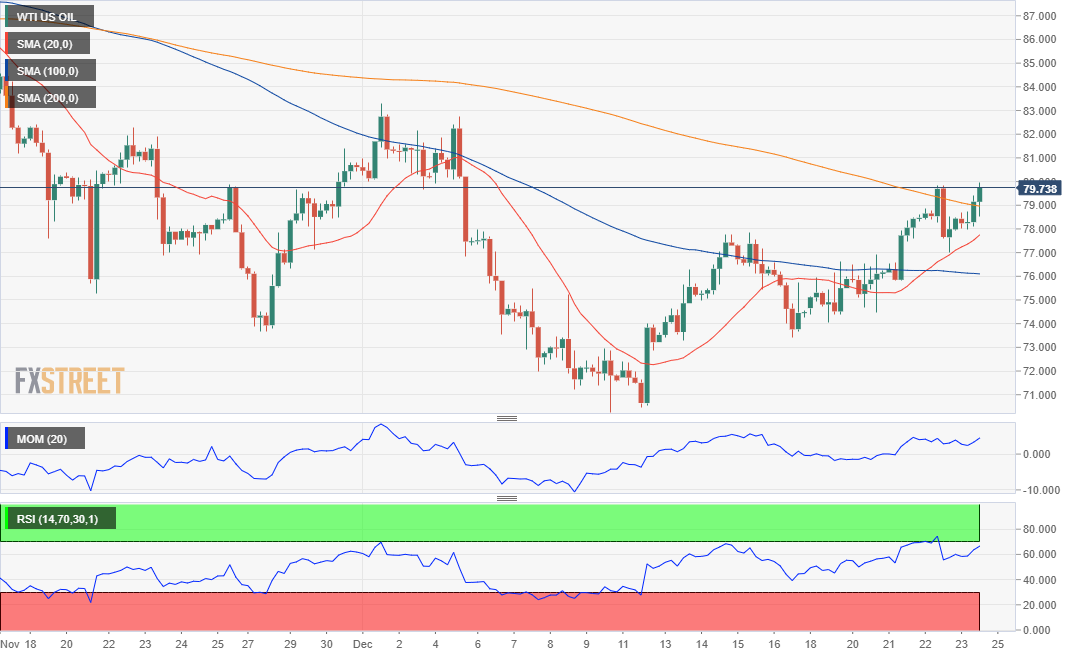
WTI Price Analysis: Crude oil challenging $80.00 a barrel
- Russia announced it might cut oil output early in January.
- US markets are due to close earlier on Friday amid the Christmas holidays.
- WTI retreated modestly after reaching a fresh monthly high.
Crude oil prices are up on Friday, with the West Texas Intermediate (WTI) barrel nearing $80.00. Oil surges despite the soft tone of equities and US Dollar strength, helped by news coming from Russia, as Deputy PM Alexander Novak said that, due to the price cap, gas flows might be diverted from the EU to Asia. Additionally, he noted that Russia may cut oil output by 5%-7% in early 2023 as a response to price caps on crude and refined derivatives. The cuts could reach 500,000-700,000 barrels per day (bpd).
Also, Anatoly Antonov, the Russian ambassador to the US, hit the wires and said that Washington is carrying out a "proxy war" against Moscow, adding that the hazard of a clash between Russia and the US is high.
It is worth adding that US markets are due to close early this Friday ahead of the Christmas celebration, meaning volatility will likely remain limited throughout the rest of the day.
WTI levels to watch
WTI touched $80.00 before shedding some cents but is biased higher according to technical readings in the daily chart. It is trading at its highest since December 5, recovering from a multi-month low of $70.08. December's monthly high was $83.33, a potential bullish target for next week. Should the black gold break beyond it, a rally towards $85.00 is on the table. Near-term dips will likely meet buyers at around $78.70, with the next support level at $78.15.
-
15:04
US: New Home Sales rise by 5.8% in November vs. -4.7% expected
- New Home Sales in the US unexpectedly increased in November.
- US Dollar Index stays in daily range above 104.00.
Sales of new single‐family houses rose by 5.8% in November to a seasonally adjusted annual rate of 640,000, the data published jointly by the US Census Bureau and the Department of Housing and Urban Development showed on Friday.
This reading followed October's increase of 8.2% and came in much better than the market expectation for a contraction of 4.7%.
Market reaction
This report doesn't seem to be having a significant impact on the US Dollar's performance against its major rivals. As of writing, the US Dollar Index was virtually unchanged on the day at 104.38.
-
15:00
United States New Home Sales Change (MoM) above forecasts (-4.7%) in November: Actual (5.8%)
-
15:00
United States Michigan Consumer Sentiment Index registered at 59.7 above expectations (59.1) in December
-
15:00
United States New Home Sales (MoM) came in at 0.64M, above forecasts (0.6M) in November
-
15:00
United States UoM 5-year Consumer Inflation Expectation down to 2.9% in December from previous 3%
-
14:42
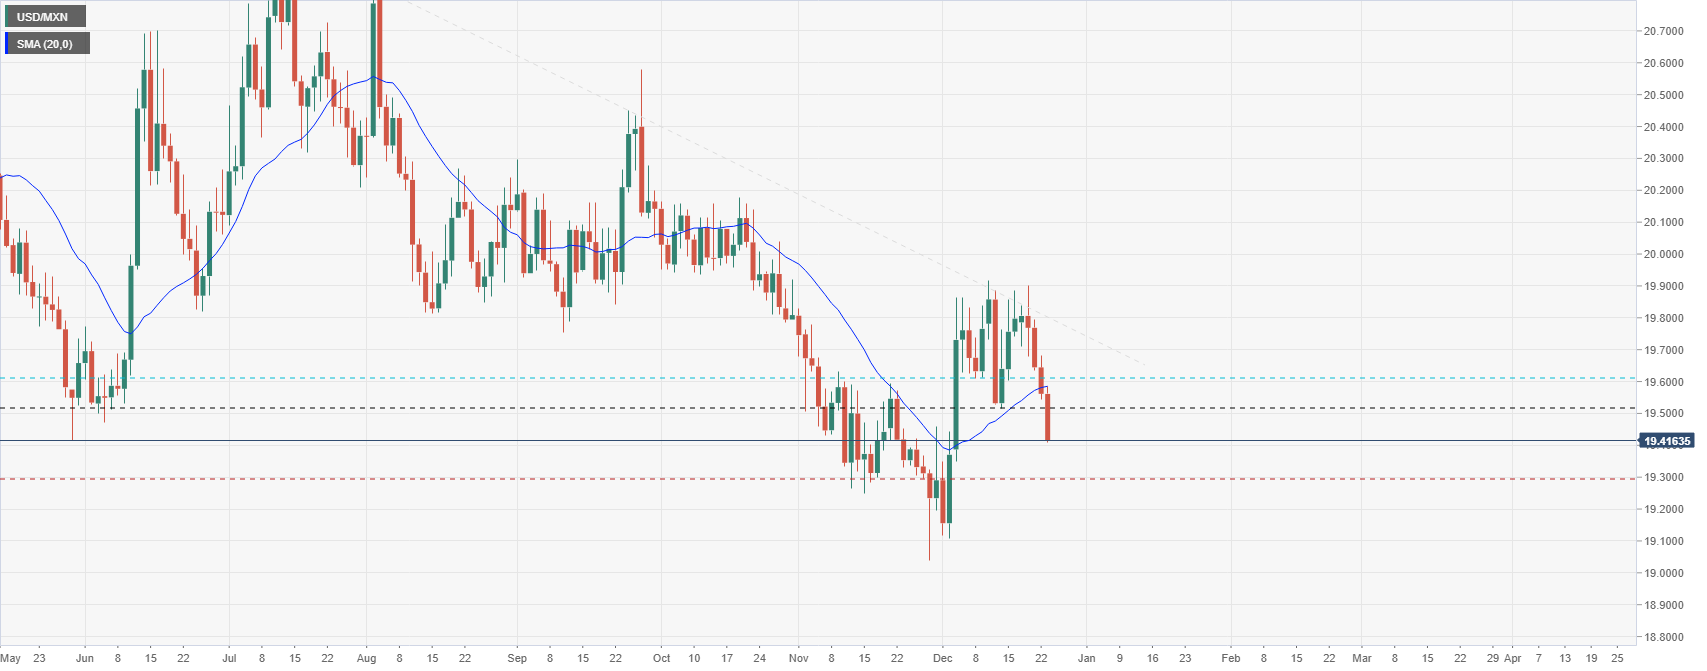
USD/MXN extends slide below 19.50, to lowest in two weeks
- Mexican Peso accelerates the upside versus US Dollar after breaking key technical level.
- US data in line with expectations, Mexican activity stagnates in October.
The USD/MXN broke under 19.50 and quickly fell further hitting 19.40, for the first time since December 5. The pair remains near the low, under pressure as the US Dollar posts mixed results on Friday.
Economic data from the US showed the Core Personal Consumption Expenditure Price Index rose 0.2% in November, in line with expectations. A different report showed Durable Goods Orders dropped 2.1%, against expectation of a 0.6% slide. The numbers did not have a significant influence on the US Dollar.
In Mexico, the Economic Activity index stagnated in October, against expectations of a 0.3% increase. Compared to a year earlier, the index rose 4.40%. On Thursday, inflation that came in mixed with the headline index rising after six consecutive drops (from 7.46% to 7.77%), while the core rate slowed down (8.37% to 8.35%).
Levels to watch
The consolidation below 19.70 left the USD/MXN vulnerable to more losses. Recently it broke the 19.50 support area falling to as low as 19.40. The bearish bias prevails with the next relevant support at 19.30. A recovery back above 19.50 would alleviate the pressure. The next resistance stands at 19.60, with a recovery above adding strength to the US Dollar.
USD/MXN daily chart
-
14:12
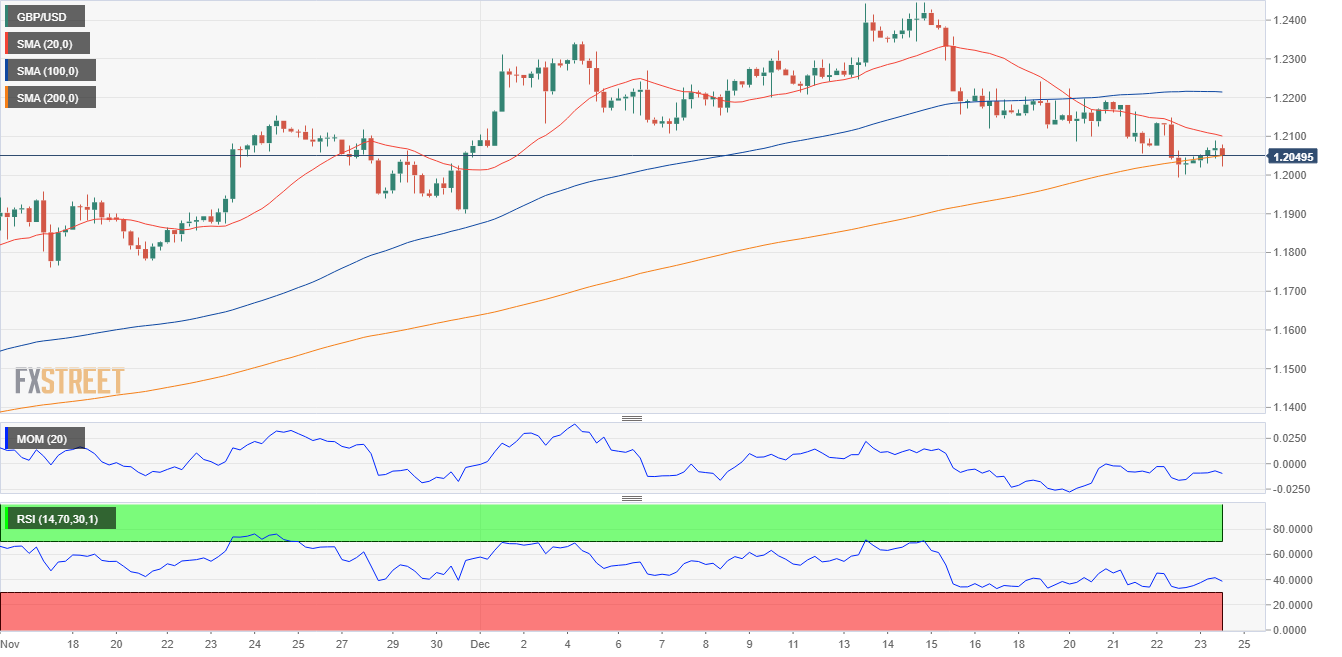
GBP/USD Price analysis: struggling to retain the green above 1.2000
- US PCE inflation eased as anticipated in November, Durable Goods Orders disappointed.
- GBP/USD is struggling to retain the 1.2000 mark as US Dollar demand increases.
- US Dollar demand increases ahead of the long weekend.
Following a short-lived slide to 1.2022, a fresh daily low, GBP/USD trimmed losses and flirted with daily highs. It currently trades in the 1.2040 price zone as speculative interest is still digesting mixed United States macroeconomic figures. On the one hand, the Personal Consumption Expenditures (PCE) Price Index rose by 5.5% YoY in November from 6.1% in October, further indicating easing inflationary pressures in the country.
On the other, Durable Goods Orders in the same month unexpectedly declined by a whopping 2.1% MoM, much worse than the 0.6% decline anticipated by market players. However, the core reading, Nondefense Capital Goods Orders ex Aircraft, rose 0.2%, better than the unchanged reading expected.
US Dollar initially appreciated with the news, then turned south, now rallying again on the back of fresh weekly highs in Treasury yields. The yield on the 10-year note jumped to 3.728%, its highest for December, while the -year note yield advanced to 4.327%. Yields held on to gains ahead of Wall Street’s opening, while US indexes are poised to open with modest gains, following the lead of their overseas counterparts.
Meanwhile, the British Pound remains weak after the latest macroeconomic releases confirmed the United Kingdom is suffering a recession that will likely extend well into 2023.
GBP/USD technical perspective
GBP/USD is little changed on a daily basis as winter holidays kicked in, limiting volumes. Technical readings in the daily chart hint at further declines ahead s the pair develops below a bearish 200 SMA after breaking below it on Thursday. Technical indicators, in the meantime, develop within negative levels, lacking evident directional strength but showing no signs of bearish exhaustion and far above oversold readings.
The weekly low at 1.1991 is the immediate near-term support level, en route to 1.1950. A daily close near the latter could anticipate a steeper decline next week. Sellers are adding shorts at around 1.2080, the immediate resistance level, followed by 1.2140.
-
14:01
Canada: Real GDP expands by 0.1% in October as expected
- Canadian economy expanded by 0.1% in October as expected.
- USD/CAD continues to trade in negative territory near 1.3600.
Real Gross Domestic Product of Canada grew by 0.1% on a monthly basis in October, Statistics Canada reported on Friday. This reading followed September's 0.2% growth and came in line with the market expectation.
"Advance information indicates that real GDP increased 0.1% in November," Statistics Canada added in its publication. "Increases in the utilities, wholesale, and finance and insurance sectors were partially offset by decreases in the construction, retail, and mining, quarrying, and oil and gas extraction sectors."
Market reaction
USD/CAD showed no immediate reaction to this report and was last seen trading near 1.3600, where it was down 0.35% on a daily basis.
-
14:00
Belgium Leading Indicator up to -13.6 in December from previous -16.6
-
13:46
EUR/USD maintains its bid tone above 1.0600, moves little post-US macro data
- EUR/USD sticks to its mildly positive tone and reacts little to the mixed US macro data.
- Hawkish Fed expectations continue to act as a tailwind for the USD and cap the upside.
- The recent range-bound price action warrants caution before placing directional bets.
The EUR/USD pair holds ccomfortably above the 1.0600 round-figure mark through the early North American session and moves little in reaction to the mixed US macro data.
The US Bureau of Economic Analysis reported that the Personal Consumption Expenditure (PCE) Price Index rose a modest 0.1% in November, missing expectations for a reading of 0.3%. The slight disappointment, however, was offset by an upward revision of the previous month's reading to 0.4% and the higher-than-anticipated yearly rate of 5.5%.
Additional details showed that the Core PCE Price Index (the Fed's preferred inflation gauge) climbed by 0.2% MoM in November and decelerated to a 4.7% YoY rate from 5.0% previous. Separately, the US Durable Goods Orders missed consensus estimates by a big margin and does little to impress the US Dollar bulls or provide any impetus to the EUR/USD pair.
That said, renewed speculations that the Fed will stick to its ultra-hawkish stance to tame inflation continue to act as a tailwind for the US Treasury bond yields. This should help limit any deeper USD losses and cap the upside for the EUR/USD pair. The mixed fundamental backdrop warrants some caution before placing fresh directional bets.
Even from a technical perspective, spot prices have been oscillating in a familiar trading band over the past week or so. This further points to indecision among traders, making it prudent to wait for a sustained move in either direction in order to confirm the near-term trajectory for the EUR/USD pair.
Technical levels to watch
-
13:38
US: Durable Goods Orders decline by 2.1% in November vs. -0.6% expected
- Durable Goods Orders in the US fell more than expected in November.
- US Dollar Index stays in daily range below 104.50 after the data.
Durable Goods Orders in the US declined by 2.1%, or $5.8 billion, in November to $270.6 billion, the US Census Bureau announced on Friday. This reading followed October's increase of 0.7% and came in worse than the market expectation for a decrease of 0.6%.
"Excluding transportation, new orders increased 0.2%," the publication further read. "Excluding defense, new orders decreased 2.6%. Transportation equipment, down following three consecutive monthly increases, drove the decrease, $6.1 billion or 6.3% to $91.3 billion."
Market reaction
The US Dollar Index failed to make a decisive move in either direction after this report and was last seen trading flat on the day at 104.38.
-
13:32
United States Personal Consumption Expenditures - Price Index (MoM) below expectations (0.3%) in November: Actual (0.1%)
-
13:32
United States Personal Consumption Expenditures - Price Index (YoY) above forecasts (5.3%) in November: Actual (5.5%)
-
13:31
Breaking: US annual Core PCE inflation declines to 4.7% in November as expected
Inflation in the US, as measured by the Personal Consumption Expenditures (PCE) Price Index, declined to 5.5% on a yearly basis in November from 6.1% in October, the US Bureau of Economic Analysis reported on Friday.
Developing story...
-
13:31
United States Core Personal Consumption Expenditures - Price Index (YoY) in line with expectations (4.7%) in November
-
13:31
United States Personal Spending registered at 0.1%, below expectations (0.2%) in November
-
13:31
United States Durable Goods Orders ex Transportation came in at 0.2%, above expectations (0%) in November
-
13:31
United States Core Personal Consumption Expenditures - Price Index (MoM) in line with forecasts (0.2%) in November
-
13:31
United States Personal Income (MoM) above expectations (0.2%) in November: Actual (0.4%)
-
13:31
United States Durable Goods Orders ex Defense below forecasts (0.1%) in November: Actual (-2.6%)
-
13:31
United States Durable Goods Orders registered at -2.1%, below expectations (-0.6%) in November
-
13:30
Canada Gross Domestic Product (MoM) in line with forecasts (0.1%) in September
-
12:56
November Core PCE will be the highlight – BBH
Analysts at BBH offer a brief preview of Friday's important US macro data, the Personal Consumption Expenditure (PCE) Price Index. The Fed's preferred inflation gauge - Core PCE Price Index - is expected to have decelerated to the 4.7% YoY rate in November from 5.0% in the previous month.
Key Quotes:
“Consensus sees 4.6% y/y vs. 5.0% in October. If so, it would be the second straight deceleration to the lowest since October 2021. That said, this drop is due in large part to high base effects from 2021 and the Fed’s 2% target still seems a long way off. Indeed, we have always felt that getting core PCE from nearly 6% down to 4% is the easy part; getting it from 4% to the 2% target is the hard part and that is where the pain comes in. Personal income and spending will be reported at the same time and are expected at 0.3% m/m and 0.2% m/m, respectively.”
-
12:40
When is the US November PCE Price Index and how could it affect EUR/USD?
US PCE Price Index Overview
Friday's US economic docket highlights the release of the Personal Consumption Expenditure (PCE) Price Index, scheduled later during the early North American session at 13:30 GMT. The gauge is foreseen to rise by 0.3% in November, matching the previous month's reading. The yearly rate is anticipated to have decelerated to 5.3% from 6% in October. Meanwhile, the Core PCE Price Index - the Fed's preferred inflation measure - likely eased to a 4.7% YoY rate in November from the 5% previous.
Analysts at TD Securities (TDS) offer a brief preview of the report and write: “We are looking for core PCE prices to have advanced at a consensus-matching 0.2% m/m pace for a second consecutive month in November (also matching the core CPI data). The y/y rate likely fell to 4.6% from 5.0% in October, suggesting prices continue to moderate but remain sticky at elevated levels.”
How Could it Affect EUR/USD?
Ahead of the key release, a recovery in the global risk sentiment prompts some selling around the safe-haven US Dollar and assists the EUR/USD pair to regain some positive traction. A softer inflation data could lift bets for a less aggressive policy tightening by the Fed. This should further boost investors' appetite for riskier assets and exerts additional downward pressure on the greenback.
Conversely, stronger PCE data might fuel speculations that the Fed will stick to its ultra-hawkish policy stance and push the US Treasury bond yields. This will be enough to trigger a fresh bout of a short-covering move around the US Dollar and attract aggressive selling around the EUR/USD pair. Nevertheless, the data is likely to infuse some volatility and provide meaningful impetus.
Eren Sengezer, Editor at FXStreet, outlines important technical levels to trade the EUR/USD pair: “The pair faces strong support at around 1.0580, where the Fibonacci 23.6% retracement of the latest uptrend and the 100-period Simple Moving Average (SMA) on the four-hour chart align. Below that level, 1.0530 (Fibonacci 38.2% retracement) could be seen as the next support before 1.0500.”
“On the upside, the pair could target 1.0680 (end-point of uptrend) and 1.0700 (psychological level) could be tested once EUR/USD rises above 1.0620 (20-period SMA, 50-period SMA) and confirms it as support,” Eren adds further.
Key Notes
• Pre-Christmas US Data Preview: Core PCE and Durable Goods may extend US Dollar retreat
• EUR/USD Forecast: Euro could test upper limit of weekly range after US data
• EUR/USD sticks to gains above 1.0600, lacks bullish conviction ahead of US PCE data
About the US PCE Price Index
The Personal Spending released by the Bureau of Economic Analysis, Department of Commerce is an indicator that measures the total expenditure by individuals. The level of spending can be used as an indicator of consumer optimism. It is also considered as a measure of economic growth: While Personal spending stimulates inflationary pressures, it could lead to raise interest rates. A high reading is positive (or Bullish) for the USD.
-
12:07
NZD/USD clings to gains near daily high, around 0.6300 mark ahead of US PCE data
- NZD/USD stages a goodish rebound from over a three-week low amid renewed USD selling bias.
- A modest recovery in the risk sentiment weighs on the buck and benefits the risk-sensitive Kiwi.
- Hawkish Fed expectations, rising US bond yields might help limit the USD losses and cap the pair.
- Investors might also refrain from placing aggressive bets and prefer to wait for the US PCE data.
The NZD/USD pair gains some positive traction on Friday and snaps a four-day losing streak to over a three-week low, around the 0.6230 area touched the previous day. The pair sticks to its intraday gains through the mid-European session and is currently hovering near the daily top, around the 0.6300 mark.
The US Dollar struggles to capitalize on the overnight positive move and meets with a fresh supply on the last day of the week, which, in turn, lends some support to the NZD/USD pair. A modest recovery in the global risk sentiment - as depicted by a positive tone around the equity markets - is seen weighing on the safe-haven buck and benefitting the perceived riskier Kiwi.
That said, looming recession risks, amid worried about a surge in new COVID-19 cases and geopolitical risks, could keep a lid on any optimism in the markets. Apart from this, reviving bets that the Fed will continue to hike interest rates to tame inflation, should act as a tailwind for the USD and cap any meaningful upside for the NZD/USD pair, at least for the time being.
The US GDP growth for the third quarter was revised higher and the Weekly Initial Jobless Claims rose less than expected during the week ended December 17. The upbeat US macro data points to a resilient economy and still-tight labour market. This, in turn, fuels speculations that the Fed will stick to its hawkish stance and pushes the US bond yields higher, which favours the USD bulls.
Traders, however, seem reluctant and prefer to wait on the sidelines ahead of Friday's release of the US Personal Consumption Expenditure (PCE) data. The Fed's preferred inflation gauge, the Core PCE Price Index will influence the US central bank's decision on future rate hikes and drive the USD demand. This, in turn, should provide a fresh directional impetus to the NZD/USD pair.
Technical levels to watch
-
12:05
Bank of England tightening expectations may need to adjust lower – BBH
Analysts at BBH think that the Bank of England tightening expectations may need to adjust lower.
Swaps market back to pricing in a peak policy rate near 4.75%
"The Office for National Statistics reported that 6 out of 10 surveyed are planning to cut spending during the holiday period by buying fewer and less expensive presents as well as by eating out less. The ONS survey ran through mid-December and also showed 18% had no savings to cushion the rising cost of living and 7% had missed a payment on a bill in the past month."
"Almost half have had difficulty heating their homes and a third have struggled with rising rents or mortgages. With little relief expected on the fiscal front, it’s shaping up to be a very difficult winter for UK households. In related news, a separate consumer survey showed nearly 2 mln UK households had failed to make at least one mortgage, rent, loan, credit card, or any other bill payment over the last month."
"Bank of England tightening expectations may need to adjust lower. WIRP suggests a 50 bp hike February 2 is about 75% priced in, with no odds of a larger 75 bp hike. The swaps market back to pricing in a peak policy rate near 4.75% vs. 4.5% right after last week’s BOE decision but still down sharply from 6.25% right after the mini-budget in late September."
-
12:01
Mexico Trade Balance s/a, $ increased to $0.666B in November from previous $-0.986B
-
12:01
Brazil Mid-month Inflation in line with expectations (0.52%) in December
-
12:00
Mexico Trade Balance, $ came in at $-0.096B, above expectations ($-1.374B) in November
-
10:57
Looking for US core PCE prices to advance at 0.2% m/m pace in November – TDS
Previewing the upcoming Personal Consumption Expenditures (PCE) Price Index data from the US, TD Securities analysts said that they expect the core PCE inflation to advance at a monthly pace of 0.2% in November as expected.
Real goods spending remains above its pre-Covid level
"The y/y rate likely fell to 4.6% from 5.0% in October, suggesting prices continue to moderate but remain sticky at elevated levels."
"Separately, personal spending is expected to rise a firm 0.3% m/m (consensus: 0.2%) after the solid 0.7% m/m pace registered, on average, over Aug-Oct. The details of the report will be very important, particularly the breakdown between goods and services spending. Note that, despite slowing, real goods spending remains above its pre-Covid level.
-
10:39
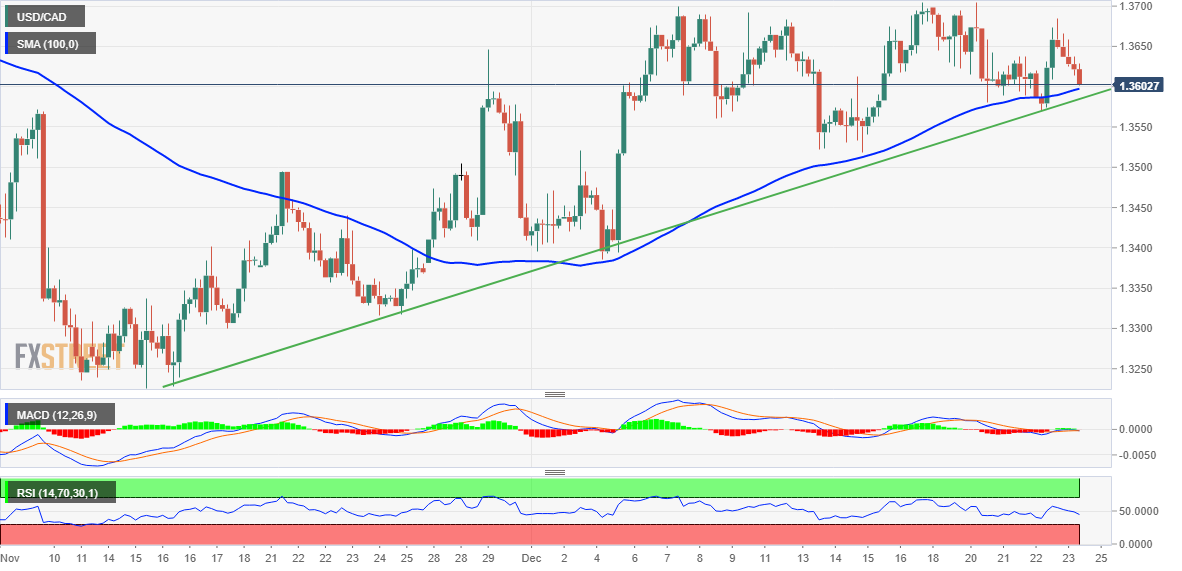
USD/CAD Price Analysis: Drops back closer to 100-period SMA/ascending trend-line confluence
- USD/CAD meets with a fresh supply on Friday and is pressured by a combination of factors.
- A break below the 1.3600-1.3590 confluence support will pave the way for deeper losses.
- Investors now look to the monthly Canadian GDP and the US PCE data for a fresh impetus.
The USD/CAD pair comes under some renewed selling pressure on the last day of the week and continues losing ground through the first half of the European session. The pair drops to the 1.3600 mark, or a fresh daily low in the last hour, and is pressured by a combination of factors.
A modest recovery in the equity markets is seen weighing on the safe-haven US Dollar. Apart from this, bullish crude oil prices underpin the commodity-linked Loonie and exert some downward pressure on the USD/CAD pair. Traders now look to the monthly Canadian GDP report and the US US Personal Consumption Expenditure (PCE) data for a fresh impetus later during the early North American session.
From a technical perspective, the USD/CAD pair is currently hovering just above confluence support, comprising the 100-period SMA on the 4-hour chart and a six-week-old ascending trend-line. Given that oscillators on hourly charts have been drifting lower in bearish territory and losing traction on the daily chart, a convincing break below will be seen as a fresh trigger for bearish trades.
Some follow-through selling below the weekly low, around the 1.3570 region touched on Thursday, will reaffirm the negative bias and make the USD/CAD pair vulnerable. Spot prices could then accelerate the fall towards testing the 1.3500 psychological mark. The downward trajectory could get extended towards the 1.3455-1.3450 intermediate support en route to the 1.3400 round figure (100-day SMA).
On the flip side, the 1.3650 area now seems to act as an immediate resistance. A sustained move above could allow the USD/CAD pair to make a fresh attempt to conquer the 1.3700 mark. Some follow-through buying will be seen as a fresh bullish breakout and lift spot prices towards the 1.3745-1.3750 hurdle en route to the November monthly swing high, around the 1.3800-1.3810 region.
USD/CAD 4-hour chart
Key levels to watch
-
10:30
Belgium Consumer Price Index (MoM) fell from previous 0.23% to 0.16% in December
-
10:30
Belgium Consumer Price Index (YoY): 10.35% (December) vs previous 10.63%
-
09:57
Australia's credit growth another sign of caution – ANZ
Adelaide Timbrell, Senior Economist at ANZ Bank offers a brief analysis of Australia's credit growth and forecasts a sharper slowdown in economic growth through 2023.
Key Quotes:
“Private sector credit grew 0.5% m/m in November, in line with market expectations. This is yet another sign of caution in the economy as higher interest rates and inflation bite for both households and businesses. Our new forecasts show a sharper slowdown in economic growth through 2023.”
“Housing credit grew just 0.4% m/m in November, the same as in October but lower than the 0.5% m/m average in Q3 and 0.6% m/m average in Q2. Falling housing prices off the back of reduced borrowing capacity is behind this.”
“Business credit slowed to 0.7% m/m in November versus 0.8% m/m in October and an average of 1.3% m/m in Q3. With higher interest rates, it’s unlikely that this is due to businesses paying down debt faster and implies caution in new lending flows.”
“Personal credit grew 0.2% m/m, which doesn’t change our view on household spending appetite. ANZ-observed spending to 18 December shows a sluggish spending pulse leading up to the Christmas peak.”
-
09:47
Canada GDP to outperform flash estimates and rise 0.1% in October – TDS
Strategists at TD Securities (TDS) offer a brief preview of the monthly Canadian GDP report, which is scheduled later during the early North American session and expected to show that the economy grew by a modest 0.1% in October.
Key Quotes:
“We look for GDP to outperform flash estimates with a 0.1% print in October. Services should drive the headline print as the goods sector is weighed down by a drag from natural resources and muted performance for manufacturing. While the recent trend for GDP looks considerably stronger after Q3 revisions, we expect flash estimates to be more downbeat as momentum wanes into 2023.”
-
09:41
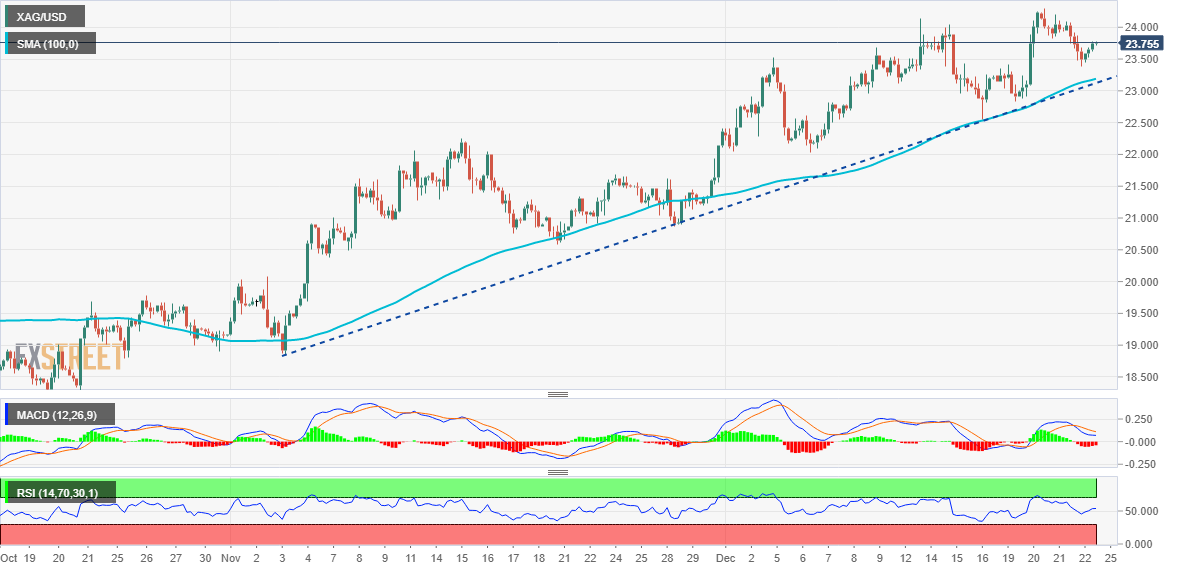
Silver Price Analysis: XAG/USD sits near daily high, seems poised to appreciate further
- Silver regains positive traction on Friday and stalls this week’s pullback from a multi-month top.
- The technical setup favours bullish traders and supports prospects for additional intraday gains.
- A convincing break below the $23.15 confluence support is needed to negate the positive bias.
Silver catches fresh bids on Friday and snaps a two-day losing streak, stalling this week's retracement slide from an eight-month high. The white metal maintains its bid tone through the first half of the European session and is currently placed near the daily high, around the $23.75 zone.
From a technical perspective, the emergence of some buying near the $23.40-$23.35 horizontal resistance breakpoint, now turned support, favours bullish traders. The constrictive setup is reinforced by the fact that oscillators on the daily chart maintain their positive bias and have again started gaining traction on the 4-hour chart.
Hence, a subsequent strength, back towards reclaiming the $24.00 mark, remains a distinct possibility. The next relevant hurdle is pegged near the multi-month top, near the $24.30 area touched on Wednesday, which if cleared should lift the XAG/USD towards the $25.00 psychological mark with some intermediate hurdle near the $24.60-$24.70 zone.
On the flip side, the $24.40-$24.35 resistance-turned-support, also the daily low, should protect the immediate downside ahead of the $24.15 confluence support. The latter comprises the 100-period SMA on the 4-hour chart and an ascending trend line extending from November low, which, in turn, should act as a strong base for the XAG/USD.
A convincing breakthrough, leading to a subsequent slide below the $23.00 round figure, will negate the positive outlook and shift the bias in favour of bearish traders. The XAG/USD might then turn vulnerable and accelerate the fall towards testing the $22.00 round-figure mark with some intermediate support near the $22.55-$22.50 horizontal zone.
Silver 4-hour chart
Key levels to watch
-
09:31
Japan's Suzuki: See no change to BoJ's monetary policy
Japanese Finance Minister Shunichi Suzuki said on Friday that the monetary policy is up to the Bank of Japan (BoJ) to decide but added that he doesn't see any changes to the BoJ's policy, as reported by Reuters.
Key takeaways
"Won't hesitate to mobilise fiscal spending to protect people's livelihoods."
"I am aware of the fact that Japan's fiscal situation is severe."
"Will stick to the aim of achieving a primary budget surplus by the fiscal year 2025."
"Will strive to achieve fiscal reform to maintain market confidence in japan's public finances."
"Will make sure to use construction bonds for defense vessels, not to loosen the grip on fiscal discipline."
Market reaction
USD/JPY showed no immediate reaction to these comments and was last seen rising 0.28% on the day at 132.70.
-
09:25
Forwards now price 30bp of tightening by BOJ in 2023 – Societe Generale
Reviewing the final full trading week of 2022, Societe Generale analysts noted that forward markets are pricing in 30 basis points rate hikes by the Bank of Japan (BoJ) in 2023 following the policy tweak announced earlier in the week.
BoJ’s pivot is another bearish omen for bond market in January
"The announcement thrashed Bunds and did not leave Treasury yields unscathed, as investors consider the wider ramifications of higher JGB yields for the investment allocation of the Japanese pension and life insurance industry, among the world’s biggest buyers of fixed income securities."
"Having increased foreign investment mandates in recent years to enhance returns, domestic accounts may be inclined to repatriate some of their holdings to Japan, boosting overseas bond yields, inhibiting the flattening impulse from the hawkish Fed and ECB and lifting the JPY."
"The BoJ insisted the widening of the band does not mark a change in policy bias, but markets read it differently. Forwards now price 30bp of tightening by the central bank in 2023. Speculation of a wider ranging policy review has intensified for when Governor Kuroda steps down in March. The BoJ’s pivot is another bearish omen for the bond market in January when debt issuance traditionally speeds up. US primary dealers estimate a whopping $35-40bn could be issued by corporations in the first week of January alone."
-
09:02
GBP/USD trades with modest gains around mid-1.2000s, eyes US PCE for fresh impetus
- GBP/USD attracts some buying on the last day of the week amid a modest USD weakness.
- A positive risk tone weighs on the buck, though hawkish Fed expectations help limit losses.
- Investors now look to the US PCE data to determine the near-term trajectory for the major.
The GBP/USD pair gains some positive traction on the last day of the week and snaps a two-day losing streak to over a three-week low touched on Thursday. Spot prices stick to intraday gains, around the 1.2055-1.2060 area through the first half of the European session, though struggle to move back above the very important 200-day SMA.
The US Dollar comes under some renewed selling pressure and turns out to be a key factor pushing the GBP/USD pair higher. A modest recovery in the equity markets is seen undermining the safe-haven buck, though looming recession risks could help limit the downside. Apart from this, speculations that the Fed will stick to its policy-tightening cycle support prospects for the emergence of some dip-buying around the USD.
Worries about the economic headwinds stemming from a surge in new COVID-19 cases in China, along with geopolitical risk, might keep a lid on any optimism in the markets. In fact, Russia said on Wednesday that the continued arms supplies by Western allies to Ukraine would lead to a deepening of the ongoing conflict. Furthermore, North Korea reportedly fired a ballistic missile towards the sea off its east coast on Friday.
Meanwhile, the upbeat US macro data released on Thursday pointed to a still-tight labour market and resilient economy. This could allow the Federal Reserve to continue raising borrowing costs to tame inflation, which acts as a tailwind for the US Treasury bond yields. The USD bulls, however, prefer to wait for the release of the US Personal Consumption Expenditure (PCE) data later during the early North American session.
The Core PCE Price Index, the Fed's preferred inflation gauge, will provide fresh cues on inflation and influence the US central bank's rate-hike path. This, in turn, will play a key role in driving the USD demand in the near term and help investors to determine the next leg of a directional move for the GBP/USD pair.
Technical levels to watch
-
09:00
Italy Consumer Confidence came in at 102.5, above forecasts (94) in December
-
09:00
Italy Business Confidence registered at 101.4, below expectations (101.5) in December
-
08:21
EUR/USD sticks to gains above 1.0600, lacks bullish conviction ahead of US PCE data
- EUR/USD regains some positive traction on Friday amid the emergence of fresh USD selling.
- A modest recovery in the risk sentiment is seen undermining demand for the safe-haven buck.
- Hawkish Fed expectations to limit the USD losses and cap the pair ahead of the US PCE data.
The EUR/USD pair continues to show some resilience below the 1.0600 mark and attracts some dip-buying on the last trading day of the week. Spot prices move away from over a one-week low touched on Thursday and climb to the 1.0620-1.0625 area, a fresh daily high during the early European session.
The US Dollar struggles to capitalize on the previous day's upbeat US macro data-inspired intraday move up and meets with a fresh supply on Friday. A modest recovery in the US equity futures undermines the safe-haven buck, which, in turn, is seen lending support to the EUR/USD pair. That said, a combination of factors should help limit any deeper USD losses and cap the upside for the major, at least for the time being.
Investors remain worried about the economic headwinds stemming from a surge in COVID-19 cases in China. Apart from this, geopolitical risks have been fueling recession fears, which could drive some haven flows towards the greenback. In fact, Russia said on Wednesday that there is no chance of peace talks and that the continued arms supplies by Western allies to Ukraine would lead to a deepening of the ongoing conflict.
Furthermore, North Korea reportedly fired a ballistic missile towards the sea off its east coast on Friday. This, along with renewed speculations that the Fed will stick to its ultra-hawkish policy stance to tame inflation, favours the USD bulls and warrants caution before placing bullish bets around the EUR/USD pair. In fact, the upbeat US macroeconomic data released on Thursday lift bets for higher rates for a longer period.
The aforementioned fundamental backdrop, along with the range-bound price action witnessed over the past week or so, should hold back traders from positioning for a firm near-term direction. Investors might also prefer to wait for the US Core PCE Price Index, the Fed's preferred inflation gauge, due later during the early North American session.
Technical levels to watch
-
08:18
Turkey Foreign Arrivals increased to 44.6% in November from previous 38.4%
-
08:04
Spain Gross Domestic Product (YoY) above expectations (3.8%) in 3Q: Actual (4.4%)
-
08:04
Spain Gross Domestic Product (QoQ) below forecasts (0.2%) in 3Q: Actual (0.1%)
-
08:01
Spain Gross Domestic Product (YoY) in line with expectations (3.8%) in 3Q
-
08:01
Spain Gross Domestic Product (QoQ) in line with forecasts (0.2%) in 3Q
-
07:52
FX option expiries for Dec 23 NY cut
FX option expiries for Dec 23 NY cut at 10:00 Eastern Time, via DTCC, can be found below.
- EUR/USD: EUR amounts
- 1.0500 1.2b
- 1.0625 257m
- 11.0800 1.04b
- USD/JPY: USD amounts
- 133.25 200m
- 135.00 1.71b
- 136.00-05 276m
- USD/CHF: USD amounts
- 0.9105 247m
- 0.9240 582m
- EUR/CHF: EUR amounts
- 0.9300 570m
- 0.9900 582m
- GBP/USD: GBP amounts
- 1.2000 400m
- 1.2400 202m
- AUD/USD: AUD amounts
- 0.6480 293m
- 0.6655 499m
- USD/CAD: USD amounts
- 1.3500-10 314m
- 1.3570 260m
- 1.3665-75 578m
-
07:45
France Producer Prices (MoM) registered at 1.2%, below expectations (2.4%) in November
-
07:25
USD/JPY consolidates in a range around mid-132.00s, eyes US PCE data for fresh impetus
- USD/JPY struggles for a firm intraday direction and seesaws between tepid gains/minor losses.
- A positive risk tone, widening US-Japan rate differential undermine the JPY and offer support.
- Bulls, however, seem reluctant and prefer to wait for the US PCE data before placing fresh bets.
The USD/JPY pair builds on the previous day's rebound from the 131.65 area and touches a three-day high on Friday, though lacks bullish conviction. The pair manages to hold steady around mid-132.00s through the early European session as traders keenly await the US Personal Consumption Expenditure (PCE) data before placing fresh directional bets.
The Fed's preferred inflation gauge, the Core PCE Price Index is due for release later during the early North American session and will provide fresh cues on inflationary pressures. This, in turn, should play a key role in influencing the next policy move by the Fed and help determine the next leg of a directional move for the US Dollar. Heading into the key data risk, investors prefer to wait on the sidelines, leading to subdued range-bound price action around the USD/JPY pair.
The downside, meanwhile, remains cushioned amid a recovery in the global risk sentiment, which tends to undermine the safe-haven Japanese Yen. Apart from this, a further rise in the US Treasury bond yields, bolstered by reviving bets for a more aggressive policy tightening by the Fed, acts as a tailwind for the USD and lends some support to the USD/JPY pair. Against the backdrop of a more hawkish commentary by the Fed last week, the upbeat US macro data released on Thursday fueled speculations that the US central bank will have to stick to its hawkish stance to tame inflation.
This, in turn, pushes the yield on the benchmark 10-year US government bond closer to the monthly top. The resultant widening of the US-Japan rate differential could contribute to driving flows away from the JPY and supports prospects for some meaningful upside for the USD/JPY pair. That said, the Bank of Japan's recent policy tweak, widening the range for fluctuations in the 10-year government bond yield, benefits the JPY and warrants caution for bullish traders. Hence, it will be prudent to wait for strong follow-through buying before confirming that spot prices have bottomed out.
Technical levels to watch
-
07:04
USD/INR Price News: Indian Rupee traces upbeat options market sentiment near 83.00
USD/INR retreats from the seven-week high as Indian Rupee (INR) sellers take a breather ahead of the key United States data on early Friday. That said, the quote prints mild losses near 82.85 by the press time, despite staying firmer for the third consecutive week.
In doing so, the USD/INR pair takes clues from the options market as the one-month risk reversal (RR) of the USD/INR, a measure of the spread between call and put prices, prints the biggest daily number in one week. Additionally portraying the USD/INR options market optimism is the upbeat print of weekly RR, following the negative marks of the previous week. In both cases the risk reversal figure is 0.035.
It’s worth noting that the USD/INR pair’s latest pullback could be linked to the optimism surrounding China’s pro-growth policies. However, the Sino-American tussles contradict the move and challenge the pair sellers.
Further, a lack of momentum in the bond markets seems to restrict immediate USD/INR moves as traders await the US Core Personal Consumption Expenditure (PCE) - Price Index and Durable Goods Orders for November ahead of a holiday-shortened final week of 2022.
Also read: Pre-Christmas US Data Preview: Core PCE and Durable Goods may extend US Dollar retreat
-
07:02
Denmark Gross Domestic Product (QoQ): 0.3% (3Q) vs previous 0.5%
-
07:02
Denmark Gross Domestic Product (YoY) dipped from previous 3.4% to 3.2% in 3Q
-
07:00
Denmark Retail Sales (YoY): -7.3% (November) vs -10.3%
-
07:00
Norway Credit Indicator came in at 5.4%, above expectations (5.2%) in November
-
06:56
AUD/USD climbs back closer to 0.6700 mark amid softer USD, positive risk tone
- AUD/USD regains some positive traction on Friday amid a modest USD weakness.
- A positive risk tone undermines the buck and benefits the risk-sensitive Aussie.
- Hawkish Fed expectations, rising US bond yields should limit deeper USD losses.
- Traders might also prefer to wait for the US PCE data before placing fresh bets.
The AUD/USD pair attracts fresh buying near the 100-day SMA on Friday and stalls the previous day's retracement slide from a one-week high. The pair sticks to its intraday gains through the early European session and is currently placed near the daily high, just below the 0.6700 mark.
A modest recovery in the US equity futures prompts some selling around the safe-haven US Dollar, which, in turn, is seen lending some support to the AUD/USD pair. That said, worries about economic headwinds stemming from a surge in new COVID-19 cases in China should keep a lid on any optimism in the markets and the risk-sensitive Aussie. Apart from this, renewed fears that the Fed will retain its hawkish stance to tame inflation should limit the USD losses and contribute to capping the major.
Against the backdrop of a more hawkish commentary by the Fed last week, the upbeat US economic data released on Thursday revived bets for a more aggressive policy tightening by the US central bank. In fact, the US GDP growth for the third quarter showed that the economy expanded by 3.2%, faster than the 2.9% estimated. Moreover, the Initial Weekly Jobless Claims increased less than expected during the week ended December 17, pointing to a still-tight labour market and resilient US economy.
This, in turn, continues to push the US Treasury bond yields higher and supports prospects for the emergence of some dip-buying around the USD. Traders might also prefer to wait on the sidelines ahead of Friday's release of the US Core PCE Price Index - the Fed's preferred inflation gauge, due later during the early North American session. Hence, it will be prudent to wait for strong follow-through buying before positioning for any further intraday appreciating move for the AUD/USD pair.
Technical levels to watch
-
06:52
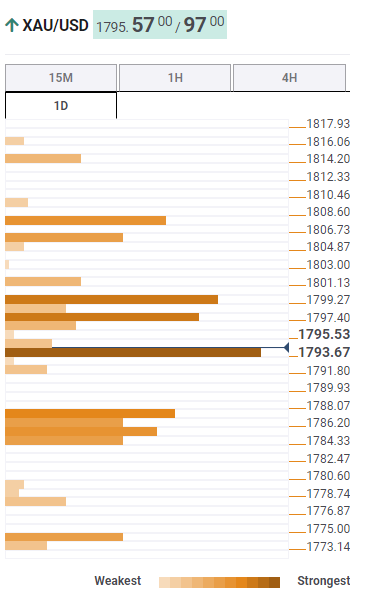
Gold Price Forecast: XAU/USD bears lurk behind $1,790 amid holiday season – Confluence Detector
- Gold price struggles for clear directions as mixed sentiment joins year-end holiday season.
- Firmer US GDP renewed hawkish Fed bets but Core PCE Inflation, Durable Goods Orders eyed for clear directions.
- China defends XAU/USD buyers ahead of the holiday-shortened week.
- Gold clings to key short-term support near $1,800 amid sluggish Treasury bond yields.
Gold price (XAU/USD) remains mildly bid as bears take a breather after a two-day downtrend. Even so, mixed catalysts challenge the metal buyers in consolidation the biggest daily fall in over a week.
That said, optimism surrounding China’s pro-growth policies and the Sino-American tussles contradict of late. However, a lack of momentum in the bond markets seems to restrict immediate XAU/USD moves as traders await the US Core Personal Consumption Expenditure (PCE) - Price Index and Durable Goods Orders for November ahead of a holiday-shortened final week of 2022.
The cautious sentiment could also be linked to the recently firmer US GDP and CB Consumer Confidence figures that renewed hawkish Fed bets. However, the US central bank hasn’t been too convincing for the XAU/USD bulls in its latest monetary policy meeting. As a result, firmer prints of the scheduled data become necessary to recall the Gold sellers.
Also read: Gold Price Annual Forecast: Will 2023 be the year Gold shines?
Gold Price: Key levels to watch
The Technical Confluence Detector shows that the gold price floats above the strong support area surrounding $1,793 which includes Fibonacci 23.6% on daily and 38.2% on weekly formation, not to forget 100-SMA on 4H and the 10-HMA.
In a case where the XAU/USD price slips beneath the $1,793 support, the previous monthly high near $1,788 could probe the bears.
Following that, Fibonacci 23.6% on weekly and middle band of the Bollinger on the 1D, around $1,785, could act as an extra downside filter.
It’s worth noting that the Gold price weakness past $1,785 won’t hesitate to slump toward the previous weekly low near $1,775.
On the flip side, a convergence of the Fibonacci 38.2% on daily and 200-HMA could test the Gold buyers near $1,800.
Also acting as an upside filter is the Fibonacci 61.8% on daily and middle band of the Bollinger on 4H, close to $1,808, as well as the Pivot Point one-day R1 near $1,815.
Here is how it looks on the tool
About Technical Confluences Detector
The TCD (Technical Confluences Detector) is a tool to locate and point out those price levels where there is a congestion of indicators, moving averages, Fibonacci levels, Pivot Points, etc. If you are a short-term trader, you will find entry points for counter-trend strategies and hunt a few points at a time. If you are a medium-to-long-term trader, this tool will allow you to know in advance the price levels where a medium-to-long-term trend may stop and rest, where to unwind positions, or where to increase your position size.
-
06:49
Forex Today: US PCE inflation data eyed ahead of long weekend
Here is what you need to know on Friday, December 23:
Markets stay relatively calm early Friday as trading conditions remain subdued heading into the Christmas holiday. Germany's Bundesbank will release its monthly report during the European trading hours. In the second half of the day, the US Bureau of Economic Analysis (BEA) will publish the Personal Consumption Expenditures (PCE) Price Index, the Federal Reserve's preferred gauge of inflation, data for November. The University of Michigan's final revision to the December Consumer Confidence Index, November New Home Sales and Durable Goods data will also be featured in the US economic docket before the long weekend. Stock markets in the US will operate at usual hours but bond markets will close one hour earlier than usual. Both markets will be closed on Monday, December 26.
Pre-Christmas US Data Preview: Core PCE and Durable Goods may extend US Dollar retreat.
On Thursday, the BEA revised the annualized Gross Domestic Product growth for the third quarter to 3.2% from 2.9% in the previous estimate. The upbeat data helped the US Dollar gather strength against its rivals in the American session. Additionally, Wall Street's main indexes suffered heavy losses, helping the currency hold its ground as a safe haven. After having closed modestly higher on Thursday, the US Dollar Index moves sideways slightly below 104.50 in the European morning. The 10-year US Treasury bond yield extends its sideways grind at around 3.7% and US stock index futures trade little changed on the day.
EUR/USD registered small daily losses on Thursday but seems to have steadied slightly above 1.0600 early Friday.
GBP/USD dropped to its lowest level in more than three weeks below 1.2000 on Thursday as the risk-averse market environment weighed heavily on Pound Sterling. Following a late recovery, the pair managed to settle above 1.2000 on Friday.
USD/JPY closed virtually unchanged on Thursday near 132.50. The data from Japan showed earlier in the day that the National Consumer Price Index (CPI) in November edged higher to 3.8% in November, compared to the market expectation of 3.7%. This print, however, failed to trigger a noticeable reaction and the pair was last seen trading modestly higher on the day at 132.70.
Gold price declined sharply on Thursday on upbeat US growth data and closed below $1,800. XAU/USD recovers modestly early Friday but continues to trade below $1,800 for the time being.
Bitcoin struggles to find direction as it continues to move up and down in a narrow channel slightly below $17,000. Ethereum trades near $1,200 for the third straight day on Friday.
-
06:16
US Dollar Index: DXY portrays pre-data anxiety ahead of United States Core PCE Inflation
- US Dollar Index pauses two-day recovery amid sluggish markets.
- China flashes mixed signals but lackluster United States Treasury bond yields underpin cautious optimism, weigh on DXY.
- Firmer US data, President Joe Biden’s urge to tame inflation keeps US Dollar Index buyers hopeful.
- Firmer prints of Federal Reserve’s preferred inflation gauge, namely US Core PCE Price Index, needed to recall DXY bulls.
US Dollar Index (DXY) treads water around 104.40 as buyers and sellers jostle ahead of the key United States economics during early Friday. In doing so, the greenback’s gauge versus the six major currencies pauses the previous two-day uptrend amid mixed catalysts.
Bullish United States data underpin US Dollar Index run-up
On Thursday, the DXY witnessed notable gains while extending the previous day’s rebound as the United States economy expanded at an annualized rate of 3.2% in the third quarter (Q3), per the final readings of the Gross Domestic Product (GDP), versus 2.9% previous estimates. Further, the Personal Consumption Expenditure (PCE) Prices match 4.3% QoQ estimations during Q3 2022 whereas the Core PCE improved to 4.7% QoQ versus 4.6% market forecasts.
Before that, the US Conference Board’s (CB) Consumer Confidence jumped to the eight-month high of 108.3 for December, compared to the market forecasts of 101.0 and the revised prior readings of 101.40.
Hence, upbeat prints of the recently firmer US data have already renewed the DXY buying even if the greenback’s gauge versus the six major currencies struggle of late.
China probes DXY
Given the US Dollar’s safe-haven demand, the recently mixed headlines from China test the US Dollar Index traders. Recently, China's Foreign Minister Wang Yi warned US Secretary of State Antony Blinken on Friday, per Reuters, while saying that the US should not continue the 'old routine of unilateral bullying'.
On the other hand, optimism over China’s pro-growth policies and the People’s Bank of China’s (PBOC) biggest weekly cash injection in two months seemed to have favored the mildly positive sentiment previously. On the same line were the chatters surrounding Evergrande’s nearness to an offshore debt restructuring plan.
Federal Reserve’s mixed messages highlight United States Core PCE Price Index
During the last monetary policy meeting, the US Federal Reserve (Fed) failed to convince markets of its hawkish nature despite propelling the rate guidance. As a result, today’s United States Core Personal Consumption Expenditure (PCE) - Price Index, also known as the Federal Reserve’s preferred inflation gauge, becomes important to watch for the US Dollar Index traders. Additionally, the monthly Durable Goods Orders for November will also offer the one last shot of market activity before witnessing the holiday-linked inaction. Forecasts suggest that the US Core PCE Price Index remains unchanged at 0.2% MoM for November. However, the Annualized forecasts suggest softer figures of 4.7% YoY versus 5.0% previous readings. Further, US Durable Goods Orders could register a contraction of 0.6% in November compared to the previous increase of 1.1% (revised from 1.0%).
Should the scheduled data print firmer readings, the hopes of the Fed’s higher rates for a longer time can recall the US Dollar Index buyers.
US Dollar Index technical analysis
US Dollar Index seesaws around the 78.6% Fibonacci retracement level of the gauge’s May-September upside. That said, the recent rebound in the Relative Strength Index (RSI), located at 14, backed the quote’s recovery moves in the last two days, suggesting the strength of the bullish momentum, which in turn favors buyers.
However, a convergence of the 21-DMA and a one-month-old descending trend line, around 105.05, guards the quote’s immediate upside.
Following that, a run-up towards the 200-DMA and the 61.8% Fibonacci retracement, also known as the “Golden ratio”, could challenge the DXY bulls near 106.45.
If at all the US Dollar Index rises past 106.45, the bulls are likely to retake control and can aim for the 108.00 resistance confluence including the late November swing high and 50% Fibonacci retracement level.
Alternatively, a daily closing below the 78.6% Fibonacci retracement level of 104.23 could drag the DXY toward an ascending support line from May, near 103.55 by the press time.
It’s worth noting that the US Dollar’s gauge versus the six major currencies will become vulnerable to testing May’s low of 101.30 in case the bears keep the reins past 103.55.
Overall, DXY stays on the buyer’s radar unless the quote breaks 103.55.
US Dollar Index: Daily chart

Trend: Recovery expected
-
05:58
USD/CAD remains depressed below mid-1.3600s amid softer USD, downside seems limited
- USD/CAD comes under some renewed selling pressure on Friday amid a modest USD downtick.
- A recovery in global risk sentiment is seen weighing the safe-haven buck and exerting pressure.
- Hawkish Fed expectations should limit the USD fall and lend support ahead of the US PCE data.
The USD/CAD pair struggles to capitalize on the previous day's goodish rebound from a one-week low and meets with a fresh supply on Friday. The pair remains depressed heading into the European session and is currently placed near the lower end of its daily range, around the 1.3630-1.3625 region.
A modest recovery in the US equity futures prompts some selling around the safe-haven US Dollar, which, in turn, is seen as a key factor weighing on the USD/CAD pair. The USD downtick, however, is likely to remain limited amid reviving bets for a more aggressive policy tightening by the Fed, bolstered by the upbeat US macro data released on Thursday.
In fact, the US GDP growth for the third quarter was revised higher to show that the economy expanded by 3.2%, faster than the 2.9% estimated previously. Adding to this, the number of Americans filing new claims for unemployment-related benefits increased less than expected during the week ended December 17, pointing to a still-tight labour market.
The resilient US economy could allow the Fed to continue raising borrowing costs, which, in turn, continues to act as a tailwind for the US Treasury bond yields and favours the USD bulls. Meanwhile, subdued action around crude oil prices fails to provide any impetus to the commodity-linked Loonie and could further lend support to the USD/CAD pair.
Traders, however, might refrain from placing aggressive bets and prefer to wait on the sidelines ahead of Friday's release of the US Personal Consumption Expenditure (PCE) data. The Core PCE Price Index - the Fed's preferred inflation gauge - will be looked upon for fresh cues on inflation and influence the US central bank's decision on future rate hikes.
This, in turn, will play a key role in driving the USD demand in the near term and provide some meaningful impetus to the USD/CAD pair on the last day of the week. Apart from this, oil price dynamics should further contribute to producing short-term trading opportunities around the major.
Technical levels to watch
-
05:30
Netherlands, The Gross Domestic Product s.a (QoQ) meets forecasts (-0.2%) in 3Q
-
05:30
Netherlands, The Gross Domestic Product n.s.a (YoY) in line with forecasts (3.1%) in 3Q
-
05:25
Senior Chinese Diplomat Wang: US should not continue 'old routine of unilateral bullying'
Senior Chinese Diplomat Wang: US should not continue 'old routine of unilateral bullying'
-
05:20
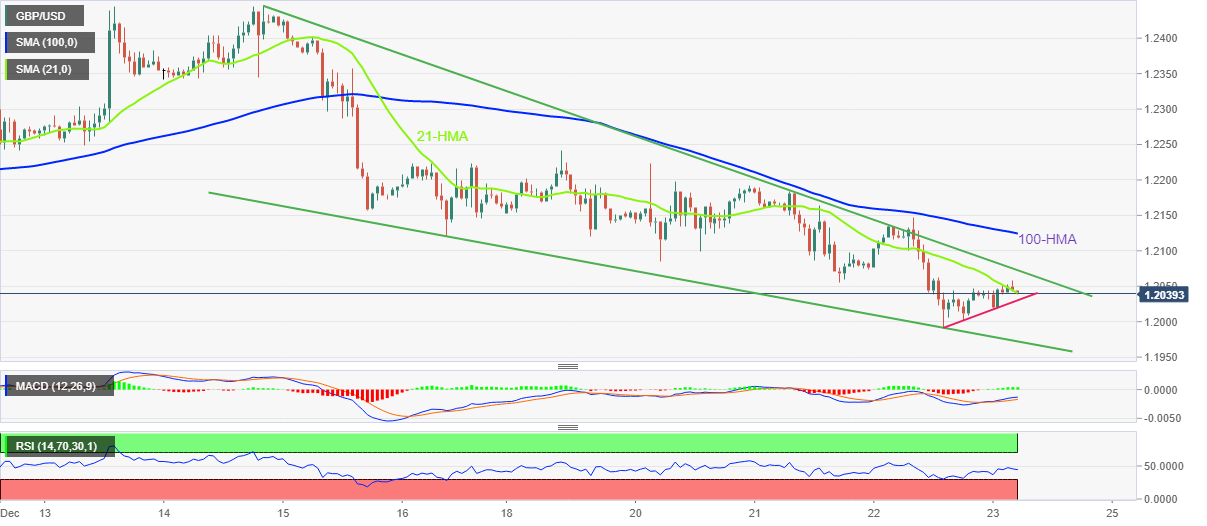
GBP/USD Price Analysis: Retreats from 21-HMA inside weekly falling wedge
- GBP/USD struggles to defend the bounce off monthly low inside bullish chart formation.
- Bullish MACD signals, immediate support line keep buyers hopeful.
- 100-HMA adds to the upside filters before giving control to bulls.
GBP/USD steps back from intraday high of 1.2058 heading into Friday’s London open. In doing so, the Cable pair fails to defend the first daily gains in three inside a one-week-old bullish chart formation, namely falling wedge.
That said, the quote’s pullback could also be linked to a retreat from the 21-HMA, around 1.2045 by the press time. It’s worth noting that the weakness in prices also takes clues from the RSI’s lower-high formation.
However, the bullish MACD signals and an ascending support line from Thursday, near 1.2030, restrict the GBP/USD pair’s immediate downside.
Also acting as the short-term key support is the 1.2000 psychological magnet and the stated wedge’s lower line, close to 1.1970.
In a case where GBP/USD remains bearish past 1.1970, July’s low near 1.1760 will gain the market’s attention.
On the contrary, an upside break of the wedge’s top line, at 1.2075 by the press time, could confirm the bullish chart formation that marks a theoretical target of 1.2530.
Though, the 100-HMA level of 1.2125 and the monthly high near 1.2446 could act as buffers during the quote’s run-up beyond 1.2075.
GBP/USD: Hourly chart
Trend: Limited recovery expected
-
05:01
Singapore Industrial Production (MoM) in line with expectations (-1.2%) in November
-
05:00
Singapore Consumer Price Index (YoY) above expectations (6.45) in November: Actual (6.7)
-
05:00
Singapore Industrial Production (YoY) registered at -3.2%, below expectations (-1.1%) in November
-
04:08
Russia’s Novak: We may cut Oil output by 5-7% in early 2023 as it responds to Western price caps
Russian Deputy Prime Minister Alexander Novak said on Friday, “Russia may cut oil output by 5-7% in early 2023 as it responds to western price caps.”
“Russia may cut Oil output by 500,000-700,000 barrels per day,” reported TASS.
Earlier in the day, Reuters unveiled hopes of a cut in Russian Russia's Baltic oil exports and triggered the rebound in the WTI crude oil prices. “Russia's Baltic oil exports could fall by 20% in December from the previous month after the European Union and G7 nations imposed sanctions and a price cap on Russian crude from Dec. 5, according to traders and Reuters calculation,” said the news.
Also underpinning the WTI crude oil rebound could be the risk-positive headlines from China, as well as the US Dollar’s retreat ahead of the key data.
That said, the WTI crude oil prints mild gains around $78.30 after reversing from a three-week high the previous day.
Also read: WTI Price Analysis: Bears take on key support
-
04:03
EUR/USD grinds near 1.0600 with eyes on Fed’s favorite inflation, US Durable Goods Orders
- EUR/USD remains sidelined around intraday high during the first profit-making day in three.
- China-linked headlines, holiday mood allow traders to pare recent losses ahead of the key US data.
- Market sentiment remains divided as hawkish Fed bets jostle with cautious optimism over economic transition.
- Bears need strong prints of US PCE Price Index, Durable Goods Orders to retake control as ECB hawks defend buyers.
EUR/USD clings to mild gains near 1.0610 as the pair buyers retake control after a two-day losing streak. That said, the major currency pair’s latest inaction could be linked to the market’s cautious mood, as well as the holiday season, during early Friday in Europe.
Talking about the positives, optimism over China’s pro-growth policies and the People’s Bank of China’s (PBOC) biggest weekly cash injection in two months seems to underpin the mildly positive sentiment of late. The same joins the chatters surrounding Evergrande’s nearness to an offshore debt restructuring plan to underpin the firmer sentiment.
Alternatively, strong US data and hawkish Fed bets join a rally in Shanghai’s hospitalization and challenge to China’s medical system, due to the latest easing of the Zero-Covid policy, to tease the risk aversion and weigh on the EUR/USD price.
That said, traders’ wait for the key US data and holiday season restrict the market’s immediate moves and restrict the EUR/USD moves. That said, the US Core Personal Consumption Expenditure (PCE) - Price Index and the Durable Goods Orders for November are crucial for short-term directions. As per the market consensus, the US Core PCE Price Index, also known as the Fed’s preferred inflation gauge, remains unchanged at 0.2% MoM. However, the Annualized forecasts suggest softer figures of 4.7% YoY versus 5.0% previous readings. Further, US Durable Goods Orders could register a contraction of 0.6% in November compared to the previous increase of 1.1% (revised from 1.0%).
Additionally, fears surrounding European economic growth, due to the geopolitical tension with Russia and the oil prices cap, as well as the comments from the European Central Bank (ECB) should be watched carefully for clear directions.
Technical analysis
A three-week-old horizontal support line, close to 1.0580, restricts short-term EUR/USD downside amid sluggish MACD and RSI (14). The recovery moves, however, need validation from a one-week-old descending resistance line, close to 1.0650.
-
03:38
Gold Price Forecast: XAU/USD braces for US PCE Inflation, Durable Goods Orders below $1,800
- Gold price remains sidelined after snapping two-day downtrend earlier in Asia.
- China-linked optimism joins holiday mood to restrict immediate XAU/USD moves.
- Recently firmer US data renewed hawkish Fed bets and tease Gold sellers.
- Fed’s favorite inflation gauge, Durable Goods Orders should be watched carefully for further recovery.
Gold price (XAU/USD) treads water around $1,795 as it struggles to defend the first daily gains in three during Friday’s sluggish trading. In doing so, the precious metal prints mild gains inside a bearish chart formation (discussed below), while waiting for the key US statistics.
That said, the quote’s latest gains, or ability to stop the bearish move, could be linked to the news suggesting optimism over China’s pro-growth policies as the People’s Bank of China (PBOC) marked the biggest weekly cash injection in two months. The same joins the chatters surrounding Evergrande’s nearness to an offshore debt restructuring plan to underpin the firmer sentiment.
However, recently increasing hawkish Fed bets, especially after Thursday’s upbeat US data, join a rally in Shanghai’s hospitalization and challenges to China’s medical system, due to the latest easing of the Zero-Covid policy, to probe the risk-on mood.
Against this backdrop, S&P 500 Futures print mild gains while ignoring the Wall Street benchmarks. Further, the US 10-year Treasury bond yields extend the previous day’s rebound near the one-month high, marked early in the week.
Looking forward, the mixed mood in the market and the year-end positioning could test the Gold buyers as they approach the Federal Reserve’s preferred inflation gauge, namely the US Core Personal Consumption Expenditure (PCE) - Price Index, as well as Durable Goods Orders, for November. As per the market consensus, the US Core PCE Price Index remains unchanged at 0.2% MoM. However, the Annualized forecasts suggest softer figures of 4.7% YoY versus 5.0% previous readings. Further, US Durable Goods Orders could register a contraction of 0.6% in November compared to the previous increase of 1.1% (revised from 1.0%).
Also read: Pre-Christmas US Data Preview: Core PCE and Durable Goods may extend US Dollar retreat
Gold price technical analysis
Gold price stays defensive after bouncing off a one-month-old rising wedge bearish chart pattern’s lower line.
The yellow metal’s latest inaction could be linked to the sluggish MACD and the lower high on RSI (14), despite the Gold’s upside grind during December.
As a result, the XAU/USD rebound appears elusive unless defying the rising wedge formation, by crossing the pattern’s upper line that currently stands near $1,830. Following that, a run-up towards June’s peak of $1,880 can’t be ruled out.
It’s worth noting that multiple hurdles near the $1,800 round figure and $1,810 test Gold’s immediate recovery moves.
Alternatively, a downside break of the stated wedge’s support line, close to $1,788 at the latest, will confirm the theoretical slump targeting $1,690. However, the 21-DMA level and October’s high, respectively near $1,785 and $1,730, could challenge the Gold bears during the anticipated slump.
Gold price: Daily chart
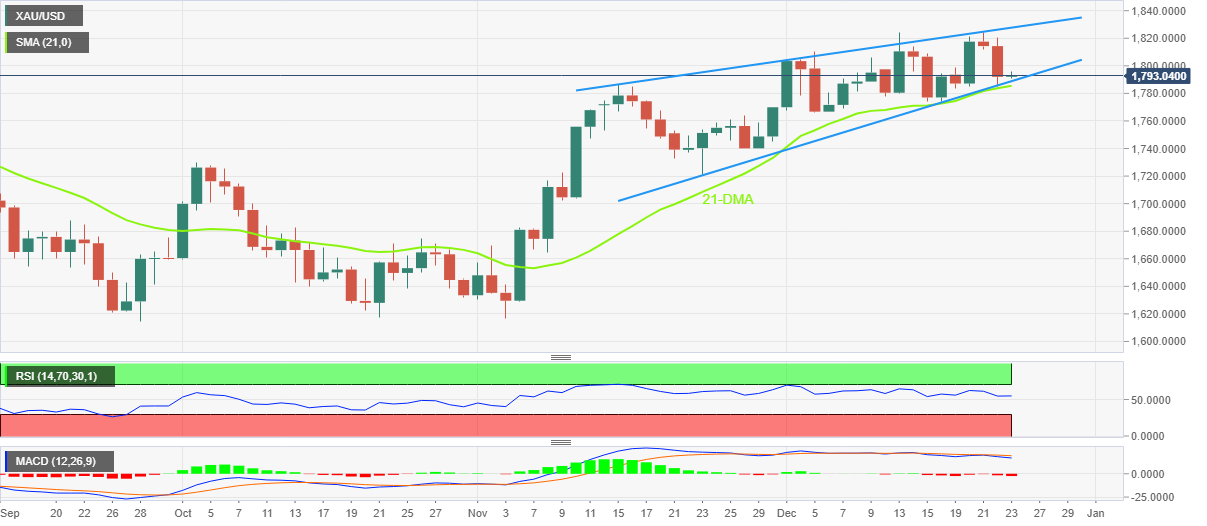
Trend: Further downside expected
-
03:15
USD/JPY Price Analysis: Rising wedge, overbought RSI probe recovery below 133.00
- USD/JPY picks up bids to pare BOJ-inflicted losses during three-day winning streak.
- Bearish chart formation, overbought RSI conditions challenge further upside.
- Sellers need validation from 50-HMA before targeting fresh multi-month low.
USD/JPY grinds near intraday high surrounding 132.80 as it consolidates the Bank of Japan (BOJ) induces losses during the three-day recovery amid early Friday.
In doing so, the Yen pair seesaws near the upper line of a short-term rising wedge bearish chart formation. Also keeping the sellers hopeful are the overbought conditions of the Relative Strength Index (RSI), located at 14.
However, the 50-Hour Moving Average (HMA) near 132.15 acts as an extra downside filter, in addition to the stated wedge’s support of around 132.35, to challenge the USD/JPY bears.
In a case where the USD/JPY price breaks the 132.15 HMA support, the odds of witnessing a slump toward the recently flashed four-month low near 130.55 can’t be ruled out.
Following that, the theoretical target of the rising wedge, near the 130.00 psychological magnet, will be in focus.
Meanwhile, the aforementioned wedge’s top line restricts immediate USD/JPY advances near 132.85, a break of which could quickly recall the 133.00 round figure to the chart.
Though, Tuesday’s swing high near 133.70, marked during the early European session, becomes crucial for the USD/JPY bulls to watch afterward.
Overall, USD/JPY appears to fade the recovery momentum and hence bears should lookout for entries.
USD/JPY: Hourly chart
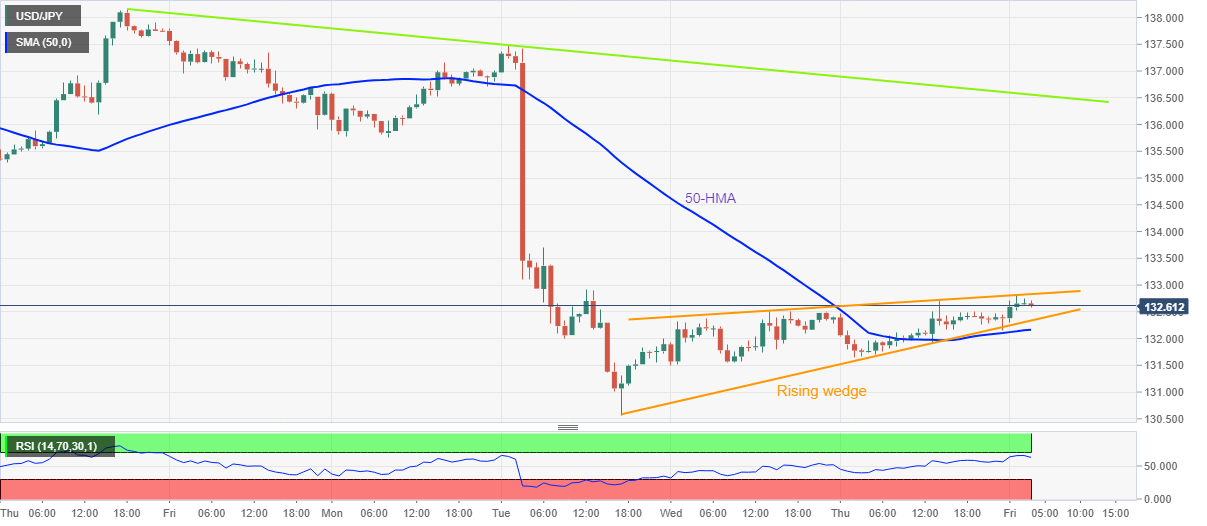
Trend: Pullback expected
-
02:56
AUD/USD bulls approach 0.6700 on China-linked optimism, US data eyed
- AUD/USD picks up bids to refresh intraday high, pares the biggest daily loss in over a week.
- PBOC’s biggest weekly cash injections in two months, Evergrande linked news trigger market’s optimism.
- Year-end holiday season, cautious mood ahead of US PCE Price Index, Durable Goods Orders probe buyers.
- Pair sellers need validation from Fed’s preferred inflation gauge.
AUD/USD bulls are back to the table and approach the 0.6700 threshold as they pick up bids to refresh intraday top near 0.6690 during early Friday. In doing so, the Aussie pair justifies its risk barometer status while ignoring downbeat data at home, as well as the market’s anxiety ahead of the key US data.
That said, the market’s latest optimism could be linked to the news suggesting optimism over China’s pro-growth policies as the People’s Bank of China (PBOC) marked the biggest weekly cash injection in two months. The same joins the chatters surrounding Evergrande’s nearness to an offshore debt restructuring plan to underpin the firmer sentiment.
However, recently increasing hawkish Fed bets, especially after Thursday’s upbeat US data, join a rally in Shanghai’s hospitalization and challenges to China’s medical system, due to the latest easing of the Zero-Covid policy, to probe the risk-on mood.
Amid these plays, S&P 500 Futures print mild gains while ignoring the Wall Street benchmarks. Further, the US 10-year Treasury bond yields extend the previous day’s rebound near the one-month high, marked early in the week.
It’s worth noting that Australia’s Private Sector Credit eased in November to 0.5% MoM and 8.9% YoY versus 0.6% and 9.5% in that order. Further, the Housing Credit remained unchanged at 0.4% MoM.
On the other hand, the US economy expanded at an annualized rate of 3.2% in the third quarter (Q3), per the final readings of the Gross Domestic Product (GDP), versus 2.9% previous estimates. Further, the Personal Consumption Expenditure (PCE) Prices match 4.3% QoQ estimations during Q3 2022 whereas the Core PCE improved to 4.7% QoQ versus 4.6% market forecasts.
Moving on, the mixed sentiment in the market and holiday mood could test AUD/USD buyers as the key approach the US Core Personal Consumption Expenditure (PCE) - Price Index, the Federal Reserve’s preferred inflation gauge, as well as Durable Goods Orders, for November.
As per the market consensus, the US Core PCE Price Index remains unchanged at 0.2% MoM. However, the Annualized forecasts suggest softer figures of 4.7% YoY versus 5.0% previous readings. Further, US Durable Goods Orders could register a contraction of 0.6% in November compared to the previous increase of 1.1% (revised from 1.0%).
Also read: Pre-Christmas US Data Preview: Core PCE and Durable Goods may extend US Dollar retreat
Technical analysis
AUD/USD rebound aims for the area comprising the 50-HMA and the 100-HMA, around 0.6700. However, the quote’s further upside appears difficult amid sluggish MACD signals. Alternatively, an upward-sloping support line stretched from Tuesday restricts the immediate downside of the Aussie pair near 0.6665.
-
02:35
Silver Price Analysis: XAG/USD bounces off 10-DMA to snap two-day losing streak below $24.00
- Silver picks up bids to print the first daily gains in three.
- Three-week-old bullish channel, ascending trend line from late October keep buyers hopeful.
- MACD signals challenge upside bias but bears should remain cautious beyond $21.25.
Silver price (XAG/USD) welcomes buyers after bears failed to hold the castle following a two-day reign. That said, the bright metal picks up bids to refresh intraday high near $23.70 during early Friday.
In doing so, the XAG/USD recovers from the 10-DMA support of $23.55 to print the first daily gains in three while staying inside an upward-sloping trend channel established in late November.
Not only the aforementioned bullish channel, currently between $23.20 and $25.00, but a two-month-old ascending support line, close to $22.60, also challenges the Silver bears from taking control.
Even if the commodity price drops below $22.60 support, the tops marked during November and October around $22.25 and $21.25, could challenge the downside momentum. Following that, a slump toward the $20.00 threshold can’t be ruled out.
On the contrary, Silver price recovery initially aims for the $24.00 round figure ahead of challenging the monthly high surrounding $24.30.
In a case where the XAG/USD remains firmer past $24.30, the aforementioned bullish channel’s top line near $25.00 could act as the last defense of sellers.
Should the quote fail to reverse from $25.00, a run-up toward April’s high near $26.25 appears more likely.
Silver price: Daily chart
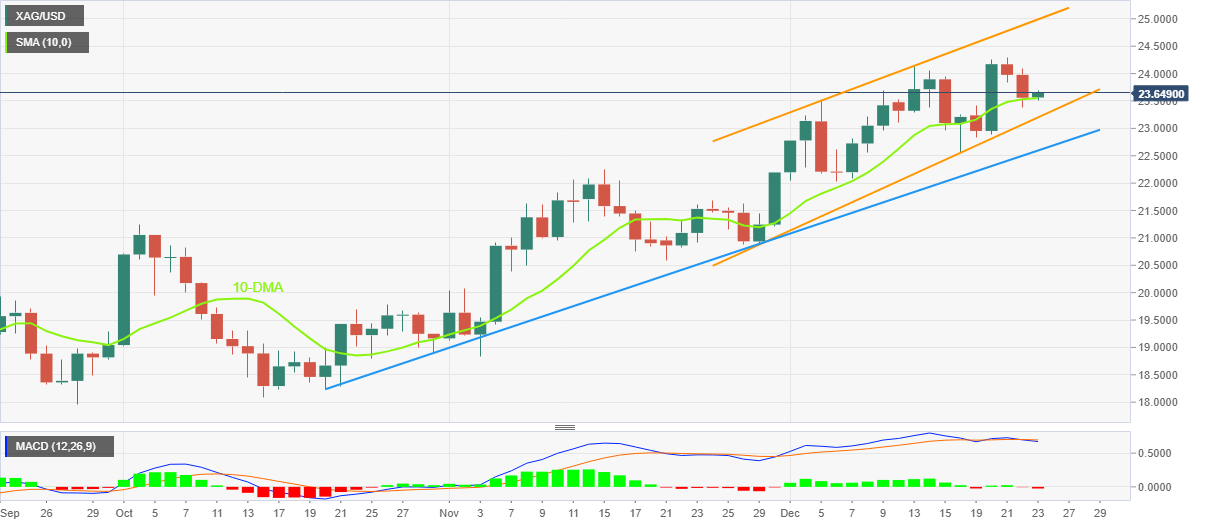
Trend: Further recovery expected
-
02:30
Commodities. Daily history for Thursday, December 22, 2022
Raw materials Closed Change, % Silver 23.567 -1.63 Gold 1792.7 -1.17 Palladium 1679.67 -1.16 -
02:15
USD/CHF prints mild gains above 0.9300 as traders await Fed’s favorite inflation gauge
- USD/CHF grinds higher after rising the most in a week, lacks upside momentum of late.
- US Dollar cheers firmer data, hawkish Fed bets and US President Biden’s comments.
- Headlines surrounding China, Russia flash mixed clues amid sluggish session.
- US Core PCE Price Index, Durable Goods Orders will be crucial for the bulls to keep reins.
USD/CHF seesaws around intraday high as traders await fresh clues during early Friday. In doing so, the Swiss Franc (CHF) pair portrays the market’s cautious mood ahead of the key US data, despite defending the US Dollar's strength. Also challenging the pair bulls could be the mixed macros and the year-end season that knocks on the door.
Optimism over China’s pro-growth policies recently gained momentum after the People’s Bank of China (PBOC) marked the biggest weekly cash injection in two months. The same joins the policymakers’ pledge to defend the world’s second-largest economy to overcome the Covid-inflicted pessimism via more stimulus. It’s worth noting that the chatters surrounding Evergrande’s nearness to an offshore debt restructuring plan also underpin the cautious optimism in the markets.
On the other hand, a rally in Shanghai’s hospitalization and challenges to China’s medical system due to the latest easing of the Zero-Covid policy seems to probe the optimists. Further, the US Senate’s passage of a $1.7 trillion government funding bill and the latest comments from US President Joe Biden showing readiness to tame inflation keeps USD/CHF buyers hopeful.
It should be noted that an increase in the hawkish Fed bets, backed by Thursday’s US data, also underpins the USD/CHF upside. That said, the US economy expanded at an annualized rate of 3.2% in the third quarter (Q3), per the final readings of the Gross Domestic Product (GDP), versus 2.9% previous estimates. Further, the Personal Consumption Expenditure (PCE) Prices match 4.3% QoQ estimations during Q3 2022 whereas the Core PCE improved to 4.7% QoQ versus 4.6% market forecasts.
Amid these plays, S&P 500 Futures print mild gains while ignoring the Wall Street benchmarks. Further, the US 10-year Treasury bond yields extend the previous day’s rebound near the one-month high, marked early in the week.
Looking forward, USD/CHF traders may pay attention to the risk catalysts ahead of the US Core Personal Consumption Expenditure (PCE) - Price Index, the Federal Reserve’s preferred inflation gauge, as well as Durable Goods Orders, for November. As per the market consensus, the US Core PCE Price Index remains unchanged at 0.2% MoM. However, the Annualized forecasts suggest softer figures of 4.7% YoY versus 5.0% previous readings. Further, US Durable Goods Orders could register a contraction of 0.6% in November compared to the previous increase of 1.1% (revised from 1.0%). Given the mixed forecasts for the key data, as well as the recent improvement in sentiment, the USD/CHF buyers should remain cautious.
Technical analysis
A daily closing break of the 13-day-old resistance line, now support around the 0.9300 threshold, keeps USD/CHF buyers hopeful of poking the monthly resistance line, around 0.9400 by the press time.
-
02:08
S&P 500 Futures print mild gains as PBOC makes biggest weekly cash injection in two months
Market sentiment improves during early Friday as the People’s Bank of China made its biggest weekly liquidity injection into the banking system in nearly two months to counteract the year-end rush for cash, per Reuters.
“PBOC injected a total of 205 billion Yuan ($29.36 billion) via open market operations on Friday, including 2 billion Yuan through the seven-day tenor and 203 billion through the 14-day tenor,” according to an online statement reported by Reuters.
“The PBOC attributed the liquidity offerings to "maintaining steady year-end liquidity level,” stated the news.
Reuters also mentioned that with the 41 billion Yuan worth of reverse repos maturing on Friday, the PBOC injected a net 164 billion Yuan on the day. And it brought the weekly cash offerings to a net 704 billion Yuan, the biggest since late October.
It’s worth noting that the chatters surrounding Evergrande’s nearness to offshore debt restructuring plan also underpin the cautious optimism in the markets.
S&P 500 Futures restore optimism
The news helps S&P 500 Futures to print mild gains around 3,855 despite the negative closing of Wall Street. Even so, the US Treasury yields remain firmer amid hawkish Fed bets and pre-data anxiety.
Also read: US Dollar Index bulls take a breather as Fed’s preferred inflation, US Durable Goods Orders loom
-
01:51
GBP/USD bulls firm above 1.2000 psychological support area
- GBP/USD bulls move in to guard 1.2000 vs. the strong US Dollar.
- Federal Reserve is expected to continue raising rates in 2023, weighing on GBP.
GBP/USD is holding above 1.2000 support and has traded between a range of 1.2017 and 1.2044 so far. The US Dollar was supported by positive US data that could keep the Federal Reserve hawkish for longer.
US data fires up the US Dollar
For one, Weekly Jobless Claims in the US rose less than expected. The Department of Labor said seasonally adjusted numbers of initial unemployment claims rose by 2,000 to 216,000 in the week ended Dec. 17. The consensus on Econoday was for a 225,000 print. The previous week's level was revised up by 3,000 to 214,000. The four-week moving average tallied 221,750, sliding by 6,250 from the previous week's revised average of 228,000. Unadjusted claims declined 4,064 on a weekly basis to 247,867.
Elsewhere in the third quarter (Q3), Gross Domestic Product (GDP), arrived at 3.2% versus 2.9% previous consensus. Personal Consumption Expenditure (PCE) Prices match 4.3% QoQ estimations during Q3 2022 whereas the Core PCE improved to 4.7% QoQ versus 4.6% market forecasts. Subsequently, the DXY popped into the 104.50s from a low of 103.75. The US Dollar, however, remains well below the highs for the month near 107.20 while US Treasury yields also edge up following the data on Thursday.
Meanwhile, analysts at Brown Brothers Harriman noted that the current consensus for Nonfarm Payrolls stands at 208k vs. 263k in November, with the Unemployment Rate seen steady at 3.7% and average hourly earnings falling a tick to 5.0% YoY. ''While job growth is clearly slowing, it’s not by enough to materially impact unemployment and so we continue to believe that the Fed will have to do more than the market is expecting.''
-
01:47
USD/CAD Price Analysis: Buyers struggle to keep the reins around mid-1.3600s
- USD/CAD fades bounce off 21-DMA amid sluggish RSI.
- Impending bear cross on MACD, multiple failures to cross 1.3700 keep bears hopeful.
- Convergence of 50-DMA, five-week-old ascending trend line appears a tough nut to crack for sellers.
USD/CAD retreats to 1.3640 as it pares intraday gains amid a sluggish Friday morning. In doing so, the Loonie pair fades bounce off the 21-DMA while portraying another U-turn below the 1.3700 key hurdle.
It’s worth noting that the RSI (14) remains steady and signals a lack of momentum. However, the looming bear cross on the MACD and failure to cross the key hurdles, as well as the inability to stay beyond crucial moving averages, keeps the USD/CAD bears hopeful.
That said, the 21-DMA support near 1.3580 gains major attention of intraday sellers ahead of the 1.3540 support confluence, encompassing the 50-DMA and an upward-sloping trend line from mid-November.
In a case where the USD/CAD bears manage to conquer the 1.3540 support, the odds of witnessing a slump to the 1.3500 round figure can’t be ruled out.
Though, the 23.6% Fibonacci retracement level of the Loonie pair’s October-November downside, near 1.3400, could challenge the quote’s further declines past 1.3500.
Meanwhile, the 61.8% Fibonacci retracement, also known as the “Golden ratio”, guards the USD/CAD pair’s immediate upside near 1.3690, a break of which could shift the market’s attention back to the 1.3700 hurdle.
Should the USD/CAD bulls manage to stay in the driver’s seat beyond the 1.3700 resistance, a run-up to the previous monthly high near 1.3810 becomes imminent.
Following that, tops marked during October, around 1.3855 and 1.3980, should probe the upside momentum ahead of highlighting the 1.4000 psychological magnet.
USD/CAD: Daily chart
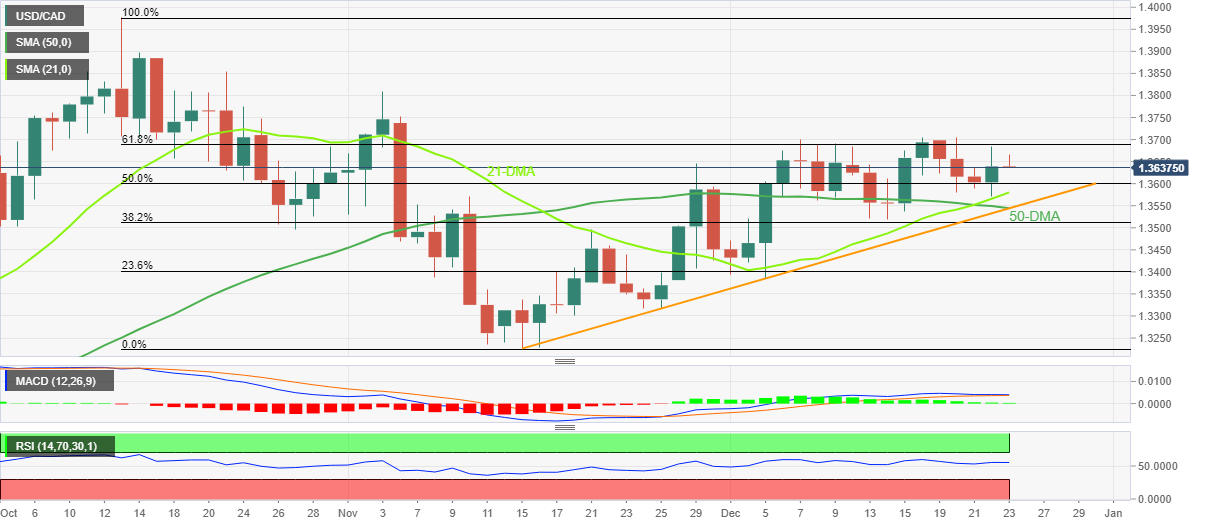
Trend: Limited downside expected
-
01:31
WTI Price Analysis: Bears take on key support
- WTI bears sinking in their teeth to test key support.
- Bears eye the 50% mean reversion area and prior support structure.
West Texas Intermediate (WTI) was pressured lower on Thursday following three straight days of gains and the following technical analysis illustrates an indecisive market on the backside of the bearish trend.
WTI daily charts

The price is on the backside of the prior dominant bear trend but remains on the front side of the micro breakout trend. Therefore, the bias is to the upside e for the time being.
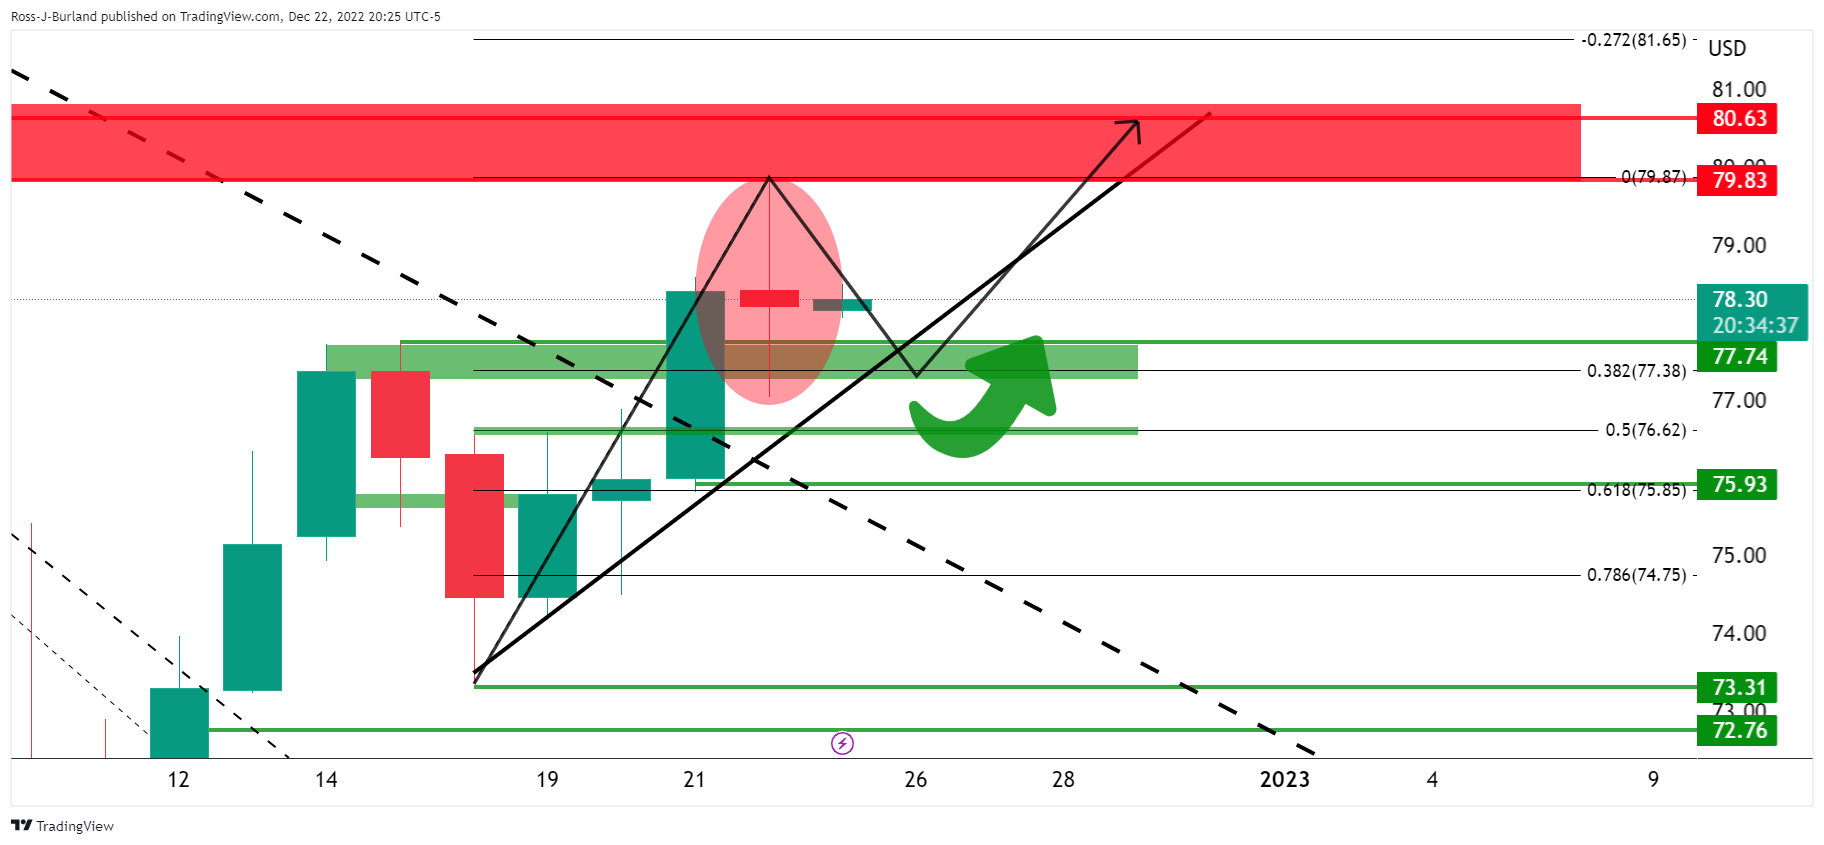
It would be reasonable to expect a correction into the Fibonacci scale and the 38.2% Fibo meets trendline support. If this were to give, however, a deeper move into a 50% mean reversion could be on the cards.
-
01:22
NZD/USD eyes the biggest weekly loss in three months as bears approach 0.6200, US data in focus
- NZD/USD takes offers to renew intraday low, prints five-day losing streak.
- Firmer US data, President Biden’s comments keep bears hopeful amid hawkish Fed bets.
- Absence of major New Zealand statistics adds strength to the bearish bias.
- US Core PCE Price Index, Durable Goods Orders for November will be important for near-term directions.
NZD/USD bears keep the reins around 0.6240, marking the fifth consecutive daily fall near the intraday low while bracing for the biggest daily slump since late September. That said, the Kiwi pair’s latest losses could be linked to the sour sentiment in the market, as well as the hawkish Fed bets, ahead of the key US statistics surrounding inflation and output.
In addition to the fading optimism over China’s pro-growth policies, strong US economics and recent comments from US President Joe Biden could be held responsible for the NZD/USD pair’s latest losses.
That said, a rally in Shanghai’s hospitalization and challenges to China’s medical system due to the latest easing of the Zero-Covid policy seems to probe the previous optimism, mainly backed by expectations of stimulus from China and reopening of the world’s second-largest economy.
Elsewhere, the US Senate’s passage of a $1.7 trillion government funding bill and the latest comments from US President Joe Biden showing readiness to tame inflation keeps NZD/USD bears hopeful.
On Thursday, strong prints of the US economic growth and personal consumption renewed hawkish expectations from the US Federal Reserve and propelled the US Dollar. To talk about the statistics, the US economy expanded at an annualized rate of 3.2% in the third quarter (Q3), per the final readings of the Gross Domestic Product (GDP), versus 2.9% previous estimates. Further, the Personal Consumption Expenditure (PCE) Prices match 4.3% QoQ estimations during Q3 2022 whereas the Core PCE improved to 4.7% QoQ versus 4.6% market forecasts.
Against this backdrop, S&P 500 Futures print mild losses while tracking the Wall Street benchmarks. Further, the US 10-year Treasury bond yields extend the previous day’s rebound near the one-month high, marked early in the week.
While the sour sentiment and firmer yields join hawkish Fed bets to favor the NZD/USD bears, the quote’s further downside hinges on the US Core Personal Consumption Expenditure (PCE) - Price Index, the Federal Reserve’s preferred inflation gauge, as well as Durable Goods Orders, for November.
Forecasts suggest that the US Core PCE Price Index remains unchanged at 0.2% MoM. However, the Annualized forecasts suggest softer figures of 4.7% YoY versus 5.0% previous readings. Further, US Durable Goods Orders could register a contraction of 0.6% in November compared to the previous increase of 1.1% (revised from 1.0%). Given the mixed forecasts, the NZD/USD bears may witness a shock in case the data disappoints.
Technical analysis
A clear downside break of the 10-week-old ascending trend line, around 0.6295 by the press time, directs NZD/USD bears towards the 200-DMA support level near 0.6200.
-
01:19
USD/CNY fix: 6.9810 vs. the prev fix of 6.9713
In recent trade today, the People’s Bank of China (PBOC) set the yuan (CNY) at 6.9810 vs. the prev fix of 6.9713 and the prior close of 6.9876.
About the fix
China maintains strict control of the yuan’s rate on the mainland.
The onshore yuan (CNY) differs from the offshore one (CNH) in trading restrictions, this last one is not as tightly controlled.
Each morning, the People’s Bank of China (PBOC) sets a so-called daily midpoint fix, based on the yuan’s previous day's closing level and quotations taken from the inter-bank dealer.
-
01:00
EUR/USD Price Analysis: Floats above 1.0580 support
- EUR/USD remains sidelined around three-week-old horizontal support, fades upside momentum of late.
- Downbeat RSI keeps bears hopeful of meeting 1.0440 support confluence.
- Bulls need to cross the weekly resistance line to retake control.
EUR/USD fades late Thursday’s corrective bounce off short-term key support as it retreats to 1.0590 during Friday’s Asian session.
Not only the failure to stay beyond the short-term key support but the RSI (14) line also keeps the pair sellers hopeful by printing the sub-50 level but staying beyond the oversold region.
As a result, the quote is likely to break the aforementioned three-week-old horizontal support line, close to 1.0580.
Following that, a slump toward the previous weekly low near the 1.0500 round figure becomes imminent.
However, a convergence of the 200-SMA and a one-month-long ascending trend line, close to 1.0440, appears a tough nut to crack for the EUR/USD bears afterward.
In a case where the pair sellers manage to keep the reins past 1.0440, the late November swing low near 1.0220 will gain the market’s attention.
On the flip side, a one-week-old descending resistance line, close to 1.0650, guards the EUR/USD pair’s immediate recovery moves.
Also acting as upside filters are multiple hurdles around 1.0660 and 1.0700, a break of which could challenge the monthly high of 1.0736.
To sum up, EUR/USD holds onto the bearish bias despite the latest inaction around the short-term key support.
EUR/USD: Four-hour chart
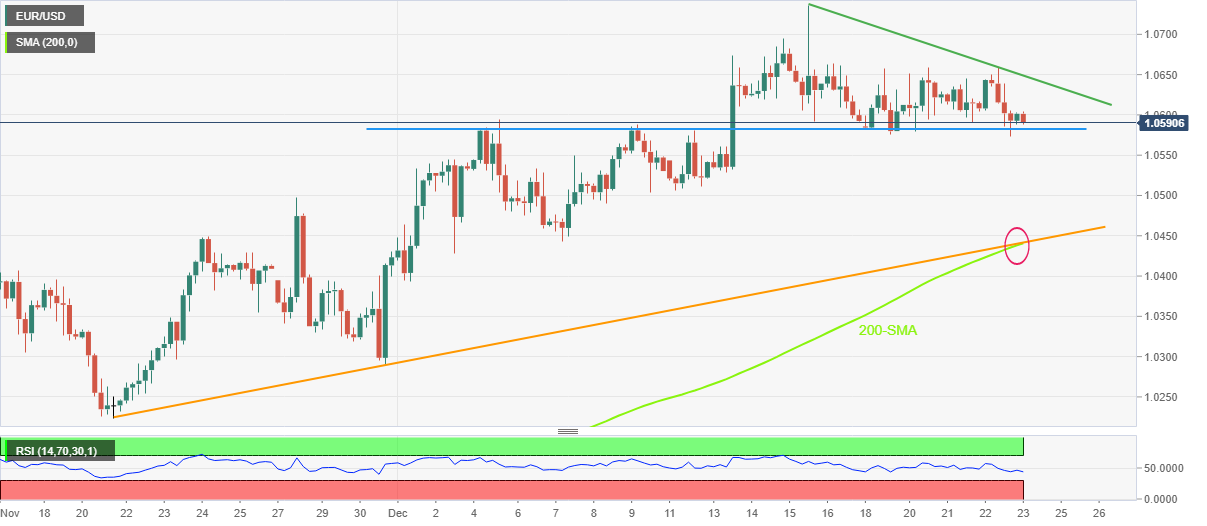
Trend: Further downside expected
-
00:48
USD/JPY consolidates above bear cycle lows in firm US dollar environment
- USD/JPY bears in town but the price consolidates in 132 area.
- Bulls eye a correction from supporting territory.
USD/JPY is flat on the day near 132.40 and consolidating the drop that occurred into the 130.60s in an extension of the late December drive to the downside. The US Dollar firmed on Thursday but as measured by the DXY index vs. a basket of currencies, it has so far failed to meaningfully recoup the 3.8% slump that followed Tuesday's Bank of Japan (BoJ) news. Nevertheless, US data has supported the hawkish sentiment surrounding the Federal Reserve (Fed).
US data keeps Fed sentiment alive
The Department of Labor said Weekly Jobless Claims in the US rose less than expected. Seasonally adjusted numbers of initial Unemployment Claims rose by 2,000 to 216,000 in the week ended Dec. 17. The consensus on Econoday was for a 225,000 print. The previous week's level was revised up by 3,000 to 214,000. The four-week moving average tallied 221,750, sliding by 6,250 from the previous week's revised average of 228,000. Unadjusted claims declined by 4,064 on a weekly basis to 247,867. Consequently, the DXY rallied into the 104.50s from a low of 103.75 but stays far below the highs for the month near 107.20 while US Treasury yields also edge up following the data on Thursday.
Meanwhile, Japan's core Consumer Prices climbed 3.7% in November from a year earlier, government data showed on Friday. The increase in the core consumer price index, which excludes volatile fresh food but includes oil costs, matched a median market forecast for a 3.7% increase. Shortly afterwards, the October meeting minutes were released by the Bank of Japan:
-
Bank of Japan Oct Minutes: Members agreed must maintain current easy policy to hit price target
-
00:33
Australia Private Sector Credit (YoY) declined to 8.9% in November from previous 9.5%
-
00:33
US Dollar Index bulls take a breather as Fed’s preferred inflation, US Durable Goods Orders loom
- US Dollar Index stays pressured around intraday low, snaps two-day uptrend.
- Sluggish Treasury yields, inactive Asian session allows sellers to sneak in ahead of the key data.
- Upward revision to US GDP, President Biden’s comments renew hawkish Fed bets.
- US Core PCE Price Index, Durable Goods Orders for November eyed for clear directions.
US Dollar Index (DXY) remains on the back foot near 104.35 as bulls retreat during early Friday after a two-day winning streak. In doing so, the greenback’s gauge versus the six major currencies portrays the consolidation ahead of the key US data.
In addition to the pre-data anxiety, sluggish US Treasury yields also allow the DXY bulls to take a breather. That said, the US 10-year Treasury yields remain sidelined around the monthly high after recalling the bulls, making rounds to 3.68% by the press time.
Even so, the US Senate’s passage of a $1.7 trillion government funding bill and the latest comments from US President Joe Biden showing readiness to tame inflation keeps DXY bulls hopeful.
That said, the US Dollar Index cheered strong prints of the US economic growth and personal consumption the previous day. US data renewed hawkish expectations from the US Federal Reserve and propelled the US Dollar. To talk about the statistics, the US economy expanded at an annualized rate of 3.2% in the third quarter (Q3), per the final readings of the Gross Domestic Product (GDP), versus 2.9% previous estimates. Further, the Personal Consumption Expenditure (PCE) Prices match 4.3% QoQ estimations during Q3 2022 whereas the Core PCE improved to 4.7% QoQ versus 4.6% market forecasts.
It’s worth noting that the sentiment-positive headlines from China and mixed US data, as well as the Bank of Japan’s (BOJ) moves, previously exerted downside pressure on the DXY.
Amid these plays, S&P 500 Futures print mild losses while tracking the Wall Street benchmarks amid a sluggish Asian session.
Looking forward, the market’s cautious mood may restrict immediate DXY moves ahead of the US Core Personal Consumption Expenditure (PCE) - Price Index, the Federal Reserve’s preferred inflation gauge, as well as Durable Goods Orders, for November.
Forecasts suggest that the US Core PCE Price Index remains unchanged at 0.2% MoM. However, the Annualized forecasts suggest softer figures of 4.7% YoY versus 5.0% previous readings. Further, US Durable Goods Orders could register a contraction of 0.6% in November compared to the previous increase of 1.1% (revised from 1.0%).
Technical analysis
US Dollar Index recovery remains elusive unless the quote remains below a one-month-old descending resistance line, around 104.95 by the press time.
-
00:30
Australia Private Sector Credit (MoM) fell from previous 0.6% to 0.5% in November
-
00:30
Stocks. Daily history for Thursday, December 22, 2022
Index Change, points Closed Change, % NIKKEI 225 120.15 26507.87 0.46 Hang Seng 518.73 19679.22 2.71 KOSPI 27.78 2356.73 1.19 ASX 200 37.4 7152.5 0.53 FTSE 100 -28.02 7469.28 -0.37 DAX -183.75 13914.07 -1.3 CAC 40 -62.27 6517.97 -0.95 Dow Jones -348.99 33027.49 -1.05 S&P 500 -56.05 3822.39 -1.45 NASDAQ Composite -233.25 10476.12 -2.18 -
00:27
Japan National CPI ex-Fresh Food (YoY) meets forecasts (3.7%) in November
-
00:26
Japan National CPI ex Food, Energy (YoY) came in at 2.8%, above expectations (2.7%) in November
-
00:15
Currencies. Daily history for Thursday, December 22, 2022
Pare Closed Change, % AUDUSD 0.66694 -0.53 EURJPY 140.241 -0.06 EURUSD 1.05972 -0.07 GBPJPY 159.321 -0.33 GBPUSD 1.20403 -0.25 NZDUSD 0.62477 -0.72 USDCAD 1.36477 0.3 USDCHF 0.93094 0.47 USDJPY 132.34 -0.05 -
00:14
AUD/USD Price Analysis: Recovery needs validation from 0.6700
- AUD/USD extends bounce off short-term key support line.
- Bullish crossover by important HMAs keeps buyers hopeful of overcoming the key hurdle.
- Eight-day-old resistance line adds to the upside filters.
- Bears need a successful break of 0.6630 to retake control.
AUD/USD picks up bids to pare recent losses around 0.6675 during Friday’s Asian session, reversing the previous day’s pullback from a weekly high.
In doing so, the Aussie pair recovers from an upward-sloping support line stretched from Tuesday while justifying the bull cross between the 50-Hour Moving Average (HMA) and the 100-HMA. Also favoring bulls is the receding bearish bias of the MACD indicator.
As a result, the AUD/USD rebound aims for the area comprising the 50-HMA and the 100-HMA, around 0.6700. However, the quote’s further upside appears difficult.
Even if the quote manages to rise past 0.6700, a one-week-old descending resistance line, close to 0.6755 by the press time, could act as the last defense of the AUD/USD bears.
It’s worth noting that the Aussie pair’s successful trading beyond 0.6755 will allow the pair buyers to challenge the early December swing high surrounding 0.6850.
Alternatively, a downside break of the aforementioned immediate support line, close to 0.6660 at the latest, could recall the AUD/USD bears.
However, the weekly low surrounding 0.6630 may act as a validation point for the Australian Dollar’s further weakness toward the late November swing low, around 0.6585.
AUD/USD: Hourly chart
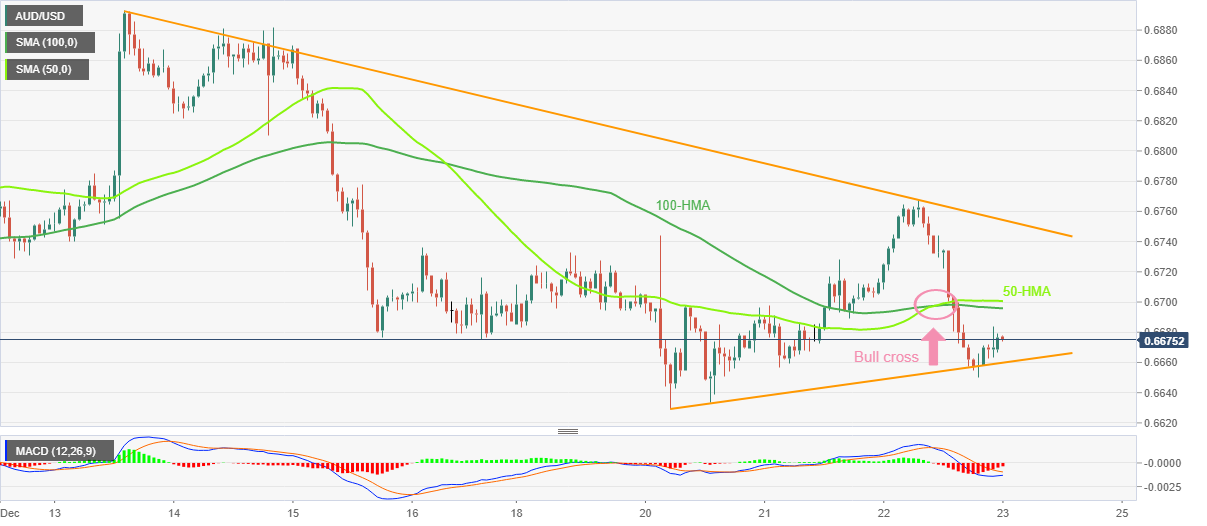
Trend: Limited recovery expected
-