Notícias do Mercado
-
23:57
Bank of Japan Oct Minutes: Members agreed must maintain current easy policy to hit price target
The Bank of Japan published the minutes of the October meeting, not to be m, mistaken for the most recent meeting where a surprising tweak was made to the central bank's monetary policy, sending the yen on a tear.
BoJ minutes
BoJ October meeting minutes: Members agreed must maintain the current easy policy to stably, and sustainably hit the price target.
BoJ minutes: One member said the effect of BoJ\s easing may be heightening as a moderate increase in inflation expectations push down real interest rates.BoJ minutes: One member said the rise in nominal wages is crucial for inflation to stably hit 2%.
More to come ...
About the Bank of Japan
The Bank of Japan publishes a study of economic movements in Japan after the actual meeting. These meetings are held to review economic developments inside and outside of Japan and indicate a sign of new fiscal policy. Any changes in this report tend to affect the JPY volatility. Generally speaking, if the BoJ minutes show a hawkish outlook, that is seen as positive (or bullish) for the JPY, while a dovish outlook is seen as negative (or bearish).
-
23:50
Gold Price Forecast: XAU/USD licks its wounds ahead of Federal Reserve’s preferred inflation
- Gold price prints mild gains to probe sellers after two-day downtrend.
- XAU/USD bears stay hopeful as United States economics renew hawkish Federal Reserve bets.
- Mixed concerns surrounding geopolitics, Covid join Treasury bond market jitters to probe Gold sellers.
- US Dollar needs firmer US PCE Price Index, Durable Goods Orders to stay strong and weigh on Gold price.
Gold price (XAU/USD) makes rounds to $1,793 as bears take a breather after a two-day losing streak during Friday’s sluggish morning. Even so, the yellow metal stays bearish amid hawkish hopes from the Federal Reserve (Fed), especially after the firmer United States statistics. That said, the quote’s latest rebound could be linked to the US Dollar’s retreat as traders await the key US Core Personal Consumption Expenditure (PCE) - Price Index and Durable Goods Orders for November.
United States data renew hawkish Federal Reserve bets, weigh on Gold price
Having witnessed an upbeat start to Thursday, Gold price witnessed heavy selling as the US data renewed hawkish expectations from the US Federal Reserve and propelled the US Dollar. That said, the US economy expanded at an annualized rate of 3.2% in the third quarter (Q3), per the final readings of the Gross Domestic Product (GDP), versus 2.9% previous estimates. Further, the Personal Consumption Expenditure (PCE) Prices match 4.3% QoQ estimations during Q3 2022 whereas the Core PCE improved to 4.7% QoQ versus 4.6% market forecasts.
Mixed geopolitics, bond market updates trouble XAU/USD traders
Contrary to the firmer United States data, risk-on mood and downbeat Treasury yields weighed on the US Dollar, which in turn allowed Gold price to pare losses. The same could be linked to the sentiment-positive headlines from China and mixed US data, as well as the Bank of Japan’s (BOJ) another unscheduled bond operation.
That said, the US Senate’s passage of a $1.7 trillion government funding bill and the latest comments from US President Joe Biden showing readiness to tame inflation also add filters to the Gold price moves.
Firmer US statistics to please Gold sellers
Although the recent inaction in the market allows Gold traders to portray indecision, the likely upbeat prints of the US inflation and output-related data could allow the XAU/USD bears to tighten their grip.
Forecasts suggest that the US Core Personal Consumption Expenditure (PCE) - Price Index, the Federal Reserve’s preferred inflation gauge, will join the monthly Durable Goods Orders to offer the one last shot of market activity before witnessing the holiday-linked inaction. Forecasts suggest that the US Core PCE Price Index remains unchanged at 0.2% MoM. However, the Annualized forecasts suggest softer figures of 4.7% YoY versus 5.0% previous readings. Further, US Durable Goods Orders could register a contraction of 0.6% in November compared to the previous increase of 1.1% (revised from 1.0%).
Gold price technical analysis
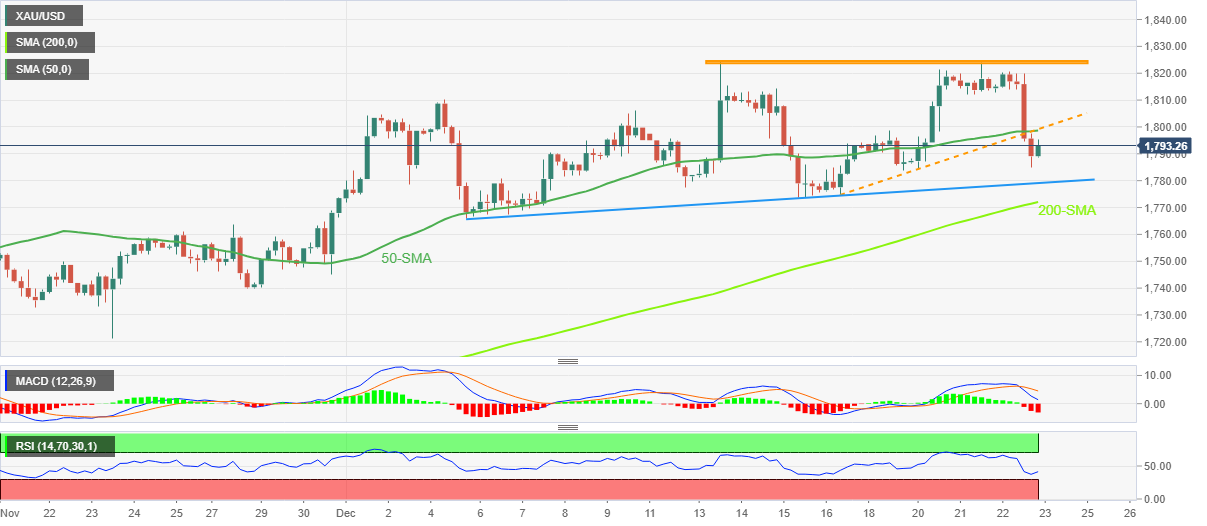
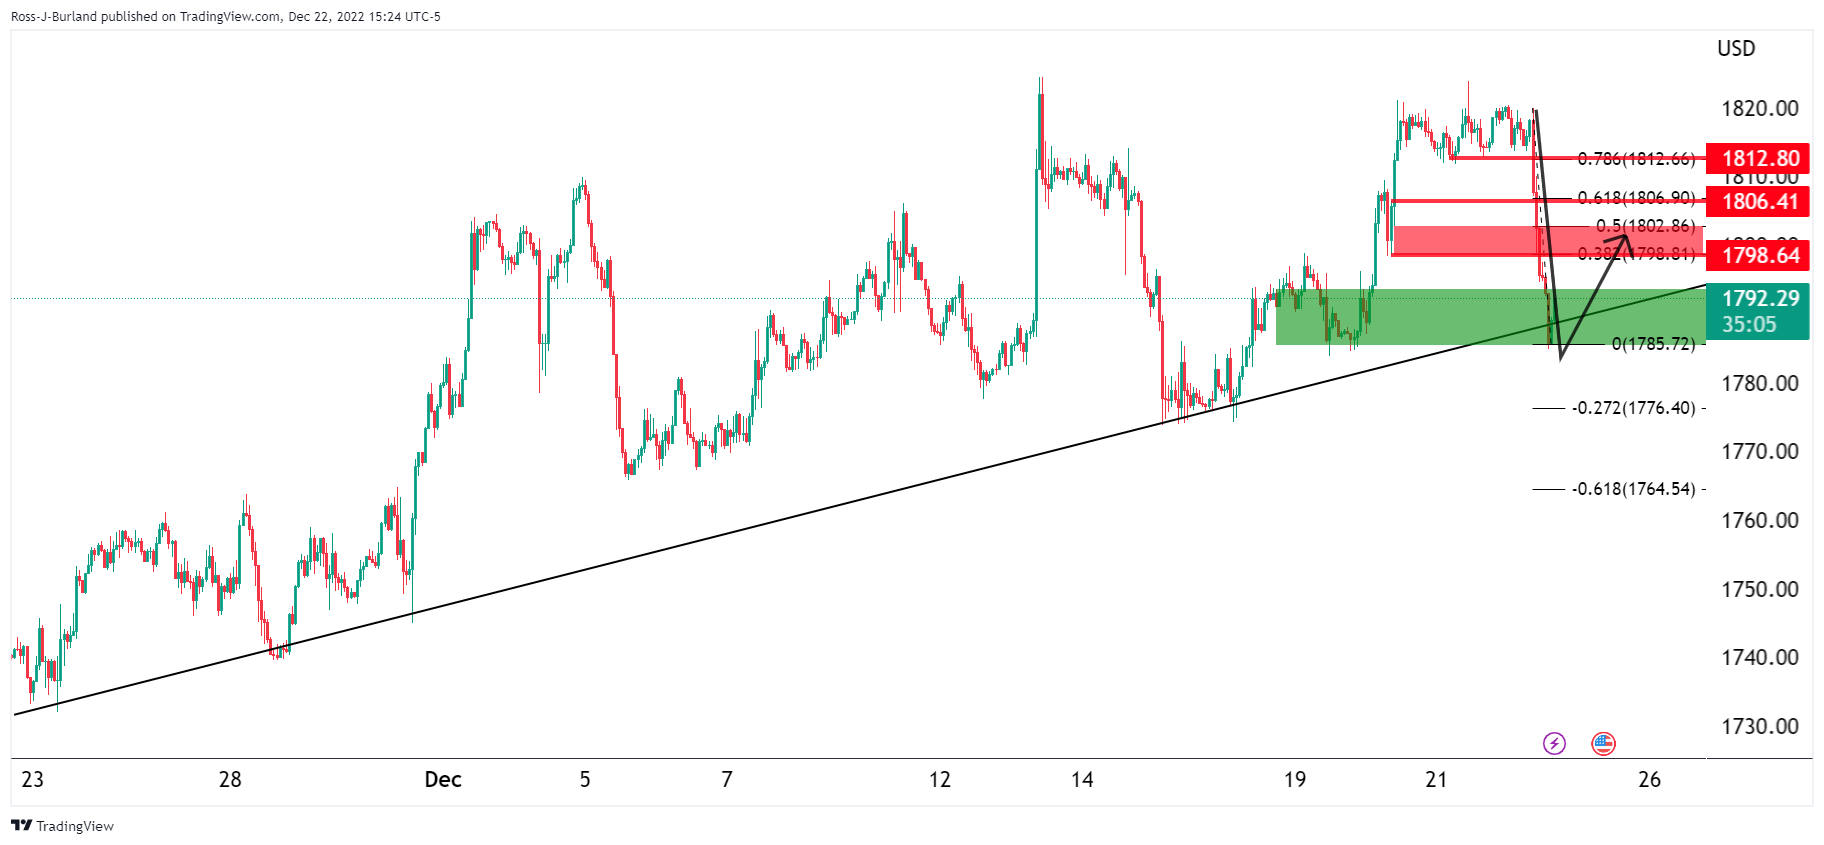
Gold price remains on the bear’s radar as it broke a one-week-old ascending trend line and the 50-Simple Moving Average (SMA) the previous day, after forming a “double top” bearish chart formation around $1,825.
Adding strength to the downside bias is the absence of the oversold conditions for the Relative Strength Index (RSI), located at 14, as well as the bearish signals from the Moving Average Convergence and Divergence (MACD) indicator.
That said, the Gold price can ignore the latest rebound unless the commodity stays below a convergence of the 50-SMA and previous support line from December 16, close to $1,799 by the press time. Also challenging the upside filter is the $1,800 threshold.
Following that, the recovery moves could aim for the “double tops” marked around $1,825, a break of which will give control to the Gold buyers targeting June’s peak surrounding $1,880.
On the contrary, a three-week-old ascending support line, near $1,779 at the latest, lures intraday sellers of the Gold. However, the likely oversold conditions of the RSI around there could join the 200-SMA, near $1,772 by the press time, to challenge the XAU/USD bears afterward.
Ina case where the Gold price remains bearish past $1,772, the odds of witnessing a slump toward the monthly low near $1,765, and then a battle with the multiple supports near $1,760, can’t be ruled out.
Overall, the Gold price remains on the bear’s radar despite the latest corrective bounce.
Gold price: Four-hour chart
Trend: Further downside expected
-
23:30
Japan National Consumer Price Index (YoY) came in at 3.8%, above expectations (3.7%) in November
-
23:10
USD/CAD retreats towards 1.3600 as Oil pares recent losses, focus on the key US/Canada statistics
- USD/CAD pares the biggest daily gains in over a week, sidelined of late.
- Upbeat US data renewed hawkish Fed concerns and favored US Dollar buyers.
- Oil prices failed to cheer price-positive sentiment amid firmer USD.
- Canada GDP, Fed’s preferred inflation gauge and US Durable Goods Orders are eyed for fresh impulse.
USD/CAD seesaws around mid-1.3600s as the Loonie pair consolidates the previous day’s heavy gains during early Friday’s sluggish trading. In addition to the generally inactive session, a bounce in the WTI crude oil also allows the quote to pare recent gains, due to Canada’s heavy reliance on energy exports as a source of income.
WTI crude oil rose to the highest levels since December 05 on early Thursday before reversing from $79.85. The pullback moves, however, failed to last below $77.00 from where the energy buyers returned to the desk. That said, the black gold picks up bids to $78.20 by the press time. Geopolitical fears from Russia joined China’s Covid-linked headlines to suggest more demand and fewer supplies to previously favor the oil prices. However, the upbeat US data renewed hawkish Fed bets and weighed on the quote afterward.
The firmer prints of the US growth and consumption data allowed the US Dollar to reverse the early losses and end the day on a positive side. Also likely to have favored the USD could be the US Senate’s passage of a $1.7 trillion government funding bill and the latest comments from US President Joe Biden showing readiness to tame inflation.
Previously, risk-on mood and downbeat Treasury yields weighed on the US Dollar. The same could be linked to the sentiment-positive headlines from China and mixed US data, as well as the Bank of Japan’s (BOJ) another unscheduled bond operation.
Talking about the data, the US economy expanded at an annualized rate of 3.2% in the third quarter (Q3), per the final readings of the Gross Domestic Product (GDP), versus 2.9% previous estimates. Further, the Personal Consumption Expenditure (PCE) Prices match 4.3% QoQ estimations during Q3 2022 whereas the Core PCE improved to 4.7% QoQ versus 4.6% market forecasts.
Against this backdrop, S&P 500 Futures remain depressed while the Wall Street benchmarks closed in the negative. Further, the US Treasury bond yields recovered.
Moving on, US Core Personal Consumption Expenditure (PCE) - Price Index, the Federal Reserve’s preferred inflation gauge, will join the monthly Durable Goods Orders to offer the one last shot of market activity before witnessing the holiday-linked inaction. Forecasts suggest that the US Core PCE Price Index remains unchanged at 0.2% MoM. However, the Annualized forecasts suggest softer figures of 4.7% YoY versus 5.0% previous readings. Further, US Durable Goods Orders could register a contraction of 0.6% in November compared to the previous increase of 1.1% (revised from 1.0%). Additionally, Canada’s monthly GDP for September, expected to remain unchanged with 0.1% growth, will also be important for the USD/CAD pair traders to watch for clear directions.
Technical analysis
Although the 21-DMA restricts the immediate downside of the USD/CAD pair to around 1.3580, the bull’s return remains doubtful unless the quote crosses the 1.3700 key hurdle.
-
22:47
US President Biden: It’s going to take time to get inflation back to normal, we may see setbacks along the way
“Americans have been through a tough few years, but I am optimistic about our country’s economic prospects,” US President Joe Biden reflects on the state of the economy in an op-ed for Yahoo News during early Friday morning in Asia, late Thursday elsewhere.
Key quotes
Americans’ resilience has helped us recover from the economic crisis created by the COVID-19 pandemic, families are finally getting more breathing room, and my economic plan is making the United States a powerhouse for innovation and manufacturing once again.
We entered this year with inflation still too high and families concerned about prices.
Tackling inflation and giving families more breathing room was and is my top economic priority.
We are making important progress transitioning from historic recovery to stable, steady growth.
For the last several months wages have been increasing faster than prices, gas prices are at their lowest levels since last summer, and year-over-year inflation has been slowing.
The Federal Reserve has a primary responsibility to control inflation, and I have appointed highly qualified people to lead that institution, given the critical importance of its dual mandate of maximum employment and stable prices. But Americans should have confidence that my plan is working.
We are seeing the results. The economy has created more than 10 million jobs since I took office, and the unemployment rate is near a 50-year low.
There’s no denying that it’s been a rough few years, with a global pandemic and global inflation that have lasted longer than almost anyone expected. But as we look back on 2022 — and look forward to what lies ahead — I have never been more confident about what the American people and the American economy can achieve.
EUR/USD licks its wounds
Following the comments from US President Biden, EUR/USD picks up bids to 1.0600, pausing the two-day downtrend.
Also read: EUR/USD struggles around 1.0600, US PCE Inflation, Durable Goods Orders eyed
-
22:39
GBP/USD Price Analysis: 200-SMA probes bears at monthly low
- GBP/USD seesaws near the key moving average after two-day losing streak that refreshed monthly low.
- Clear break of one-month-old support, bearish MACD signals favor sellers.
- Weekly resistance line, previous support from late November keeps buyers off.
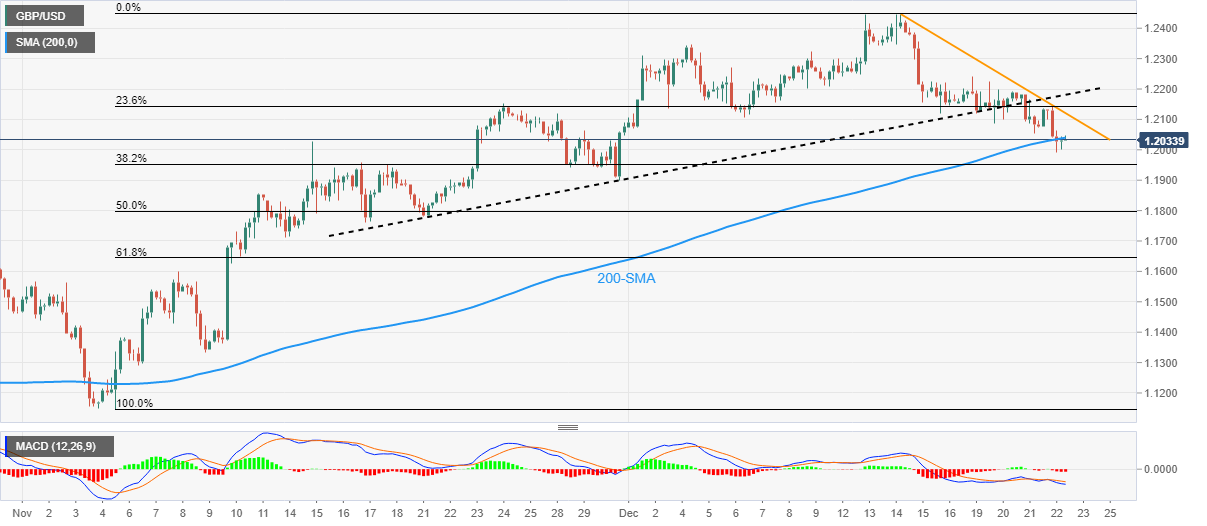
GBP/USD bears take a breather around the monthly low after two-day downtrend, marking rounds to 1.2030 during Friday’s Asian session, as the 200-SMA challenges the quote’s immediate downside.
Even so, the Cable pair’s sustained trading below the one-month-old ascending trend line, broken on Wednesday, joins the bearish MACD signals to keep sellers hopeful.
That said, the 38.2% Fibonacci retracement level of the GBP/USD’s November-December upside, near 1.1950, acts as nearby support for the pair sellers to watch should it manage to provide a clear break of the 200-SMA clutch around 1.2040.
Following that, the late November swing low of 1.1900 could act as an extra filter to the south before directing bears towards the 50% and the 61.8% Fibonacci retracements, respectively around 1.1800 and 1.1645.
It’s worth noting, however, that the GBP/USD pair’s sustained downside past 1.1645 defies the hopes of recovery and can push the prices towards November 09 low surrounding 1.1330.
Alternatively, a one-week-old downward-sloping resistance line, around 1.2120 by the press tie, guards the GBP/USD recovery before the support-turned-resistance line from late November, close to 1.2180 at the latest.
In a case where GBP/USD remains firmer past 1.2180, multiple hurdles around 1.2200 and 1.2340-40 could challenge the bulls ahead of highlighting the monthly peak of 1.2446.
To sum up, GBP/USD stays on the bear's radar even if the 200-SMA challenges the nearby downside.
GBP/USD: Four-hour chart
Trend: Further downside expected
-
22:16
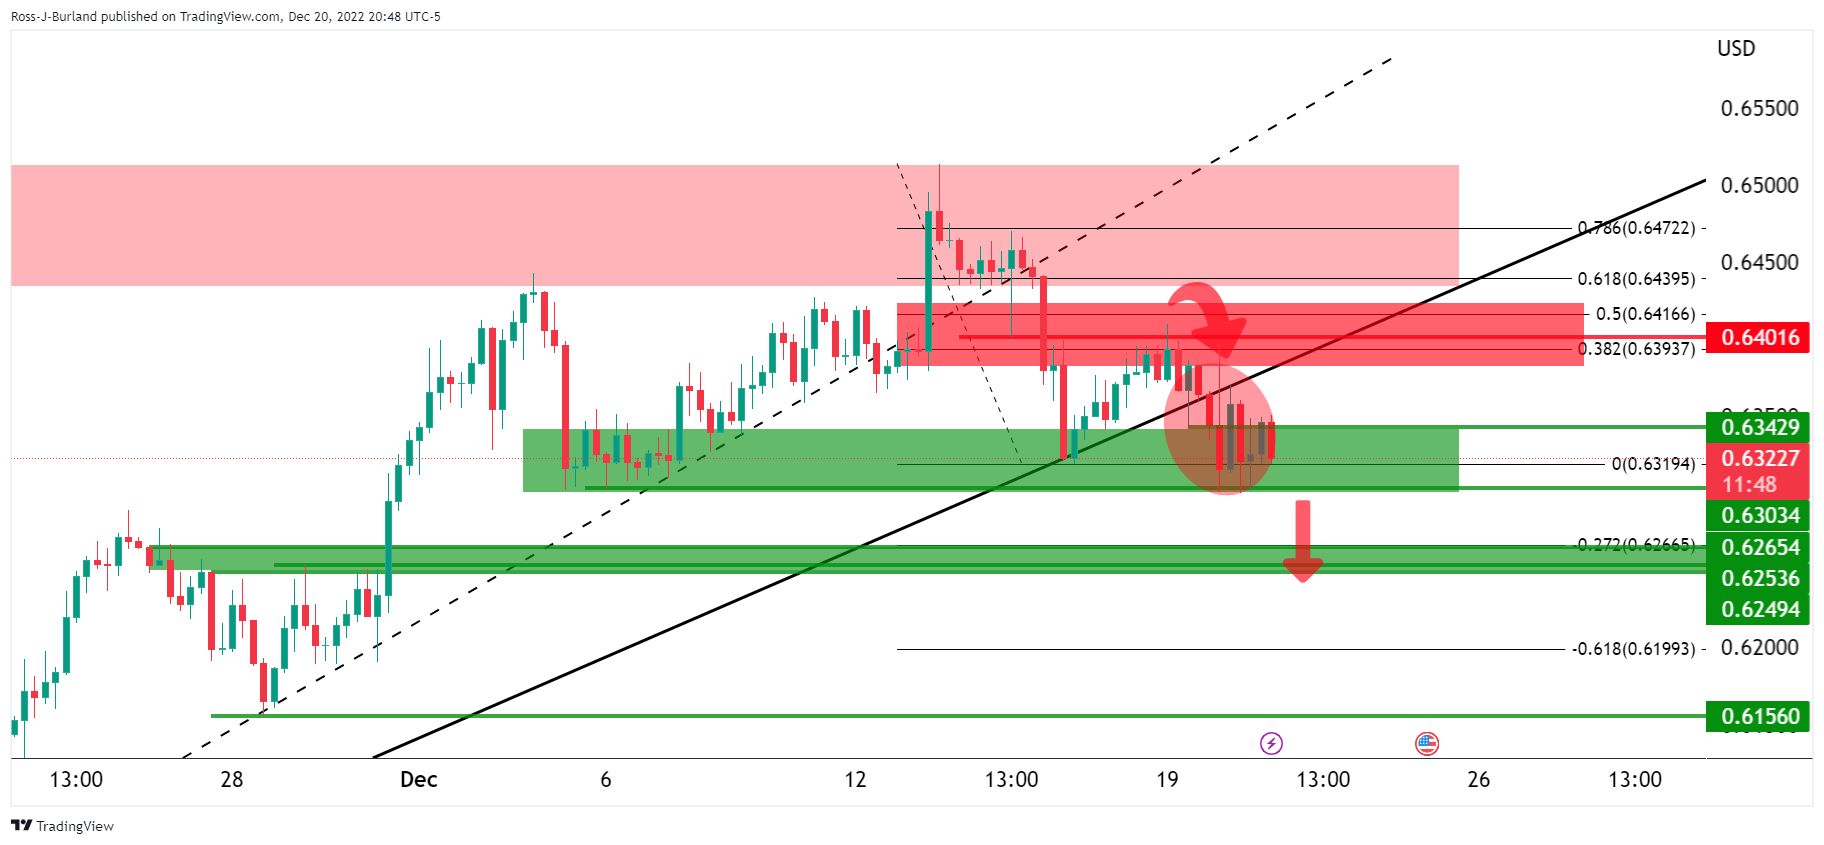
NZD/USD Price Analysis: Bulls eye a 50% mean reversion to 0.6280
- NZD/USD bears run into an area of support with a correction now on the cards.
- NZD/USD bulls eye a 50% mean reversion target that aligns with prior support.
As per the prior analysis, NZD/USD Price Analysis: Bears in charge and eye 0.6250, whereby the price was expected to continue lower, we have seen a resurgence in the US dollar that has subsequently knocked the bird off its perch and into the targeted area.
NZD/USD prior analysis
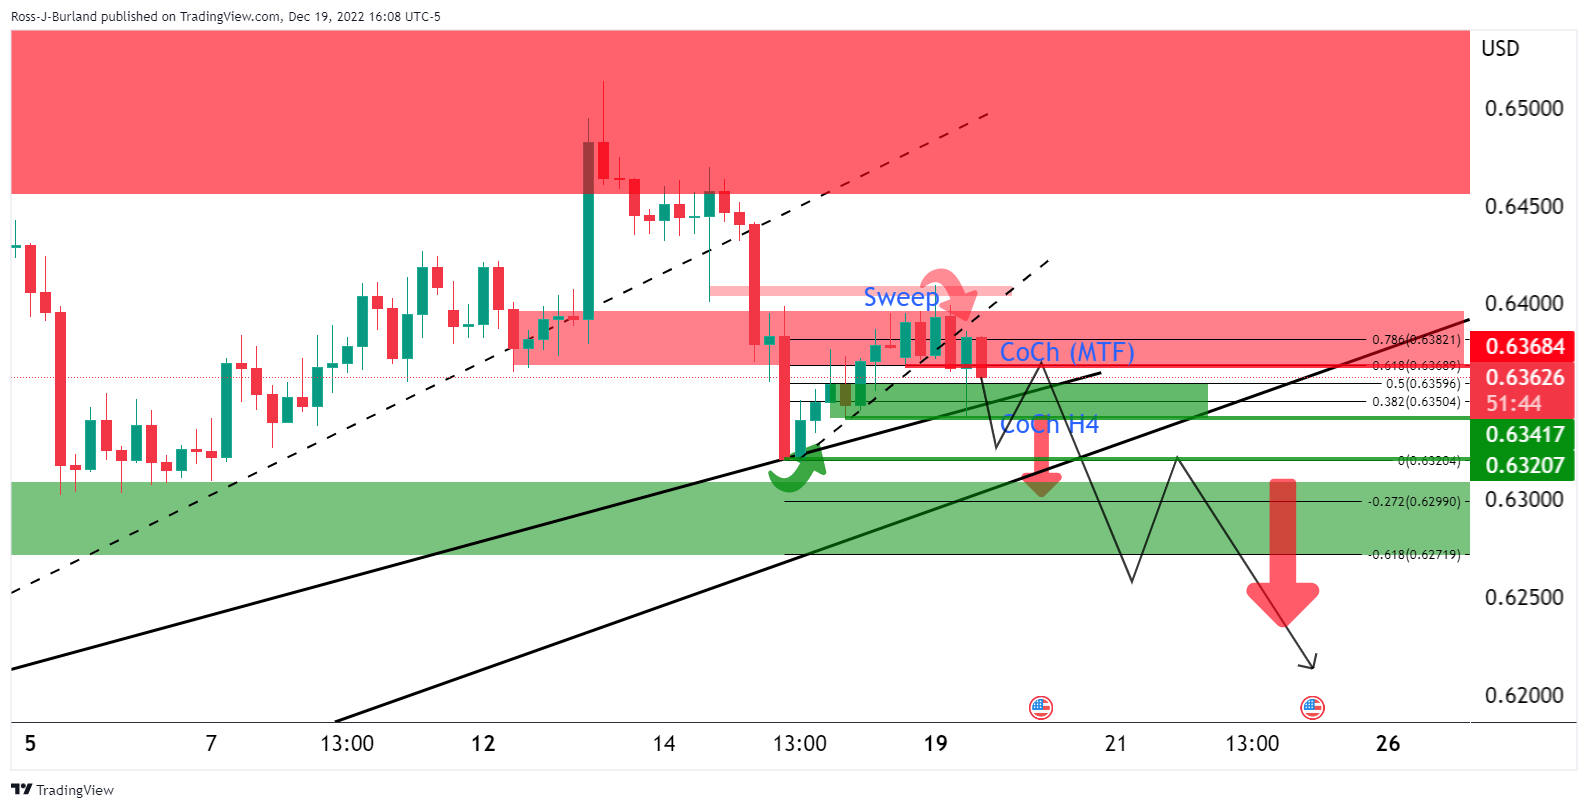
it was stated that the price had swept the liquidity near 0.64 in the form of stops and this had resulted in a move lower and a change of charter (CoCh MTF (multi time frame)) in structure, from bullish to bearish, on the lower time frames around 0.6370.
The price had crept into the targetted area in choppy market conditions. The bears needed to get below 0.6300. This was expected to take out critical trendline support and be the makings of a possible downside continuation for the rest of the year with 0.6250 eyed.
NZD/USD update
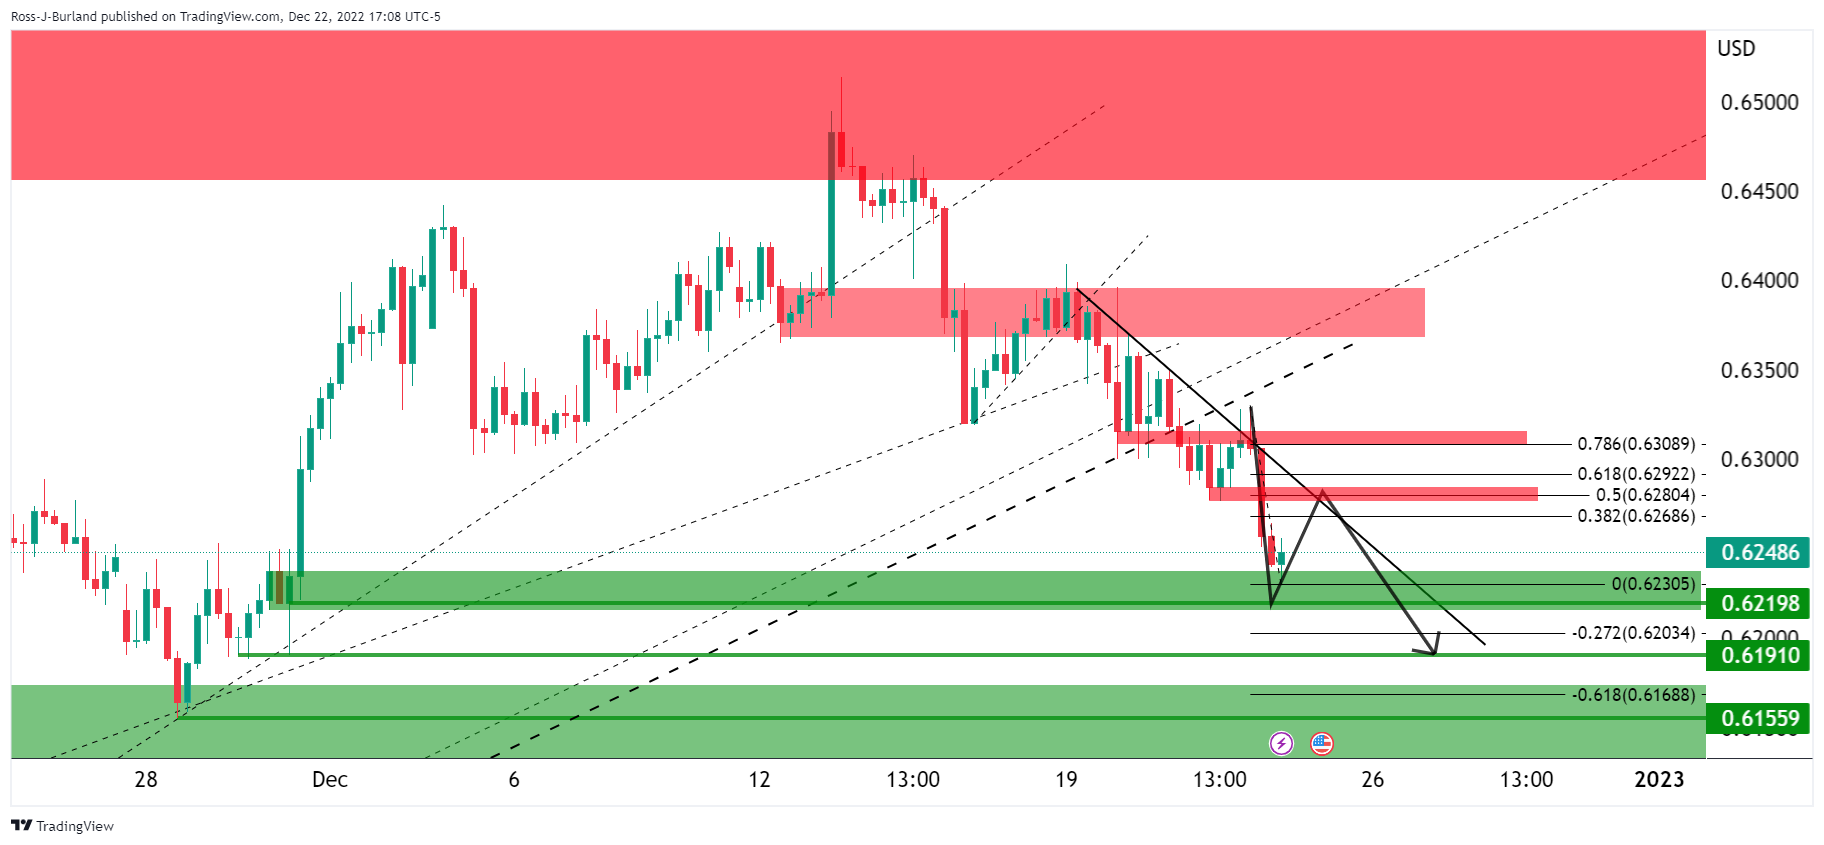
The price target was met in trade on Thursday and an upside correction could now be on the cards putting heat on to the breakout shorts from the 0.6300 area. A 50% mean reversion aligns with prior support near 0.6280.
-
22:14
EUR/USD struggles around 1.0600, US PCE Inflation, Durable Goods Orders eyed
- EUR/USD begins Friday on mixed sentiment after posting two-day downtrend.
- Firmer US data, geopolitical fears exert downside pressure amid sluggish session.
- News from China, US Senate lure buyers amid more hawkish ECB outlook than the Fed.
- US Core PCE Price Index, Durable Goods Orders for November will be crucial for clear directions.
EUR/USD bears run out of steam after a two-day losing streak as they brace for the key data on Friday. Even so, the buyers have a long way to go as the year-end holiday mood restricts the market moves. That said, the major currency pair refreshed weekly top the previous day before reversing from 1.0660, picking up bids to 1.0600 by the press time.
EUR/USD initially cheered risk-on mood and softer US Dollar, as well as the downbeat Treasury bond yields to favor buyers during early Thursday. The same could be linked to the sentiment-positive headlines from China and mixed US data, as well as the Bank of Japan’s (BOJ) another unscheduled bond operation. Also likely to have favored the pair buyers could be the hawkish comments from the European Central Bank (ECB) officials as Vice-President Luis de Guindos said on Thursday that “we should expect to raise interest rates at this pace for a period of time.”
Following that, firmer prints of the US growth and consumption data allowed the US Dollar to reverse the early losses and end the day on a positive side. That said, the US economy expanded at an annualized rate of 3.2% in the third quarter (Q3), per the final readings of the Gross Domestic Product (GDP), versus 2.9% previous estimates. Further, the Personal Consumption Expenditure (PCE) Prices match 4.3% QoQ estimations during Q3 2022 whereas the Core PCE improved to 4.7% QoQ versus 4.6% market forecasts.
It’s worth noting that the news surrounding China’s no quarantine limits for foreigners, starting from January, joins the US Senate’s passage of a $1.7 trillion government funding bill and offers positive support to the risk appetite. Alternatively, Ukrainian President Volodymyr Zelensky’s US visit and Russian President Vladimir Putin’s readiness to increase the country’s military potential weigh on the sentiment.
Amid these plays, Wall Street closed in the red while the US Treasury yields regain upside momentum after Wednesday’s pause to the run-up.
Looking forward, US Core Personal Consumption Expenditure (PCE) - Price Index, the Federal Reserve’s preferred inflation gauge, will join the monthly Durable Goods Orders to offer the one last shot of market activity before witnessing the holiday-linked inaction. Forecasts suggest that the US Core PCE Price Index remains unchanged at 0.2% MoM. However, the Annualized forecasts suggest softer figures of 4.7% YoY versus 5.0% previous readings. Additionally, US Durable Goods Orders could register a contraction of 0.6% in November compared to the previous increase of 1.1% (revised from 1.0%).
Technical analysis
A clear downside break of 1.0580 horizontal support, the previous resistance, appears necessary for the EUR/USD bears to retake control.
-
21:41
AUD/USD bears on the prowl on firm US Dollar
- AUD/USD bears move in on US Dollar strength.
- US Dollar in demand as hawkish Fed sentiment persists into the holidays.
AUD/USD is down by over 0.6%, losing territory from a high of 0.6767 and printing a fresh low of 0.6650. The US Dollar firmed on Thursday but as measured by the DXY index vs. a basket of currencies, it has so far failed to meaningfully recoup the 3.8% slump that followed Tuesday's Bank of Japan (BoJ) news. Nevertheless, US data has supported the hawkish sentiment surrounding the Federal Reserve (Fed).
The DX rallied into the 104.50s from a low of 103.75. The US Dollar, however, remains well below the highs for the month near 107.20 while US Treasury yields also edge up following the data on Thursday. The Department of Labor said Weekly Jobless Claims in the US rose less than expected. Seasonally adjusted numbers of initial Unemployment Claims rose by 2,000 to 216,000 in the week ended Dec. 17. The consensus on Econoday was for a 225,000 print. The previous week's level was revised up by 3,000 to 214,000. The four-week moving average tallied 221,750, sliding by 6,250 from the previous week's revised average of 228,000. Unadjusted claims declined by 4,064 on a weekly basis to 247,867.
Meanwhile, domestically, earlier in December, the Reserve Bank of Australia (RBA) raised its policy rate by 25 basis points to 3.1%, taking borrowing costs to a level not seen in a decade. The RBA said that it expects to tighten further to bring down inflation but analysts at Rabobank explained that a less aggressive RBA interest rate cycle from here combined with concerns that Chinese demand may be hampered by a surge in Covid-19 are risks to the outlook for the AUD.
-
20:42
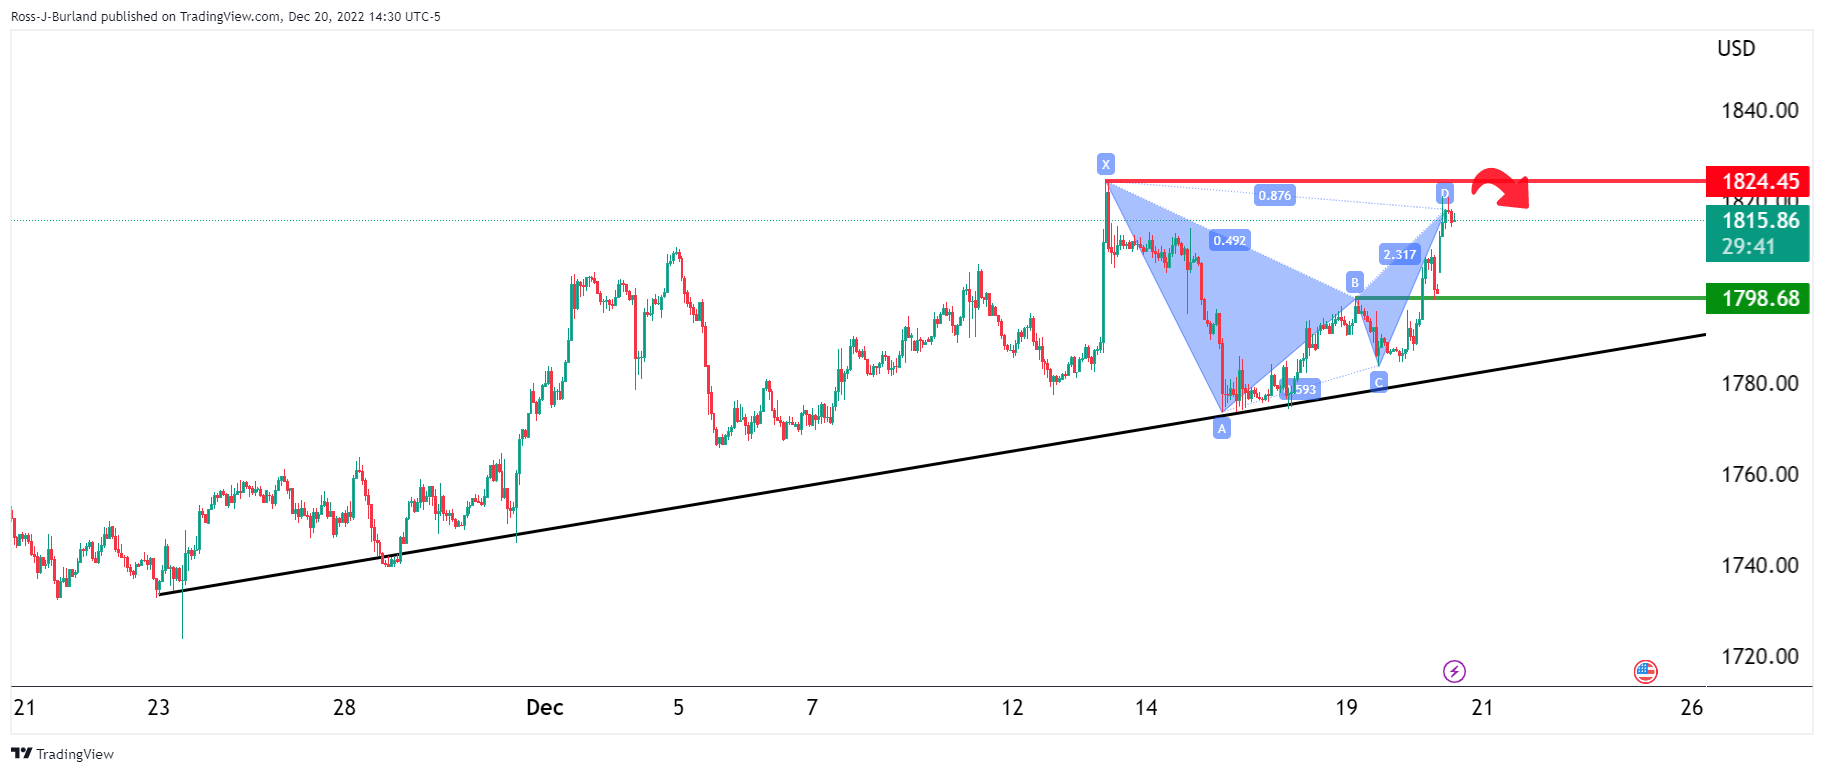
Gold Price Forecast: XAU/USD bulls need to commit at key trendline support
- Gold price meets major trendline support in blow-off move on Thursday.
- The Federal Reserve theme is alive and kicking, weighing on the Gold price.
- US Treasury yields and US Dollar benefitted from sold Weekly Jobless Claims.
The Gold price has dumped to a critical area on the daily charts, as shown below, losing some 1.5% on Thursday. The yellow metal is back below the psychological $1,800 area as the Gold price continues to face resistance in attempts to break out to the upside. Most prevalent in the fundamentals surrounding the Gold price has been the sentiment in markets for a hawkish Federal Reserve (Fed) in 2023.
US Treasury yields rally, weighing on Gold price
US Treasury yields are higher following the data on Thursday showed Weekly Jobless Claims in the US rose less than expected. The US 10-year Treasury yield is up 0.14% at the time of writing, but it rose to a high of 3.692% earlier in the day, bearish for the Gold price as the shiny metal offers no interest.
The US Dollar and Gold price took their cues when the Department of Labor said seasonally adjusted numbers of initial unemployment claims rose by 2,000 to 216,000 in the week ended Dec. 17. The consensus on Econoday was for a 225,000 print. The previous week's level was revised up by 3,000 to 214,000. The four-week moving average tallied 221,750, sliding by 6,250 from the previous week's revised average of 228,000. Unadjusted claims declined by 4,064 on a weekly basis to 247,867.
US Dollar in demand
The US Dollar was in demand following the numbers as these are the type of data that could keep the Federal Reserve (Fed) hawkish for longer. The Fed last week projected at least an additional 75 basis points of increases in borrowing costs by the end of 2023. DXY, an index that measures the US Dollar against a basket of currencies rallied into the 104.50s from a low of 103.75. The US Dollar, however, remains well below the highs for the month near 107.20 and the Gold price has been able to capitalize on the slide over recent weeks.
Meanwhile, analysts at Brown Brothers Harriman noted that the current consensus for Nonfarm Payrolls (NFP) stands at 208k vs. 263k in November, with the Unemployment Rate seen steady at 3.7% and average hourly earnings falling a tick to 5.0% YoY. ''While job growth is clearly slowing, it’s not by enough to materially impact unemployment and so we continue to believe that the Fed will have to do more than the market is expecting.''
Gold price technical analysis
In a series of prior analyses, it was stated that the Gold price 1-hour picture was bearish while below the resistance near $1,825 and on the backside of the micro trendline and there are eyes on eyes on $1,795.
Gold price, prior analysis
- Gold Price Forecast: XAU/USD bears lurking at key resistance, eyes on $1,795
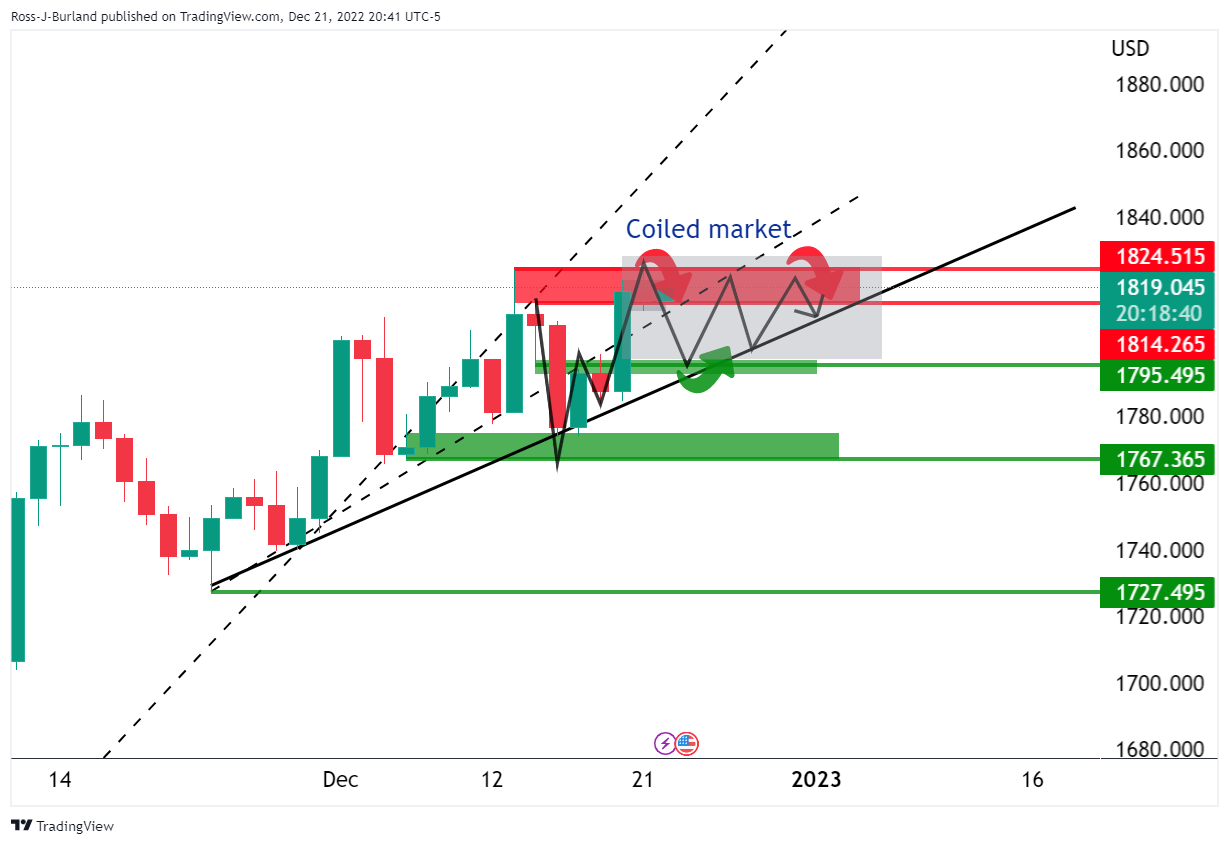
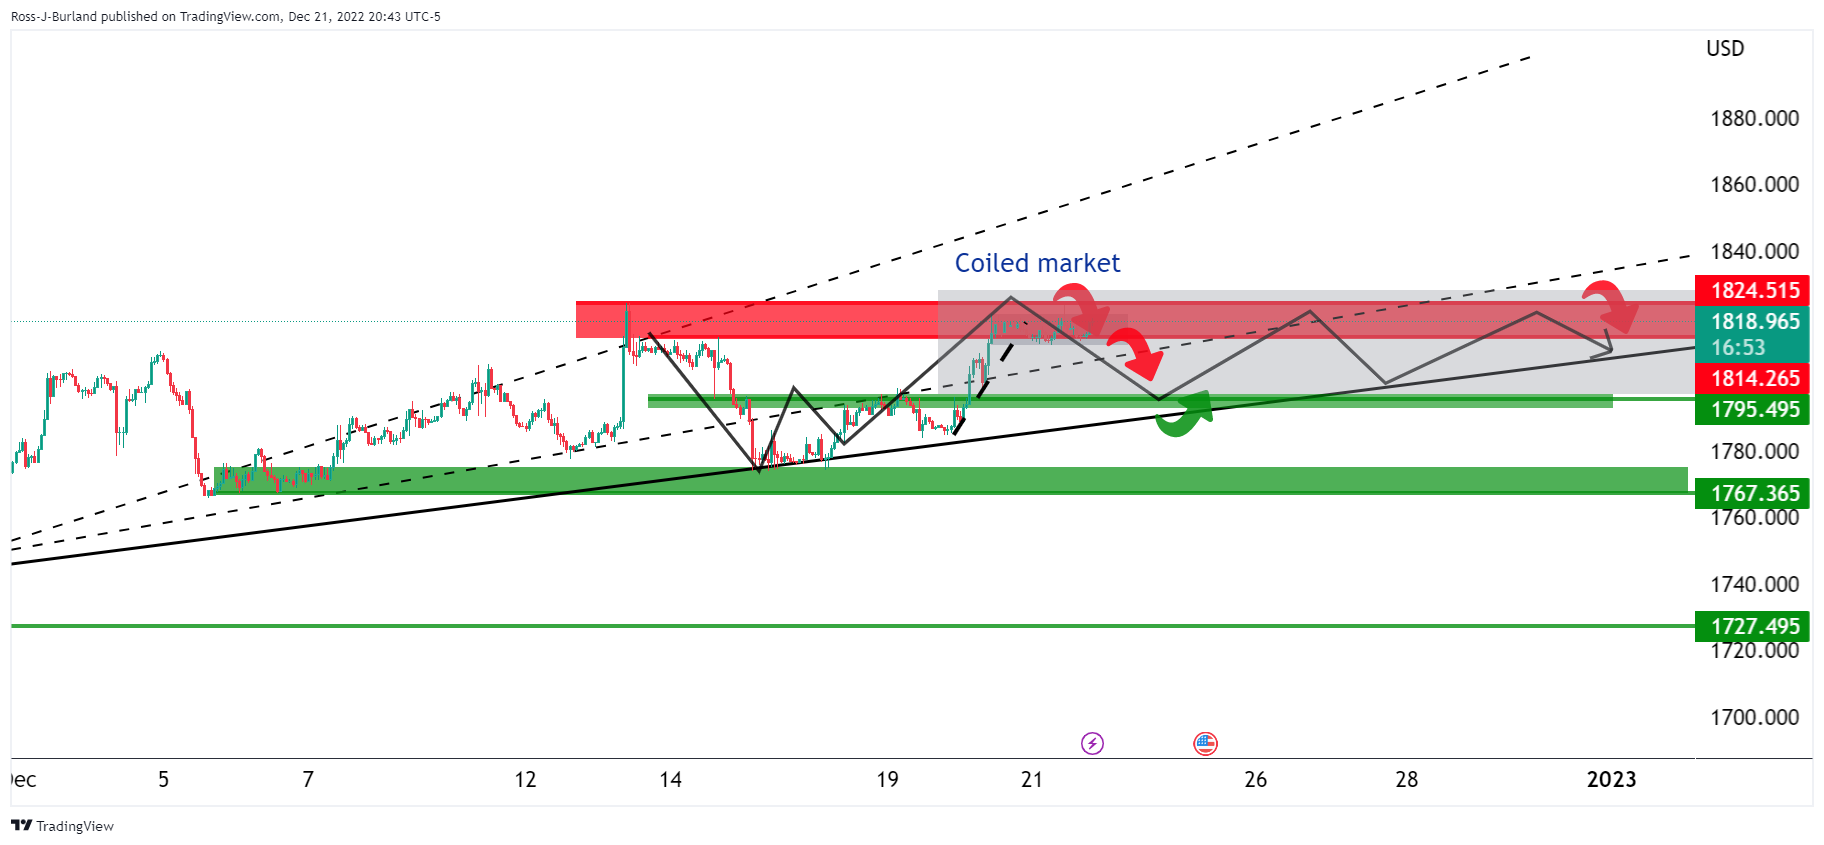
- Gold Price Forecast: XAU/USD reversing its technical path (or is it?) despite Bank of Japan surprise move:
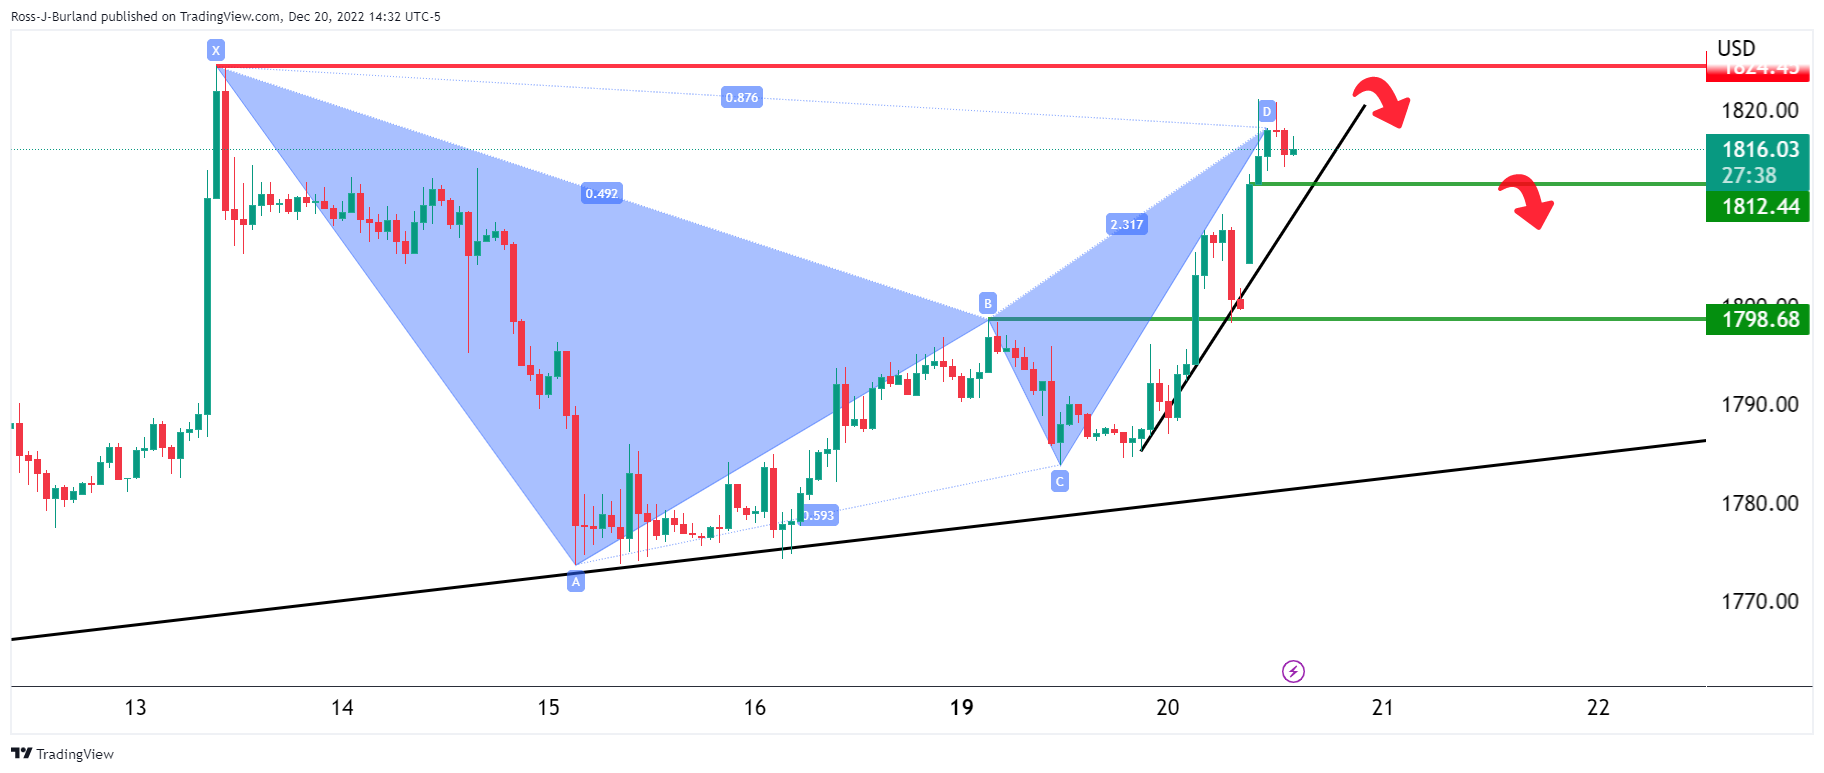
The Gold price 1-hour picture is bearish while below the resistance near $1,825 but not until the Gold price moves to the backside of the micro trend line:
On the 15-minute chart for the Gold price, we drew the extensions to the downside based on the presumed sideways consolidation box that had been forming over the prior sessions/days.
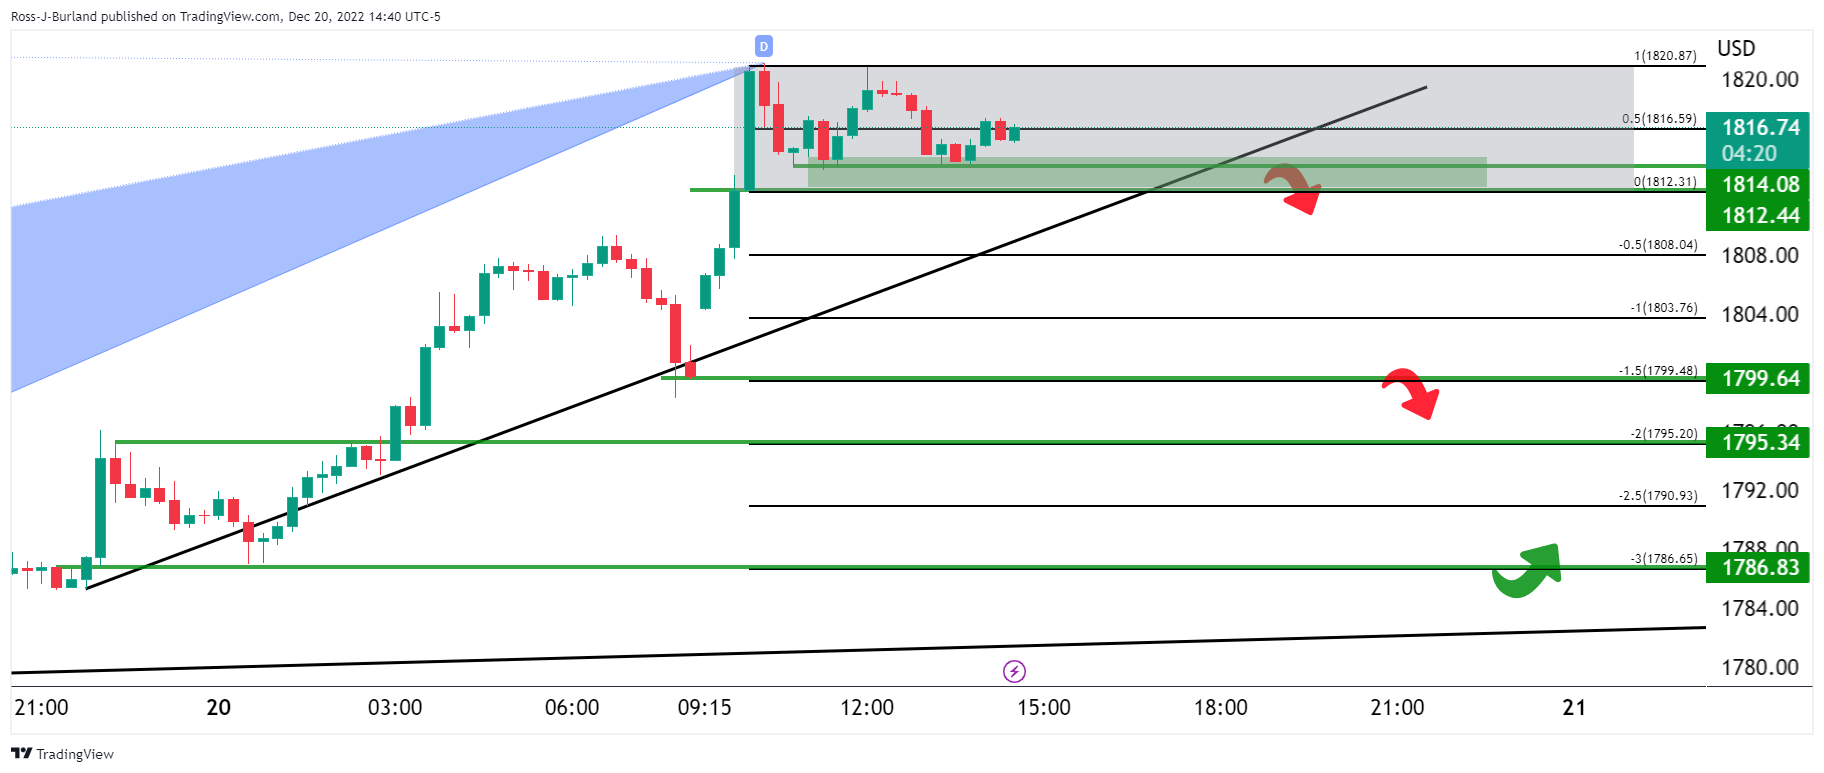
Gold price, update
As illustrated, the Gold price dropped to the targetted area and exceeded it into the $1,784s for a 300% measured move and to where the prior micro trend started off at.
At this juncture, a correction in the Gold price would be expected, respecting the bullish trend:
Failing this, then an even deeper move in Gold price would be on the cards for the days ahead, making the case for a significant downside correction with $1,775 eyed.
-
20:15
Forex Today: US Dollar demand resurges amid upbeat US growth data
What you need to take care of on Friday, December 23:
The US Dollar recovered its shine on Thursday, and despite still trading within familiar levels against most of its major rivals, it currently stands near weekly highs. The Greenback got boosted by an upbeat US Gross Domestic Product report, as the Q3 GDP was upwardly revised from 2.9% to 3.2%.
By contrast, UK economic progress shrank at a faster-than-anticipated pace, with the Q3 GDP down by 0.3%. The news fueling speculation the UK’s recession will likely last throughout the upcoming year.
Asian stock markets closed in the green, but European indexes ended the day with modest losses. Wall Street posted substantial losses, trimming all of its weekly gains.
Positive headlines came from China, as the local government announced they would ease travel quarantine restrictions for foreigners starting next month.
Also, the US Senate approved a $1.7 trillion government funding bill and passed it to the House, where it is expected to also pass before the end of the day.
EUR/USD flirted with the weekly high but retreated from the 1.0650 price zone, and settled at 1.0580. GBP/USD, on the other hand, bounced modestly from 1.1991, a fresh three-week low.
The AUD/USD pair reached a fresh weekly high of 0.6766 but ended the day in the red, down 100 pips. The USD/CAD advanced and currently stands at 1.3650. Easing crude oil prices weighed on the CAD. WTI ended the day in the red at $77.90 a barrel.
Gold also fell, and currently trades at around $1,789 a troy ounce.
Like this article? Help us with some feedback by answering this survey:
Rate this content -
19:38
US Senate approved a $1.7 trillion government funding bill
The Senate has approved a $1.7 trillion government funding bill and the legislation is on the way to the House, ahead of the Friday night deadline to avert a partial federal government shutdown.
The final vote was 68 in favour and 29 opposed and if the House passes the bill, it will represent a significant bipartisan win for President Joe Biden. If the House were to fail to advance this bill, it is likely that this will be moved to the new year when Republicans will control the House.
-
19:07
EUR/USD Price Analysis: Bears ink in their teeth to test bulls at a critical support structure
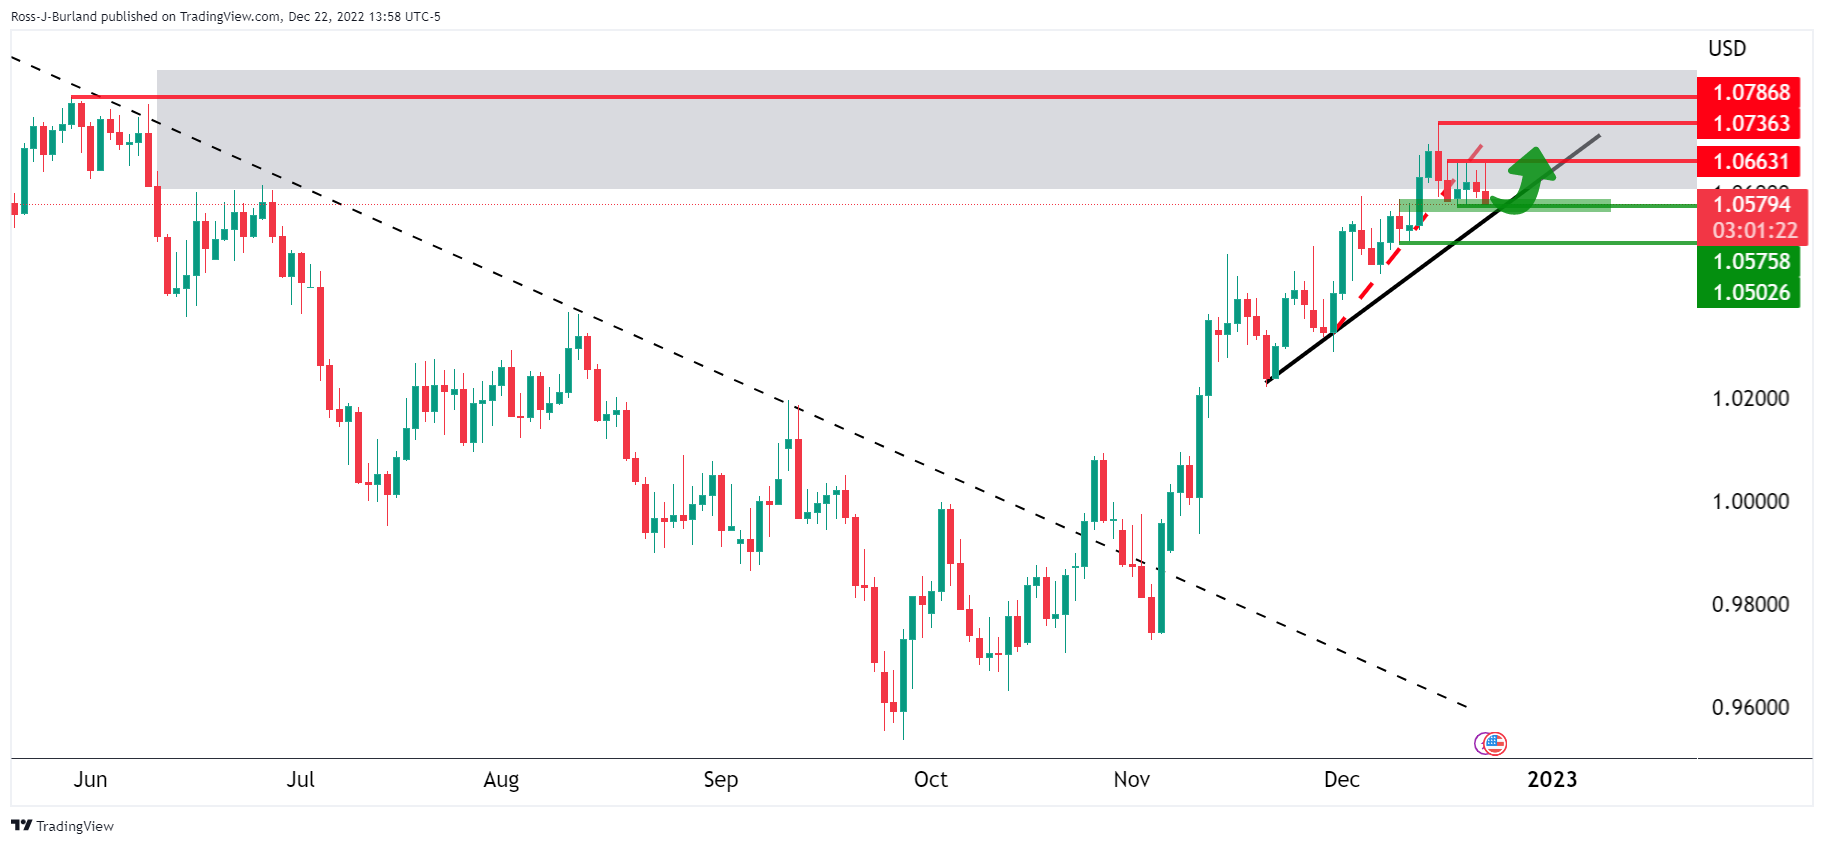
- EUR/USD is testing a critical support structure that guards a breakout.
- EUR/USD has otherwise supported within the bullish cycle with prospects of a bullish extension.
EUR/USD is moving in towards a price imbalance between 1.0580 and 1.0560 having already made a low of 1.0582. The price is coiled below the top of the bullish cycle up at 1.0763 and is breaking down the trend which leaves the bias to the downside. The following illustrates the prospects of an explosive move below trendline support and given the holidays, a narrow range could be the fuel for the same in the full trading days between Christmas and New Year.
EUR/USD daily charts
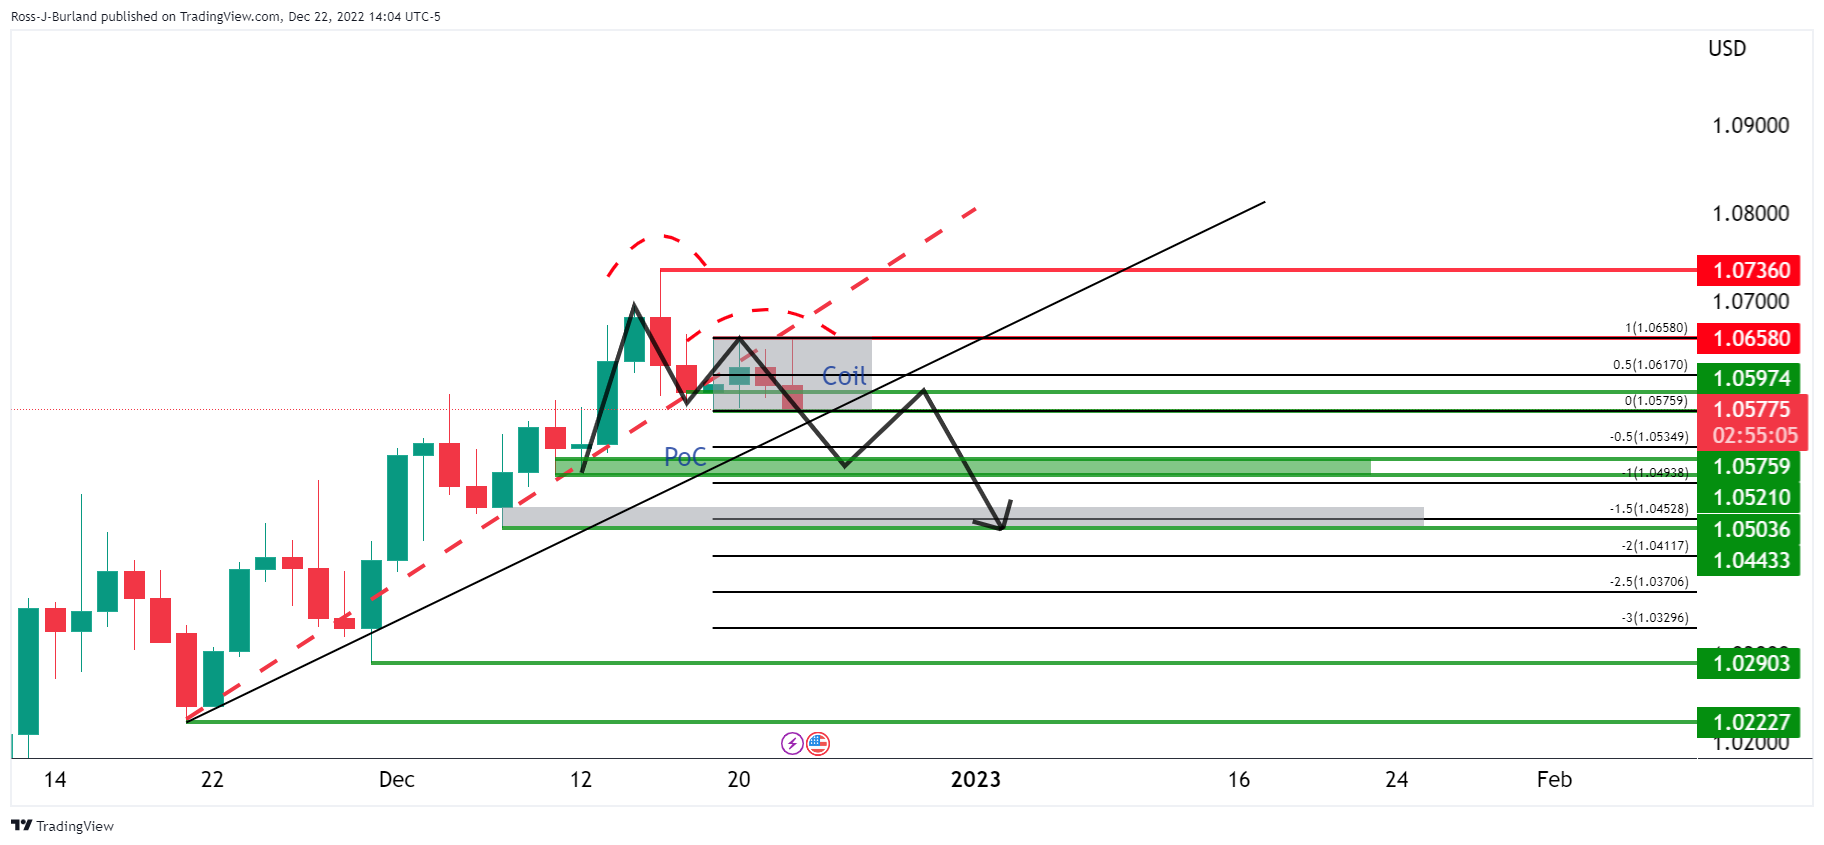
The breakout traders buying at the highs of the day are trapped following an inside day on Wednesday. The subsequent blow-off to the downside on Thursday is keeping longs trapped all the way to test the coil's lows. A break of 1.0575 opens the risk of a measured move near the Point of Control (Poc) of the bullish trend's swing lows of 1.0227 to cycle highs of 1.0736.
The PoC comes in at 1.0520. A full 100% range expansion comes in at 1.0493. If this scenario were to play out, an M-formation would be left on the chart and typically, the price would correct back towards the neckline for the restest of prior support prior to the next bearish impulse. In this case, 1.0450 will be eyed.
On the flip side:
The price remains in a bullish trend and there is every possibility that we could see a higher for days ahead, i.e. consolidation within the bullish trendline and horizontal support of 1.0575 or thereabouts followed by a surge in demand to target fresh cycle highs.
-
17:58
GBP/USD bears move in and eye further downside towards 1.1900
- GBP/USD broke out of a coil and there are eyes on a move towards 1.1900 and 1.1778 thereafter.
- US Dollar is in demand due to prospects of a higher for longer from the Fed in 2023.
GBP/USD is pressured by a resurgence in the US dollar that is getting a boost from stronger-than-forecast data, underpinning the hawkish Federal Reserve outlook and higher rate expectations for 2023. DXY, an index that measures the greenback against a basket of currencies has rallied into the 104.50s from a low of 103.75 although remains well below the highs for the month near 107.20.
The data on Thursday showed weekly jobless claims in the US rose less than expected. The Department of Labor said seasonally adjusted numbers of initial unemployment claims rose by 2,000 to 216,000 in the week ended Dec. 17. The consensus on Econoday was for a 225,000 print. The previous week's level was revised up by 3,000 to 214,000. The four-week moving average tallied 221,750, sliding by 6,250 from the previous week's revised average of 228,000. Unadjusted claims declined 4,064 on a weekly basis to 247,867.
Federal Reserve hawkish for longer
The greenback was in demand following the numbers as these are the type of data that could keep the Federal Reserve hawkish for longer. The Fed last week projected at least an additional 75 basis points of increases in borrowing costs by the end of 2023. Meanwhile, analysts at Brown Brothers Harriman noted that the current consensus for Nonfarm Payrolls stands at 208k vs. 263k in November, with the Unemployment Rate seen steady at 3.7% and average hourly earnings falling a tick to 5.0% YoY. ''While job growth is clearly slowing, it’s not by enough to materially impact unemployment and so we continue to believe that the Fed will have to do more than the market is expecting.''
BoE tightening expectations subdued
Meanwhile, domestically, the UK reported third-quarter current account and final Gross Domestic Produce data. The QoQ growth rate was marked down a tick to -0.3%, while the YoY was revised to 1.9% vs. 2.4% preliminary. Private consumption, government spending, and investment were all marked down significantly, but this was partially offset by stronger net exports. ''This offset is unlikely to be sustained while domestic activity will continue to weaken under the weight of fiscal and monetary tightening,'' the analysts at BBH argued. ''We see downside risks'' the analysts added. ''Bank of England tightening expectations remain subdued. WIRP suggests a 50 bp hike on February 2 is about 80% priced in, with no odds of a larger 75 bp hike.''
GBP/USD technical analysis
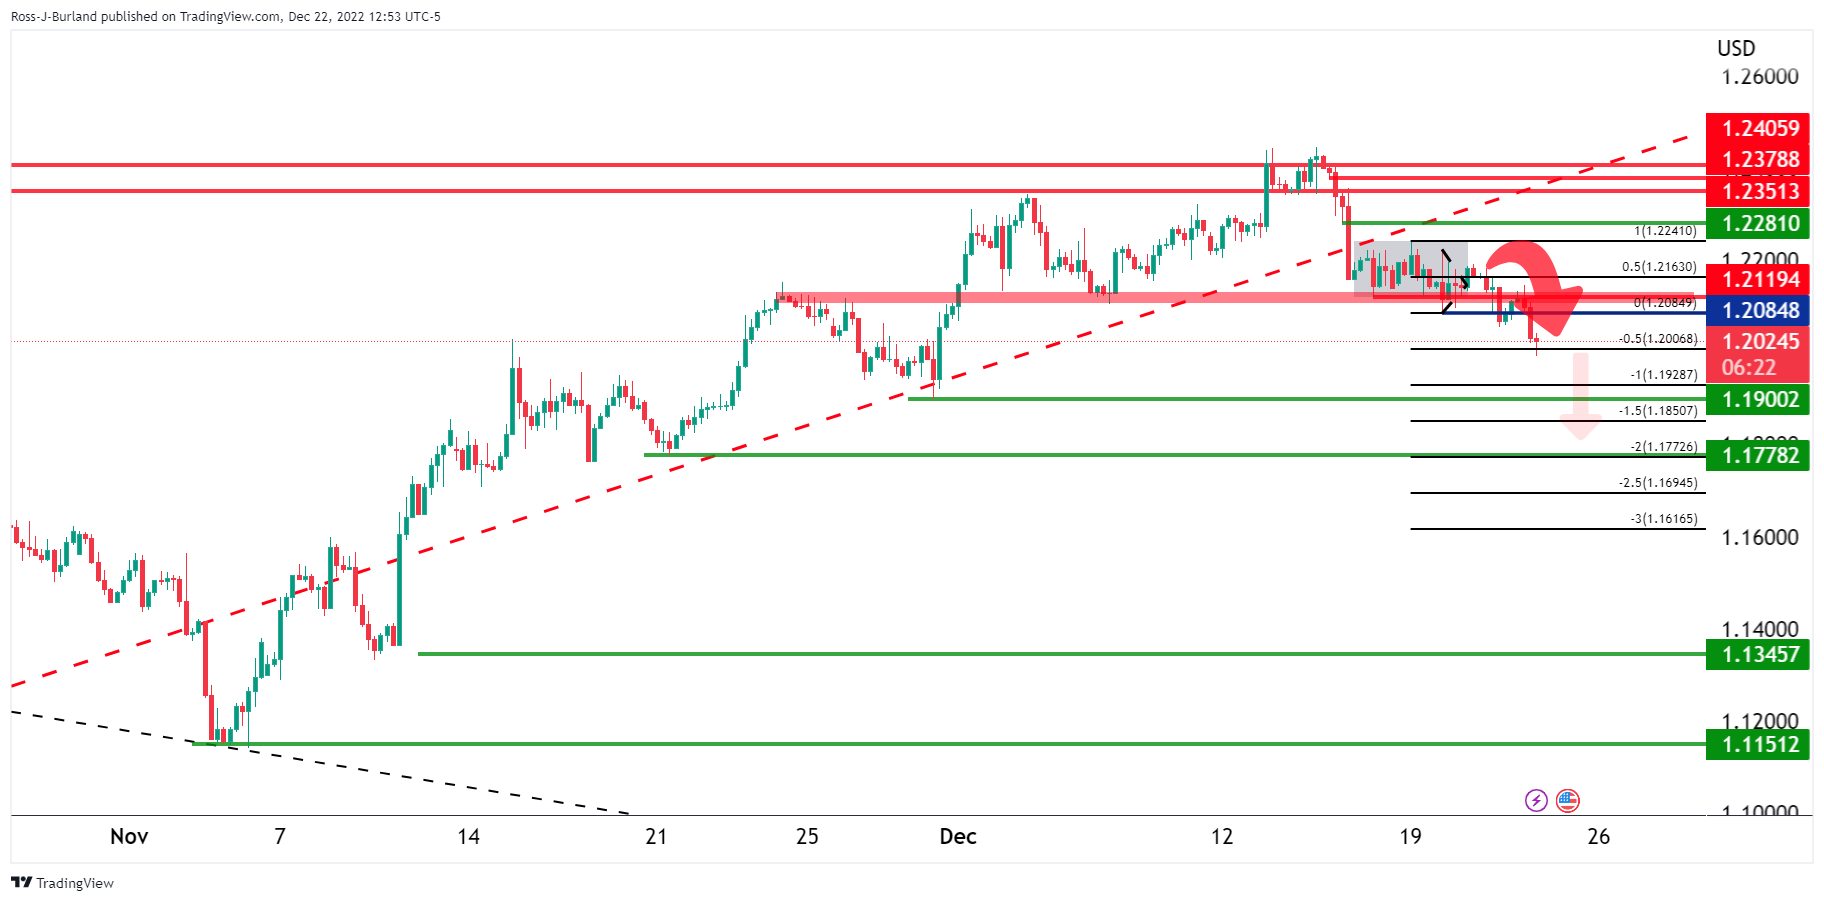
GBP/USD broke out of the coil and while being on the backside of the bull cycle trend and below 1.2100, there are eyes on a move towards 1.1900 and 1.1778 thereafter.
-
16:54
United States 4-Week Bill Auction fell from previous 3.78% to 3.61%
-
16:24
AUD/USD reverses and tumbles below 0.6700 as Dollar soars
- US Dollar rises across the board after US data and amid risk aversion.
- US Q3 GDP revised from 2.9% to 3.2%.
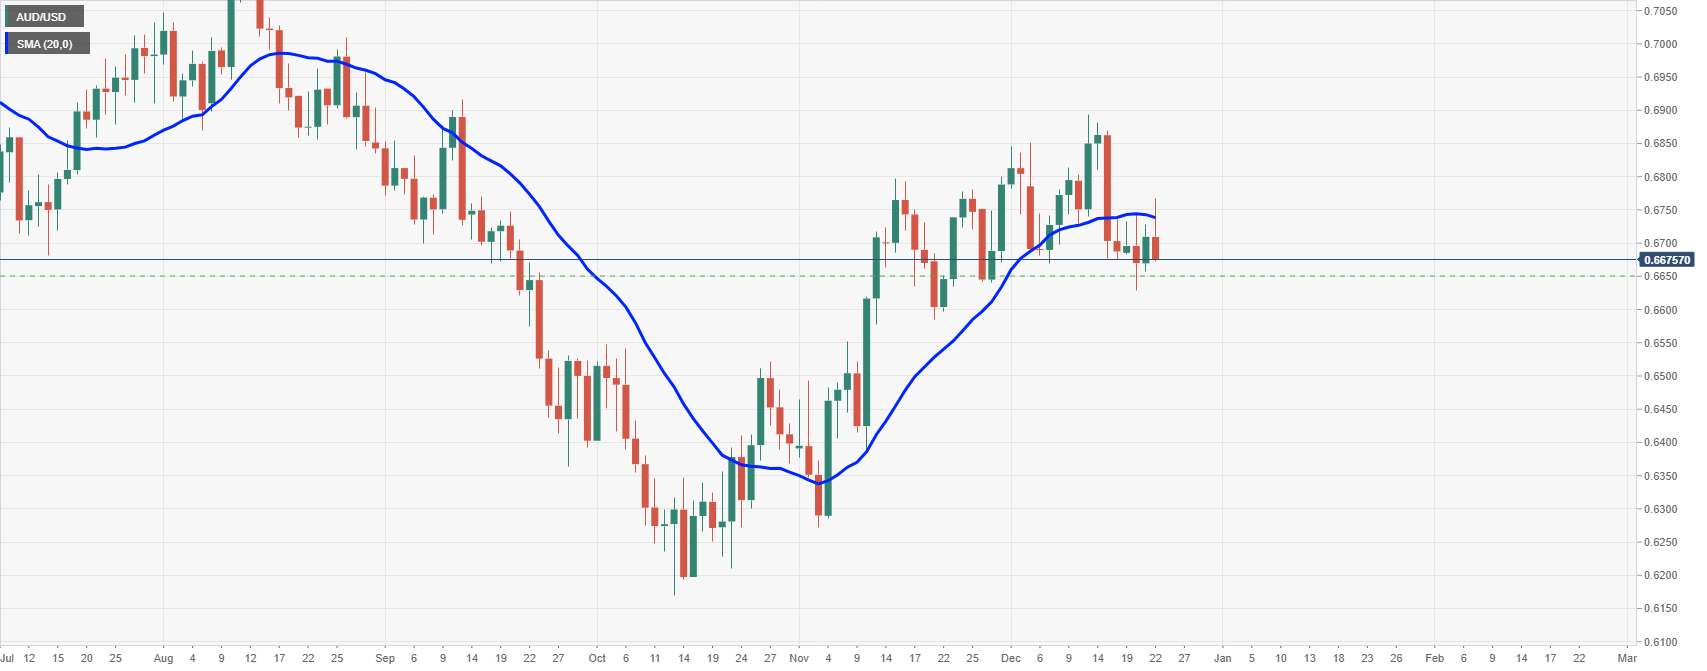
- AUD/USD again rejected from above the 20-day SMA.
The AUD/USD dropped further during the American session and printed a fresh daily low at 0.6672. Earlier on Thursday is traded at 0.6767, the highest level in a week. The move lower took place amid a stronger US Dollar across the board.
The greenback gained momentum following the release of US economic data. The economy expanded during the third quarter at an annualized rate of 3.2% above the 2.9% of the previous estimate. Price indicators of the Q3 GDP report were also revised higher. Initial Jobless Claims rose to 216K below the 222K of market consensus while Continuing Claims dropped for the first time in weeks from 1.678 million to 1.672 million.
In Wall Street, the Dow Jones is falling by 1.35% and the Nasdaq tumbles by 2.55%, on another volatile session. US yields rose sharply after US data, helping the Dollar and then pulled back.
The AUD/USD has fallen by 1.45% from the top of the day, erasing all daily gains. Price was rejected from above the 20-day Simple Moving Average (today at 0.6740) that is turning south. A daily close well above would be a positive technical development for the Aussie. While below that level, risks are biased to the downside. The next strong support could be seen around 0.6650.
AUD/USD daily chart
-
15:58
United States Kansas Fed Manufacturing Activity registered at -13 above expectations (-16) in December
-
15:30
United States EIA Natural Gas Storage Change above forecasts (-93B) in December 16: Actual (-87B)
-
15:14
USD/JPY jumps to 132.70 amid a stronger US Dollar
- US Dollar soars across the board after US data.
- Equity prices in Wall Street reversed sharply, post important losses.
- USD/JPY hits two-day highs, fails to consolidate above 132.50.
The USD/JPY rose to 132.73 after the beginning of the American session and following the release of US economic data. It then pulled back finding support above 132.15.
So far, the pair has been rejected from above 132.50. A consolidation above the mentioned level would strengthen the US Dollar. On the flip side, a break under 131.50 would expose 131.00.
Dollar up after data
Economic data released in the US on Thursday showed the economy expanded at an annualized rate of 3.2% during the third quarter, above the 2.9% of the previous estimate. Price indicators were also revised higher. Initial Jobless Claims rose to 216K below the 222K of market consensus while Continuing Claims fell for the first time in weeks from 1.678 million to 1.672 million.
US figures came in above expectations and triggered an intraday rally of the US Dollar and a decline in equity and bond prices. The Dow Jones extended losses, a few minutes after the opening is falling by 0.96% and the Nasdaq tumbles by 1.75%. The Japanese Yen received some support from the deterioration in market sentiment and printed fresh highs against currencies like the Aussie and the Kiwi.
The key move for the USD/JPY came from the bond market. Treasury yields rose to fresh daily highs boosting the pair. The US 10-year bond yield climbed from 3.64% to 3.69% while the US 2-year yield soared from 4.20% to 4.26%.
Technical levels
-
14:51
Gold Price Forecast: XAU/USD tumbles after US data, hits two-day lows under $1,800
- Gold is under pressure as US yields jump after US data.
- US Q3 GDP was revised from 2.9% to 3.2%.
- Wall Street extends losses, US Dollar soars.
Gold prices dropped sharply from nearly $1,820, reaching levels under $1,800 following the release of US economic reports.
Looking for Santa’s rally
Economic data released in the US showed the economy expanded at an annualized rate of 3.2% during the third quarter, above the 2.9% of the previous estimate. Price indicators were also revised higher.
Following the numbers, US yields jumped. The US 10-year yield rose from 3.64% to 3.67% while the US 2-year yield soared from 4.20% to 4.26%. The move in the bond market weighed on XAU/USD that sank. At the same time, equity prices in Wall Street extended losses. As of writing, the Dow Jones is losing 0.93% and the SP& 500 drops by 1.24%.
Gold bottomed at $1,798, the lowest level in two days. It is hovering around $1,800 far from the recent high of $1,824. The correction is taking place after the yellow metal was unable to consolidate above the $1,820 area. A daily close above, should open the doors to more gains.
Technical levels
-
14:03
Looking for AUD to outperform both GBP and EUR – Rabobank
"On the assumption that China re-opens next year and that the prices of Australia’s energy exports remain firm, we would look for the AUD to outperform both the GBP and the EUR," said Rabobank analysts.
AUD is less susceptible to speculative flows
"A weakening of global growth may traditionally be associated with a softer AUD. The Aussie has previously behaved as the ‘risky’ currency within the G10 basket. This profile has its roots in the currency’s commodity links (seen as a proxy for growth), the country’s previous relatively higher interest rate profile and its long standing current account deficit."
"The interest rate spread is no longer as marked, and Australia no longer runs a current account deficit. This likely means that the AUD is less susceptible to speculative flows."
"We look for GBP/AUD to retreat towards 1.67 in the middle of next year and for EUR/AUD to drop below 1.50 on a 6 month view."
-
13:39
US: Weekly Initial Jobless Claims rise to 216K in the week ending December 17
- Initial Jobless Claims in the US increased by 2,000 in the week ending December 17.
- US Dollar Index posts small daily gains above 104.00.
There were 216,000 initial jobless claims in the week ending December 17, the weekly data published by the US Department of Labor (DOL) showed on Thursday. This print followed the previous week's print of 214,000 (revised from 211,000).
Further details of the publication revealed that the advance seasonally adjusted insured unemployment rate was 1.2% and the 4-week moving average was 221,750, a decrease of 6,250 from the previous week's revised average.
"The advance number for seasonally adjusted insured unemployment during the week ending December 10 was 1,672,000, a decrease of 6,000 from the previous week's revised level," the DOL noted.
Market reaction
US Dollar Index inches higher after the report and was last seen posting small daily gains at 104.30.
-
13:39
USD/CAD recovers further from one-week low, refreshes daily high post-US GDP
- USD/CAD rebounds swiftly from a one-week low touched earlier this Thursday.
- The emergence of some USD buying is seen as a key factor acting as a tailwind.
- An upward revision of the US GDP remains supportive of the intraday move up.
- Bullish oil prices could underpin the Loonie and keep a lid on any further gains.
The USD/CAD pair stages a goodish rebound from the 1.3570 area, or a one-week low touched earlier this Thursday and hits a fresh daily high heading into the North American session. The pair is currently placed around the 1.3635-1.3640 area, up over 0.20% for the day, and for now, seems to have snapped a three-day losing streak.
A modest pullback in the US equity futures assists the safe-haven US Dollar to recover a major part of its intraday losses, which, in turn, is seen acting as a tailwind for the USD/CAD pair. The USD gets an additional lift following an upward revision of the US GDP print, which showed that the economy expanded by a 3.2% annualized pace during the third quarter. This was well above the 2.9% estimated previously and favours the USD bulls. That said, the ongoing retracement slide in the US Treasury bond yields should keep a lid on any meaningful upside for the greenback.
Despite the Fed's hawkish commentary, investors expect the US central bank to pivot to something more neutral and drag the US Treasury bond yields lower. Apart from this, bullish crude oil prices continue to underpin the commodity-linked Loonie and might further contribute to capping the the USD/CAD pair. Crude oil prices climb to a two-and-half-week high amid the optimism over fuel demand recovery. That said, worries about a surge in new COVID-19 cases could act as a headwind for the black liquid. The mixed fundamental backdrop warrants some caution for aggressive traders.
Technical levels to watch
-
13:33
US: Economy grows at an annualized rate of 3.2% in Q3 vs. 2.9% expected
- US GDP grew at an annualized rate of 3.2% in Q3.
- US Dollar Index holds above 104.00 after the growth data.
The US economy expanded at an annualized rate of 3.2% in the third quarter, the US Bureau of Economic Analysis' (BEA) final estimate showed on Thursday. This reading came in better than the previous estimate and the market expectation of 2.9%.
"The updated estimates primarily reflected upward revisions to consumer spending and nonresidential fixed investment that were partly offset by a downward revision to private inventory investment.," the BEA explained in its publication.
Market reaction
The US Dollar Index edged slightly higher with the initial reaction and was last seen trading flat on the day at 104.22.
-
13:31
United States Personal Consumption Expenditures Prices (QoQ) in line with expectations (4.3%) in 3Q
-
13:31
United States Core Personal Consumption Expenditures (QoQ) came in at 4.7%, above expectations (4.6%) in 3Q
-
13:30
United States Gross Domestic Product Price Index came in at 4.4%, above forecasts (4.3%) in 3Q
-
13:30
United States Gross Domestic Product Annualized came in at 3.2%, above forecasts (2.9%) in 3Q
-
13:30
United States Continuing Jobless Claims below forecasts (1.683M) in December 9: Actual (1.672M)
-
13:30
United States Initial Jobless Claims came in at 216K, below expectations (222K) in December 16
-
13:30
United States Initial Jobless Claims 4-week average down to 221.75K in December 16 from previous 227.25K
-
13:07
Canada: Inflation to undershoot BOC's Q4 forecast of 7.1% y/y – TDS
TD Securities analysts noted that a sufficiently weak growth context in late 2022 and early 2023 might be enough to keep the Bank of Canada (BOC) on hold in January. Analysts, however, added that the latest inflation data should ever so slightly ratchet up the pressure on the BOC.
BOC will find cause for concern in inflation data
"CPI inflation decelerated slightly to 6.8% y/y in November versus a market consensus estimate of 6.7% y/y, as prices rose 0.1% on month-over-month basis. Food prices were the largest positive contributor with prices increasing by 1.2% m/m, while gasoline prices were the most notable downward contributor after dropping by 3.6% in November."
"Inflation is likely to undershoot the BoC's Q4/Q4 forecast of 7.1% y/y, but the Bank will still find cause for concern in the data. Most notably, core CPI metrics firmed slightly with the weighted median measure rising from 4.9% to 5.0% y/y, which points to persistent underlying inflationary pressures."
-
13:00
Russia Central Bank Reserves $: $581.7B vs $576.5B
-
12:46
When is the Final US Q3 GDP report and how could it affect EUR/USD?
US Q3 GDP Overview
Thursday's US economic docket highlights the release of the Final GDP print for the third quarter, scheduled at 13:30 GMT. The third revision is expected to show that the world's largest economy grew 2.9% annualized pace during the July-September period, matching the previous estimates.
How Could it Affect EUR/USD?
Ahead of the key release, the US Dollar comes under some renewed selling pressure amid retreating US Treasury bond yields and assists the EUR/USD pair to regain some positive traction on Thursday. That said, a modest pullback in the US equity futures lends some support to the safe-haven buck and keeps a lid on any meaningful upside for the major.
Meanwhile, the backwards-looking data might do little to influence market expectations about the Fed's next policy move or provide any meaningful impetus to the greenback. That said, an upward revision of the US GDP print could revive bets for a prolonged policy tightening by the Fed and prompt some near-term short-covering around the USD.
Conversely, a weaker-than-expected reading will be enough to reaffirm bets that the US central bank will pivot from an ultra-hawkish stance to something more hawkish. This will be enough to exert additional downward pressure on the buck and allow the EUR/USD pair to push through a one-week-old trading range hurdle near the 1.0660 area.
Eren Sengezer, Editor at FXStreet, offers a brief technical outlook for the major and writes: “EUR/USD near-term technical outlook points to a slightly bullish bias with the pair holding above the 20-period and the 50-period Simple Moving Averages (SMA) on the four-hour chart. Additionally, the Relative Strength Index indicator on the same chart stays above 50.”
Eren also outlines important levels to trade the EUR/USD pair: “1.0680 (end-point of the latest uptrend, static level) aligns as first resistance before 1.0700 (psychological level) and 1.0735 (December 15 high).”
“On the downside, first support is located at 1.0620 (20-period SMA, 50-period SMA) ahead of 1.0580 (Fibonacci 23.6% retracement) and 1.0560 (100-period SMA),” Eren adds further.
Key Notes
• EUR/USD Forecast: Risk perception to drive the pair's action
• EUR/USD edges higher amid weaker USD, upside remains capped near 1.0660 area
• EUR/USD defends channel support above 1.0600 amid renewed US Dollar selling
About US GDP
The Gross Domestic Product Annualized released by the US Bureau of Economic Analysis shows the monetary value of all the goods, services and structures produced within a country in a given period of time. GDP Annualized is a gross measure of market activity because it indicates the pace at which a country's economy is growing or decreasing. Generally speaking, a high reading or a better than expected number is seen as positive for equities, while a low reading is negative.
-
12:01
Mexico 1st half-month Inflation registered at 0.39%, below expectations (0.41%) in December
-
12:01
Mexico 1st half-month Core Inflation above forecasts (0.45%) in December: Actual (0.57%)
-
11:07
Türkiye: CBRT leaves one-week repo rate unchanged at 9%
The Central Bank of the Republic of Türkiye (CBRT) announced on Thursday that it left the policy, one-week repo, rate unchanged at 9% following the December policy meeting, as expected.
Key takeaways from policy statement as summarized by Reuters
"CBRT expects disinflation process to start on the back of measures taken."
"It is critically important that financial conditions remain supportive."
"Current policy rate is adequate."
"Leading indicators for the last quarter of the year continue pointing to a slowdown in growth due to the weakening foreign demand."
"Effects of foreign demand-based pressures observed in the manufacturing industry on domestic demand and supply capacity currently remain limited."
"Entire policy toolset, particularly funding channels, will be aligned with liraization targets."
Market reaction
USD/TRY pair showed no reaction to the CBRT's policy decision and was last seen trading flat on the day at 18.6740.
-
11:03
GBP/USD surrenders modest intraday gains, seems vulnerable near multi-week low
- GBP/USD struggles to capitalize on its intraday move up and retreats to the 200-day SMA.
- The weaker-than-expected UK GDP print undermines the GBP and prompts fresh selling.
- Sliding US bond yields, a positive risk tone weigh on the USD and could help limit losses.
- Traders now look forward to the final US Q3 GDP report for some meaningful impetus.
The GBP/USD pair attracts fresh selling in the vicinity of mid-1.2100s on Thursday and retreats to the lower end of its daily range during the mid-European session. The pair is currently placed below the 1.2100 mark and remains well within the striking distance of a nearly three-week low touched on Wednesday, with bearish still awaiting a sustained break below a technically significant 200-day SMA.
The British Pound started losing ground following the release of the final UK GDP print, which showed that the economy contracted by 0.3% in the third quarter, worse than the previous estimate of 0.2%. Adding to this, the yearly growth rate was also revised down to 1.9% from the 2.4% reported previously and adds to a bleak outlook for the UK economy.
This comes on the back of a dovish outcome from the Bank of England (BoE) meeting last week and turns out to be a key factor acting as a headwind for the GBP/USD pair. It is worth recalling that two out of nine BoE MPC members voted to keep interest rates unchanged, suggesting that the central bank is closer to ending the current policy tightening cycle.
The downside for the GBP/USD pair, meanwhile, seems cushioned amid renewed US Dollar selling bias. Despite the Fed's hawkish commentary, investors expect the US central bank to pivot to something more neutral, which leads to a further decline in the US Treasury bond yields. This, along with a positive risk tone, is seen weighing on the safe-haven greenback.
The mixed fundamental backdrop makes it prudent to wait for some follow-through selling below the very important 200-day SMA before placing fresh bullish bets around the GBP/USD pair. Traders now look to the US economic docket, featuring the release of the final Q3 GDP print and Weekly Initial Jobless Claims later during the early North American session.
This, along with the US bond yields and the broader market risk sentiment, will influence the USD price dynamics and provide some impetus to the GBP/USD pair. The focus, however, will remain on the release of the US Core PCE Price Index (the Fed's preferred inflation gauge), due on Friday.
Technical levels to watch
-
11:02
Italy Trade Balance non-EU increased to €2.011B in November from previous €-2.04B
-
11:01
Turkey CBRT Interest Rate Decision remains at 9%
-
10:22
Silver Price Analysis: XAG/USD moves further away from multi-month top, downside seems limited
- Silver edges lower for the second straight day and retreats further from a multi-month top.
- The setup still favours bulls and supports prospects for the emergence of some dip-buying.
- A convincing break below the $23.00 confluence is needed to negate the positive outlook.
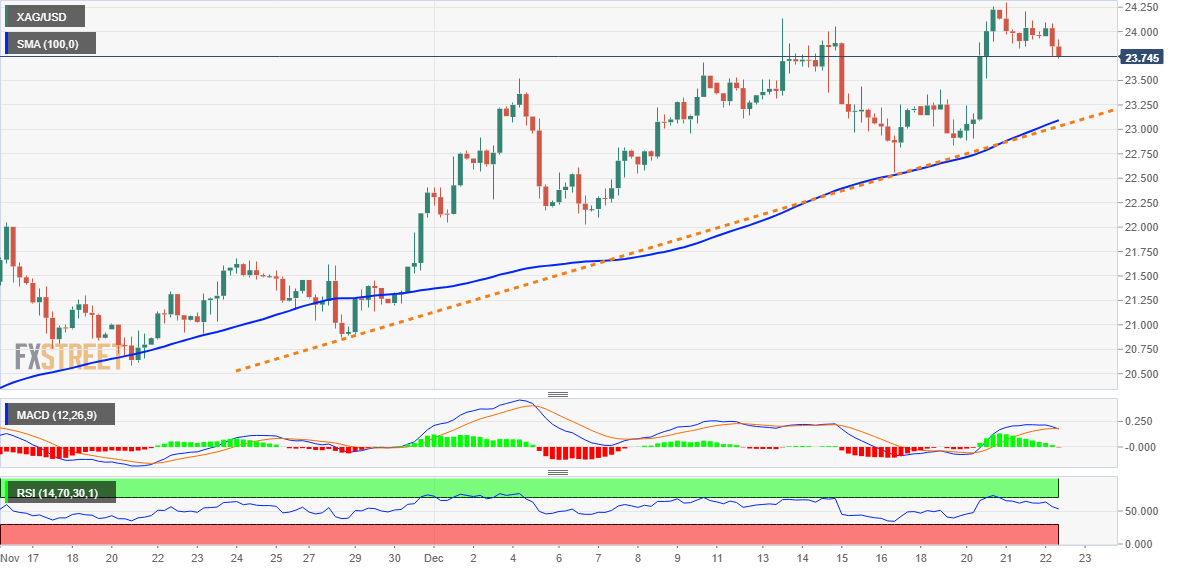
Silver extends the previous day's retracement slide from an eight-month top and remains under some selling pressure for the second successive day on Thursday. The white metal remains depressed through the first half of the European session and is currently placed around the $23.80-$23.75 region.
From current levels, any subsequent slide is likely to find some support near the $23.55-$23.50 area. Some follow-through selling will expose the $23.00 confluence, comprising the 100-period SMA on the 4-hour chart and an ascending trend-line extending from November low. The said handle should act as a strong base and a key pivotal point to determine the next leg of a directional move for the XAG/USD.
Meanwhile, oscillators on the 4-hour chart - though have been losing traction - are still holding in bullish territory. Furthermore, positive technical indicators on the daily chart support prospects for the emergence of some dip-buying near the aforementioned confluence support. That said, a convincing break below will negate the constructive outlook and shift the bias in favour of bearish traders.
The XAG/USD might then turn vulnerable and accelerate the fall towards testing the $22.00 round-figure mark with some intermediate support near the $22.55-$22.50 horizontal zone. A sustained strength beyond should pave the way for additional near-term gains, lifting the XAG/USD beyond the $24.60-$24.70 zone and allowing bulls to aim towards reclaiming the $25.00 psychological mark.
Silver 4-hour chart
Key levels to watch
-
10:15
China to cut quarantine for overseas travellers from January – Bloomberg
Citing two people familiar with the matter, Bloomberg reported on Thursday that China was planning to forego quarantine requirements for overseas travellers from January as part of its re-opening efforts.
Market reaction
This headline doesn't seem to be having a significant impact on risk perception during European trading hours. As of writing, the S&P 500 futures were trading flat on the day at 3,905.
Meanwhile, the US Dollar stays on the back foot with the US Dollar Index losing 0.28% on a daily basis at 103.95.
-
10:04
Italy Producer Price Index (MoM) came in at 2.6%, above forecasts (1.2%) in November
-
10:03
Italy Producer Price Index (YoY) above forecasts (23.7%) in November: Actual (29.4%)
-
09:36
EUR/USD edges higher amid weaker USD, upside remains capped near 1.0660 area
- EUR/USD catches fresh bids on Thursday amid some renewed USD selling bias.
- Sliding US bond yields and a positive risk tone seem to weigh on the greenback.
- The lack of follow-through buying warrant caution for bulls amid recession fears.
The EUR/USD pair regains positive traction on Thursday and jumps to the top end of a one-week-old trading range during the first half of the European session, though lacks follow-through. The pair retreats a few pips from the daily top touched in the last hour and is currently placed just below mid-1.0600s, up over 0.30% for the day.
A combination of factors prompts fresh selling around the US Dollar, which, in turn, is seen lending some support to the EUR/USD pair. A generally positive tone around the equity markets continues to act as a headwind for the safe-haven greenback. Apart from this, the recent pullback in the US Treasury bond yields contributes to keeping the USD bulls on the defensive.
In fact, the yield on the benchmark 10-year US government bond moves away from the monthly top touched on Wednesday amid expectations that the Fed will pivot from an ultra-hawkish stance to something more neutral. It is worth recalling that the US central bank indicated last week that it will continue to raise borrowing costs to combat stubbornly high inflation.
The shared currency, on the other hand, is underpinned by a more hawkish stance adopted by the European Central Bank, indicating that it will need to raise rates significantly further to tame inflation. The upside for the EUR/USD pair, however, remains capped in the wake of looming recession risks, fueled by a surge in COVID-19 cases and the protracted Russia-Ukraine war.
In the latest geopolitical developments, Russia said that there is no chance of peace talks and that the continued arms supplies by Western allies to Ukraine would lead to a deepening of the ongoing conflict. This makes it prudent to wait for a sustained strength beyond the 1.0660 strong horizontal resistance before placing fresh bullish bets around the EUR/USD pair.
Traders now look to the US economic docket, featuring the final Q3 GDP print and the Weekly Initial Jobless Claims data. Apart from this, the US bond yields and the broader risk sentiment will influence the USD and provide some impetus to the EUR/USD pair. The focus, however, will remain on the US Core PCE Price Index (the Fed's preferred inflation gauge), due on Friday.
Technical levels to watch
-
09:01
Norway Registered Unemployment n.s.a meets forecasts (1.6%) in December
-
09:01
Norway Registered Unemployment s.a: 58.78K (December) vs 58.01K
-
09:01
Italy Industrial Sales n.s.a. (YoY) came in at 12.5% below forecasts (18.2%) in October
-
09:01
Italy Industrial Sales s.a. (MoM) registered at -0.8%, below expectations (0.1%) in October
-
08:48
NZD/USD sticks to modest intraday gains above 0.6300 amid softer USD, positive risk tone
- NZD/USD regains positive traction on Thursday amid the emergence of fresh USD selling.
- Sliding US bond yields and a positive risk tone seem to weigh on the safe-haven greenback.
- Recession fears could act as a headwind for the risk-sensitive Kiwi ahead of the US Q3 GDP.
The NZD/USD pair attracts some buying on Thursday and reverses a part of the previous day's slide to the 0.6275 area, or a fresh monthly low. The pair sticks to its gains through the first half of the European session and is currently placed around the 0.6310-0.6315 region, just a few pips below the daily top.
A combination of factors exerts weighs on the US Dollar, which, in turn, is seen acting as a tailwind for the NZD/USD pair. The recent recovery in the global risk sentiment - as depicted by a generally positive tone around the equity markets - continues to undermine the safe-haven buck and benefits the risk-sensitive Kiwi. The greenback is further pressured by the ongoing pullback in the US Treasury bond yields.
In fact, the yield on the benchmark 10-year US government bond retreats further from the monthly top touched the previous day amid expectations that the Fed will pivot from an ultra-hawkish stance to something more neutral. It is worth recalling that the US central bank indicated last week that it will continue to raise borrowing costs to crush inflation and projected an additional 75 bps rate hike by the end of 2023.
It, however, remains to be seen if the NZD/USD pair can capitalize on the move or meets with a fresh supply at higher levels amid looming recession risks. Despite the easing of COVID-19 restrictions in China, investors remain worried about the economic headwinds stemming from a surge in new cases. Apart from this, the protracted Russia-Ukraine war has been fueling concerns about a deeper global economic downturn.
The aforementioned factors make it prudent to wait for follow-through buying before confirming that the NZD/USD pair has formed a bottom and that the recent corrective slide from a multi-month top has run its course. Traders now look forward to the US economic docket, featuring the release of the final Q3 GDP print and the usual Weekly Initial Jobless Claims, for a fresh impetus later during the early North American session.
Technical levels to watch
-
08:15
USD/JPY recovers a few pips from daily low, keeps the red around 132.00 amid weaker USD
- USD/JPY meets with a fresh supply on Thursday amid the emergence of fresh USD selling.
- Sliding US bond yields turn out to be a key factor keeping the USD bulls on the defensive.
- The BoJ’s policy tweak continues to underpin the JPY and contributes to the offered tone.
- The upbeat market mood seems to cap the safe-haven JPY and lends support to the pair.
The USD/JPY pair comes under some renewed selling pressure on Thursday and reverses a major part of the previous day's recovery gains. The pair, however, recover a few pips from the daily low and trades just below the 132.00 mark during the early North American session, still down around 0.40% for the day.
A modest downtick in the US Treasury bond yields exerts some downward pressure on the US Dollar, which, in turn, is seen as a key factor dragging the USD/JPY pair lower. Despite the Fed's hawkish commentary last week, investors expect the US central bank to pivot to something more neutral. This drags the yield on the 10-year US government bond away from the monthly peak touched on Wednesday and undermines the greenback.
The Japanese Yen, on the other hand, continues to draw support from the Bank of Japan's policy tweak, widening the range for fluctuations in the 10-year government bond yield. The Japanese central bank's surprise move to review its yield curve control policy is seen as a precursor to the end of the ultra-accommodative monetary policy. The resultant US-Japan rate differential further benefits the JPY and weighs on the USD/JPY pair.
That said, the recent recovery in the global risk sentiment - as depicted by a generally positive tone around the equity markets - keeps a lid on any further gains for the safe-haven JPY. This, in turn, lends some support to the USD/JPY pair and helps limit the downside, at least for the time being. Traders also refrain from placing aggressive bets ahead of the final US Q3 GDP print, due later during the early North American session.
The focus, however, remains on the US Core PCE Price Index (the Fed's preferred inflation gauge), scheduled for release on Friday. This will play a key role in influencing the near-term USD price dynamics and provide some meaningful impetus to the USD/JPY pair. Nevertheless, the fundamental backdrop favours bearish traders and suggests that the path of least resistance for spot prices is to the downside.
Technical levels to watch
-
07:35
EUR/GBP climbs to 0.8800 neighbourhood, highest since mid-November on weaker UK GDP
- EUR/GBP gains traction for the second straight day and hits its highest level since mid-November.
- A downward revision of the UK GDP print undermines the GBP and extends support to the cross.
- A more hawkish stance adopted by the ECB supports prospects for a further appreciating move.
The EUR/GBP cross builds on the previous day's strong move up and climbs to the 0.0.8800 neighbourhood, or its highest level since mid-November during the early European session on Thursday.
The British Pound continues with its relative underperformance in the wake of a dovish outcome from the Bank of England meeting last week, which, in turn, acts as a tailwind for the EUR/GBP cross. In fact, two out of nine BoE MPC members voted to keep interest rates unchanged, suggesting that the central bank is closer to ending the current policy tightening cycle.
Apart from this, a downward revision of the UK Q3 GDP print further undermines the Sterling Pound and pushes the EUR/GBP cross higher for the second straight day. The UK economy contracted by 0.3% during the July-September period, weaker than the 0.2% decline estimated previously. Furthermore, the yearly growth rate was revised down to 1.9% from the 2.4% reported initially.
The shared currency, on the other hand, continues to draw support from a more hawkish stance adopted by the European Central Bank (ECB), indicating that it will need to raise borrowing costs significantly further to tame inflation. This, in turn, suggests that the path of least resistance for the EUR/GBP cross it to the upside and supports prospects for a further appreciating move.
Technical levels to watch
-
07:33
Forex Today: Eyes on US data before holiday trading sets in
Here is what you need to know on Thursday, December 22:
After having closed modestly higher on Wednesday, the US Dollar Index turned south and declined below 104.00 early Thursday amid an improving market mood. The 10-year US Treasury bond yield stays below 3.7% and US stock index futures post small daily gains. The US Bureau of Economic Analysis will release the final estimate of the third-quarter Gross Domestic Product (GDP) growth. The US economic docket will also feature the weekly Initial Jobless Claims data and the Federal Reserve Bank of Chicago's National Activity Index for November.
On Wednesday, the data from the US revealed that Existing Home Sales declined by 7.7% on a monthly basis in November. Additionally, the one-year consumer inflation rate expectation of the Conference Board's Consumer Sentiment Survey dropped to 6.7% in December from 7.1%. Wall Street's main indexes gained traction and made it difficult for the US Dollar to gather strength in the second half of the day.
Supported by the selling pressure surrounding the US Dollar, EUR/USD climbed toward 1.0650 during the Asian trading hours on Thursday. In its latest monthly report, Germany's finance ministry said that it expects the economic activity in Germany to remain subdued during the fourth quarter of this year and the first quarter of 2023.
GBP/USD edged modestly lower toward 1.2100 in the early European morning on Thursday. The data published by the UK's Office for National Statistics (ONS) announced that the Gross Domestic Product (GDP) grew at an annualized rate of 1.9% in the third quarter, missing the market expectation for an expansion of 2.4%.
Following the sharp decline witnessed on Tuesday, USD/JPY managed to register small daily gains on Wednesday but struggles to extend its recovery on Thursday. At the time of press, USD/JPY was trading in negative territory at around 132.00. The data from Japan showed earlier in the day that the Leading Economic Index edged slightly higher to 98.6 in October from 98.2 in September.
With the 10-year US T-bond yield fluctuating in a tight range on Wednesday, Gold price struggled to make a decisive move in either direction. CAU/USD continues to trade flat on the day slightly above $1,810 early Thursday.
On Wednesday, the data from Canada revealed that the annual Consumer Price Index declined to 6.8% in November from 6.9% in October. USD/CAD showed no reaction to the inflation report on Wednesday but started to edge lower early Thursday, falling below 1.3600 in the European morning.
Bitcoin continues to move sideways slightly below $17,000 and Ethereum stays quiet at around $1,200 as trading action in the crypto market remains subdued.
-
07:26
Indonesia Bank Indonesia Rate in line with forecasts (5.5%)
-
07:12
GBP/USD eases from daily high post-UK GDP, holds above 1.2100 mark amid weaker USD
- GBP/USD regains some positive traction on Thursday amid renewed USD selling bias.
- The softer-than-expected UK Q3 GDP keeps a lid on any further gains for the major.
- A dovish BoE decision last week further warrants caution before placing bullish bets.
The GBP/USD pair attracts some buying on Thursday and reverses a major part of the previous day's slide to a nearly three-week low. The pair sticks to its intraday gains above the 1.2100 mark, though retreats a few pips in reaction to the weaker-than-expected UK macro data.
According to the final version of the Q3 GDP print released by the Office for National Statistics, the UK economy contracted by 0.3% during the July-September period. This is slightly below the 0.2% decline estimated initially and was accompanied by a downward revision of the yearly growth rate to 1.9% from 2.4%. This adds to a bleak outlook for the UK economy and acts as a headwind for the British Pound, though a weaker US Dollar continues to lend support to the GBP/USD pair.
The upbeat mood - as depicted by a generally positive tone around the equity markets - is seen as a key factor undermining the safe-haven greenback. Apart from this, softer US Treasury bond yields further contribute to keeping the USD bulls on the defensive. Despite the Fed's hawkish outlook, investors expect the US central bank to pivot to something more neutral. This, in turn, drags the yield on the 10-year US government bond away from the monthly peak touched on Wednesday.
That said, a dovish outcome from the Bank of England (BoE) meeting last week could hold back traders from placing aggressive bullish bets around the GBP/USD pair. It is worth recalling that two out of nine BoE MPC members voted to keep interest rates unchanged, suggesting that the central bank is closer to ending the current policy tightening cycle. This makes it prudent to wait for strong follow-through buying before positioning for any further gains amid looming recession risks.
Market participants now look forward to the US economic docket, featuring the releases of the final Q3 GDP print and the usual Weekly Initial Jobless Claims data. This, along with the US bond yields, will influence the USD price dynamics and provide some impetus to the GBP/USD pair. The focus, however, remains on the US Core PCE Price Index (the Fed's preferred inflation gauge), due on Friday, which will play a key role in driving the USD during the year-end holiday season.
Technical levels to watch
-
07:04
USD/CAD bears eye 1.3540 as downbeat US Dollar, yields jostle with sluggish Oil
- USD/CAD holds lower grounds near intraday bottom, prints four-day downtrend.
- Cautious optimism, downbeat Treasury yields weigh on US Dollar.
- WTI seesaws near 13-day high amid hopes of more demand on winter, travel concerns.
USD/CAD takes offers to refresh intraday low near 1.3580 during early Thursday morning in Europe. In doing so, the Loonie pair drops for the fourth consecutive day while extending the previous day’s downside break of a short-term key support trend line toward another support line.
That said, the quote’s latest weakness could be linked to the broad US Dollar weakness, as well as firmer prices of WTI crude oil, Canada’s main export item. It should be noted that the mixed prints of Canada inflation data failed to recall USD/CAD buyers the previous day.
US Dollar Index (DXY) drops half a percent to around 103.85 at the latest as the US 10-year Treasury yields remain depressed at around 3.65%, extending the previous day’s pullback from the monthly high.
WTI crude oil prints mild losses as it pares the daily gains around $78.40. Even so, hopes of more energy demand due to fierce winter and more travel forecasts keep the black gold positive on a weekly basis.
On Wednesday, Canada’s Consumer Price Index (CPI) declined to 6.8% YoY in November from 6.9% in October, versus market forecasts of 6.7%. Further, the more important reading of inflation, namely the Core Bank of Canada (BOC) CPI, which excludes volatile food and energy prices, remained unchanged at 5.8% YoY.
It should be noted that the Bank of Japan’s (BOJ) second unscheduled bond-buying joins the cautious optimism in the market, as portrayed by mildly bid stock futures and Asia-Pacific equities, also exert downside pressure on the USD/CAD prices.
Bloomberg cites China’s State Council and the People’s Bank of China (PBOC) to hint at more positives for the dragon nation and revives the market’s optimism of late. “China’s State Council, People’s Bank of China (PBoC) and the country’s top securities regulator jointly conducted a study during last week’s economic policy meeting, aiming to prioritize growth and boost the property market in 2023,” reported Bloomberg.
Alternatively, news suggesting China’s biggest budget deficit on record, for the January-November period, joins the Russia-Ukraine woes to probe the USD/CAD bears.
Looking forward, final prints of the US Gross Domestic Product (GDP) and Core Personal Consumption Expenditure (PCE) details for the third quarter (Q3) could entertain traders ahead of Friday’s US Core PCE Price Index for November, also known as the Fed’s preferred inflation gauge. That said, the US GDP is expected to confirm 2.9% Annualized growth in Q3 while the Core PCE is anticipated to also meet the initial forecasts of 4.6% QoQ during the stated period.
Technical analysis
A clear downside break of the two-week-old ascending trend line, around 1.3630 by the press time, directs USD/CAD bears towards an upward-sloping support line from November 15, close to 1.3540 at the latest.
-
07:02
Sweden Retail Sales (YoY) came in at -6.3%, above expectations (-7.7%) in November
-
07:01
UK Final GDP revised down to -0.3% QoQ in Q3 vs. -0.2% expected
The UK economy contracted by 0.3% on the quarter in the three months to September of 2022 vs. -0.2% prior, the final revision confirmed on Thursday. The market expected a reading of -0.2% in the reported period.
On an annualized basis, Britain’s GDP rate increased by 1.9% in Q3 vs. 2.4% registered in the first estimate while missing 2.4% expectations.
Meanwhile, the UK Q3 Current Account arrived at £-19.402 when compared to the £-33.224B expected and the second quarter’s £-35.086B.
The country’s Total Business Investment data for Q3 came in at 1.3% QoQ and -2.5% YoY.
FX implications
GBP/USD was last seen trading at 1.2115, retreating from daily highs of 1.2135, still up 0.25% on the day. The Pound Sterling remains unimpressed by the mixed UK data dump.
About the UK GDP
The Gross Domestic Product released by the Office for National Statistics is a measure of the total value of all goods and services produced by the UK. The GDP is considered a broad measure of the UK's economic activity. Generally speaking, a rising trend has a positive effect on the GBP, while a falling trend is seen as negative (or bearish).
-
07:01
United Kingdom Current Account above expectations (£-33.224B) in 3Q: Actual (£-19.402B)
-
07:01
United Kingdom Total Business Investment (YoY) came in at -2.5%, below expectations (3.5%) in 3Q
-
07:01
United Kingdom Gross Domestic Product (YoY) registered at 1.9%, below expectations (2.4%) in 3Q
-
07:01
United Kingdom Gross Domestic Product (QoQ) came in at -0.3% below forecasts (-0.2%) in 3Q
-
07:01
Sweden Retail Sales (MoM) above forecasts (0.4%) in November: Actual (2.2%)
-
07:01
United Kingdom Total Business Investment (QoQ) came in at 1.3%, above expectations (-0.5%) in 3Q
-
07:00
Sweden Producer Price Index (MoM) above forecasts (0.9%) in November: Actual (2%)
-
07:00
Sweden Producer Price Index (YoY) came in at 19.5%, above expectations (16.3%) in November
-
06:39
US Dollar Index Price Analysis: DXY breaks weekly support with eyes on 103.40
- US Dollar Index takes offers to refresh intraday low, breaks one-week-old ascending trend line.
- Bearish MACD signals allow sellers to aim for the previous weekly low, also the lowest level in six months.
- 100-SMA, weekly top add to the upside filters even if buyers manage to cross support-turned-resistance line.
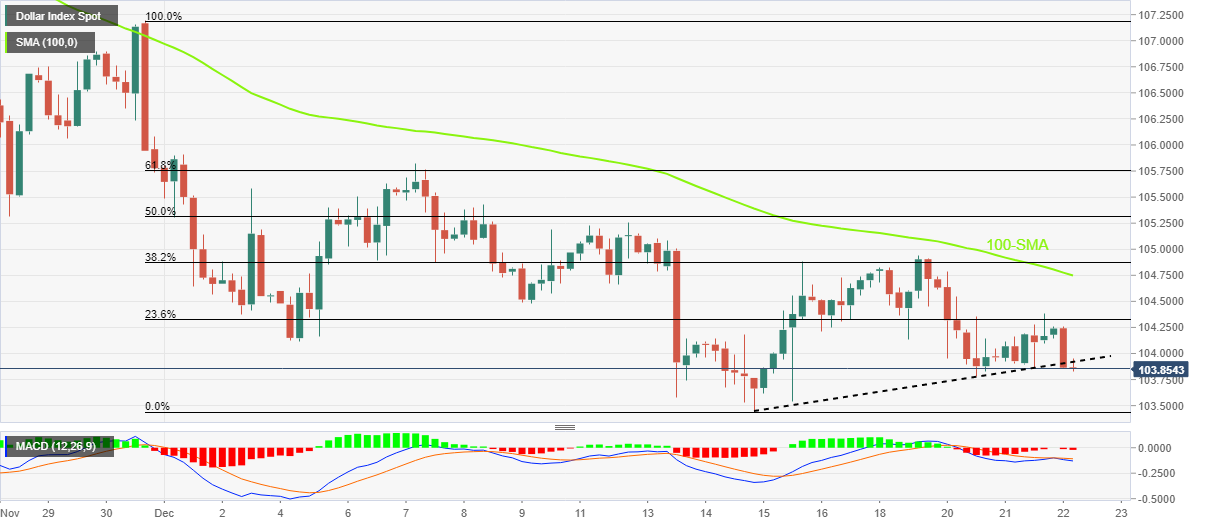
US Dollar Index (DXY) retreats towards the weekly low, marked the previous day, taking offers to refresh the intraday low near 103.83 during early Thursday in Europe.
In doing so, the greenback’s gauge versus the six major currencies breaks a one-week-old ascending support line, now resistance near 103.92, while approaching the six-month low marked in the last week.
It’s worth noting that the bearish MACD signals and a U-turn from 104.93 during early weekdays also favor the DXY sellers to approach the multi-day low surrounding 103.40.
During the fall, the weekly bottom near 103.80 and horizontal support around 103.60 could test the US Dollar Index bears.
Additionally, the DXY’s sustained weakness past 103.40 will highlight the 103.00 round figure ahead of directing bears toward the May 2022 low near 101.30.
On the contrary, the previous support line around 103.92 precedes the 104.00 round figure to restrict short-term US Dollar Index rebound.
Following that, the 100-SMA and the weekly top could challenge the DXY bulls around 104.75 and 104.95 in that order.
Also acting as an upside filter is the 105.00 round figure, a break of which could welcome DXY bulls targeting the monthly high of 105.82.
US Dollar Index: Four-hour chart
Trend: Further downside expected
-
06:33
ECB’s de Guindos: We should expect to raise interest rates at this pace for a period of time
European Central Bank (ECB) Vice-President Luis de Guindos said on Thursday that “we should expect to raise interest rates at this pace for a period of time.”
Additional quotes
Indication for Q4 2022 is that we are perhaps in negative territory, but not very deep, with GDP expected to contract by 0.2%.
Over the course of the next two or three months inflation will be somewhere around its current level, in q2 2023 it will see a drop to hover around 7% by the middle of the year.
We have no choice but to act.
If we do nothing, the situation would be worse because inflation is one of the factors behind the current recession.
Increases of 50 basis points may become the new norm in the near term.
Our interest rates will then enter into restrictive territory.
I am concerned that markets could underestimate the persistence of inflation.
I am concerned that markets might consider fiscal policy to be incompatible with monetary policy, that there is a potential conflict.
Banks have a solid capital position and can withstand a shock, but i have a lot more doubts about non-banks, notably hedge funds.
Market reaction
In reaction to the above hawkish comments, EUR/USD keeps its upbeat momentum intact at near-daily highs of 1.0650, up 0.43% so far.
-
06:18
AUD/USD pauses on the way to 0.6800 amid fears of easy Aussie spending, heavy China budget deficit
- AUD/USD seesaws around intraday high, as well as the weekly top, on mixed concerns.
- Aussie analysts predict slowdown in spending, China’s budget deficit hit record high during January-November period.
- US data, yields eyed for fresh impulse amid holiday mood.
AUD/USD grinds near an intraday high of 0.6765 heading into Thursday’s European session. In doing so, the Aussie pair seesaws near the weekly top amid mixed news surrounding Australia and China, while cheering the US Dollar’s pullback on softer Treasury bond yields.
That said, analysts from the Australia and New Zealand Group (ANZ) highlight fears of a slowdown in Aussie spending and challenge the AUD/USD bulls. “Total ANZ-observed spending from 20 Nov – 18 Dec was just 10% higher than in 2019, despite a CPI increase of 10.5% between Dec 2019 and Sep 2022 and population growth of 1.8% from Dec 2019 to Jun 2022,” said the latest report.
It should be noted that the news suggesting China’s biggest budget deficit on record also probes the AUD/USD buyers. That said, China’s budget deficit hit a record high for the first 11 months of 2022 and weigh on the AUD/USD prices.
On the other hand, Bloomberg cites China’s State Council and the People’s Bank of China (PBOC) to hint at more positives for the dragon nation. “China’s State Council, People’s Bank of China (PBoC) and the country’s top securities regulator jointly conducted a study during last week’s economic policy meeting, aiming to prioritize growth and boost the property market in 2023,” reported Bloomberg.
Also likely to propel the AUD/USD prices could be the downbeat US Treasury yields and the softer US Dollar, amid a lack of major data/events and due to the Bank of Japan’s (BOJ) efforts. That said, the US 10-year Treasury yields remain depressed around 3.65%, extending the previous day’s pullback from the monthly high while the US Dollar Index (DXY) prints mild losses near 103.90 at the latest.
Looking forward, final prints of the US Gross Domestic Product (GDP) and Core Personal Consumption Expenditure (PCE) details for the third quarter (Q3) could entertain traders ahead of Friday’s US Core PCE Price Index for November, also known as the Fed’s preferred inflation gauge. That said, the US GDP is expected to confirm 2.9% Annualized growth in Q3 while the Core PCE is anticipated to also meet the initial forecasts of 4.6% QoQ during the stated period.
Technical analysis
A clear upside break of the 0.6730 resistance confluence, including the convergence of the 200-Exponential Moving Average (EMA) and a two-day-old descending resistance line, keeps AUD/USD bulls hopeful of piercing the downward-sloping resistance line from December 13, close to 0.6785 by the press time.
-
06:06
China State Council, PBOC vow to boost growth and property market next year
Citing reports, Bloomberg noted on Thursday that China’s State Council, People’s Bank of China (PBoC) and the country’s top securities regulator jointly conducted a study during last week’s economic policy meeting, aiming to prioritize growth and boost the property market in 2023.
Key takeaways
“The readings from these meetings described a commitment to action aimed at bailing out the economy and putting it on the path to stability.”
“The government has been pushing for the implementation of previously announced stimulus measures, saying existing measures could be more effective.”
“Policy measures can still have an impact and if we do the job well now, it will help stabilize growth next year.”
“The economy is recovering and stabilizing, but the fundamentals are not solid yet.”
Market reaction
Amidst risk-on sentiment, encouraging headlines from China are keeping the buoyant tone intact around the Australian Dollar, allowing AUD/USD to consolidate its gains at around 0.6750. The pair is up 0.70% on the day.
-
05:49
Asian Stock Market: China, Japan portray cautious optimism, Indian equities grind lower
- Asia-Pacific markets pare BOJ-linked losses despite mixed news from China, Japan.
- Pullback in Treasury bond yields, hopes of more stimulus add strength to the positive mood.
- Hong Kong braces for best run-up in two weeks as China unveiled pro-growth policies.
- RBI’s rejection to an abrupt pause to the rate hike trajectory weighs on Indian shares.
Asian shares grind higher, mostly positive, as traders cheer softer Treasury yields and upbeat headlines from the regional leaders China and Japan. In doing so, the equity traders also benefit from a lack of major data/events while ignoring the Covid-linked market fears.
While portraying the mood, MSCI’s Index of Asia-Pacific shares outside Japan extends the previous day’s rebound, up near 1.0% intraday, whereas Japan’s Nikkei 225 adds half a percent to 26,505 ahead of Thursday’s European session.
Japanese government revises growth forecasts for the fiscal year 2023. “Japan's real gross domestic product (GDP) is expected to expand 1.5% in the fiscal year beginning in April 2023, the government said in its new semi-annual projection, up from 1.1% in the previous forecast made in July,” mentioned Reuters. On the same line were comments from Japanese Prime Minister (PM) Fumio Kishida who pushed local industries for 100 trillion Japanese Yen investment as soon as possible.
On the other hand, policymakers in China brace for pro-growth steps as hospitals in Shanghai eye more virus cases. On the same line could be the People’s Bank of China’s (PBOC) pledge to help overcome a slump in the local property market.
With this in mind, Hong Kong’s Hang Seng rises 2.55% intraday to lead the region’s gainers while India’s BSE Sensex drops 0.40% on a day to buck the trend.
Stocks in Australia ignore fears of a slowdown in spending, as conveyed by local banks, whereas those from New Zealand cheer optimism in Beijing to print daily gains.
On a broader front, the S&P 500 Futures rise 0.30% intraday to 3,916 whereas the US 10-year Treasury yields remain depressed around 3.65%, extending the previous day’s pullback from the monthly high.
Given the holiday mood, the markets may witness lackluster moves but final prints of the US Gross Domestic Product (GDP) and Core Personal Consumption Expenditure (PCE) details for the third quarter (Q3) could entertain traders ahead of Friday’s US Core PCE Price Index for November, also known as the Fed’s preferred inflation gauge. That said, the US GDP is expected to confirm 2.9% Annualized growth in Q3 while the Core PCE is anticipated to also meet the initial forecasts of 4.6% QoQ during the stated period.
-
05:29
EUR/USD Price Analysis: Bulls approach weekly hurdle near 1.0660
- EUR/USD picks up bids to refresh intraday top.
- Firmer oscillators underpin the run-up toward one-week-old resistance line.
- Monthly high, 61.8% FE level eyed during further advances.
- A convergence of 50-EMA, three-week-old ascending trend line highlights 1.0600 as short-term key support.
EUR/USD renews an intraday high around 1.0650 heading into Thursday’s European session. In doing so, the major currency pair rises inside the weekly trading range while reversing the previous day’s pullback moves.
Underpinning the quote’s latest run-up is the bullish MACD signal and firmer RSI (14), as well as the buyer’s ability to keep the reins past the 50-Exponential Moving Average (EMA).
That said, a slightly downward-sloping resistance line from the last Friday, around 1.0660 by the press time, challenges the EUR/USD pair’s immediate upside.
Following that, the monthly high marked in the last week around 1.0735 and the 61.8% Fibonacci Expansion (FE) of the pair’s December 01-19 moves, near 1.0760, will be in focus.
Alternatively, the 50-EMA level surrounding 1.0600 restricts the short-term downside of the EUR/USD pair. Also adding strength to the stated support is an upward-sloping trend line from December 01.
It should be noted that the December 05 high near 1.0595 acts as an additional downside filter before welcoming the bears.
Should the quote remains weak past 1.0595, the odds of witnessing a slump towards the fresh weekly low, currently around 1.0575, can’t be ruled out.
EUR/USD: Four-hour chart
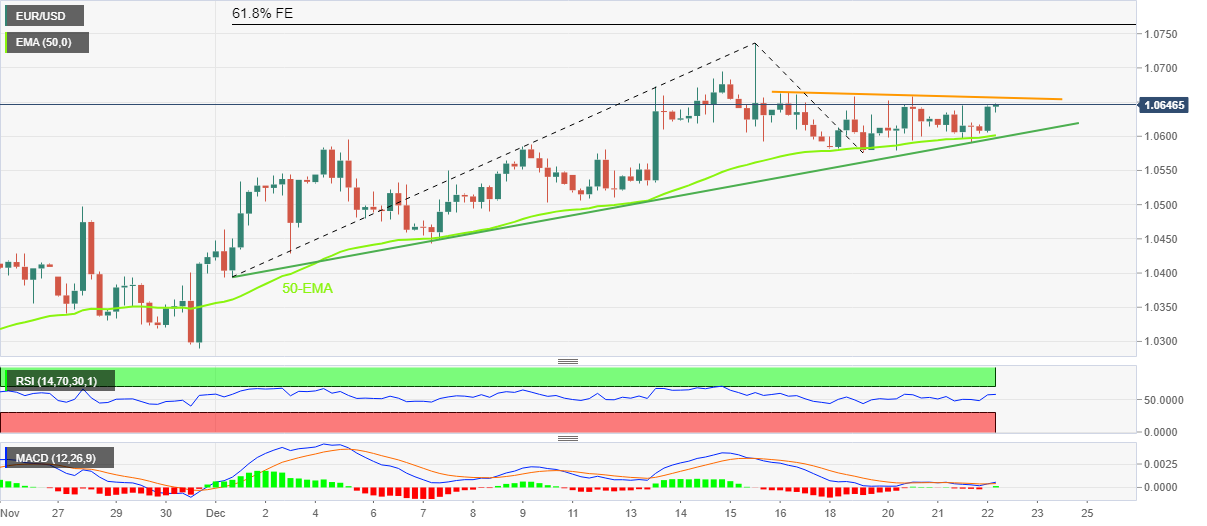
Trend: Further upside expected
-
05:01
Japan Leading Economic Index below forecasts (99) in October: Actual (98.6)
-
05:01
Japan Coincident Index registered at 99.6, below expectations (99.9) in October
-
04:58
USD/JPY pares intraday loss near 132.00 on mixed news from Japan, sluggish yields
- USD/JPY bounces off intraday low but stays mildly offered around four-month bottom.
- Yields struggle for clear directions, grinding lower off late, as BOJ announced another unchanged bond buying.
- Tokyo to pull Covid alert to the highest, PM Kishida pushes Japanese industry for more investment.
- US GDP, Treasury bond moves eyed for fresh impulse.
USD/JPY picks up bids to consolidate intraday losses around 131.90 during early Thursday. Even so, the Yen pair remains mildly offered while reversing the previous day’s rebound from a four-month low.
That said, the quote’s latest weakness could be linked to the mixed headlines from Japan, as well as sluggish US Treasury yields and the holiday mood in the market. Additionally challenging the USD/JPY traders is the cautious mood ahead of the key US data/events scheduled for release.
Tokyo is up for the highest Covid alert as the virus cases in Asia major increased recently. The same should have pushed the Japanese government to revise growth forecasts for the fiscal year 2023. “Japan's real gross domestic product (GDP) is expected to expand 1.5% in the fiscal year beginning in April 2023, the government said in its new semi-annual projection, up from 1.1% in the previous forecast made in July,” mentioned Reuters.
On the same line were comments from Japanese Prime Minister (PM) Fumio Kishida who pushed local industries for 100 trillion Japanese Yen investment as soon as possible.
Elsewhere, talks of China’s higher budget deficit in 11 months join fears of a spending slowdown in Australia and geopolitical concerns relating to Russia-Ukraine to probe the sentiment. It should be observed that the Bank of Japan’s (BOJ) second unscheduled bond-buying also exerts downside pressure on the USD/JPY prices.
Amid these plays, the US Dollar Index (DXY) traces depressed Treasury yields while the S&P 500 Futures remains mildly bid by the press time.
Looking forward, the holiday mood could restrict USD/JPY moves but final prints of the US Gross Domestic Product (GDP) and Core Personal Consumption Expenditure (PCE) details for the third quarter (Q3) could entertain the pair traders ahead of Friday’s US Core PCE Price Index for November, also known as the Fed’s preferred inflation gauge. That said, the US GDP is expected to confirm 2.9% Annualized growth in Q3 while the Core PCE is anticipated to also meet the initial forecasts of 4.6% QoQ during the stated period.
Technical analysis
Unless providing a daily closing beyond the early December low near 133.65, the USD/JPY bears can keep attacking August month’s low surrounding 130.40 to aim for further downside.
-
04:34
Gold Price Forecast: XAU/USD clings to mild gains above $1,800 on softer US Dollar, Treasury yields
- Gold price clings to mild gains around weekly top.
- Mixed risk catalysts, BOJ actions probe US Dollar, bond yields.
- US data, qualitative factors to determine intraday XAU/USD moves.
- Holiday season, light calendar to restrict Gold price moves during the rest of 2022.
Gold price (XAU/USD) grinds higher at the intraday top near $1,820, reversing the previous day’s pullback from a one-week high, as markets sneak into a holiday mood during early Thursday. Also favoring the metal price could be the recent pullback in the US Dollar amid mixed catalysts and pre-data anxiety.
That said, the US Dollar Index (DXY) drops 0.36% intraday to around 103.85 by the press time while the US 10-year Treasury bond yields remain depressed near 3.65% after retreating from the monthly high of 3.72% the previous day.
China’s readiness for more stimulus and the Bank of Japan’s (BOJ) second unscheduled bond buying allow US stock futures to remain mildly bid, as well as let the US Treasury bond yields retreat, at the latest.
On the other hand, updates surrounding Russia and Ukraine weigh on the sentiment and put a floor under the US Dollar, due to its safe-haven demand. Ukrainian President Volodymyr Zelensky’s US visit and Russian President Vladimir Putin’s readiness to increase the country’s military potential.
On Wednesday, the DXY bounced off its weekly low the previous day as the US Conference Board’s (CB) Consumer Confidence jumped to the eight-month high of 108.3 for December, compared to the market forecasts of 101.0 and the revised prior readings of 101.40. However, the US Existing Home Sales for November, 4.09M MoM compared to 4.2M expected and 4.43M prior, probed the US Dollar bulls.
Against this backdrop, it becomes safe to conclude that the Gold price grinds higher and may end the year 2022 on a positive note. However, a light economic calendar during the final days of the year and mixed catalysts could restrict the metal’s moves during the holiday season.
Even so, final prints of the US Gross Domestic Product (GDP) and Core Personal Consumption Expenditure (PCE) details for the third quarter (Q3) could entertain the pair traders ahead of Friday’s US Core PCE Price Index for November, also known as the Fed’s preferred inflation gauge. That said, the US GDP is expected to confirm 2.9% Annualized growth in Q3 while the Core PCE is anticipated to also meet the initial forecasts of 4.6% QoQ during the stated period.
Gold price technical analysis
Gold price remains firmer around the double tops marked in the last week, near $1,825. It should be noted that the nearly overbought RSI (14) and receding bullish bias of the MACD challenges the buyers.
Hence, the metal’s further upside hinges on a clear break of the $1,825, which in turn could trigger a run-up targeting $1,875. Following that, June’s peak surrounding $1,880 could challenge the Gold buyers.
Alternatively, XAU/USD sellers remain off the table unless witnessing a clear downside break of the $1,790 support confluence, comprising 100-SMA and a one-month-old ascending trend line.
Also acting as the downside filter is the previous weekly low and the monthly bottom, respectively around $1,775 and $1,765.
Gold price: Four-hour chart
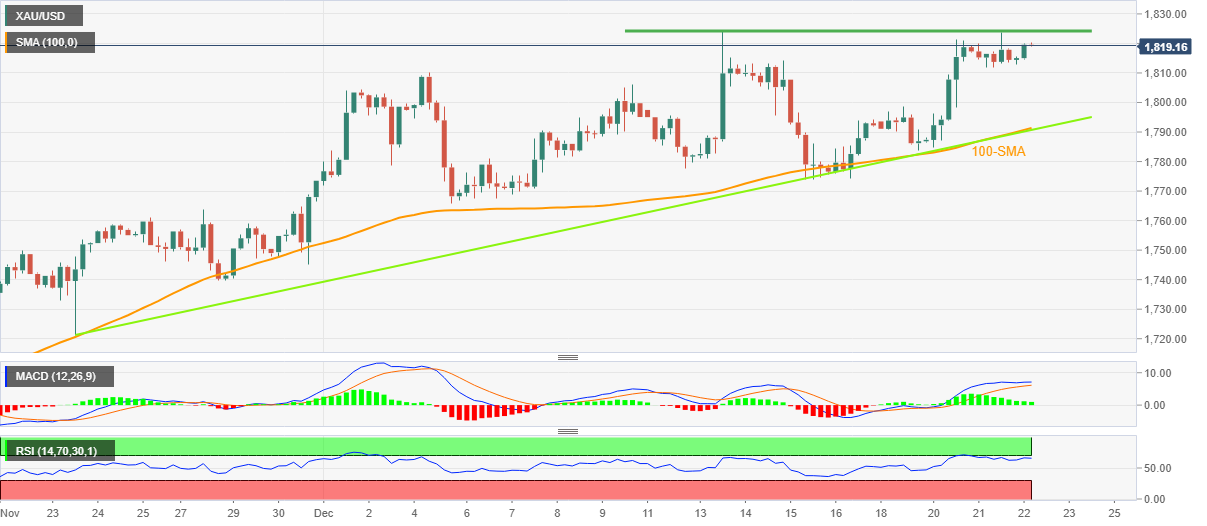
Trend: Further upside expected
-
03:54
USD/INR Price News: Indian Rupee again recovers from 83.00 as US Dollar traces softer yields
- USD/INR reverses from one-week high, snaps two-day uptrend.
- RBI Minutes defy hopes of pause in rate hikes amid inflation woes.
- Mixed US data, BOJ’s second unscheduled bond operation weighs on US Dollar.
- US Q3 GDP, PCE details will be important for immediate directions.
USD/INR retreats from the weekly top, taking offers to refresh the intraday low near 82.77 during early Thursday, as the US Dollar reverses the previous day’s recovery amid mixed catalysts. Also adding strength to the Indian Rupee (INR) are the recently firmer Indian Treasury bond yields after the Reserve Bank of India’s (RBI) hawkish comments in the latest monetary policy meeting Minutes.
“RBI cannot afford to prematurely pause its rate tightening cycle with inflation staying above its upper tolerance band,” stated RBI Minutes on Wednesday. The Minute Statement also quotes Governor Shaktikanta Das as saying that a premature pause in monetary policy action would be a costly policy error at this juncture.
Following the hawkish comments from RBI, India’s benchmark 10-year Treasury bond yields rose to 7.29% versus 7.28% marked the previous day.
On the other hand, the US 10-year Treasury bond yields remain depressed near 3.65% after retreating from the monthly high of 3.72% the previous day. The same weighs on the US Dollar Index (DXY), down 0.36% around 103.88 by the press time.
It’s worth noting that the DXY bounced off it's weekly low the previous day as the US Conference Board’s (CB) Consumer Confidence jumped to the eight-month high of 108.3 for December, compared to the market forecasts of 101.0 and the revised prior readings of 101.40. However, the US Existing Home Sales for November, 4.09M MoM compared to 4.2M expected and 4.43M prior, probed the US Dollar bulls.
Additionally favoring the US Dollar’s safe-haven demand were updates surrounding Russia and Ukraine as Ukrainian President Volodymyr Zelensky’s US visit and Russian President Vladimir Putin’s readiness to increase the country’s military potential.
Alternatively, China’s readiness for more stimulus and the Bank of Japan’s (BOJ) second unscheduled bond buying allow US stock futures to remain mildly bid, as well as let the US Treasury bond yields retreat, at the latest.
To sum up, the year-end holiday season could challenge the USD/INR moves. However, the final prints of the US Gross Domestic Product (GDP) and Core Personal Consumption Expenditure (PCE) details for the third quarter (Q3) could entertain the pair traders ahead of Friday’s US Core PCE Price Index for November, also known as the Fed’s preferred inflation gauge. That said, the US GDP is expected to confirm 2.9% Annualized growth in Q3 while the Core PCE is anticipated to also meet the initial forecasts of 4.6% QoQ during the stated period.
Technical analysis
Although multiple rejections from 83.00 keeps USD/INR bears hopeful, a three-week-old bullish channel, between 83.30 and 82.65, restricts short-term moves of the pair.
-
03:19
Japan to sell $1.44 trillion worth of JGBs in FY2023/24 – Reuters
Citing a draft of the plan, Reuters reported on Thursday, Japan's Ministry of Finance (MoF) plans to sell 190 trillion yen ($1.44 trillion) worth of Japanese government bonds (JGB) in the fiscal year beginning April 1, with cuts in the amount of short-term debt sold.
Separately, Reuters noted that “private sector advisers of Japan's top economic council on Thursday called on the government to step up talks on how to ensure wages rise faster than inflation.”
Related reads
- Japan’s PM Kishida: Will host a special session of council on economic, fiscal policy early next year
- USD/JPY Price Analysis: Gearing up for another break of 131.00 on impending bear cross
-
03:03
Japan’s PM Kishida: Will host a special session of council on economic, fiscal policy early next year
Japanese Finance Minister Fumio Kishida said in a statement on Thursday, “we will host a special session of council on economic and fiscal policy and it will be held early next year to examine long-term macroeconomic policy with an expert panel.”
PM Kishida said he “wants industries to carry out investments of 100 trillion Yen as early as possible.”
Market reaction
USD/JPY continues to hold the lower ground on the above comments, down 0.60% on the day at 131.70.
-
02:59
EUR/USD defends channel support above 1.0600 amid renewed US Dollar selling
- EUR/USD is bouncing from near 1.0600 amid a fresh spurt of US Dollar selling.
- Investors cheer a ‘Santa rally’ while EUR/USD also cheers falling Treasury yields.
- EUR/USD defends the rising channel support at 1.0620, but for how long?
EUR/USD is attempting a rebound toward 1.0650 in Thursday’s Asian trading. The US Dollar comes under renewed selling pressure amid a risk-on market profile, as investors finally see a ‘Santa rally’ coming through. The upbeat market mood is also doing little to keep the sentiment around the US Treasury bond yields buoyed. Negative Treasury yields are also aiding the bounce in the EUR/USD pair. The benchmark 10-year US rates are down roughly 1% on the day at 3.65%, as of writing.
On the EUR side of the story, encouraging Germany’s IFO Business Climate Index climbed to 88.6 in December versus the previous reading of 86.3 and the forecast of 87.2. The institute also offered a positive outlook for the country’s employment sector for early 2023. The improving economic situation in Europe’s no.1 economy, Germany, underpins the EUR/USD recovery. The hawkish European Central Bank (ECB) policy outlook also keeps the Euro bulls hopeful.
The focus now shifts toward the US Q3 GDP revision, weekly Jobless Claims and other minority reports, especially after US consumer confidence rose to an eight-month high in December, as the inflation expectations fell to 6.7%.
EUR/USD: Technical outlook
Having traversed within a rising channel formation since November 30, EUR bulls reversed from the channel resistance at 1.0736 last week.
The pair has been consolidating near the lower boundary of the channel so far this week, having bounced off that support at 1.0620 in early Asia on Thursday.
The 14-day Relative Strength Index (RSI) stays flat while above the 50.00 level, suggesting that the rebound could have legs going forward.
The next stop for bulls is seen at the weekly high at 1.0658, above which the 1.0700 threshold could come into play.
On the other side, if EUR/USD closes the day below the abovementioned rising trendline (channel) support, then it would confirm a downside break from the channel.
A fresh downswing toward the upward-sloping 21-Daily Moving Average (DMA) at 1.0524 cannot be ruled out. Although the 1.0600 round level could offer some temporary respite to the EUR/USD buyers.
EUR/USD: Daily chart
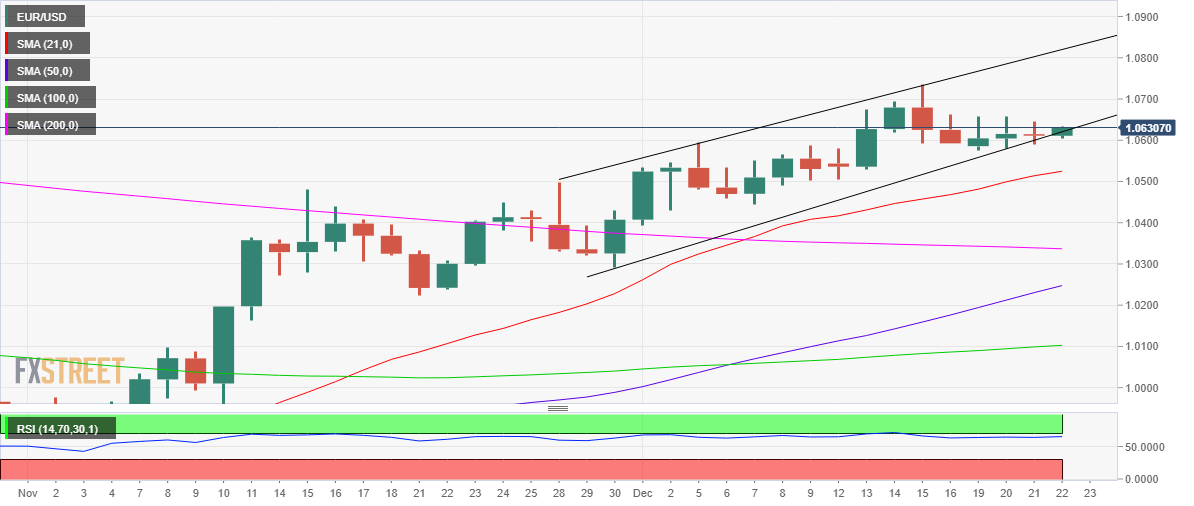
EUR/USD: Additional technical levels to watch
-
02:39
GBP/USD grinds higher past 1.2100 ahead of UK/US GDP
- GBP/USD recovers from three-week low amid broad US Dollar pullback.
- Upbeat UK CBI Retail Sales favor bulls but British medical worker’s strike probe Cable bulls.
- Softer Treasury yields, mixed US data probe USD ahead of US Q3 GDP.
- UK’s Q3 GDP is expected to confirm 0.20% QoQ contraction.
GBP/USD prints mild gains around 1.2110 as it pares the previous day’s losses ahead of the third quarter (Q3) Gross Domestic Product (GDP) details of the UK and the US.
The Cable pair dropped to the lowest levels in three weeks the previous day amid a broad US Dollar rebound. However, mixed updates and a retreat in the Treasury bond yields seemed to have weighed on the quote of late. On the contrary, upbeat prints of the British data lure pair buyers ahead of the key statistics.
That said, the UK’s Confederation of British Industry (CBI) reported on Wednesday that the Retail Sales Balance in December rose to +11 from -19 in November. Also, the CBI's Expected Retail Sales for January came in at -17.
On the negative side, Reuters came out with the news saying, “Thousands of ambulance workers in England and Wales walked out over pay on Wednesday, increasing the strain on a state-funded health service a day after nurses went on strike, as government ministers advised the public to avoid taking risks.”
It should be noted that the US 10-year Treasury bond yields remain depressed near 3.65% after retreating from the monthly high of 3.72% the previous day. On the other hand, the US two-year bond coupons also drop to around 4.21% after a two-day downtrend.
On Wednesday, the US Conference Board’s (CB) Consumer Confidence jumped to the eight-month high of 108.3 for December, compared to the market forecasts of 101.0 and the revised prior readings of 101.40. However, the US Existing Home Sales for November, 4.09M MoM compared to 4.2M expected and 4.43M prior.
To sum up, the pre-data anxiety joins mixed clues from geopolitics to propel GBP/USD prices. Ukrainian President Volodymyr Zelensky’s US visit and Russian President Vladimir Putin’s readiness to increase the country’s military potential challenge the risk appetite. On the other hand, China’s readiness for more stimulus and the Bank of Japan’s (BOJ) second unscheduled bond buying allow US stock future to remain mildly bid at the latest.
Moving on, the UK Q3 GDP, expected to confirm 0.2% QoQ contraction, could recall the GBP/USD bears if marching downbeat forecasts or providing a negative surprise. On the other hand, the US GDP is expected to confirm 2.9% Annualized growth in Q3 while the Core PCE is anticipated to also meet the initial forecasts of 4.6% QoQ during the stated period.
Technical analysis
A clear bounce off the 200-DMA and an upward-sloping support line from late September, around 1.2080 by the press time, keeps GBP/USD buyers hopeful to revisit the monthly high surrounding 1.2450.
-
02:30
Commodities. Daily history for Wednesday, December 21, 2022
Raw materials Closed Change, % Silver 23.97 -0.7 Gold 1814.37 -0.19 Palladium 1679.19 -3.06 -
02:09
Silver Price Analysis: XAG/USD bulls flirt with key resistance around $24.00
- Silver price picks up bids to reverse the previous day’s pullback from eight-month high.
- XAG/USD seesaws around 22-month-old resistance line as prices portray bullish moving average crossover.
- Sellers need validation from June’s top to retake control.
Silver price (XAG/USD) remains mildly bid around the eight-month high as it reverses the previous day’s pullback by rising to $24.00 during early Thursday.
In doing so, the bright metal justifies firmer MACD signals and the bullish moving average crossover, also known as the Golden cross. That said, the 50-DMA pierces the 200-DMA from below, which in turn suggests the short-term upside of the Silver price.
It’s worth noting, however, that a downward-sloping resistance line from February 2021, around $24.70, appears a tough nut to crack for the XAG/USD bulls during the quote’s further upside.
In a case where the commodity prices rally beyond $24.70, the Silver buyers can easily aim for the yearly high marked in March at around $27.00. That said, April’s peak of $26.22 may act as a buffer during the run-up toward $27.00.
On the contrary, pullback moves may aim for the $23.00 round figure before directing Silver bears toward the previous weekly low of $22.55.
Following that, June’s high near $22.51 could act as the last defense of the Silver buyers.
Should the metal price drop below $22.51, the monthly bottom surrounding $22.00 will be in focus.
Silver price: Daily chart
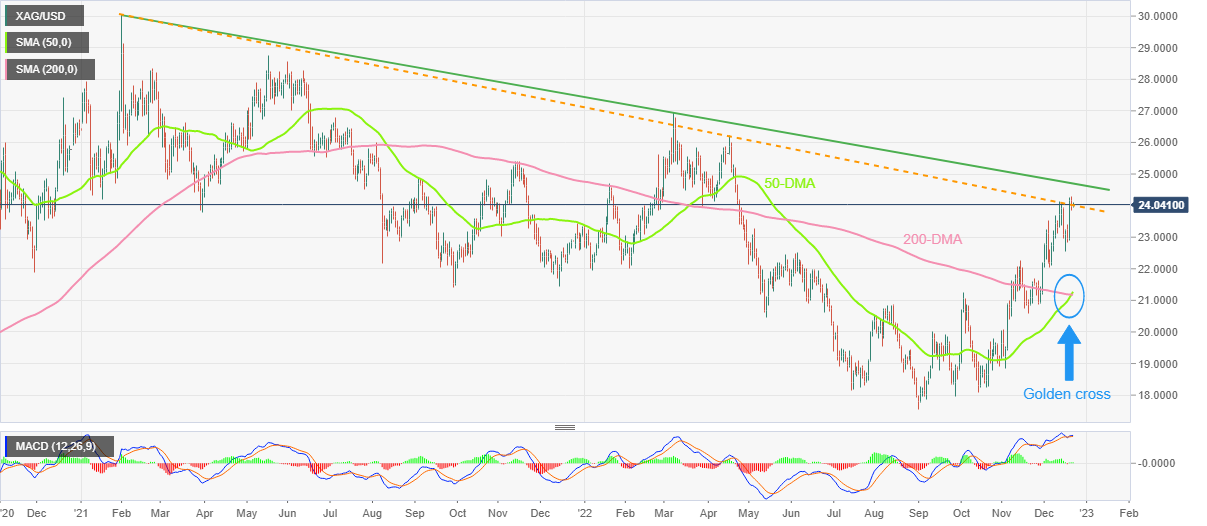
Trend: Further upside expected
-
02:07
USD/JPY Price Analysis: Gearing up for another break of 131.00 on impending bear cross
- USD/JPY is back in the red after seeing a dead cat bounce on Wednesday.
- US Treasury yields retreat, dragging USD/JPY lower amid upbeat mood.
- Impending bull cross on the daily chart leaves the pair exposed to 131.00.
USD/JPY is returning to the red zone below the 132.00 level early Thursday, fading a dead cat bounce seen on Wednesday. The renewed weakness in the US Dollar alongside the Treasury bond yields is weighing down on the currency pair.
The US Dollar is on a slippery slope, courtesy of the ‘Santa rally’ that kicked off on Wall Street, which is extending into the Asian markets. Meanwhile, the Yen resume its upward momentum, as the Japanese bond yields shifted into a new higher range.
The Bank of Japan (BoJ) announced an unscheduled bond-buying operation for the second straight day, which has failed to have any material impact on the USD/JPY pair so far.
Markets look past the upbeat US CB Consumer Confidence data, as all eyes now remain on the final revision to the US Q3 GDP, weekly Jobless Claims, Japanese inflation and BoJ minutes due on the cards in the balance of this week.
From a short-term technical perspective, USD/JPY is consolidating the downside, awaiting a fresh catalyst for a fresh leg lower.
The bearish 21-Daily Moving Average (DMA) is on the verge of cutting the mildly bullish 200DMA from above. A bull cross confirmation is what is needed for bears to accelerate control.
The 14-day Relative Strength Index (RSI) is sitting just above the oversold territory, suggesting that there is more room for a decline.
Immediate support awaits at the 131.00 round figure. Sellers will then target the four-month low of 130.57.
USD/JPY: Daily chart
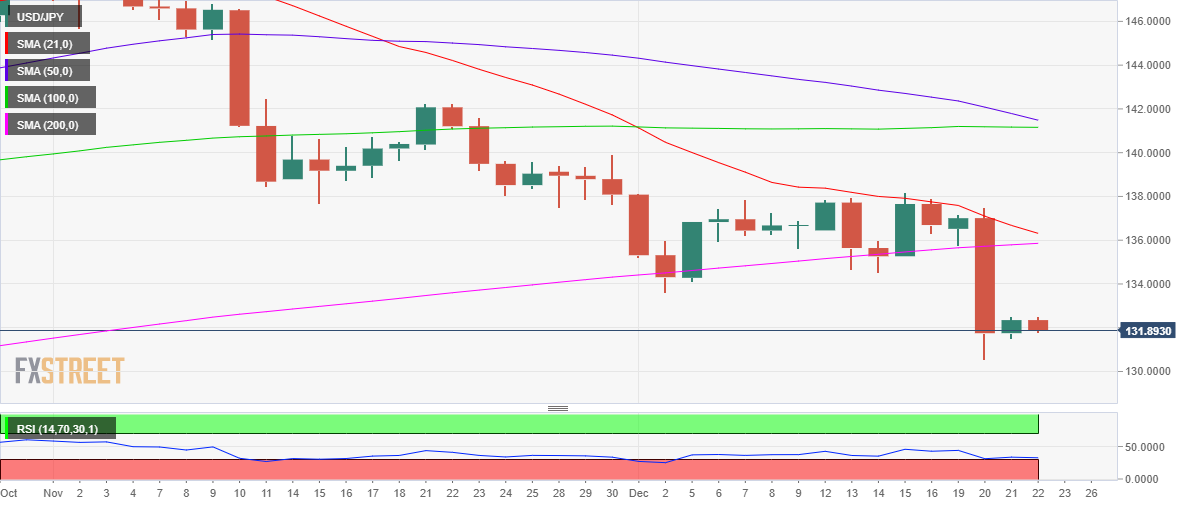
On the flip side, any recovery attempts will need to find acceptance above the 132.00 hurdle on a sustained basis. Recapturing Wednesday’s high at 132.53 is critical to unleashing the additional recovery toward the 133.00 barrier.
USD/JPY: Additional technical levels
-
01:48
USD/CHF prints four-day downtrend near 0.9250 as US Dollar retreats, US GDP in focus
- USD/CHF takes offers to refresh intraday low, down for the fourth consecutive day.
- US Dollar traces a pullback in Treasury yields amid mixed sentiment, holiday mood.
- Firmer US data allowed greenback to recover but hawkish statements in SNB quarterly report challenged USD/CHF bulls.
- US GDP, PCE details will be crucial for short-term directions amid holiday mood.
USD/CHF sellers keep the reins around the mid-0.9200s as they refresh intraday low during a four-day downtrend early Thursday.
The Swiss Franc (CHF) pair bounced off it's weekly low the previous day before retreating from 0.9290. Even so, the quote ended Wednesday on a negative note as hawkish details of the Swiss National Bank’s (SNB) quarterly report jostled with the mixed US data.
“The level of uncertainty associated with the (Swiss GDP) forecast is still high,” said the SNB in its quarterly economic upside the previous day. The SNB also mentioned that inflation will remain elevated for the time being.
On the other hand, the US Conference Board’s (CB) Consumer Confidence jumped to the eight-month high of 108.3 for December, compared to the market forecasts of 101.0 and the revised prior readings of 101.40. However, the US Existing Home Sales for November, 4.09M MoM compared to 4.2M expected and 4.43M prior.
Elsewhere, Ukrainian President Volodymyr Zelensky’s US visit and Russian President Vladimir Putin’s readiness to increase the country’s military potential challenge the risk appetite.
Additionally, the Bank of Japan’s second unscheduled bond buying and a retreat in the US Treasury yields recently exerted downside pressure on the US Dollar and weigh on the USD/CHF prices.
Given the latest US Dollar pullback and the holiday mood, the US Gross Domestic Product (GDP) for the third quarter (Q3) and Core Personal Consumption Expenditure (PCE) details for Q3 will be important for immediate directions. Forecasts suggest that the US GDP will confirm 2.9% Annualized growth in Q3 while the Core PCE is anticipated to also meet the initial forecasts of 4.6% QoQ during the stated period.
Technical analysis
A sustained U-turn from the 10-DMA hurdle, around 0.9300 by the press time, directs USD/CHF towards a five-week-old descending resistance line, near 0.9175.
-
01:46
Gold Price Forecast: XAU/USD Bears lurking at key resistance, eyes on $1,795
- Gold bears could be about to make their move at resistance.
- The hawkish Fed is a thorn in the side of Gold bulls, eyes on $1,795.
Gold price is up 0.26% so far on Thursday, with the yellow metal now holding around $1,820 following a move from the lows of $1,813.46. Traders are waiting for key data today from the US calendar with US Gross Domestic Product for the third quarter and weekly US Jobless Claims due at 1330 GMT. This comes ahead of the core Personal Consumption Expenditure (PCE) data scheduled on Friday which will be of particular interest following the recent hawkish rate hike from the Federal Reserve, (Fed).
Earlier this month, the Fed rose rates by 50 bps, lower than the prior four consecutive 75 bps rate hikes. However, Fed Chairman Jerome Powell gave off hawkish comments during the press conference, referencing the board's desire to continue raising rates in 2023 despite the risks of a recession.
After rising as high as 5.5% after last week’s FOMC meeting, the terminal rate as seen by the swaps market fell back to just below 5.0%. Similarly, WIRP suggests a 50 bp hike on February 1 is only about 35% priced in, followed by a 25 bp hike on March 22 and 20% odds of one more 25 bp hike on May 3, analysts at Brown Brothers Harriman explained.
''We cannot understand why the markets continue to fight the Fed. With the exception of some communications missteps here and there, Powell and company have been resolute about the need to take rates higher for longer. Although the media embargo has been lifted, there are no Fed speakers scheduled this week.'' In this regard, rising interest rates increase the opportunity cost of holding bullion since it pays no interest and synchronised rate hikes have weighed on gold in 2022.
''Although we expect the US fed funds rate to peak at 5%, a pause in rate hiking should turn market sentiment in favour of gold,'' analysts at ANZ Bank explained. ''This comes as we approach the end of US dollar dominance, and a depreciation in the currency would add further support to investor demand. With the Fed suggesting rates will remain high through 2023, the risk of weak economic growth next year. Gold prices tend to come under pressure ahead of recessions, but then outperform other markets (such as equities) during them.''
Gold technical analysis
The Gold price 1-hour picture is bearish while below the resistance near $1,825 and on the backside of the micro trendline and there are eyes on eyes on $1,795.
-
01:18
USD/CNY fix: 6.9713 vs. previous closing of 6.9810
In recent trade today, the People’s Bank of China (PBOC) set the yuan (CNY) at 6.9713 vs. previous closing of 6.9810.
About the fix
China maintains strict control of the yuan’s rate on the mainland.
The onshore yuan (CNY) differs from the offshore one (CNH) in trading restrictions, this last one is not as tightly controlled.
Each morning, the People’s Bank of China (PBOC) sets a so-called daily midpoint fix, based on the yuan’s previous day's closing level and quotations taken from the inter-bank dealer.
-
01:17
AUD/USD Price Analysis: Bulls attack 0.6730 resistance confluence
- AUD/USD picks up bids to poke short-term key resistance during two-day uptrend.
- Convergence of 200-EMA, descending trend line from Tuesday restricts immediate upside.
- Firmer oscillators suggest further recovery towards weekly resistance line.
- Short-term triangle’s support probes sellers from retaking control.
AUD/USD picks up bids to refresh intraday high near 0.6730 during early Thursday. In doing so, the Aussie pair buyers attack a short-term key resistance while extending the previous day’s recovery moves during a sluggish Asian session.
The quote’s run-up takes clues from firmer RSI (14), not overbought, as well as the bullish MACD signals.
However, the convergence of the 200-Exponential Moving Average (EMA) and a two-day-old descending resistance line, near 0.6730, challenges the AUD/USD bulls.
Also acting as an upside hurdle is the downward-sloping resistance line from December 13, close to 0.6785 by the press time.
In a case where AUD/USD manages to stay firmer past 0.6785, the 0.6800 round figure could act as the last defense of the bears before directing the upside moves toward the monthly high near 0.6895, as well as the 0.6900 round figure.
On the flip side, pullback moves remain elusive unless staying inside the two-day-old symmetrical triangle, currently between 0.6730 and 0.6680.
Even if the quote drops below 0.6680, it needs validation from the monthly low of 0.6630 and the 0.6600 round figure to convince bears.
Overall, AUD/USD is likely to pare recent losses but the upside momentum has limited room towards the north.
AUD/USD: Hourly chart
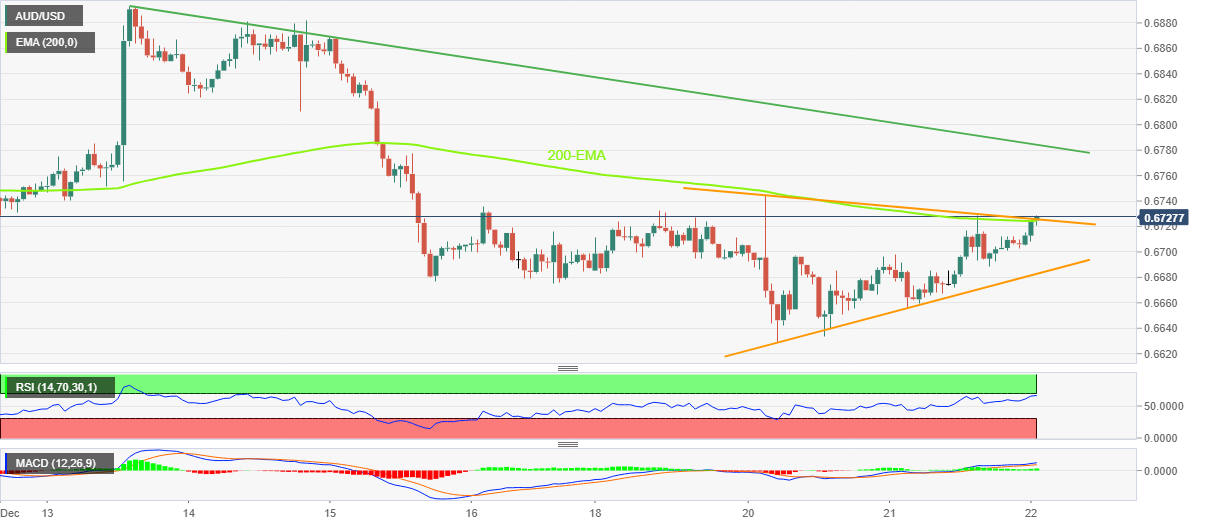
Trend: Further upside expected
-
01:16
BoJ Announces unscheduled bond buying operation
BoJ announces unscheduled bond buying operation and offers to buy JPY1.325Tln worth of JGBs:
- JPY650Bln 3-5 Year.
- JPY675Bln 5-10 Year.
Meanwhile, Japan's government revised up on Thursday its growth forecast for the next fiscal year on prospects for higher business expenditure and substantial wage hikes that are seen underpinning consumption, Reuters reported.
''The upgraded projections, which provide a basis for the government's annual budget plan due on Friday, underscore how Japan is set to buck a global growth slowdown thanks to robust domestic demand supported by inbound tourism reopening.''
''"Private sector demands will drive growth in fiscal 2023,"'' the government said in a statement, although warning of downside risks from an overseas economic slowdown, inflation, supply bottlenecks and market fluctuations.
Japan's real gross domestic product (GDP) is expected to expand 1.5% in the fiscal year beginning in April 2023, the government said in its new semi-annual projection, up from 1.1% in the previous forecast made in July.''
-
01:04
WTI surfs a micro trendline support with a focus into the $79.80s
- WTI moving higher along the micro trendline support.
- Focus could be returning to structural supply risks amid a potential recovery in demand from China.
West Texas Intermediate, (WTI), is higher on Thursday by some 0.38% and has reached a high of $78.77 from a low of $78.36. It has made the highest since December 2 on the back of a larger-than-expected drop in US inventories. At the same time, Saudi Arabia's oil minister said OPEC+ will continue to manage the market to support prices.
In a weekly survey, the Energy Information Administration said US oil inventories dropped by 5.9-million barrels in the prior week, way above the consensus that analysts estimated which was for a 0.17-million barrel draw, according to Oilprice.com. Meanwhile, OPEC+ is said to continue to actively manage the market as it looks to maintain oil prices, Saudi Arabia's oil minister was reported to have said.
Analysts at TD Securities recently said WTI and Brent crude were showing ''nascent signs that the epic repricing in supply risk premia has come to an end, which may suggest that the market's focus will return to structural supply risks amid a potential recovery in demand from China's loosening Covid restrictions. In this sense, upside triggers could be brought into range heading into 2023.''
USD/CAD technical analysis
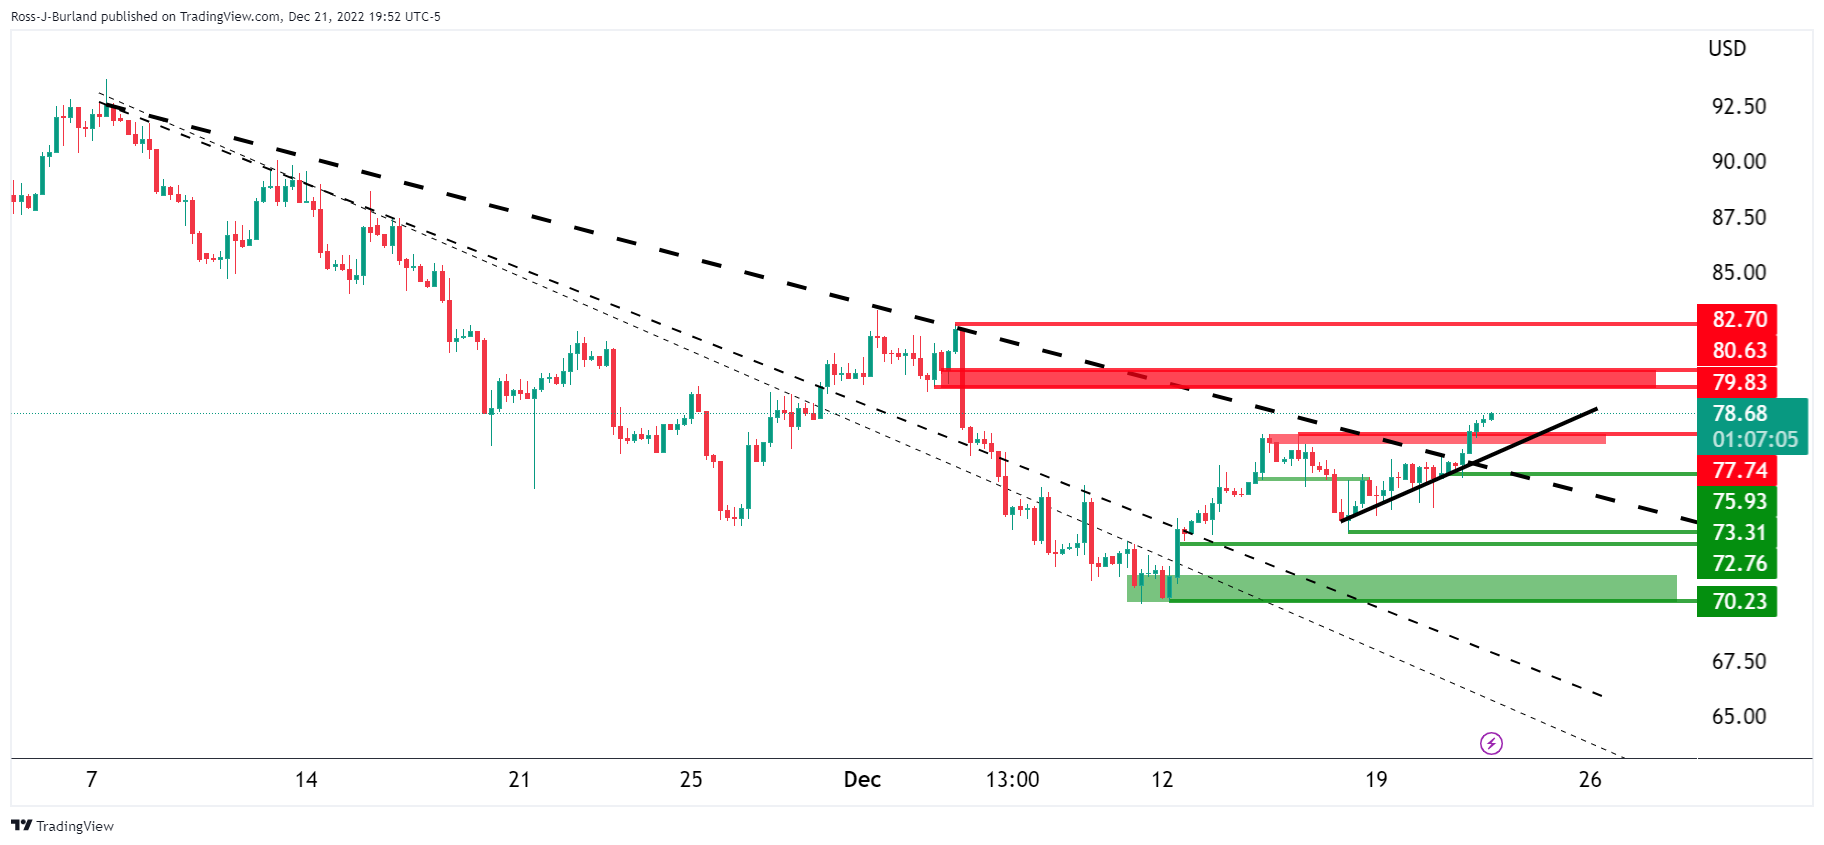
Having broken the bearish trend resistance, the price is rising along a micro trendline support with a focus into the $79.80s.
-
00:58
Goldman Sachs expects S&P 500 to end 2023 around 4,000
Goldman Sachs (GS) recently joined a slew of global investment bankers while unveiling the 2023 forecasts.
In its latest analysis, the GS expects S&P 500 Future to average around 4,000 in 2023.
The US bank also states that S&P 500 EPS is still $224 in 2023 while stating, “The firm remains underweight the S&P 500 Industrials Sector despite its 19% rally since the start of the fourth quarter.”
Goldman Sachs’ forecast on S&P 500 is near to the predictions of Bank of America, HSBC and Citibank.
It should be noted that the US bank anticipated a 5,100 level for the year 2022 by this time of 2021.
That said, the S&P 500 Futures print mild gains of around 3,910 by the press time of Thursday’s Asian session.
Also read: Forex Today: Little action across the FX board
-
00:41
US Dollar Index struggles to defend recovery above 104.00 ahead of US GDP
- US Dollar Index remains sidelined after snapping two-day downtrend.
- Firmer US data, challenges to sentiment underpin DXY rebound.
- Pullback in Treasury bond yields, holiday mood restrict immediate upside.
- Final readings of US Q3 GDP, PCE details eyed for clear directions.
US Dollar Index (DXY) remains indecisive around 104.20, struggles to extend the previous day’s rebound during Thursday’s sluggish Asian session. In doing so, the greenback’s gauge versus the six major currencies portrays the market’s holiday mood, as well as the cautious sentiment ahead of this week’s key data, namely the US Dollar Index struggles to defend recovery above 104.00 ahead of US GDP
The DXY cheered upbeat US data and challenges to sentiment emanating from Russia to print the first daily gain in three the previous day.
That said, the US Conference Board’s (CB) Consumer Confidence jumped to the eight-month high of 108.3 for December, compared to the market forecasts of 101.0 and the revised prior readings of 101.40. On the other hand, Ukrainian President Volodymyr Zelensky’s US visit and Russian President Vladimir Putin’s readiness to increase the country’s military potential challenge the risk appetite.
Alternatively, a pullback in the US Treasury bond yields joined risk-positive news from China to probe the US Dollar Index buyers. The US 10-year Treasury bond yields remain sidelined near 3.66% after retreating from the monthly high of 3.72% the previous day. On the other hand, the US two-year bond coupons remain pressured around 4.22% after a two-day downtrend.
Recently, hopes of faster economic recovery in Germany and mixed comments from the European Central Bank (ECB) official Mario Centeno join mixed comments from US President Joe Biden and Ukrainian President Zelensky to restrict the DXY moves amid mixed mood. While portraying the mood, the S&P 500 Futures print mild gains amid sluggish yields and mixed performance in the Asia-Pacific markets.
Moving on, risk catalysts could direct intraday DXY moves ahead of the US GDP and Core PCE data for Q3. US GDP is expected to confirm 2.9% Annualized growth in Q3 while the Core PCE is anticipated to also meet the initial forecasts of 4.6% QoQ during the stated period. Also important will be Friday’s Core PCE Price Index for November, the Fed’s preferred inflation gauge.
Technical analysis
A five-week-old bearish channel restricts DXY moves between 102.90 and 104.60.
-
00:30
Stocks. Daily history for Wednesday, December 21, 2022
Index Change, points Closed Change, % NIKKEI 225 -180.31 26387.72 -0.68 Hang Seng 65.69 19160.49 0.34 KOSPI -4.34 2328.95 -0.19 ASX 200 90.8 7115.1 1.29 FTSE 100 126.72 7497.32 1.72 DAX 213.16 14097.82 1.54 CAC 40 129.81 6580.24 2.01 Dow Jones 526.74 33376.48 1.6 S&P 500 56.82 3878.44 1.49 NASDAQ Composite 162.26 10709.37 1.54 -
00:22
USD/JPY traces sluggish US Treasury bond yields near 132.50, US GDP eyed
- USD/JPY fades recovery from four-month low, struggles to consolidate BOJ-led losses.
- US 10-year Treasury bond yields retreat from monthly high.
- BOJ announced unscheduled bond buying after shocking markets with YCC tweak.
- Final readings of US Q3 GDP, Fed’s preferred inflation gauge eyed for fresh impulse.
USD/JPY remains sidelined around 132.50, struggling to extend the previous day’s recovery from a four-month low, as markets in Tokyo begin Thursday’s trading with no major excitement.
The reason could be linked to the absence of major data/events, as well as mixed concerns surrounding the risk catalysts and holiday mood. Adding strength to the dullness could be the cautious mood ahead of the US Gross Domestic Product (GDP) for the third quarter (Q3) and Core Personal Consumption Expenditure (PCE) details for Q3.
It’s worth noting that the sluggish performance of the US Treasury bonds also challenges the USD/JPY prices amid an inactive Asian session. That said, the US 10-year Treasury bond yields remain sidelined near 3.66% after retreating from the monthly high of 3.72% the previous day. On the other hand, the US two-year bond coupons remain pressured around 4.22% after a two-day downtrend.
While the bond coupons seem to pare the Bank of Japan (BOJ)-led gains, the BOJ’s unscheduled bond buying operation, announced Wednesday, also weighed on the Treasury yields. On Wednesday, the BOJ offered to buy JPY200 billion worth of Japanese Government Bonds (JGBs), including JPY100 billion 3-5 Year and JPY100 billion 5-10 Year.
Elsewhere, firmer US data and fears emanating from Russia seem to challenge the USD/JPY bears amid mixed sentiment. That said, the US Conference Board’s (CB) Consumer Confidence jumped to the eight-month high of 108.3 for December, compared to the market forecasts of 101.0 and the revised prior readings of 101.40. On the other hand, Ukrainian President Volodymyr Zelensky’s US visit and Russian President Vladimir Putin’s readiness to increase the country’s military potential challenge the risk appetite.
While portraying the mood, Wall Street closed positive and the US Treasury yields retreated. Even so, the US Dollar Index (DXY) snapped a two-day downtrend. It’s worth noting that the S&P 500 Futures remain mildly bid of late.
Moving on, the year-end inaction could restrict USD/JPY pair moves amid a light calendar. It’s worth noting that the US GDP is expected to confirm 2.9% Annualized growth in Q3 while the Core PCE is anticipated to also meet the initial forecasts of 4.6% QoQ during the stated period. Also important will be Friday’s Core PCE Price Index for November, the Fed’s preferred inflation gauge. Furthermore, Japan’s Coincident Index and Leading Economic Index for October could offer immediate directions.
Technical analysis
The oversold RSI conditions join August month’s low to challenge USD/JPY bears around 130.40. The latest attempts to rebound, however, remain elusive unless crossing the early December low near 133.65.
-
00:16
USD/CAD Price Analysis: Bulls need to move in at trendline support to guard against bearish breakout to 1.3500
- USD/CAD is at a crossroads, leaving into trendline support.
- A bullish continuation could be on the cards.
USD/CAD was unchanged on Wednesday despite domestic data that showed underlying inflation pressures picking up. However, from a technical perspective, the bias is to the upside as the following will illustrate.
In the prior analysis, USD/CAD Price Analysis: Bears moving in and eye 1.3600/20, it was noted that USD/CAD remained within a bull cycle trend but The price was decelerating on the bid and the bears were moving in.
There was a focus on a move into the 50% mean reversion and micro bullish trendline. The 61.8% ratio was just below and was expected to be tapped for a test of 1.3600 prior to the next bullish impulse.
USD/CAD prior analysis
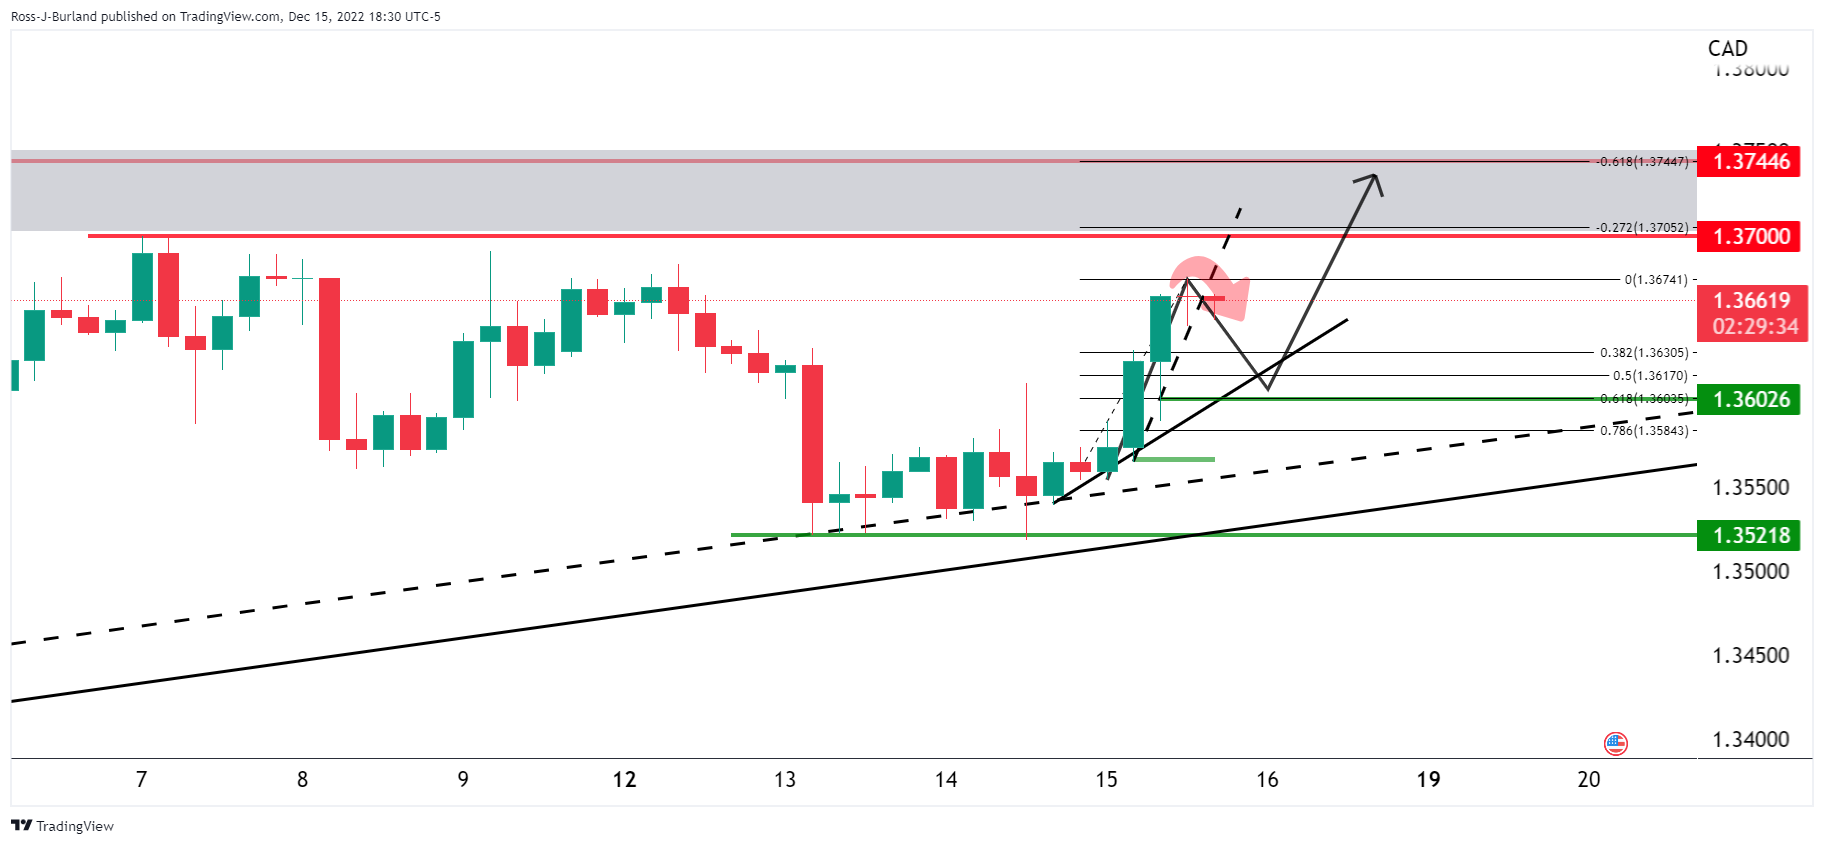
USD/CAD update, H4 and daily chart
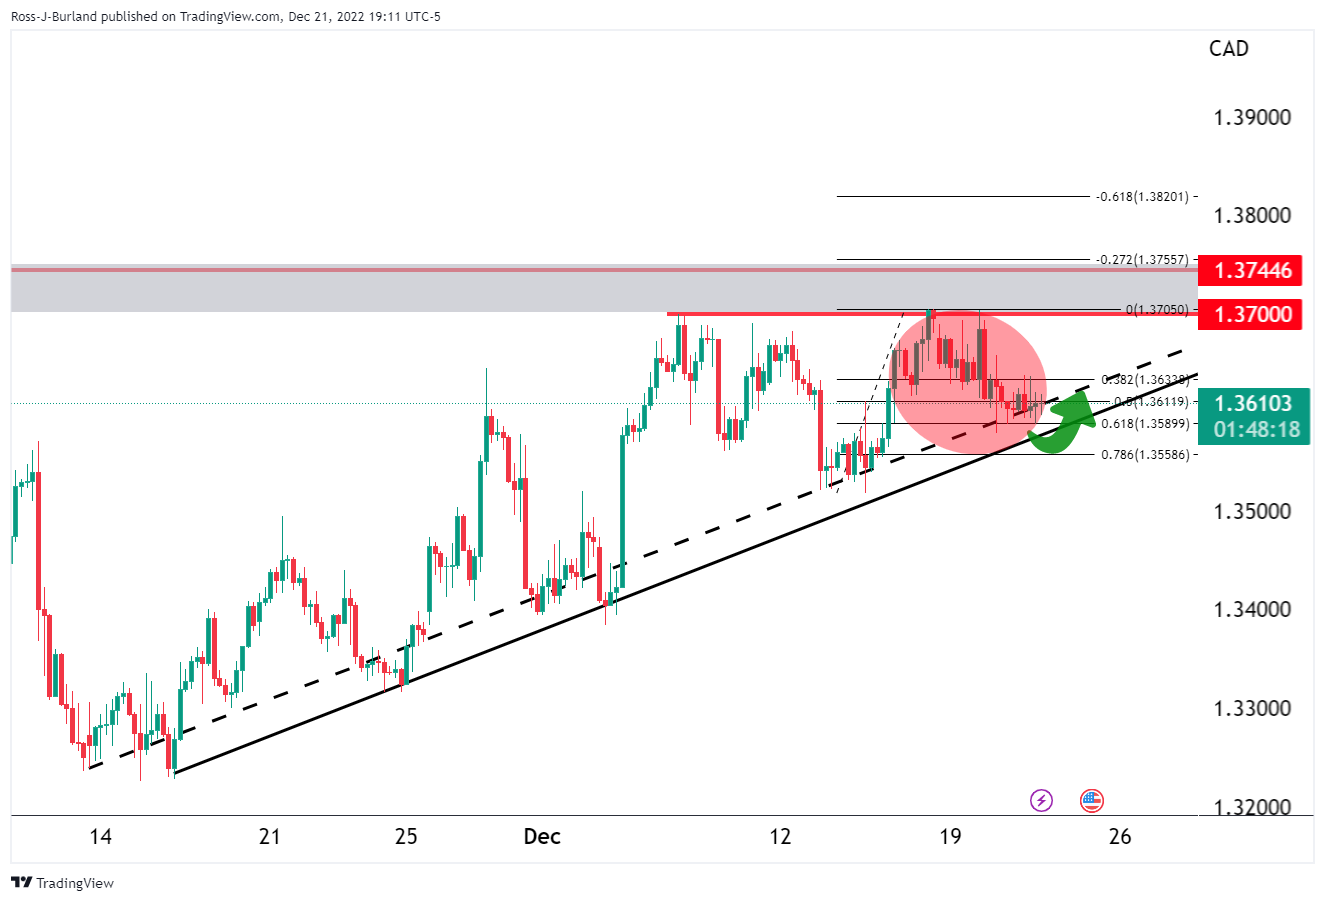
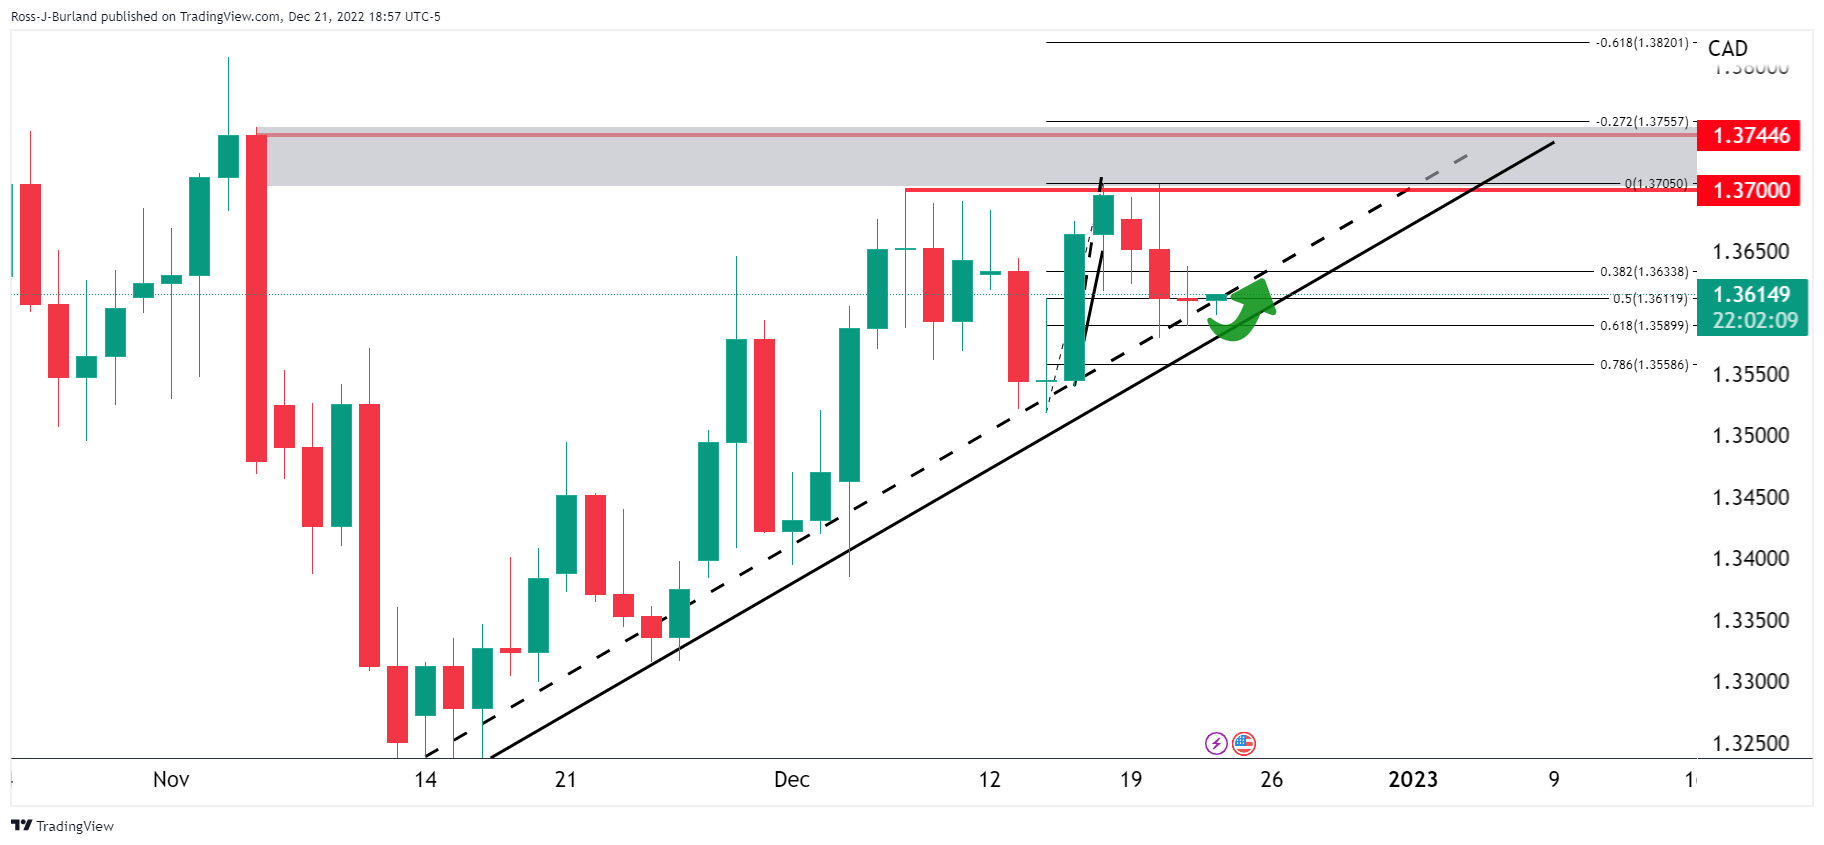
The correction into the trendline is slowing and there are prospects of a continuation to the upside. Failing that, a peak formation could be put in, resiting in a break of the bullish cycle for the days ahead with eyes on 1.3500.
-
00:15
Currencies. Daily history for Wednesday, December 21, 2022
Pare Closed Change, % AUDUSD 0.67076 0.52 EURJPY 140.425 0.51 EURUSD 1.06059 -0.2 GBPJPY 159.964 -0.12 GBPUSD 1.2082 -0.74 NZDUSD 0.6295 -0.81 USDCAD 1.36103 0.08 USDCHF 0.92672 0.07 USDJPY 132.4 0.68 -
00:02
EUR/USD seesaws near 1.0600 with eyes on US GDP, Fed’s preferred inflation
- EUR/USD dribbles inside a tight trading range surrounding 1.0600, picks up bids of late.
- Mixed comments from ECB officials, firmer US data teased bears the previous day.
- Optimism surrounding Germany recently helped buyers amid sluggish session.
- Final readings of US Q3 GDP, PCE details eyed for clear directions.
EUR/USD makes rounds to 1.0600 during early Thursday, defending the weekly trading range of 90 pips, as traders await the US data for fresh impulse. In addition to the pre-data anxiety, the major currency pair’s latest inaction could be linked to the mixed catalysts from Eurozone and the US, not to forget the risk headlines.
EUR/USD snapped a two-day uptrend with minor losses the previous day as firmer US data joined mixed comments from European Central Bank (ECB) officials.
Upbeat prints of Germany’s GfK Consumer Confidence for January, to -37.8 versus -38.0 expected and -40.1 prior, failed to impress the ECB policymakers as Bank of Portugal Governor Mario Centeno stated, “All data point to inflation reaching its peak in the euro area in the fourth quarter of 2022.”
It should be noted that the German Finance Ministry’s recently upbeat forecasts seem to favor the EUR/USD buyers. “Germany's finance ministry expects activity in Europe's biggest economy to remain subdued during the fourth quarter of this year and first quarter of next and sees declining inflation rates during 2023,” it said in its monthly report per Reuters.
Elsewhere, the US Conference Board’s (CB) Consumer Confidence jumped to the eight-month high of 108.3 for December, compared to the market forecasts of 101.0 and the revised prior readings of 101.40.
Talking about the risk catalysts, Ukrainian President Volodymyr Zelensky’s US visit and Russian President Vladimir Putin’s readiness to increase the country’s military potential challenges the market sentiment and the EUR/USD bulls of late. On the same line could be fears surrounding China’s economic growth.
Against this backdrop, Wall Street closed positive and the US Treasury yields retreated. Even so, the US Dollar Index (DXY) snapped a two-day downtrend. It’s worth noting that the S&P 500 Futures remain mildly bid of late.
Looking forward, a lack of data/events from the bloc highlights the US Gross Domestic Product (GDP) for the third quarter (Q3) and Core Personal Consumption Expenditure (PCE) details for Q3. Forecasts suggest that the US GDP is expected to confirm 2.9% Annualized growth in Q3 while the Core PCE will also meet the initial forecasts of 4.6% QoQ during the stated period. Also important will be Friday’s Core PCE Price Index for November, the Fed’s preferred inflation gauge.
Given the likely improvement in the scheduled US data, the EUR/USD prices may witness further downside in the case of firmer US statistics. However, a positive surprise won’t be ignored, especially when the pair is in recovery mode lately.
Technical analysis
Bearish Doji candlestick joins a clear downside break of the six-week-old ascending support line, now resistance near 1.0685, to keep EUR/USD sellers hopeful. That said, a horizontal area comprising multiple levels marked since November 16, near 1.0450-40, appears the key support for bears to watch before aiming for the 200-DMA level surrounding 1.0335.
-
00:01
Ireland Consumer Confidence increased to 48.7 in December from previous 45.3
-