Notícias do Mercado
-
23:56
NZD/USD slides below 0.6200 on downbeat NZ Retail Sales, focus on US data, RBNZ’s Orr
- NZD/USD takes offers to refresh intraday low after downbeat New Zealand data.
- New Zealand’s Q2 Retail Sales dropped -2.3% QoQ, -1.6% YoY.
- Fears surrounding China recedes, mixed US data also tests DXY bulls ahead of the key event.
- Second-tier US statistics will decorate calendar ahead of Thursday’s speech from RBNZ Governor Orr.
NZD/USD remains pressured for the second consecutive day, taking offers around 0.6190 to refresh the intraday low, amid downbeat New Zealand (NZ) Retail Sales figures. Also exerting downside pressure on the Kiwi pair is the cautious mood ahead of the key annual speaking event at the Jackson Hole.
New Zealand’s second quarter (Q2) Retail Sales growth slumped to -2.3% QoQ versus -0.5% prior. The yearly figures also dropped way below the previous readings of 0.0% to -1.6% YoY.
Being the first partial indicator for the NZ Q2 GDP, the data managed to keep bears hopeful and raise challenges for Reserve Bank of New Zealand (RBNZ) Governor Adrian Orr when he speaks at the Jackson Hole on Thursday. It’s worth noting that the recently mixed NZ data have raised doubts about the RBNZ’s further rate hikes, which in turn keeps the NZD/USD bears hopeful.
Even so, mixed US data and the market’s anxiety ahead of the key event, namely the Jackson Hole symposium, keep the pair bears on their toes. US Durable Goods Order for July dropped to 0.0% versus 0.6% expected and an upwardly revised 2.2% previous reading. However, Nondefense Capital Goods Orders ex Aircraft rose past 0.3% market consensus to 0.4%, versus 0.9% prior. Further, Pending Home Sales improved to -1.0% MoM in July versus -4.0% expected and -8.9% prior (revised down from -8.6%). On a yearly basis, the Pending Home Sales decreased by 19.9%, versus the previous contraction of 20.0%.
Also testing the NZD/USD bears are the recent hopes that China may manage to overcome the recession woes, even with smaller losses. Various Chinese state media agencies are coming to the rescue of the local currency, the yuan, after the recent depreciation, justifying that the country’s strong exports should offset a stronger dollar and hawkish Fed rate hikes, mentioned Reuters on Wednesday.
Against this backdrop, the US 10-year Treasury yields rose the most in a week while refreshing a two-month high around 3.10% whereas the Wall Street benchmarks printed mild gains.
Looking forward, the second version of the US Q2 GDP will join the US Personal Consumption Expenditure (PCE) for the said period to decorate the calendar. However, major attention will be given to RBNZ Governor Orr’s speech at the Jackson Hole for fresh impulse.
Technical analysis
NZD/USD seesaws between a two-month-old horizontal area of 0.6135-50 and the 50-DMA level near 0.6235. However, MACD and RSI (14) are in favor of the sellers of late.
-
23:47
New Zealand Retail Sales ex Autos (QoQ): -1.6% (2Q) vs previous 0%
-
23:46
New Zealand Retail Sales (QoQ): -2.3% (2Q) vs previous -0.5%
-
23:45
USD/CAD Price Analysis: Bears face rejection near 1.2950 inside fortnight-old rising channel
- USD/CAD sellers attack support line of the bullish chart pattern.
- Bearish MACD signals, lower high formation keep sellers hopeful.
- Buyers have a bumpy road on the way to previous monthly top.
USD/CAD stays defensive around 1.2965, poking the support line of a two-week-old ascending trend channel, during Thursday’s Asian session.
That said, the Loonie pair’s recent lower high formation joins the bearish MACD signals to tease sellers inside a bullish chart pattern.
However, a clear downside break of the stated channel’s support line, at 1.2950 by the press time, appears necessary for the USD/CAD bear’s entry.
Even so, the 200-SMA level near 1.2905 could test the downside momentum before directing the bears towards the monthly low of 1.2727. During the fall, multiple supports around 1.2800 and 1.2765 could challenge the sellers.
Alternatively, recovery moves may initially have to cross the weekly falling resistance line, at 1.3000 by the press time, before challenging the 61.8% Fibonacci retracement level of July-August downside, around 1.3035.
Following that, a horizontal area established from early July, close to 1.3085-90, will be important to watch for the pair buyers. Additionally challenging the USD/CAD upside is the top of the stated channel, near 1.3115 at the latest.
USD/CAD: Four-hour chart

Trend: Further weakness expected
-
23:36
GBP/USD Price Analysis: Bearish pennant advocates more downside ahead
- The cable is going through the process of inventory distribution for further downside.
- For more downside, a breakdown of the RSI (14) below 40.00 could be optimal.
- EUR/USD could re-visit pandemic lows after violating the round-level support of 1.1700.
The GBP/USD pair is indicating a volatility squeeze as the asset is auctioning in an extremely narrow range in the early Tokyo session. The cable is struggling to cross the immediate hurdle of 1.1800. On a broader note, the asset is oscillating in a 1.1757-1.1838 range after a pullback move from a two-year low at 1.1717.
A formation of a bearish pennant chart pattern on an hourly scale is strengthening the greenback bulls. The above-mentioned chart pattern results in a sheer downside move after a downside break of the consolidation. Usually, a consolidation phase denotes the distribution of inventory from institutional investors to retail participants as the latter prefers catching a falling knife rather than selling the weakness.
The 20-period Exponential Moving Average (EMA) at 1.1800 is overlapping with the cable prices, which signals a consolidation ahead.
Also, the Relative Strength Index (RSI) is oscillating in a 40.00-60.00 range, which indicates the unavailability of a potential trigger for a decisive move. However, a dip below 40.00 by the momentum oscillator will activate a fresh downside impulsive wave.
The investing community will witness a vertical downside move if cable drops below the two-year low at 1.1717, which will drag the asset towards the 25 March 2020 low at 1.1638, followed by the 19 March 2020 low at 1.1472.
Alternatively, the pound bulls could regain their mojo and may drive the asset higher towards the August 3 low and high at 1.2135 and 1.2200 after violating the psychological resistance of 1.2000 decisively.
GBP/USD hourly chart
-637969773489663442.png)
-
23:25
EUR/USD treads water around mid 0.9900s with eyes on Jackson Hole
- EUR/USD remains sidelined after a volatile day that ended near the opening price.
- US dollar bulls relinquished controls after mixed US data helped equities to print mild gains.
- DXY printed small gains despite strong yields amid anxiety ahead of central bankers’ speeches at the Jackson Hole.
- The second readings of German/US GDP, Germany’s IFO Sentiment figures and US Core PCE data could also entertain traders.
EUR/USD steadies around 0.9970 while fading the bounce off 0.9910, as well as cooling down the retreat from 0.9998, amid traders’ anxiety ahead of the Jackson Hole symposium speech from Fed Chair Jerome Powell. The major currency pair also struggled for clear directions after mixed US data and a lack of major comments from the ECB/Fed policymakers.
US Dollar Index (DXY) began Wednesday on a firmer footing before retreating towards 108.50 as equities pared recent losses amid a lack of too-strong US data. Also exerting downside pressure on the greenback’s gauge versus the six major currencies was the indecision among the latest Fedspeak and market chatters that Fed Chair Powell may repeat his economic fears and may refrain from too hawkish comments at the Jackson Hole Symposium.
Talking about the US data, Durable Goods Order for July dropped to 0.0% versus 0.6% expected and an upwardly revised 2.2% previous reading. However, Nondefense Capital Goods Orders ex Aircraft rose past 0.3% market consensus to 0.4%, versus 0.9% prior. Further, Pending Home Sales improved to -1.0% MoM in July versus -4.0% expected and -8.9% prior (revised down from -8.6%). On a yearly basis, the Pending Home Sales decreased by 19.9%, versus the previous contraction of 20.0%.
It should be noted that Minneapolis Fed President Neel Kashkari mentioned that the biggest fear is that we are misreading underlying inflation dynamics, per Reuters. The policymaker also added that the Fed can relax on rate hikes when compelling evidence of CPI heading toward 2% is seen.
On the other hand, an influential economist Marcel Fratzscher of the German Institute for Economic Research mentioned, per Reuters, “The economic impact on Germany of Russia's invasion of Ukraine will last years.”
Elsewhere, Sara Johnson, Executive Director of Economic Research at S&P Global Market Intelligence, said in a statement on Wednesday, that global growth is likely to remain subdued in late 2022 and 2023 while inflation is seen moderating over the next two years.
Amid these plays, the US 10-year Treasury yields rose the most in a week while refreshing a two-month high around 3.10% whereas the Wall Street benchmarks printed mild gains.
Moving on, Final readings of Germany’s second quarter (Q2) GDP and the second version of the US Q2 GDP will join the US Personal Consumption Expenditure (PCE) for the said period to decorate the calendar. Also important to watch will be the monthly prints of Germany’s IFO sentiment figures. However, major attention will be given to Jackson Hole for fresh impulse.
Technical analysis
Doji candlestick at the multi-year low joins nearly oversold RSI to suggest that the EUR/USD bears are running out of fuel.
-
23:10
Silver Price Forecast: XAG/USD waver around $19.00 on subdued trading, ahead of Jackson Hole
- Silver prices remain choppy trading as investors prepare for Powell’s speech at Jackson Hole.
- XAG/USD benefitted from thin liquidity conditions and a soft greenback which, despite gaining, traded off the week’s highs.
- Fed’s Kashkari: Inflation is very high, and the Fed will relax until further evidence shows that inflation is reaching 2%.
Silver prices remain subdued on late Wednesday after Wall Street closed, with US equities recording minimal gains on a day characterized by thin market volatility as traders brace for Fed Chair Jerome Powell’s speech on Jackson Hole. At the time of writing, XAG/USD is trading at $19.15 a troy ounce, up by 0.13%.
On Wednesday, XAG/USD opened near the day’s high at around $19.10 before diving toward the daily lows at $18.93. However, buyers lifted white metal prices, reclaiming the $19.00 figure, and hitting a daily high at $19.22, before settling at current price levels.
Before the New York Stock Exchange (NYSE) opened, US Durable Good Orders for July unexpectedly jumped, as shown by data released by the US Commerce Department. Headline Orders were unchanged on a monthly reading while excluding defense and aircraft; so-called core Durable Good Orders rose by 0.4%, higher than estimates at 0.3%.
Later, US Pending Home Sales fell for the sixth consecutive month, collapsing by 19.9% YoY, less than 22% contraction, while on a month-over-month, it fell -1%, vs. -4% forecasts.
The US Dollar Index, a gauge of the greenback’s value against a basket of six currencies, extended its gains by 0.09%, at 108.600, while the 10-year US Treasury note rate at 3.109%, gaining six bps.
On Tuesday, Minnesota Fed President Neil Kashkari said that inflation is very high, and it is the Fed’s job to bring it down. He emphasized the need to tighten monetary policy and added that the Fed could only relax on rate increases when they see compelling evidence of inflation heading toward 2%.
What to watch
The US economic docket will feature the GDP growth rate for the second quarter, Initial Jobless Claims, and the Kansas City Fed Manufacturing Index for August.
Silver (XAG/USD) Key Technical Levels
-
22:55
Gold Price Forecast: XAU/USD aims establishment above $1,750, DXY stabilizes ahead of Jackson Hole
- Gold price is aiming to scale up its auctioning territory above $1,750.00.
- The DXY has turned sideways as investors await Jackson Hole Economic Symposium.
- The Fed is expected to continue its pace of hiking interest rates further.
Gold price (XAU/USD) is displaying a lackluster performance as it is hovering around the critical hurdle of $1,750.00. On a broader note, the precious metal is auctioning in an inventory adjustment phase after a firmer rebound from Tuesday’s low of $1,727.85.
The US dollar index (DXY) has also turned sideways around 108.60 despite a weak performance on the US Durable Goods Orders data front. The economic data landed a 0%, lower than the forecast of 0.6% and the prior release of 2.2%. Looks like, the market participants are purely focusing on the commentary from Federal Reserve (Fed) chair Jerome Powell at Jackson Hole Economic Symposium.
After the release of the downbeat US Purchasing Managers Index (PMI) economic data on Tuesday, the think tanks were dictating that the Fed might slow down its pace of hiking interest rates. As a contraction in economic activities is a consequence of vigorous interest rate hikes, Fed may trim the extent of a rate hike.
However, commentary from Minneapolis Fed Bank President Neel Kashkari has faded the rumors. Fed policymaker believes that the inflation rate above 8% is a big reason to worry and the Fed will stick to its path of bringing price stability sooner.
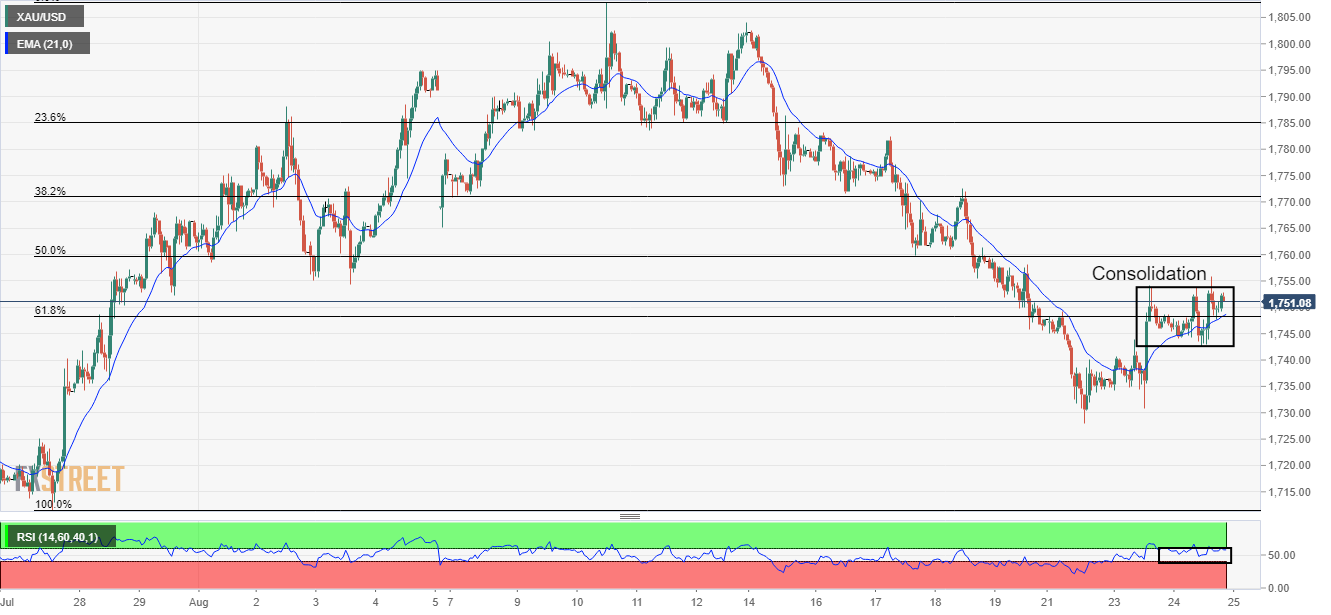
Gold technical analysis
Gold prices are displaying topsy-turvy moves in a tad wider range of $1,742.90-1,753.85 after establishing above the 61.8% Fibonacci retracement (placed from July 27 low at $1,711.53 to August 10 high at $1,807.93) at $1,748.38 on an hourly scale.
The precious metal is comfortably auctioning above the 20-period Exponential Moving Average (EMA) at $1,749.00, which validates a short-term uptrend.
Meanwhile, the Relative Strength Index (RSI) is attempting to shift into the bullish range of 60.00-80.00. The momentum oscillator is hovering around 60.00.
Gold hourly chart
-
22:41
AUD/USD Price Analysis: Bulls eye 0.6950 for Thursday's business, bears need to get below 0.6880
- AUD/USD bulls getting set for a significant move.
- The bears need to break 0.6900 and then 0.6880.
AUD/USD has been bottoming on the charts with a move below 0.69 the figure from where it has formed a peak bullish formation and bulls will be looking to engage from within 0.69 again for a bust higher over the course of the forthcoming sessions. The money is above the various swing pints on the hourly time frame:
AUD/USD H1 charts

The Gartley pattern is a bullish feature on the chart whereby the target aligns with a 78.6% Fibonacci retracement o the current corrective range between recent highs and lows of 0.6965 and 0.6880. The prior structure aligns with this target as being the 0.6945/50 area on the chart. The resistance until there are 0.6912, 0.6922 and 0.6931.
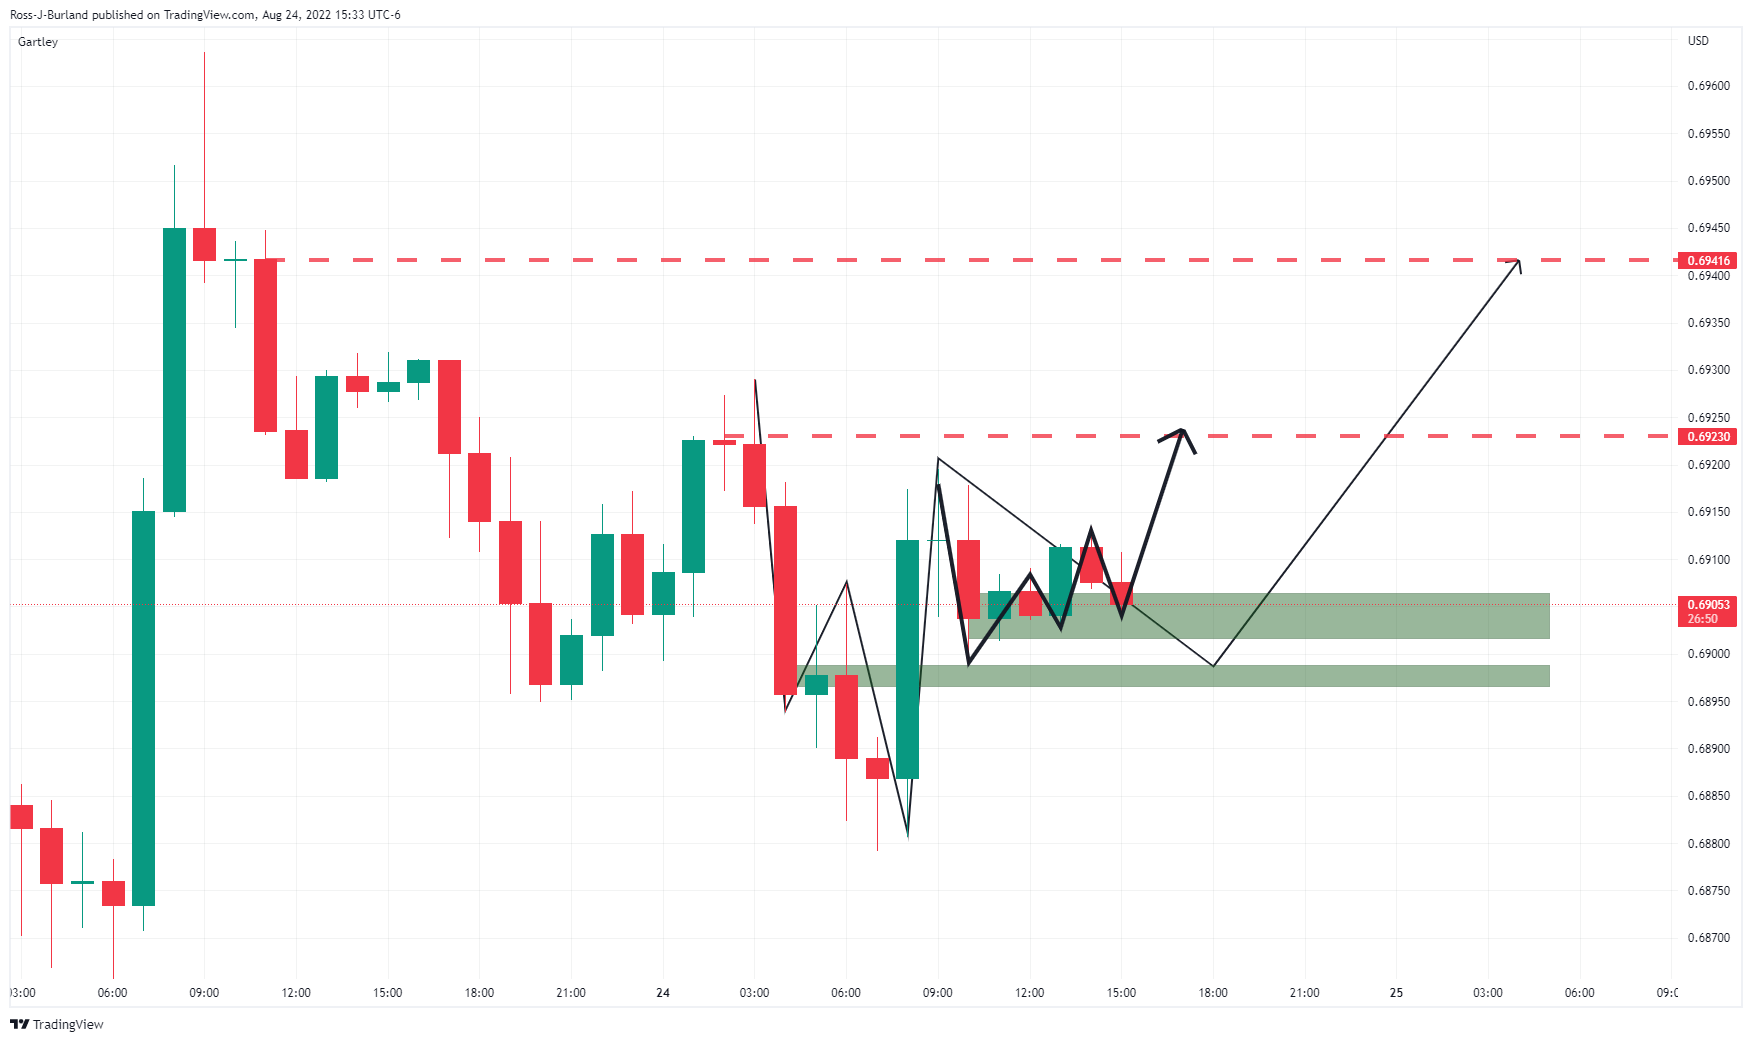
The W-formations are bottoming patterns where the price has, so far, been supported by the necklines. This is bullish for the Tokyo open and the day ahead. On the other hand, a break below these necklines, 0.6906, 0.6896 and then the 0.6880 lows will be bearish.
-
22:38
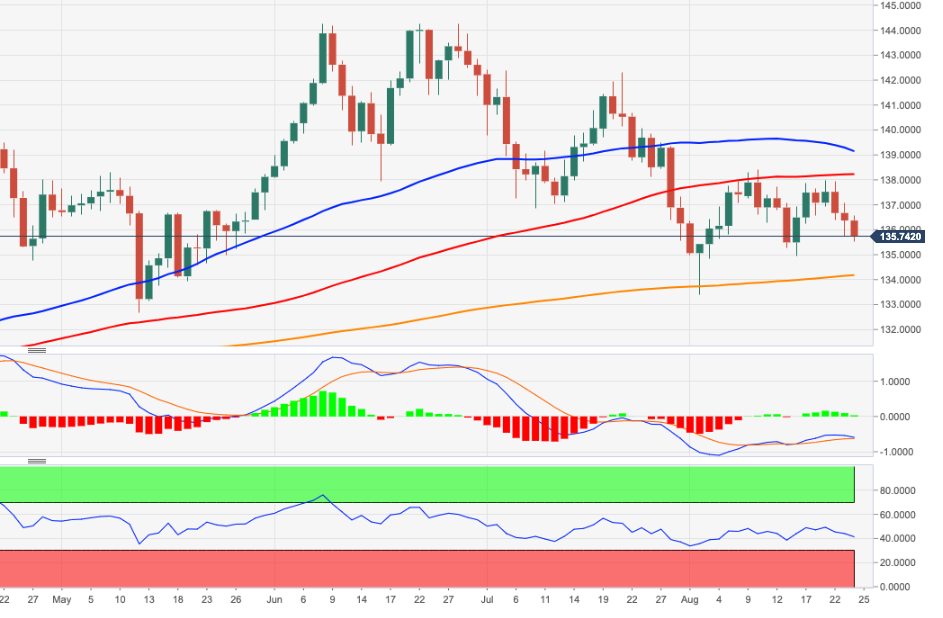
EUR/JPY Price Analysis: In consolidation, unable to crack the 137.00 mark on risk-on mood
- EUR/JPY bounced off weekly lows at around 135.51 due to improved sentiment.
- From a monthly chart perspective, an August close below 135.54 would keep sellers in control.
- The EUR/JPY weekly chart depicts the formation of a head-and-shoulders chart pattern, targeting the YTD lows around 124.00.
The EUR/JPY edges higher during the day, above the 136.50 figure, for the first time in the week, snapping two days of consecutive losses as the New York session finishes. As the Asian Pacific session starts, the EUR/JPY is trading at 136.67, with marginal gains of 0.01%.
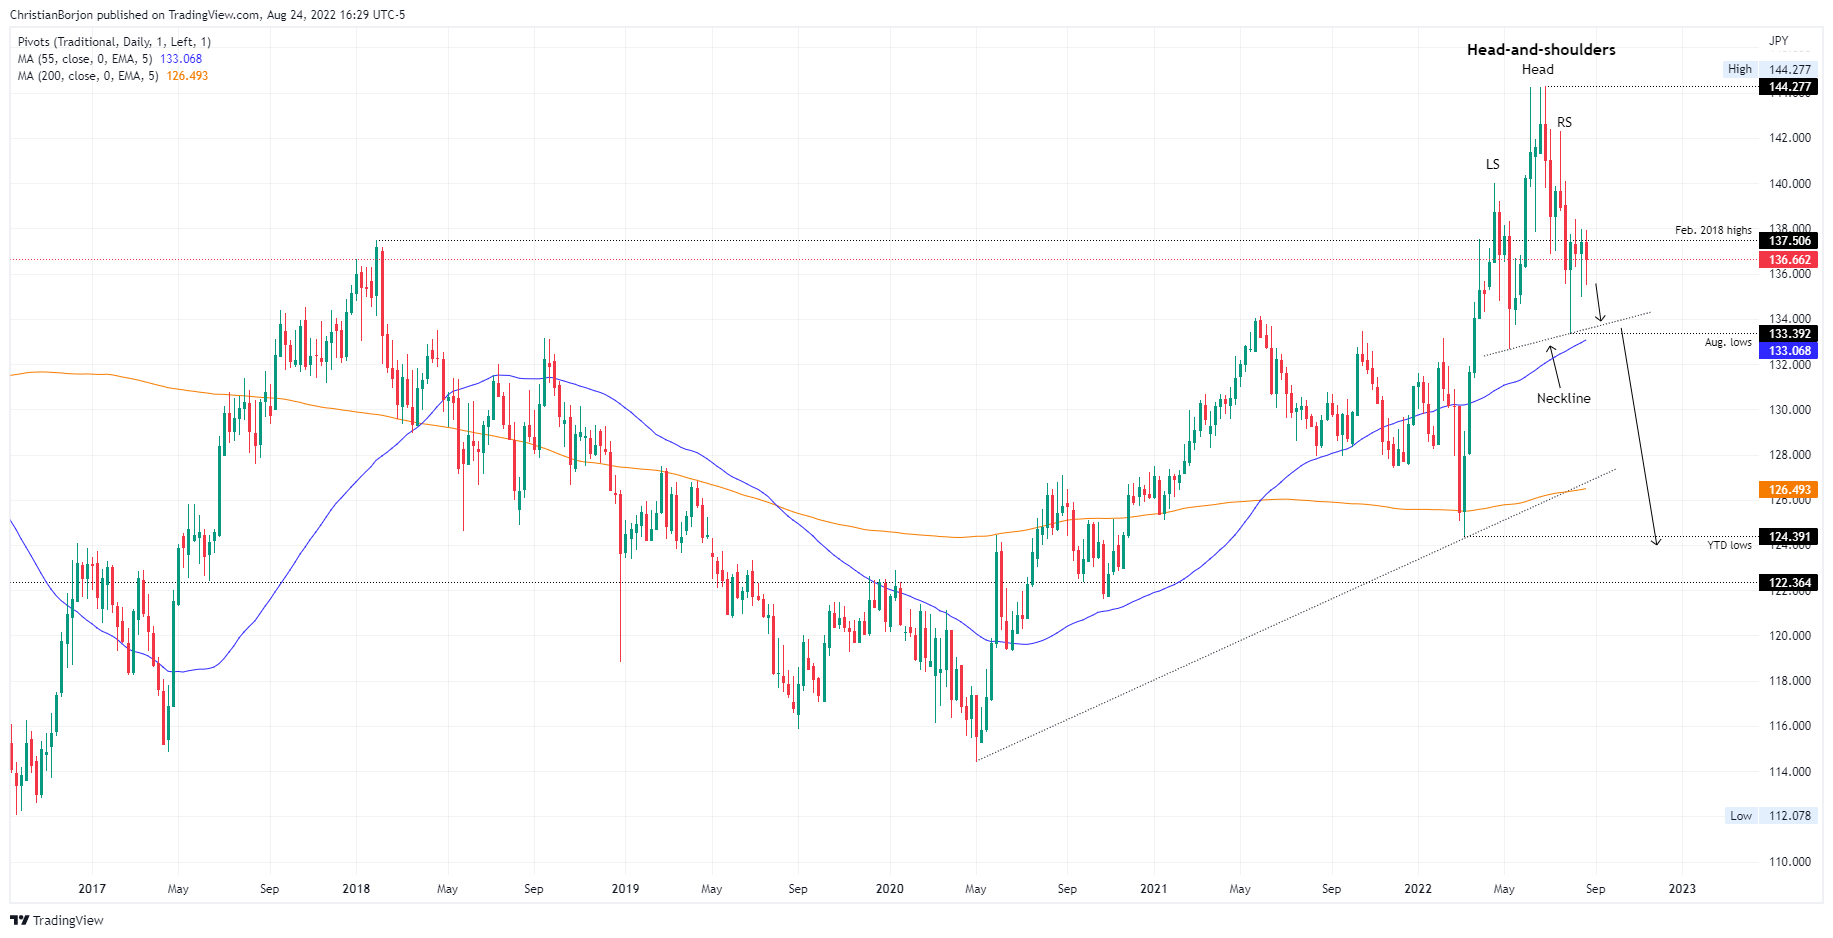
EUR/JPY Price Analysis: Technical outlook
From the monthly chart perspective, the EUR/JPY shows traders undecided, about to form a dragonfly-doji, after July staggering loss of 4.24%, created a bearish-engulfing candle pattern, which initially drove prices towards August lows around 133.39. If the EUR/JPY fails to achieve a monthly close below 135.54, July’s low will pave the way for further losses. Otherwise, expect prices to seesaw around the 136.20-138.40 area.
Meanwhile, the EUR/JPY weekly chart suggests forming a head-and-shoulders chart pattern, pending to break below the neckline around the 133.00-134.00 area for confirmation. Once achieved, the EUR/JPY profit target will be the 124.00 mark, below the YTD lows at 124.39.
EUR/JPY Key Technical Levels
-
22:04
GBP/JPY Price Analysis: Subdued around 161.70, range-bound for the last four days
- GBP/JPY snaps two days of consecutive gains, down by 0.01%.
- The GBP/JPY daily chart illustrates the pair as range-bound.
- The GBP/JPY is seesawing in the 161.00-162.30 area, unable to break beyond the range.
The GBP/JPY is seesawing within a narrow range for the third consecutive day, though on Wednesday, it failed to continue the last five days of successive series of lower highs/lows; however, indecision keeps lurking at the cross-currency pair. As of writing, the GBP/JPY is trading at 161.63, below its opening price.
On Wednesday, the cross-currency pair opened near the day’s high before sliding sharply to the lows of the day of 160.08, at a time when market sentiment turned sour. However, the GBP/JPY stayed a comeback and rallied towards the 100-hour EMA at 161.79, stalling the pair’s recovery.
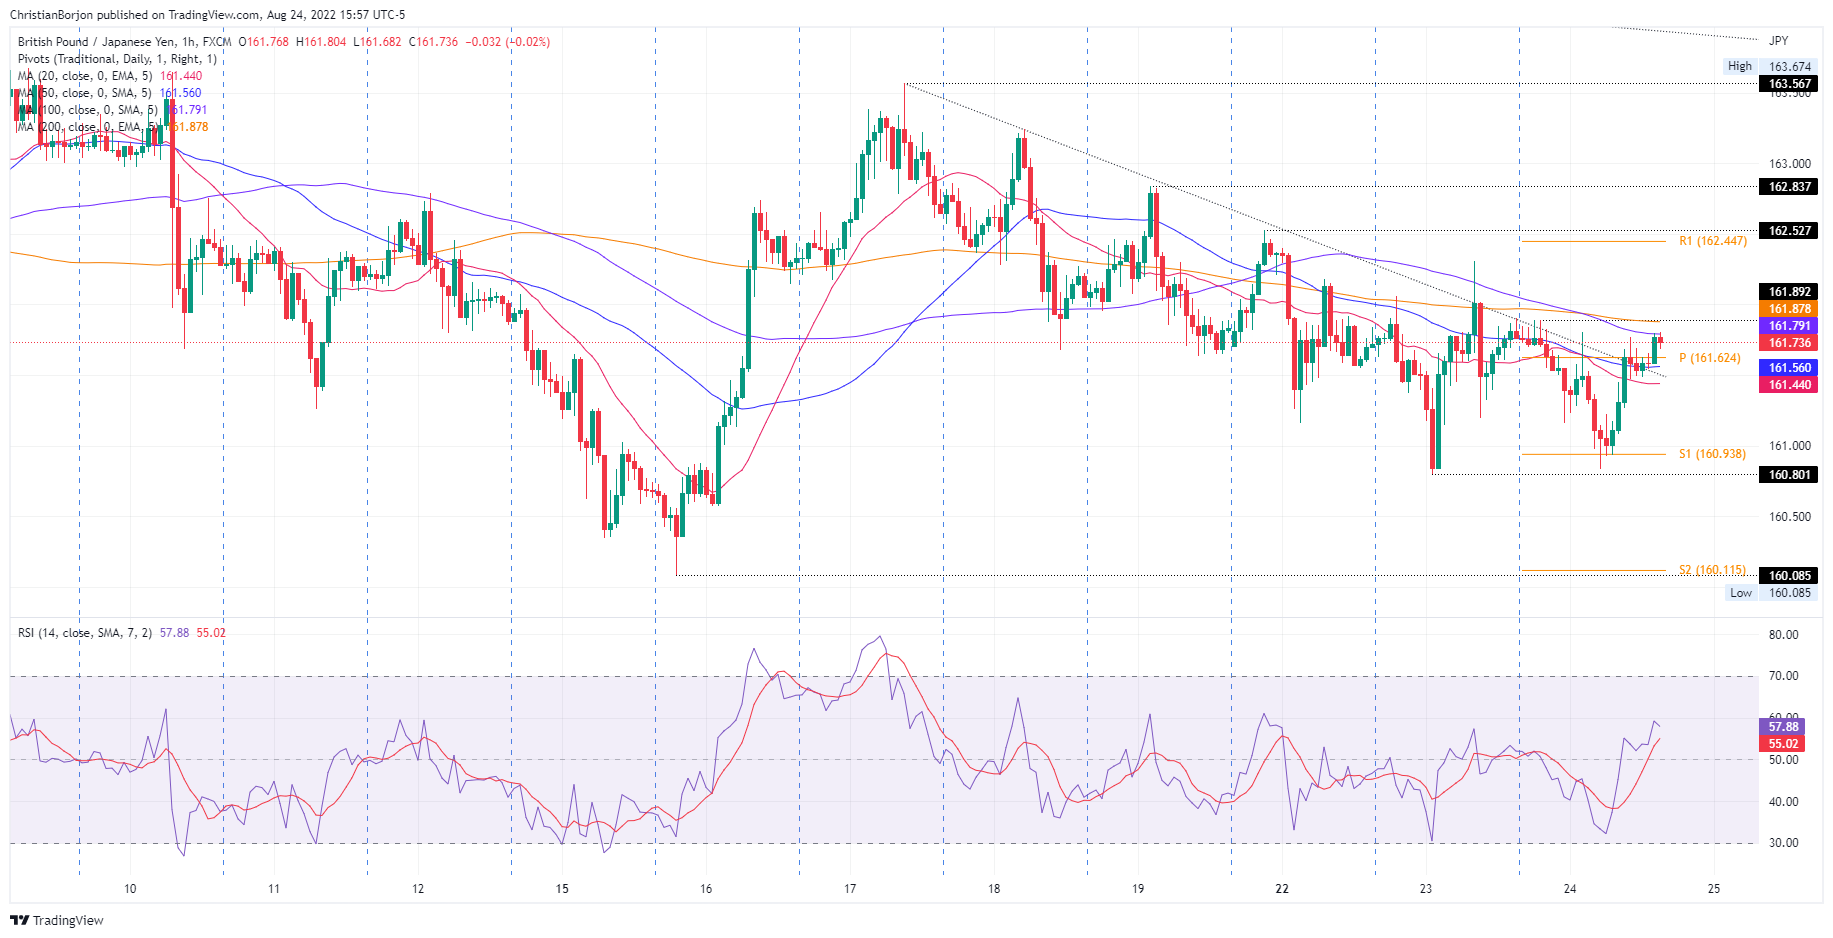
GBP/JPY Price Analysis: Technical outlook
From a daily chart perspective, the GBP/JPY has remained subdued for the last four days. During the previous three days, indecision surrounds the cross, further confirmed by the Relative Strength Index (RSI) almost flat, despite residing below the 50-midline.
In the short term, the GBP/JPY hourly chart portrays the pair as neutral biased. The exponential moving averages (EMAs) in the hourly chart are within a narrow range, below the exchange rate, except for the 100-EMA at 161.79. Therefore, the GBP/JPY trend is skewed to the upside, so a break above the latter, would open the door for further gains.
Therefore, the GBP/JPY first resistance would be the 162.00 figure. Once cleared, the next resistance would be the R1 pivot at 162.44, followed by the 163.00 mark.
On the other hand, if the GBP/JPY tumbles below the 161.00 mark, it would pave the way for further downside. The first support would be the 160.50 mark, followed by the S2 daily pivot at 160.11, followed by 160.00.
GBP/JPY Key Technical Level
-
22:00
South Korea Producer Price Index Growth (MoM) in line with forecasts (0.3%) in July
-
22:00
South Korea Producer Price Index Growth (YoY) below expectations (9.3%) in July: Actual (9.2%)
-
21:25
NZD/USD bulls are beaten back in a non-favourable environment
- NZD/USD is back under pressure following a resurgence in the greenback.
- The bulls, however, are also feeling the heat in an unfavourable commodities complex environment.
NZD/USD is trading at 0.6190 and has been in a range of between 0.6162 and 0.6218 on the day, losing some 0.3% currently into a sleepy close on Wall Street.
US stocks were mixed on the day, initially rallying as incoming data beat expectations on the whole. Analysts at ANZ Bank explained that growth in US Durable Goods Orders came in weaker than expected at 0% in July (exp: 0.8%, prev: 2.2%). ''However, this was largely driven by the volatile transportation component.
Excluding this, durable goods orders beat expectations, rising 0.3% (exp: 0.2%, prev: 0.3%). This was largely down to machinery, computers & electronics and fabricated metals. The stronger data suggests that investment activity is not slowing as quickly as some of the weaker survey and PMI data may suggest.''
Nevertheless, the US dollar gave up some gains later in the session into the London fix which enabled the kiwi to take flight early doors, although the price melted thereafter printing towards the lows of the day in midday trade from where the price has consolidated in and around thereafter.
''In many ways, the USD’s comeback is logical (at least from an NZ perspective) – it’s late-cycle here, so early winners may be early faders, and global growth risks abound – that’s hardly a supportive backdrop for commodity exporters,'' the analysts argued.
-
20:42
Forex Today: Caution prevails ahead of Jackson Hole
What you need to take care of on Thursday, August 25:
The dollar seesawed between gains and losses, ending the day mixed, but little changed across the FX board. The American currency advanced at the beginning of the day but shed some ground after Wall Street’s opening, as US stocks managed to post modest gains.
The US reported July Durable Goods Orders, which stayed virtually unchanged at $273.5 billion, missing expectations of a 0.6% increase. However, the reading on Nondefense Capital Goods Orders excluding Aircraft increased by 0.4%, beating the 0.3% expected.
Meanwhile, US Treasury yields edged sharply higher. The 10-year note yielded as much as 3.1269%, while the 2-year note yield peaked at 3.393%. The dollar eased during US trading hours despite yields holding at the upper end of their range.
The EUR/USD pair settled around 0.9960, little changed for a second consecutive day. GBP/USD trades just below the 1.1800 threshold. The AUD/USD trades at around 0.6900, down for the day, while USD/CAD trades at 1.2965.
Spot gold stands at around $1,750 a troy ounce while crude oil prices extended their advance, with WTI now trading at around $95 a barrel.
The dollar posted modest gains against its safe-haven rivals. USD/CHF stands at 0.9660 while USD/JPY trades at around 137.20.
The focus now shifts to the Jackson Hole Symposium. The US Federal Reserve’s annual event will host economists and policymakers from around the globe in which they will discuss global issues. Market players will try to reassess their estimates on potential rate hikes across major economies, alongside the risk of steeper economic downturns.
Top 3 Price Prediction Bitcoin, Ethereum, Ripple: Early bulls meet the butcher
Like this article? Help us with some feedback by answering this survey:
Rate this content -
20:34
USD/JPY Price Analysis: Bears are stepping on the gas and a move to 135.50 could be on the cards
- USD/JPY is meeting daily resistance, and a break of the hourly trendline support would expose 137 the figure.
- A break below there could open the way for a move below 136.80 towards 135.50.
USD/JPY bears are moving in and the following illustrates the prospects of a sizeable move to the downside to correct a significant portion of the recent rally in the US dollar.
USD/JPY daily chart
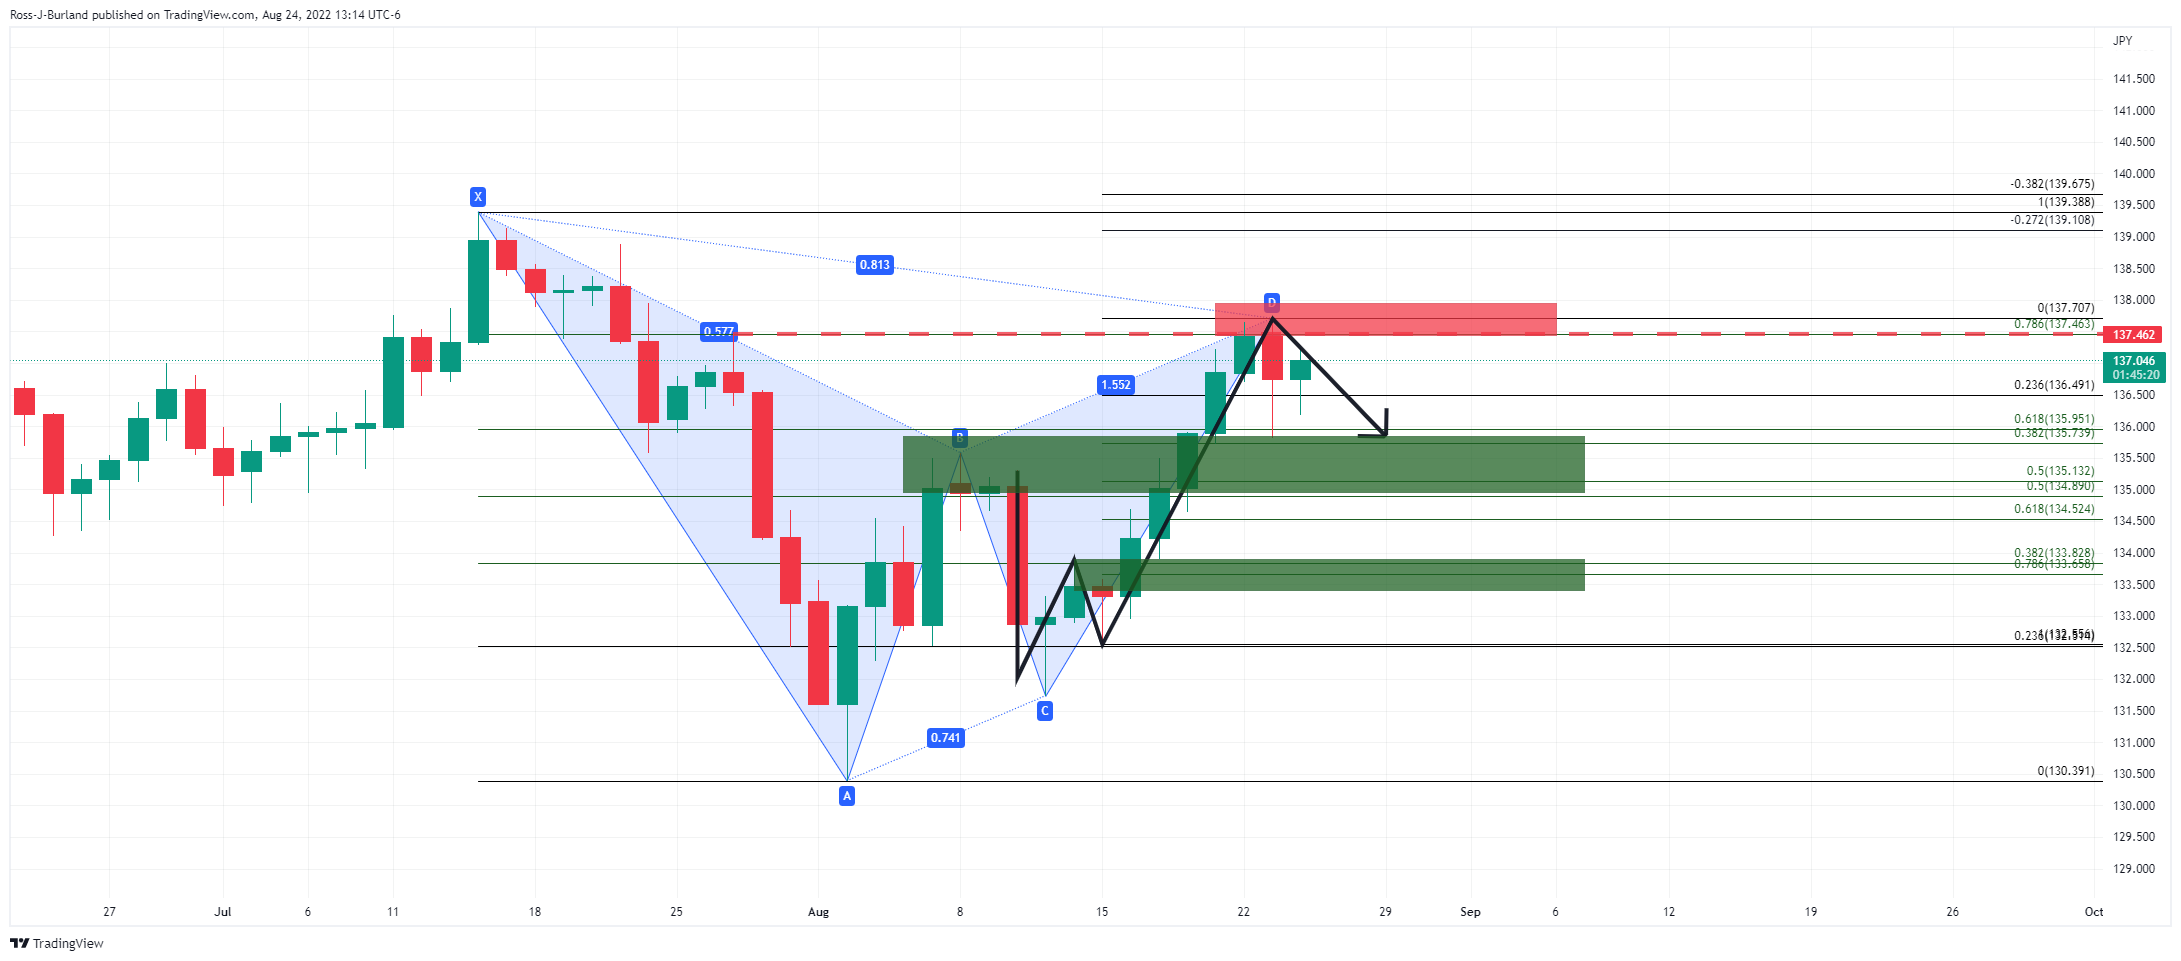
The Gartley pattern offers resistance around 137.50 which leaves the focus on the downside and back towards the pattern's neckline. This also aligns with the W-formation's 38.2% and 50% ratios. Zooming down to the hourly chart, we can see that the price is moving out of the bullish trend as follows:
USD/JPY H1 chart
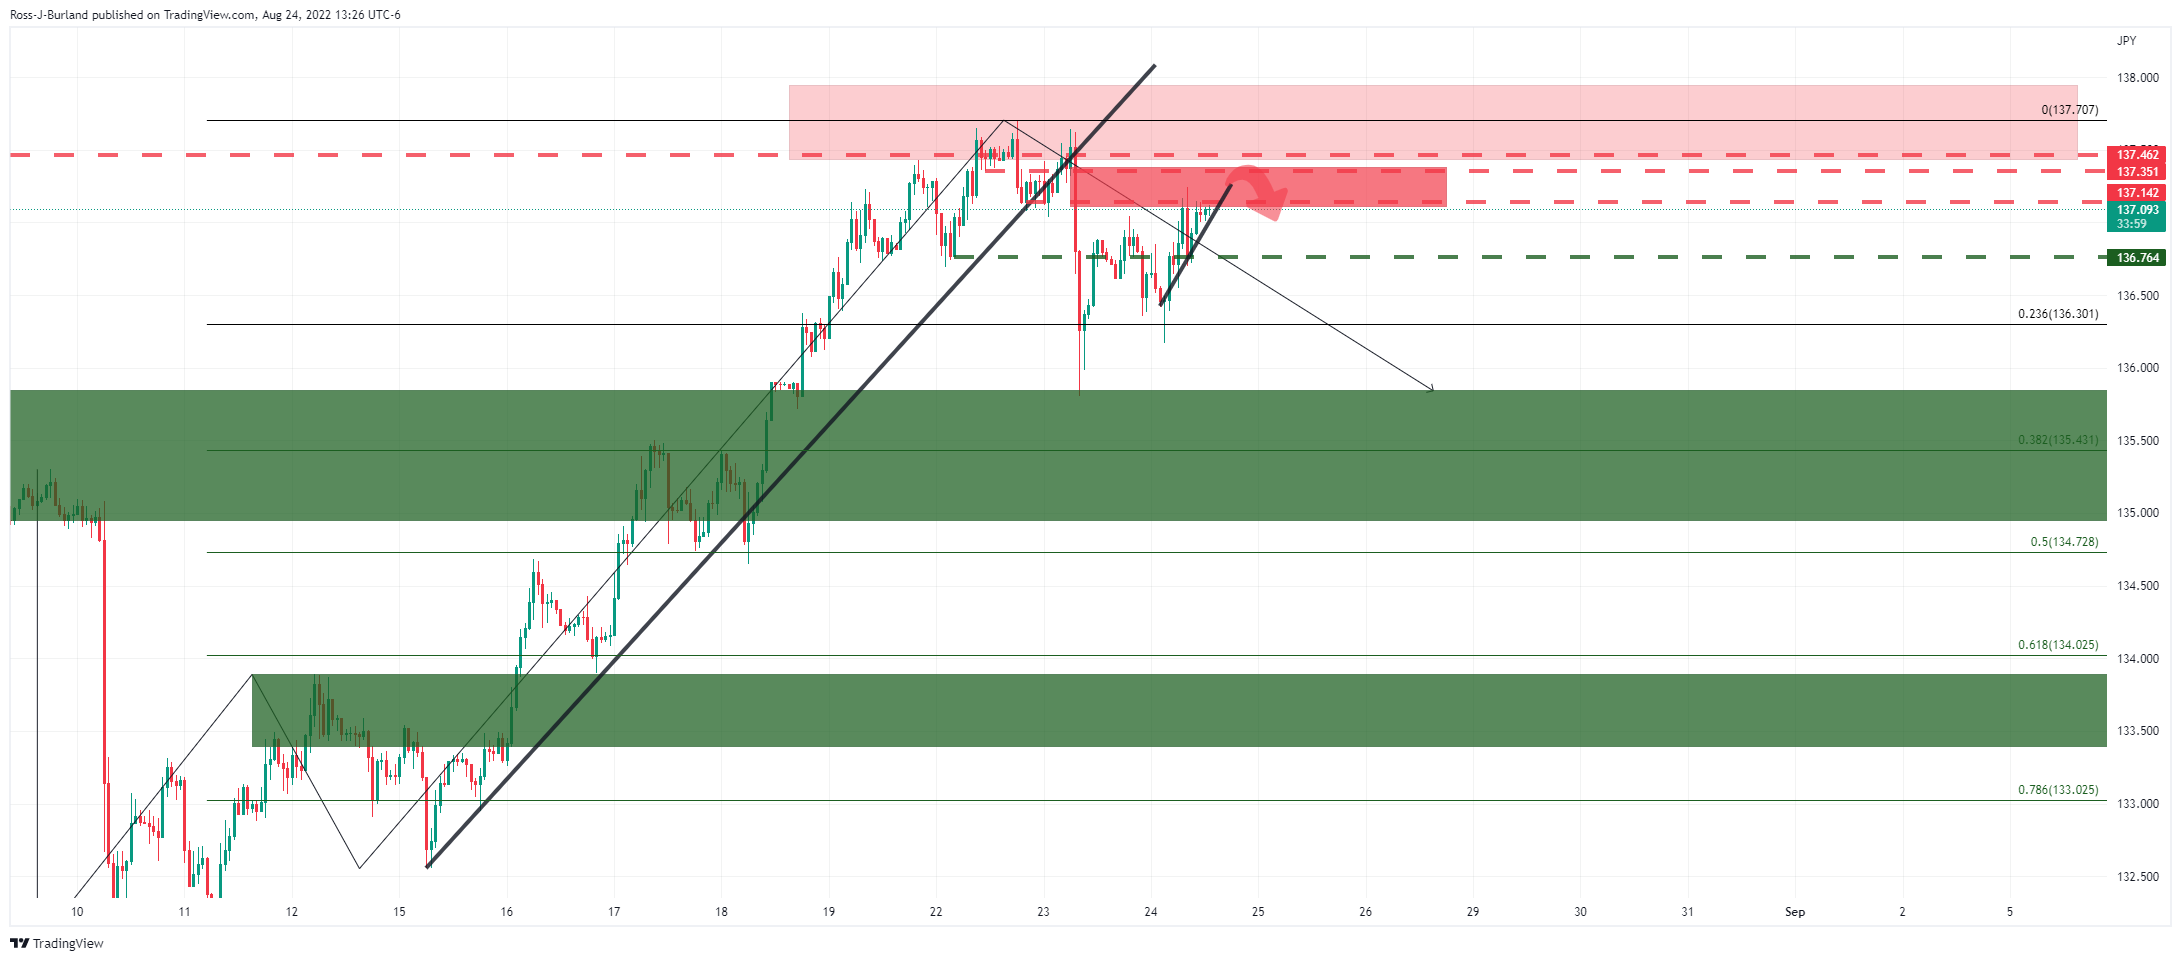
The price moved out of the trend and is now coming back into to restest the old supports, counter trendline and now resistance area. Zooming in further, we can see the price is attempting to move out of a sub trend:
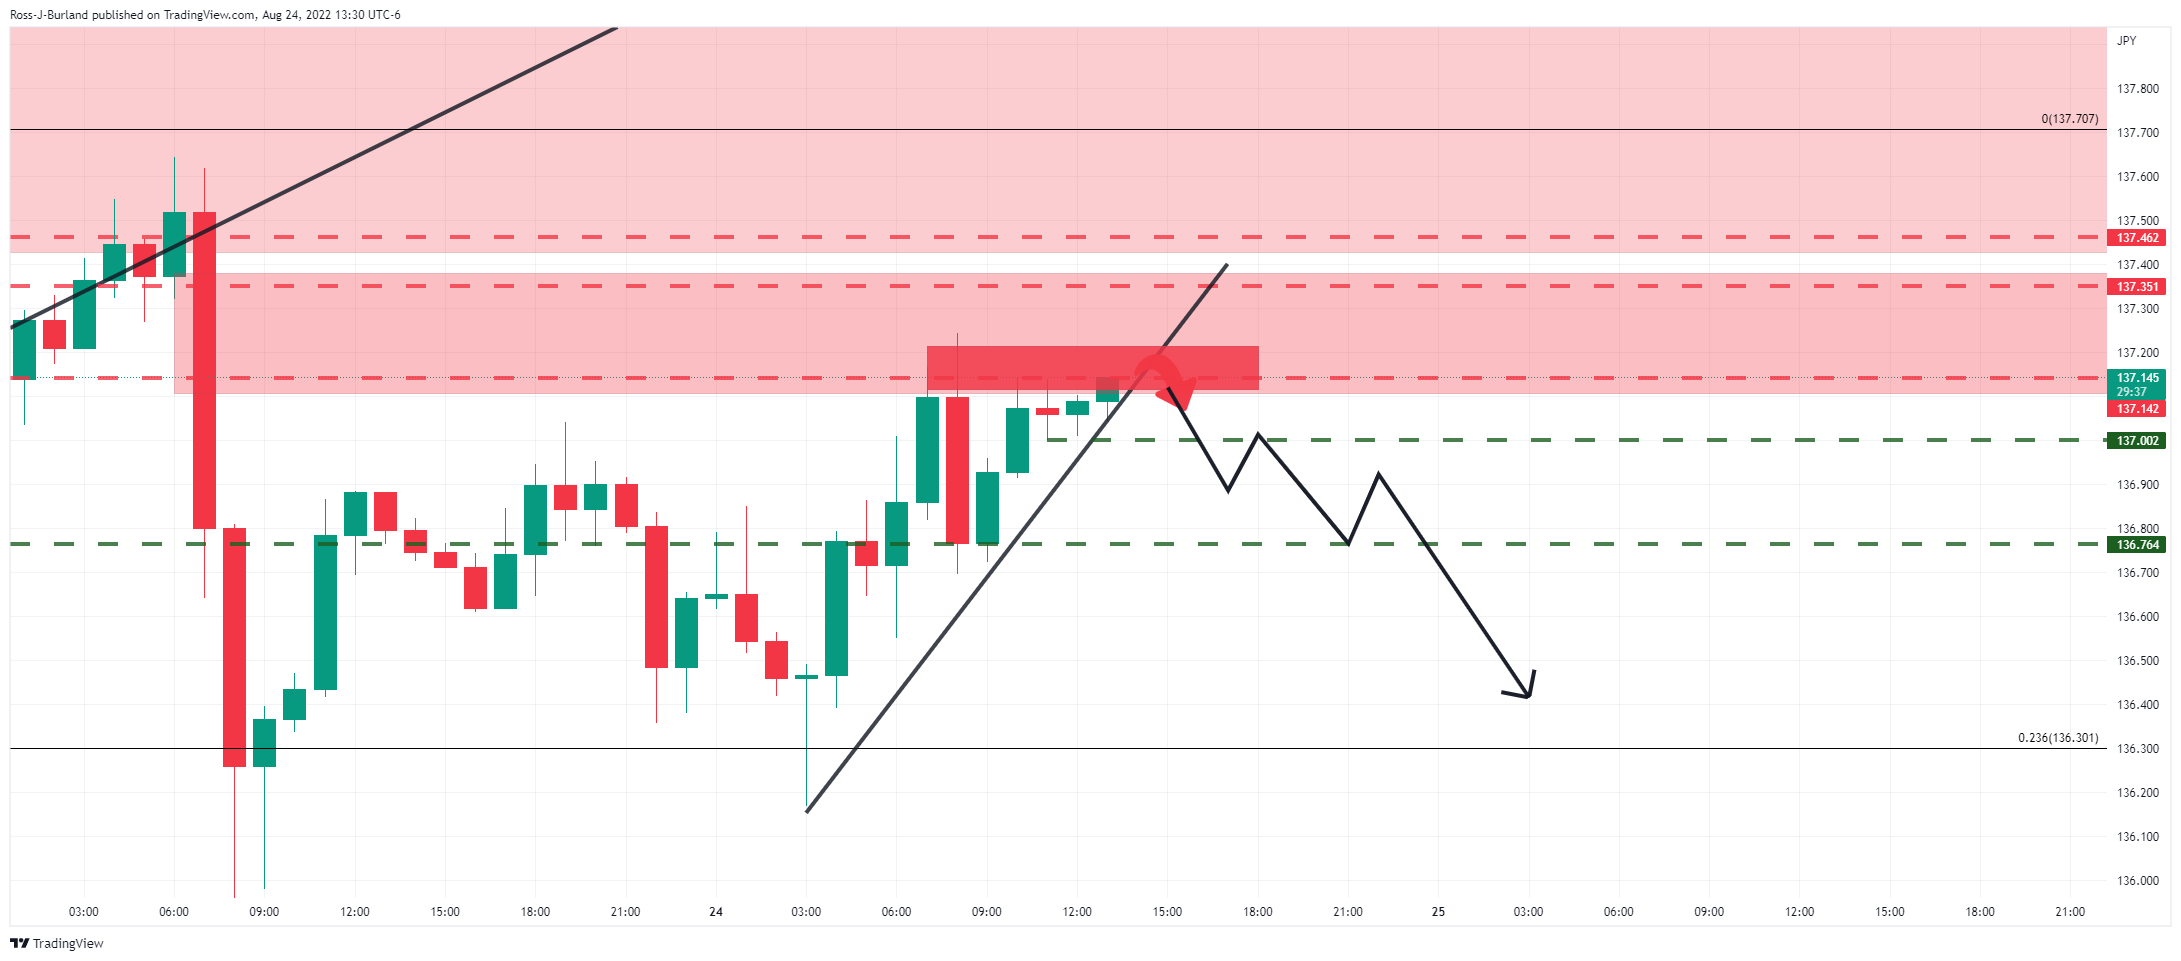
A break of the trendline support would expose 137 the figure. A break below there could open the way for a move below 136.80 and set off a waterfall sell-off for the days ahead, in accordance with the daily bearish scenario towards 135.50.
-
20:23
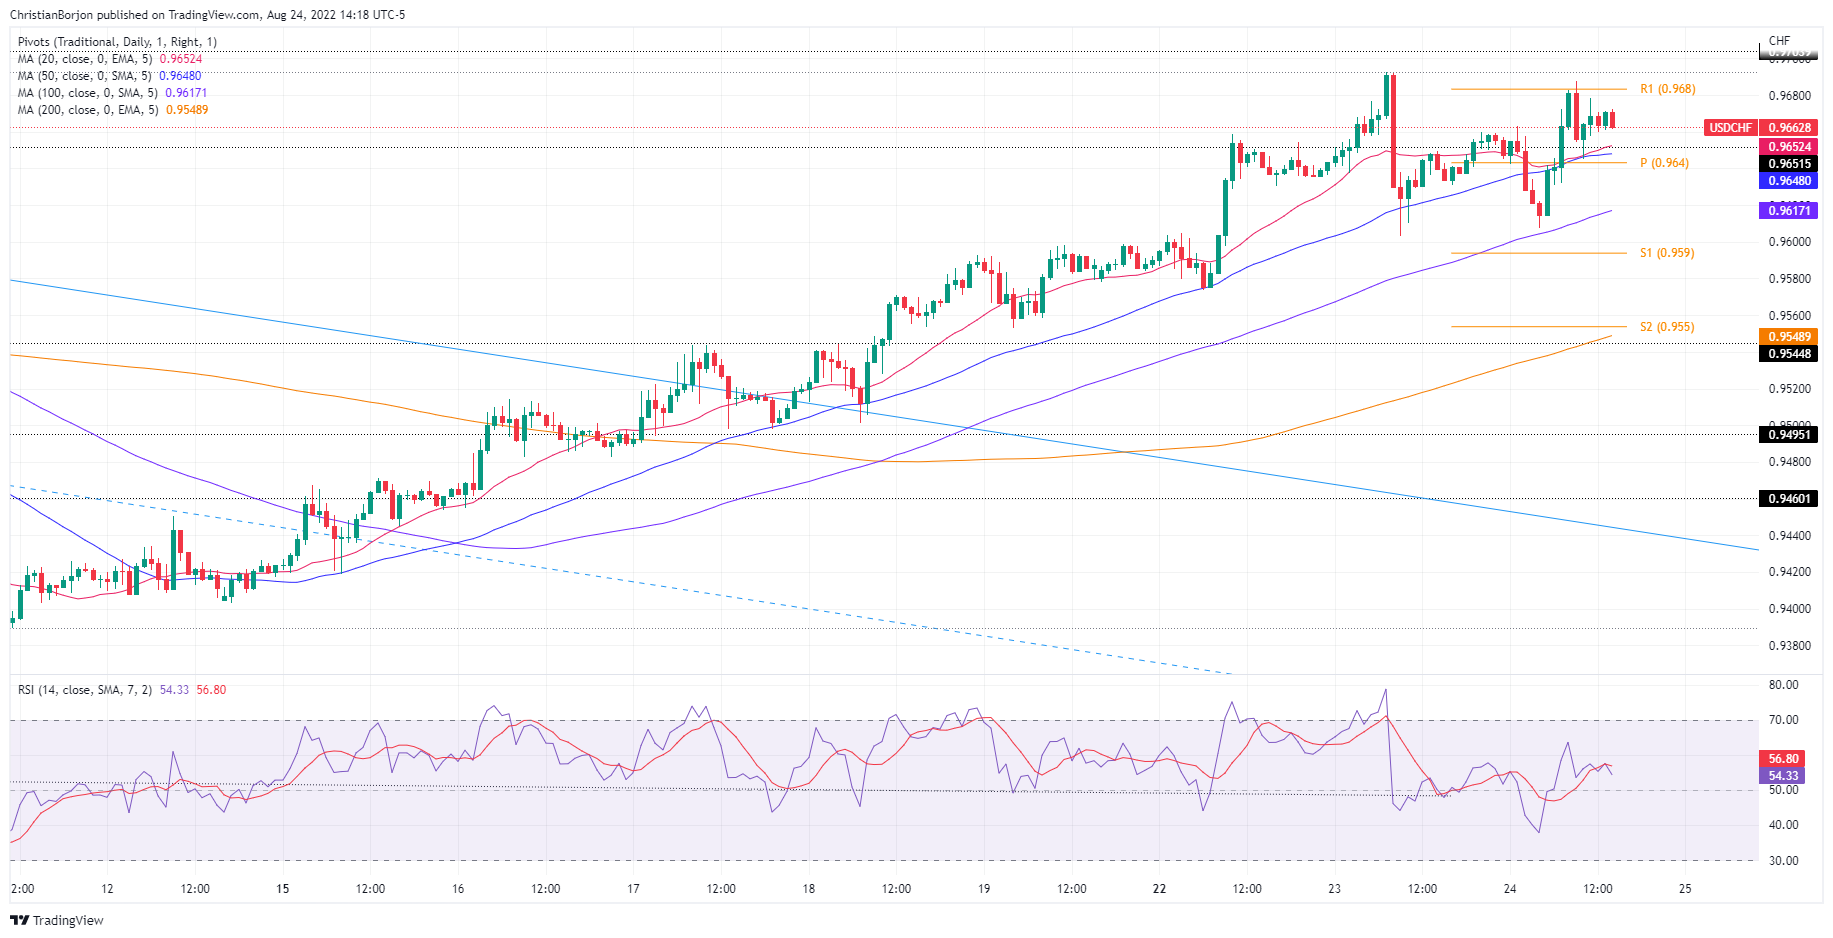
USD/CHF Price Analysis: Clears the 50/100-DMAs on its way to 0.9700
- USD/CHF holds to its gains above the 50 and 100-DMA.
- The USD/CHF daily chart illustrates the pair as neutral biased.
- In the 4-hour chart, unsuccessfully tests of the 20-EMA on the downside keep the USD/CHF tilted upwards.
USD/CHF advances during the North American session, up by 0.31%, bolstered by a strong US dollar, despite a release of mixed US economic data ahead of the so-awaited Jerome Powell speech at Jackson Hole. At the time of writing, the USD/CHF is trading at 0.9662, above its 50 and 100-day EMAs.
USD/CHF Price Analysis: Technical outlook
The daily chart illustrates price action in the last couple of days as range-bound, about to form a “bearish-harami” candle pattern, which would pose downward pressure on the major. Nevertheless, the Relative Strength Index (RSI) at 58.65 exerts upward pressure on the pair, meaning that the best way to trade the USD/CHF from a daily chart perspective is to expect a break of the previous high/low and wait for a re-test of the breakout.
The 4-hour chart paints a different picture. The USD/CHF has been advancing steadily since August 11, until Tuesday, when the USD/CHF printed a negative day. Nevertheless, it’s worth noting that the day’s low pierced the 20-EMA of the 4-hour chart, stalling the major’s dive before consolidating for a re-test. Today, the USD/CHF re-tested the previously-mentioned moving average, and for the second consecutive time, USD/CHF buyers lifted prices to current price levels.
However, with the Relative Strength Index (RSI) at 61.73, aiming downwards could keep the USD/CHF risks skewed to the downside. But if the USD/CHF breaks above the August 23 high at 0.9692, that will expose the 0.9700 figure, followed by the R2 daily pivot at 0.9730.
USD/CHF Key Technical Levels
-
19:28
Copper drops from two-month highs due to global economic slowdown, speculators’ shorts
- Copper prices are trading with losses of almost 1.50%.
- The Euro area energy crisis, China’s property and construction crisis, and a possible US recession are headwinds for copper.
- Copper Price Analysis: Could test the monthly lows around $3.4160 once it clears $3.5420.
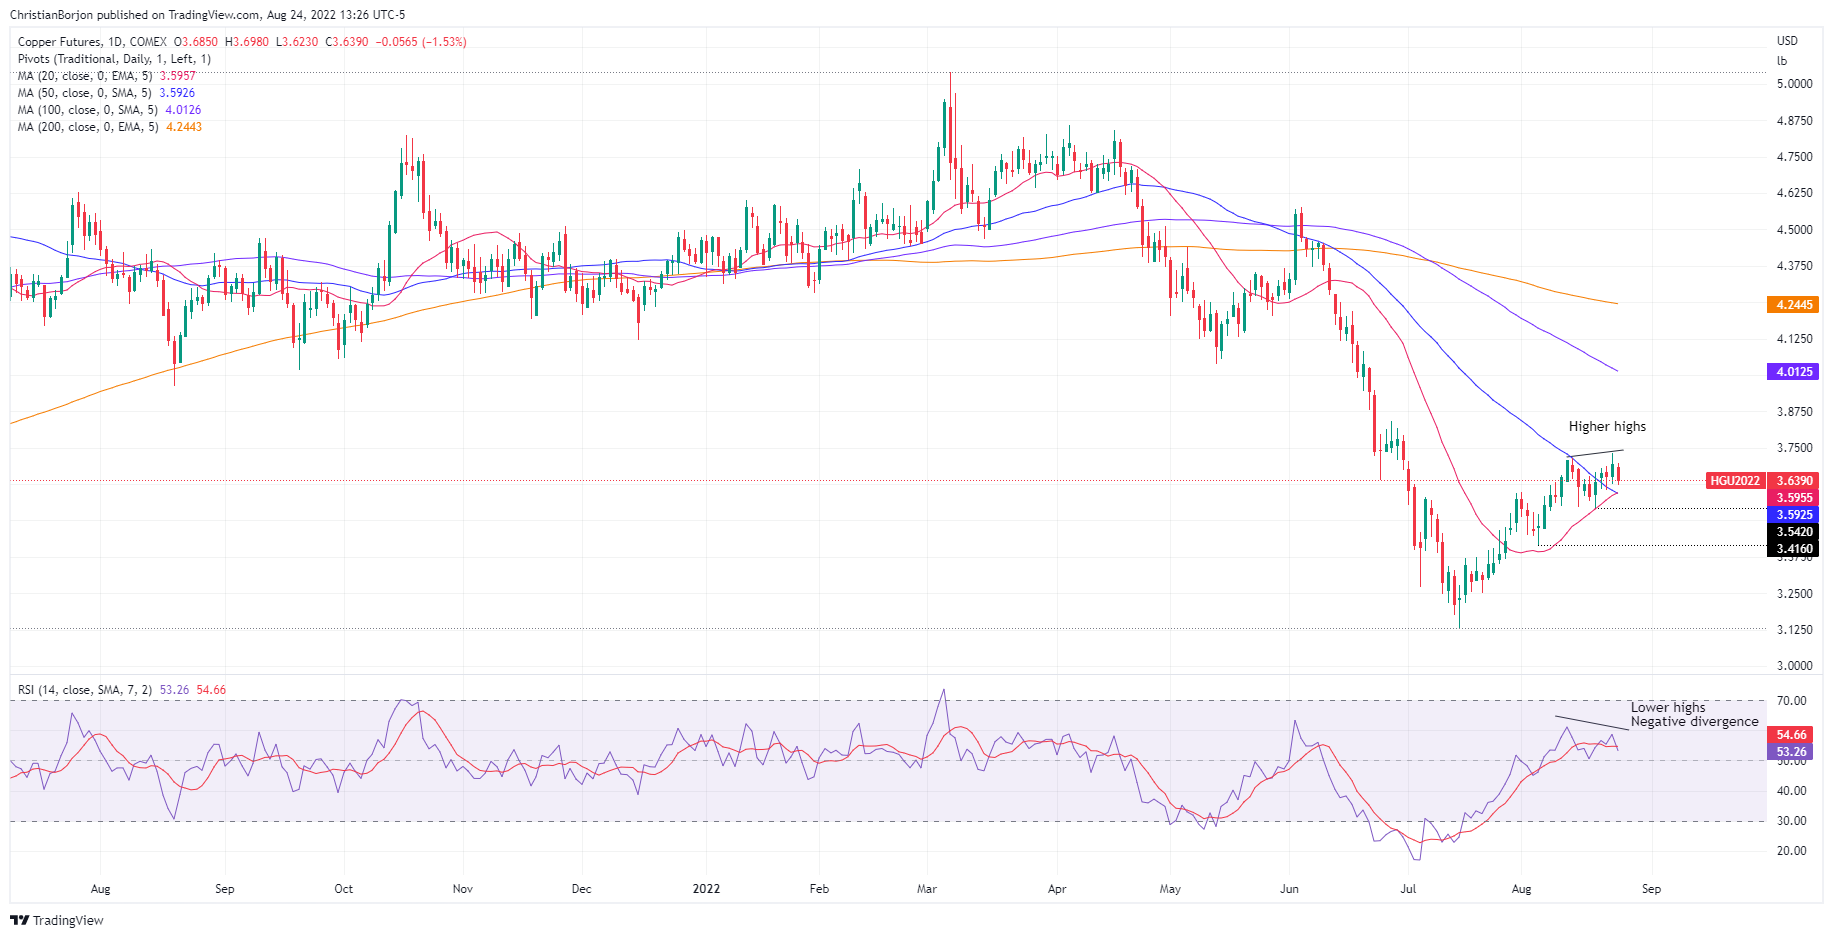
Copper futures are dropping for the first time in the week, down by 1.53% on Wednesday, courtesy of an ongoing global economic slowdown, portrayed in part by released S&P Global PMIs in the week, painting a gloomy picture while worries about China’s economy had increased. At the time of writing, Copper futures are trading at $3.6390 after hitting a daily high of $3.6980 during the Asian session.
US equities are trading in the green, portraying a positive mood. Meanwhile, the ongoing energy crisis in Europe, China’s property and construction market crisis, and recession fears in the US, are posing downward pressure on the red metal
In the meantime, the investment house Goehring & Rozencwajg Associates, in their Q2 update, pointed out that after bottoming at 165,000 tonnes at the end of 2021, inventories rebounded to 300,000 by mid-May but pulled back to 240,000 tonnes. They commented that inventories, when adjusted for days of consumption, are almost as low as in 2005, just before copper prices more than doubled. 2005, copper exchange inventories covered consumption by only two days.”
Aside from this, China’s appetite for the red metal, from which it accounts for 55% of the world’s copper consumption, its imports are up almost 6%. However, according to Shanghai Metals Market, stocks of copper in the country are at year lows.
All that said, Dr. Copper should be headed to the upside. Nevertheless, the Commitment of Traders report shows that speculators are net short 16,000 lots for the past six weeks, so a further downside is expected before recovering some ground.
Copper Price Analysis: Technical outlook
The Copper daily chart illustrates the non-yielding metal as neutral biased. The red metal remains seesawing for nine consecutive days in the $3.5420-$3.7315 area. However, it’s worth noting that the Relative Strength Index (RSI) recorded a successive series of lower highs, contrary to price action, meaning that prices are about to edge lower.
Hence, the first support would be the confluence of the 20 and 50-DMA around $3.5925-55. Once it’s broken, the next support will be the bottom of the range above-mentioned at $3.5420, followed by the August 3 low at $3.4160.
-
18:51
United States 5-Year Note Auction rose from previous 2.86% to 3.23%
-
18:16
Gold Price Forecast: XAU/USD bulls reach a critical milestone on daily chart ahead of Jackson Hole
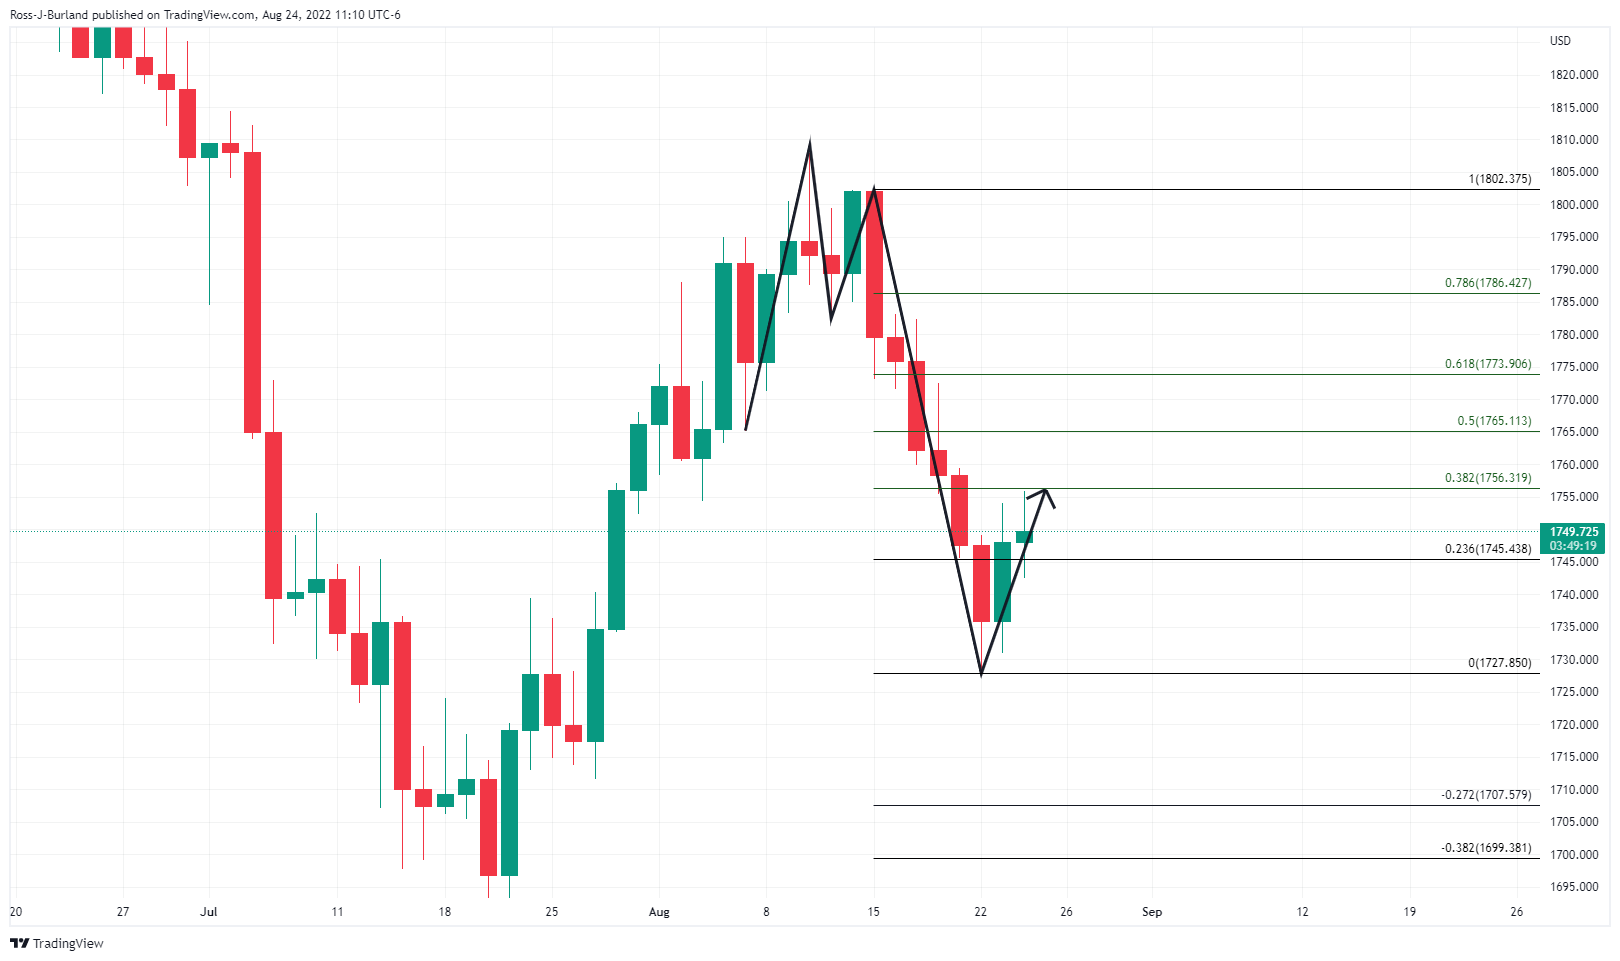
- Gold extended its bullish correction to the 38.2%$ ratio target and there is every chance of a deeper correction.
- As the clock ticks down to the Jackson Hole, fundamentals take precedent.
The gold price is back to flat on the day as the US dollar comes back up for air. At the time of writing, XAU/USD is trading at $1,749 after falling from a high of $1,755.94. The yellow metal has been as low as $1,742.51 on the day. The theme of the day centres around the Federal Reserve and US data, driving the direction of the US dollar and yields.
The US dollar gained against a basket of currencies on Wednesday, holding near a 20-year high as investors waited for a Friday speech by the Federal Reserve Chairman, Jerome Powell. Investors are looking for insight into how aggressive the central bank will be in its plight against inflationary headwinds. The greenback has been pushed and pulled in everchanging sentiment as to whether the Fed could will be in a position to curtail its rate hike path in the face of inflation that remains at 8.5% on an annual basis, far exceeding the Fed's 2% objective.
US data, in this regard, is what counts. The first round of data that moved the needle in financial markets came in yesterday's report that showed US private sector activity contracted for a second-straight month in August. The S&P Global flash composite purchasing managers index (PMI) for August dropped to 45 this month, the lowest since February 2021, as demand for services and manufacturing weakened in the face of inflation and tighter financial conditions. A reading below 50 indicates a contraction in activity.
However, the dollar regathered itself on the back of a jump in US yields following a bullish 2-year Treasury auction. The demand from domestic and international buyers was far below a 6-month average which led to a rally in the 2 and 10-year yields, supporting the US dollar and weighing on gold prices. The greenback recovered from a touch above 108 the figure as per the DXY index all the way to 109.11 highs over the course of Asia, Europe and early New York session.
Data on Wednesday also showed that new orders for US-made capital goods increased at a slower pace in July from the prior month, suggesting that business spending on equipment could struggle to rebound after contracting in the second quarter. However, the move in the greenback to the downside did not come until around the London fix. We saw a sharp sell-off which lifted the price of gold momentarily. However, US yields remained firm which ultimately lead to the price of the yellow metal's decline again and has enabled the greenback to recover some ground as we progress through the US session.
Due to the less inflationary data, Fed funds futures traders are pricing in a 59% chance that the Fed will hike rates by another 75 basis points at its September meeting, and a 41% probability of a 50 basis points increase.
Will the Jackson Hole be a big letdown?
For the rest of the week, Thursday's Gross Domestic Product, Initial Jobless Claims and Personal Consumption Expenditures will be key ahead of the speech by Fed chair Powell at 10.00 ET Friday. In the past, the Fed has used this symposium to announce or hint at policy shifts. However, analysts at Brown Brothers Harriman argued that they do not think the Fed will paint itself into a corner ahead of the September 20-21 FOMC meeting. ''Rather, we expect the Fed to try and manage market expectations by maintaining the hawkish message it has perfected since the July FOMC meeting.''
The analysts note that between now and the September FOMC, all the major August data and some of the early September surveys such as the preliminary S&P Global PMI readings and regional Fed surveys will be released. ''The Fed will also have a better idea of how the economy is doing in Q3''
Those gold bugs holding out for a bearish narrative for the US dollar and yields pertaining to recently less inflationary data could be left disappointed in the case that Powell doesn't push back on hawkish sentiment.
"The dollar's still well bid and I think that the market's concluding that these data are not going to change the Fed's position about what's going to happen next month," said Marc Chandler, chief market strategist at Bannockburn Global Forex in New York.
"While the market might be swinging back and forth between inflation and recession, the central banks aren't. They are focused, it seems to be nearly exclusively, on inflation," Chandler said.
Gold technical analysis
As per the prior analysis, it was stated that the price of gold had left behind an M-formation on the daily chart. This is a reversion pattern that put the spotlight on the support near a 38.2% Fibonacci around $1,755:
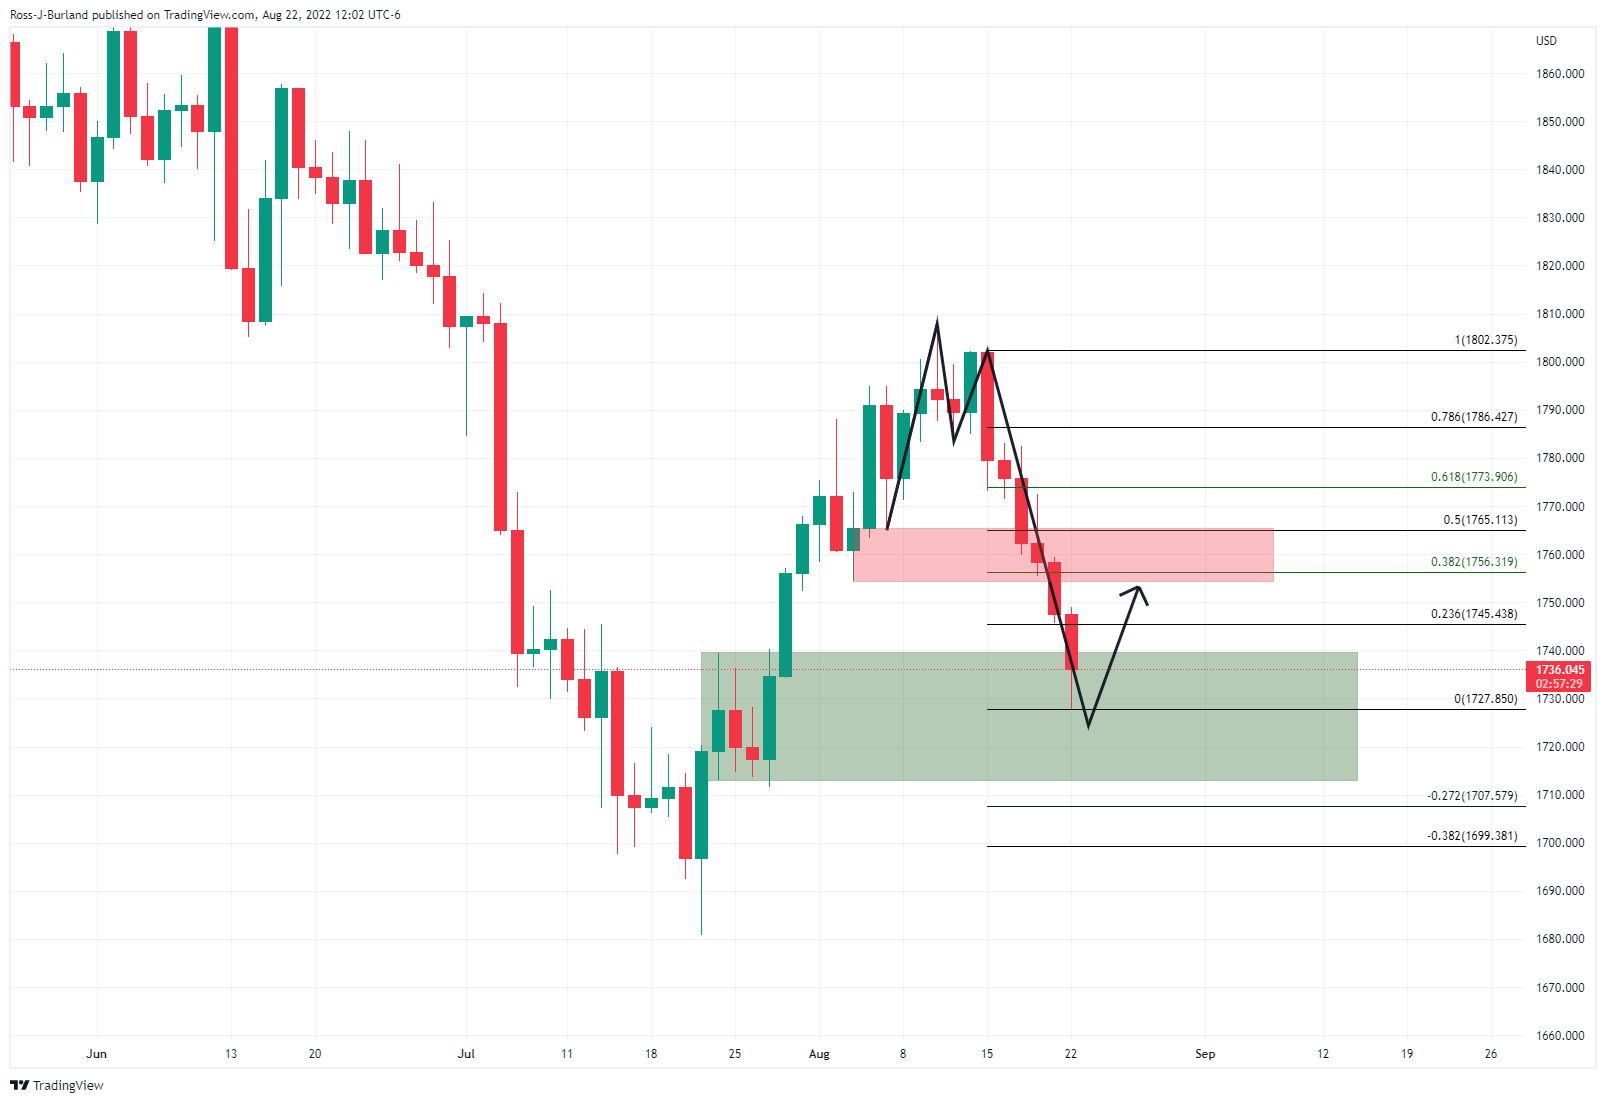
As illustrated, the prior analysis anticipated the correction, above, and the bulls committed to the moves this week so far as per the chart below:
At this juncture, there is every chance of a deeper correction although as the clock ticks down to the Jackson Hole, fundamentals take precedent.
-
18:04
AUD/USD drops below the 0.6900 figure as the USD strengthens
- AUD/USD trimmed Tuesday’s gains as USD bulls recovered some ground ahead of Jackson Hole.
- US Durable Good Orders beat estimates, contrarily to US housing data, flashing recession.
- AUD/USD Price Analysis: Range-bound, expecting the outcome of Fed’s Jerome Powell speech.
The AUD/USD remains on the defensive on Wednesday, trimming some of its Tuesday gains, but remains above the 0.6900 figure amidst an upbeat sentiment, putting a lid on the AUD/USD fall. Factors like mixed US economic data released and investors awaiting Jerome Powell’s speech at the Kansas City Fed symposium in Jackson Hole keep traders cautious.
The AUD/USD hit a daily low of around 0.6879, but the release of mixed US economic data weighed on the greenback, so the major, climbed back above the 0.6900 figure, though falling short of its opening price. At the time of writing, the AUD/USD trades at 0.6900, down by 0.37%.
US Durable Good Orders surprisingly rose in July, according to the US Commerce Department, with orders at 0% MoM, while excluding defense and aircraft, rose by 0.4%, higher than estimates at 0.3%.
In the meantime, US Pending Home Sales fell for the sixth consecutive month, collapsed -19.9% YoY, less than -22% drop, while on a month-over-month, dipped -1%, vs. -4% forecasts.
Meanwhile, the US Dollar Index, a gauge of the greenback’s value against a basket of peers, extended its gains by 0.26%, at 108.800, a headwind for AUD/USD prices. US Treasury bond yields are echoing the US dollar direction, led by the 10-year note rate at 3.113%, gaining six and a half bps.
Elsewhere, late on Tuesday, the Minnesota Fed President Neil Kashkari crossed wires. Kashkari said that inflation is very high, and it is the Fed’s job to curb it. He emphasized the need to tighten monetary policy and added that the Fed could only relax on rate increases when they see compelling evidence of inflation heading toward 2%.
An absent Australian economic docket left traders leaning towards US dollar dynamics. Australia’s PMI was soft in tone with worldwide S&P Global PMIs released during the week. But, it would not deter the Reserve Bank of Australia from hiking rates. Money market futures expect at least a 35 bps increase of the Reserve Bank of Australia at their next monetary policy meeting on September 6th.
AUD/USD Price Analysis: Technical outlook
The AUD/USD daily chart illustrates the major bottoming around the 0.6850-0.6930 area for the last four trading days, while the Relative Strength Index (RSI) crossed below the 50-midline. Nevertheless, the pair might be set for the Jackson Hole outcome. Even though the RSI crossed above its 7-day SMA, it shifted gears to the downside, meaning that AUD/USD sellers could be gathering momentum. Therefore, a break below the bottom of the range will expose the 0.6800 figure, followed y the YTD low at 66.81. On the flip side, an AUD/USD upside break will put in play the 20-day EMA at 0.6973, followed by the 0.7000 figure.
-
17:55
USD could peak during the fourth quarter – Wells Fargo
Analysts at Wells Fargo continue to see US Dollar strength through the end of 2022 as a result of the hawkish Federal Reserve. They point out the dollar could peak during the fourth quarter of 2022, starting a period of cyclical weakness against most currencies in 2023 as the U.S. economy enters recession and the Fed unwinds rate hikes.
Key Quotes:
“We expect the U.S. dollar to strengthen moderately through the end of 2022 as the Fed raises interest rates 75 bps in September and policymakers reinforce their hawkish stance at the Jackson Hole Annual Symposium. However, we believe peak inflation and peak interest rates could be approaching, and we believe the dollar will broadly weaken against most G10 and select emerging market currencies over the course of 2023.”
“We expect the U.S. dollar to trend lower over the course of the 2023. While we also forecast other major central banks to ease monetary policy next year, we believe the Fed will likely cut policy rates quicker than peers. With interest rate differentials swinging back in favor of foreign currencies next year, the greenback should enter a period of cyclical decline against most G10 currencies as well as certain emerging currencies.”
-
17:45
EUR/USD remains under pressure after short-lived rebound
- US Dollar loses momentum on risk appetite.
- Market participants turn attention to Jackson Hole.
- EUR/USD unable to recover 1.0000, holds near 20-year lows.
The EUR/USD rose from the daily low at 0.9907 to 0.9998 in a few minutes around the London fix, on the back of a broad-based slide of the US dollar. The euro failed to hold to gains and pulled back to the 0.9950 area.
The greenback weakened even as US yields held at daily highs. The improvement in risk sentiment weighed on the dollar. The Dow Jones is up by 0.37% and the Nasdaq gains 0.80%. The DXY printed a fresh daily low at 108.36 and, as of writing, it is hovering around 108.70, up 0.22% for the day.
Data released on Wednesday showed Durable Goods Orders showed a 0% increase in July against expectations of a 0.6% rise and Pending Home Sales declined 1%, less-than-expected. The numbers did not have a significant impact on market that are turning their attention to the Jackson Hole symposium.
Fed Chair Powell will deliver his speech on Friday. “While some may be looking for an explicit policy signal, we believe the Fed will leave all options open for the September 20-2 FOMC meeting. However, we expect Chair Powell and his colleagues to maintain a very hawkish tone at the symposium. We also give an overview of current U.S. economic conditions”, explained analysts at Brown Brothers Harriman.
The EUR/USD remains under pressure, unable to sustain a recovery. Another test of 0.9900 over the next sessions should not be ruled out. A break lower could trigger more losses with the next support seen around 0.9860. A firm break above 1.0000 could alleviate the bearish pressure, particularly if the euro manages to recover 1.0030.
Technical levels
-
17:00
Russia Industrial Output above forecasts (-2.4%) in July: Actual (-0.5%)
-
16:45
Iran's ForMin Spokesperson: Tehran has started assessing US response
A spokesperson for Iran's Foreign Ministry said on Wednesday that Iran has received the United States' response to the draft agreement proposed by the European Union and said they have started assessing it, as reported by Reuters.
Market reaction
With the initial market reaction to this headline, crude oil prices came under modest bearish pressure. As of writing, the barrel of West Texas Intermediate was trading at around $93, where it was down nearly 1% on a daily basis. Meanwhile, the barrel of Brent was down 0.9% at $99.20.
-
16:34
NZD/USD rebounds toward 0.6200 as USD loses momentum
- Dollar drops into the London fix, even as US yields remain at weekly highs.
- DXY reverses turns negative, erasing a 0.60% daily gain.
- NZD/USD: key support above 0.6150 remains in place.
The NZD/USD again rebounded from near 0.6150 and climbed to 0.6200, trimming daily losses. A decline of the US dollar across the board boosted the pair.
The greenback weakened around the London fix, even as US yields printed fresh daily highs. In Wall Street, stocks turned decisively positive and commodities erased losses. The DXY dropped from above 109.00 to 108.40.
Economic data from the US showed on Wednesday a mixed Durable Goods Order report with the headline missing expectations but with positive detail. A different report revealed Existing Home Sales dropped 1% in July to the lowest in two years. On Thursday, a new estimate of Q2 GDP, the weekly Jobless Claims and the Kansas Fed Manufacturing index are due.
During the Asian session Retail Sales data is due in New Zealand. Later on Thursday, the market focus will turn to the Jackson Hole symposium. Jerome Powell will speak on Friday.
Crucial support at 0.6150
The bias in NZD/USD continues to favor the downside. The crucial support is around 0.6150, which capped the upside during the last four trading days. A break lower would clear the way to more losses targeting 0.6125 initially and then 0.6095.
On the upside, the immediate resistance may be seen at 0.6205, followed by 0.6240.
Technical levels
-
16:34
GBP/USD dwindles and falls toward 1.1800 on mixed US data, and Jackson Hole looming
- GBP/USD records marginal losses of 0.23% on Wednesday, trimming some of Tuesday’s gains.
- Market participants are “laser-focused” on Friday’s US Fed Jerome Powell speech.
- US Pending Home Sales shows the housing market deteriorating, while Durable Good Orders stood still.
The British pound erases Tuesday’s gains and drops, towards the 1.1800 figure, amidst a slightly upbeat mood, with traders being cautious ahead of the Jackson Hole Symposium, with market players’ eyes “laser-focused” on Fed chief Jerome Powell’s speech. At the time of writing, the GBP/USD is trading at 1.1803.
On Wednesday, the GBP/USD opened nearby daily highs around 1.1830 but dropped to the lows of the day at 1.1755, an hour before Wall Street opened, with US economic data hitting newswires. The lack of the UK’s economic releases will keep GBP/USD traders adrift to US dollar dynamics.
In the meantime, the US Dollar Index resumed its upward trajectory, though marginally up by 0.03%, at 108.523, while US T-bond yields rose. US economic data revealed during the last couple of weeks has been mixed, though in tone with an ongoing deceleration of the US economy.
Before Wall Street opened, US Pending Home Sales dropped to their lowest levels since the Covid-19 pandemic began. On its annual reading, collapsed -19.9%, less than -22% drop, while on a month-over-month, fell -1%, vs. -4% forecasts.
Earlier, Durable Good Orders for July remained unchanged at 0% MoM, missing estimations, but June’s reading was upward revised to 2.2%, showing consumer resilience. Orders excluding Defense and Transportation rose by 0.4%, higher than estimates of 0.3%.
Even though US data was dollar positive, the GBP/USD recovered some ground, lifting towards the 1.1817 area, current price levels, given that around 14:00 GMT, the British pound was trading sub 1.1800.
Elsewhere, late on Tuesday, the Minnesota Fed President Neil Kashkari crossed wires. Kashkari said that inflation is very high, and is the Fed’s job to curb it. He emphasized the need to tighten monetary policy and added that they (the Fed) could only relax on rate increases when they see compelling evidence of inflation heading toward 2%.
On the UK side, given that the country is reaching record energy prices and double-digit inflation levels, it would likely keep the Sterling downward pressured. Additionally, with elections coming on September 5, uncertainty about a new Prime Minister keeps market participants uneasy. Therefore, further British pound weakness is expected, despite further rate hikes by the Bank of England.
In the meantime, JP Morgan Analysts foresee the pound would hit 1.14 “if gas prices continue to do what they are doing,” as said Sam Zief, head of global FX strategy at JP Morgan.
What to watch
The UK economic docket will feature the CBI Distributive Trades on Thursday. In the US, the calendar will reveal the GDP growth rate for the second quarter, Initial Jobless Claims, and the Kansas City Fed Manufacturing Index for August.
GBP/USD Price Analysis: Technical outlook
The GBP/USD trades below the midline of a descending channel drawn from late May, while the 20-DMA crossed under the 50-DMA, signaling that sellers are gathering momentum. Worth noting that if the GBP/USD records a daily close below the July 14 cycle low at 1.1759, it could open the door for a YTD low test at 1.1716. Otherwise, it would open the door for a consolidation in the 1.17601.1878 area, ahead of the Bank of England’s next monetary policy decision.
-
15:30
United States EIA Crude Oil Stocks Change registered at -3.282M, below expectations (-0.933M) in August 19
-
15:04
US: Pending Home Sales decline by 1% in July vs. -4% expected
- Pending Home Sales in the US continued to fall in July.
- US Dollar Index clings to strong daily gains near 109.00.
Pending Home Sales in the US declined by 1% on a monthly basis in July, the data published by the National Association of Realtors showed on Wednesday. This reading followed June's decrease of 8.9% and came in better than the market expectation for a contraction of 4%.
On a yearly basis, Pending Home Sales decreased by 19.9% in July.
Market reaction
The US Dollar Index edged slightly higher with the immediate reaction to this report and was last seen rising 0.5% on a daily basis at 109.05.
-
15:02
Gold Price Forecast: XAU/USD slips as USD inches back closer to a two-decade high
- Gold meets with a fresh supply on Wednesday and erodes a part of the overnight gains.
- Resurgent USD demand, rising US bond yield exert some downward pressure on the metal.
- Recession fears could help limit losses for the XAU/USD ahead of Fed’s Powell on Friday.
Gold turns south following an early uptick to the $1,754 area and drops to a fresh daily low during the early North American session. The XAU/USD reverses a part of the previous day's goodish recovery move to the weekly high and is currently placed around the $1,745 level, down nearly 0.25% for the day.
The downtick is sponsored by the emergence of fresh buying around the US dollar, which tends to dent demand for dollar-denominated gold. The overnight hawkish remarks by Minneapolis Fed President Neel Kashkari revive bets for a further policy tightening by the US central bank. Adding to this, Wednesday's release of mostly upbeat US Durable Goods Orders data reaffirms hawkish Fed expectations and further underpins the greenback.
The current market pricing indicates an equal possibility of a 50 bps rate hike or a supersized 75 bps move at the September FOMC policy meeting. This, in turn, trigger a fresh leg up in the US Treasury bonds and further contributes to driving flow away from the non-yielding yellow metal. In fact, the yield on the benchmark 10-year US government bond climbs to a nearly two-month high and offers additional support to the buck.
Apart from this, signs of stability in the financial markets further seem to weigh on the safe-haven XAU/USD, though recession fears could help limit deeper losses, at least for now. Investors also seem reluctant and might prefer to wait for a more hawkish message from Fed Chair Jerome Powell at the Jackson Hole symposium on Friday. This, in turn, warrants some caution for aggressive bearish traders and positioning for any further decline.
Technical levels to watch
-
15:00
United States Pending Home Sales (YoY) increased to -19.9% in July from previous -20%
-
15:00
United States Pending Home Sales (MoM) above forecasts (-4%) in July: Actual (-1%)
-
14:38
EUR/USD loses the grip and approaches 0.9900, focus on Jackson Hole
- EUR/USD remains on the defensive and closer to 0.9900.
- The dollar climbs to daily highs following yields and data.
- The Jackson Hole Symposium kicks in on Thursday.
Further selling pressure forces EUR/USD to trade at shouting distance from the 0.9900 zone on Wednesday.
EUR/USD now looks to the 2022 low
EUR/USD sees its daily decline gather extra pace and approach the area of recent lows near 0.9900 and a tad below, always on the back of the relentless move higher in the US dollar.
The persistent advance in the buck, in the meantime, found extra fuel in the equally strong march north in US yields, where the belly and the long end of the curve navigate levels last seen in late June around 3.10% and 3.30%, respectively.
In the docket, US Durable Goods Orders came flat on a monthly basis in July, while orders excluding the Transport sector surprised to the upside and expanded 0.3% inter-month.
Also collaborating with the upside in US yields and the dollar appear consensus’ expectations of a hawkish message from Chair Powell at his speech at the Jackson Hole Symposium on Friday.
What to look for around EUR
EUR/USD returns to the 0.9900 region as the greenback rapidly left behind Tuesday’s hiccup.
Price action around the European currency, in the meantime, is expected to closely follow dollar dynamics, geopolitical concerns, fragmentation worries and the Fed-ECB divergence.
On the negatives for the single currency emerge the so far increasing speculation of a potential recession in the region, which looks propped up by dwindling sentiment gauges and the incipient slowdown in some fundamentals.
Key events in the euro area this week: Germany Final Q2 GDP Growth Rate, Germany IFO Business Climate, ECB Accounts (Thursday) – Germany GfK Consumer Confidence.
Eminent issues on the back boiler: Continuation of the ECB hiking cycle. Italian elections in late September. Fragmentation risks amidst the ECB’s normalization of its monetary conditions. Impact of the war in Ukraine on the region’s growth prospects and inflation.
EUR/USD levels to watch
So far, spot is losing 0.48% at 0.9920 and a break below 0.9899 (2022 low August 23) would target 0.9859 (December 2002 low) en route to 0.9685 (October 2022 low). On the other hand, the next up barrier comes at 1.0202 (high August 17) followed by 1.0267 (55-day SMA) and finally 1.0368 (monthly high August 10).
-
14:29
USD/JPY retakes 137.00 mark amid modest USD strength, rising US bond yields
- USD/JPY steadily climbs back above the 137.00 mark during the early North American session.
- Renewed USD buying, a fresh leg up in the US bond yields remain supportive of the move up.
- Recession fears could offer support to the safe-haven JPY and keep a lid on any further gains.
The USD/JPY pair attracts some dip-buying near the 136.20-136.15 region on Wednesday and climbs to a fresh daily high during the early North American session. Spot prices, however, seem to struggle to capitalize on the move beyond the 137.00 round-figure mark.
The US dollar regains positive traction and moves back closer to a two-decade high touched the previous day. This turns out to be a key factor lending some support to the USD/JPY pair. The USD drew support from the overnight hawkish remarks by Minneapolis Fed President Neel Kashkari, which revived bets a further policy tightening by the US central bank.
The USD bulls further took cues from mostly upbeat US Durable Goods Orders. In fact, the US Census Bureau reported that headline orders remain flat MoM in July against the 0.6% rise anticipated. The disappointment, however, was offset by an upward revision of the previous month's reading and a slightly better-than-expected growth in orders excluding transportation items.
Nevertheless, the data reaffirms expectations that the Fed would raise interest rates further and the current market pricing points to equal chances of a 50 bps or a 75 bps hike in September. This marks a big divergence in comparison to a more dovish monetary policy stance adopted by the Bank of Japan, which continues to exert some pressure on the Japanese yen.
Meanwhile, hawkish Fed expectations lift the US Treasury bond yields to a nearly two-month high, widening the US-Japan rate differential and further weighing on the JPY. That said, the prevalent cautious market mood, amid growing worries about a global economic downturn, offers some support to the safe-haven JPY and could cap the upside for the USD/JPY pair.
The fundamental backdrop, however, remains tilted firmly in favour of bullish traders and supports prospects for a further near-term appreciating move. That said, market participants might refrain from placing aggressive bets and prefer to wait for a more hawkish message from Fed Chair Jerome Powell at the Jackson Hole symposium on Friday.
Technical levels to watch
-
14:19
AUD/USD to clamber back to 0.71 on a six-month view – Rabobank
AUD/USD has failed to sustain above 0.69. But economists at Rabobank expect the pair to move back higher towards 0.71 over the coming months.
Aussie to catch its breath
“Going forward Australian growth is set to slow. The central bank forecasts growth at 3.25% over 2022, underpinned by growth in consumption and a recovery in investment and service exports. Growth is then expected to slow to around 1.75% over both 2023 and 2024. This outlook compares favourably with the Eurozone, UK and the US all of which are at risk of recession next year.
“We had anticipated a pullback to AUD/USD 0.69 on the back of dollar strength. We continue to see scope for AUD/USD to clamber back to 0.71 on a six-month view.”
-
14:12
EUR/USD: Strong bearish momentum at present – Scotiabank
EUR/USD drifts lower as bearish perspectives prevail. Economists at Scotiabank expect the pair to remain under pressure.
Resistance aligns at 0.9970
“The only remarkable thing from my point of view is the prevalence of EUR bearishness across the screens and market commentary.”
“The broader bear trend remains intact and enjoys the backing of strong, bearish momentum at present.”
“Resistance is 0.9970 and 1.0000/10.”
-
14:11
USD/TRY pushes higher and prints new 2022 highs above 18.1500
- USD/TRY advances to fresh YTD highs beyond 18.1500.
- Further upside could challenge the all-time peak around 18.25.
- The sentiment around the Turkish lira continues to deteriorate.
Further weakness in the Turkish lira motivates USD/TRY to clinch new 2022 peaks past 18.1500 on Wednesday.
USD/TRY now targets the all-time high near 18.25
USD/TRY keeps the upside bias unabated for the sixth consecutive session so far on Wednesday, always on the back of the relentless rally in the US dollar and the persistent offered tone in the lira.
In fact, while expectations of extra Fed’s tightening continue to fortify the buying interest in the dollar, the Turkish currency keeps suffering the unexpected reduction of the policy rate by the Turkish central bank (CBRT) last week against the backdrop of the utter absence of measures to tackle the rampant inflation in the country.
It is worth remembering that inflation in Türkiye ran at the fastest pace since 1998 at nearly 80% YoY in July.
What to look for around TRY
The upside bias in USD/TRY remains unchanged and now targets the all-time high around 18.25 following the unexpected interest rate cut by the CBRT on August 18.
In the meantime, the lira’s price action is expected to keep gyrating around the performance of energy and commodity prices - which are directly correlated to developments from the war in Ukraine - the broad risk appetite trends and the Fed’s rate path in the next months.
Extra risks facing the Turkish currency also come from the domestic backyard, as inflation gives no signs of abating (despite rising less than forecast in July), real interest rates remain entrenched in negative figures and the political pressure to keep the CBRT biased towards low interest rates remains omnipresent. In addition, there seems to be no Plan B to attract foreign currency in a context where the country’s FX reserves dwindle by the day.
Key events in Türkiye this week: Capacity Utilization, Manufacturing Confidence (Thursday).
Eminent issues on the back boiler: FX intervention by the CBRT. Progress (or lack of it) of the government’s new scheme oriented to support the lira via protected time deposits. Constant government pressure on the CBRT vs. bank’s credibility/independence. Bouts of geopolitical concerns. Structural reforms. Presidential/Parliamentary elections in June 23.
USD/TRY key levels
So far, the pair is gaining 0.32% at 18.1557 and faces the immediate target at 18.1582 (2022 high August 24) seconded by 18.2582 (all-time high December 20) and then 19.00 (round level). On the other hand, a breach of 17.7586 (monthly low August 9) would pave the way for 17.4896 (55-day SMA) and finally 17.1903 (weekly low July 15).
-
13:44
USD/CAD refreshes daily high, climbs above 1.3000 post-US Durable Goods Orders
- USD/CAD regains positive traction on Wednesday and reverses a part of the overnight slide.
- Rising bets for aggressive Fed rate hikes help revive the USD demand and extend support.
- Mostly upbeat US Durable Goods Orders remain supportive of the intraday USD strength.
- An uptick in oil prices could underpin the loonie and keep a lid on any meaningful upside.
The USD/CAD pair maintains its bid tone through the early North American session and climbs to a fresh daily high in the last hour, with bulls looking to build on the momentum beyond the 1.3000 psychological mark.
The US dollar makes a solid comeback on Wednesday and inches back closer to a two-decade high touched the previous day, which, in turn, extends support to the USD/CAD pair. Tuesday's disappointing US PMI prints and weak US home sales data had fueled speculations that the Fed may be less aggressive in its rate hiking cycle. That said, hawkish remarks by Minneapolis Fed President Neel Kashkari - the biggest dove - revive expectations for a supersized rate hike in September and push the USD higher.
The intraday USD buying remains well supported by mostly upbeat US Durable Goods Orders data. The US Census Bureau reported that headline orders remain flat MoM in July, missing expectations for a 0.6% rise. The disappointment, however, was offset by an upward revision of the previous month's reading, showing a growth of 2.2%. Adding to this, orders excluding transportation items recorded a slightly better-than-expected growth of 0.3% during the reported month, reaffirming hawkish Fed expectations.
In fact, the current market pricing indicates greater chances of a 75 bps Fed rate hike move at the September policy meeting. This remains supportive of elevated US Treasury bond yields and continues to lend support to the greenback. That said, a modest uptick in crude oil prices to a three-week high seems to underpin the commodity-linked loonie and might keep a lid on any further gains for the USD/CAD pair. Nevertheless, spot prices have managed to reverse a part of the overnight corrective decline from a six-week high.
Technical levels to watch
-
13:36
US: Durable Goods Orders virtually unchanged at $273.5 billion in July
- US Durable Goods Orders stayed unchanged on a monthly basis in July.
- US Dollar Index stays in positive territory below 109.00.
New orders for manufactured durable goods orders in the US stayed virtually unchanged at $273.5 billion in July, the US Census Bureau reported on Wednesday. This reading followed June's 2.2% expansion and came in worse than the market expectation for an increase of 0.6%.
"Excluding transportation, new orders increased 0.3%," the publication further read. "Excluding defense, new orders increased 1.2%. Transportation equipment, down following three consecutive monthly increases, drove the decrease, $0.6 billion or 0.7% to $93.0 billion."
Market reaction
These figures had little to no impact on the dollar's valuation. As of writing, the US Dollar Index was up 0.3% on the day at 108.84.
-
13:30
United States Durable Goods Orders ex Transportation above forecasts (0.2%) in July: Actual (0.3%)
-
13:30
United States Durable Goods Orders below forecasts (0.6%) in July: Actual (0%)
-
13:30
United States Durable Goods Orders ex Defense came in at 1.2%, above forecasts (0%) in July
-
13:19
EUR/PLN to hit 4.85 by year-end, then fall back to 4.60 by end-2023 – TDS
EUR/PLN is hovering around 4.7770. Economists at TD Secutities expect the pair to reach 4.85 by year-end. Nonetheless, EUR/PLN is set to move back lower next year.
Positive view on the zloty over the long-term
“We expect gradual zloty weakness ahead with EUR/PLN reaching 4.85 by end of December. However, over the long-term, we continue to hold a positive view on the zloty and think that EUR/PLN will fall back to 4.60 by the end of 2023.”
“Overall, the National Bank of Poland (NBP) has been much more decisive in tightening than the ECB and we think that Poland can reap the benefits of that further down the line.”
-
13:14
BoE: More front-loaded hikes and sooner cuts is the strategy – TDS
The Bank of England (BoE) remains torn between a weak growth outlook and near-record inflation. Economists at TD Securities revise their Bank Rate profile, and now expect sharp hikes in the near-term, followed by cuts once the wage-price link has been broken.
A more hawkish BoE, for now
“We now expect the MPC to deliver sequential 50 bps hikes at its September and November meetings, before slowing to a 25 bps hike in December.”
“We expect policy to remain on hold from the start of 2023, with 25 bps cuts coming from August to December that year, and a final 25 bps cut in 2024 to take Bank Rate to its neutral 1.75% rate.”
“Our new profile sees Bank Rate reach a peak of 3.00% from December this year, still well below the market's expectation of a 4.00% terminal rate.”
-
13:08
USD/KRW: Won to appreciate when the trade deficit narrows – Standard Chartered
The South Korean won has depreciated along with widening trade deficit. The strong correlation between the trade balance and the KRW implies that the won will likely appreciate when the trade deficit narrows, economists at Standard Chartered report.
Widening trade deficit weighs on the KRW
“Counter-intuitively, we have found that the trade balance has a much higher correlation with the KRW than the C/A balance. This strong correlation may partly explain recent KRW weakness and implies that the KRW is likely to appreciate when the trade deficit narrows.”
“We do not expect the trade account to turn supportive of the KRW in the near-term. Slowing global growth and external demand will likely keep the trade account under pressure, outweighing any benefits from a pullback in commodity prices.”
“We highlight a notable improvement in Korea’s capital account. Korean retail purchases of foreign equities have slowed and foreign flows to Korean equities have recovered – this is improving net equity flows following a sharp deterioration in the past two years.”
“We believe the improving capital account may allow the KRW to start outperforming peers, even as broad USD strength and weak risk sentiment likely keep USD/KRW supported in the short-term.”
See – BoK Preview: Forecasts from seven major banks, monetary tightening set to continue
-
13:01
USD/JPY set to test the July 14 high near 139.40 – BBH
USD/JPY traded as high as 137.70 on Tuesday but has since fallen back to around 136.60. Economists at BBH expect the pair to tackle the July 14 high near 139.40.
Japan eases COVID-19 entry requirements
“The USD/JPY pair remains on track to test the July 14 high near 139.40.”
“Japan will end its requirement for boosted inbound travelers to show a negative covid test result to enter the country. This will go into effect on September 7. With the economy showing signs of slowing, it’s clear that policymakers are looking to boost tourism in the coming months. Of note, the weak yen should help promote foreign visitors.”
-
13:00
Brazil Mid-month Inflation registered at -0.73% above expectations (-0.81%) in August
-
12:57
EUR/USD remains on track to test the September 2002 low near 0.9615 – BBH
EUR/USD remains heavy after Tuesday’s bounce really could not crack 1.00 and is currently trading near 0.9930. Economists at BBH expect the pair to challenge the September 2002 low near 0.9615.
ECB officials are acknowledging the risks of recession
“We believe EUR/USD remains on track to test the September 2002 low near 0.9615.”
“European Central Bank (ECB) executive board member Fabio Panetta stressed that monetary policy ‘needs to be strictly data dependent, taking fully into consideration the condition of the euro-area economy. This implies first of all being fully aware that the probability of a recession is increasing in the euro area because of the consequences of the pandemic, the shock to commodity prices of recent months, because of the war and its consequences for trade and uncertainty’.”
-
12:25
Indonesia: BI seen raising rates to 4.50% by year-end – UOB
Economist at UOB Group Enrico Tanuwidjaja comments on the latest interest rate decision by the Bank Indonesia (BI).
Key Takeaways
“Bank Indonesia (BI) raised its benchmark rate (7-Day Reverse Repo) to 3.75% at its Aug MPC.”
“BI unexpectedly raised borrowing costs for the first time since 2018 amidst mounting inflation risks.”
“We keep our view for BI to continue hiking in months to come with three more 25bps hikes in 2H22, taking its benchmark rate to 4.5% by the end of 2022.”
-
12:20
EUR/USD Price Analysis: Another test of the sub-0.9900 area appears probable
- EUR/USD reverses Tuesday’s gains and approaches 0.9900.
- Losses below the 2022 low could extend to 0.9860.
EUR/USD sees Tuesday’s bullish attempt rapidly eroded and refocuses instead on the lower end of the recent range near the 0.9900 area.
Further decline remains on the cards for the time being. That said, the breach of the 2022 low at 0.9899 (August 23) could sponsor a deeper pullback to the December 2002 low at 0.9859.
In the longer run, the pair’s bearish view is expected to prevail as long as it trades below the 200-day SMA at 1.0838.
EUR/USD daily chart
-
12:00
Mexico 1st half-month Inflation came in at 0.42%, above expectations (0.35%) in August
-
12:00
Mexico 1st half-month Core Inflation above forecasts (0.34%) in August: Actual (0.49%)
-
12:00
United States MBA Mortgage Applications climbed from previous -2.3% to -1.2% in August 19
-
12:00
When are the US durable goods orders and how could they affect EUR/USD?
US durable goods orders overview
Wednesday's US economic docket highlights the release of Durable Goods Orders data for July. The US Census Bureau will publish the monthly report at 12:30 GMT and is expected to show that headline orders rose 0.6% during the reported month, marking a notable slowdown from the 2% increase recorded in June. Orders excluding transportation items, which tend to have a broader impact, are anticipated to grow by a modest 0.2% in July as compared to a 0.4% rise reported in the previous month.
Analysts at Wells Fargo offer a brief preview of the report and explain: “Demand for goods is slowing. That is as true for business spending as it is for personal consumption. For businesses, the growing concern the economy is about to tip into recession is weighing on activity, as well as higher borrowing costs and demand largely having been pulled forward throughout the pandemic.”
How could it affect EUR/USD?
Ahead of the key data, the emergence of fresh US dollar buying drags the EUR/USD pair back closer to its lowest level since December 2002 touched the previous day. A stronger-than-expected domestic data will reinforce hawkish Fed expectations, which, in turn, should result in higher US Treasury bond yields and a stronger USD.
Conversely, a weaker report will further fuel concerns about a global economic downturn and weigh on investors' sentiment, offering some support to the greenback's safe-haven status. This, along with fears of a prolonged energy-supply crunch in the Eurozone, suggests that the path of least resistance for the EUR/USD pair is to the downside.
That said, any immediate market reaction is more likely to be short-lived as market participants might prefer to wait on the sidelines ahead of Fed Chair Jerome Powell's appearance at the Jackson Hole symposium on Friday. Nevertheless, a big divergence from the expected readings might still provide some meaningful impetus to the EUR/USD pair.
Eren Sengezer, Editor at FXStreet, meanwhile, offered a brief technical outlook for the EUR/USD pair: “On the four-hour chart, the Relative Strength Index (RSI) indicator stays well below 40 after having moved out of the oversold territory on Tuesday. Additionally, EUR/USD is yet to make a four-hour close above the descending regression channel coming from August 12. Both of these technical developments suggest that the pair's latest recovery was a technical correction rather than a reversal..”
Eren also outlined important technical levels to trade the EUR/USD pair: “In case the pair starts using 0.9950 (static level, upper limit of the descending regression channel) as support, it could face interim resistance at 0.9975 (20-period SMA) before testing parity. On the downside, 0.9900 (static level, psychological level) aligns as first support before 0.9870 (former resistance area from October 2002) and 0.9800 (psychological level).”
Key Notes
• EUR/USD Forecast: Euro stays fragile while below parity
• EUR/USD: Unlikely to bounce as long as the energy crisis lasts – SocGen
• EUR/USD: A drop to 0.98 is more likely than a sustained recovery above parity – ING
About US durable goods orders
The Durable Goods Orders, released by the US Census Bureau, measures the cost of orders received by manufacturers for durable goods, which means goods planned to last for three years or more, such as motor vehicles and appliances. As those durable products often involve large investments they are sensitive to the US economic situation. The final figure shows the state of US production activity. Generally speaking, a high reading is bullish for the USD.
-
11:26
US Dollar Index Price Analysis: Bets for a test of the 2022 high remain intact
- DXY regains the smile following Tuesday’s marked drop.
- Above the 109.00 mark the dollar could revisit the YTD highs.
DXY fades Tuesday’s decline and returns to the positive territory with the next target at the 109.00 neighbourhood.
The continuation of the upside momentum looks increasingly likely in the very near term. That said, beyond the 2022 high at 109.29 (July 14) the index could challenge the September 2002 peak at 109.77 prior to the round level at 110.00.
In the meantime, while above the 6-month support line near 105.10, the index is expected to keep the short-term positive stance.
Looking at the long-term scenario, the bullish view in the dollar remains in place while above the 200-day SMA at 100.55.
DXY daily chart
-
11:13
USD/CHF flirts with daily low, bears now await sustained weakness break below 0.9600 mark
- USD/CHF meets with a fresh supply on Wednesday and drops to the 0.9600 neighbourhood.
- Recession fears offer some support to the safe-haven CHF and exert pressure on the major.
- Softer US bond yields act as a headwind for the USD and contribute to the modest weakness.
- Hawkish Fed expectations should limit any meaningful slide for the greenback and the pair.
The USD/CHF pair attracts some selling near the 0.9660-0.9665 region on Wednesday and slides to a fresh daily low during the first half of the European session. Bears now await a sustained break below the 0.9600 round figure before positioning for an extension of the overnight pullback from the vicinity of the 0.9700 mark, or over a one-month high.
Investors remain concerned about a global economic downturn in the wake of stubbornly high inflation, tighter financial conditions and headwinds stemming from China's COVID-19 lockdowns. This is evident from a generally weaker tone around the equity markets, which offers some support to the safe-haven Swiss franc and exerts some downward pressure on the USD/CHF pair.
The downside, however, seems cushioned mid the emergence of some US dollar buying, bolstered by hawkish Fed expectations. Investors seem convinced that the Fed will stick to its policy tightening path and have been pricing in at least a 50 bps rate hike move at the September FOMC meeting. That said, a modest pullback in the US Treasury bond yields cap gains for the buck.
The mixed fundamental backdrop warrants some caution before positioning for a firm near-term direction. Traders might also prefer to wait on the sidelines ahead of Fed Chair Jerome Powell's speech at the Jackson Hole symposium on Friday. Market participants are bracing for a more hawkish message and will look for clues about a supersized 75 bps Fed rate hike in September.
In the meantime, traders on Wednesday might take cues from the US economic docket - featuring Durable Goods Orders and Pending Home Sales data later during the early North American session. This, along with the US bond yields, might influence the USD. Apart from this, the broader market risk sentiment should contribute to producing short-term trading opportunities around the USD/CHF pair.
Technical levels to watch
-
10:59
EUR/JPY Price Analysis: Further losses expected below 134.94
- EUR/JPY extends the leg lower well below 136.00.
- Initial support comes at the weekly low at 134.94.
EUR/JPY loses ground for the third session in a row, this time breaking below the support at the 136.00 level.
Extra weakness now appears in store for the cross, with the immediate support at the weekly low at 134.94 (August 16). The loss of this level should expose a deeper pullback to the 200-day SMA, today at 134.15.
While above the latter, the prospects for the pair should remain constructive.
EUR/JPY daily chart
-
10:56
S&P Global Market Intelligence: Inflation to moderate in 2023 and 2024
Sara Johnson, Executive Director of Economic Research at S&P Global Market Intelligence, said in a statement on Wednesday, global growth is likely to remain subdued in late 2022 and 2023 while inflation is seen moderating over the next two years.
Key quotes
“World real GDP growth is thus projected to slow from 5.8% in 2021 to 2.7% in 2022 and 2.3% in 2023.
“Once inflation subsides and financial conditions improve, global growth is expected to revive to 3% in 2024,”
mainland China’s economy continues to struggle. “The housing market remains in a deep recession, and declining land sales are hurting local government finances. Real GDP growth is projected to slow from 8.1% in 2021 to 3.8% in 2022 before picking up to 4.9% in 2023.”
“After slowing from 6.2% in 2021 to 3.8% in 2022, Asia-Pacific’s real GDP growth is projected to pick up to 4.2% in 2022 and 4.5% in 2023.”
“India, Indonesia, Vietnam, the Philippines, Bangladesh, and Cambodia will likely achieve growth rates of 5%-7%.”
US real GDP growth is projected to slow from 5.7% in 2021 to 1.5% in 2022 and 1.0% in 2023 before picking up to 1.7% in 2024.”
“With growth falling short of potential, the US unemployment rate will likely rise from 3.5% in July to 4.8% in mid-2024.”
“With consumer price inflation at 10.1% year-on-year in July and headed higher (with a 75% October increase in gas and electricity rate caps), the UK recession is expected to linger through the spring quarter of 2023.”
Related reads
- Why the S&P 500 surge may not last, three reasons to remain cautious – Morgan Stanley
- Goldman Sachs, Nomura cut China’s GDP outlook
-
10:44
AUD/USD remains on the defensive, around 0.6920 area amid modest USD strength
- AUD/USD attracts some dip-buying on Wednesday, though lacks bullish conviction.
- Retreating US bond yields seem to cap the USD and offer some support to the major.
- Recession fears, hawkish Fed expectations favour USD bulls and cap gains for the pair.
The AUD/USD pair reverses an intraday dip to sub-0.6900 levels and climbs back closer to the top end of its daily range during the early part of the European session. The pair, however, lacks follow-through buying and is currently trading with modest intraday losses, around the 0.6915-0.6920 region.
The US dollar trims a part of its intraday gains and turns out to be a key factor offering some support to the AUD/USD pair. A softer tone around the US Treasury bond yields seems to weigh on the greenback, though hawkish Fed expectations should limit the downside. Apart from this, the caution market mood could benefit the safe-haven buck and contribute to keeping a lid on any meaningful upside for the major.
Market participants seem convinced that the Fed would continue to tighten its monetary policy to tame inflation and have been pricing in at least a 50 bps rate hike at the September FOMC meeting. This, along with headwinds stemming from COVID-19 lockdowns in China, adds to worries about a global economic downturn. Recession fears weigh on investors' sentiment and should act as a headwind for the risk-sensitive aussie.
The downside, however, seems cushioned, at least for the time being, as investors might prefer to wait for a hawkish message from Fed Chair Jerome Powell at the Jackson Hole symposium on Friday. Powell's speech will be looked for clues about a 75 bps rate hike in September, which will influence the USD price dynamics.
In the meantime, traders might take cues from Wednesday's US economic docket - featuring Durable Goods Orders and Pending Home Sales data later during the early North American session. This, along with the US bond yields and the broader risk sentiment, will drive the USD demand and provide some impetus to the AUD/USD pair.
Technical levels to watch
-
10:37
Germany 10-y Bond Auction increased to 1.33% from previous 0.94%
-
10:36
China's yuan has no basis for long-term depreciation – Reuters
Various Chinese state media agencies are coming to the rescue of the local currency, the yuan, after the recent depreciation, justifying that the country’s strong exports should offset a stronger dollar and hawkish Fed rate hikes, per Reuters.
The official Shanghai Securities News said, citing analysts, “China’s robust trade surplus should continue to provide support as exporters’ conversion of their FX receipts would be an important factor stabilizing the exchange rate.”
“A moderate yuan depreciation is conducive to maintaining export competitiveness against the backdrop of the global economic downturn, and has positive implications for keeping the economy running in a reasonable range,” Securities Times noted.
At the time of writing, USD/CNY is adding 0.42% on the day, trading at 6.8636. The pair hit the highest level since August 2020 at 6.8676, earlier in the day. The yuan has lost more than 1.6% against the greenback since the People’s Bank of China (PBOC) surprised the market by lowering two key interest rates in the past week, which widened the monetary policy divergence with the Fed.
-
10:04
USD/JPY keeps the red around 135.50 amid weaker yields, US data eyed
- USD/JPY keeps corrective decline intact from monthly highs.
- The US dollar clings to recovery gains but Treasury yields retreat.
- Rejection at the rising channel resistance calls for a test of 50 DMA support.
USD/JPY is keeping its corrective downside intact for the second straight day on Wednesday, as bears capitalize on retreating Treasury yields.
Looming recession risks, expectations of aggressive Fed tightening and energy crisis in China and Europe fuel risk-off flows into the save-haven US bonds, in turn, knocking down the yields across the curve.
Broad risk-aversion also helps the dollar recover some lost ground but has little to no positive impact on the major, as it reverses from monthly highs of 137.70. The greenback clings to the overnight recovery gains, as investors reassess the hawkish Fed expectations following the releases of weak US S&P Global business PMIs and New Home Sales.
Meanwhile, the yen could be drawing support from Japanese Prime Minister Fumio Kishida’s announcement of relaxation of covid border controls starting from September 7. Looking ahead, the US Durable Goods Orders and Pending Home Sales data will be closely eyed before the all-important Fed’s Jackson Hole Symposium held from August 25 to 27.
From a short-term technical perspective, bears have retained control after bulls failed to clear the rising trendline resistance at 137.71 on Tuesday.
Note that the pair has been traversing within a three-week-long rising channel formation. Rejection at the channel resistance revived the selling interest, with sellers now seeking a test of the mildly bullish 50-Daily Moving Average (DMA) support at 135.50.
The next stop for bears is seen at the horizontal 21 DMA at 134.59. The 14-day Relative Strength Index (RSI) is edging lower towards the midline, justifying the latest move lower.
USD/JPY: Daily chart
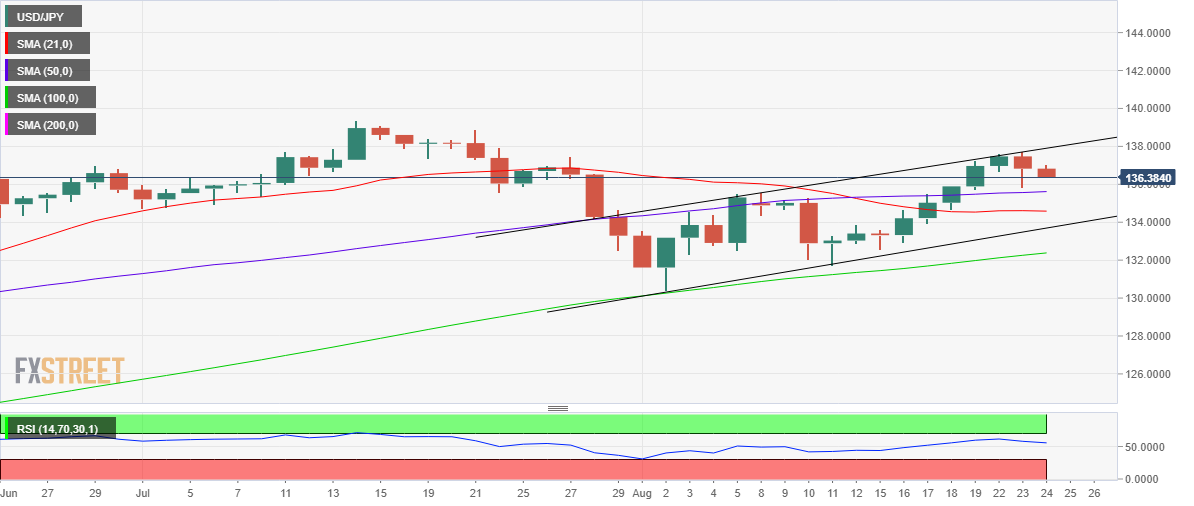
Daily closing above the rising trendline resistance, now at 137.90, will confirm a bullish channel, fuelling a fresh uptrend towards the July 21 highs of 138.87.
Further up, all eyes will be on the 139.00 barrier, as bulls march towards the multi-year highs of 139.39.
USD/JPY: Additional levels to consider
-
10:04
Gold Price Forecast: XAU/USD holds steady near weekly high, just above $1,750 level
- Gold regains some positive traction for the second successive day, though lacks follow-through.
- Recession fears continue to weigh on investors’ sentiment and benefit the safe-haven XAU/USD.
- Hawkish Fed expectations, elevated US bond yields, renewed USD buying cap gains for the metal.
Gold attracts some dip-buying near the $1,744 region and turns positive for the second straight day on Wednesday. The XAU/USD climbs back above the $1,750 level during the early European session, closer to the weekly high touched on Tuesday, though any meaningful upside still seems elusive.
Growing worries about a global economic downturn and headwinds stemming from fresh COVID-19 lockdowns in China continue to weigh on investors' sentiment. This is evident from a generally weaker tone around the equity markets, which turns out to be a key factor offering some support to the safe-haven gold. That said, the emergence of fresh US dollar buying might hold back traders from placing aggressive bullish bets around the dollar-denominated commodity.
The overnight knee-jerk reaction to the dismal US PMI prints turns out to be short-lived amid firming expectations for a further policy tightening by the Fed. In fact, the markets are still pricing in at least a 50 bps rate hike move at the September FOMC monetary policy meeting. This remains supportive of elevated US Treasury bond yields, which assists the USD to regain positive traction and might further contribute to capping gains for the non-yielding gold.
Furthermore, Fed Chair Jerome Powell is anticipated to deliver a more hawkish message at the Jackson Hole symposium on Friday, further warranting some caution before positioning for additional gains. Market participants will look for fresh clues about the possibility of a supersized 75 bps Fed rate hike in September. This will play a key role in influencing the near-term USD price dynamics and help determine the next leg of a directional move for gold.
In the meantime, traders on Wednesday will take cues from the US economic docket - featuring Durable Goods Orders and Pending Home Sales data later during the early North American session. This, along with the US bond yields, will drive the USD demand and provide some impetus to gold. Apart from this, the broader risk sentiment might further contribute to producing short-term trading opportunities around the XAU/USD.
Technical levels to watch
-
09:49
Singapore: Inflation surprised to the upside in July – UOB
Senior Economist at UOB Group Alvin Liew reviews the latest inflation figures in Singapore.
Key Takeaways
“Singapore’s headline CPI rose by 0.2% m/m, 7.0% y/y in Jul (from 1.0% m/m, 6.7% y/y in Jun), fastest y/y print since Jun 2008 but in line with our and Bloomberg median estimate. However, core inflation (which excludes accommodation and private road transport) rose at a much faster clip, up by 4.8% y/y in Jul (from 4.4% in Jun), fastest since Nov 2008, beating expectations.”
“While the surge in core inflation was a surprise, its sources of price pressures for Jul were not unexpected. The sources of price pressures for core inflation were again broad-based including nearly all the major categories, with food, electricity & utilities and services as main drivers. As for the headline CPI inflation, other than upside to the core CPI, both the accommodation costs and private transport costs continued to play the key roles driving overall price increases. Transport component continued to lead, contributing an outsized 3.4ppts to the 7% inflation print, followed by housing & utilities (1.4ppt) and food (1.4ppt) all in similar magnitude as Jun, an indication that the sources of inflation contribution are broadening to other segments, like healthcare. Communication cost was again the only major component of CPI which saw a fall in prices, but its “contribution” was fairly insignificant.”
“In its outlook, the MAS removed its previous expectation for core inflation to peak in 3Q (2022) even as it maintained the projection for core inflation to ‘ease towards the end of 2022’. This likely means that core inflation may stay elevated for longer. Its warnings on inflation developments remained on the upside, both on the external (‘upward pressure on Singapore’s import prices are expected to persist’) and domestic fronts (tight labour market conditions and businesses to pass higher costs to consumer prices here).”
“We maintain our forecasts for headline inflation to average 6.0% and core inflation average 4.2% in 2022. Our headline CPI forecast is at the top end of the official outlook for headline CPI (5.0-6.0%) but our core CPI projection remains above the official core inflation forecast range (3.0-4.0%).”
-
09:30
GBP/USD struggles for a firm direction, stuck in a range above 1.1800 mark
- GBP/USD struggles to gain any meaningful traction and oscillates in a range on Wednesday.
- The emergence of fresh USD buying acts as a headwind amid a bleak UK economic outlook.
- Investors now look forward to US Durable Goods Orders data for short-term opportunities.
The GBP/USD pair lacks a firm intraday direction and seesaws between tepid gains/minor losses through the early part of the European session on Wednesday. Spot prices, however, manage to hold above the 1.1800 round-figure mark, around the previous day's closing level.
The US dollar regains some positive traction and moves further away from the weekly low touched in reaction to the dismal US PMI prints on Tuesday. Expectations that the Fed would stick to its policy tightening path to tame inflation continue to underpin the buck, which, in turn, acts as a headwind for the GBP/USD pair.
In fact, the markets are still pricing in at least a 50 bps Fed rate hike move at the September policy meeting. This remains supportive of elevated US Treasury bond yields, which, along with the prevalent risk-off environment amid growing worries about a global economic downturn, offers additional support to the safe-haven greenback.
The British pound, on the other hand, draws some support from the prospects for a 50 bps rate hike by the Bank of England in September. This, in turn, helps offset the negative factors and limits the downside for the GBP/USD pair. That said, rising concerns over the UK cost of living crisis and recession fears seem to cap gains.
Market participants also seem reluctant to place aggressive bets ahead of Fed Chair Jerome Powell's appearance at the Jackson Hole symposium on Friday. Powell's remarks will be scrutinized for clues about the possibility of a supersized 75 bps rate hike in September, which will influence the USD and provide a fresh impetus to the GBP/USD pair.
In the meantime, traders on Wednesday will take cues from the US economic docket - featuring Durable Goods Orders and Pending Home Sales data later during the early North American session. This, along with the US bond yields, might drive the USD demand. Apart from this, the broader risk sentiment could produce short-term opportunities around the GBP/USD pair.
Technical levels to watch
-
09:09
EUR/USD: Unlikely to bounce as long as the energy crisis lasts – SocGen
Kit Juckes, Chief Global FX Strategist at Société Générale, stresses the importance of the terms of trade to the dollar’s strength. The euro won’t bounce until a devastating term of trade divergence stops.
Energy prices are helping the dollar and crushing the euro
“As oil prices rose in the run-up to the GFC, both European and US terms of trade suffered, but this time around, the relative effect is completely different. From a US perspective, this highlights the positive impact on the dollar of rising energy prices; for the euro, it just highlights the scale of the challenge confronting the continent.”
“I can’t see a significant rebound for any European currency until we get through the gas crisis.”
“Our current forecasts look for EUR/USD to trough in Q3, in a 0.95-1.00 range, and while that level may be about right, it’s harder now, to see a bounce before the end of the year.”
-
09:06
EUR/USD: Bears retake control and retest 0.9930
- EUR/USD remains under pressure well below parity.
- German 10y Bund yields flirt with 2-month highs near 1.40%.
- US Durable Goods Orders next of relevance in the calendar.
The single currency resumes the downside and drags EUR/USD back to the 0.9930 region on Wednesday, where some initial contention appears to have turned up.
EUR/USD looks to USD, risk trends
EUR/USD so far fades part of Tuesday’s bullish attempt and navigates the 0.9950 region on the back of the resumption of the buying interest around the US dollar, which in turn remains underpinned by prospects for the continuation of the Fed’s normalization process via extra interest rate hikes.
The downtick in the pair comes along further rebound in the German 10y Bund yields, which already flirt with 2-month peaks in the vicinity of 1.40%. The bounce in German yields falls in line with the continuation of the uptrend from their American counterparts.
Moving forward, spot is expected to keep the cautious stance ahead of the release of US inflation figures gauged by the PCE and the speech by Fed’s Powell at the Jackson Hole Symposium, both events due on Friday.
Nothing scheduled data wise in the euro area on Wednesday should leave the attention to the publication of Durable Goods Orders, Pending Home Sales and the weekly report on Mortgage Applications by the MBA expected later in the NA session.
What to look for around EUR
EUR/USD managed to rebound from new nearly 2-decade lows in the sub-0.9900 zone on Tuesday following some loss of upside momentum in the greenback.
Price action around the European currency, in the meantime, is expected to closely follow dollar dynamics, geopolitical concerns, fragmentation worries and the Fed-ECB divergence.
On the negatives for the single currency emerge the so far increasing speculation of a potential recession in the region, which looks propped up by dwindling sentiment gauges and the incipient slowdown in some fundamentals.
Key events in the euro area this week: Germany Final Q2 GDP Growth Rate, Germany IFO Business Climate, ECB Accounts (Thursday) – Germany GfK Consumer Confidence.
Eminent issues on the back boiler: Continuation of the ECB hiking cycle. Italian elections in late September. Fragmentation risks amidst the ECB’s normalization of its monetary conditions. Impact of the war in Ukraine on the region’s growth prospects and inflation.
EUR/USD levels to watch
So far, spot is losing 0.16% at 0.9952 and a break below 0.9899 (2022 low August 23) would target 0.9859 (December 2002 low) en route to 0.9685 (October 2022 low). On the other hand, the next up barrier comes at 1.0202 (high August 17) followed by 1.0267 (55-day SMA) and finally 1.0368 (monthly high August 10).
-
09:00
South Africa Consumer Price Index (YoY) registered at 7.8% above expectations (7.7%) in July
-
09:00
South Africa Consumer Price Index (MoM) came in at 1.5%, above expectations (1.42%) in July
-
08:51
USD/CAD clings to modest intraday gains, holds above mid-1.2900s amid renewed USD buying
- USD/CAD regains traction on Wednesday and reverses a part of the overnight corrective slide.
- Hawkish Fed expectations, the risk-off mood revives the USD demand and remains supportive.
- Recession fears cap oil prices and undermine the loonie, supporting prospects for further gains.
The USD/CAD pair catches fresh bids on Wednesday and reverses a part of the previous day's sharp retracement slide from a six-week high. The pair maintains its bid tone through the early European session and is currently placed near the top end of its daily range, around the 1.2975-1.2980 region.
A combination of factors assists the US dollar to regain positive traction and turns out to be a key factor acting as a tailwind for the USD/CAD pair. The overnight knee-jerk reaction to the dismal US PMI prints turns out to be short-lived amid firming expectations for a further policy tightening by the Fed. In fact, the markets are still pricing in at least a 50 bps Fed rate hike at the September policy meeting. This remains supportive of elevated US Treasury bond yields, which, along with the prevalent risk-off environment, continue to benefit the safe-haven buck.
The market sentiment remains fragile amid growing worries about a global economic downturn and headwinds stemming from China’s COVID-zero policy. Apart from this, fading hopes for an imminent output cut by the major producers capped crude oil prices near the very important 200-day SMA. This, in turn, is undermining the commodity-linked loonie and offering additional support to the USD/CAD pair, supporting prospects for further gains. That said, bulls prefer to wait for a hawkish message from Fed Chair Jerome Powell at the Jackson Hole symposium on Friday.
In the meantime, traders on Wednesday will take cues from the US economic docket - featuring Durable Goods Orders and Pending Home Sales data later during the early North American session. This, along with the US bond yields and the broader market risk sentiment, might drive the USD demand and provide some impetus to the USD/CAD pair. Apart from this, oil price dynamics will be looked upon to grab short-term trading opportunities.
Technical levels to watch
-
08:44
Four factors make for volatile markets – UBS
Financial markets remain volatile, with sentiment perhaps outweighing economic facts. The problem is the global economy is in a very weird place. Four factors make for volatile markets, Paul Donovan, the Chief Economist of UBS Global Wealth Management, reports.
Data is unreliable
“It is hard to see a midpoint between a slowdown and a slump. If data does not suggest a soft landing, it implies a slump rather than any other scenario.
“Any hint that a slowdown is less likely means investors have to price in a very different, and more extreme, slump scenario.”
“Sentiment data (never the most reliable indicator) is influenced by media narrative and political partisanship. Real world data is being revised more and more often. Initial data releases will therefore surprise economic models (which extrapolate from past reality).
“Consumers hold the balance between slowdown and slump – but consumer reaction functions are not normal, consumer balance sheets are not normal, and the labor market is just weird.”
-
08:38
Weak US data from unlikely to alter the appreciation of the US dollar – MUFG
The US Dollar Index (DXY) year-to-date high of 109.29 was in sight (109.27) and close to being breached but the US housing data and the US PMI data provided a catalyst for a reversal. The US dollar reversed notably but is unlikely to prove lasting, in the view of economists at MUFG Bank.
Weak US data respite for the US dollar but it will be brief
“To us, the price action suggests the move was as much technical as it was fundamental. Yes, the correction was triggered by data that was weaker than expected but the failure of DXY to break above the YTD high level meant the dollar was already weakening ahead of the data release.”
“We doubt weak data from the US at this juncture will alter the course for the US dollar. The appreciation of the US dollar is being driven not by US economic strength but more the grim deterioration in the global growth outlook.”
“Europe due to the far bigger hit from energy and China due to a collapsed property sector and its zero-covid policy leaves the US dollar relative to the rest as the currency most in demand.”
-
08:18
USD/CNY to trade in a new and higher range for the rest of 2022 and into first half of 2023 – HSBC
USD/CNY has recently broken above the closely watched 6.80 level. Economists at HSBC expect the CNY’s depreciation to be more gradual and modest this time around.
Some potential catalysts could trigger USD/CNY to decline
“Currency-wise, USD/CNY has recently broken above the closely watched 6.80 level. We think this means USD/CNY will likely trade in a new and higher range for the rest of the year and into the first half of next year.”
“USD/CNY jumped significantly in April-May after it broke above 6.40; however, we do not think the upside momentum will be as strong this time around, as China-US yield differentials appear to be stabilising and the CNY’s overvaluation has been pared.”
“Notwithstanding the recent upward momentum, it is possible for USD/CNY to reverse course later and fall instead, triggered by potential catalysts. For example, if US-China trade relations were to improve and/or China’s dynamic zero COVID-19 policy were to relax, USD/CNY could decline instead.”
-
08:18
Silver Price Analysis: XAG/USD struggles near $19.00, remains vulnerable to slide further
- Silver struggles to capitalize on the previous day’s modest bounce and edges lower on Wednesday.
- Failure to find acceptance above the 61.8% Fibo. level supports prospects for further near-term fall.
- Attempted recovery could be seen as a selling opportunity and remain capped near the $20.00 mark.
Silver meets with a fresh supply on Wednesday and remains on the defensive through the early European session. The white metal is currently placed just above the $19.00 mark and seems vulnerable to slide further.
The overnight recovery move from the vicinity of the monthly low struggled to find acceptance above the 61.8% Fibonacci retracement level of the July-August rally. The subsequent pullback suggests that the bearish pressure might still be far from being over.
Furthermore, technical indicators on the daily chart are holding deep in the negative territory and are still far from being in the oversold zone. This adds credence to the bearish outlook and supports prospects for a further depreciating move for the XAG/USD.
Hence, a decline back towards the weekly low, around the $18.70 region, en route to the next relevant support near the $18.45-$18.40 area, remains a distinct possibility. The downward trajectory could drag the XAG/USD to the YTD low, around the $18.15 zone touched in July.
On the flip side, the overnight swing high, around the $19.25-$19.30 area, now seems to act as immediate resistance. Any further recovery could be seen as a selling opportunity and remain capped near the $19.40-$19.50 area, which coincides with the 50% Fibo. level.
The latter should now act as a pivotal point, which if cleared should lift the XAG/USD to the $19.85 confluence, comprising of the 50-day SMA and the 38.2% Fibo. level. Some follow-through buying beyond the $20.00 mark will suggest that spot prices have bottomed out.
Silver daily chart
-637969221942793407.png)
Key levels to watch
-
08:15
USD/CNH: A move to 6.9000 loses traction – UOB
FX Strategists at UOB Group Lee Sue Ann and Quek Ser Leang note a probable test of 6.9000 appears to have lost some momentum in USD/CNH for the time being.
Key Quotes
24-hour view: “We highlighted yesterday that ‘conditions remain overbought but the improved upward momentum is likely to lead to a break of 6.8800’. We added, ‘the next major resistance at 6.9000 is not expected to come into the picture’. While our view was not wrong as USD took out 6.8800 and rose to a high of 6.8845, we did not expect the sharp drop from the high (low has been 6.8369). Upward pressure has eased and USD appears to have moved into a consolidation phase. For today, we expect USD to trade within a range of 6.8350/6.8750.”
Next 1-3 weeks: “After USD soared to 6.8751, we highlighted yesterday (23 Aug, spot at 6.8660) that upward momentum is still solid and a break of 6.8800 would not be surprising. We added, ‘the next level to focus on is at 6.9000’. USD subsequently took out 6.8800 but dropped sharply from a high of 6.8845. The sharp decline came close to taking out our ‘strong support’ level at 6.8330 (low of 6.8369). The rapid loss in shorter-term upward momentum has diminished the odds for USD to advance to 6.9000. However, only a break of 6.8330 would indicate that USD has moved into a consolidation phase.”
-
08:15
Why the S&P 500 surge may not last, three reasons to remain cautious – Morgan Stanley
The last two months’ recovery has sent the S&P 500 Index up about 15% from its June low. As enticing as this rally has been, however, Morgan Stanley’s Global Investment Committee remains convinced that it is still no more than a bear-market rally.
It’s not unusual for stocks to rally during a bear market
“Rallies have occurred in just about every bear market of the past 95 years, with gains averaging 18% before a downward slide resumes. In comparison, the current rally has gained about 15% so far. That may seem like a bull market that is gathering steam, but given the historical context, we may not be out of the woods yet.”
Bond and currency markets anticipate further rate hikes
“While stock investors continue to hope that the Fed will soon reverse its rate-hike program, Fed fund futures imply that the central bank will continue to raise rates for longer. Global currency markets appear to agree, with the US dollar still close to the 20-year high it reached recently.”
Stocks look expensive
“Valuations have re-inflated, with the market’s forward price/earnings ratio now at 18.7. Meanwhile, the equity risk premium is around 2.6 percentage points. That’s about one whole point lower than the 13-year average. Such valuation concerns wouldn’t be so troubling if it weren’t for the fact that current pricing seems based on unrealistic earnings estimates. While US consumers are still spending and the labor market remains strong, leading economic indicators suggest a slowing in growth that may challenge profit estimates.”
-
08:11
US Dollar Index resumes the upside and retargets 109.00
- The index leaves behind the recent pullback and looks to 109.00.
- US yields extend the upside momentum on Wednesday.
- Durable Goods Orders next of relevance in the US docket.
The US Dollar Index (DXY), which gauges the greenback vs. a basket of its main competitors, regains the upside bias and targets the 109.00 neighbourhood midweek.
US Dollar Index now looks to data releases
The index regains ground lost following Tuesday’s moderate pullback, as the sentiment around the risk complex remains sour amidst expectations of further tightening by the Fed ahead of the Jackson Hole Symposium and the speech by Chair Powell on Friday.
Indeed, investors continue to debate the size of the next rate hike by the Fed at the September meeting, where the probability of a 50 bps or a 75 bps rate raise appears stable around 50% according to CME Group’s FedWatch Tool.
Later in the US docket, usual MBA Mortgage Applications are due in the first turn seconded by Durable Goods Orders, Pending Home Sales and the weekly report on US crude oil stockpiles by the EIA.
What to look for around USD
Hawkish rhetoric from Fed’s rate-setters coupled with deteriorating sentiment in the risk complex propelled the index back above the 109.00 barrier in past sessions.
Bolstering the dollar’s strength appears the firm conviction of the Federal Reserve to keep hiking rates until inflation looks well under control regardless of a likely slowdown in the economic activity and some loss of momentum in the labour market.
DXY, in the meantime, is poised to suffer some extra volatility amidst investors’ repricing of the next move by the Federal Reserve, namely a 50 bps or 75 bps hike in September.
Looking at the macro scenario, the greenback appears propped up by the Fed’s divergence vs. most of its G10 peers (especially the ECB) in combination with bouts of geopolitical effervescence and occasional re-emergence of risk aversion.
Key events in the US this week: MBA Mortgage Applications, Durable Goods Orders, Pending Home Sales (Wednesday) – Jackson Hole Symposium, Advanced Q2 GDP Growth Rate, Initial Claims (Thursday) - Jackson Hole Symposium, PCE, Personal Income, Personal Spending, Fed Powell, Final Consumer Sentiment (Friday) - Jackson Hole Symposium (Saturday).
Eminent issues on the back boiler: Hard/soft/softish? landing of the US economy. Escalating geopolitical effervescence vs. Russia and China. Fed’s more aggressive rate path this year and 2023. US-China trade conflict.
US Dollar Index relevant levels
Now, the index is gaining 0.19% at 108.71 and a breakout of 109.29 (2022 high July 15) would aim for 109.77 (monthly high September 2002) and then 110.00 (round level). On the other hand, immediate support comes at 106.12 (55-day SMA) followed by 104.63 (monthly low August 10) and then 104.36 (100-day SMA).
-
08:09
US Dollar Index can still reach 110.00 by the end of the week – ING
Amid an abundance of rather dismal PMIs in major Western economies, the dollar suffered a correction on Tuesday. Economists at ING think the post-PMI dollar correction may be fully reversed today.
Shrugging off the post-PMI correction
“We are not surprised to see the post-PMI FX moves being quite short-lived, as the macro picture and solidly hawkish expectations ahead of Jackson Hole should keep the dollar broadly in demand.
“The quintessential lack of attractive alternatives – especially in Europe – means that DXY can still reach 110.00 by the end of the week if Fed Chair Jerome Powell sounds convincing enough in sticking to his hawkish message on Friday.”
-
08:06
GBP/USD still seen lower at 1.17/16 for this week – ING
GBP/USD gained more than 50 pips on Tuesday and went into a consolidation phase above 1.18 on Wednesday. Nonetheless, the pair is expected to drop towards 1.17/16 this week, economists at ING report.
EUR/GBP may bottom out if it reaches 0.84
“We see downside risks for cable as yesterday’s dollar drop may be unwound further, with 1.16/1.17 remaining the bias for this week.”
“EUR/GBP may bottom out if it reaches 0.8400, as similar economic troubles for the UK and the eurozone argue against sustained deviations from its recent range.”
-
08:03
EUR/USD: A drop to 0.98 is more likely than a sustained recovery above parity – ING
EUR/USD staged a rebound and tried to reclaim parity after having dropped to its weakest level in nearly 20 years at around 0.99 on Tuesday. However, the pair has retreated to 0.9950 and could fall to 0.98, economists at ING report.
Bearish bias persists
“While an improvement in the eurozone’s growth sentiment may trigger an asymmetrical upside reaction in EUR/USD, a prolonged short-term undervaluation is surely possible should gas prices remain elevated and the threat of supply shortages material.”
“Yesterday’s PMIs all but confirmed the market’s concerns about the toxic combination of high energy prices and slowing global demand, and a full inversion of yesterday’s moves may be on the cards today.”
“A drop to 0.9800 is more likely than a sustained recovery above parity in the near-term.”
-
08:00
Hungary Gross Wages (YoY) rose from previous 14.9% to 15.4% in June
-
07:59
USD/TRY bulls occupy driver’s seat above 18.00, focus on US data, Jackson Hole speeches
- USD/TRY remains on the front foot around the yearly top, up for the second consecutive day.
- Turkish FinMin Nebati praises CBRT moves while expecting softer inflation.
- Turkish Consumer Confidence improved in August, US data came in mostly downbeat.
- US Durable Goods Orders, Fed Chair Jerome Powell’s speech at Jackson Hole will be crucial
USD/TRY grinds higher past 18.00 for the second consecutive day amid the initial European morning on Wednesday. In doing so, the Turkish lira (TRY) pair fails to cheer the multiple recent efforts by the Central Bank of the Republic of Türkiye (CBRT), as well as hawkish comments from the Turkish Finance Minister (FinMin) Nureddin Nebati. The reason could be linked to the market’s risk-off mood ahead of the key US data/events that underpin the US dollar’s safe-haven demand.
On Tuesday, the CBRT announced a hike in the discount rate on CPI-indexed bonds in the Turkish central bank's collateral system, from 50% to 60%. “The move would make the longer-term fixed-coupon bond more attractive to banks over CPI-indexed bonds,” said Reuters.
It’s worth noting that the CBRT also unveiled new required bond holdings for lenders, per Reuters, which lead higher demand and meant to address the widening gap between the bank's policy rate and lending rates.
While praising the CBRT moves, Turkish Nebati said, “Turkey's annual inflation rate will enter a sharp downward trend as of December due to favorable so-called base effects and the fall will continue throughout 2023,” reported Reuters.
Talking about the data, Turkiye’s Consumer Confidence Index rose to 72.2 versus 68.00 for August but failed to help the USD/TRY bears.
It’s worth noting that the USD/TRY traders also ignored downbeat US data to keep the pair on the bull’s radar. That said, the preliminary readings of the US S&P Global Manufacturing PMI for August eased to 51.3 versus 52.0 expected and 52.2 prior while the Services gauge plunged to 44.1 from 47.3, compared to 49.2 market forecasts. According to S&P Global, the US economy is also in trouble as the Composite PMI shrank to 45, its lowest in 27 months. Furthermore, the US New Home Sales for July dropped to the lowest levels in six years, to 0.511M from 0.585M prior and 0.575M market forecasts. Furthermore, the US Richmond Fed Manufacturing Index for August dropped to -8.0 compared to the 0.0 previous reading.
Recently, Minneapolis Fed President Neel Kashkari mentioned that the biggest fear is that we are misreading underlying inflation dynamics, per Reuters. The policymaker also added that the Fed can relax on rate hikes when compelling evidence of CPI heading toward 2% is seen. Comments from Fed’s Kashkari tamed concerns that Fed Chair Powell would go slow on rate hikes while speaking at the Jackson Hole on Friday, as backed by Goldman Sachs.
Looking forward, the US Durable Goods Orders for July, expected 0.6% versus 2.0% prior, would direct intraday moves of the USD/TRY but major attention will be given to Friday’s speech by Fed Chairman Jerome Powell at the Kansas City Fed’s symposium in Jackson Hole.
Technical analysis
USD/TRY bulls remain on the way to an upward sloping resistance line from early June, around 18.25 unless the sellers successfully break the 18.00 threshold.
-
07:58
Forex Today: Markets turn choppy ahead of key events
Here is what you need to know on Wednesday, August 24:
After having snapped a four-day winning streak on disappointing data releases on Tuesday, the US Dollar Index (DXY) started to edge higher in the early European morning on Wednesday. In the absence of high-tier data releases, the market action turns choppy with investors remaining cautious ahead of the Jackson Hole Symposium later this week. In the second half of the day, July Pending Home Sales and Durable Goods Orders data will be featured in the US economic docket. Meanwhile, US stock index futures post modest losses and the 10-year US Treasury bond yield continues to fluctuate above 3%.
On Tuesday, the data from the US revealed that the business activity in the private sector continued to contract in August with the S&P Global Composite PMI dropping to 45 from 47.7 in July. Other data showed that New Home Sales declined by 12.6% in July following June's contraction of 7.1%. The dollar lost interest after these data and the DXY lost nearly 0.5% on a daily basis. Nevertheless, the CME Group FedWatch Tool shows that markets are still pricing in a 51.5% probability of a 75 basis points rate hike in September.
Several news outlets reported on Tuesday that OPEC+ may lean towards oil output cuts when and if Iranian production returns depending on the revival of the nuclear deal. Crude oil prices continued to push higher and the barrel of West Texas Intermediate gained 3.5% before settling near $94.00.
EUR/USD staged a rebound and tried to reclaim parity after having dropped to its weakest level in nearly 20 years at around 0.9900 on Tuesday. The pair, however, failed to gather bullish momentum and retreated toward 0.9950 early Wednesday.
GBP/USD gained more than 50 pips on Tuesday and went into a consolidation phase above 1.1800 during the Asian trading hours on Wednesday. The pair trades in a relatively tight channel so far on the day.
USD/JPY fell sharply during the American session on Tuesday but the rebound witnessed in the 10-year US Treasury bond yield helped it erase a large portion of its daily losses. The pair moves sideways above 136.50 on Wednesday.
Gold capitalized on the broad-based selling pressure surrounding the greenback and registered daily gains for the first time since August 12. XAU/USD is struggling to find direction as it moves up and down in a narrow channel below $1,750.
Bitcoin is having a difficult time making a decisive move in either direction and is trading near the mid-$21,000s. Ethereum registered modest daily gains on Tuesday but it's already down more than 1% on the day near $1,600 early Wednesday.
-
07:58
EUR/CHF: Everything points towards further franc appreciation – Commerzbank
The Swiss franc /CHF) only knows one direction against the euro at present: up. On Tuesday, EUR/CHF even breached the 0.96 mark. Economists at Commerzbank expect to see further franc appreciation.
SNB interventions seem more like a leaning against the wind
Levels below parity have become normal. The increased uncertainty on the market, recession fears for the eurozone economy and high inflation levels combined with a hesitant ECB would make possible SNB interventions seem more like a leaning against the wind. As a result, their effect would be short-lived – if anything – as they would only limit the franc’s appreciation speed but would not prevent appreciation altogether.
“Of course, it can never be excluded that the SNB might intervene on the market every so often, but principally everything points towards further franc appreciation. In particular, while the situation for the euro seems unfavourable.”
-
07:56
USD/JPY faces extra consolidation near term – UOB
USD/JPY is now expected to trade within the 135.20-138.00 range in the short term, comment FX Strategists at UOB Group Lee Sue Ann and Quek Ser Leang.
Key Quotes
24-hour view: “The sharp but short-lived drop in USD to 135.80 and the subsequent robust rebound came as a surprise (we were expecting USD to consolidate). The volatile price actions have resulted in a mixed outlook. For today, USD could trade in a choppy manner, likely within a broad range of 135.70/137.60.”
Next 1-3 weeks: “Our view for USD to advance to 138.30 was invalidated as it dropped below our ‘strong support’ level of 136.40 yesterday (low of 135.80). The subsequent strong bounce from the low has resulted in a mixed outlook. Further choppy price actions are not ruled out. In view of the whippy price actions, USD could trade within a broad range of 135.20/138.00 for now.”
-
07:54
USD/TRY: Scope for a break above 19.00 by the end of the quarter – Credit Suisse
Economists at Credit Suisse set their end-Q3 USD/TRY target at 19.00 and anticipate a more challenging Q4 for the lira.
Expecting an orderly rally in USD/TRY, for now
“We expect the rally in USD/TRY in the coming weeks to remain relatively orderly. We mark an end-Q3 target of 19.00, which is only slightly above the forward rate.”
“The outlook for the lira looks set to become more challenging in Q4 when the summer-period favourable current account seasonality ends.”
-
07:50
USD/KRW could struggle to break the 1,350 level in the short-term – Credit Suisse
Economists at Credit Suisse revise their USD/KRW forecast higher to 1,300-1,365. However. they think that the pair could struggle to break the 1,350 level in the short-term.
KRW follows the leaders, yuan and yen
“We revise our USD/KRW forecast to 1,300-1,365. But we think that the 1,350 will likely show resistance in the short-term.”
“We are cautious on further USD/KRW upside in the short-term as USD/JPY and USD/CNH momentum is likely to slow ahead of key levels of 140 and 6.90, respectively.”
“The fundamentals of weaker Asian export growth and still-elevated oil prices point to further won weakness.”
“The Bank of Korea (BoK) will continue hiking; we forecast 25 bps this Thursday and the following three meetings. Outflows will continue however as the BoK rate is below Fed funds rate.”
See – BoK Preview: Forecasts from seven major banks, monetary tightening set to continue
-
07:45
USD/JPY is likely to test the 140 mark sooner or later – Commerzbank
USD/JPY reached 137 on Tuesday. Economists at Commerzbank believe that the pair could test the 140 level.
Yen stands no chance
“It is still not foreseeable that the Bank of Japan (BoJ) will become less expansionary in any way or shape. On the contrary: the risk of the (global) economy cooling rather causes it to consider whether it might have to become more expansionary if need be.”
“As long as the market doesn't reduce its Fed rate expectations significantly the pair is likely to test the 140-mark sooner or later. The yen simply does not stand a chance against the US dollar.”
-
07:42
EUR/NOK: Q3 target revised lower from 10.35 to 10.00 – Credit Suisse
The Norwegian krone (NOK) has been remarkably resilient over the past week, with EUR/NOK pushing below 9.70. Economists at Credit Suisse revise their Q3 EUR/NOK target lower from 10.35 to 10.00, staying bearish NOK but with a more modest target.
NOK/SEK should settle slightly lower around 1.08
“While we retain a fundamentally still bearish view on NOK, we revise our EUR/NOK target lower from 10.35 to 10.00, near the 200-day moving average.”
“This is consistent with a Q3 USD/NOK target of around 10.31; combined with our 10.80 EUR/SEK target, it suggests NOK/SEK should settle slightly lower around 1.08, perhaps having tested the Q1 levels north of 1.10 beforehand.”
“While growth and geopolitical risks in continental Europe leave us structurally net bearish NOK, terms of trade have grown increasingly supportive and monetary policy is not providing a strong enough offsetting force for now.”
-
07:37
BoK Preview: Forecasts from seven major banks, monetary tightening set to continue
The Bank of Korea (BoK) will hold its Monetary Policy Committee (MPC) meeting on Thursday, August 25 at 01:00 GMT and as we get closer to the release time, here are the expectations as forecast by the economists and researchers of seven major banks.
At the last meeting on July 13, the bank hiked rates by 50 basis points (bps) to 2.25%, as expected. Now, the BoK is expected to hike their rate by 25 bps to 2.50%.
ANZ
“We expect the BoK to hike by 25 bps. Overall, we maintain that the BoK’s rate hiking cycle will end in 2022; we have pencilled in 25 bps hikes at each of its remaining three policy meetings (August, October and November) this year, bringing the policy rate to 3.0%.”
Standard Chartered
“We expect the BoK to hike the base rate by 25 bps to 2.50%. The central bank is likely to take a balanced approach to monetary policy as the base rate has reached the bottom of the range of neutral rate estimates and global recessionary concerns rise. Korea’s CPI inflation rose to 6.3% YoY in July, suggesting that inflationary pressure remains and that inflation is yet to peak. However, on MoM basis, CPI inflation eased to 0.5%. The BoK is likely to view this positively and therefore hike by 25 bps in August.”
ING
“We expect the BoK to raise rates by 25 bps. On the same day, the BoK will release its latest economic outlook. The 2022 GDP outlook could be downgraded slightly to 2.6% from the current 2.7%, while the CPI inflation outlook should rise sharply to 5.3% from 4.5%. Surveys for consumers and businesses are also likely to worsen as the recent nationwide floods will likely take a toll on sentiment.”
UOB
“On the assumption that inflation will peak in 2H22, we maintain our forecast for the BoK to revert to 25 bps hike for the remaining meetings this year in Aug, Oct and Nov to bring the benchmark base rate to 3.00% by year-end. With an expected moderation in inflation rate next year, the BoK is likely to stay on hold thereafter, or even begin to trim interest rate should growth risks mount.”
TDS
“Headline inflation climbed to 6.3% YoY in July from 6.0%, reaching a 24-year high and likely warrants another hike from the BoK. However, the Governor has signalled a preference for more ‘gradual’ 25 bps hikes instead of another outsized 50 bps hike last month. The Board still views the policy rate as accommodative and we think the BoK isn't done with its tightening cycle yet.”
BBH
“BoK is expected to hike rates 25 bps to 2.5%. The swaps market is pricing in 50 bps of tightening over the next six months that would see the policy rate peak near 2.75% but we see upside risks.”
Credit Suisse
“We now think that the BoK will slow down its hikes. We expect 25 bps hikes at each of the four upcoming meetings (25 August, 12 October, 24 November and next January) to be followed with a pause for the remainder of 2023.”
-
07:35
EUR/GBP Price Analysis: Monthly bullish channel, RSI conditions test bears above 0.8400
- EUR/GBP prints three-day downtrend inside a bullish channel.
- Failure to stay beyond 200-SMA, bearish MACD favor sellers.
- Nearly oversold RSI line challenges further downside, 0.8410 is the key support.
EUR/GBP holds lower grounds near the intraday low bottom surrounding 0.8420 amid the early Wednesday morning in Europe. In doing so, the cross-currency pair drops for the third consecutive day as bears poke a one-week low.
It’s worth observing that the EUR/GBP pair’s failure to stay beyond the 200-SMA joins the bearish MACD signals to keep sellers hopeful.
However, the RSI (14) approaches the oversold territory, suggesting that the bears are running out of steam. Also likely to challenge the quote’s further downside is the support line of a one-month-old ascending trend channel, at 0.8410 by the press time.
In a case where EUR/GBP prices remain weak past 0.8410, the odds of witnessing a gradual south-run towards the monthly low near 0.8340 can’t be ruled out.
On the flip side, the 200-SMA level near 0.8445 guards the quote’s immediate upside ahead of the 0.8500 threshold. Following, that, the upper line of the stated channel, near 0.8520, could lure the pair buyers.
If the EUR/GBP bulls keep reins past 0.8520, the late July swing high of 0.8585 will be in focus.
EUR/GBP: Four-hour chart

Trend: Limited downside expected
-
07:33
EUR/USD does not see new momentum – Commerzbank
EUR/USD has turned sideways after a decent correction from above the figure of 1.0000. In the opinion of economists at Commerzbank, there is no new momentum in the pair.
EUR/USD does not differ significantly from a random walk
“EUR/USD does not differ significantly from a random walk, for which no trade strategy is successful, as you will know.”
“The downside move of the past days can be explained very easily with non-systemic arguments. Trying to turn this into a story which would have implications for the EUR/USD moves over the coming days is not supported by the data.”
-
07:30
FX option expiries for August 24 NY cut
FX option expiries for August 24 NY cut at 10:00 Eastern Time, via DTCC, can be found below.
- EUR/USD: EUR amounts
- 0.9840-50 621m
- 0.9920-25 812m
- 0.9935 232m
- 0.9950 771m
- 0.9990-00 377m
- 1.0050 249m
- USD/JPY: USD amounts
- 136.00-05 955m
- 136.30-35 300m
- 136.80-90 1.1b
- 137.00-05 360m
- 137.20 320m
- AUD/USD: AUD amounts
- 0.6975 341m
- NZD/USD: NZD amounts
- 0.6250 274m
- EUR/JPY: EUR amounts
- 136.00 201m
- 137.00 278m
-
07:27
GBP/USD: Break below the 1.1760 July low to clear the way towards 1.15 – Credit Suisse
GBP/USD is expected to resume its downtrend. The pair stays on course for a move to Credit Suisse’s core objective at 1.1500/1409.
Resistance at 1.2142 to cap any further recovery attempt
“We look for a sustained break of the 1.1760 July low for a move to our core objective of the key low of 2020 and long-term trend support stretching back to 1985 at 1.1500/1409. We would then look for a fresh floor here. Should weakness directly extend though, this would be seen to expose support next at 1.1285.”
“Resistance at 1.2142 ideally caps any further recovery attempt.”
-
07:24
USD/TRY: Lira shrugs off Erdogan’s resistance to the rate hike – Commerzbank
Turkish President Erdogan mentioned that the country did not need to hike interest rates. These remarks have no implications for the lira, in the view of economists at Commerzbank.
Erdogan reiterates case against rate hikes
“President Tayyip Erdogan’s repetition that there is no case for rate hikes in Turkey hardly has implications for the exchange rate. Even if his remarks might mean that CBT will be under pressure to cut the rate again in the coming months, that too, should come as no surprise.”
“Erdogan is emphasising rapid investment as the way to tackle inflation. This is anyway a longer-term strategy. But crucially, Turkey needs substantial foreign capital to bridge the gap between the required investment rate and Turkey’s own low savings rate. But perhaps that too will be clear only over the longer-term. For now, we see no implication for the lira.”
-
07:20
EUR/USD set to slide towards the 0.9609/0.9592 region – Credit Suisse
EUR/USD has broken to new 2022 lows. Despite the stalling on Tuesday at the 78.6% retracement support at 0.99, analysts at Credit Suisse continue to look for an eventual break for a move to their 0.9609/0.9592 next objective.
EUR/USD may again hold 0.99 for now
“Whilst we may see the 78.6% retracement of the 2000/2008 uptrend at 0.99 hold near-term, we continue to look for an eventual break for a move to our 0.9609/0.9592 next objective.”
“Resistance is seen moving to 1.0097 initially, with the 55-day average at 1.0285 now ideally capping further strength if seen.”
-
07:16
Gold Price Forecast: XAU/USD recalls bears as fails to settle aboev $1,750
Gold price is treading water below $1,750 so far this Wednesday. XAU/USD is seen at a critical juncture as bull-bear tug-of-war could set in, FXStreet’s Dhwani Mehta reports.
XAU/USD bears return after rejection above $1,750
“The 14-day Relative Strength Index (RSI) is turning south once again while below the midline, suggesting that the downside pressure could build up in the sessions ahead.”
“Adding credence to the bearish bias, the 50-Daily Moving Average (DMA) is fast approaching the 21 DMA from above.”
“A sustained break below the Fibonacci Retracement (Fibo) level of the recovery from yearly lows of $1,681 to the August 10 high of $1,808 at $1,729 will open up the downside towards the $1,700 mark.”
“Bulls need a daily closing above the $1,750 psychological level, above which the 38.2% Fibo resistance at $1,760 will be probed. Further up, the meeting point of the 21 and 50 DMAs at $1,769 will be a tough nut to crack for XAU bulls.”
-
07:09
Gold Price Forecast: XAU/USD steadies near $1,750 as central bankers head to Jackson Hole
- Gold price remains steady after bouncing off monthly low.
- DXY retreat underpins the recovery as yields ease, recession woes test XAU/USD bulls.
- Cautious sentiment ahead of Jackson Hole symposium, US data could restrict immediate moves.
Gold price (XAU/USD) remains sidelined near $1,745-46, following the rebound from the monthly low, as traders brace for Wednesday’s European session.
In doing so, the bright metal portrays the markets’ cautious mood ahead of the US Durable Goods Orders for July. Also restricting the bullion’s immediate moves are the news that the global policymakers have recently left for Friday’s key speech at the Kansas City Fed’s symposium in Jackson Hole.
“Many of the central bankers heading to the Grand Teton mountains this week hoping today's inflation pressures will abate quickly enough to allow them to counter the downturns anticipated in economies around the world,” said Reuters.
It’s worth noting that the retreat in the US 10-year Treasury yields, down 2.5 basis points (bps) near 3.03% also favors the gold price. On the contrary, economic fears surrounding China, the world’s largest commodity user, weigh on the XAU/USD prices. “Authorities have been trying to put a floor under a slowdown spurred by China’s deepening real estate crisis, as well as an ongoing hit to consumer and business sentiment fueled by a stop-start Covid containment strategy,” said Bloomberg.
Amid these plays, stock futures remain mildly offered while the US Dollar Index (DXY) seesaw around the intraday high, after reversing from the yearly peak the previous day.
Moving on, US Durable Goods Orders for July, expected 0.6% versus 2.0% prior, will be important for intraday directions. However, major attention should be given to Friday’s speech by Fed Chairman Jerome Powell at the Kansas City Fed’s symposium in Jackson Hole. Should policymakers accept recession as a major risk than inflation and shows readiness to shift the previously hawkish bias, XAU/USD may witness further upside.
Technical analysis
A clear upside break of the two-week-old descending trend line keeps XAU/USD buyers hopeful amid a firmer RSI (14). However, the MACD signals a mildly negative and hence the immediate hurdle surrounding the 100-HMA and the 200-HMA, respectively near $1,748 and $1,764, will be important for the gold price upside to watch.
If the quote rises past $1,764, the mid-August high near $1,785 will be an important hurdle to watch before welcoming XAU/USD bulls.
On the contrary, pullback remains elusive until the quote stays beyond the previous resistance line from August 12, around $1,737 by the press time.
If at all the gold price weakens past $1,737, the south-run towards the monthly low near $1,727 appears imminent.
Gold: Four-hour chart
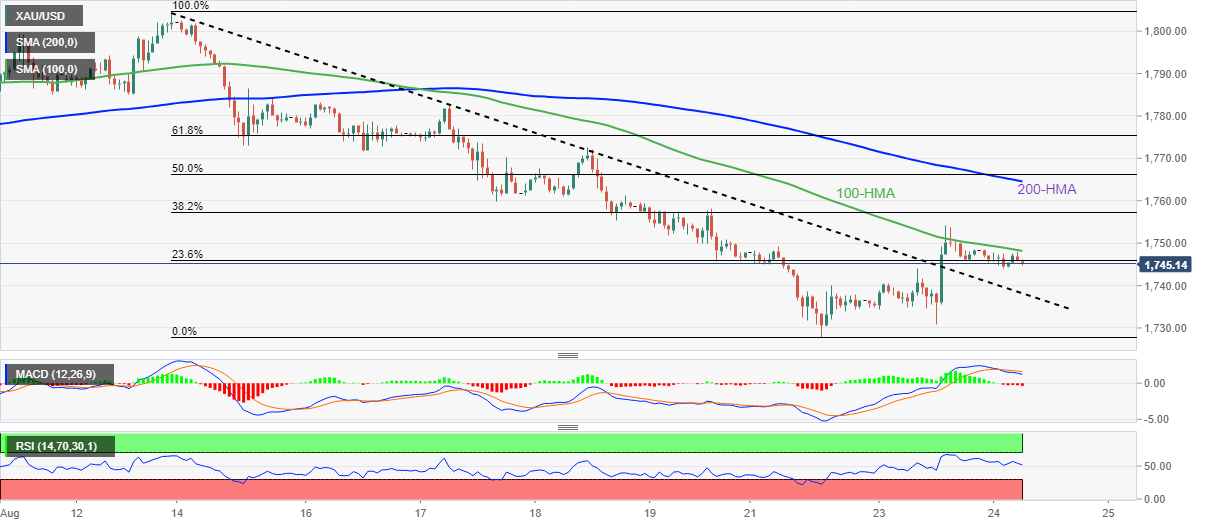
Trend: Further weakness expected
-
07:07
EUR/JPY Price Analysis: Declines towards 135.00 on ascending triangle violation
- A downside break of ascending triangle adds to the downside filters.
- A bear cross, represented by the 20-and 50-period EMAs, indicates more downside ahead.
- The RSI (14) has shifted into the bearish range of 20.00-40.00.
The EUR/JPY pair is hovering around the critical support of 135.76. The asset is highly expected to continue its two-day losing streak amid the unavailability of any pullback despite delivering a sheer downside move. In the Asian session, the cross extended its weakness after violating the cushion of 136.00.
On a four-hour scale, the asset has given a downside break of the Ascending Triangle chart pattern, which is expected to result in higher volume and large-size ticks ahead. The upward-sloping trendline of the above-mentioned chart pattern is placed from August low at 133.40 while the horizontal resistance is plotted from August 8 high at 137.93.
The 20-and 50-period Exponential Moving Averages (EMAs) have delivered a bearish crossover near 137.00, which signals more weakness ahead.
Also, the Relative Strength Index (RSI) (14) has shifted into the bearish range of 20.00-40.00 after oscillating in the neutral range of 40.00-60.00, which strengthens the yen bulls.
Should the asset drops below the August 4 low at 135.64, yen bulls will get strengthened further. An occurrence of the same will drag the cross towards the previous week’s low at 134.90, followed by an August 2 low at 133.40.
On the contrary, the shared currency bulls could defy the downside momentum if the cross oversteps the round-level resistance of 138.00. This will drive the asset towards July 29 high at 139.51, followed by July 18 high at 140.80.
EUR/JPY four-hour chart
-637969180032774753.png)
-
07:05
Natural Gas Futures: A deeper pullback is not favoured
Considering advanced prints from CME Group for natural gas futures markets, open interest dropped for the second straight session on Tuesday, now by around 1.9K contracts. Volume, in the meantime, increased for the second consecutive day, this time by more than 98K contracts.
Natural Gas keeps looking to $10.00
Prices of natural gas briefly surpassed the key $10.00 mark per MMBtu on Tuesday, although the commodity ended the session with strong losses. The daily retracement was on the back of shrinking open interest, however, signalling that the continuation of the downtrend appears improbable in the very near term.
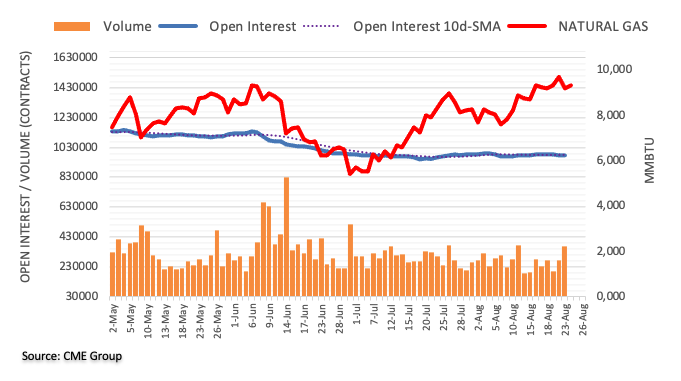
-
07:01
Norway Credit Indicator increased to 5.2% in July from previous 5.1%
-
06:56
AUD/USD now moved into a side-lined theme – UOB
In the opinion of FX Strategists at UOB Group Lee Sue Ann and Quek Ser Leang, AUD/USD could now trade between 0.6850 and 0.7005.
Key Quotes
24-hour view: “We expected to ‘consolidate and trade between 0.6855 and 0.6920’ yesterday. AUD subsequently dipped to 0.6856, rebounded robustly to 0.6963 before easing off to end the day at 0.6929 (+0.73%). We still view the price actions as part of a consolidation even though the increase in volatility and firmed underlying tone suggests a wider and higher range of 0.6870/0.6970.”
Next 1-3 weeks: “Two days ago (22 Aug, spot at 0.6885), we indicated that there is scope for AUD to extend its decline but any further weakness is expected to encounter solid support at 0.6830. Yesterday, AUD dropped to 0.6856 before rebounding strongly to take out our ‘strong resistance’ level at 0.6960 (high of 0.6963). The breach of the ‘strong resistance’ level indicates that the weakness in AUD has stabilized. From here, AUD is likely to trade sideways between 0.6850 and 0.7005.”
-
06:45
Crude Oil Futures: Scope for extra gains
CME Group’s flash data for crude oil futures markets noted traders added around 12.4K contracts to their open interest positions on Tuesday, reversing at the same time six consecutive daily drops. On the other hand, volume shrank by around 97.7K contracts, partially reversing the previous build.
WTI keeps targeting $95.00
Prices of the WTI rose sharply on Tuesday amidst rising open interest. That said, extra gains appear in store for crude oil, with the next target of note at the $95.00 region per barrel in the near term.
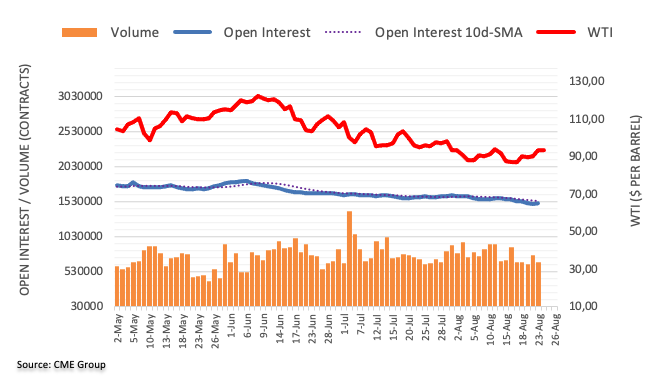
-
06:35
AUD/USD advances after picking bids to near 0.6900, focus is on US Durable Goods Orders
- AUD/USD is aiming to reclaim its tree-day high at 0.6960 amid a downbeat consensus for US data.
- The US private sector has become a victim of delayed response by the Fed on inflation.
- Investors have ignored the dismal performance of the Australian PMI.
The AUD/USD pair has witnessed a firmer rebound after correcting to near the critical support of 0.6900 in the early European session. The asset is advancing confidently and is expected to reclaim its three-day high above 0.6960 as the US dollar index (DXY) has trimmed its gains after facing barricades around 108.80.
The DXY is likely to remain volatile as investors are awaiting the release of the US Durable Goods Orders data. According to the preliminary estimates, the economic data could tumble to 0.6% against the prior release of 2%. Also, the dismal US Purchasing Managers Index (PMI) data released on Tuesday supports the poor forecasts for Durable Goods orders.
The investing community is aware of the fact that the foremost priority of the Federal Reserve (Fed) is to bring price stability to the economy. And, in order to address the same, the Fed has already stepped up its interest rates to 2.25-2.50% in its last four monetary policy meetings. Investors believe that the Fed has remained laggard in dealing with ramping up inflation. And, the US private sector has become a victim of the Fed's leniency. Well, the Fed is still sticking to its velocity of hiking interest rates and the market participants must not upgrade growth forecasts for a while.
On the antipodean front, aussie bulls are displaying a decent performance despite the downbeat Australian PMI numbers. The S&P Global Manufacturing PMI slipped sharply to 54.5 vs. expectations of 57.3 and the prior release of 55.7. While the Services PMI data landed lower to 49.6 against the forecasts of 54 and the former figure of 50.9.
-
06:33
GBP/USD now points to some consolidation – UOB
GBP/USD is now seen navigating the 1.1720-1.1930 range in the next few weeks, suggested FX Strategists at UOB Group Lee Sue Ann and Quek Ser Leang.
Key Quotes
24-hour view: “We highlighted yesterday that ‘downward momentum has waned a tad’ and we were of the view that GBP ‘could dip below the major support at 1.1730 but it is unlikely able to maintain a foothold below this level’. While GBP subsequently dipped below 1.1730 (low of 1.1718), the outsized bounce from the low came as a surprise (high has been 1.1878). The rebound appears to be running ahead of itself and GBP is unlikely to advance much further. For today, GBP is more likely to trade sideways within a range of 1.1760/1.1885.”
Next 1-3 weeks: “After GBP dropped to 1.1744, we highlighted yesterday (24 Aug, spot at 1.1765) that despite the decline, downward momentum has not improved by much. We held the view that there is scope for GBP to edge lower towards 1.1680. GBP subsequently dipped to 1.1718 before rebounding strongly to take out our ‘strong resistance’ at 1.1875 (high of 1.1878). The breach of the ‘strong resistance’ indicates that GBP is unlikely to weaken further. The current movement is viewed as part of a consolidation phase and GBP is likely to trade between 1.1720 and 1.1930 for now.”
-
06:33
Steel price edges higher amid mixed clues from China
- Steel price remains steady around weekly peak amid sluggish session.
- US dollar pullback, hopes of China stimulus favor buyers.
- Expectations for more output from India, recession fears and hardships for Chinese steel manufacturers weigh on prices.
Steel price remain mildly bid around a one-week high, flashed the previous day. It’s worth noting that the hopes of more stimulus from China and the US dollar pullback underpin the latest rebound in the metal prices even as the recession woes challenge the bulls.
With this, the most active steel rebar contract on the Shanghai Futures Exchange (SFE) rise 0.50% while the hot-rolled coil rose 1.4%. Further, stainless steel climbed 0.4% to 15,430 yuan a tonne at the latest.
China’s readiness to battle the recession woes with a heavy injection of funds seems to have favored the latest optimism among the metal buyers. “More measures from China to support its beleaguered property sector lent further support. China on Monday cut benchmark lending rates and lowered the mortgage reference by a bigger margin to boost its economy hurt by COVID-19 outbreaks and a property crisis,” said Reuters.
On the other hand, Reuters also mentioned that the longer-term outlook remained cloudy as a resurgence of COVID-19 cases and a slowdown in the global economy continued to weigh on steel demand.
It should be noted that the US Dollar Index (DXY) retreats from its intraday high as traders await the US Durable Goods Orders for July, expected 0.6% versus 2.0% prior, for fresh impulse. Also likely to have weighed on the greenback could be the expectations that Fed Chairman Jerome Powell would repeat his attempt to tame hawks during Friday’s speech at the Kansas City Fed’s symposium in Jackson Hole.
Elsewhere, recession fears in Europe, mainly due to the energy crisis, joins India’s hopes of becoming the world’s top steel producer seem to exert downside pressure on the steel price.
-
06:23
Gold Futures: Further rebound looks likely
Open interest in gold futures markets resumed the upside on Tuesday, this time by just 504 contracts according to preliminary readings from CME Group. Volume, instead, reversed two consecutive daily builds and shrank by just 642 contracts.
Gold: Initial hurdle comes at $1,775
Gold prices regained some poise and reversed six consecutive sessions with losses on Tuesday, retesting the $1,750 region. The rebound was accompanied by a small uptick in open interest, which is indicative that the current bounce could extend further in the very near term. That said, the next up barrier comes at the 55-day SMA, today at $1,775 per ounce troy.
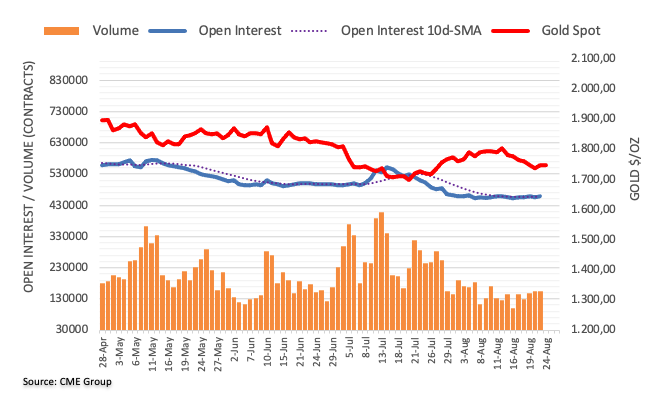
-
06:15
EUR/USD: Downside pressure alleviated above 1.0035 – UOB
FX Strategists at UOB Group Lee Sue Ann and Quek Ser Leang noted the current weakness in EUR/USD could mitigate above 1.0035 level.
Key Quotes
24-hour view: “We highlighted yesterday that ‘further EUR decline is likely’ and indicated ‘the next support is at 0.9980 (minor support is at 0.9900)’. EUR subsequently tested the minor support (low of 0.9899), rebounded strongly to 1.0018 before pulling back to end the day at 0.9967 (+0.26%). Downward pressure has eased and this coupled with oversold conditions suggests EUR has likely moved into a consolidation phase. In other words, EUR is likely to trade sideways for today, expected to be between 0.9920 and 1.0010.”
Next 1-3 weeks: “Yesterday (23 Aug, spot at 0.9935), we highlighted that solid momentum is likely to lead to further EUR weakness. We indicated the levels to focus on are 0.9870 and 0.9830. EUR subsequently dropped to 0.9899 before staging a surprisingly robust rebound (high of 1.0018). Shorter-term downward momentum has waned but there is still room for EUR to weaken. Only a breach of 1.0035 (no change in ‘strong resistance’ level from yesterday) would indicate that the EUR weakness that started last week has run its course. Meanwhile, oversold conditions could lead to a couple of days of consolidation first.”
-
06:07
USD/JPY Price Analysis: Retreats towards 136.00 but far from bear’s reach
- USD/JPY takes offers to refresh intraday low during a two-day pullback from monthly high.
- Fortnight-old ascending trend line, 61.8% Fibonacci retracement level limit further declines.
- 200-SMA, five-week-long horizontal support appears a tough nut to crack for bears.
- Monthly high guards recovery moves ahead of July’s peak.
USD/JPY portrays a two-day downtrend, after refreshing the monthly peak, as it refreshes the daily low around 136.35 heading into Wednesday’s European session.
In doing so, the yen pair traces the pullback in RSI (14) and the bearish MACD signals to keep intraday sellers hopeful.
However, an upward sloping support line from August 11, near 136.15, restricts the immediate downside of the pair.
Following that, the 61.8% Fibonacci retracement level of the July-August south-run, near the 136.00 threshold.
It’s worth noting, however, that a convergence of the 200-SMA and a horizontal area comprising multiple levels marked since July 22, around 135.60-70, seems the notable challenge for USD/JPY bears.
Meanwhile, recovery moves may initially aim for the daily high surrounding the 137.00 round figure before challenging the monthly peak marked the previous day near 137.65.
In a case where USD/JPY bulls keep reins past 137.65, the late July swing high near 138.90 and the previous monthly top near 139.40 could probe buyers targeting the 140.00 psychological magnet.
USD/JPY: Four-hour chart
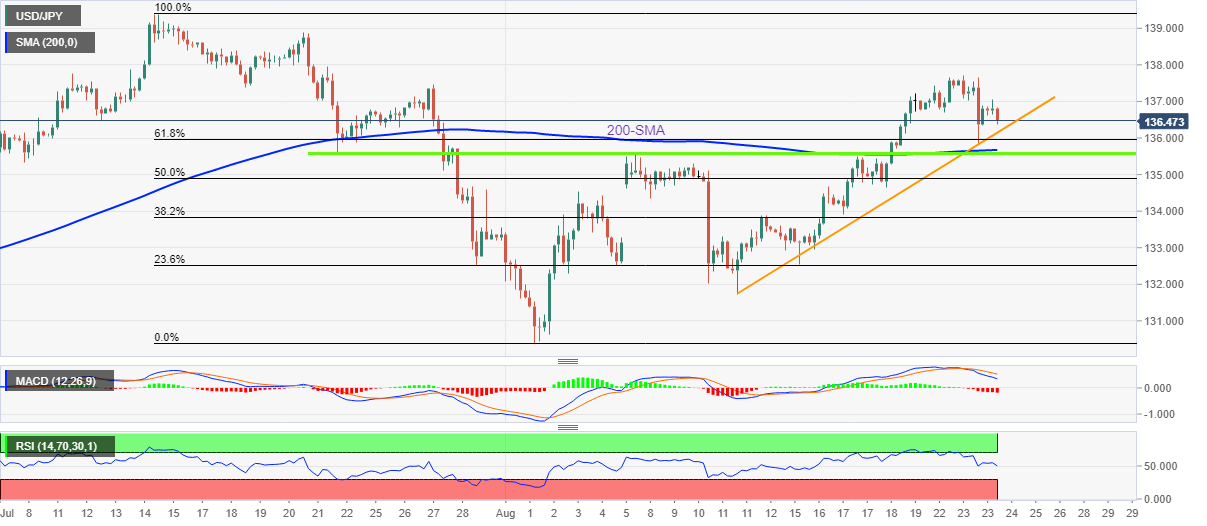
Trend: Recovery expected
-
06:07
Asian Stock Market: Declines on dismal global PMIs, oil stabilizes above $93.00
- Asian stocks are facing the heat of poor global PMIs.
- A massive decline in the US Services PMI has trimmed the global IT forecasts.
- Oil prices have advanced sharply led by the production cut announcement by OPEC.
Markets in the Asian domain have witnessed a decent sell-off as investors have turned cautious after the release of the weak Purchasing managers Index (PMI) data by Western leaders. The contraction of the private sector in various economies after a spree of rate hikes by Western central banks has forced the market participants to stick to growth stocks in order to combat the turbulence.
At the press time, Japan’s Nikkei225 eased 0.47%, China A50 surrendered 0.58%, and Hang Seng plummeted 1.45%. However, Nifty50 has defended the downside momentum and has turned flat after a weak opening.
A meaningful contraction in the US economic activities has created havoc in the global economy. The US Services PMI has contracted dramatically to 44.1 against the forecast of an expansion to 49.2 and the prior release of 47.3. Also, the Manufacturing PMI has contracted to 51.3 from the estimates of 52 and the prior release of 52.2. What is worrisome for the global economy is the dramatic decline in Services activities. This has trimmed the forecast for the global IT sector substantially as the US outsources its substantial IT services from Asia.
Meanwhile, rising oil prices after the commentary from OPEC that the cartel is considering a decent production cut in oil to offset the recent decline has dampened the market sentiment. For OPEC, lower prices are always an imbalance as it scales down their revenues and higher prices are optimal. The oil prices have established above $93.00 and more upside seems possible.
-
05:43
USD/CAD rebound approaches 1.2900 amid hawkish Fedspeak, softer oil price
- USD/CAD grinds higher to pare the biggest daily loss in two weeks.
- Fed’s Kashkari favors hawkish bets despite softer US data.
- Oil prices retreat amid concerns surrounding OPEC+, Iran.
- Yields, stock futures retreat as traders await US Durable Goods Orders, Powell’s Jackson Hole speech.
USD/CAD consolidates the biggest daily slump in a fortnight as it seesaws near the daily top, up 0.20% around 1.2980 during early Wednesday morning in Europe. In doing so, the Loonie pair tracks the firmer US dollar, as well as the softer oil prices, amid a sluggish session ahead of the US Durable Goods Orders for July.
US Dollar Index (DXY) poked the multi-year high the previous day before reversing from 109.27, up 0.12% near 108.66 by the press time. That said, the fears of economic slowdown and the US Federal Reserve’s (Fed) aggressive rate hikes are the main factors that could have favored the DXY bulls even if the latest weakness in the US data triggered the quote’s pullback.
The preliminary readings of the US S&P Global Manufacturing PMI for August eased to 51.3 versus 52.0 expected and 52.2 prior while the Services gauge plunged to 44.1 from 47.3, compared to 49.2 market forecasts. According to S&P Global, the US economy is also in trouble as the Composite PMI shrank to 45, its lowest in 27 months. Furthermore, the US New Home Sales for July dropped to the lowest levels in six years, to 0.511M from 0.585M prior and 0.575M market forecasts. Furthermore, the US Richmond Fed Manufacturing Index for August dropped to -8.0 compared to the 0.0 previous reading.
Recently, Minneapolis Fed President Neel Kashkari mentioned that the biggest fear is that we are misreading underlying inflation dynamics, per Reuters. The policymaker also added that the Fed can relax on rate hikes when compelling evidence of CPI heading toward 2% is seen. Comments from Fed’s Kashkari tamed concerns that Fed Chair Powell would go slow on rate hikes while speaking at the Jackson Hole on Friday, as backed by Goldman Sachs.
Elsewhere, WTI crude oil drops 0.40% intraday to $93.30 at the latest, snapping a two-day uptrend near the fortnight high. In addition to the firmer US dollar, easing calls of the Organization of the Petroleum Exporting Countries and allies, a group known as OPEC+, group’s production cuts appear the main catalyst for the black gold’s latest weakness. The energy bull’s retreat could also be linked to the impending return of Iran to the oil markets.
Amid these plays, US 10-year Treasury yields remain mostly steady around 3.05%, after rising to the highest in a month the previous day. That said, Wall Street benchmarks closed with mild gains and directed the S&P 500 Futures to follow the path by the press time, down 0.33% intraday.
Moving on, USD/CAD traders should pay attention to the US Durable Goods Orders for July, expected 0.6% versus 2.0% prior, for fresh impulse. However, major attention should be given to Friday’s speech by Fed Chairman Jerome Powell at the Kansas City Fed’s symposium in Jackson Hole.
Technical analysis
A two-week-old support line, near 1.2950, defends USD/CAD buyers trying to mark another battle with the key horizontal resistance area surrounding 1.3080.
-
05:27
EUR/USD remains sideways around a potential cushion at 0.9950, US Durable Goods Orders buzz
- EUR/USD is juggling around 0.9950 as investors await US Durable Goods Orders data.
- The potential German energy crisis has put the shared currency bulls on the tenterhooks.
- The US Durable Goods Orders are expected to trim to 0.6% vs. 2% recorded earlier.
The EUR/USD pair is displaying back and forth moves in a narrow range of 0.9944-0.9956 in the Asian session. The asset has turned sideways after a decent correction from above the magical figure of 1.0000. Considering a broader context, the downside for the EUR/USD pair remains favored. Earlier, the asset rebounded firmly after printing a fresh two-decade low near 0.9900 as German Purchasing Managers Index (PMI) displayed a mixed performance in spite of vulnerable consensus.
The US dollar index (DXY) is displaying a lackluster performance after a firmer rebound from Tuesday’s low at 108.36. The asset has regained strength despite a serious contraction in the private sector. US PMI contracted dramatically led by mounting interest rates by the Federal Reserve (Fed). However, the DXY has still regained strength as the Fed will continue its path of hiking interest rates with similar velocity despite the headwinds of contraction in economic activities.
Going forward, the entire focus of the market participants will remain on the US Durable Goods Orders data. The economic data is expected to contract to 0.6% from the prior release of 2%. This also indicates a decline in the overall demand in the US economy and may result in more pressure on the US dollar index (DXY).
However, the shared currency bulls are worried over the potential energy crisis in Germany. A three-day unscheduled cut-off of energy supplies for maintenance of Nord Stream 1 pipeline could accelerate the already imbalance in the demand-supply mechanism. Germany is a core member of the European Union (EU) and a situation of energy crisis in the aforementioned zone will have a significant impact on the Eurozone.
-
05:13
German Economist: War hit to economy will last years
The economic impact on Germany of Russia's invasion of Ukraine will last years, influential economist Marcel Fratzscher of the German Institute for Economic Research told Reuters, adding that it could cost 3 percentage points of growth this year. It’s worth noting that the institute advises the government of Europe's largest economy on macroeconomic policy.
Key quotes
The war in Ukraine has done massive damage to the German economy.
Perhaps only 1.5% would remain of the 4.5% economic growth he had expected at the start of the year.
Unions aren't as strong as they were in the 1970s.
This year's forecast wage growth of 4.5% was well short of inflation at some 8%.
Even in coming years I see no sign of us falling into a wage spiral.
EUR/USD remains pressured
The news exerts additional downside pressure on EUR/USD prices, down 0.22% around 0.9950.
Also read: EUR/USD bears attack 0.9950 ahead of US Durable Goods Orders, Jackson Hole
-
05:06
GBP/USD ignores hawkish BOE bets around 1.1800, US data, Jackson Hole eyed
- GBP/USD reverses the bounce off 2.5-year low, pressured around intraday bottom.
- Money market bets hint at 4.0% BOE rate in March, from 1.75% currently.
- UK data appeared comparatively better than the US ones but Sunak’s defense of BOE appear to favor bears.
- Recession woes, hawkish Fedspeak adds strength to the downside bias.
GBP/USD holds lower ground near 1.1800 during early Wednesday morning in Europe, following a failed attempt to recover from the yearly low the previous day. In doing so, the cable pair traces the broad US dollar strength while paying a little heed to the hawkish market bets on the Bank of England’s (BOE) next move.
“The money markets are pricing in the likelihood that the base rate, which currently stands at 1.75 percent, will have reached about 4 percent by March, according to data compiled by Refinitiv,” reported The UK Times. The news also adds that the money market bets mark a sharp readjustment of the market’s rate expectations as inflation continues to surge.
It should be noted that the UK’s preliminary readings of August month PMIs flashed mixed readings as the Manufacturing gauge slumped to 46.00 versus 51.1 forecasts and 52.1 prior while the Services PMI improved to 52.5 versus 52.0 expected and July’s final score of 52.6.
Also, the latest survey results from the Confederation of British Industry (CBI) of trends in British manufacturing showed that the Manufacturing Order Book Balance dropped to -7 in August, the first negative reading since April 2021, from +8 in July and +3 of market expectations.
Elsewhere the comments from ex-Chancellor Rishi Sunak, suggesting less push for the Bank of England (BOE) seemed to have eased the pressure off the GBP/USD and seemed to have favored sellers of late. “Rishi Sunak has suggested that Liz Truss would "spook" international investors if she threatened the independence of the Bank of England,” per The Guardian.
On the other hand, traders in fed funds futures are pricing in a 52.5% chance of a 75 basis-point (bps) rate hike at the Fed meeting next month. On Monday the odds favored a slightly better-than-even chance of a 50 bp hike in September, per Reuters.
Recently, Minneapolis Fed President Neel Kashkari mentioned that the biggest fear is that we are misreading underlying inflation dynamics, per Reuters. The policymaker also added that the Fed can relax on rate hikes when compelling evidence of CPI heading toward 2% is seen. Comments from Fed’s Kashkari tamed concerns that Fed Chair Powell would go slow on rate hikes while speaking at the Jackson Hole on Friday, as backed by Goldman Sachs.
On Tuesday, preliminary readings of the US S&P Global Manufacturing PMI for August eased to 51.3 versus 52.0 expected and 52.2 prior while the Services gauge plunged to 44.1 from 47.3, compared to 49.2 market forecasts. According to S&P Global, the US economy is also in trouble as the Composite PMI shrank to 45, its lowest in 27 months. Furthermore, the US New Home Sales for July dropped to the lowest levels in six years, to 0.511M from 0.585M prior and 0.575M market forecasts. Furthermore, the US Richmond Fed Manufacturing Index for August dropped to -8.0 compared to the 0.0 previous reading.
Against this backdrop, US 10-year Treasury yields remain mostly steady around 3.05%, after rising to the highest in a month the previous day. That said, Wall Street benchmarks closed with mild gains and directed the S&P 500 Futures to follow the path by the press time.
Looking forward, a light calendar may restrict GBP/USD moves ahead of the US Durable Goods Orders for July, expected 0.6% versus 2.0% prior. However, major attention should be given to Friday’s speech by Fed Chairman Jerome Powell at the Kansas City Fed’s symposium in Jackson Hole.
Technical analysis
GBP/USD approaches 1.1790 before challenging the latest lows near 1.1720-15. Following that, the weekly channel’s support line and the lower line of the longer-term trend channel, respectively near 1.1660 and 1.1615, will be crucial supports to watch during the GBP/USD pair’s further weakness. Meanwhile, upside momentum remains elusive until the quote stays below the 1.2200 hurdle, comprising the upper line of the downward sloping trend channel from mid-May.
-
04:56
Fed: September could be the last of the outsized hikes – JP Morgan
Analysts at JP Morgan appear sceptical over the US Dollar’s further upside as they hint at slowing of the Federal Reserve (Fed) rate hike. The US bank also mentioned that the US dollar moves relies heavily on the Fed call.
Key quotes
Over the past few quarters Fed has consistently surprised by its hawkishness, and consequently the USD was strong.
We expect the Fed to become more sensitive to softer activity dataflow now that they have moved policy rates above what was historically considered as neutral.
We note the signs of peaking inflation, and of inflation forwards. Brent is sub 100, and it has historically strongly correlated with inflation breakevens.
Also read: US Dollar Index looks to regain 109.00 ahead of US Durable Goods Orders, Jackson Hole
-
04:40
USD/INR Price Analysis: Rising wedge, RSI retreat tease Indian rupee buyers around 79.80
- USD/INR holds lower ground inside bearish chart pattern.
- RSI signals that bulls are running out of steam around record high.
- 200-SMA can offer an intermediate halt, 80.20 appears key upside hurdle.
USD/INR remains pressured for the third consecutive day after reversing from the monthly high, depressed around 79.82 during Wednesday’s Asian session.
In doing so, the Indian rupee (INR) pair portrays the buyer’s lack of conviction inside a three-week-old rising wedge bearish chart pattern. Also keeping the USD/INR sellers hopeful is the RSI (14) that retreats from the overbought territory.
That said, the quote’s latest weakness aims for the 200-SMA level support of 79.58 before challenging the lower line of the stated wedge, around 79.50.
Should the USD/INR pair remains weak past 79.50, it confirms (theoretically) the south-run towards 77.70. However, multiple swing lows around the 79.00 threshold and the monthly bottom surrounding 78.40 could offer intermediate halts during the anticipated fall.
Meanwhile, recovery moves the main aim for the 80.00 psychological magnet before challenging the latest high near 80.10.
Even so, the USD/INR pair’s upside momentum remains elusive until the quote stays inside the aforementioned rising wedge.
If at all the quote defies the bearish formation by crossing the 80.20 hurdle, the odds of its rally can’t be ruled out.
USD/INR: Four-hour chart
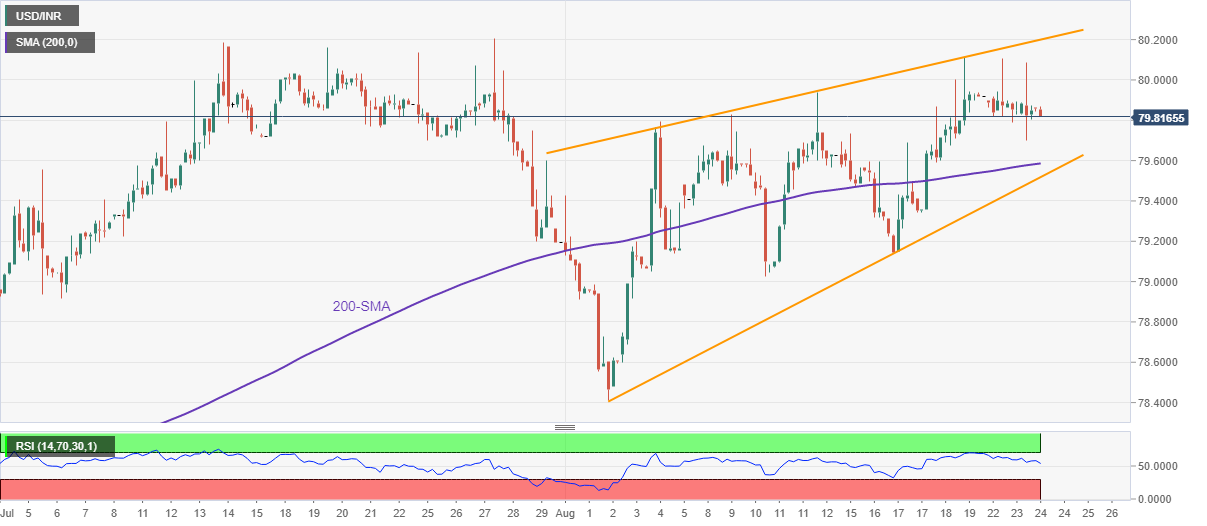
Trend: Pullback expected
-
04:34
Gold Price Forecast: XAU/USD corrects to near $1,740 as DXY advances, US Durable Goods Orders eyed
- Gold price has slipped to near $1,740 as the DXY has recovered a majority of Tuesday’s losses.
- The US private sector has contracted sharply led by higher velocity in hiking interest rates by the Fed.
- The US Durable Goods Orders data is seen lower at 0.6% than the former release of 2%.
Gold price (XAU/USD) is going through a corrective mode after failing to sustain above the critical hurdle of $1,750.00. The precious metal has witnessed a short-live correction as the US dollar index (DXY) has managed to recover more than half of its entire losses recorded on Tuesday after the release of the downbeat US Purchasing Managers Index (PMI). The DXY has climbed to near 108.80 after printing a low of 108.36.
The downbeat US PMI is the consequence of the adaptation of a higher pace in hiking interest rates by the Federal Reserve (Fed). Activities of the private sector are contracting dramatically led by the unavailability of cheap money for investment in multiple projects. Lack of liquidity due to higher interest rates has forced them to go with ultra-filtered investments only. Also, the corporate sector is not operating at full production capacities amid expectations of a decline in the overall demand ahead.
In today’s session, the US Durable Goods Orders will hog the limelight. According to the market consensus, the economic data is likely to land at 0.6%, lower than the prior release of 2%. As price pressures are higher in the US economy and the value of paychecks for households is trimming sharply, investors have surrendered the demand for durable goods for a while.
Gold technical analysis
Gold prices are attempting to sustain above the 50% Fibonacci retracement (placed from July 21 low at $1,680.91 to August 10 high at $1,807.93) at $1,744.42. The precious metal is dealing with the 20-period Exponential Moving Average (EMA) at $1,746.64 for now. However, the 50-EMA at $1,757.70 is still declining.
Meanwhile, the Relative Strength Index (RSI) (14) has shifted into the neutral range of 40.00-60.00 from the bearish range of 20.00-40.00. But that doesn’t warrant that the impact of bears has faded.
Gold four-hour chart
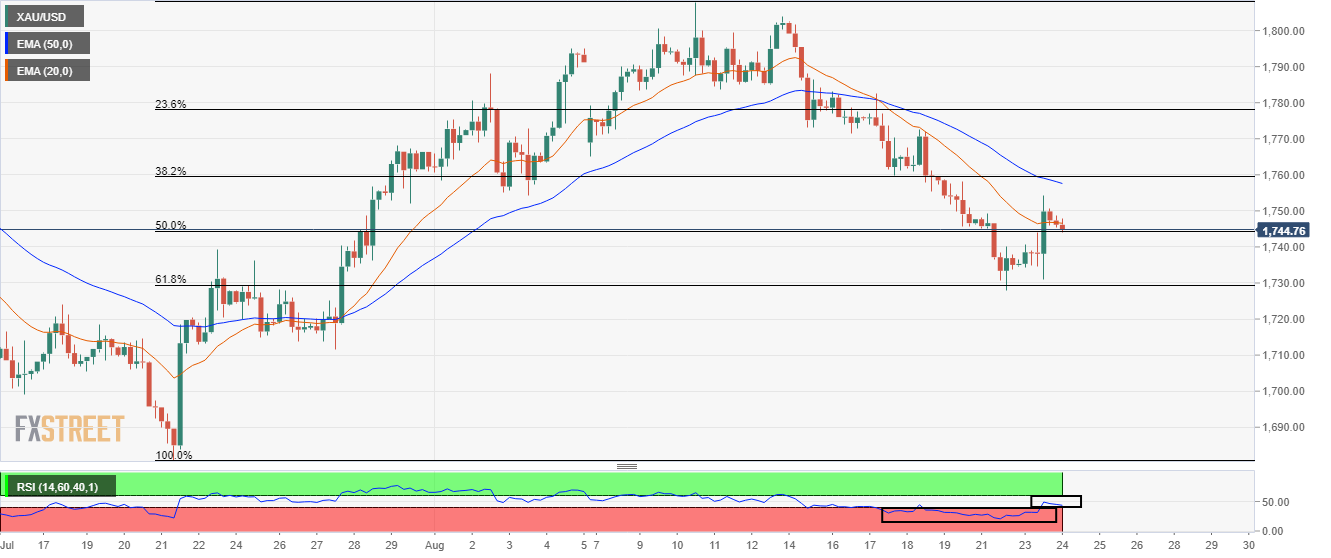
-
03:57
EUR/GBP finds a cushion at around 0.8420 despite a potential German energy crisis ahead
- EUR/GBP has picked bids around 0.8420, however, the bullish reversal seeks more evidence.
- Gas supply cut-off to Germany due to unscheduled maintenance has soared fears of a German energy crisis.
- A fresh forecast for UK CPI at 18% has created havoc for BOE policymakers.
The EUR/GBP pair has attempted a rebound after concluding the downside move to near 0.8412 in the Tokyo session. The shared currency bulls are defending further downside despite soaring expectations of a potential German energy crisis ahead.
Investors should be aware of the fact that Russia will halt natural gas supplies to Europe for the last three days of August to run the unscheduled maintenance under the Baltic Sea to Germany. The unexpected natural gas supply cut to Germany from Nord Stream 1 pipeline will shore up the imbalance in the energy demand-supply mechanism. Also, the arrival of the winter season in Germany will scale up the energy demand. And, more supply issues in an already vulnerable German energy market may accelerate a sell-off in the shared currency.
A supportive move in the cross also banks upon mixed German Purchasing Managers Index (PMI) data. The Manufacturing PMI landed better than expectations and the prior release at 49.8. However, the Services PMI contracted to 48.2 against the forecast of 49 and the former release of 49.9.
On the pound front, rising tensions over soaring price pressures are likely to force the market participants to dump sterling. The inflation rate in the UK zone is still at par with a four-decades high at 10.1%. Now, analysts from US Bank Citi Have come forward with fresh forecasts for British consumer price inflation that it is set to peak at 18% in early 2023. Price pressures in the UK zone are not getting contained and are creating havoc for the Bank of England (BOE) policymakers.
-
03:39
China: Economic outlook remains constructive – JP Morgan
Analyts at JP Morgan note that they maintain their constructive outlook on the Chinese economy, citing four key reasons.
“1. Chinese money supply is moving up ... and credit impulse is improving. This has historically been key for the Chinese activity momentum.
2. More policy stimulus is likely, in order to deliver "stability.” Our economists are looking for an acceleration in government incentives to boost infrastructure FM in 3Q, on top of the rate cuts and tax rebates seen recently.
3. The COVID situation remains highly uncertain, but there is a potential for restrictions to ease further.
4. Base effects are very easy in 2H, as 2nd half of last year has been hit by multiple shocks. This will add to the perception that the Chinese growth momentum is turning higher.”
-
03:30
Commodities. Daily history for Tuesday, August 23, 2022
Raw materials Closed Change, % Silver 19.111 0.56 Gold 1748.33 0.72 Palladium 1981.09 -0.59 -
03:29
Copper price declines on economic woes, ignores demand-supply matrix
- Copper price retreats from two-month high amid recession fears, firmer US dollar.
- ICSG data hints at copper market deficit, increase in bonded stocks’ deficit in China.
- US Durable Goods Orders could entertain traders ahead of Friday’s Jackson Hole speech from Fed’s Powell.
Copper price takes a U-turn after refreshing the monthly high the previous day as recession fears supersede the demand-supply statistics during Wednesday’s Asian session. That said, the red metal also bears the burden of the market’s hopes of the Fed’s aggression, as well as of the doubts surrounding China’s economic recovery.
Copper futures on COMEX drop half a percent to $3.66 by the press time, after rising to the two-month high of $3.73 the previous day. That said, the prices of the most active three-month copper contract on the London Metal Exchange (LME) dropped 0.65% to $8,027.
On late Tuesday, the International Copper Study Group (ICSG) released monthly statistics on the market supply and demand as it said, “The global refined copper market showed a 66,000 tonnes deficit in June, compared with a 30,000 tonnes deficit in May.” The news also mentioned that the first 6 months of the year, the market was in a 72,000 tonnes deficit compared with a 130,000 tonnes deficit in the same period a year earlier, the ICSG said.
It should be noted that the bonded stocks of copper in China showed a 66,000 tonnes deficit in June compared with a 34,000 tonnes deficit in May whereas the global refined copper output in June was 2.17 million tonnes, versus the consumption of 2.23 million tonnes.
Although market data favors copper buyers, fears of economic slowdown, especially concerning the world’s largest industrial player China, exert downside pressure on the metal prices. Bloomberg recently came out with an analysis portraying the Chinese yuan’s fall as another worry for the dragon nation. “The Chinese yuan’s slump to its weakest against the dollar in almost two years adds to what is already a precarious balancing act for Beijing, which is seeking ways to prop up its struggling economy without stoking financial instability,” said the piece.
On a different page, Minneapolis Fed President Neel Kashkari mentioned that the biggest fear is that we are misreading underlying inflation dynamics, per Reuters. The policymaker also added that the Fed can relax on rate hikes when compelling evidence of CPI heading toward 2% is seen. Comments from Fed’s Kashkari tamed concerns that Fed Chair Powell would go slow on rate hikes while speaking at the Jackson Hole on Friday, as backed by Goldman Sachs.
Previously, the August month’s downbeat preliminary activity data for the key global economies renewed recession fears and probed the copper buyers.
Moving on, copper traders will pay attention to Friday’s speech by Fed Chairman Jerome Powell at the Kansas City Fed’s symposium in Jackson Hole, as well as chatters surrounding China, for fresh impulse.
-
03:07
AUD/USD Price Analysis: Bears flex muscles to revisit 0.6850 support
- AUD/USD remains pressured around intraday low, reverses the previous day’s rebound from monthly bottom.
- Multiple swings around 61.8% Fibonacci retracement level highlight 0.6850 as the key support.
- Short-term bearish channel, pullback from 200-EMA also keep sellers hopeful.
AUD/USD sellers attack 0.6900 while consolidating the bounce off the monthly low during Wednesday’s Asian session.
The Aussie pair remains inside a one-week-old bearish channel, after taking a U-turn from the 200-EMA. Additionally favoring the pair sellers is the RSI (14) retreat.
With this, the AUD/USD bears again prepare to break the 0.6850 support area comprising multiple levels marked since July 18, as well as 61.8% Fibonacci retracement of July-August upside.
Following that, the aforementioned channel’s lower line, near 0.6790, could act as an intermediate halt before directing the bears towards the previous monthly low near 0.6680.
Alternatively, recovery moves need to defy the bearish channel formation with a clear upside break of 0.6940, as well as stay beyond the 200-EMA level of 0.6952, to convince AUD/USD buyers.
That said, the 0.7000 psychological magnet and the month-start peak of 0.7048 will gain the market’s attention afterward. However, the monthly peak of 0.7137 appears a tough nut to crack for the AUD/USD bulls afterward.
AUD/USD: Four-hour chart
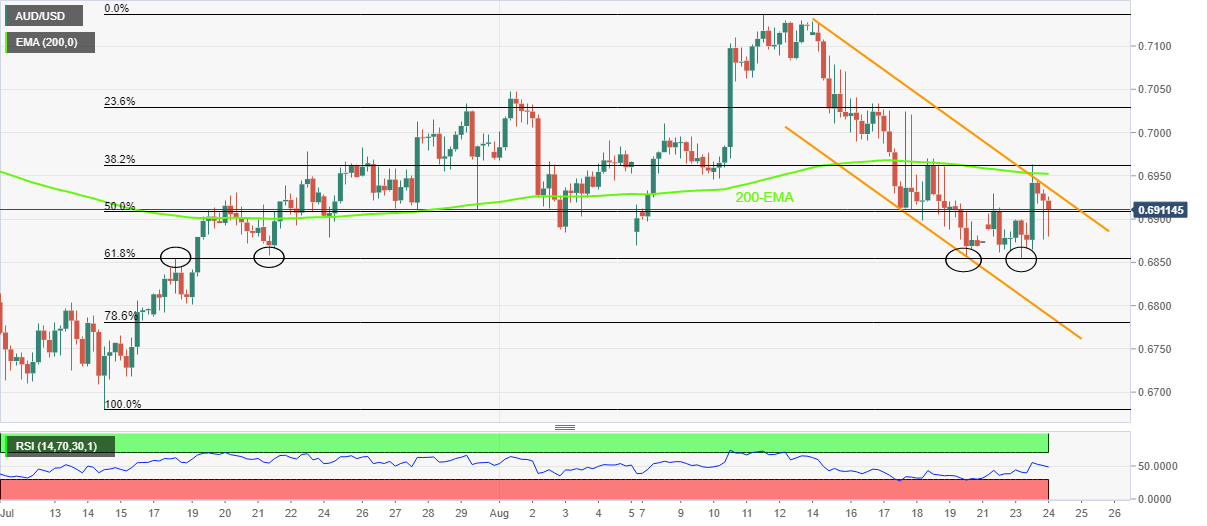
Trend: Further weakness expected
-
03:03
USD/CNH Price Analysis: The bulls are moving in on key breakout level
- USD/CNH is in a state of consolidation between the key levels.
- The price needs of break out of 6.8588 to the downside and 6.8686 to the upside.
It was stated in the prior analysis that the price could be on the verge of a move beyond support levels should the US dollar blow off to the downside. The price came up to form a peak formation and has since plummeted:
USD/CNH H1 chart, prior analysis

Ahead of the Jackson Hole, it was stated that there was time for moves in the markets and a break below 6.8485 could have been a significant turning point in the currency. 6.8600 was marked as a near-term key level on the break of trendline support.
USD/CNH live H1 chart
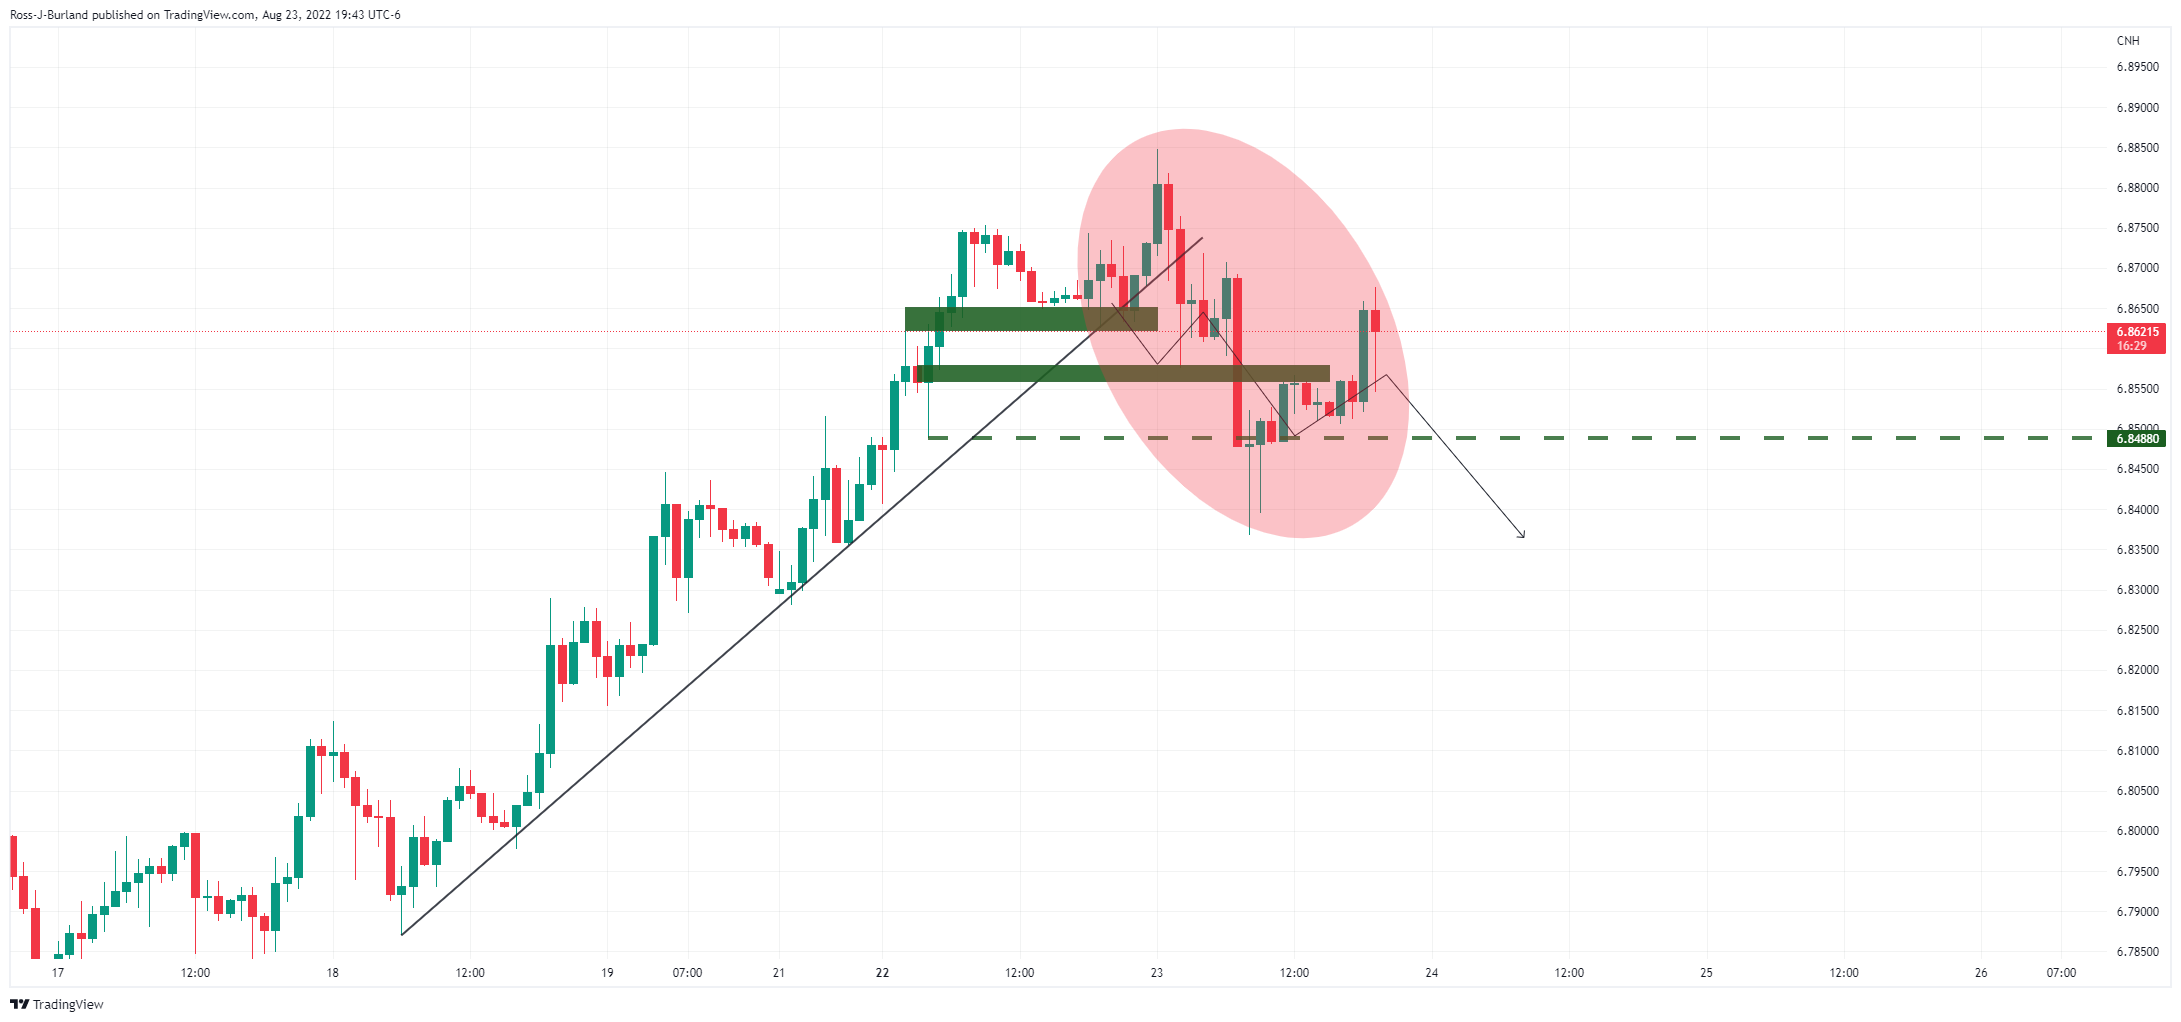
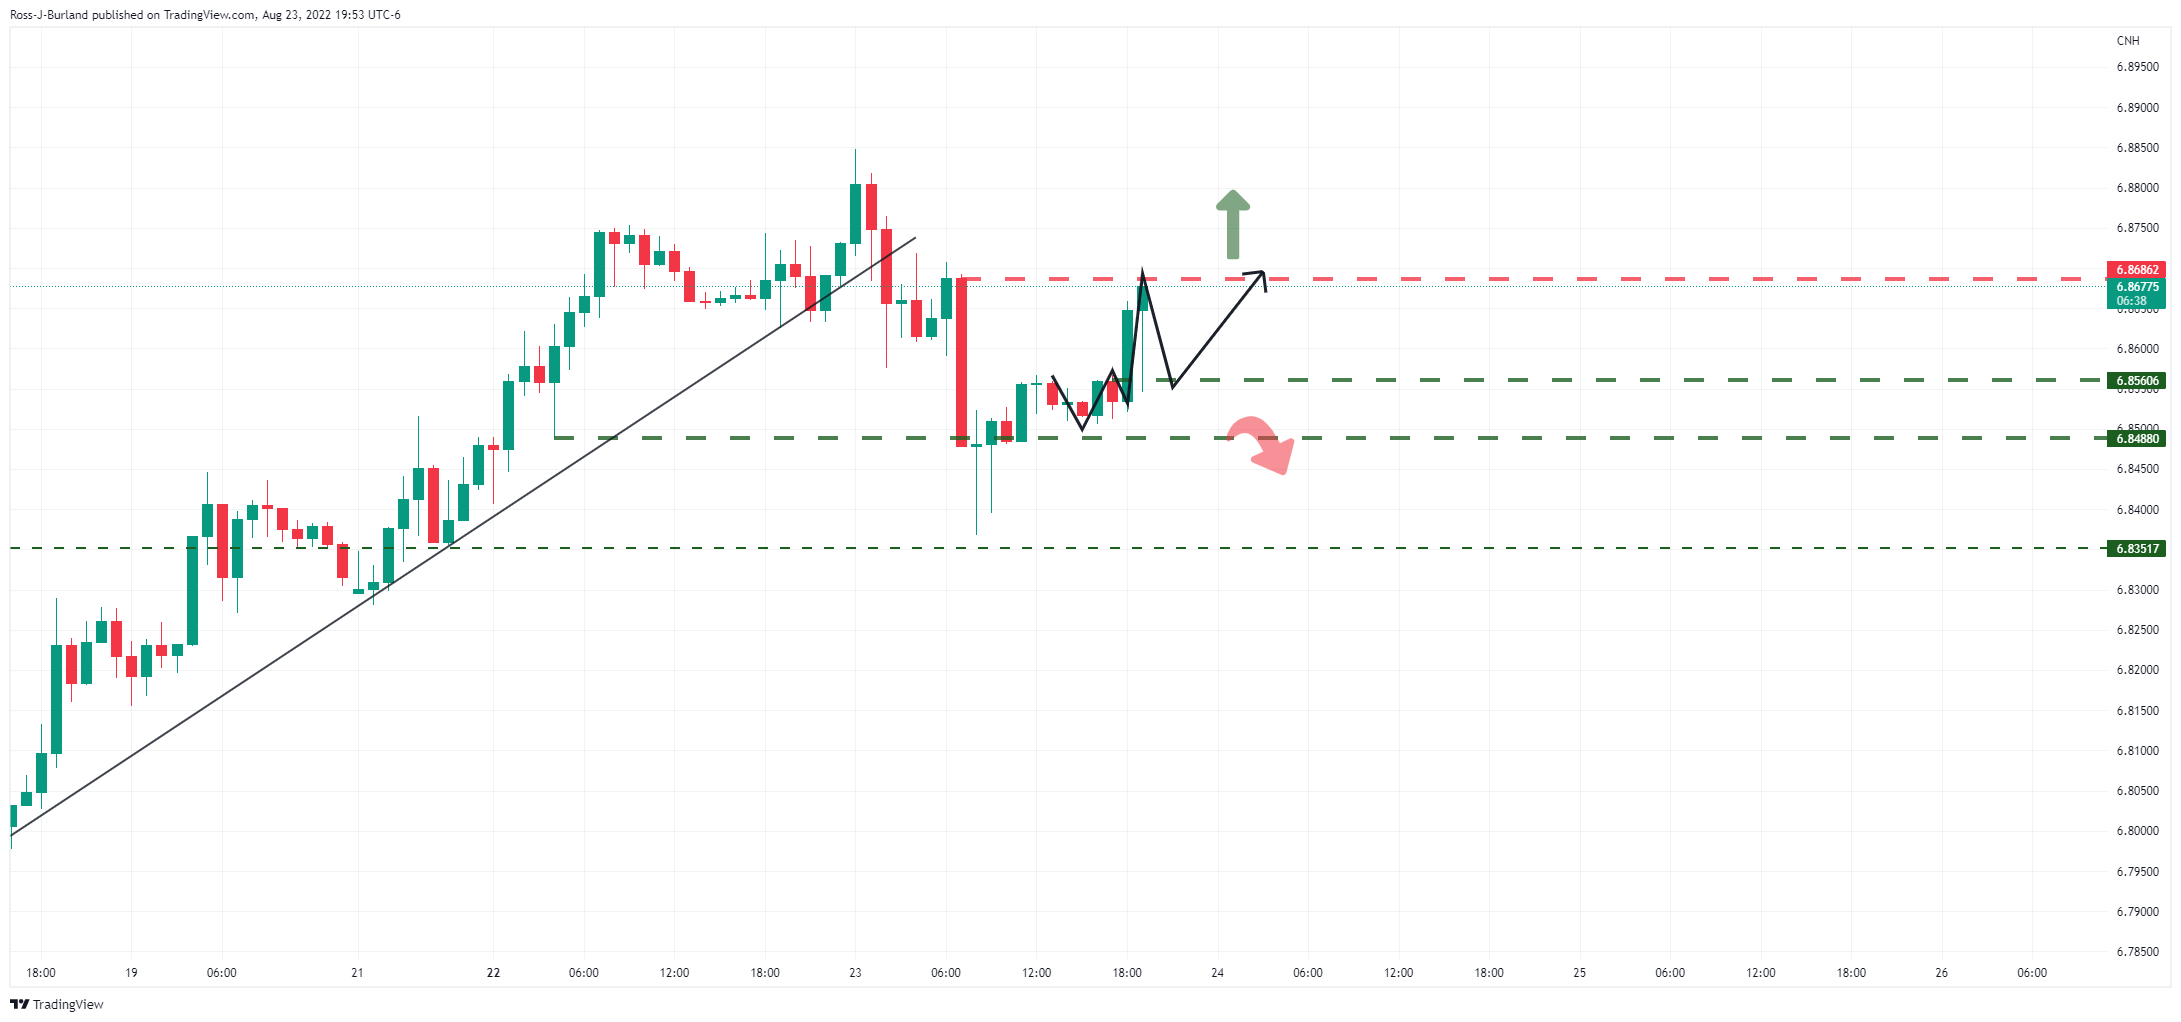
The bulls have moved back in and the key structure levels are marked on the hourly chart above. 6.8588 to the downside is key while 6.8686 to the upside guards a break and restest of recent highs.
-
02:45
S&P 500 Futures, yields portray recession fears as traders await key US data
- Market sentiment remains sour amid a sluggish Asian session.
- Fed’s Kashkari sounds cautiously optimistic to keep hawkish Fed bets intact.
- Yields remain firmer around one-month high, stock futures trace Wall Street.
- US Durable Goods Orders to decorate calendar, Jackson Hole speech will be crucial.
Risk profile remains weak during early Wednesday, after witnessing a volatile day, as traders await top-tier US data amid hawkish hopes from the Federal Reserve. It’s worth noting, however, that the recent market surveys hint at a softer landing for equities and a mixed speech from Fed Chair Jerome Powell at the key Jackson Hole symposium.
While portraying the mood, US 10-year Treasury yields remain mostly steady around 3.05%, after rising to the highest in a month the previous day. That said, Wall Street benchmarks closed with mild gains and directed the S&P 500 Futures to follow the path by the press time.
Recently, Minneapolis Fed President Neel Kashkari mentioned that the biggest fear is that we are misreading underlying inflation dynamics, per Reuters. The policymaker also added that the Fed can relax on rate hikes when compelling evidence of CPI heading toward 2% is seen.
Comments from Fed’s Kashkari tamed concerns that Fed Chair Powell would go slow on rate hikes while speaking at the Jackson Hole on Friday, as backed by Goldman Sachs.
It should be noted that the softer US data also raised concerns over the hawkish Fed bets the previous day. That said, The preliminary readings of the US S&P Global Manufacturing PMI for August eased to 51.3 versus 52.0 expected and 52.2 prior while the Services gauge plunged to 44.1 from 47.3, compared to 49.2 market forecasts. According to S&P Global, the US economy is also in trouble as the Composite PMI shrank to 45, its lowest in 27 months. Furthermore, the US New Home Sales for July dropped to the lowest levels in six years, to 0.511M from 0.585M prior and 0.575M market forecasts. Furthermore, the US Richmond Fed Manufacturing Index for August dropped to -8.0 compared to the 0.0 previous reading.
Even so, traders in fed funds futures are pricing in a 52.5% chance of a 75 basis-point (bps) rate hike at the Fed meeting next month. On Monday the odds favored a slightly better-than-even chance of a 50 bp hike in September, per Reuters.
Other than the Fed concerns and US data, the energy crisis in Europe and doubts over China’s economic health also weigh on the market’s risk profile, which in turn underpins the US dollar’s safe-haven demand. As a result, commodities and Antipodeans witness a downside move after the previous day’s corrective pullback.
Looking forward, a light calendar may restrict market moves ahead of the US Durable Goods Orders for July, expected 0.6% versus 2.0% prior. However, major attention should be given to Friday’s speech by Fed Chairman Jerome Powell at the Kansas City Fed’s symposium in Jackson Hole.
-
02:23
USD/CNY fix: 6.8388 vs. the last close of 6.8367
In recent trade today, the People’s Bank of China (PBOC) set the yuan (CNY) at 6.8388 vs. the last close of 6.8367.
About the fix
China maintains strict control of the yuan’s rate on the mainland.
The onshore yuan (CNY) differs from the offshore one (CNH) in trading restrictions, this last one is not as tightly controlled.
Each morning, the People’s Bank of China (PBOC) sets a so-called daily midpoint fix, based on the yuan’s previous day's closing level and quotations taken from the inter-bank dealer.
-
02:21
NZD/USD Price Analysis: Declines amid barricades around 61.8% Fibo retracement at 0.6220
- Offers pick-up around 61.8% Fibo retracement has weakened the kiwi bulls.
- The 20-period EMA has acted as a major hurdle for the antipodean.
- A downside below 40.00 by the RSI (14) may initiate a fresh selling in the asset.
The NZD/USD pair is falling firmly after surrendering the round-level cushion of 0.6200 in the Asian session. Gains recorded on Tuesday after the release of the dismal US PMI data are majorly vapored in Tokyo and the asset is declining to re-test the monthly low of 0.6156 sooner.
After failing to sustain above the 61.8% Fibonacci retracement (placed from July 14 low at 0.6061 to August 12 high at 0.6468) at 0.6217, kiwi bulls have weakened vigorously. Also, the 20-period Exponential Moving Average (EMA) placed at 0.6210 has acted as a major hurdle for the asset.
The 50-period EMA at 0.6255 is declining sharply, which indicates more downside ahead. On the oscillator front, the Relative Strength Index (RSI) (14) has shifted into the neutral range of 40.00-60.00 from the bearish range of 20.00-40.00. But that doesn’t warrant that the impact of bears is fading. Going forward, a drop below 40.00 will initiate a fresh bearish impulsive wave.
For a fresh downside move, the greenback bulls need to drag the asset below Monday’s low at 0.6156, which will drag the asset towards July 15 low at 0.6115, followed by July 14 low at 0.6061.
Alternatively, a breach of Tuesday’s high at 0.6245 will send the asset towards the August 8 high at 0.6304. A breach of the latter will unleash the kiwi bulls for further upside towards the August 1 high at 0.6353.
NZD/USD four-hour chart
-637969008685054805.png)
-
02:13
EUR/USD bears attack 0.9950 ahead of US Durable Goods Orders, Jackson Hole
- EUR/USD takes offers to renew intraday low, reverses the bounce off multi-year low.
- US data triggered USD pullback, statistics from Germany, Eurozone appeared mixed and helped EUR to pare recent losses.
- Fears of economic slowdown, hawkish Fedspeak weigh on the prices amid sluggish session.
- US data should be watched for proof of recession in the US as Fed policymakers appear cautious.
EUR/USD reverses the previous day’s corrective pullback as it takes offers to renew the intraday low near 0.9950 during Wednesday’s Asian session. In doing so, the major currency pair portrays the market’s rush towards the US dollar in search of risk safety ahead of top-tier data/events. Also keeping the pair sellers hopeful is the hawkish Fedspeak.
That said, the US Dollar Index (DXY) poked the multi-year high the previous day before reversing from 109.27. That said, the fears of economic slowdown and the US Federal Reserve’s (Fed) aggressive rate hikes are the main factors that favor the DXY bulls even if the latest weakness in the US data triggered the quote’s pullback. Also likely to have favored the EUR/USD buyers were the mixed numbers from the bloc.
The preliminary readings of the US S&P Global Manufacturing PMI for August eased to 51.3 versus 52.0 expected and 52.2 prior while the Services gauge plunged to 44.1 from 47.3, compared to 49.2 market forecasts. According to S&P Global, the US economy is also in trouble as the Composite PMI shrank to 45, its lowest in 27 months. Furthermore, the US New Home Sales for July dropped to the lowest levels in six years, to 0.511M from 0.585M prior and 0.575M market forecasts. Furthermore, the US Richmond Fed Manufacturing Index for August dropped to -8.0 compared to the 0.0 previous reading.
On the other hand, Preliminary readings of August month Manufacturing PMIs improved in Germany and Europe, despite signaling contraction, whereas the Services gauge eased further during the stated month. That said, the German Manufacturing PMI rose to 49.8 versus 48.2 expected and 49.3 prior while the activity index for the bloc crossed 49.00 market consensus with 49.7 figure compared to 49.8 prior reading. Further, Germany’s Services PMI eased to 48.2 from 49.7 previous readouts and 49.0 expected whereas the Eurozone Services gauge dropped to 50.2 versus 50.5 market forecasts and 51.2 prior. Additionally, the flash reading of the Euro area Consumer Confidence Indicator rose to -24.9 in August from July's record low of -27. This reading came in better than the market expectation of -28.
It should be noted that European Central Bank (ECB) executive board member Fabio Panetta said on Tuesday that they may have to adjust the monetary policy further, as reported by Reuters. ECB’s Panetta also acknowledged that the probability of a recession in the eurozone was increasing and added that a recession would mitigate inflation pressures. Before that, Bundesbank President, as well as the European Central Bank (ECB) policymaker, Joachim Nagel mentioned that the ECB must keep raising interest rates even if a recession in Germany is increasingly likely, as inflation will stay uncomfortably high all through 2023.
Amid these plays, US 10-year Treasury yields rose to the highest in a month, inactive at around 3.05% by the press time, whereas Wall Street benchmarks closed with mild gains. It’s worth noting that the S&P 500 Futures print mild losses by the press time.
Moving on, the US Durable Goods Orders for July, expected 0.6% versus 2.0% prior, will be important to watch for the EUR/USD pair traders for fresh impulse. However, major attention should be given to Friday’s speech by Fed Chairman Jerome Powell at the Kansas City Fed’s symposium in Jackson Hole will be crucial to follow.
Technical analysis
Unless providing a daily close beyond the two-week-old descending resistance line, around 1.0055 by the press time, EUR/USD prices remain on the bear’s radar. That said, the 61.8% Fibonacci Expansion (FE) of the pair’s moves between late May and early August, around 0.9850, seems to lure the short-term sellers.
-
02:06
GBP/USD bears move in as the greenback recovers lost ground
- GBP/USD sinking as the US dollar perks up in the wake of higher yields.
- Focus turns to the Fed again, but US data this week will play a key role.
GBP/USD is back under pressure in Tokyo as the US dollar gathers pace in its correction following the poor data that sent it off a cliff in the New York session. At the time of writing, the cable is trading at 1.1815 and down around 0.1% after falling from a high of 1.1838 to a low of 1.1813 so far in the session.
Firstly, the UK PMI readings were mixed in August, with the manufacturing reading falling to a two-year low and the service reading down slightly but above expectations. The pound remains in the hands of the Bank of England which is expected to raise interest rates by another 50 basis points at its Sept. 15 meeting. However, the focus is turning to the Federal Reserve again.
The US dollar was mixed against its major trading partners early Tuesday ahead of key data events this week, including the release of manufacturing and services PMIs for August, although turned out to be the nail in the coffin for the greenback. The S&P Global flash composite purchasing managers index (PMI) for August fell to 45 this month, the lowest since February 2021.
The data made it clear that demand for services and manufacturing continues to weaken in the face of inflation and tighter financial conditions. A reading below 50 indicates a contraction in activity. Markets are also looking ahead to the second estimate of second-quarter growth data on Thursday, personal income and spending data for July on Friday, and frequent Federal Reserve comments from the Jackson Hole conference Thursday through Saturday. If we see more of the same from the forthcoming data this week ahead of the Jackson Hole, then the US dollar may continue to struggle in the face of a cooling demand-side economy.
However, there was a bid forced back into the greenback and US yields following a bullish 2-year Treasury auction in the US session:
- High yield 3.307%.
- Tail 1.4 bps vs a 6-month average of -0.3 bps.
- Bid to cover 2.49X vs 6-month avg of 2.59X.
- Dealers 23% vs a 6-month average of 17.4%.
- Directs 17.3 vs a 6-month average of 22.2%.
- Indirects 59.7% vs a 6-month average of 60.4%.
The demand from domestic and international buyers is far below a 6-month average which has seen the 2 and 10-year yields rally, supporting the US dollar.
Meanwhile, the main event of the Jackson Hole conference will be Fed Chair Jerome Powell's speech on Friday. In the past, Fed chairs have used this annual speech to evaluate the current state of the economy and lay out a road map for monetary policy going forward. Analysts at TD Securities argued that with regards to the Jackson Hole that is coming up later this week, the Fed's Chair, Jerome Powell's speech ''will likely aim to reinforce the message that multiple, sizable hikes are still in the pipeline, and easing should not be expected to be on the horizon anytime soon.''
-
01:56
WTI Price Analysis: Bullish Flag near supply zone advocates more upside
- Oil prices are forming a bullish flag that may trigger a break above the $94.16-94.32 zone.
- Advancing 20-and 50-period EMAs indicates more upside ahead.
- The upward-sloping trendline placed from $90.09 will act as major support for the counter.
West Texas Intermediate (WTI), futures on NYMEX, has turned sideways after failing to cross the critical hurdle of $94.00. The black gold is oscillating in a narrow range of 93.31-93.64 in the Asian session but is likely to display volatile moves ahead.
On an hourly scale, the asset is auctioning in an inventory adjustment phase near the supply zone, which is placed in a narrow range of 94.16-94.32. The formation of a Bullish Flag that leads to a sheer upside after the conclusion of an inventory adjustment is favoring bulls. Also, the upward-sloping trendline placed from the August 16 high at $90.09 will act as major support for the counter.
Advancing 20-and 50-period Exponential Moving Averages (EMAs) at $92.80 and $91.50 respectively adds to the upside filters.
Also, the Relative Strength Index (RSI) (14) is oscillating in the bullish range of 60.00-80.00, which indicates more upside ahead.
A decisive break above the supply zone placed in a $94.16-94.32 range will drive the oil prices towards the August 3 high near $96.00, followed by the psychological resistance at $100.00.
On the flip side, the bears could regain control if the asset drops below Monday’s high at $91.00, which will drag the asset towards Friday’s low at $87.91. A slippage below the latter will expose the asset to more downside towards the August 15 low at $86.34.
WTI hourly chart
-637968993066618937.png)
-
01:50
Gold Price Forecast: XAU/USD slides towards $1,730, US data, Jackson Hole eyed
- Gold price reverses the previous day’s bounce off monthly low.
- Sour sentiment weighs on the XAU/USD prices after US data triggered recovery.
- Recession, hawkish Fed bets are the key catalysts favoring bears.
- US Durable Goods Orders for July, Fed Chair Powell’s speech at Jackson Hole Symposium will be crucial for fresh impulse.
Gold price (XAU/USD) returns to the bear’s radar after the previous day’s failure to recall buyers near the monthly low. That said, the precious metal retreats to $1,746 during the mid-Asian session on Wednesday.
The bullion’s latest weakness could be linked to hawkish Fedspeak and the firmer US Treasury yields, not to forget the fears of economic slowdown, which in turn underpin the US dollar’s rebound and weigh on the XAU/USD amid a sluggish session.
Minneapolis Fed President Neel Kashkari mentioned that the biggest fear is that we are misreading underlying inflation dynamics, per Reuters. The policymaker also added that the Fed can relax on rate hikes when compelling evidence of CPI heading toward 2% seen.
US Dollar Index (DXY) poked the multi-year high the previous day before reversing from 109.27. That said, the fears of economic slowdown and the US Federal Reserve’s (Fed) aggressive rate hikes are the main factors that favor the DXY bulls even if the latest weakness in the US data triggered the quote’s pullback ,which in turn favored the gold buyers before teasing the bears of late.
The preliminary readings of the US S&P Global Manufacturing PMI for August eased to 51.3 versus 52.0 expected and 52.2 prior while the Services gauge plunged to 44.1 from 47.3, compared to 49.2 market forecasts. According to S&P Global, the US economy is also in trouble as the Composite PMI shrank to 45, its lowest in 27 months. Furthermore, the US New Home Sales for July dropped to the lowest levels in six years, to 0.511M from 0.585M prior and 0.575M market forecasts. Furthermore, the US Richmond Fed Manufacturing Index for August dropped to -8.0 compared to the 0.0 previous reading.
Traders in fed funds futures are pricing in a 52.5% chance of a 75 basis-point (bps) rate hike at the Fed meeting next month. On Monday the odds favored a slightly better-than-even chance of a 50 bp hike in September, per Reuters.
Elsewhere, Bloomberg recently came out with an analysis portraying the Chinese yuan’s fall as another worry for the dragon nation. “The Chinese yuan’s slump to its weakest against the dollar in almost two years adds to what is already a precarious balancing act for Beijing, which is seeking ways to prop up its struggling economy without stoking financial instability,” said the piece. The same weighs on the AUD/USD prices due to China’s status as one of the world’s largest gold consumers.
Talking about the market sentiment, US 10-year Treasury yields rose to the highest in a month, inactive at around 3.05% by the press time, whereas Wall Street benchmarks closed with mild gains. It’s worth noting that the S&P 500 Futures print mild losses by the press time.
Looking forward, a light calendar ahead of the North America session may restrict XAU/USD moves. Following that, US Durable Goods Orders for July, expected 0.6% versus 2.0% prior, will be important to watch for fresh clues. Above all, Friday’s speech by Fed Chairman Jerome Powell at the Kansas City Fed’s symposium in Jackson Hole will be crucial to follow.
Technical analysis
Gold price failed to cross the monthly horizontal hurdle, not to forget the 200-SMA, despite crossing a one-week-old bearish trend channel the previous day. The following pullback also takes clues from the RSI retreat to keep sellers hopeful.
However, the previous resistance line of the aforementioned channel, near $1,740, could act as the immediate support ahead of directing XAU/USD bears towards the latest swing low near the 61.8% Fibonacci Retracement of the July-August uptrend, near $1,730.
It should be noted that the lower line of the stated channel near $1,715, as well as the 78.6% Fibonacci retracement level surrounding $1,708, could entertain gold sellers afterward.
Meanwhile, the 200-SMA and the four-week-old horizontal resistance, respectively near $1,750 and $1,755, restrict short-term XAU/USD rebound.
Following that, multiple levels near $1,785 and $1,800 could challenge the gold buyers.
Gold: Four-hour chart
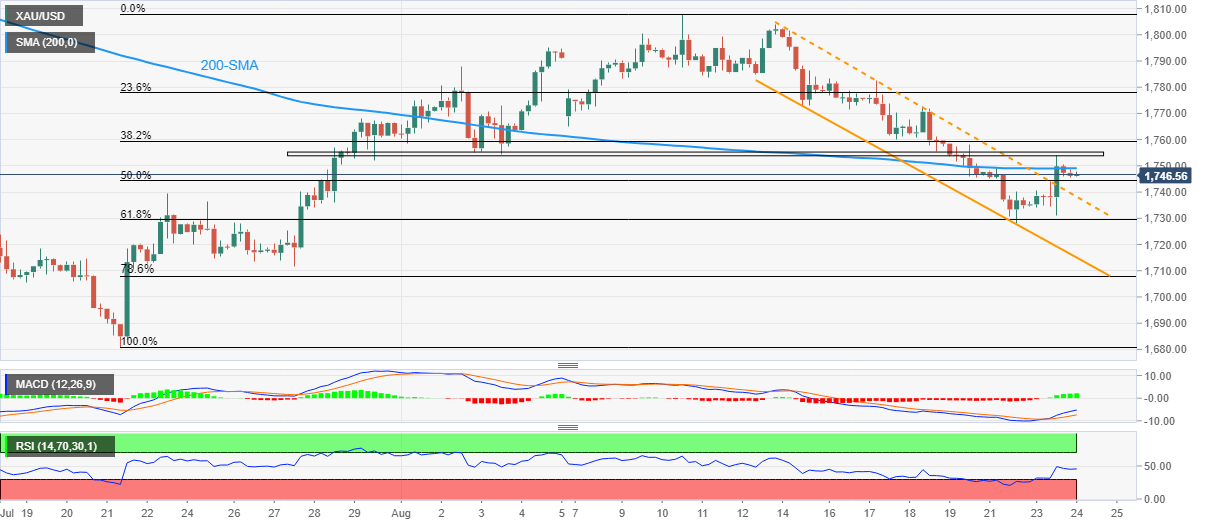
Trend: Further weakness expected
-
01:40
GBP/JPY struggles to track firmer yields below 162.00
- GBP/JPY rebound from one-week low remains unconvincing for bulls.
- UK’s political, Brexit jitters join downbeat UK PMIs to keep bears hopeful.
- US Treasury yields remain firmer at five-week high.
- Light calendar keeps market’s focus on risk catalysts, recession woes are crucial.
GBP/JPY traders seek confirmation as the cross-currency pair retreats to 161.75 during Wednesday’s Asian session. In doing so, the quote fades the previous day’s rebound from the one-week low amid a sluggish session.
It’s worth noting that the GBP/JPY inaction could be linked to the pessimism surrounding the UK data.
That said, the UK’s preliminary readings of August month PMIs flashed mixed readings as the Manufacturing gauge slumped to 46.00 versus 51.1 forecasts and 52.1 prior while the Services PMI improved to 52.5 versus 52.0 expected and July’s final score of 52.6.
Also, the latest survey results from the Confederation of British Industry (CBI) of trends in British manufacturing showed that the Manufacturing Order Book Balance dropped to -7 in August, the first negative reading since April 2021, from +8 in July and +3 of market expectations.
It should be noted that the comments from ex-Chancellor Rishi Sunak, suggesting less push for the Bank of England (BOE) seemed to have eased the pressure off the GBP/JPY. “Rishi Sunak has suggested that Liz Truss would "spook" international investors if she threatened the independence of the Bank of England,” per The Guardian.
Amid these plays, US 10-year Treasury yields rose to the highest in a month, inactive at around 3.05% by the press time, whereas Wall Street benchmarks closed with mild gains.
Moving on, a light calendar keeps risk catalysts as the key directives for the GBP/JPY traders. Among them, recession woes and chatters surrounding the BOE will be important for clear directions.
Technical analysis
Repeated failures to cross the 50-DMA, around 163.15 by the press time, direct GBP/JPY bears towards an upward sloping support line from mid-May, close to 160.45 at the latest.
-
01:30
Stocks. Daily history for Tuesday, August 23, 2022
Index Change, points Closed Change, % NIKKEI 225 -341.75 28452.75 -1.19 Hang Seng -153.73 19503.25 -0.78 KOSPI -27.16 2435.34 -1.1 ASX 200 -85.1 6961.8 -1.21 FTSE 100 -45.69 7488.11 -0.61 DAX -36.34 13194.23 -0.27 CAC 40 -16.72 6362.02 -0.26 Dow Jones -154.02 32909.59 -0.47 S&P 500 -9.26 4128.73 -0.22 NASDAQ Composite -0.27 12381.3 -0 -
01:23
US Dollar Index eyes to regain 109.00 ahead of US Durable Goods Orders, Jackson Hole
- US Dollar Index picks up bids to consolidate recent pullback from yearly top.
- Treasury yields underpin US dollar rebound, downbeat data weighed on the greenback.
- Hawkish Fed bets, recession fears gain major attention amid sluggish Asian session.
US Dollar Index (DXY) resumes its upward trajectory towards the multi-year high marked in July, picking up bids to 108.60 during Wednesday’s Asian session, as traders await the key catalysts amid a sluggish day-start.
It’s worth noting that the greenback’s gauge versus the six major currencies poked the multi-year high the previous day before reversing from 109.27. That said, the fears of economic slowdown and the US Federal Reserve’s (Fed) aggressive rate hikes are the main factors that favor the DXY bulls even if the latest weakness in the US data triggered the quote’s pullback.
Recently, Minneapolis Fed President Neel Kashkari mentioned that the biggest fear is that we are misreading underlying inflation dynamics, per Reuters. The policymaker also added that the Fed can relax on rate hikes when compelling evidence of CPI heading toward 2% seen.
That said, Traders in fed funds futures are pricing in a 52.5% chance of a 75 basis-point (bps) rate hike at the Fed meeting next month. On Monday the odds favored a slightly better-than-even chance of a 50 bp hike in September, per Reuters.
On Tuesday, the preliminary readings of the US S&P Global Manufacturing PMI for August eased to 51.3 versus 52.0 expected and 52.2 prior while the Services gauge plunged to 44.1 from 47.3, compared to 49.2 market forecasts. According to S&P Global, the US economy is also in trouble as the Composite PMI shrank to 45, its lowest in 27 months.
Furthermore, the US New Home Sales for July dropped to the lowest levels in six years, to 0.511M from 0.585M prior and 0.575M market forecasts. Furthermore, the US Richmond Fed Manufacturing Index for August dropped to -8.0 compared to the 0.0 previous reading.
Amid these plays, US 10-year Treasury yields rose to the highest in a month, inactive at around 3.05% by the press time, whereas Wall Street benchmarks closed with mild gains. It’s worth noting that the S&P 500 Futures print mild losses by the press time.
Looking forward, a light calendar ahead of the North America session may restrict DXY moves. Following that, US Durable Goods Orders for July, expected 0.6% versus 2.0% prior, will be important to watch for fresh clues. Above all, Friday’s speech by Fed Chairman Jerome Powell at the Kansas City Fed’s symposium in Jackson Hole will be crucial as traders struggle for clear directions on the Fed’s next move.
Technical analysis
Although a two-week-old ascending support line challenges the DXY bears around 108.00, the upside momentum needs validation from the 109.30 to convince the buyers.
-
01:19
USD/CAD Price Analysis: Bulls step on the gas in Tokyo open
- USD/CAD bulls moving in as the price corrects in an M-formation on H4 charts.
- Bulls eye a move towards the 1.30 figure for the day ahead.
For the Tokyo open, we are seeing a break of resistance 1.2960 that could open the way to a bullish extension below 1.2965, 1.2970 and to 1.2980:
USD/CAD M15 chart
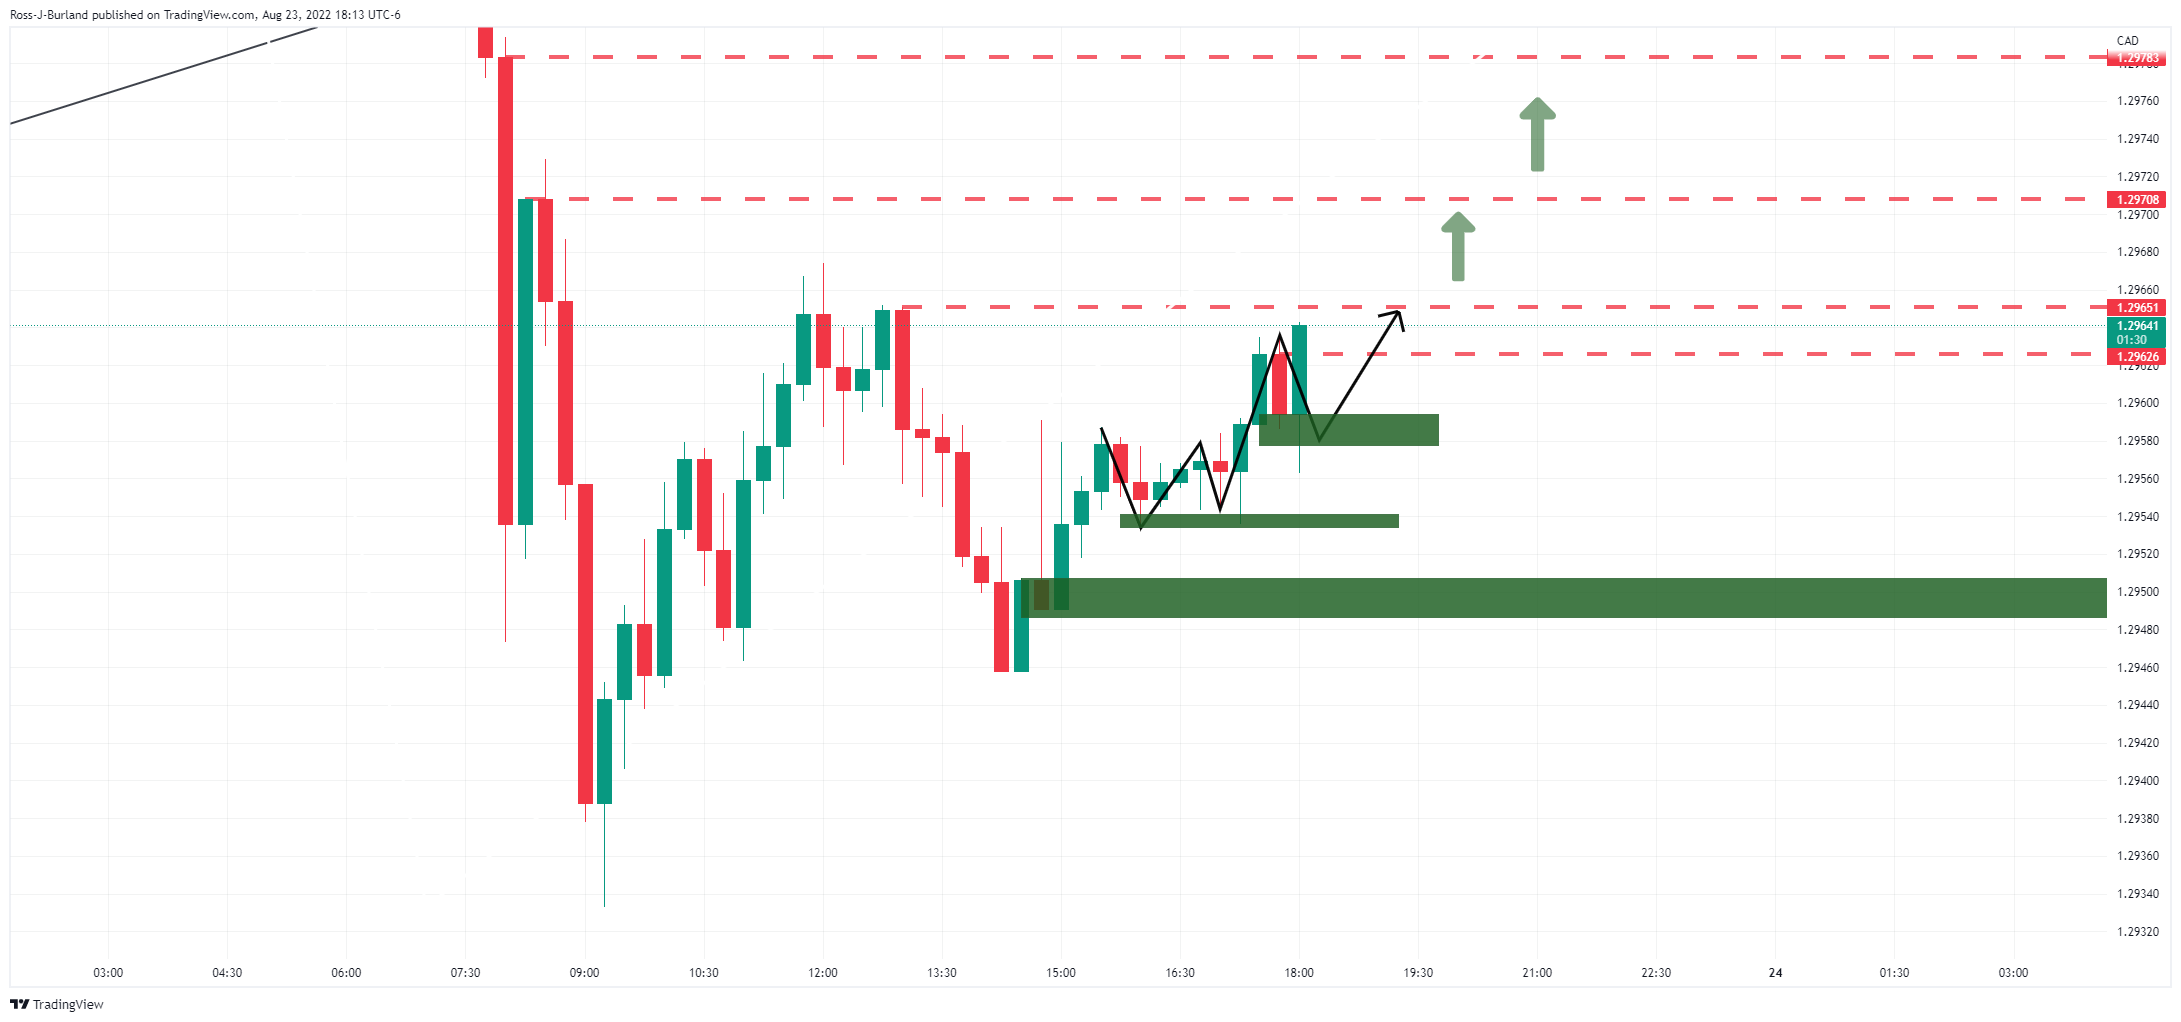
On the back of the W-formation breakout, and given that the price has been marking out its support base on the structure of the 15-min chart, if the bulls continue to close above the said levels, the 1.30s will be back in vogue:
USD/CAD prior analysis, H4 chart
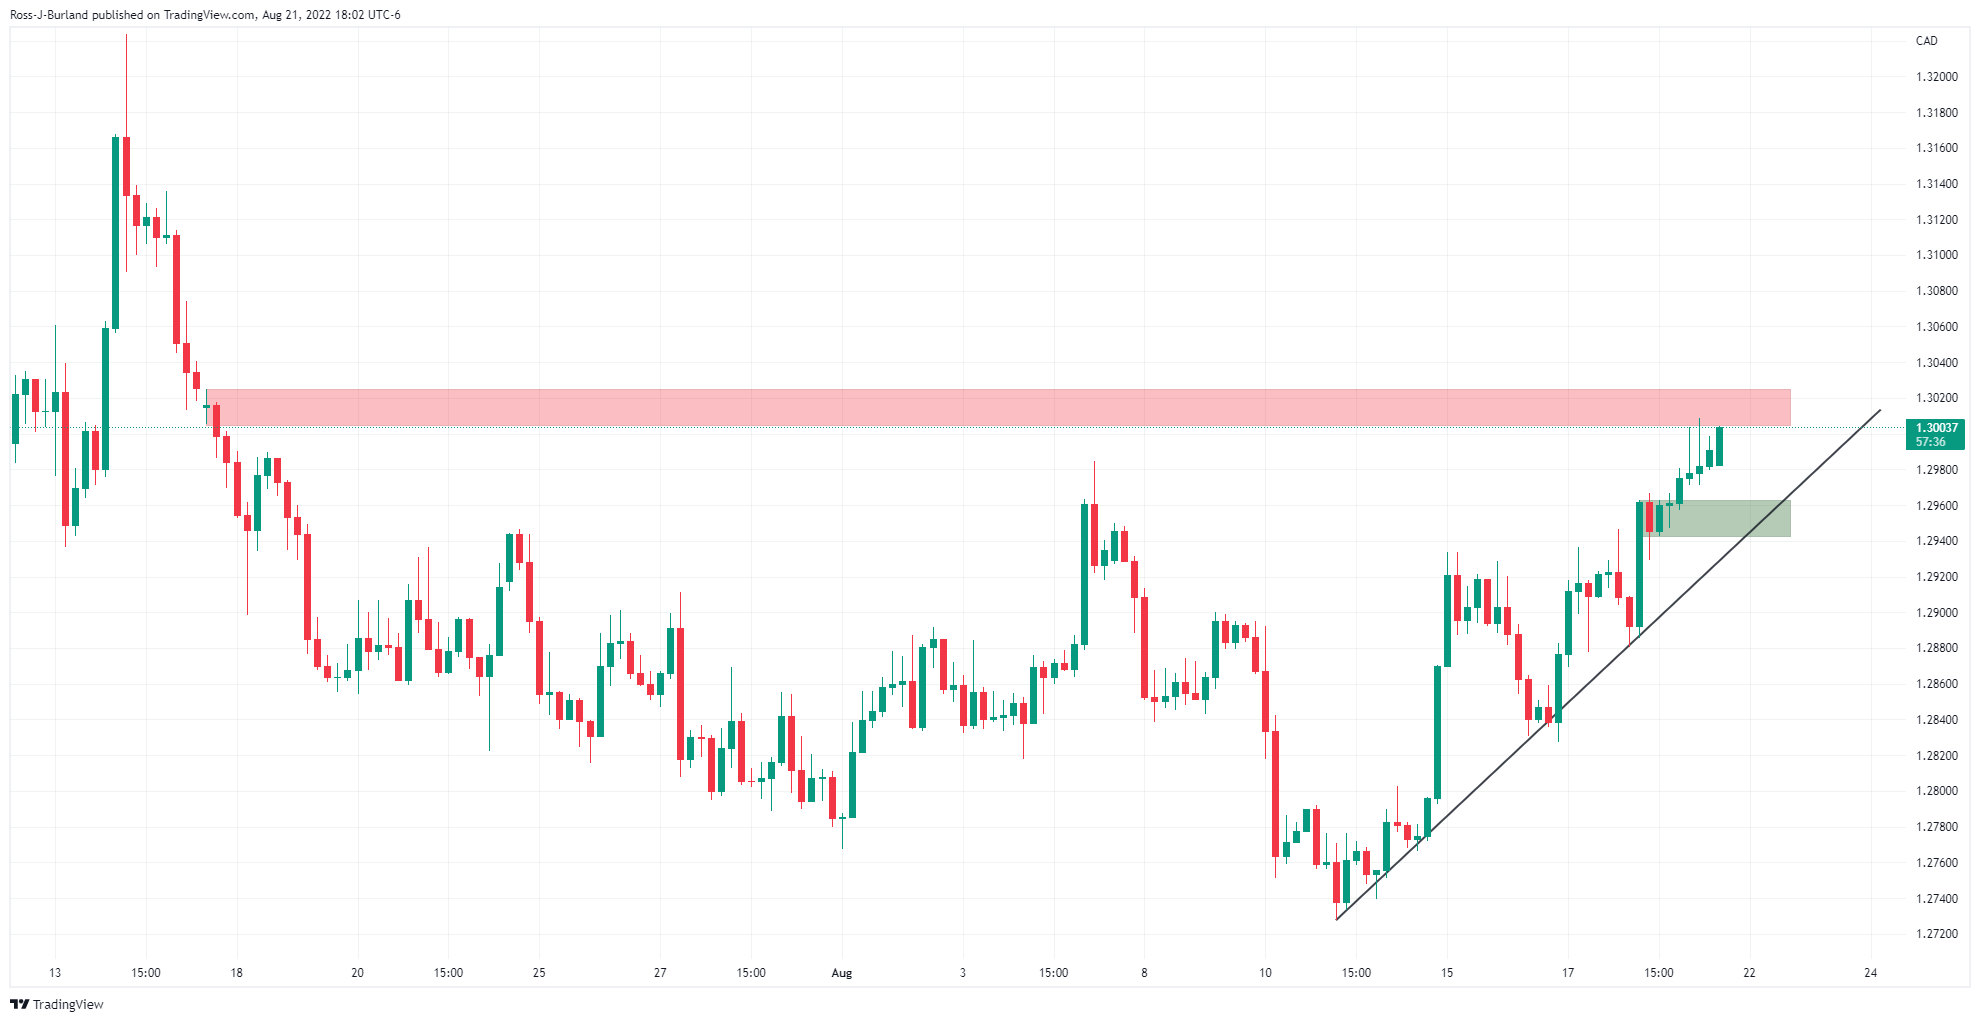
It was stated in the prior analysis that the price had been rising along the trendline but had moved away which could result in a correction as the price meets a resistance zone:
USD/CAD live H4 chart
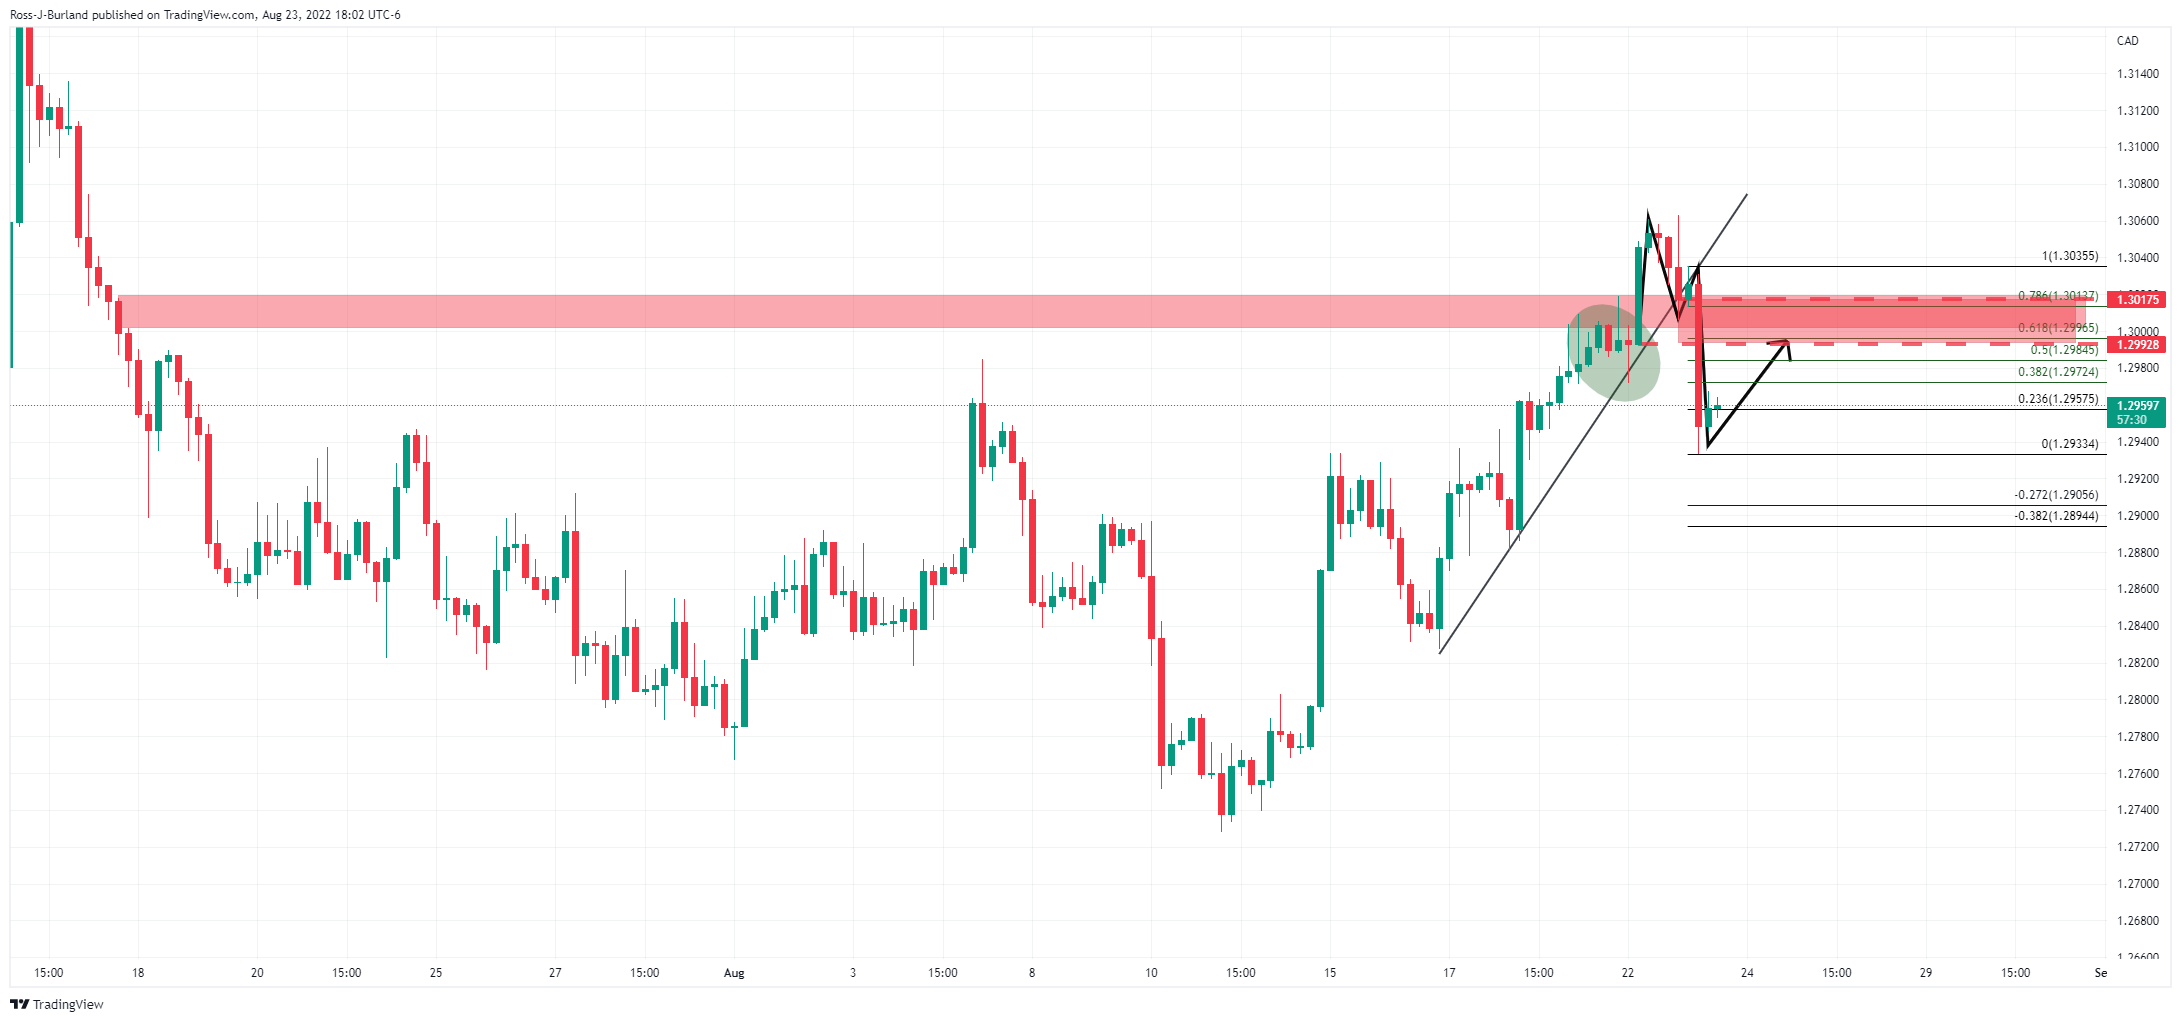
As illustrated, the price moved into the support line, popped the resistance and has since pulled below the trendline which would now be expected to act as a counter-trendline for the sessions ahead. The price has left a bullish reversion pattern on the charts also. This is pulling the price into the Fibonacci scale with 1.2970/90 an area that could be exploited by the bulls in the day ahead. Thereafter, the neckline of the pattern guards a break above 1.3020. On the downside, the bears could be encouraged on a break below 1.2950 support:
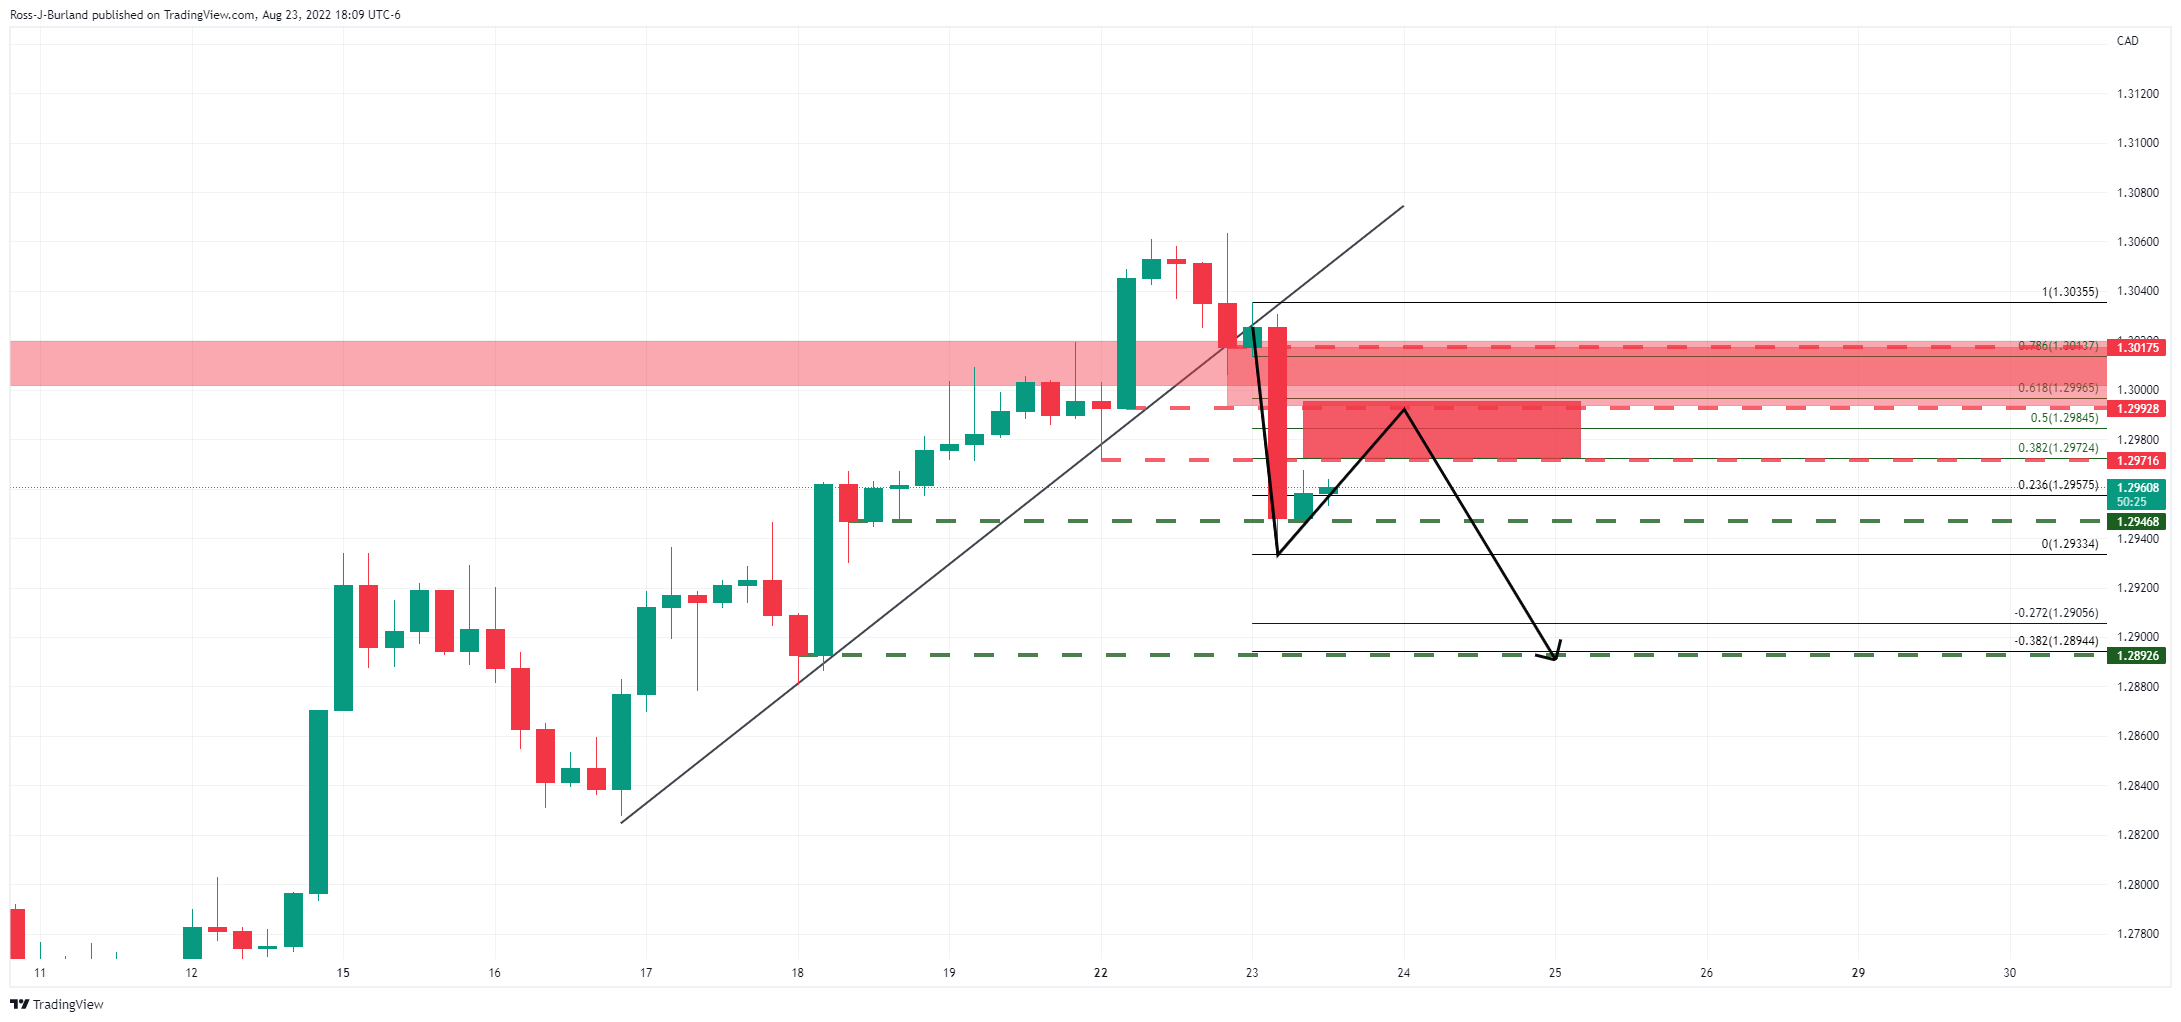
-
01:15
Currencies. Daily history for Tuesday, August 23, 2022
Pare Closed Change, % AUDUSD 0.69293 0.75 EURJPY 136.316 -0.3 EURUSD 0.99698 0.27 GBPJPY 161.755 -0.01 GBPUSD 1.18299 0.56 NZDUSD 0.62135 0.69 USDCAD 1.2956 -0.72 USDCHF 0.96393 0.01 USDJPY 136.731 -0.56 -
01:11
S&P 500 seen a little higher by end of 2022 – Reuters poll
The S&P 500 will end the year a little above its current level after a recent rally that has lifted the index from its bear market lows, according to a new Reuters poll of strategists published during early Wednesday in Asia.
Key findings
The benchmark will end this year at 4,280, according to the median forecast of nearly 50 strategists polled by Reuters during the last two weeks. That is 3.4% higher than Monday's close of 4,137.99.
That median forecast for 2022 was down from a forecast of 4,400 in a Reuters poll conducted in late May.
Strategists in the latest Reuters poll expected the S&P 500 to continue to rise in 2023, and hit 4,408 by mid-year, according to the poll's median forecast.
Analysts' estimates for full-year profit growth have come down slightly since the start of July, but they still forecast growth of 8% for 2022, the data showed.
Investors have worried whether profits can grow fast enough to support stock valuations, especially with the recent rally.
The S&P 500's forward 12-month price-to-earnings ratio is now at about 18 compared with 22 at the end of December and its long-term average of about 16, according to Refinitiv data.
Also read: EUR/USD Forecast: A small respite for the shared currency
-
01:09
USD/JPY advances towards 137.00 as Fed sticks to the path of hiking interest rates
- USD/JPY is scaling higher towards 137.00 as Fed may step up interest rates with ongoing acceleration.
- US CPI’s appreciation is not haunting anymore, however, an establishment above 8% is worrisome.
- The BOJ will stick to its loose policy until inflation stabilizes at around 2% for at least two years.
The USD/JPY pair is marching towards 137.00 after a sheer decline to near 135.80 on Tuesday. The asset went through the carnage on Tuesday after the dismal US Purchasing Managers Index (PMI) data forced the market participants to dump the US dollar index (DXY). However, the DXY is expected to regain the upside track as the Federal Reserve (Fed) is sticking to its path of hiking interest rates despite a contraction in private sector activities as their focus is on achieving price stability.
The commentary from Minneapolis Fed Bank President Neel Kashkari that the central bank will keep on hiking interest rates until it finds multiple evidence, which could warrant that the inflation rate will scale down to 2%. This time, appreciation in the price pressures is not haunting but its establishment above 8% is a big reason to worry.
Fed’s Kashkari also added that ‘Half to two-thirds of US high inflation is driven by supply-side shocks. And, there is no denying the fact that supply bottlenecks are normalizing, which may trim price pressures ahead.
In today’s session, investors will keep an eye on the US Durable Goods Orders data. The economic data is seen at 0.6% against the former figure of 2%. In times, when the US economy has already displayed an unchanged US core Consumer Price Index (CPI), a decline in the economic data is not lucrative for the US dollar index (DXY).
On the Tokyo front, the yen bulls are expected to shift into a negative trajectory against the greenback for a prolonged period. The Bank of Japan (BOJ) Chief Economist Kazuo Momma predicted that the BOJ won't be able to ditch easy policy until inflation stabilizes at around 2% for at least two years.
-
01:02
AUD/USD seller’s return aim for 0.6900 amid recession, Fed fears ahead of US data
- AUD/USD fades bounce off five-week low as market fears remain intact amid sluggish session.
- US data triggered US dollar pullback but fears surrounding China, recession join hawkish Fedspeak to favor pair bears.
- US Durable Goods Orders for August precede Fed Chair Powell’s speech at Jackson Hole to test bears.
AUD/USD retreats to 0.6915, following a corrective pullback from the one-month low, as risk-aversion remains intact during Wednesday’s tepid Asian session.
In doing so, the Aussie pair failed to justify downbeat US data while also portraying a cautious mood ahead of this week’s key catalysts. This includes today’s US Durable Goods Orders for July, expected 0.6% versus 2.0% prior, as well as Friday’s speech by Fed Chairman Jerome Powell at the Kansas City Fed’s symposium in Jackson Hole.
US Dollar Index (DXY) poked the yearly high during the initial Tuesday trading amid fears of recession and increasing hawkish Fed bets, as well as growing pessimism in China. However, downbeat US economics triggered the greenback’s much-needed correction.
The preliminary readings of the US S&P Global Manufacturing PMI for August eased to 51.3 versus 52.0 expected and 52.2 prior while the Services gauge plunged to 44.1 from 47.3, compared to 49.2 market forecasts. According to S&P Global, the US economy is also in trouble as the Composite PMI shrank to 45, its lowest in 27 months.
Furthermore, the US New Home Sales for July dropped to the lowest levels in six years, to 0.511M from 0.585M prior and 0.575M market forecasts. Furthermore, the US Richmond Fed Manufacturing Index for August dropped to -8.0 compared to the 0.0 previous reading.
Elsewhere, Minneapolis Fed President Neel Kashkari mentioned that the biggest fear is that we are misreading underlying inflation dynamics, per Reuters.
It should be noted that Bloomberg recently came out with an analysis portraying the Chinese yuan’s fall as another worry for the dragon nation. “The Chinese yuan’s slump to its weakest against the dollar in almost two years adds to what is already a precarious balancing act for Beijing, which is seeking ways to prop up its struggling economy without stoking financial instability,” said the piece. The same weigh on the AUD/USD prices due to the trade ties between Beijing and Canberra.
Against this backdrop, US 10-year Treasury yields rose to the highest in a month, inactive at around 3.05% by the press time, whereas Wall Street benchmarks closed with mild gains.
Moving on, a light calendar in the Asia-Pacific highlights the US data and recession woes as the key factors to watch for near-term directions. It should be noted that the fears of economic slowdown, especially in China, could keep the AUD/USD prices pressured.
Technical analysis
An upward sloping support line from mid-June, around 0.6875 by the press time, restricts the short-term AUD/USD downside. The recovery moves, however, need validation from the 100-DMA and the 200-DMA, respectively around 0.6960 and 0.7115, before convincing the bulls to take entries.
-
00:37
Fed's Kashkari: Fear in back of mind is that inflation is more embedded at higher level than appreciate
Federal Reserve's Neel Kashkari is crossing the wires with his comments dripping through throughout early Asia.
His pivot on his outlook for rates impacted recently when he said the ''Fed is far, far, far away from declaring victory on inflation'' following the recent surprise fall in inflation data. This is when prices rose 8.5% on an annualized basis in July, a slower pace than the 9.1% rise reported in June and below analysts' consensus expectations for an 8.7% rise.
Key comments
Half to two-thirds of US high inflation is driven by supply-side shocks.
There is some evidence supply chains are beginning to normalize.
We need to get some help on the supply side to get inflation down.
The more help we get from the supply side, the less fed has to do and better able to avoid a hard landing.
We need to make sure the underlying inflation trend gets back down to 2%.
We need to tighten monetary policy.
Right now there is no tradeoff between employment and inflation mandates.If inflation was at 4%, I would be more willing to say let's take our time, and avoid the risk of overdoing it.
With inflation at 8% or higher, we don't want to allow inflation expectations to unanchor.
We can only relax on rate hikes when we see compelling evidence inflation is heading toward 2%.
Fear in the back of the mind is that inflation is more embedded at a higher level than appreciation.
A lot of balance sheet tightening has already happened due to forward guidance.
The biggest fear is that we are misreading underlying inflation dynamics.
Market implications
Old news has failed to move the needle and the greenback remains pressured albeit within a bullish correction on the lower timeframes:
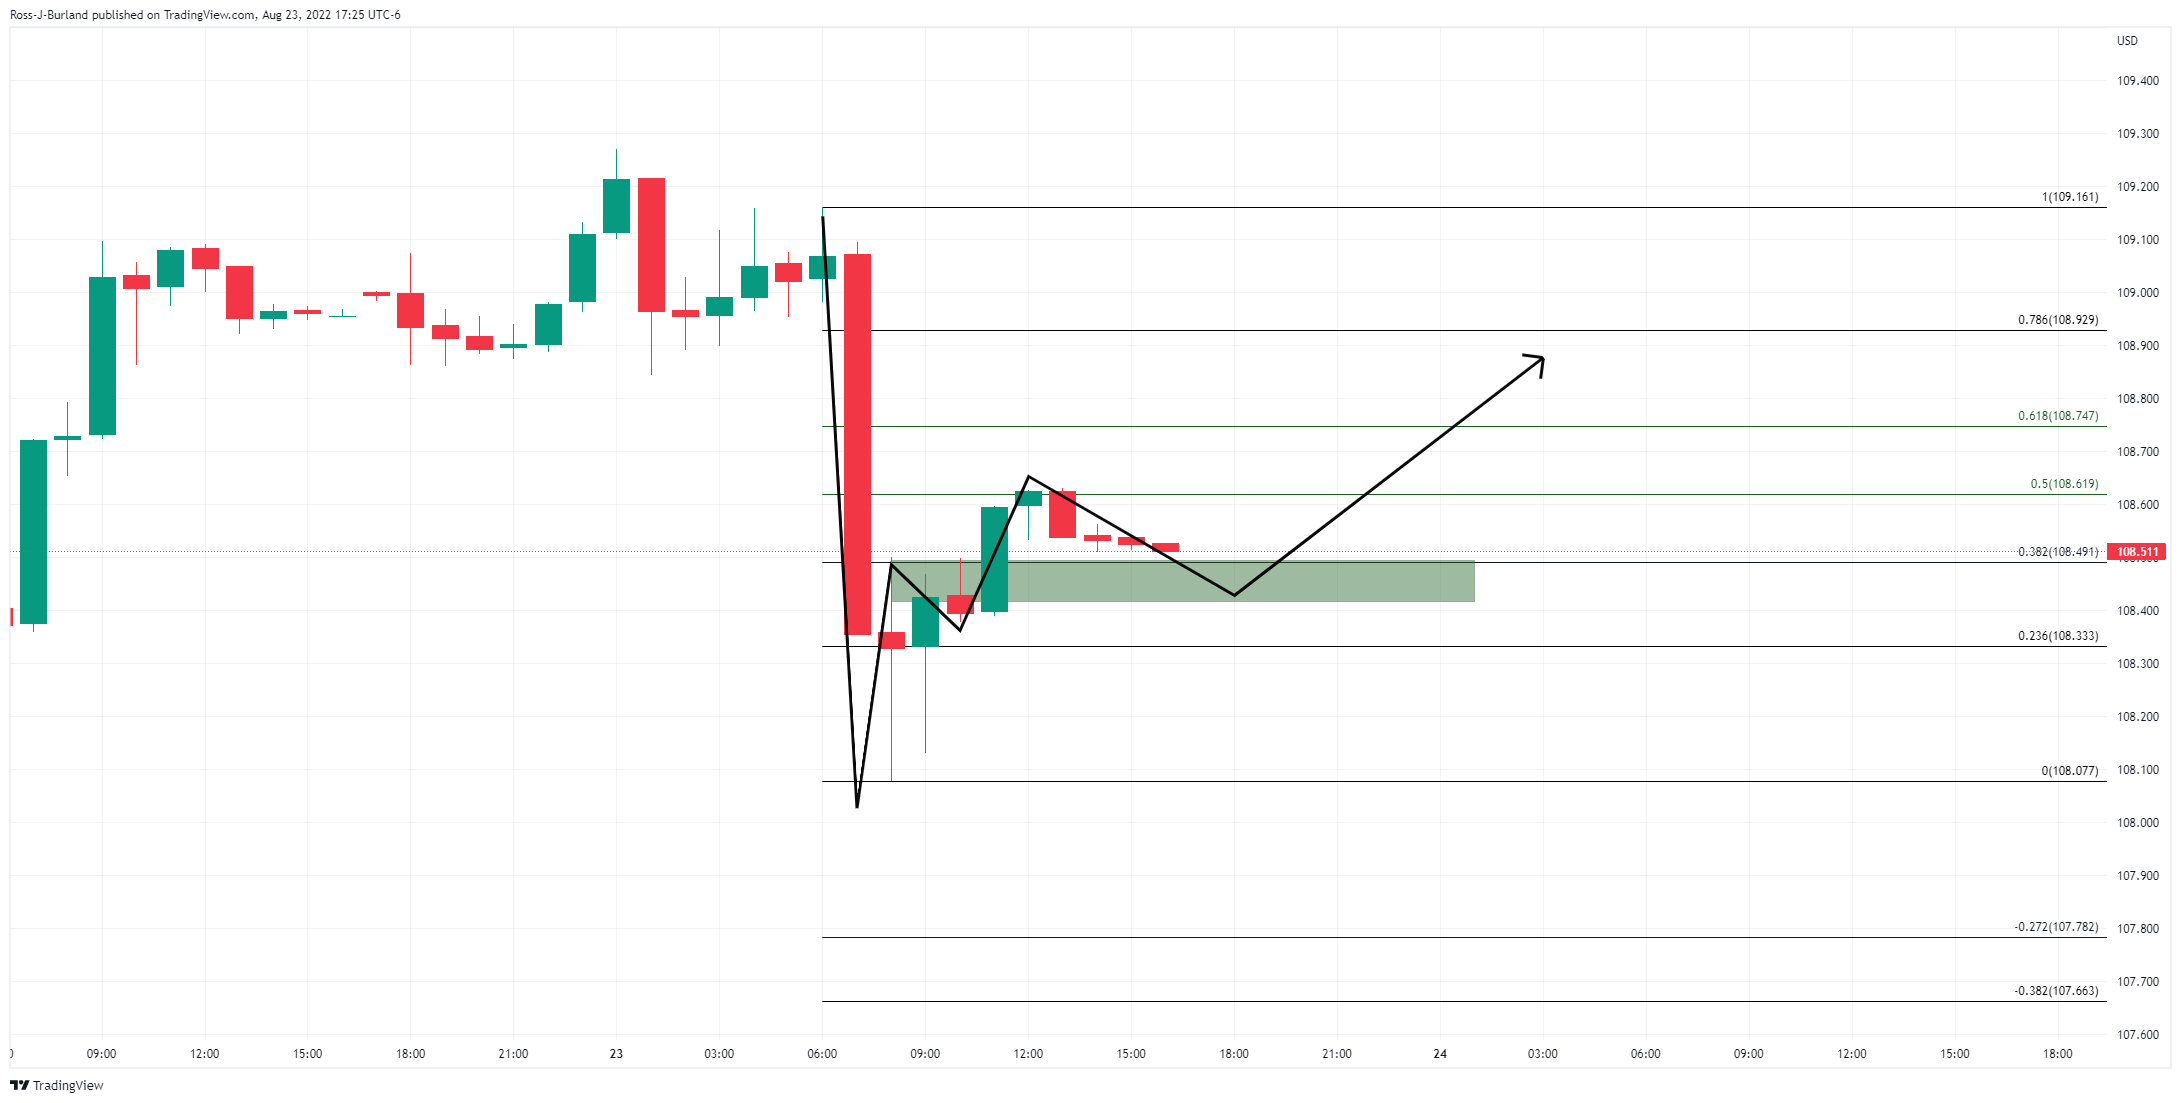
The overall picture is that the Fed has hiked rates from near zero in March to their current range of 2.25% to 2.50%, with more expected in the months ahead.
Kashkari has flipped more hawkish as of late as the Fed tries to tame inflation, which is running near a 40-year high.
However, while WIRP suggests a 50 bp hike is fully priced in for the September 20-21 FOMC meeting, the odds of a 75 bp hike could start to dwindle and weigh on the greenback, reviving the bull's hopes elsewhere.
Nevertheless, analysts at TD Securities argued that with regards to the Jackson Hole that is coming up later this week, the Fed's Chair, Jerome Powell's speech ''will likely aim to reinforce the message that multiple, sizable hikes are still in the pipeline, and easing should not be expected to be on the horizon anytime soon.''
US treasury auction
Meanwhile, we were seeing a bid back into the greenback and US yields following today's bullish 2-year Treasury auction.
- High yield 3.307%.
- Tail 1.4 bps vs a 6-month average of -0.3 bps.
- Bid to cover 2.49X vs 6-month avg of 2.59X.
- Dealers 23% vs a 6-month average of 17.4%.
- Directs 17.3 vs a 6-month average of 22.2%.
- Indirects 59.7% vs a 6-month average of 60.4%.
The demand from domestic and international buyers is far below a 6-month average which has seen the 2 and 10-year yields rally, supporting the US dollar and weighing on gold prices in the recent hours since the auction:

-
00:33
EUR/JPY sees downside below 136.00 on potential German energy crisis
- EUR/JPY is expected to display more weakness on a downside move below 136.00.
- An energy supply halt for three days could dampen the already vulnerable German energy market.
- Japan’s dismal PMI numbers despite prolonged dovish BOJ is a big reason to worry.
The EUR/JPY pair has displayed a short-lived pullback to near 136.40 after the shared currency bulls defended an establishment below 136.00. The asset defended further losses on mixed German Purchasing Managers Index (PMI) numbers, released on Tuesday.
The German Services PMI contracted to 48.2 against the forecast of 49 and the former release of 49.9. However, the Manufacturing PMI expanded to 49.8 from the expectations of 48.2 and the prior release of 49.3. It is worth noting that Germany is displaying a decline in the Manufacturing PMI consecutively for the past six months and the unavailability of downside exhaustion could have soared Germany’s recession fears.
Now, the entire focus of the market participants is on energy supply in Germany as Nord Stream 1 pipeline is going under unscheduled maintenance, and the winter season is coming in when demand for energy surges sharply.
Russia will halt natural gas supplies to Europe for the last three days of August to run the unscheduled maintenance under the Baltic Sea to Germany. The unexpected natural gas supply cut to Germany from Nord Stream 1 pipeline will accelerate the imbalance of the energy demand-supply mechanism. Investors should be aware of the fact that Germany is a core European Union (EU) member and an occurrence of an energy crisis in Germany could drag the shared currency.
On the yen front, investors have ignored the downbeat Japan PMI numbers despite the continuation of an ultra-loose monetary policy by the Bank of Japan (BOJ). Dismal PMI numbers by the Western leaders are the consequences of tight monetary policy by the Western central banks. However, the BOJ keeps on flushing liquidity in the economy and dismal PMI numbers at the same time are a big reason to worry.
-
00:31
GBP/JPY Price Analysis: Back-to-back doji means indecision lurking the pair
- GBP/JPY marginally advances almost 0.05% on Wednesday’s Asian session.
- The GBP/JPY is seesawing in the 161.00-162.30 area, unable to break beyond the range.
The GBP/JPY is almost flat as the Asian session begins, still below the 20-day EMA for the third consecutive trading day, whilst price action continues to record successive series of lower highs and lows. At the time of writing, the GBP/JPY Is trading at 161.86.
Sentiment has improved, as shown by Asian equities set to open higher. GBP/JPY Tuesday’s price action illustrates the pair seesawing between 161.00-162-30, while all the hourly moving averages (HMAs) meandering around the exchange rate are almost flat.
GBP/JPY Price Analysis: Technical outlook
The GBP/JPY daily chart illustrates the pair as neutral biased. Helped by the GBP/USD recovery, the British pound edged higher, after recording a fresh five-daily low at 160.80, bounced off to close the session around 161.77. That said the GBP/JPY printed back-to-back doji’s, meaning indecision lurks in the pair.
In the near term, the GBP/JPY hourly chart illustrates the pair fulfilling the head-and-shoulders chart pattern target. Once the target was achieved, the GBP/JPY rallied sharply, testing a downslope trendline, drawn from the August 17 high around 163.56, which confluences with the 200-hour EMA at 161.96.
A breach of the latter will expose the 162.00 figure, followed by the August 22 high at 162.30, followed by the R1 pivot at 162.47. On the flip side, the GBP/JPY first support would be the daily pivot at 161.62. Break below will expose the figure at 161.00, immediately followed by the S1 pivot at 160.94.

GBP/JPY Key Technical Level
-
00:19
Fed Chair Powell to reiterate the case for slowing the pace of tightening at Jackson Hole – Goldman Sachs
Reuters shared a research note from Goldman Sachs during early Wednesday in Asia. The report said, “Goldman economists said the message will be the same as laid out in his July news conference and in the minutes of the July Federal Open Market Committee meeting released last week.”
Key quotes
He is likely to balance that message by stressing that the FOMC remains committed to bringing inflation down and that upcoming policy decisions will depend on incoming data.
Policymakers saw the easing of financial conditions since July as unhelpful to keeping the economy on a below-potential growth trajectory.
Goldman expects the FOMC to hike rates by 50 basis points (bps) in September and by 25 bp in November and December, less aggressive than the 75 basis-point hikes at each of its last two meetings.
Also read: EUR/USD Forecast: A small respite for the shared currency
-
00:11
USD/CHF Price Analysis: Bears seek acceptance above 0.9600
- USD/CHF retreats from monthly top as buyers struggle after six-day uptrend.
- 61.8% Fibonacci retracement triggered pullback amid overbought RSI, looming bear cross on MACD.
- 200-SMA, two-week-old ascending trend line restricts immediate downside.
USD/CHF keeps the previous day’s pullback from a one-month high as sellers flirt with the 50% Fibonacci retracement of the July-August downside during Wednesday’s Asian session. That said, the Swiss currency (CHF) pair remains pressured at around 0.9640 by the press time.
In doing so, the quote portrays a reversal from the 61.8% Fibonacci retracement, known as the golden ratio, amid the RSI retreat from the overbought territory and an impending bear cross of the MACD.
It’s worth noting, however, that the 200-SMA and an upward sloping support line from August 11, respectively around 0.9615 and 0.9590, challenge the USD/CHF bears.
Should the pair decline below 0.9590, the odds of witnessing a slump towards the 23.6% Fibonacci retracement level surrounding 0.9490 appear brighter. Following that, the monthly low of 0.9370 will be in focus.
Meanwhile, recovery moves remain elusive unless crossing the golden ratio, around 0.9690.
Even so, the July 13 swing low near 0.9750 precedes the previous monthly high surrounding 0.9885 could lure the USD/CHF bulls.
USD/CHF: Four-hour chart
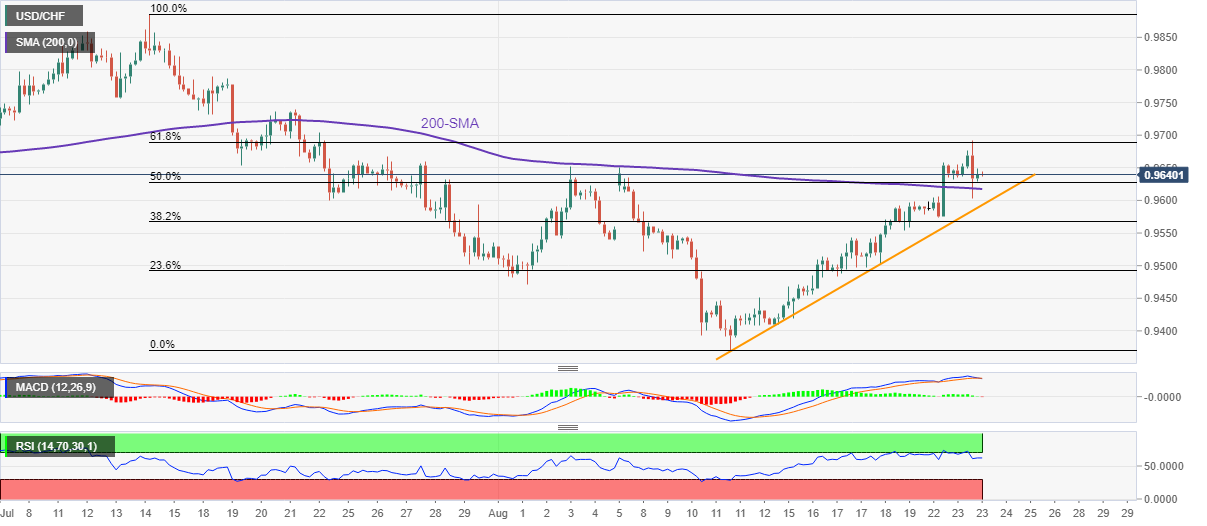
Trend: Further downside expected
-